Article

Effect of Different Blades on Suspension Characteristics of Anaerobic Digestion Particles and Energy Consumption Optimization Analysis

1
College of Engineering, Northeast Agricultural University, Harbin 150030, China
2
Key Laboratory of Pig-Breeding Facilities Engineering, Ministry of Agriculture, Harbin 150030, China
3
Key Laboratory of New Materials and Facilities for Rural Renewable Energy of Ministry of Agriculture and Rural Affairs, Henan Agricultural University, Zhengzhou 450002, China
*
Author to whom correspondence should be addressed.
Fermentation 2022, 8(12), 717; https://doi.org/10.3390/fermentation8120717
Submission received: 10 November 2022 / Revised: 23 November 2022 / Accepted: 29 November 2022 / Published: 8 December 2022
(This article belongs to the Section Fermentation Process Design)

Abstract

:
In this study, a solid-liquid mixing system model was established to simulate the coexistence of floating particles (FP) and sinking particles (SP) in the early stage of anaerobic digestion, and the mixing effect and energy consumption of the system were investigated. Four typical blades were selected to compare the solid phase distribution of straw particles under different blade stirring, and the distribution of FP and SP in the coexistence system was clarified. Then the combination of full-factorial design and numerical simulation was applied to compare the effect of blade diameter and blade width on particle mixing, which was better than that of immersion depth. A comprehensive equation was further established to balance the weight between the particle mixing effect and energy consumption and improve the blade design. It provided theoretical support for the design and amplification of subsequent stirring equipment.

Graphical Abstract

1. Introduction

Anaerobic digestion (AD) is an effective way to reduce greenhouse gas emissions and value-added agricultural waste [1,2,3,4]. Crop straw is usually used as the main raw material for AD, such as corn straw (CS) [5,6]. In the reaction process, a sink layer and a scum layer are usually formed [7]. The suspension state of CS particles in the digestion broth is improved by mechanical stirring to inhibit the formation of a scum layer [8]. Therefore, how to achieve appropriate mixing by mechanical stirring and slow down the formation of the sink layer and scum layer, which improves the stability and gas production efficiency of AD, is still a difficult problem.
In the stirring system, the force between each phase in the solid-liquid two-phase flow field is relatively complex. Previous studies focused on the sinking or floating motion of single-phase particles in liquids [9,10]. However, in digestion, catalysis, and fine chemical production, SP and FP coexistence systems are widely used, and there are few related studies. However, this system exists widely in digestion, catalysis, and fine chemical production [11]. It is limited to measuring the mixing effect of different dimensions and scales by experimental methods [12,13]. Since continuously stirred tank reactors (CSTR) have complex and changeable flow field characteristics, past designs were mostly based on empirical methods [14]. The application of CFD technology in the simulation and analysis of the multiphase stirring flow field has been paid more attention. It is helpful to understand the details of the flow field and make up for the deficiency of experience-based design [15].
The suspension of the SP system and the FP system are two different subjects. The former is the problem of rising and dispersing solid particles [16], and the latter is the problem of pulling down and dispersing solid particles. The regression equation of the critical dispersion condition of the double-layer slurry FP is obtained by experiments, which is applied to explain the influence of the type, size, and distance from the bottom of the blade in the double-layer slurry system [17]. In the rice straw AD system, the mixture model is used for solid-liquid two-phase CFD simulation. It indicates that the dead zone of solid particles decreases as the number of blade layers increases from one layer to three layers. Furthermore, it has been proven by digestion experiments that the gas production of digestion with multi-layer slurry increased [18]. The effects of turbulent vortex size and particle size on particle suspension were investigated experimentally in a flat bottom circular groove. The closer the size of the two was, the more conducive to the suspension of particles, the greater the number of turbulent vortices in the stirred tank, and the more easily the particles were suspended [19]. The experiment indicated that the power consumption of the double-layer blade was roughly equal to the sum of the power consumption of the single blade at the corresponding position. Therefore, the multi-layer slurry was not needed in the operation for critical suspension. For uniform suspension, the multi-layer blade was more energy-saving.
Research on the coexistence of SP and FP in solid-liquid mixed systems has become a hot spot. The simulation results have been verified successfully. An experimental study on the suspension quality of a solid-liquid system in a stirred AD reactor has been conducted [20]. Numerical simulation of the solid-solid-liquid system in CSTR with the Euler model as the multiphase flow model and the RNG k-ε model as turbulence model has been carried out [21]. The energy consumption was numerically simulated using cow dung and CS as raw materials. The standard k-ε model was more suitable than other models. Compared with the digestion of single raw material, the power consumption during mixed digestion changed significantly [22]. The solid-liquid suspension characteristics in a double-layer turbine blade stirred tank were simulated by the multi-reference frame (MRF) method and the Euler-Euler model, which found that the solid holdup distributions of the FP and SP were opposite. Therefore, the SP and FP should be investigated simultaneously in the same container to distinguish their suspension characteristics.
The blade installation position, type, stirring speed, and reactor geometry in the CSTR reactor were the main factors affecting the stirring and suspension effect of particles. Among them, the blade design had an important influence on the particle suspension quality [23]. Blade stirring capacity was mainly affected by the blade diameter, structure, number, width, blade angle, and installation position. One factor at a time (OFAT) was consuming and laborious, and the reciprocation between factors was easily ignored. The full-factorial design method [24,25] was combined with CFD simulation [26] to clarify the relationship between factors and indicators and the optimization process. The influence of contact force modeling parameters on the fluid dynamics of the jet bed system was analyzed by full-factorial design and variance analysis, and the main parameters and interaction parameters of contact force modeling were determined [27]. It can be seen from the above research that CFD combined with the full-factorial design method has a positive effect on structural optimization. In the present study, this method applied to the stirred straw AD reactor was less studied. Moreover, the sink layer and scum layer were easily formed in the early stage of AD of CS, and the design of blade parameters was based on experience, which seriously restricts the efficiency of AD.
Based on this, the suspension uniformity of particles was determined by the distribution of FP and SP. Solid particle distribution was determined by solid-liquid interaction, solid-solid interaction, velocity distribution, and turbulence characteristics. Nevertheless, information on solid-liquid micromixing through experiments was difficult to obtain. Therefore, the suspension characteristics of suspended particles in the stirred tank were studied by the CFD method. Previous research on mixing equipment based on CFD and full-factorial design was restricted. Thus, the blade design parameters were optimized to improve the suspension quality of FP and SP and balance their energy consumption. The design of blade parameters provides theoretical support for efficient utilization and energy saving of CS in biogas projects.

2. Materials and Methods

2.1. Materials and Reactor

The reactor was a flat bottom cylindrical structure, and the stirring device adopted a double-layer structure (10 L reactor, Xinshun Biotechnology Co., Ltd., Wuxi, China). The tank was 200 mm in diameter, 350 mm in height, 8.8 L in working volume, and 280 mm in liquid level height H. Four typical blades were selected and marked as follows: a pitched blade turbine (PBT) with a blade angle of 45°; a pitched two-blade impeller pumping down (PBD) with a blade angle of 45°, and six-blade turbine (BT) and a hollow blade turbine (HBT), both with a blade angle of 45°. Because 45° oblique blades in laminar and turbulent states are effective blades and suitable for viscosity change, the range was larger [28]. Among them, the PBT blade, PBD blade, and HBT blade were common runoff blades, and the BT blade was an axial flow blade [21,29,30]. The structure of the stirrer and the schematic diagram of the four blades are shown in Figure 1.
The solid-liquid system consisted of liquid water (1000 kg/m3), FP (950 kg/m3), and SP (1050 kg/m3). The average solid concentration was 5% by volume. The Euler multiphase flow model regards the two phases, solid and liquid, as mutually permeable media, and water was defined as a continuous phase. Moreover, SP and FP were infiltrated by water as dispersed phases, and fluid was considered incompressible.

2.2. Mathematical Model

Numerical simulation was realized in commercial CFD software FLUENT 2020 R1(ANSYS, Inc., Pittsburgh, PA, USA) [31]. The solution of the solid-liquid separation flow field was obtained by solving the continuity equation and momentum equation with the Euler-Euler multiphase flow model. The control equation used to describe the mixed system consists of three basic equations, namely, momentum conservation, mass conservation, and energy conservation, which are indicated in Equation (1).
a n ρ n t + a n ρ n v = 0
where αn is the n phase volume fraction, n represents the liquid phase (l) or solid phase (s), ρ is the phase density, v is speed, and t is time.
The momentum conservation equations of the liquid phase (l) and solid phase (s) are shown in Equations (2) and (3).
a l ρ l v l t + a l ρ l v l v l = a l p + a l ρ l g + τ l ¯ ¯ + p = 1 n K l s v l v s
a s ρ s v s t + a s ρ s v s v s = a s P P s + a s ρ s g + τ s ¯ ¯ + p = 1 n K l s v s v l
where τ l ¯ ¯ and τ s ¯ ¯ are l, s phase pressure-strain tensors; the formula is shown as Equation (4). Ps is solid-phase pressure, and Kls is the interphase momentum exchange coefficient.
τ n ¯ ¯ = a n μ n v n + v n T + a n λ n 2 3 μ n v n
where μn and λn are shear viscosity and bulk viscosity of n phases, respectively.
Calculation of the solid-liquid exchange coefficient Kls was conducted using the Gidaspow model [32].
When al > 0.8, Kls is shown in Equation (5).
K l s = 3 4 C D a l a s ρ l d s v l v s a l 2.65
When al ≤ 0.8, Kls is shown in Equation (6).
K l s = 150 C D a s 1 a l μ l a l d s 2 + 1.75 a s ρ l v l v s d s
where CD is the drag coefficient, and the formula is shown in Equation (7).
C D = 24 a l Re s 1 + 0.15 a l Re s 0.687
where Res is the Reynolds number between the primary and secondary phases; the formula is shown in Equation (8).
Re s = ρ l d s v l v s μ l
The solid (S1)-solid (S2) momentum exchange coefficient selects the Syamlal-O’Brien symmetric model [33] recommended by Wang [20], and the formula is shown in Equation (9).
K s 1 s 2 = 3 1 + e s 1 s 2 π 2 + C f r , s 1 s 2 π 2 8 α s 1 ρ s 1 α s 2 ρ s 2 d s 1 + d s 2 2 g 0 , s 1 s 2 2 π ρ s 1 d s 1 3 + ρ s 2 d s 2 3 v s 1 v s 2
where es1s2 is the recovery coefficient, Cfr,s1s2 is the friction coefficient between solid phases, and g0,s1s2 is the radial distribution coefficient, which is applied to correct the collision probability between particles when the solid particles tend to be dense. In FLUENT, es1s2 = 0.9, Cfr,s1s2 = 0.
The RNG k-ε turbulence model was applied to forecast the rapid strain and turbulence change [20]. Because the Reynolds number of fluid in the digestion broth was low, the effective viscosity differential analytic formula under a low Reynolds number was provided. The standard k-ε model was mainly used for high Reynolds number fluid simulation. The RNG k-ε model improves the calculation accuracy of fast strain flow, improves the calculation accuracy of eddy current, and provides the analytical formula of the turbulent Prandtl constant. The Prandtl constant was constant in the standard k-ε model [34].
The turbulent kinetic energy (k) and turbulent kinetic energy dissipation rate (ε) were expressed by Equations (10) and (11).
t ρ k + x i ρ k u i = x j α k μ t k x j ρ u i u j ¯ u j x i ρ ε 2 ρ ε k a 2
t ρ ε + x i ρ ε u i = x j α ε μ t ε x j C 1 ε ρ u i u j ¯ u j x i C 2 ε ρ ε 2 k R ε
The turbulent viscosity t was calculated by Equations (12) and (13).
μ t = ρ C μ k 2 ε f α p , Ω , k ε
R ε = C μ ρ η 3 1 η / η 0 1 + β η 3 ε 2 k
where Cμ = 0.0845, αp = 0.05, ƞ0 = 4.38, β = 0.012, ƞ = Sk/ε; S is the total entropy, and Ω is a characteristic swirl number evaluated within Fluent. The constants C1ε = 1.42 and C2ε = 1.68 were used by default.
Blade stirring power was calculated by Equation (14) [35].
P = 2 π N M
where P is the stirring power (W), N is the blade speed (r/s), and M is the blade rotation torque (Nm), which can be obtained by CFD simulation.
The mixed energy level (MEL) (unit volume input power) was calculated by Equation (15) [36].
M E L = P V
where P is the stirring power in Equation (14), and V is the liquid volume of the vessel.

2.3. Numerical Method

This system consisted of three systems including FP, SP, and water. In the computational domain, the distribution of F and S particles was based on the natural sedimentation stratification of CS AD to set the initial conditions. Unstructured grids were generated by ICEM 2020 R1(ANSYS, Inc., Pittsburgh, PA, USA).
The MRF method was applied to process the rotating region and stationary region of blades. The area around the blade was set as the rotating domain, and the remaining areas were set as the stationary domain. The rotating speed was set in the rotating region, and the blade was relatively static with the rotating region. The implicit solver based on pressure was adopted [37]. A SIMPLE algorithm was applied to calculate the coupling of pressure and velocity, and the difference scheme was set to the first-order upwind format.
All examples were executed on two Intel Xeon Scalable Platinum 8124M 3.0 GHz operating systems with 64 GB RAM. In the transient condition simulation, the convergence criterion was 1, and the convergence residual was 1 × 10⁻⁴ within 800 iterations. The total simulation time of each example was about 40 h, and another major convergence criterion was that the blade torque approaches a constant value [38]. This study was mainly to reveal the relationship between solid holdup and energy consumption.

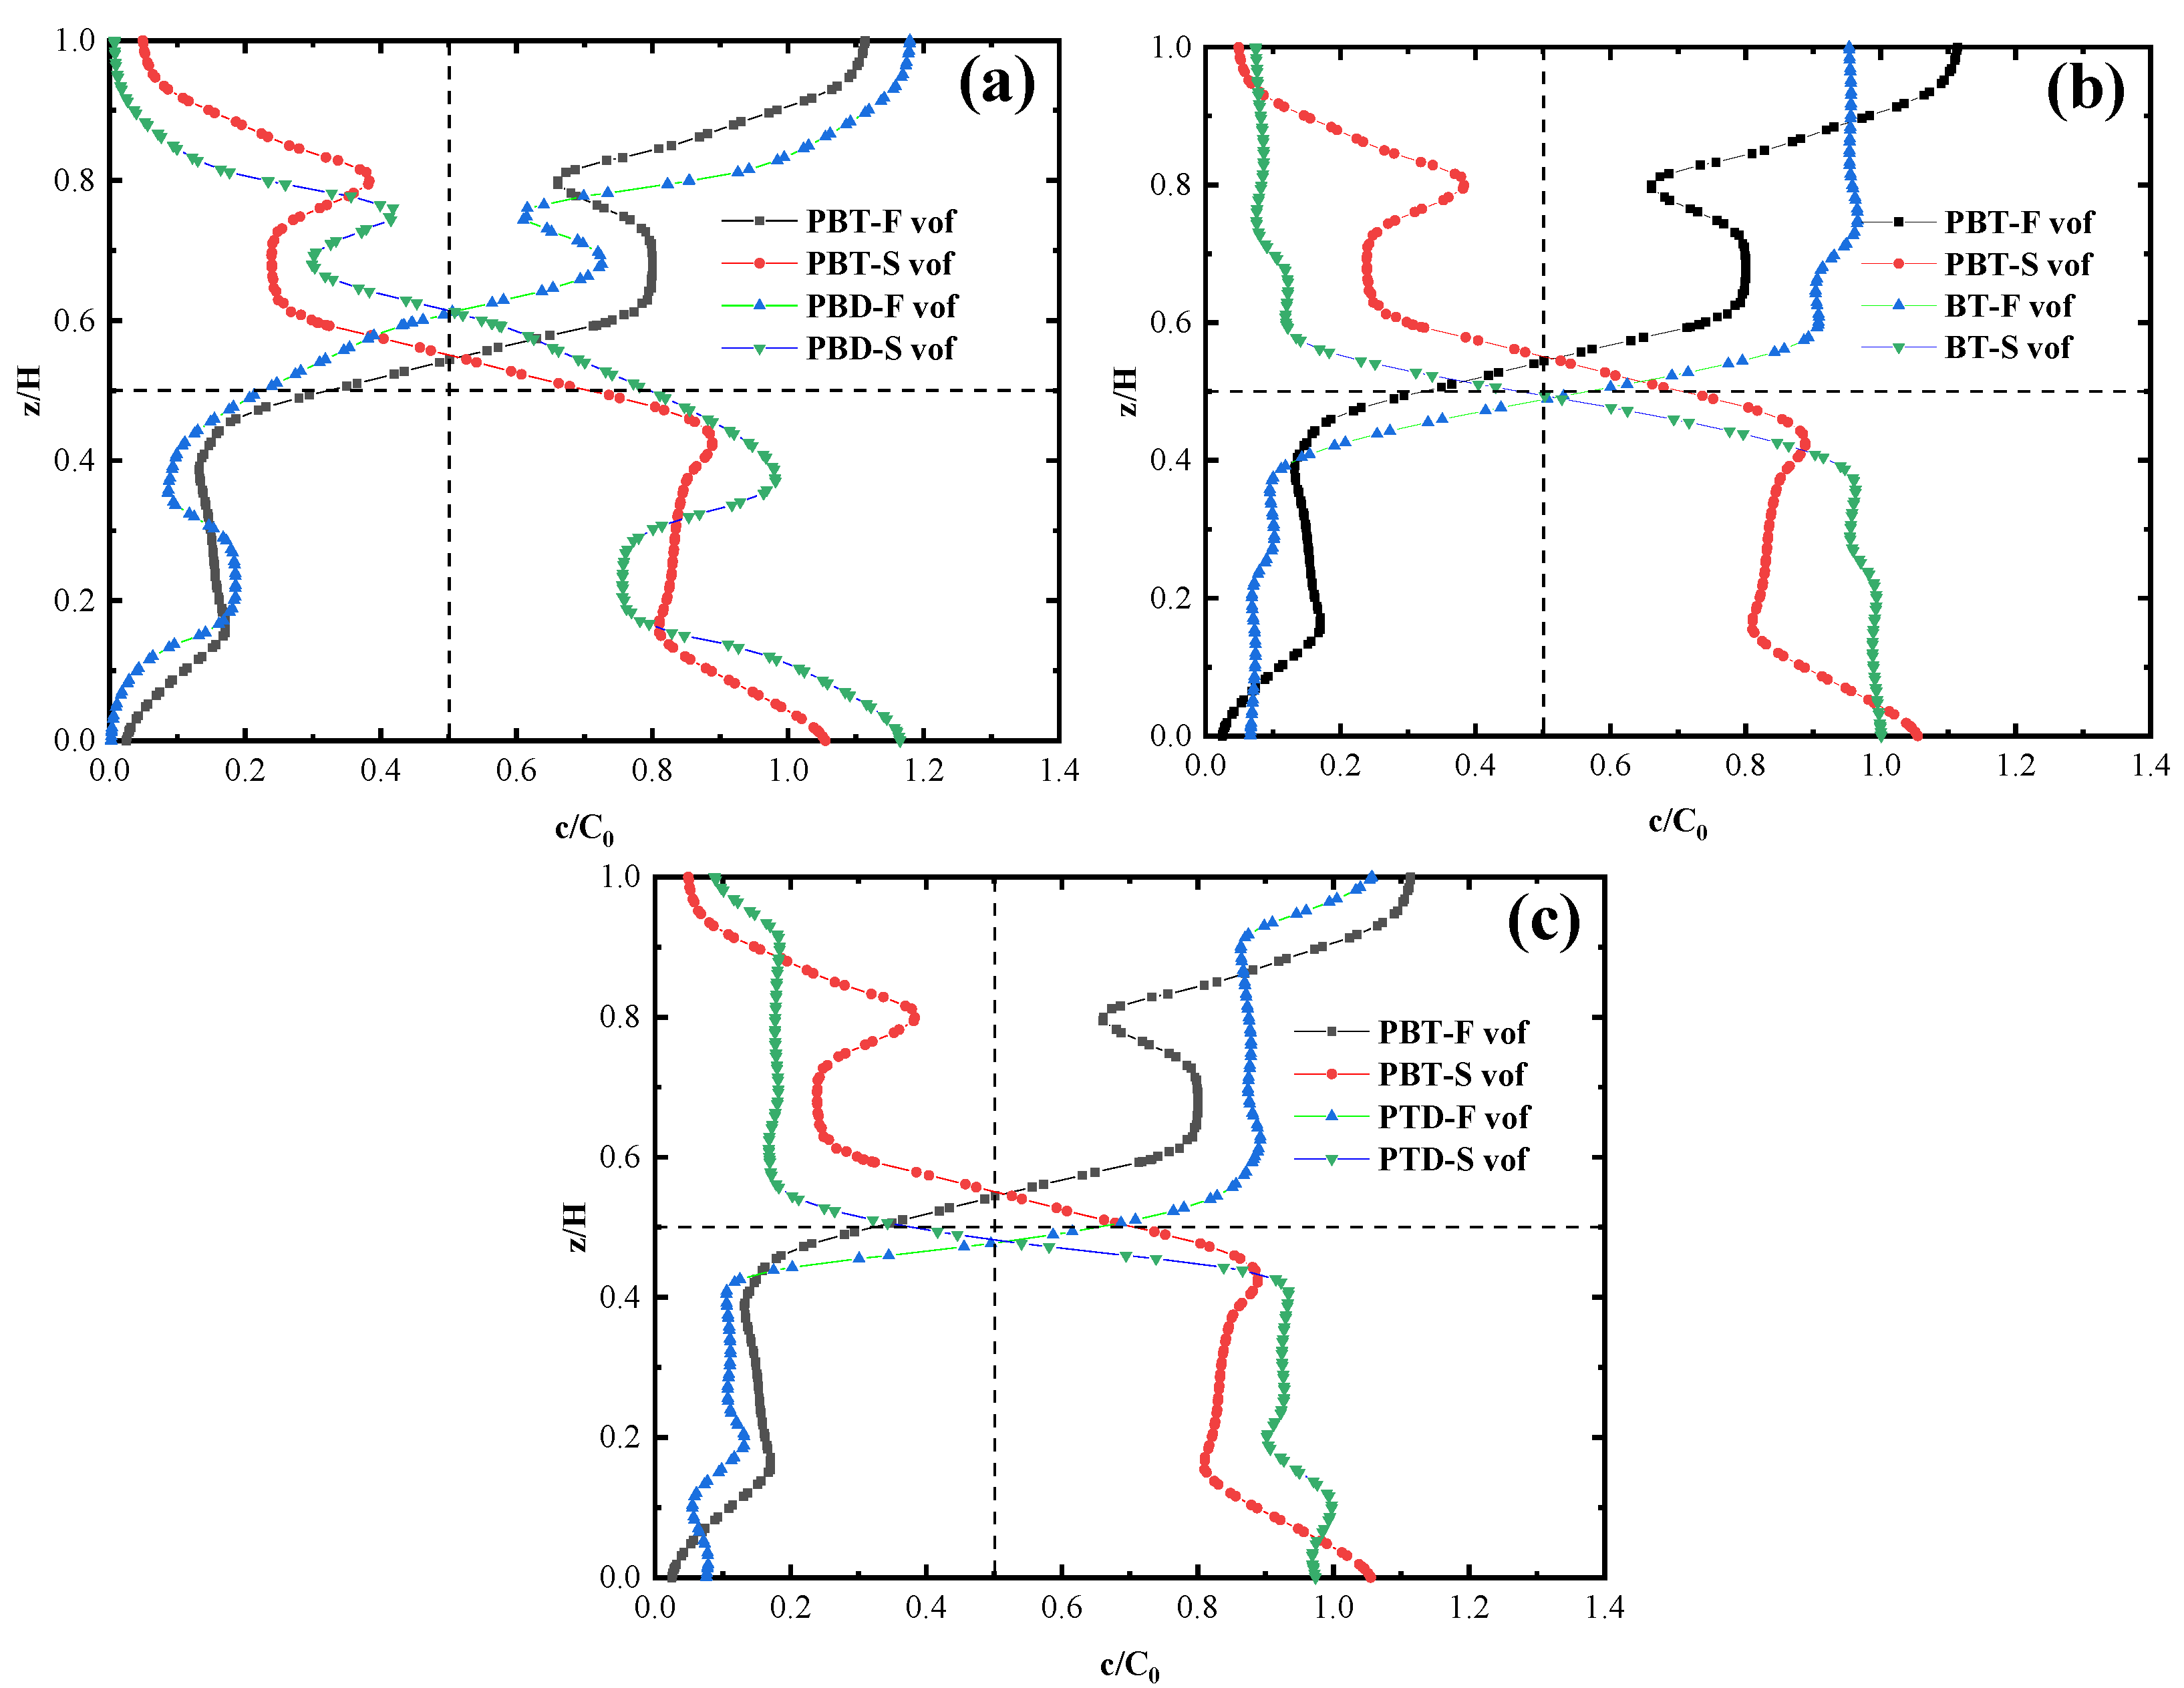
2.4. Characterization of Particle Suspension Performance

Researchers agree that the standard deviation of particle concentration should be applied to characterize suspension performance [39], which can be expressed as Equation (16).
σ = 1 n i = 1 n c i c 0 1 2
where ci and c0 represent the solid volume fraction of the particle sampling point and the average solid volume fraction of the whole reactor, respectively. Usually, when σ is lower than 0.2, the particle concentration is uniform, and when σ is higher than 0.8, the suspension is not uniform. The standard deviations of particle concentrations for FP and SP are denoted by σF and σS, respectively.

2.5. Full-Factorial Design

The full-factorial design was applied to investigate the influence of design factors and levels on the indicators [27]. Three influencing factors of blade diameter (A), immersion depth (B), and blade width (C) were selected. Each factor selected two levels; the high level was defined as (+1), and the low level was (−1). σF, σS, and MEL were selected as measurement indicators. Construction of 23 full-factorial designs was built in this study with a total of 24 examples, which are shown in Table 1. Four basic blades, PBT, PBD, BT, and HBT, were selected.
Data statistics and analysis were conducted by Design Expert 13.0 software (Stat-Ease, Inc., Minneapolis, MN, USA). The significance of factors A, B, and C and the reciprocation between factors AB, AC, and BC were analyzed by analysis of variance (ANOVA). [40]. ANOVA was applied to reveal the effects of three factors and their reciprocation on the indicators (σF, σS, and MEL). The F-test in variance analysis was applied to determine whether the influence of each factor on the index was significant. The p-value was applied to determine the order of significance of factors and their reciprocations for the indicator, with a 95% confidence interval (p < 0.05). The current research discussed the impact of all factors and the reciprocation between factors on indicators.

3. Results

3.1. Model Validation

The RNG k-ε turbulence model was applied to simulate the diffusion of the solid-solid-liquid system (polypropylene, resin, and water) in the stirred reactor. Moreover, the solid phase distribution of the two particles was experimentally verified [22]. Based on the research of Li, a three-phase model was established, and a double-layer PBT propeller was used for simulation and experiment. The thickness of the blade was 3 mm, the diameter of the blade was 120 mm, the height of the lower blade was 56 mm, and the immersion depth of the upper blade was 56 mm. The stirring speed was 80 rpm, and the volume fraction of FP and SP was 2.5%. A total of seven sampling points was set every 40 mm at 60 mm in the radial direction, and the sampling points are shown in Figure 1. Figure 2a reveals the consistency among the simulation results and the experimental results, and the average relative error was 3.53%. The error can mainly be imputed to the numerical error and estimated error generated by the experimental measurements. Therefore, the established solid-solid-liquid multiphase model was compatible with predicting the flow field and solid holdup distribution of the digestion mixture.

3.2. Grid Independence

The number of meshes and the quality of meshes directly affect the accuracy of calculation results. For the benefit of determining the impact of mesh number on reactor simulation results, it was necessary to carry out a mesh independence analysis. Firstly, four geometric models with different mesh sizes were established and simulated by CFD. The axial solid content distribution of FP and SP under different grid sizes is shown in Figure 2b. In the initial stage, four geometric models with different mesh sizes were established for CFD simulation. It was observed that the particle concentration varied greatly with the increase of mesh number in the range of 658,541 to 1,269,393. However, the number of grids further increased from 2,016,313 to 2,725,692, and the change leveled off. Therefore, in the subsequent simulation of 8.8 L working volume, the geometric development of this study was preferentially carried out in a grid size range of about 2 million.

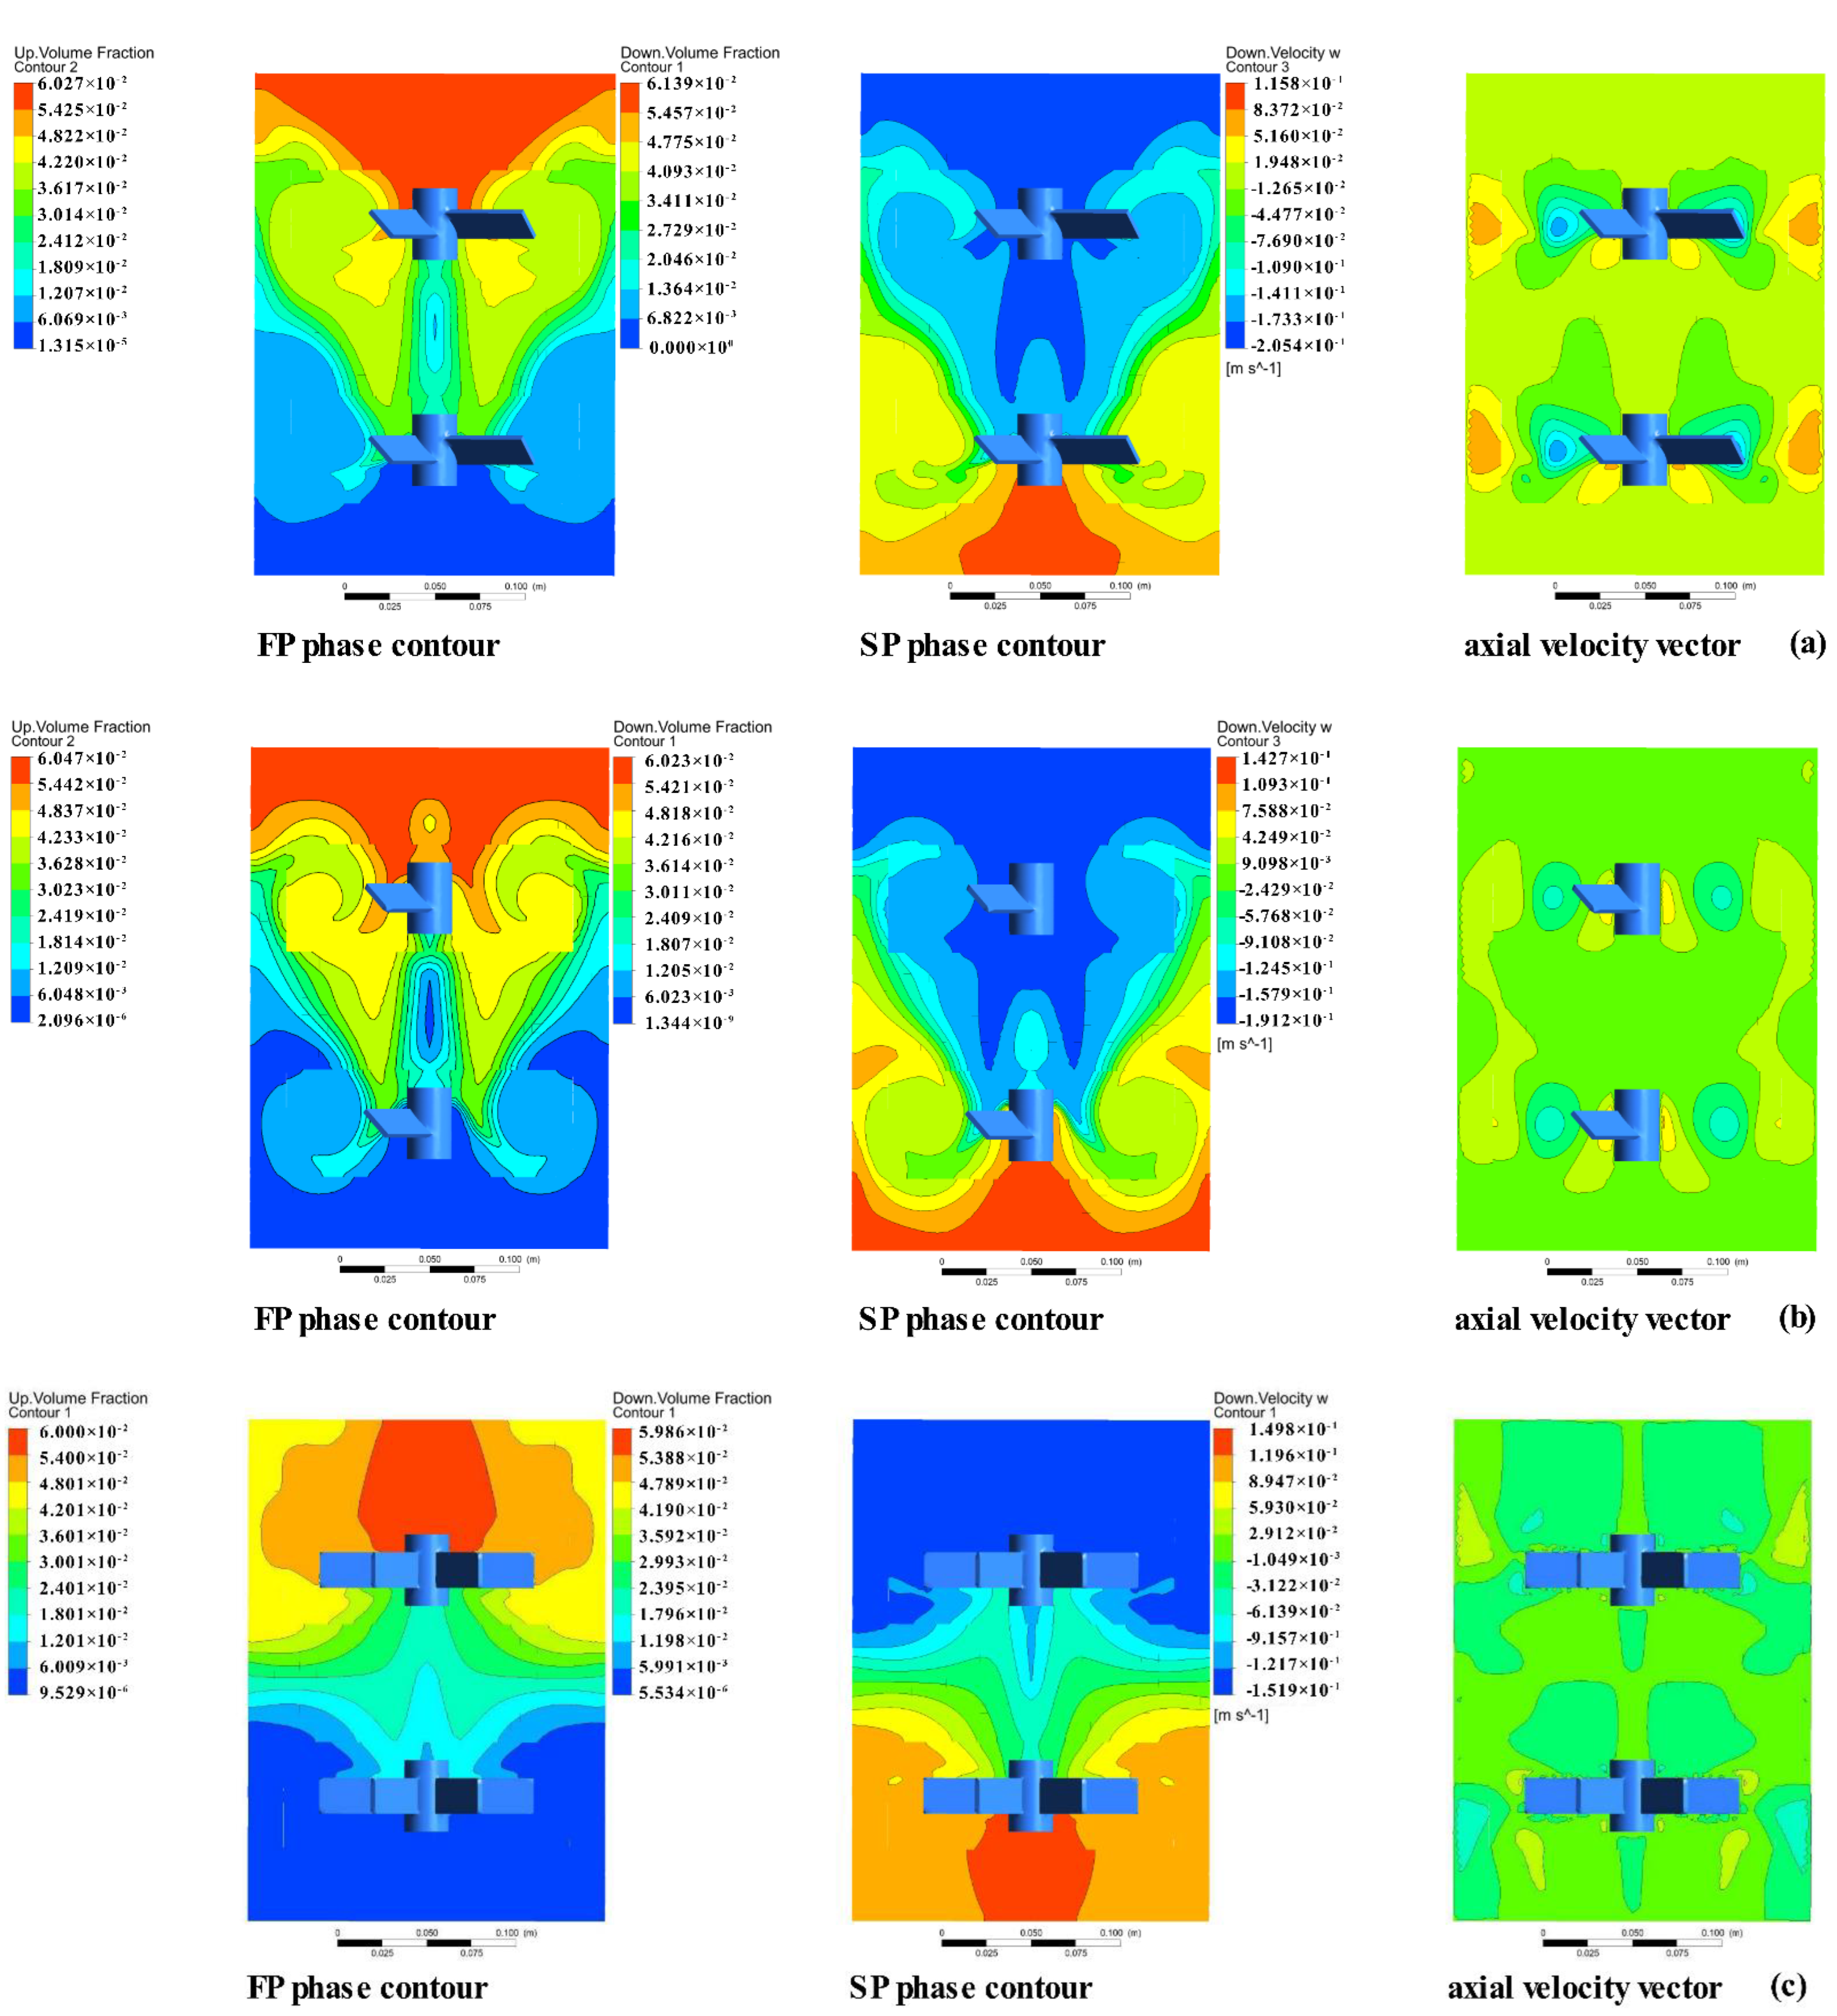
3.3. Blade Stirring Characteristics

In the multiphase system established in this paper, the particle diameter was 0.5 mm, the impeller speed was 80 rpm, and the phase volume fraction of FP and SP was 2.5%. The volume fraction of FP and SP phases and the axial velocity vector diagram are indicated in Figure 3.
The pull-down effect of PBT blades on FP was more pronounced. The effective extension height of the upper circulating stream formed by the upper blade extended to the liquid surface, and the FP near the side of the tank was pulled down to the lower part of the blade; the remaining particles were stacked in an inverted triangle shape above the blade. The SP accumulated at the bottom of the tank. This phenomenon was also reported in the study of the double-layer blade, which was indicated in Figure 3a [41]. The particle circulation flow formed by the PBD blade was analogous to that of the PBT blade. However, because the number of the PBD blades was half that of the PBT blades, the turbulence intensity generated could not effectively pull up and down the FP and SP, so the accumulation effect was more obvious, and the accumulation position appeared in grooves. Bruno et al. reported the same phenomenon when glass beads with PBT blades were suspended [42]. The axial velocity of the particle end at the wall of the PBD blade tank was small, and the main flow could not directly reach the bottom of the tank, which was not conducive to the pull-down and suspension of the particles, which is indicated in Figure 3b.
Both the FP and the SP of the BT blade were accumulated at the central axis, which was approximately cylindrical. The velocity vector diagram showed that this was because the BT blade belonged to the runoff type blade, particles in the BT blade were stirring, and the particle velocity distribution was almost uniform. The particle flow trajectory extended radially away from the tail of the blade, and near the wall was divided into two flows to form two loops, respectively distributed on the upper and lower sides of the blade. The loop formed by the upper and lower blades formed an interface at 0.5 H, resulting in poor mixing among the FP and SP, which is indicated in Figure 3c [22]. The HBT blades had a better effect on the rising of the SP, and only partial accumulation occurred at the central axis. The effect of pulling down the FP was poor, and the FP covered the entire liquid surface, most of which accumulated above the blade. This was owing to the disc design in the middle of the axial-flow HBT blade, which led to the blockage of the upper and lower circulation of the particles, which reduced the pull-down effect of the FP. However, for SP, the end of HBT leaf particles was faster, which will lead to excessive shear stress, and the related high shear stress will also cause damage to microbial cells and flocs, and the existence of high shear stress should be avoided as much as possible. Jie et al. and Luo and Muthanna et al. carried out experiments to verify the effect of shear stress on bacteria in biological hydrogen production reactors and lifting reactors [43,44]. At this time, two vortices were formed below the blade, the effective circulating flow extended to the bottom of the tank, and the SP only sank at the center of the blade, which is indicated in Figure 3d.
PBT, PBD, and HBT blades produced two main cycles in the reactor above all cases. The BT blade produced four main cycles in the reactor, distributed on both sides of the blade. The solid phase distribution of SP was mainly that which can be seen in Figure 3, primarily concentrated near the central axis and covering the liquid surface. The velocity vector diagram shows that the axial velocity was lower in the particle accumulation part, while the particle velocity was quite different in the main circulation part. However, the distribution of FP and SP was uniform [45].
Figure 4 shows the contrast of the normalized axial concentration of the FP and SP of PBT with PBD (Figure 4a), BT (Figure 4b), and HBT (Figure 4c). The line at c/C0 = 0.5 indicates a uniform distribution of FP and SP.
In the vertical section, the solid phase distribution of SP decreased with the increase of reactor depth, and the solid holdup was the highest at the center of the groove bottom and the lowest at the axis center near the liquid surface. The solid phase distribution of FP was opposite, as shown in Figure 4. Kasat et al.’s simulation of the solid holdup distribution in the SP and FP particle stirred tank also found that the SP solid holdup was low, and the FP solid holdup was high at the center of the circulating vortex, which was consistent with the simulation results in this paper [46,47]. Comparing PBT blades with the other three blades, it can be seen that the particle concentration was in the range of z/H = 0.4–0.6, and the FP was mixed here. Figure 4a,b show contrasts with the BT blade and HBT blade. The FP concentration curve of the PBT blade approached the straight line at c/C0 = 0.5. By contrast with the PBD blade, both of them had similar solid phase distribution, but the PBD blade had a better mixing effect on the FP in the upper half of the reactor. In Figure 4c, the particle concentration curves of PBT and PBD were almost asymmetric near z/H = 0.5 [48]. This was because the upper blade generated more turbulence in its vicinity, so the mixing effect was better.

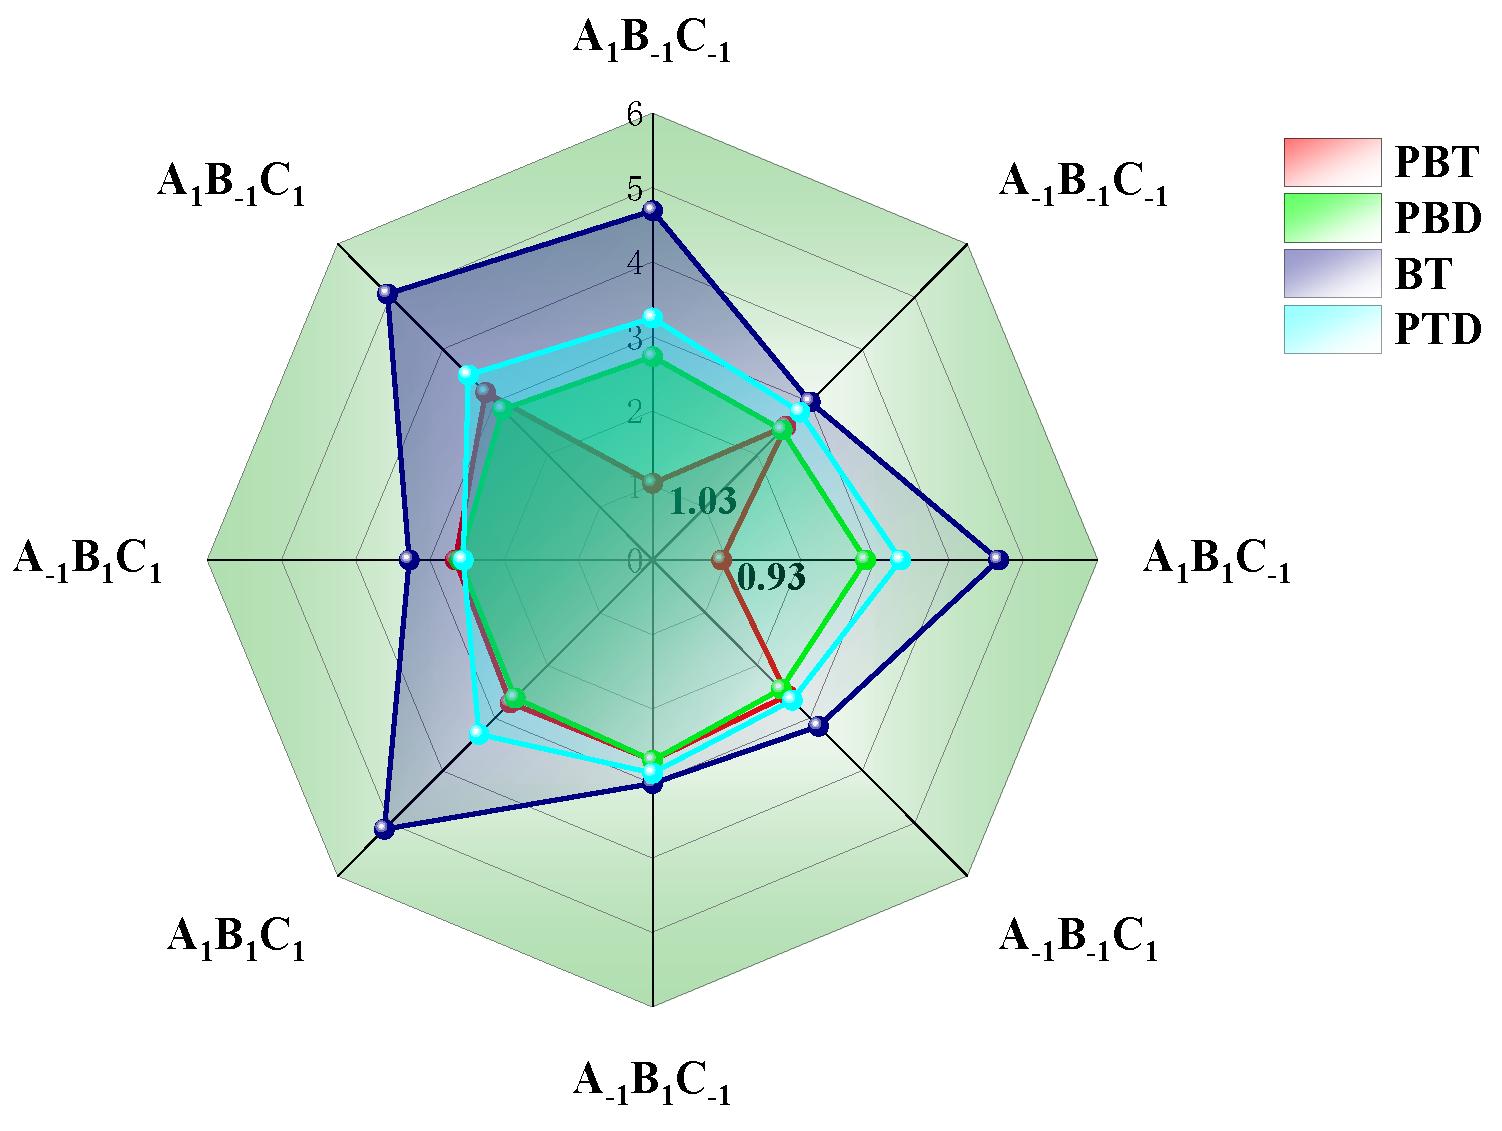
3.4. Full-Factorial Design

3.4.1. Influencing Factor

Figure 5 shows the response values of PBT, PBD, BT, and HBT obtained by full-factorial design and the running test. The results were analyzed by ANOVA analysis, and the relationship between different blade response values and design factors was obtained after fitting. The results of these figures indicate the particle mixing and energy consumption, which hinge on the design factors and those level settings.
The factor significance p-values for the four blades are summarized in Table 2. It shows that only the blade diameter (A) and the blade width (C) of PBT and HBT significantly affected the standard deviation σF and σS of the FP. The p-value of the blade diameter was less than the p-value of the blade width, indicating that the blade diameter had a more significant effect on the FP suspension. For blade PBD, the effect of immersion depth (B) on σF and σS was also significant. This was because the number of PBD blades was less than that of PBT blades, and the turbulence intensity generated by stirring was low, so the immersion depth of the upper blade attacks the particle suspension [49]. For the σF of the BT blade, all factors were not significant, which was because the BT blade is a runoff type blade, and the FP exchange process was blocked. The turbulence generated by the lower blade was dispersed into several small turbulences on the inner wall of the tank, which promoted the SP to rise, and the turbulence generated by the upper blade extended to the liquid level to dissipate.
In addition to the impact of individual factors, the impact of two-factor reciprocation on indicators was also analyzed. For the PBT blade and BT blade, the p values of AB and AC indicated that the σF and σS reciprocations of blade diameter (A) and blade width (C) on the two blades were significant. Two-factor interaction compared to the consequence of a single factor on mixing was different. Therefore, the blade aspect ratio was an important factor in the design of the particle mixing blades.

3.4.2. Fitting Equation

The regression equations of blade diameter (A), immersion depth (B), and blade width (C) and their second-order reciprocation were obtained by fitting σF and σS with MEL through regression analysis. The relevant mathematical expressions are shown in Table 3.
The minimum values for each blade index (σF, σS, and MEL) and their corresponding factor levels are summarized in Table 4. For the four kinds of blades, the higher the blade diameter level and the higher the blade width level, the better the particle suspension effect that could be obtained. However, for PBT blades, the obtained minimum values of σF and σS were inconsistent with the other three blades. For MEL, the minimum value could be obtained when the blade diameter and blade width were at a low level.
The best design state of the stirring blade was that the three indexes all obtained the minimum value. However, from Table 4, it can be seen that selecting the minimum value of the three indicators at the same time could not be balanced in one blade [23]. Therefore, it was necessary to establish an optimization function including three indexes; the formula is shown as Equation (17).
Q = k σ F σ F a v g + m σ S σ S a v g + n M E L MEL a v g
where Q is the optimization value; k, m, and n are the influence weights of the three indexes, respectively; and the corresponding weight factors can be changed according to the actual operation [4]. In this system, the three indicators were equally important, so the three weight factors k, m, and n were set to 1, where σFavg, σSavg, and MELavg were the average values of σF, σS, and MEL in 32 simulation experiments, which were 0.69, 0.62, and 13.8 W·m−3, respectively.
To find the optimal value Qmin for σF, σS, and MEL in 32 sets of simulation experiments, the optimization values are listed in Figure 6. It can be seen that among the four-blade designs, the PBT blades with large diameters, large immersion depths, and narrow blades (A1, B1, C1) with Qmin = 0.93 could best balance the standard deviation of particle concentration and mixed energy level. This optimization result was somewhat different from the result obtained by Zhang. The other optimization result was that the small diameter and wide blade showed the best performance. The possible reason was that the double-layer blade design was adopted in this paper. Compared with the same type of single-layer blade, the double-layer slurry can produce more turbulence, and the large-diameter narrow blade is more conducive to particle suspension [23]. The factorial design method can guide the selection of blade parameters to achieve the best mixing design and can be extended to the same type of reactor design.

4. Conclusions

An optimal design method for the particle mixing behavior of the multiphase system in a stirred AD reactor was proposed. Using CFD simulation, the suspension behavior and local concentration distribution of four typical blades on FP and SP were shown. The results of the full-factorial design were presented in the form of a regression formula, with rational appraisal of the stirring performance of each blade. In order to balance the weight of particle mixing effects and energy consumption, a comprehensive equation was established. Therefore, the PBT blade with a large diameter, high immersion depth, and small blade width was the best design. This equation can be extended to the blade design of the same type of stirred reactor. The next step will be to make further research on the gas-liquid-solid system in the gas production stage of anaerobic digestion.

Author Contributions

Conceptualization, X.W. and Y.S.; methodology, X.W.; software, X.W., T.L. and Y.L.; validation, X.W., Y.L. and T.L.; formal analysis, X.W. and T.L.; resources, Q.Z.; data curation, X.W. and T.L.; writing—original draft preparation, X.W.; writing—review and editing, Y.L. and Y.S.; visualization, T.L.; supervision, Y.S.; project administration, Y.S.; funding acquisition, Q.Z. and Y.S. All authors have read and agreed to the published version of the manuscript.

Funding

This research was funded by the National Natural Science Foundation of China (52076034) and the Development Program Strategic Key Special Subject of International Science and Technology Innovation Cooperation (2018YFE026602).

Institutional Review Board Statement

Not applicable.

Informed Consent Statement

Not applicable.

Data Availability Statement

Not applicable.

Conflicts of Interest

The authors declare no conflict of interest.

Abbreviations

FPFloating particles
SPSinking particles
ADAnaerobic digestion
CSCorn straw
CSTRContinuous stirred tank reactor
MRFMulti-reference frame
PBTPitched blade turbine
PBDPitched two-blade impeller pumping down
BTSix-blade turbine
HBTHollow blade turbine
MELMixed energy level
OFATOne factor at a time

References

  1. Chu, X.; Cheng, Q.; Xu, Y.; Luo, L.; Wang, M.; Zheng, G.; Zhang, H.; Yi, W.; Liu, X.; Sun, Y.; et al. Anaerobic digestion of corn straw pretreated by ultrasonic combined with aerobic hydrolysis. Bioresour. Technol. 2021, 341, 125826. [Google Scholar] [CrossRef] [PubMed]
  2. Liu, Z.; Sun, Y.; Xu, X.; Meng, X.; Qu, J.; Wang, Z.; Liu, C.; Qu, B. Preparation.; characterization and application of activated carbon from corn cob by KOH activation for removal of Hg(II) from aqueous solution. Bioresour. Technol. 2020, 306, 123154. [Google Scholar] [CrossRef] [PubMed]
  3. Qu, J.; Sun, Y.; Awasthi, M.K.; Liu, Y.; Xu, X.; Meng, X.; Zhang, H. Effect of different aerobic hydrolysis time on the anaerobic digestion characteristics and energy consumption analysis. Bioresour. Technol. 2021, 320, 124332. [Google Scholar] [CrossRef]
  4. Sun, Y.; Zhang, Z.; Sun, Y.; Yang, G. One-pot pyrolysis route to Fe-N-Doped carbon nanosheets with outstanding electrochemical performance as cathode materials for microbial fuel cell. Int. J. Agric. Biol. Eng. 2020, 13, 207–214. [Google Scholar] [CrossRef]
  5. Niu, M.; Pang, X.; Chen, S. The Study of Influencing Factors to Corn Straw Mixed with Pig Effluent Anaerobic Fermentation. Procedia Environ. Sci. 2011, 8, 54–60. [Google Scholar] [CrossRef] [Green Version]
  6. Khan, M.A.; Ngo, H.H.; Guo, W.; Liu, Y.; Zhang, X.; Guo, J.; Chang, S.W.; Nguyen, D.D.; Wang, J. Biohydrogen production from anaerobic digestion and its potential as renewable energy. Renew. Energy 2018, 129, 754–768. [Google Scholar] [CrossRef]
  7. Zhang, B.; Li, W.; Xu, X.; Li, P.; Li, N.; Zhang, H.; Sun, Y. Effect of Aerobic Hydrolysis on Anaerobic Fermentation Characteristics of Various Parts of Corn Stover and the Scum Layer. Energies 2019, 12, 381. [Google Scholar] [CrossRef] [Green Version]
  8. Sun, Y.; Wang, L.; Zhang, Z.; Li, J. Development and experiment of barrier crust anaerobic fermentation reactors. Trans. Chin. Soc. Agric. Eng. 2022, 38, 30–37. [Google Scholar] [CrossRef]
  9. Gong, H.; Huang, F.; Li, Z.; Gao, Z.; Derksen, J.J. Mechanisms for drawdown of floating particles in a laminar stirred tank flow. Chem. Eng. J. 2018, 346, 340–350. [Google Scholar] [CrossRef] [Green Version]
  10. Li, G.; Gao, Z.; Li, Z.; Wang, J.; Derksen, J.J. Particle-resolved PIV experiments of solid-liquid mixing in a turbulent stirred tank. AIChE J. 2018, 64, 389–402. [Google Scholar] [CrossRef]
  11. Ren, X.; Zheng, W.; Qiao, H.; Ren, L.; Liu, S.; Huang, Z.; Qi, X.; Wang, Z.; Zhong, J.; Zhang, H. Enhanced photoresponse behavior of Au@Bi2Te3 based photoelectrochemical-type photodetector at solid-solid-liquid joint interface. Mater. Today Energy 2020, 16, 100401. [Google Scholar] [CrossRef]
  12. Shi, X.; Tan, C.; Dong, F.; Santos, E.N.d.; Silva, M.J.d. Conductance Sensors for Multiphase Flow Measurement: A Review. IEEE Sens. J. 2021, 21, 12913–12925. [Google Scholar] [CrossRef]
  13. Pandey, A.K.; Pratap, R.; Chau, F.S. Influence of Boundary Conditions on the Dynamic Characteristics of Squeeze Films in MEMS Devices. J. Microelectromech. Syst. 2007, 16, 893–903. [Google Scholar] [CrossRef] [Green Version]
  14. Jing, Q.; Huang, X.; Wu, L.; Liu, T.; Yan, X.; Li, D. Design and Experiment of Dry Anaerobic Digestion PilotPlant for Biogas Producing. Trans. Chin. Soc. Agric. Mach. 2012, 43 (Suppl. S1), 186–189. [Google Scholar]
  15. Van Wachem, B.G.M.; Almstedt, A.E. Methods for multiphase computational fluid dynamics. Chem. Eng. J. 2003, 96, 81–98. [Google Scholar] [CrossRef]
  16. Kuzmanic, N.; Akrap, M.; Kovacevic, A. An experimental investigation into the complete drawdown of floating solids in dual-impeller stirred vessels. J. Chem. Eng. Jpn. 2006, 39, 932–939. [Google Scholar] [CrossRef]
  17. Shen, F.; Tian, L.; Yuan, H.; Pang, Y.; Chen, S.; Zou, D.; Zhu, B.; Liu, Y.; Li, X. Improving the Mixing Performances of Rice Straw Anaerobic Digestion for Higher Biogas Production by Computational Fluid Dynamics (CFD) Simulation. Appl. Biochem. Biotechnol. 2013, 171, 626–642. [Google Scholar] [CrossRef]
  18. Baldi, G.; Conti, R.; Alaria, E. complete suspension of particles in mechanically agitated vessels. Chem. Eng. Sci. 1978, 33, 21–25. [Google Scholar] [CrossRef]
  19. Ren, X.; Gao, F. Concentration Distribution of Suspended Solids in a Liquld-solid Stirred Tank. Chem. React. Eng. Technol. 1993, 9, 477–484. [Google Scholar]
  20. Wang, L.; Zhang, Y.; Li, X.; Zhang, Y. Experimental investigation and CFD simulation of liquid-solid-solid dispersion in a stirred reactor. Chem. Eng. Sci. 2010, 65, 5559–5572. [Google Scholar] [CrossRef]
  21. Zhang, Y.; Yu, G.; Yu, L.; Siddhu, M.A.; Gao, M.; Abdeltawab, A.A.; Al-Deyab, S.S.; Chen, X. Computational fluid dynamics study on mixing mode and power consumption in anaerobic mono- and co-digestion. Bioresour. Technol. 2016, 203, 166–172. [Google Scholar] [CrossRef] [PubMed]
  22. Li, L.; Xu, B.; Yang, J. Sinking/Floating Particles Solid Suspension Characteristics in Stirred Tank Based on CFD Simulation. J. Mech. Eng. 2014, 50, 185–191. [Google Scholar] [CrossRef]
  23. Zhang, Y.; Yu, G.; Siddhu, M.A.H.; Masroor, A.; Ali, M.F.; Abdeltawab, A.A.; Chen, X. Effect of impeller on sinking and floating behavior of suspending particle materials in stirred tank: A computational fluid dynamics and factorial design study. Adv. Powder Technol. 2017, 28, 1159–1169. [Google Scholar] [CrossRef]
  24. Cheng, S.-J.; Miao, J.-M.; Wu, S.-J. Investigating the effects of operational factors on PEMFC performance based on CFD simulations using a three-level full-factorial design. Renew. Energy 2012, 39, 250–260. [Google Scholar] [CrossRef]
  25. Lee, S.; Park, Y.; Kim, J. An evaluation of factors influencing drag coefficient in double-deck tunnels by CFD simulations using factorial design method. J. Wind Eng. Ind. Aerod. 2018, 180, 156–167. [Google Scholar] [CrossRef]
  26. Jankovic, A.; Chaudhary, G.; Goia, F. Designing the design of experiments (DOE)—An investigation on the influence of different factorial designs on the characterization of complex systems. Energy Build. 2021, 250, 111298. [Google Scholar] [CrossRef]
  27. Yurata, T.; Piumsomboon, P.; Chalermsinsuwan, B. Effect of contact force modeling parameters on the system hydrodynamics of spouted bed using CFD-DEM simulation and 2 factorial experimental design. Chem. Eng. Res. Des. 2020, 153, 401–418. [Google Scholar] [CrossRef]
  28. Roudsari, S.F.; Ein-Mozaffari, F.; Dhib, R. Use of CFD in modeling MMA solution polymerization in a CSTR. Chem. Eng. J. 2013, 219, 429–442. [Google Scholar] [CrossRef]
  29. Li, J.; Zou, J.; Wei, X. Modeling of CSTR flow field for Agaricus bisporus residue fermentation based on CFD numerical simulation. Environ. Sci. Pollut. Res. Int. 2022, 1–12. [Google Scholar] [CrossRef]
  30. Patel, H.; Dhib, R.; Ein-Mozaffari, F. Computational Fluid Dynamics Study of a Styrene Polymerization Reactor. Chem. Eng. Technol. 2010, 33, 258–266. [Google Scholar] [CrossRef]
  31. Chou, Y.-J.; Wu, F.-C.; Shih, W.-R. Toward numerical modeling of fine particle suspension using a two-way coupled Euler-Euler model. Part 1, Theoretical formulation and implications. Int. J. Multiph. Flow. 2014, 64, 35–43. [Google Scholar] [CrossRef]
  32. Sobieski, W. Switch Function and Sphericity Coefficient in the Gidaspow Drag Model for Modeling Solid-Fluid Systems. Dry. Technol. 2009, 27, 267–280. [Google Scholar] [CrossRef]
  33. Gera, D.; Syamlal, M.; O’Brien, T.J. Hydrodynamics of particle segregation in fluidized beds. Int. J. Multiph. Flow. 2004, 30, 419–428. [Google Scholar] [CrossRef]
  34. Mao, L.; Zhang, J.; Dai, Y.; Tong, Y.W. Effects of mixing time on methane production from anaerobic co-digestion of food waste and chicken manure: Experimental studies and CFD analysis. Bioresour. Technol. 2019, 294, 122177. [Google Scholar] [CrossRef]
  35. Bhole, M.R.; Bennington, C.P.J. Performance of Four Axial Flow Impellers for Agitation of Pulp Suspensions in a Laboratory-Scale Cylindrical Stock Chest. Ind. Eng. Chem. Res. 2010, 49, 4444–4451. [Google Scholar] [CrossRef]
  36. Wu, B. CFD simulation of mixing for high-solids anaerobic digestion. Biotechnol. Bioeng. 2012, 109, 2116–2126. [Google Scholar] [CrossRef]
  37. Guo, J.; Chen, Z.; Dai, Y. Numerical study on self-propulsion of a waterjet propelled trimaran. Ocean Eng. 2020, 195, 106655. [Google Scholar] [CrossRef]
  38. Li, L.; Xu, B. CFD simulation of local and global mixing time in an agitated tank. Chin. J. Mech. Eng. 2017, 30, 118–126. [Google Scholar] [CrossRef]
  39. Matthias, B.; Gerd, N. Feststoffverteilung in gerührten Suspensionen. Chem. Ing. Technol. 1979, 4, 314–315. [Google Scholar]
  40. Prateepchaikul, G.; Somnuk, K.; Allen, M. Design and testing of continuous acid-catalyzed esterification reactor for high free fatty acid mixed crude palm oil. Fuel Process. Technol. 2009, 90, 784–789. [Google Scholar] [CrossRef]
  41. Ding, Y.; Zong, Y.; Xi, Z.; Zhao, L. Structure Optimization of Dual Impellers in Solid-Liquid System by Numerical Simulation. J. East China Uni. Sci. Techno Nat. Sci. Ed. 2015, 41, 750–757. [Google Scholar] [CrossRef]
  42. Das, T.; Usher, S.P.; Batstone, D.J.; Rees, C.A.; Stickland, A.D.; Eshtiaghi, N. Shear and solid-liquid separation behaviour of anaerobic digested sludge across a broad range of solids concentrations. Water Res. 2022, 222, 118903. [Google Scholar] [CrossRef]
  43. Dapelo, D.; Alberini, F.; Bridgeman, J. Euler-Lagrange CFD modelling of unconfined gas mixing in anaerobic digestion. Water Res. 2015, 85, 497–511. [Google Scholar] [CrossRef] [PubMed]
  44. Luo, H.-P.; Al-Dahhan, M.H. Local characteristics of hydrodynamics in draft tube airlift bioreactor. Chem. Eng. Sci. 2008, 63, 3057–3068. [Google Scholar] [CrossRef]
  45. Ding, J.; Wang, X.; Zhou, X.F.; Ren, N.Q.; Guo, W.Q. CFD optimization of continuous stirred-tank (CSTR) reactor for biohydrogen production. Bioresour. Technol. 2010, 101, 7016–7024. [Google Scholar] [CrossRef] [PubMed]
  46. Kasat, G.R.; Khopkar, A.R.; Ranade, V.V.; Pandit, A.B. CFD simulation of liquid-phase mixing in solid-liquid stirred reactor. Chem. Eng. Sci. 2008, 63, 3877–3885. [Google Scholar] [CrossRef]
  47. Panneerselvam, R.; Savithri, S.; Surender, G.D. CFD modeling of gas-liquid-solid mechanically agitated contactor. Chem. Eng. Res. Des. 2008, 86, 1331–1344. [Google Scholar] [CrossRef]
  48. Meroney, R.N.; Colorado, P.E. CFD simulation of mechanical draft tube mixing in anaerobic digester tanks. Water Res. 2009, 43, 1040–1050. [Google Scholar] [CrossRef]
  49. Wei, P.; Mudde, R.F.; Uijttewaal, W.; Spanjers, H.; van Lier, J.B.; de Kreuk, M. Characterising the two-phase flow and mixing performance in a gas-mixed anaerobic digester: Importance for scaled-up applications. Water Res. 2019, 149, 86–97. [Google Scholar] [CrossRef]
Figure 1. Digestion reactor and blade structure: (A) Diameter; (B) Immersion; (C) Width.
Fermentation 08 00717 g001
Figure 2. Model validation and mesh independence: (a) axial 60 mm solid holdup curve; (b) mesh independence.
Fermentation 08 00717 g002
Figure 3. Solid distribution and axial velocity vector for blades (A = 0.6 D, B = 0.3 HL, C = 0.2 D): (a) PBT, (b) PBD, (c) BT, and (d) HBT on Y = 0 surface.
Fermentation 08 00717 g003aFermentation 08 00717 g003b
Figure 4. Comparison of normalized axial concentration of SP and FP for four blades (A = 0.6 D, B = 0.3 HL, C = 0.2 T): (a) PBT-PBD, (b) PBT-BT, and (c) PBT-HBT.
Fermentation 08 00717 g004
Figure 5. Full-factorial design response results: (a) PBT blade, (b) PBD blade, (c) BT blade, and (d) HBT blade.
Fermentation 08 00717 g005
Figure 6. Radar chart of blade optimization.
Fermentation 08 00717 g006
Table 1. Factors and their levels for the 23 full-factorial design.
FactorsSymbolLow Level (−1)High Level (+1)
Diameter (mm)A80 (A/D = 0.40)120 (A/D = 0.60)
Immersion depth (mm)B56 (A/HL = 0.20)84 (A/HL = 0.30)
Width (mm)C20 (A/D = 0.10)40 (A/D = 0.20)
Note: D = 200 mm, HL = 280 mm, speed = 80 rpm, total solids = 5%.
Table 2. Four kinds of blade influence factors and the p-value summary.
BladeInfluencing Factorp-Value
ABCABACBC
PBTσF0.002 ** 0.035 ** 0.023 *
σS0.007 ** 0.037 *0.034 *0.024 *
MEL (W·m−3)0.007 ** 0.001 ** 0.001 **
PBDσF0.006 **0.028 *0.005 **
σS0.006 **0.027 *0.005 **
MEL (W·m−3)0.015 * 0.036 *
BTσF
σS0.012 *0.006 **0.008 ** 0.038 *
MEL (W·m−3)0.006 ** 0.023 *
HBTσF0.004 ** 0.033 *
σS0.019 * 0.022 *
MEL (W·m−3)0.006 ** 0.003 ** 0.004 **
Note: ** represents p < 0.01, * represents p < 0.05.
Table 3. The mathematical equation of significant factors affecting indicators.
BladeEquationR2
PBTσF = 0.5488 − 0.2713A + 0.0888B + 0.1038AC0.96
σS = 0.4825 − 0.2375A + 0.0425C − 0.0475AB + 0.0675AC1.00
MEL = 10.03 + 6.11A + 4.06C + 3.21AC1.0000
PBDσF = 0.7150 − 0.0700A − 0.0325B − 0.0800C0.98
σS = 0.5950 − 0.0650A − 0.0300B − 0.0700C0.98
MEL = 8.38 + 5.32A + 2.24C1.00
BTσS = 0.7163 + 0.0363B − 0.0412C + 0.0162AB + 0.0287AC − 0.0263BC1.00
MEL = 20.52 + 12.24A0.75
HBTσF = 0.7187 − 0.1212A − 0.0537C0.92
σS = 0.645 − 0.0825A − 0.0725C1.00
MEL = 13.40 + 8.58A + 2.26C + 1.39AC1.0000
(+) indicates that there was a synergistic effect between the index and the factor; on the contrary, (−) indicates that there was an antagonistic effect between the two. For PBT, BT, and HBT, the factor blade diameter (A) was proportional to σF, and the factor immersion depth (B) was only proportional to PBT; for blade PBD and HBT, the three factors were inversely proportional to σF; for blade BT, σF was not a significant influencing factor, which means that there were no suggested predictors [37], whereas the BT blade was subjected to all factors, such as A, B, C, AB, AC, and BC. In addition, for MEL, all factors that had a significant impact on it were proportional to it. Owing to the various suspension mechanisms of FP and SP, the differentiated design was adopted to deal with different mixing strategies to achieve the design goal.
Table 4. Summary table of minimum index.
BladeσF (min)Optimization GroupσS (min)Optimization GroupMEL (min)
(W·m−3)
Optimization Group
PBT0.07(A1, B − 1, C − 1)0.09(A1, B1, C − 1)3.06(A − 1, B1, C − 1)
PBD0.50(A1, B1, C1)0.41(A1, B1, C1)1.95(A − 1, B1, C − 1)
BT0.69(A1, B1, C1)0.67(A1, B − 1, C1)8.78(A − 1, B1, C1)
HBT0.51(A1, B1, C1)0.45(A1, B1, C1)3.94(A1, B − 1, C − 1)
Note: D = 200 mm, HL = 280 mm, speed = 80 rpm, total solids = 5%.
Publisher’s Note: MDPI stays neutral with regard to jurisdictional claims in published maps and institutional affiliations.

