Article

Experimental and Model Analysis of the Thermal and Electrical Phenomenon of Arc Faults on the Electrode Pole of Lithium-Ion Batteries

1
School of Electrical & Electronic Engineering, Harbin University of Science and Technology, Harbin 150080, China
2
School of Vehicle and Mobility, Tsinghua University, Beijing 100084, China
3
School of Electrical Engineering, Hebei University of Technology, Tianjin 300401, China
*
Authors to whom correspondence should be addressed.
Batteries 2024, 10(4), 127; https://doi.org/10.3390/batteries10040127
Submission received: 9 February 2024 / Revised: 25 March 2024 / Accepted: 5 April 2024 / Published: 9 April 2024

Abstract

:
Aiming at the electrical safety problem of a high-voltage lithium-ion battery system caused by an arc, and based on the establishment of a battery arc fault experimental platform, the evolution law of safety caused by an arc in the negative terminal of a battery system under different working conditions is discussed. On this basis, a battery arc evolution model based on magnetohydrodynamics is established to analyze the arc’s electro-thermal coupling characteristics to further obtain the distribution of the arc’s multi-physical field. The results show that the arc generated by the high-voltage grade battery pack will break down the cell’s shell and form a hole, resulting in electrolyte leakage. When the loop current is 10 A, the evolution law of arc voltage and current is basically the same under different supply voltages, charges, and discharges. The accuracy of the battery arc simulation model is verified by comparing the simulation with the experimental results. The research in this paper provides a theoretical basis for the electrical safety design of lithium-ion batteries caused by the arc, fills the gaps in the field of battery system arc simulation, and is of great significance for improving the safety performance of arc protection.

1. Introduction

Lithium-ion batteries are crucial for smoothing out the intermittency of renewable energy generation due to their high energy density, serving as vital electrochemical energy storage devices [1,2,3]. However, safety concerns related to lithium-ion batteries used in energy storage applications are not uncommon, especially in high-voltage energy storage systems where numerous battery cells and modules are interconnected via series and parallel connections [4,5,6]. During the cyclic use of battery systems, the aging-related expansion or mechanical stress of batteries can lead to issues such as the loosening or breakage of solder joints at the connections between batteries, potentially resulting in arc formation [7,8]. In extreme cases, high-voltage arcs sustain discharge, resulting in temperatures within the arc exceeding 6000 K [9,10]. Therefore, the intense energy impact accompanying the evolution of the arc can lead to severe electrochemical corrosion issues on battery poles and connecting tabs. This poses a significant threat to the battery’s lifespan and to the safe and stable operation of the battery system, with potential risks of thermal runaway and fire hazards [11,12,13].
Currently, research on battery system arcs primarily involves extracting arc characteristic information (arc sound, arc light, voltage, current, etc.) from arc data and then proposing reasonable arc detection methods. This method of arc fault detection, which relies on historical arc data, exhibits a detection delay that trails the occurrence of the arc. Within this detection interval, the arc may have already compromised the routine operation of the battery system [14,15]. Therefore, early-stage research on battery system arcs has only focused on the mechanism detection of arcs, neglecting the impact of arcs on the safety performance of the battery system.
Due to the formation of arcs involving multiple interdisciplinary fields such as electromagnetics, heat transfer, fluid dynamics, and plasma physics, it constitutes a highly complex multi-physics coupling process [16]. In arc simulation studies, the relevant literature primarily focuses on alternating current arcs [17,18], direct current arcs [19,20], arc furnaces [21], and neural network models of fault arcs [22]. Huang et al., based on the magnetohydrodynamics theory, established a three-dimensional arc model coupled with an inductive load circuit. They observed a notable movement phenomenon at the root of the arc and deduced the impact of the contact separation speed and magnetic field on the behavior of the arc plasma [23]. Cao et al. investigated the motion of arcs under different external magnetic fields, varying silver vapor concentrations, and the addition of longitudinal insulating grates. They obtained the arc root movement curves [24]. Jiang et al. established a simulation model for medium-frequency vacuum arcs under a longitudinal magnetic field and analyzed the reignition phenomenon of the arc [25]. Rong et al. established a three-dimensional magnetohydrodynamic model of air arc plasma, considering the coupling effects of the airflow, temperature, electromagnetic field, and radiation. They analyzed the distribution of the temperature, pressure, and arc voltage in the arc zone. Wu et al. established a steady-state numerical model of direct current fault arc heat transfer based on magnetohydrodynamics. They revealed the changing patterns of the maximum arc temperature and the heat transfer rules of the arc heat source on the internal temperature of the electrode [26]. Qin et al. investigated the temperature field variations of direct current arcs under different minimum gap distances and electrode materials [27]. Huang et al. demonstrated that during the direct current interruption process, the ion pressure, ion density, and ion temperature decrease with the reduction of the arc current, while the ion velocity gradually increases [28]. In summary, these studies have analyzed the motion characteristics and temperature of the arc, but few in-depth studies have been conducted for the simulation modeling of the arc in the battery system, and little is known about the effects of arc faults on the battery system.
Therefore, to investigate the changes in the safety performance of high-voltage energy storage battery systems caused by arcs, this study, based on the construction of a simulated battery arc fault experimental platform, conducted battery arc experiments under charging and discharging conditions with different power supply voltages. The aim was to analyze the electrothermal characteristics and hazard features of the arc. At the same time, a numerical model of the battery arc was constructed to simulate the multi-physics coupling characteristics of the arc.

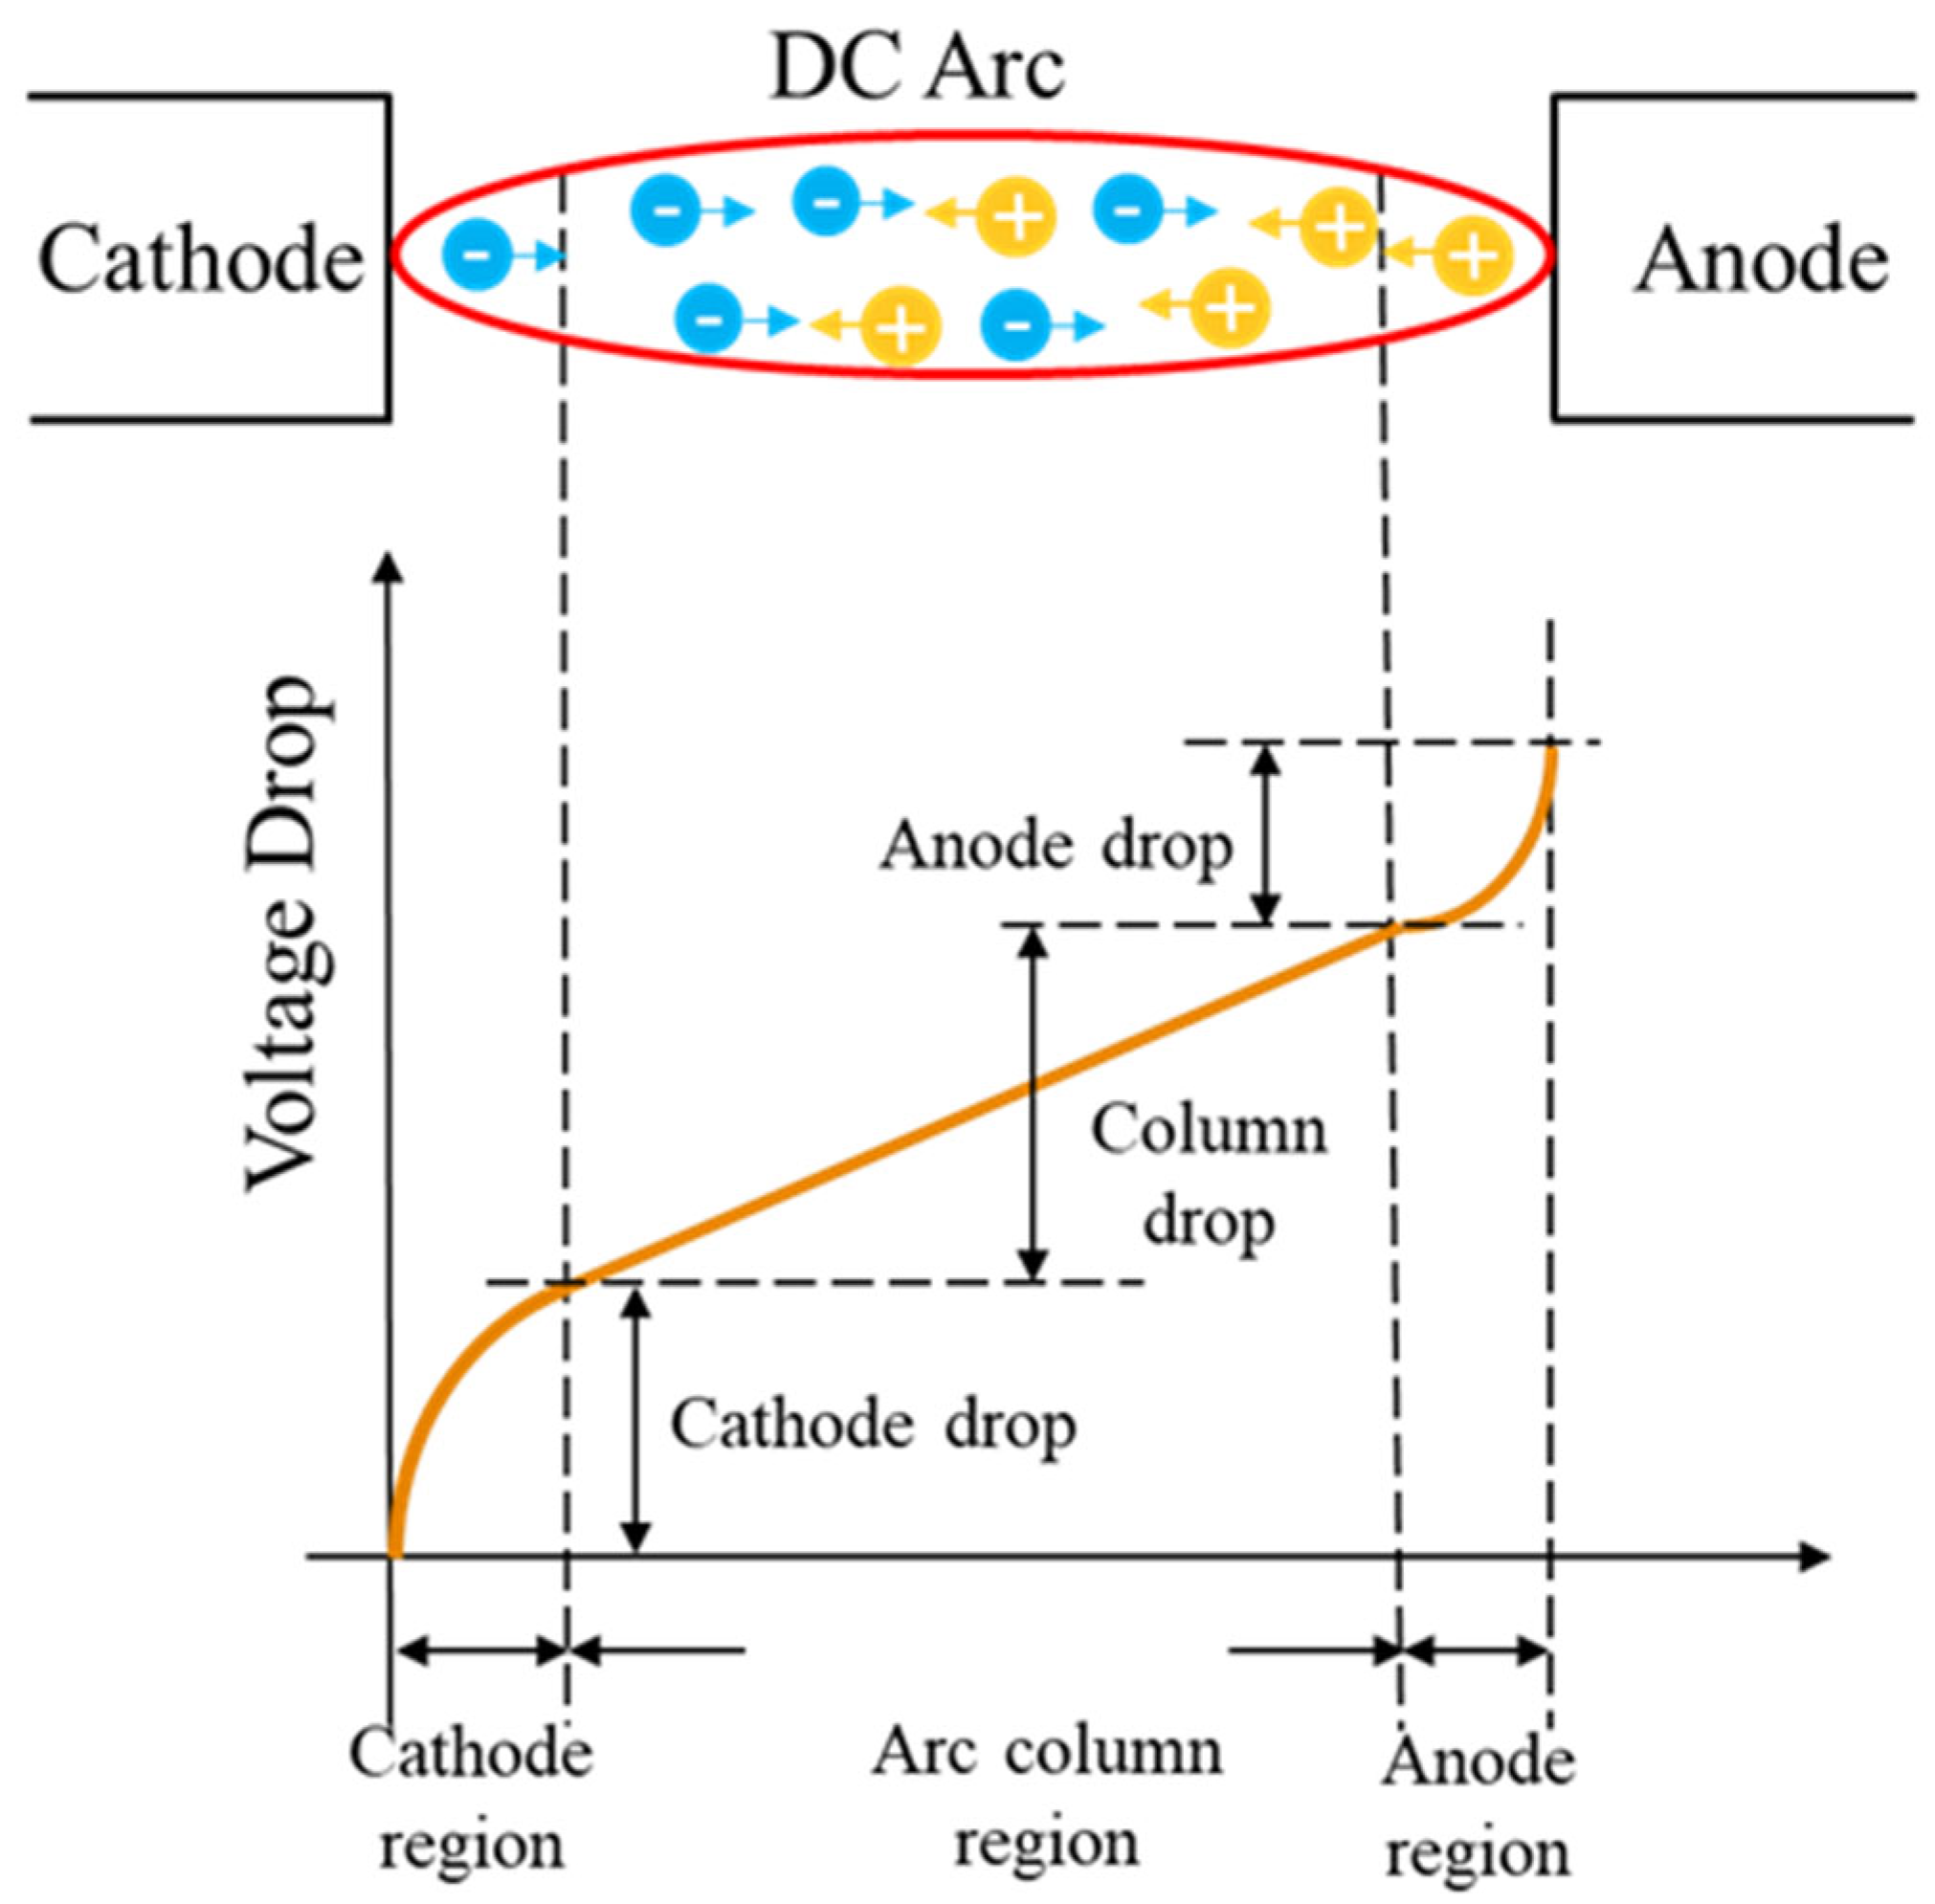
2. The Mechanism of Arc Generation in High-Voltage Lithium-Ion Battery Systems

An arc is a phenomenon of gas discharge. When there is a sufficiently high electric field strength between two electrodes, the free electrons between the electrodes begin to move. Through collisions with neutral molecules or atoms in the air, energy exchange occurs, causing them to ionize and release more charged particles, further enhancing the electric field strength. Under the continued influence of the electric field, electrons collide with the anode, while positive ions collide with the cathode. If the energy of the positive charge can liberate new electrons from the cathode and emit intense glow, an arc is formed [29,30].
The direct current arc can be divided into three parts: the cathode region, the arc column region, and the anode region [31], as shown in Figure 1. In typical situations, the cathode region and the anode region, collectively referred to as the arc column region, complete the transition from a solid with constant electrical conductivity to a gas with variable electrical conductivity. This region has a relatively short length, typically ranging from 0.02 to 0.1 mm. The cathode process is crucial to the generation of the arc, where electron emission from the cathode leads to the accumulation of positive charges. A high electric field strength is a necessary condition for arc generation. The influence of the anode on the arc process is relatively small; it receives electrons from the arc column, but the electrons often cannot fill the entire space of the anode region, resulting in a decrease in the electric field strength compared to the cathode region [30]. The arc column region, located between the cathode and anode regions, is a collectively electrically neutral high-temperature plasma, approximately cylindrical in shape. The voltage of the arc column region increases with the lengthening of the arc [32]. The electric field strength in the arc column region is influenced by the electrode materials, gas type, and current magnitude, but overall, it exhibits a uniform distribution and is lower than the electric field strength in the arc column region [33].

3. Computational Model of Arc Generation and Results Analysis

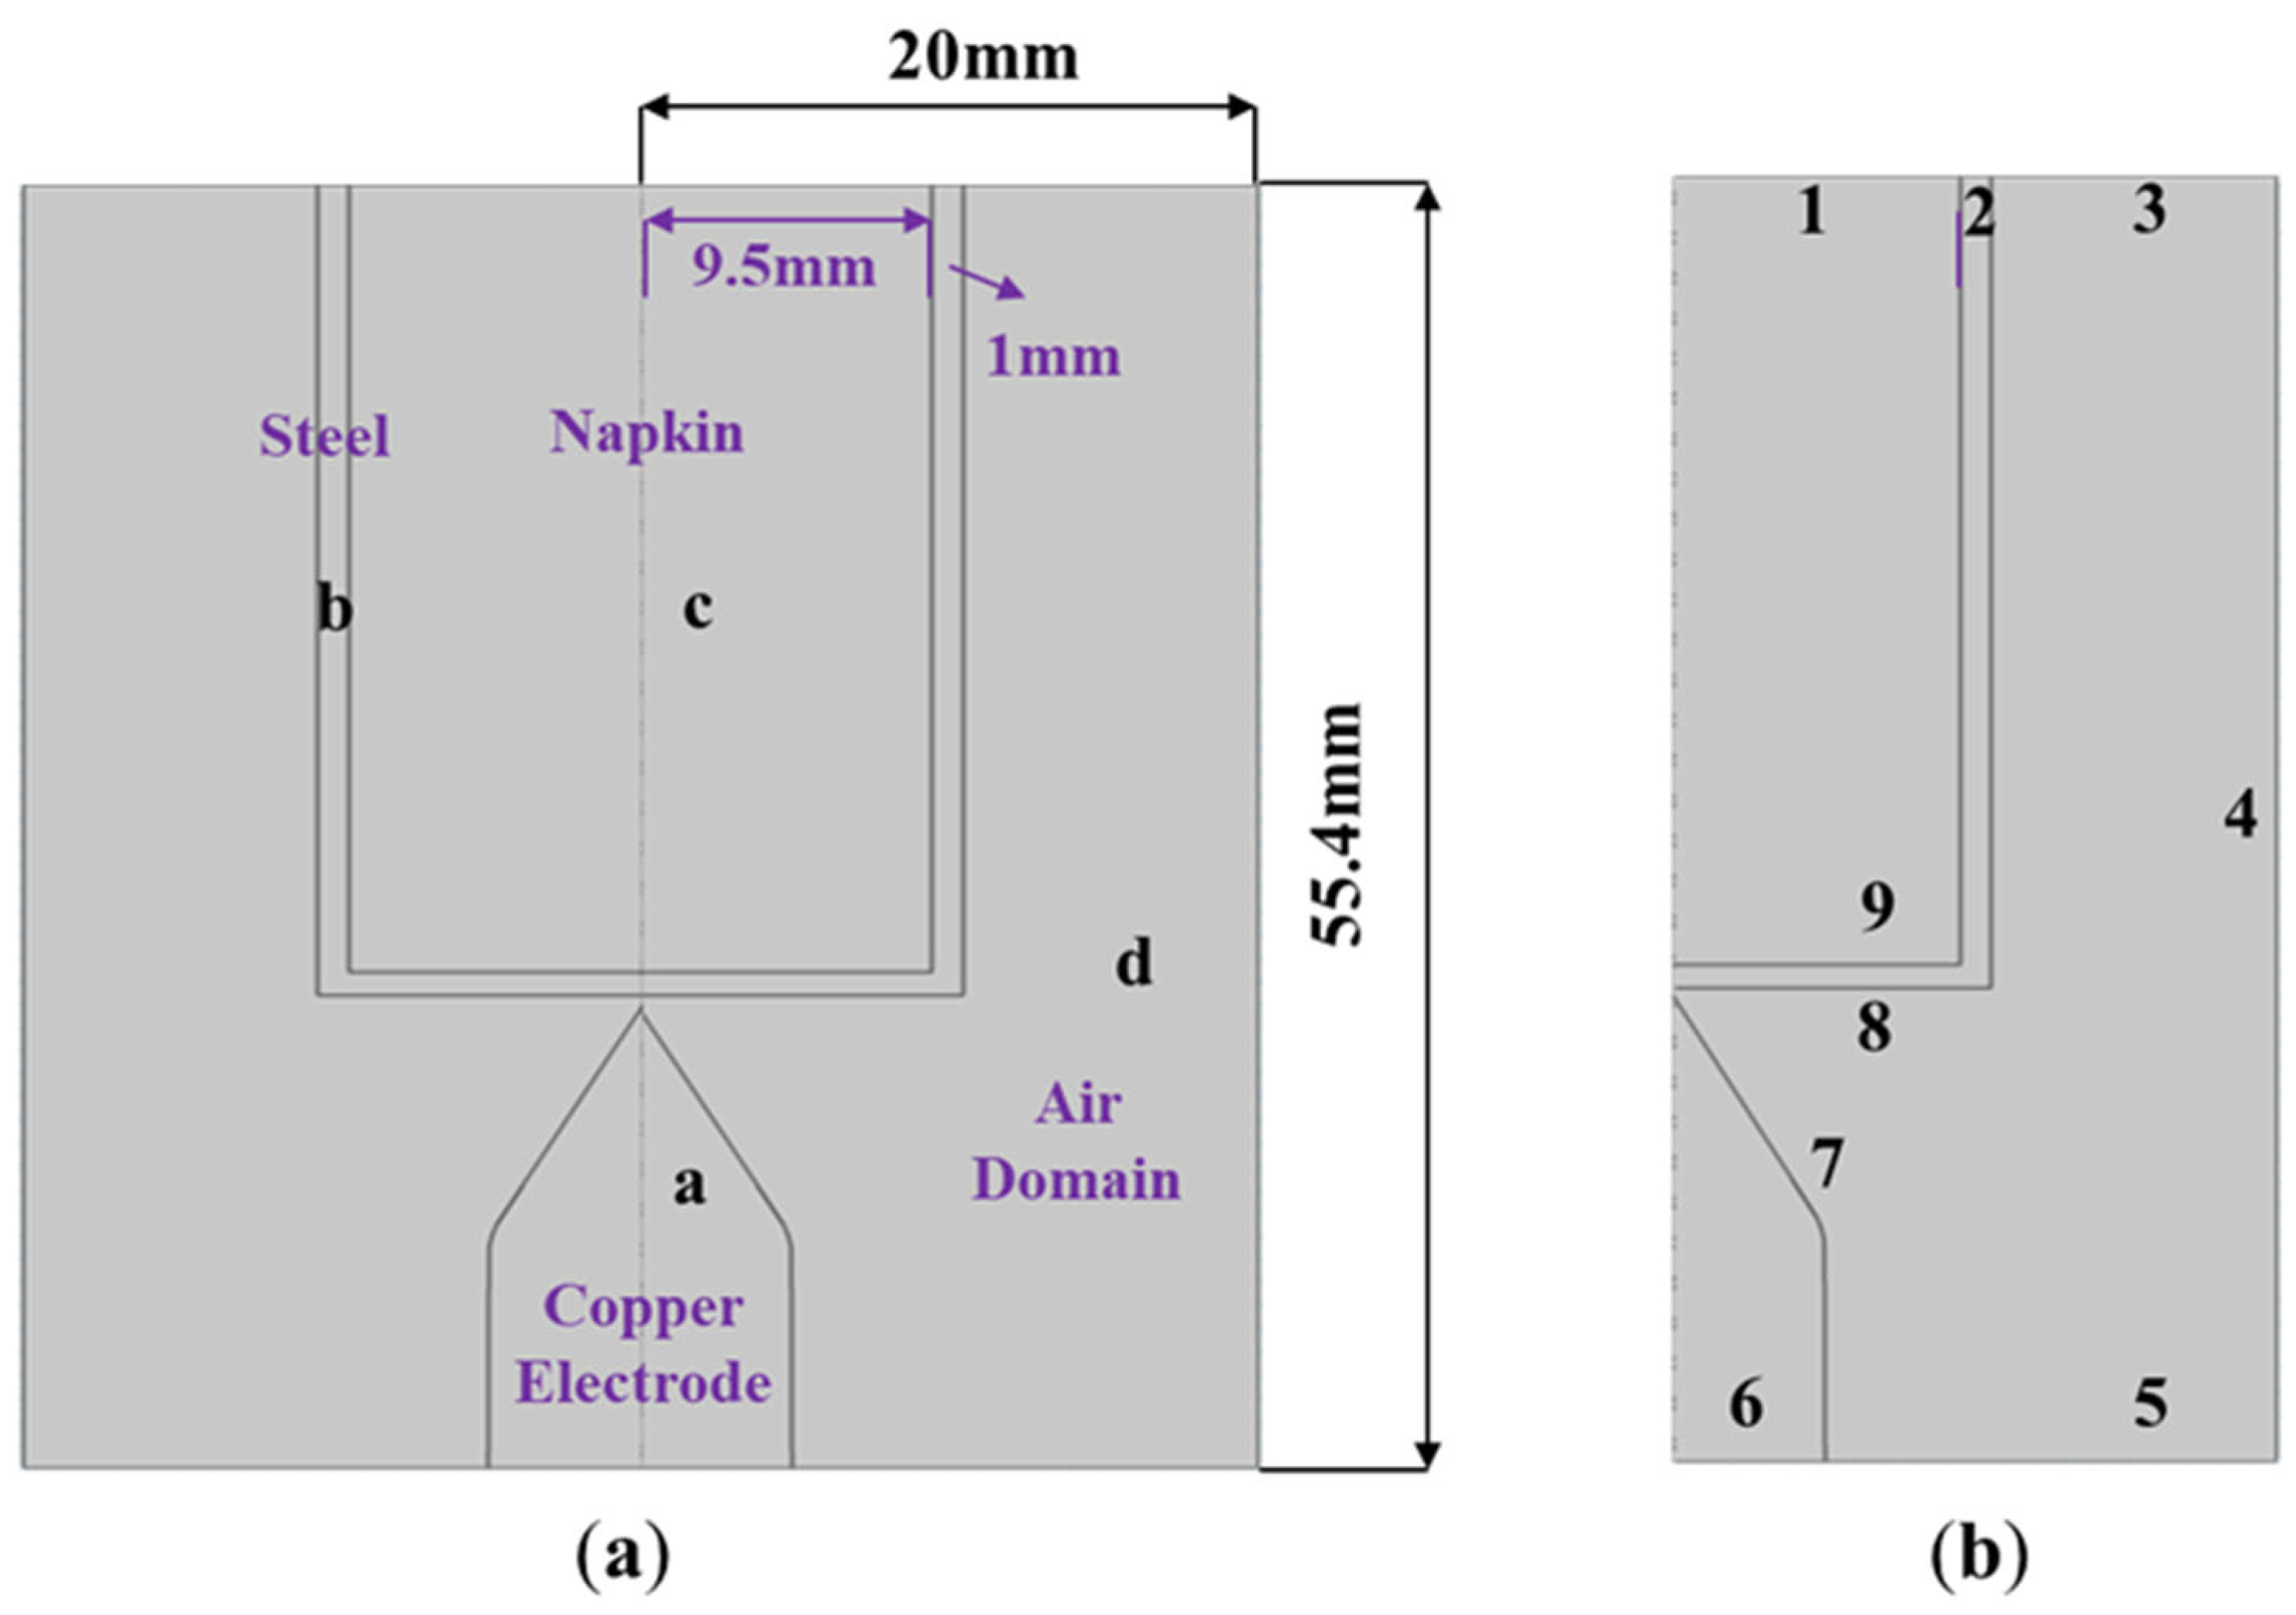
3.1. Geometric Model and Assumption Conditions

Based on the assumption that the arc plasma is axially symmetric, we established a two-dimensional axisymmetric arc model in this study, as illustrated in Figure 2. The computational domain is a rectangle with the dimensions of 55.4 mm in length and 20 mm in width. In the model, ‘a’ represents a copper electrode with a pointed end and a radius of 5 mm, ‘b’ denotes the 1 mm thick steel shell of a 21,700 cylindrical battery, ‘c’ is a custom material representing the battery’s core, and ‘d’ signifies the region outside the electrode and battery, representing the surrounding air. The individual physical property parameters of the materials in the numerical model are shown in Table 1.
To ensure better convergence in the numerical model calculations and reduce the complexity of the simulations, some ideal assumptions are introduced during the construction of the numerical model:
(1)
The initiation process of the arc is not considered.
(2)
It is assumed that the solved arc plasma is in a state of equilibrium, satisfying the local thermodynamic equilibrium.
(3)
The plasma density, electrical conductivity, thermal conductivity, specific heat at constant pressure, and dynamic viscosity are dependent solely on the temperature.
(4)
The impact of the arc on the contact erosion and the sheath layer near the electrode is neglected.
(5)
The arc plasma is assumed to be a stable, non-rotational, and incompressible ideal fluid.

3.2. Control Equations

Based on the above assumptions, the arc in freely stable combustion in air can be described by the magnetohydrodynamics (MHD) equations. The plasma of the arc involves a complex interaction of electric, magnetic, and flow fields. Therefore, simulating the arc involves computations of the flow, magnetic, and electric fields, with strong coupling between the equations [26,34]. As we assume the plasma of the arc to exhibit two-dimensional axisymmetric flow in this simulation, its control equations can be expressed as:
(1)
Equation for energy conservation:
𝜕 ( ρ c p T ) 𝜕 t + 1 r 𝜕 𝜕 r ( r ρ h v r ) + 𝜕 𝜕 z ( ρ h v z ) = j r 2 + j z 2 σ + Q rad + 1 r 𝜕 𝜕 r ( r k c p 𝜕 h 𝜕 r ) + 𝜕 𝜕 z ( k c p 𝜕 h 𝜕 z ) 5 2 k B e ( j r 𝜕 T 𝜕 r + j z δ T δ z )
In Equation (1), ρ is the density; cp is the specific heat at constant pressure; T is the temperature; h is the surface heat transfer coefficient; υr is the radial velocity; υz is the axial velocity; jr is the radial current density; jz is the axial current density; σ is the electrical conductivity; Qrad is the overall volume radiation coefficient; k is the thermal conductivity; kB is the Boltzmann constant; and e is the elementary charge.
(2)
Radial momentum conservation equation:
𝜕 ( ρ v r ) 𝜕 t + 1 r 𝜕 𝜕 r ( r ρ v r 2 ) + 𝜕 𝜕 z ( ρ v r v z ) = 𝜕 P 𝜕 r j z B θ + 1 r 𝜕 𝜕 r ( 2 r η 𝜕 v r 𝜕 r ) + 𝜕 𝜕 z [ η ( 𝜕 v r 𝜕 z + 𝜕 v z 𝜕 r ) ] 2 η v r r 2
(3)
Axial momentum conservation equation:
𝜕 ( ρ v z ) 𝜕 t + 1 r 𝜕 𝜕 r ( r ρ v r v z ) + 𝜕 𝜕 z ( ρ v z 2 ) = 𝜕 P 𝜕 z + j r B θ + 𝜕 𝜕 z ( 2 η 𝜕 v r 𝜕 z ) + 1 r 𝜕 𝜕 r [ r η 𝜕 v r 𝜕 z + 𝜕 v z 𝜕 r ]
(4)
Mass conservation equation:
𝜕 ρ 𝜕 t + 1 r 𝜕 𝜕 r ( r ρ v r ) + 𝜕 𝜕 z ( ρ v z ) = 0
In Equation (4), P is the plasma pressure; jrBθ and jzBθ are the Lorentz forces; and η is the dynamic viscosity coefficient.
(5)
Current continuity equation:
1 r 𝜕 𝜕 r ( r σ 𝜕 U 𝜕 r ) + 𝜕 𝜕 z ( σ 𝜕 U 𝜕 z ) = 0
In Equation (5), U is the potential.
(6)
Maxwell’s equations:
1 r 𝜕 𝜕 r ( r B θ ) = μ 0 j z
In Equation (6), μ0 is the vacuum permeability.
(7)
Ohm’s law:
j r = σ 𝜕 U 𝜕 r , j z = σ 𝜕 U 𝜕 z
By utilizing the physical field control equations, the temperature field, velocity field, electric field, and magnetic field of the arc plasma can be solved. The calculation results are influenced by the model’s material parameters (electrical conductivity, density, thermal conductivity, overall volume radiation coefficient, specific heat at constant pressure, dynamic viscosity coefficient) and the selection of boundary conditions.

3.3. Boundary Conditions

According to the MHD model, the boundaries of four modules, the electric field, magnetic field, flow field, and thermal field, are set, and the numbers 1, 2, 8, and 9 are the boundaries of the battery; 3, 4, and 5 are the air domain boundaries; and 6 and 7 are the boundaries of the copper electrodes, as shown in Figure 2b. In the electric field, the entire computational domain follows the law of current conservation, with boundary 6 as the terminal coupled with the circuit module, providing it with a high potential. A voltage source and resistor are added to the circuit module to simulate a series circuit. Boundary 2 is grounded, and the other boundaries are set as electrically insulated. In the magnetic field, three-component vectors are chosen for the solved field components, with the inclusion of a fixed A-field gauge to improve the model convergence. The boundary conditions are set to be magnetically insulating. In solid and fluid heat transfer, the electrode and battery are treated as solids, and the air is treated as a fluid. Boundaries 1, 2, and 6 are set as heat fluxes with a heat flux coefficient of 15 W/m2, while the initial value temperatures of boundaries 1, 2, and 6 are set to 300 K. Boundaries 3, 4, and 5 are outlets, and 7 and 8 are boundary heat sources. Boundaries 7 and 8 represent the interface between air and the electrode/battery, set as coupled boundary conditions with an initial temperature of 300 K. For the laminar flow field, an incompressible flow is selected, with boundaries 3, 4, and 5 as outlets, and boundaries 7 and 8 set as walls. The initial air pressure is set to standard atmospheric pressure (1.01325 × 10⁵ Pa).

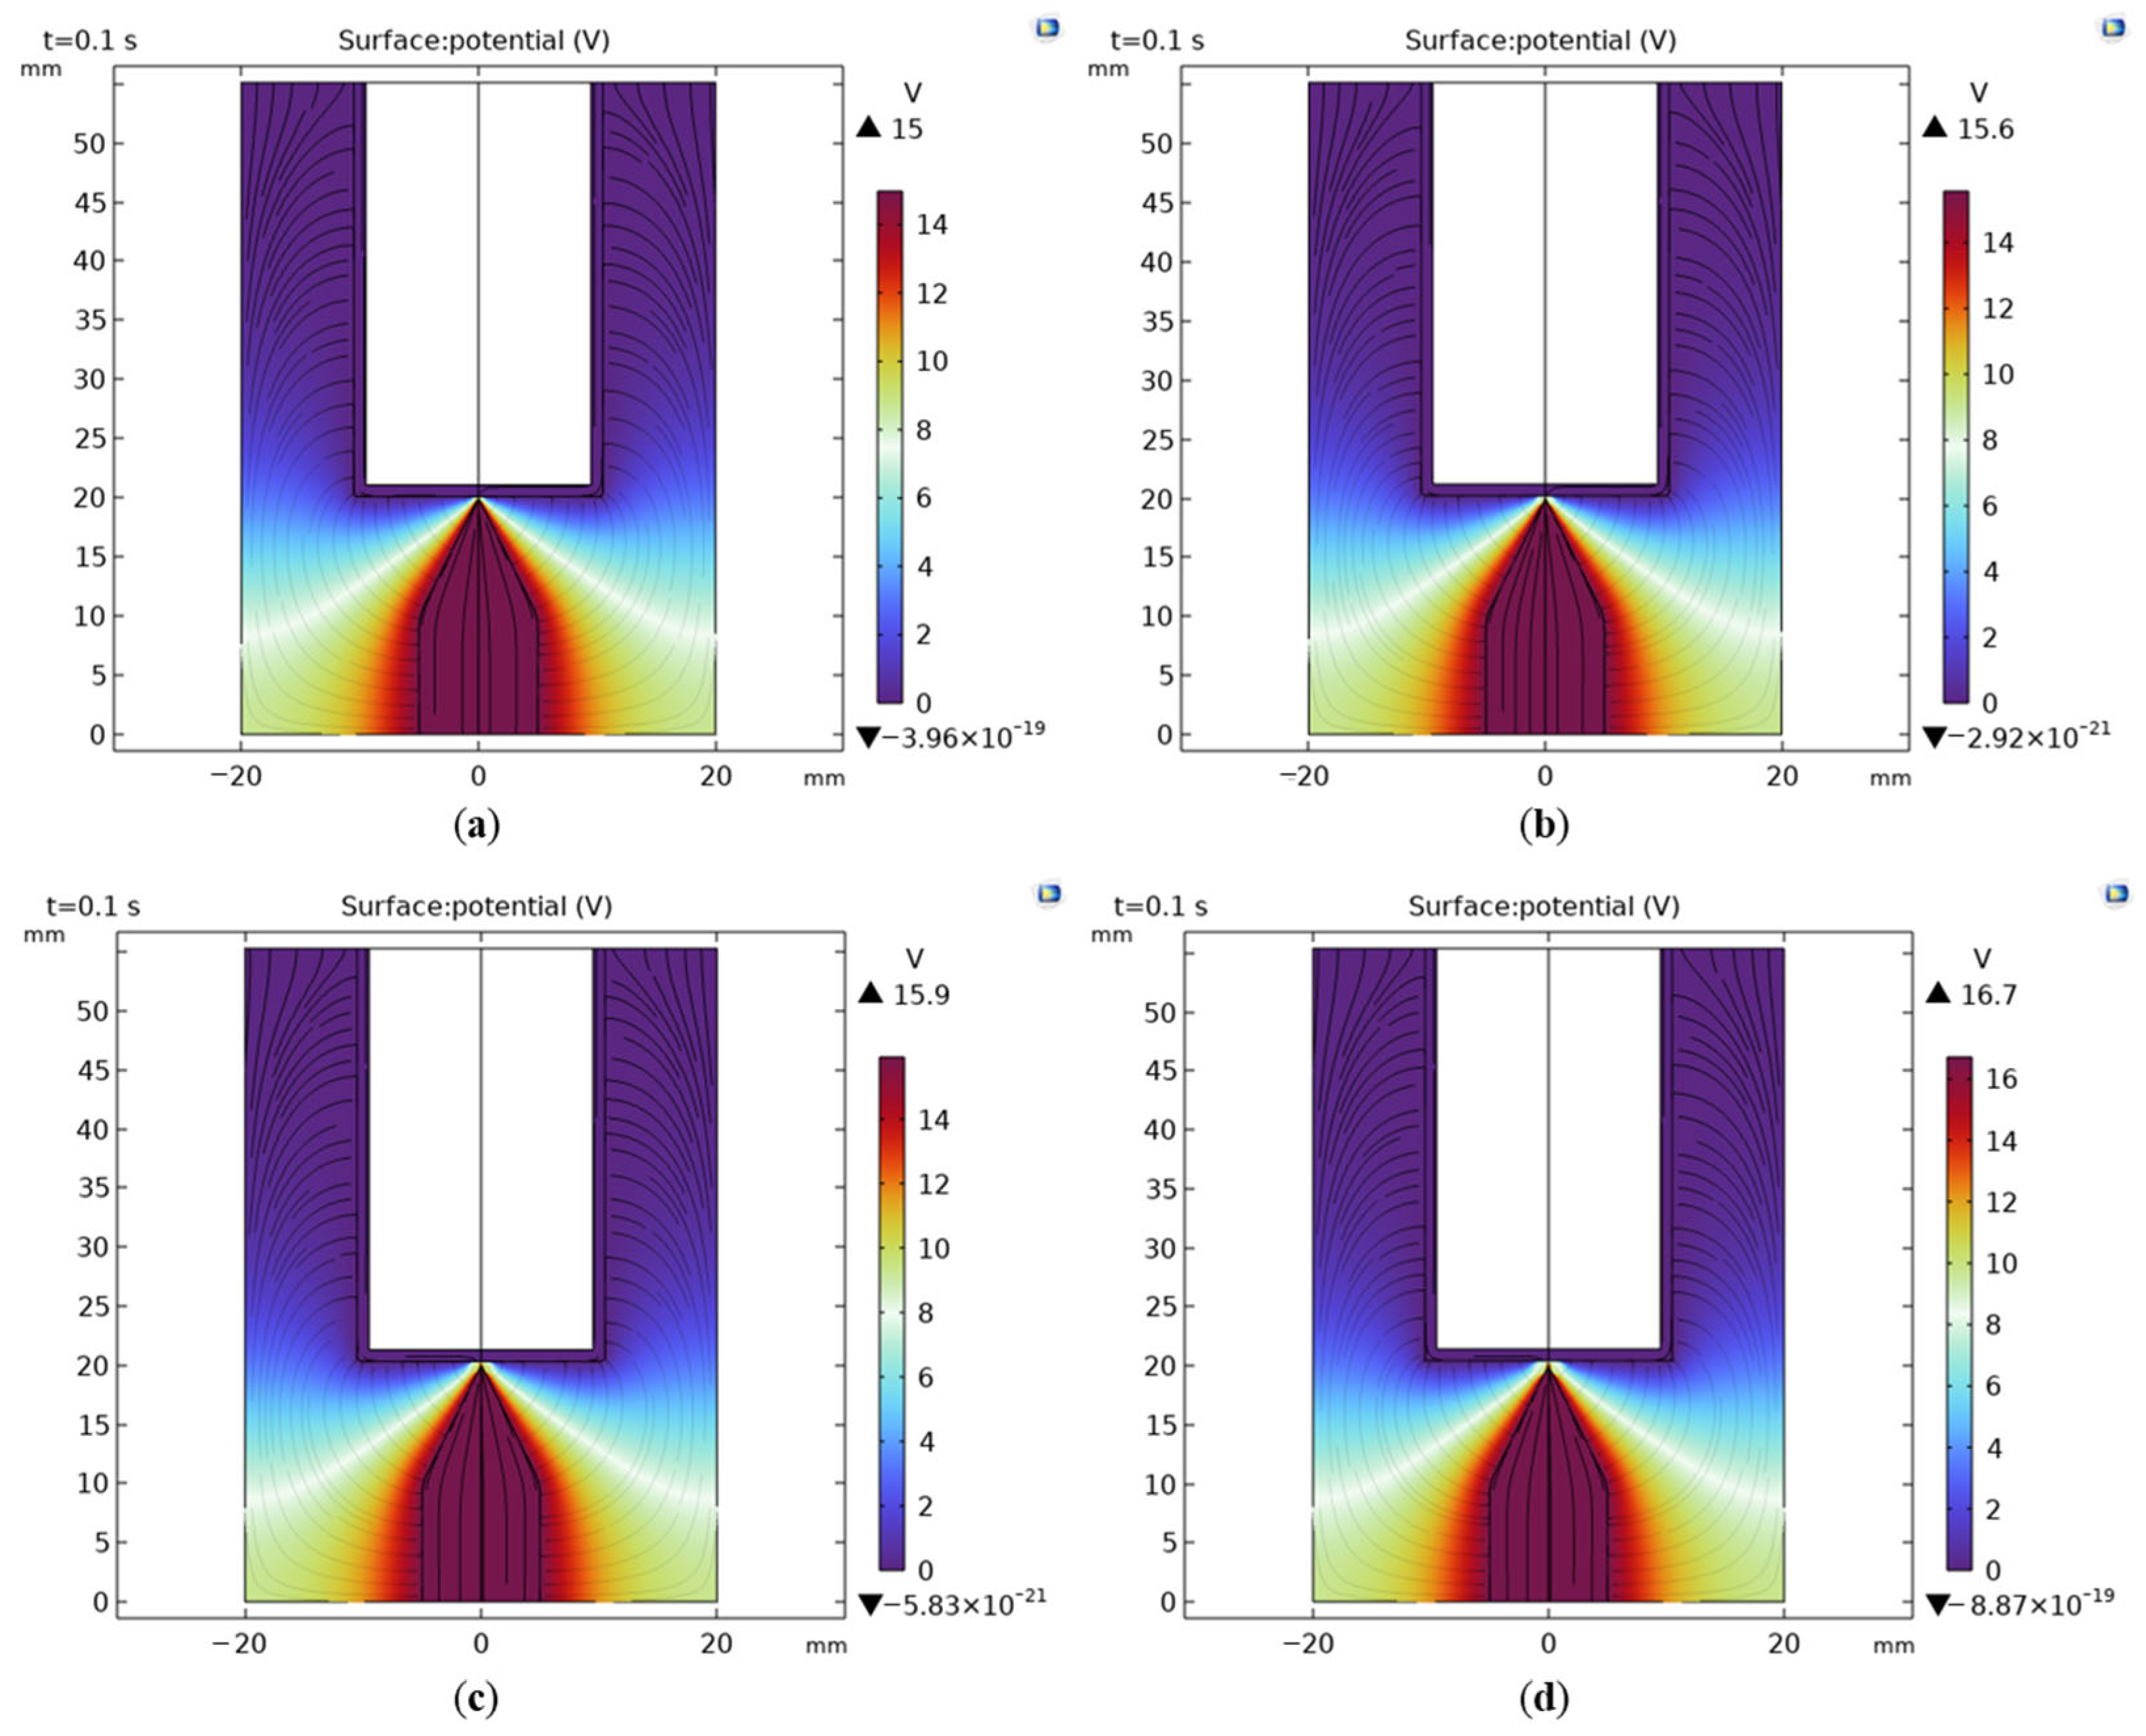
3.4. Analysis of Simulation Results

When the power supply voltage is 200 V and the circuit current is 10 A, the simulated arc voltage for gap sizes of 0.1 mm, 0.2 mm, 0.3 mm, and 0.4 mm is shown in Figure 3. For gap sizes of 0.1 mm, 0.2 mm, 0.3 mm, and 0.4 mm, the arc voltages at both ends are 15 V, 15.6 V, 15.9 V, and 16.7 V, respectively. With the increase in the gap size, the arc voltage at both ends also increases. Fitting the data reveals that the fitted curve for the arc voltage and distance satisfies: y = 5.4x + 14.45, with an R2 value of 0.958, as shown in Figure 4.
Under the condition of 200 V + 10 A, the simulation results of the electric field, temperature field, magnetic field, and flow field are shown in Figure 5. In Figure 5a, the maximum value of the electric field is 1.46 × 10⁵ V/m. The right figure is an enlarged view of the electric field in the arc initiation region. It can be observed that the maximum electric field intensity is near the cathode. The cathode process is crucial for arc generation, as the emission of electrons from the cathode leads to the accumulation of positive charges, and a high electric field intensity is a necessary condition for arc generation. The influence of the anode on the arc process is relatively small. It accepts electrons from the arc column, and the electric field intensity is relatively reduced compared to the cathode area. The electric field intensity in the arc column region generally exhibits a uniform distribution and is lower than the electric field intensity in the cathode region. In Figure 5b, the maximum temperature of the arc is 16,043 K, and the highest temperature in the system is located at the center of the electrode gap. The temperature of the arc decreases in an arc shape toward the surroundings. Some heat is transferred to the surface of the copper electrode and the battery through thermal conduction, while the remaining majority of the heat is dissipated into the air, maintaining a higher temperature in the surrounding air area. In Figure 5c, the maximum magnetic flux density is 0.01 T at the tip of the copper electrode. In Figure 5d, the maximum flow velocity is 5.57 m/s, located at the center of the electrode gap.

4. Experimental Results and Analysis

4.1. Experimental Platform Setup

In order to investigate the generation of arcs in battery systems and their impact on battery safety performance, we established an experimental platform simulating arc occurrence. As shown in Figure 6, the main circuit section, depicted in Figure 6a, comprises an adjustable DC power supply, Hall current sensor, arc generator, electronic load, high-speed data acquisition instrument, voltage probe, thermocouple, high-speed camera, and stroke control module. Within this setup, the DC power supply, Hall current sensor, arc generator, and electronic load are connected in series to form a circuit. To ensure the safety of the experiment, a variable DC power supply is used instead of an energy storage battery pack. The DC power supply can provide a maximum variable DC voltage of 1500 V, with an output voltage error within 0.2%. The adjustable load is used to regulate the current magnitude in the main circuit and protect the circuit’s safety, with an error within 0.2%. A Hall effect current sensor is employed to measure the changes in current in the circuit, with a maximum of 25 A and an error within 0.8%. The arc voltage (Uarc), circuit current (Idc), temperature, and other parameters are recorded by an online high-speed data acquisition system, with a maximum sampling rate of 10 MS/s. A high-speed camera with a maximum frame rate of 10.00 frames/s is employed to observe the evolution of the arc behavior from the main view direction.
In the experimental platform designed in this study, the arc generator is mainly composed of a base, insulation clamp, insulation bracket, movable slider, and stepper motor, as shown in Figure 6b. The discharge arc is generated by energizing the electrode tip of the arc generator, which is in full contact with the battery. Good contact before arc generation is crucial; if there is a gap between the electrode and the battery, the circuit cannot close, preventing the formation of an arc. One end of the arc generator is fixed to the cylindrical battery through an insulation clamp, while the other end secures the electrode tip to the movable slider. The movable slider is controlled by a stepper motor, creating a gap between the electrode tip and the battery. When the conditions for arc generation are met, the air gap between the electrode and the battery will be broken through, resulting in arc discharge. The microcontroller can adjust the speed of the stepper motor to control the movement of the electrode and the distance between the electrode and the battery.
In this study, we selected Panasonic’s 21,700 cylindrical battery as the subject of investigation, and the relevant parameters are shown in Table 2.

4.2. Experimental Plan Formulation

This study designs experiments to simulate the arc fault issue caused by the loosening or breaking of battery connection tabs, aiming to explore the evolution and interactions between the battery and the arc. The positive terminal cover of the battery is selected as the location for arc initiation. Considering the factors influencing arc generation, the material of the connection tab on the negative terminal of the cylindrical battery is mainly copper. Therefore, copper is chosen as the material for the movable electrode. The movable electrode is cylindrical in shape, and one end of the electrode is polished into a pointed shape (conical), facilitating the generation of the arc. The operational steps for the experiment are as follows:
1.
Circuit Connection
Connect the various devices according to the main circuit shown in Figure 6a; ensure tight contact between the pointed end of the movable electrode and the negative terminal of the battery, maintaining continuity.
2.
Parameter Settings
(1)
Circuit Parameters: Power supply voltage Udc, electronic load R;
(2)
Arc Generator Parameters: Stepper motor moving speed v (minimum moving speed of the arc generator), separation gap L;
(3)
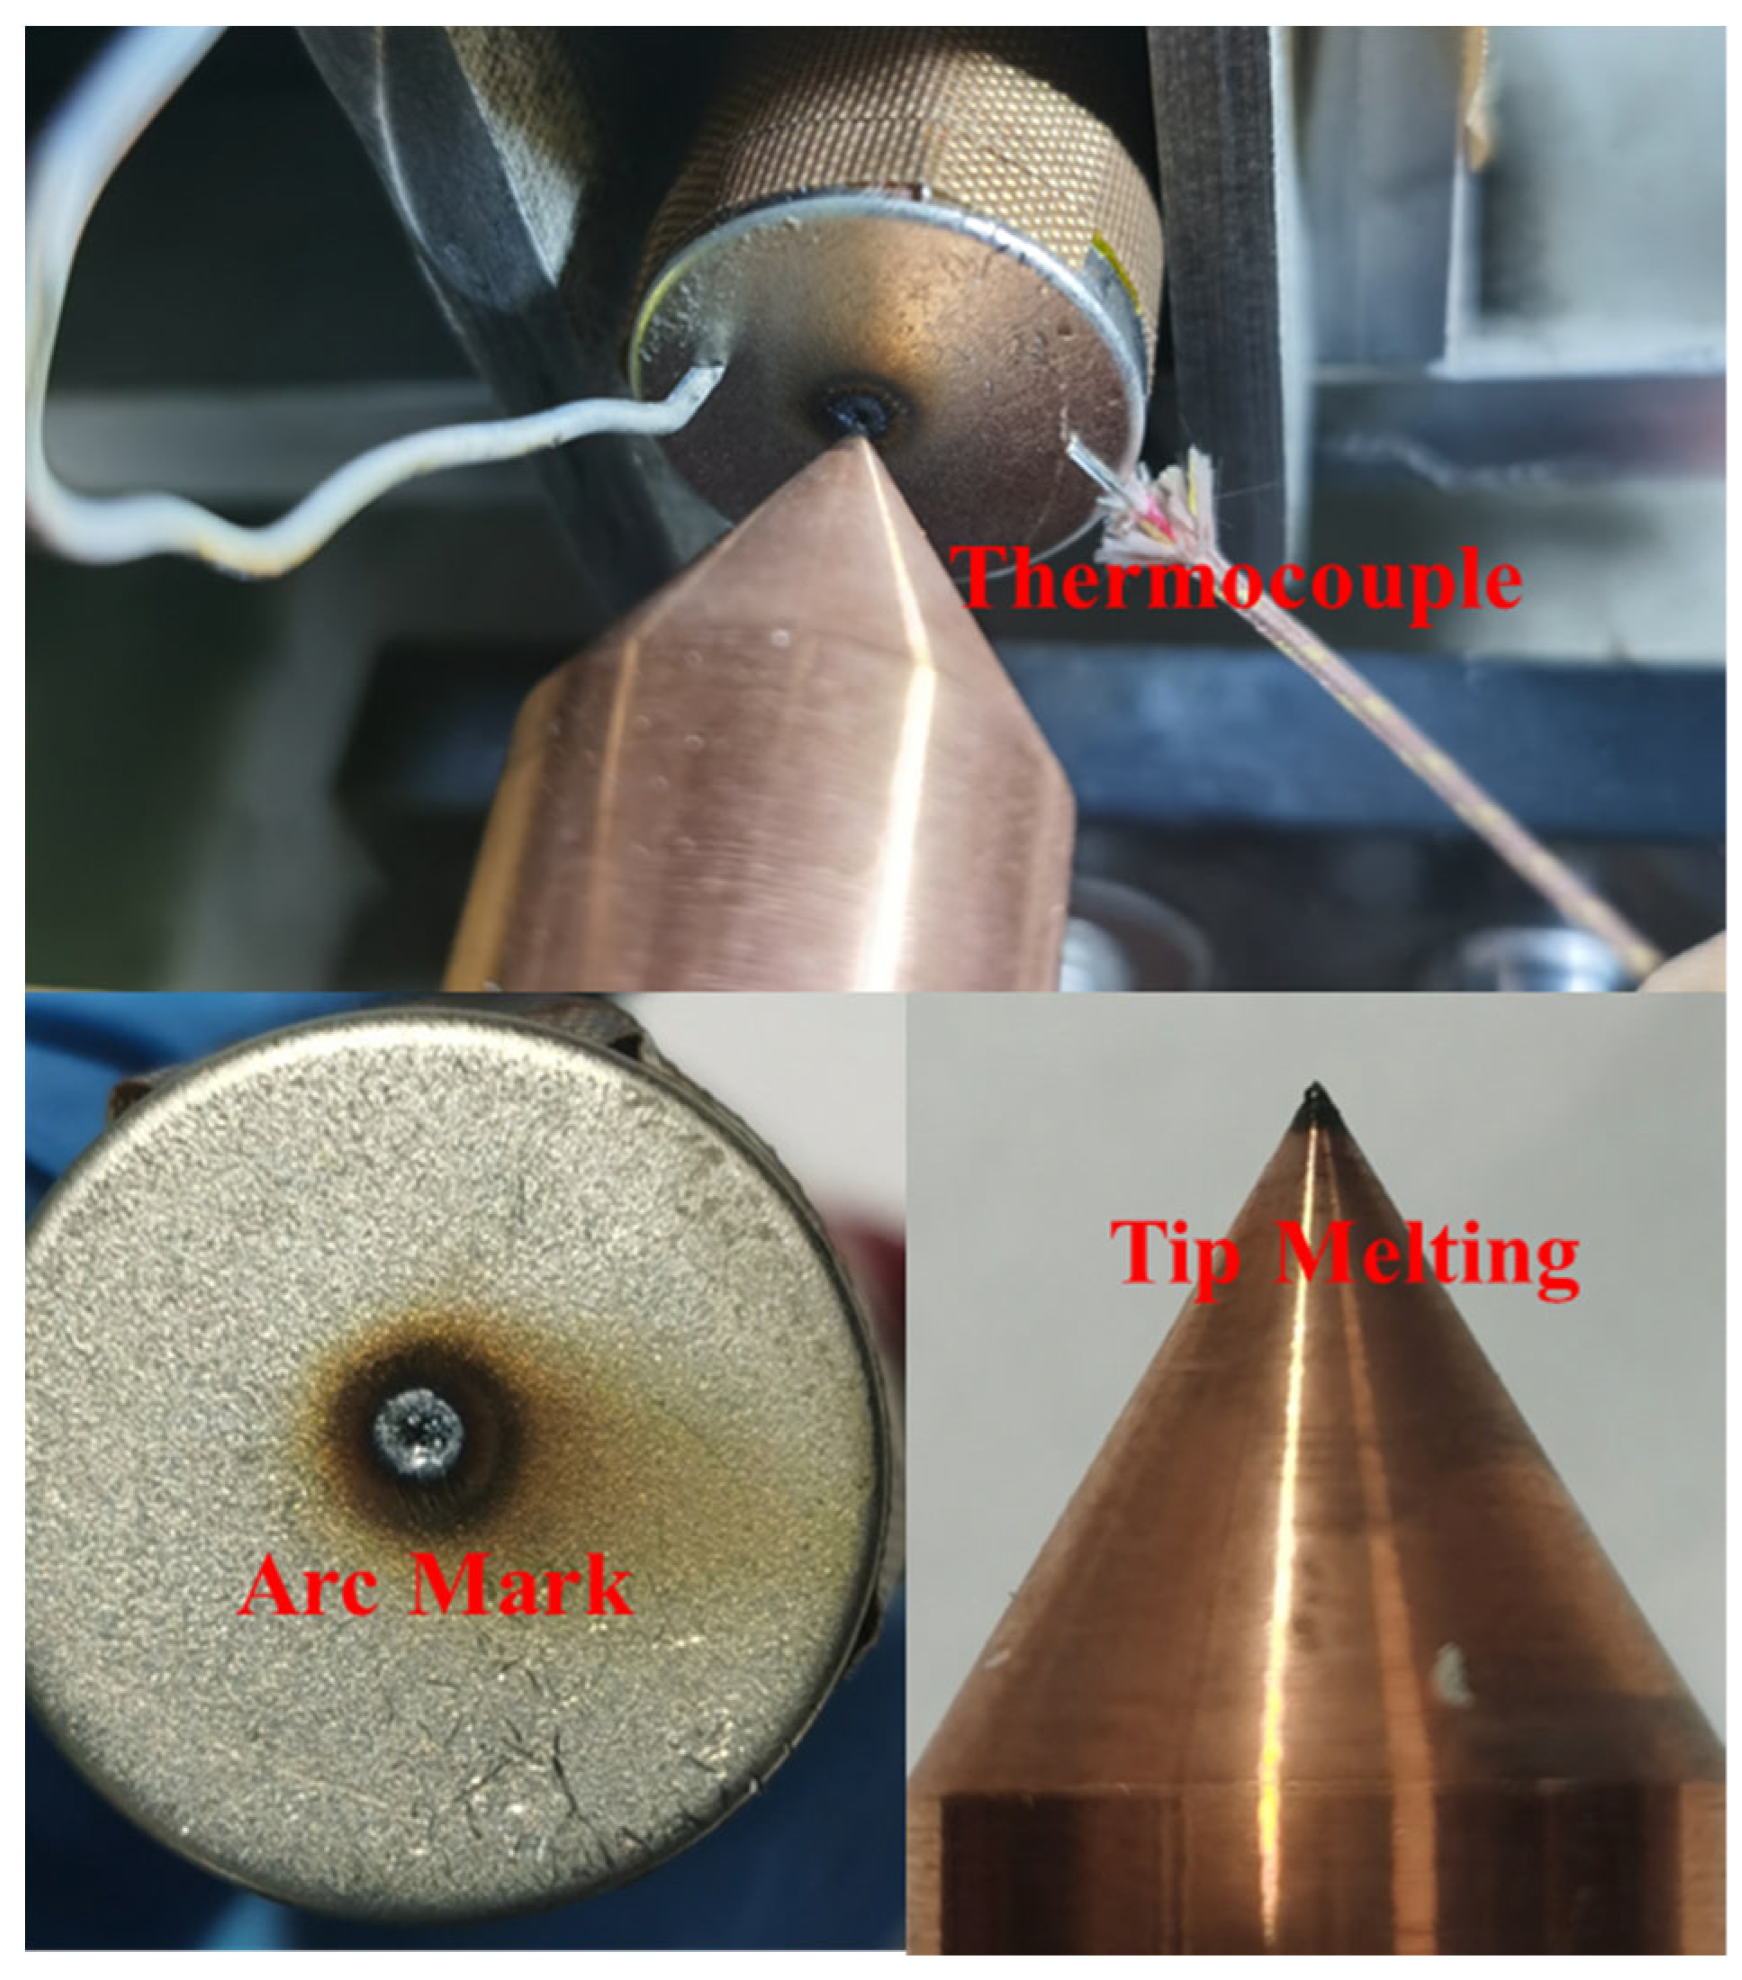
Detection Equipment Parameters: The high-speed camera captures the evolution of the arc process at a frame rate of 1000 frames/s; the sampling frequency of the high-speed data acquisition system is 1 kHz, recording the real-time voltage, current, and temperature data; thermocouples are arranged 6 mm away from the arc initiation point (to avoid damage due to high temperatures at the arc center) and used to approximate the temperature of the arc acting on the battery core. Table 3 shows the initial operational settings for the experiment.

4.3. Experimental Results Analysis

This study investigated the interaction patterns between batteries and arcs at different levels of power supply voltage and under the same voltage level during charging and discharging.

4.3.1. Charging Conditions

Figure 7 shows the waveform of the arc voltage, circuit current, and battery voltage during the arc occurrence and extinction when the power supply voltage is 200 V and the charging circuit current is 10 A (approximately 2 C). From the figure, it can be observed that when the arc fault does not occur, the copper electrode of the arc generator and the battery are closed, acting as a conductor, and the circuit current remains constant at 9.7 A, the arc voltage is 0 V, and the battery voltage is 4.0 V. Then, when the copper electrode moves backward at a speed of 0.153 mm/s, sparks are generated first. There are upward and downward spikes in the arc voltage waveform and the circuit current waveform, indicating an unstable discharge phase with a duration of approximately 1.2 s. With the increase in the gap, it enters the arc discharge phase, where a stable arc is generated, and the arc is equivalent to a dynamic resistor. The arc voltage jumps from 0 V to the arc starting voltage, approximately 15 V. Subsequently, the arc voltage slowly increases over time, reaching 18 V. During this phase, bright sparks can be observed, lasting for 1.6 s. As the gap continues to increase, the energy in the gap becomes insufficient to maintain the stable combustion of the arc, and the arc extinguishes. During the arc extinction process, there is an overvoltage generated. Subsequently, the arc voltage becomes the power supply voltage, and the circuit current becomes 0 A. Due to the circuit being open, the power supply voltage no longer charges the battery. After the arc extinguishes, there is a decline in the battery voltage, dropping from 4.0 V to 3.4 V.
After analyzing the trends of the arc voltage and charging circuit current with the distance under various conditions where the power supply voltage is 200 V and the charging circuit current is 10 A, it was observed that, within an acceptable margin of error, there exists a linear relationship between the arc voltage, charging circuit current, and distance. In this study, under the conditions of 200 V and 10 A, a set of experimental data was selected, and a data-fitting process was performed. Figure 8a represents the fitted curve for the arc voltage and distance, while Figure 8b illustrates the fitted curve for the charging circuit current and distance.
As shown in Figure 8a, the fitting curve for the arc voltage and separation distance satisfies the equation: y = 5.65x + 14.34. According to the root mean square error formula:
R M S E = i = 1 n ( X obs , i X model , i ) 2 n
where Xobs,i represents the actual data, Xmodel,i represents the fitted data, and n is the number of samples.
The root mean square error (RMSE) between the actual values and the fitted curve is 0.15 V for the fitted curve of the arc voltage and distance, as shown in Figure 8a. Similarly, for the fitted curve of the charging circuit current and distance, as illustrated in Figure 8b, the equation y = −0.28x + 9.26 is satisfied, and the RMSE between the actual values and the fitted curve is 0.05 A.
The waveform of the arc voltage and the temperature variation at the position 6 mm away from the arc initiation point on the surface of the battery negative electrode are shown in Figure 9. From the figure, it can be observed that the initial temperature of the battery surface is 25 °C. When the arc occurs, the temperature on the battery surface begins to rise, and with the continuous duration of the arc, the temperature on the surface of the battery’s negative electrode keeps increasing. The arc lasts for a total of 2.8 s, and the temperature at the position 6 mm away from the arc initiation point on the negative electrode surface reaches its peak temperature of 90.2 °C at 3.8 s. Since the thermocouple is positioned 6 mm away from the arc initiation point, there is a 1 s heat transfer process. In locations closer to the negative electrode surface, the temperature is higher. After the arc extinguishes, with no heat source, the temperature gradually decreases. The placement of the thermocouple and the phenomena on the battery’s negative electrode surface and the copper electrode tip after the arc are marked in Figure 10. After the arc action, there is a formation of holes on the surface of the battery’s negative electrode. The formation of these holes causes the arc to lose its anode, accelerating the arc-extinguishing process. There is a high-temperature burn mark at the tip of the copper electrode (the tip of the copper electrode is in a molten state, and the arc temperature reaches the melting point of copper).
Figure 11a,b depict the waveforms of the arc voltage, circuit current, and battery voltage, as well as the wreckage of the battery, at a charging current of 10 A and power supply voltages of 300 V and 400 V, respectively. From Figure 11, it can be observed that, at power supply voltages of 300 V and 400 V, the arc voltage is around 15 V, and the arcs last for approximately 2.2 s and 2.5 s, respectively. In comparison to the 200 V power supply condition, there is more pronounced oscillation in both the arc voltage and circuit current waveforms during the arc initiation and extinction phases. However, with the increase in the power supply voltage, the duration of the arcs decreases by 0.6 s and 0.3 s, respectively. After the arc, not only are there holes formed on the negative surface of the battery, but there is also electrolyte leakage. Since there are holes formed on the surface of the battery after the arc occurs, it indicates that the temperature of the arc acting on the surface of the battery is higher than the melting point of the steel on the surface of the battery (1500 °C), and the temperature of the arc itself is much higher than 1500 °C. With the increase in the power supply voltage, the burning of the copper electrode tip becomes more intense. At a power supply voltage of 400 V, there is the appearance of melted beads on the copper electrode.
Under the conditions of 300 V and 400 V with a 10 A charging current, any set of experimental data was chosen for data fitting, as shown in Figure 12. For the 300 V and 10 A conditions, the fitting curve for the arc voltage versus distance conforms to the equation y = 5.73x + 14.51, with an RMSE of 0.17 V, as depicted in Figure 12a. The fitted curve for the charging circuit current versus distance satisfies the equation y = −0.29x + 9.4, with an RMSE of 0.08 A, as illustrated in Figure 12b. In the scenario of 400 V and 10 A, the fitted curves for both the arc voltage versus distance (y = 5.72x + 14.61, RMSE = 0.18 V, as shown in Figure 12c) and the charging circuit current versus distance (y = −0.29x + 9.55), RMSE = 0.09 A, as shown in Figure 12d) are consistent. Therefore, in the charging condition and under different levels of power supply voltage, the arc voltage and charging circuit current exhibit a similar evolutionary pattern with the separation distance, demonstrating a linear relationship.
The arc voltage waveform and the temperature variation waveform at the distance of 6 mm from the occurrence point of the arc on the negative electrode surface are shown in Figure 13a,b. As seen in Figure 13a, the highest temperature at 6 mm from the arc occurrence point on the negative electrode surface is 80.1 °C. Compared to the power supply voltage of 200 V, although the arc duration only decreased by 0.3 s, the surface temperature of the battery decreased by 10.1 °C. As shown in Figure 13b, the highest temperature is 77.9 °C, and the surface temperature of the battery decreased by 12.2 °C.

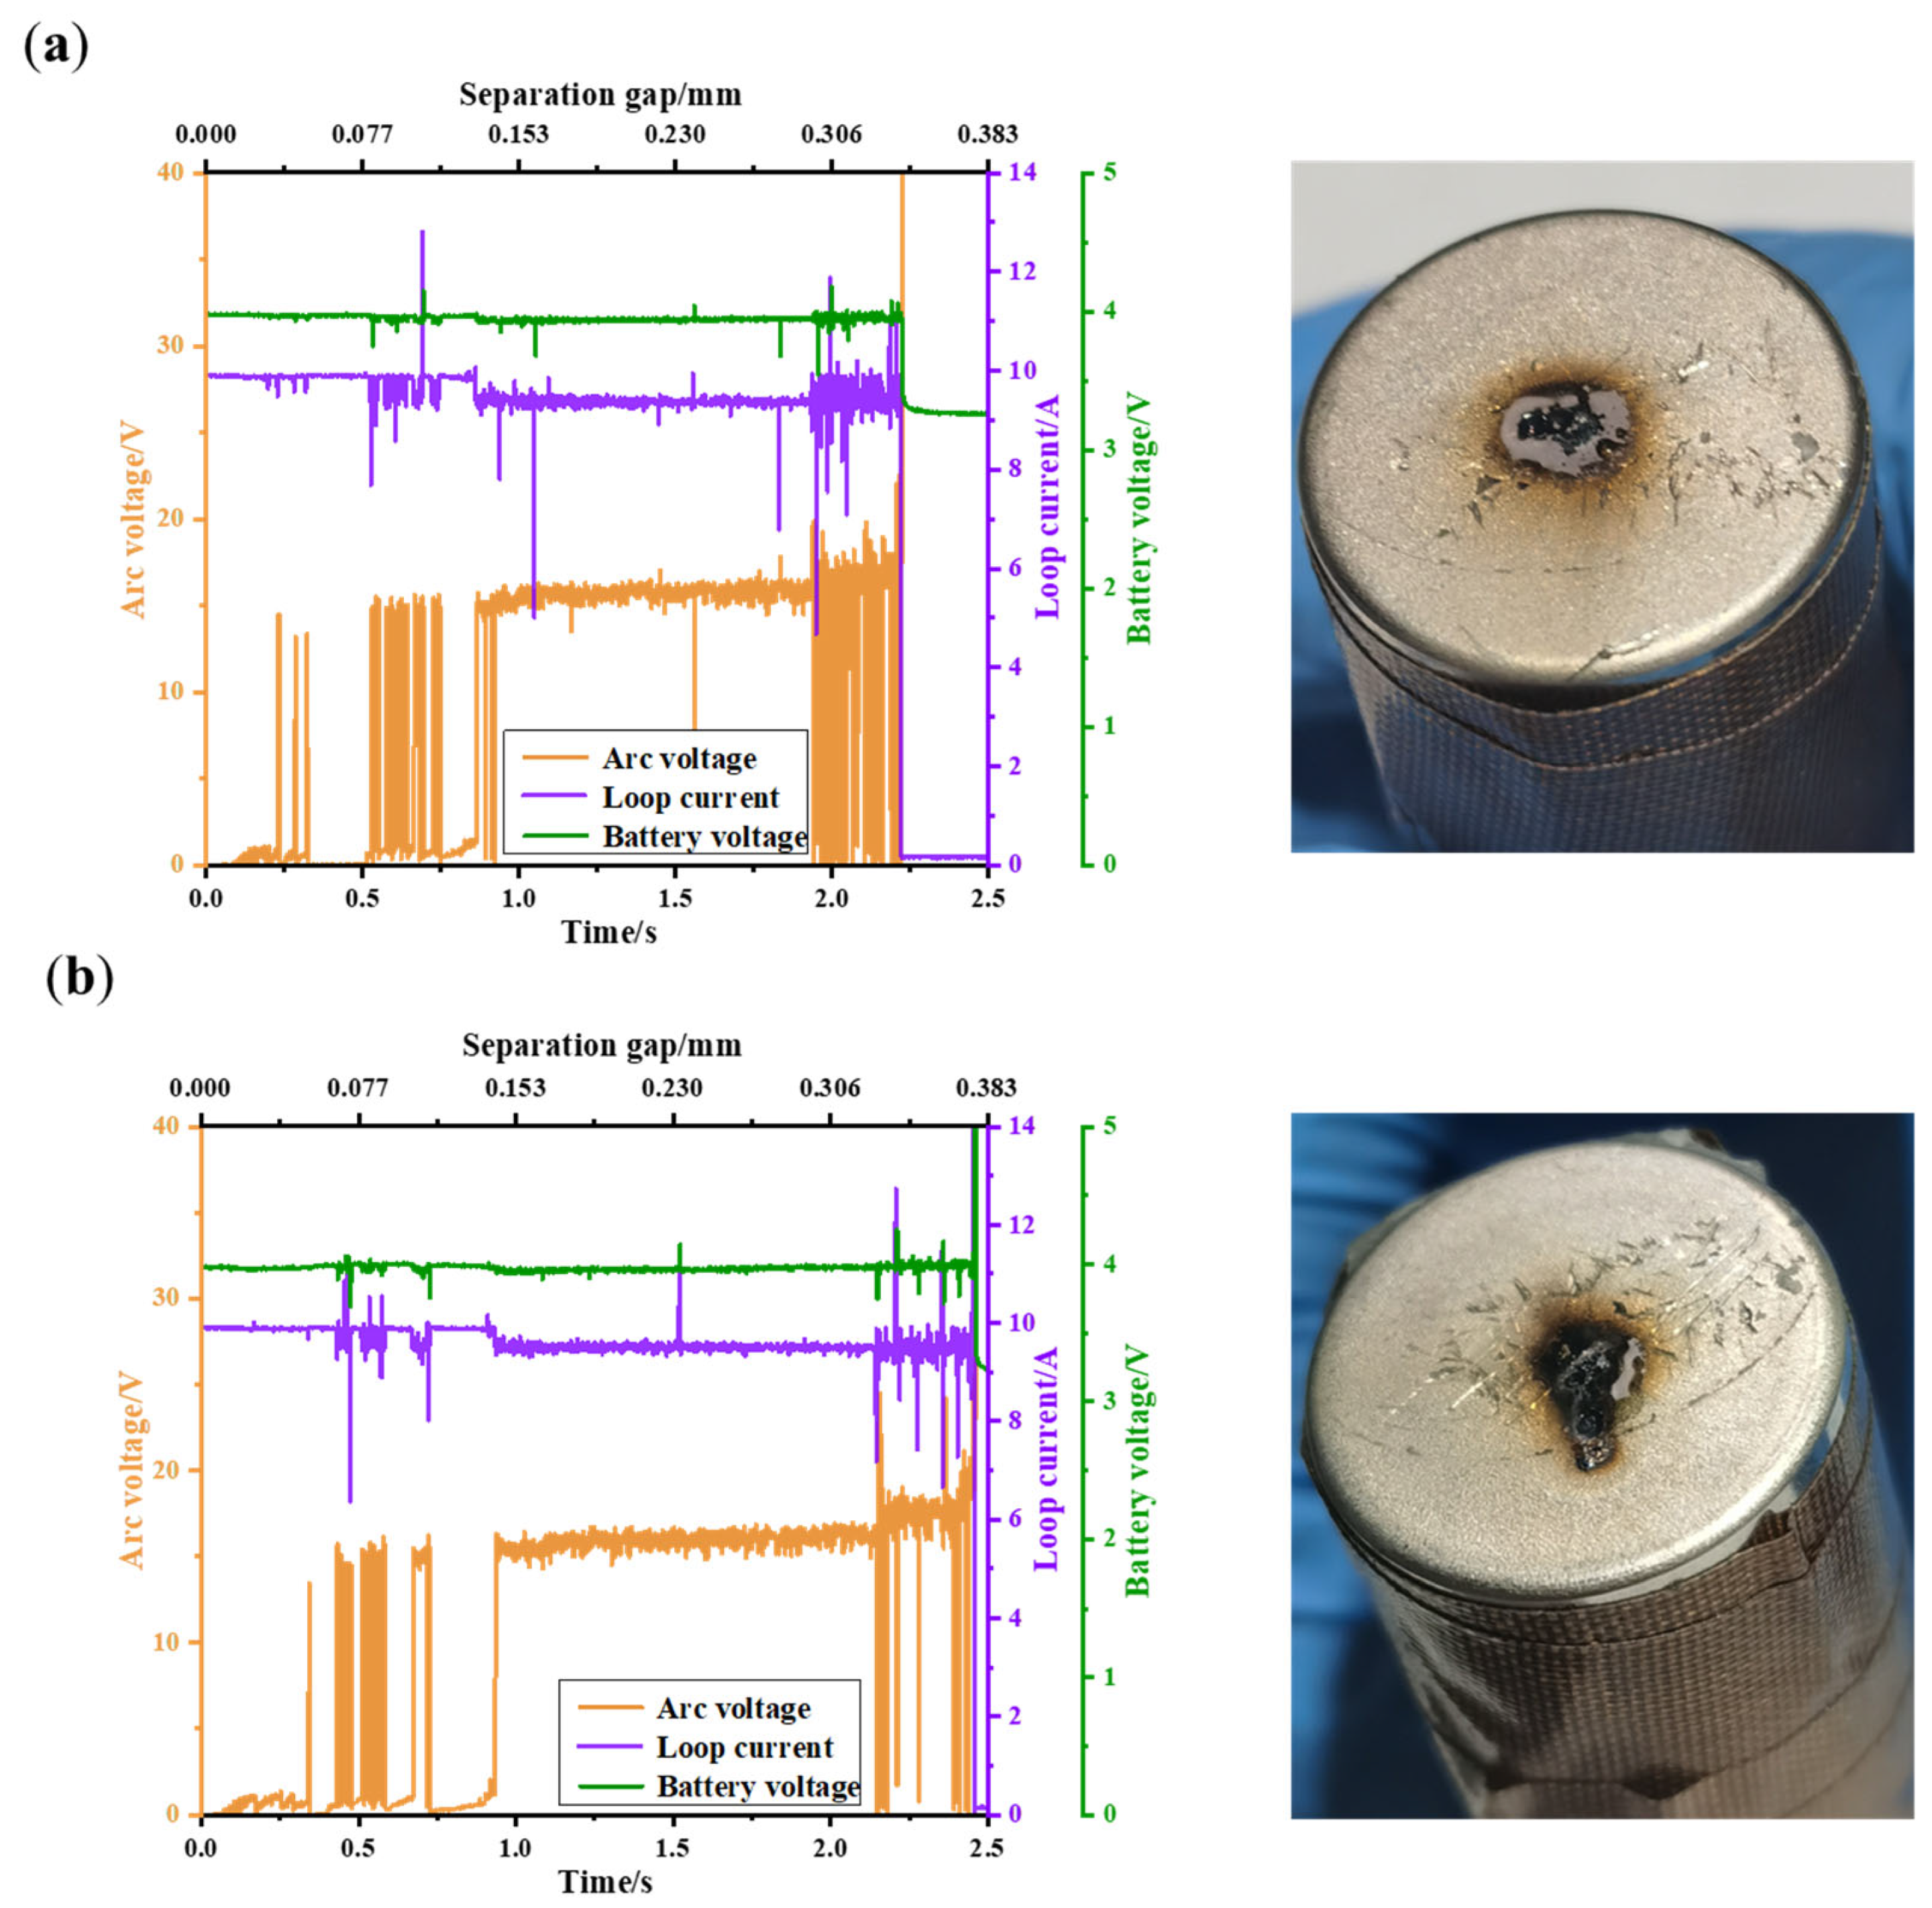
4.3.2. Discharge Conditions

The waveform diagram of the arc voltage, circuit current, and battery voltage is shown in Figure 14 under the conditions of a power supply voltage of 200 V and a discharge circuit current of 10 A. From the arc waveform, it can be observed that the minimum arc voltage during discharge is around 18 V, which is 3 V higher compared to the charging conditions. During stable arc burning, the waveform of the arc voltage and current exhibits more noticeable fluctuations.
When the arc occurs, the arc shapes captured by the high-speed camera under a power supply voltage of 200 V, both in the charging and discharging conditions, are shown in Figure 15. From the figure, it can be observed that during discharge, the negative electrode arc sparks are more intense, leading to an increased arc erosion pattern. Therefore, compared to the charging condition, the harmful effects of the negative electrode arc are enhanced during discharge.
Under the 200 V + 10 A discharging condition, fitting the discharge data, the fitting curve of the arc voltage and separation gap satisfies y = 7.04x + 18.08, with an RMSE of 0.21 V, as shown in Figure 16. Compared to the 200 V + 10 A charging condition, it is found that the slope of the arc voltage with respect to the separation gap increases. This is because the arc consists of the cathode region, anode region, and arc column region, with more intense reactions occurring in the cathode region than in the anode region. Under the discharging condition, the battery’s negative electrode acts as the cathode of the arc. In comparison to the charging condition, where the battery’s negative electrode acts as the anode of the arc, the reactions are more intense, leading to greater fluctuations in the arc voltage and an increased slope.

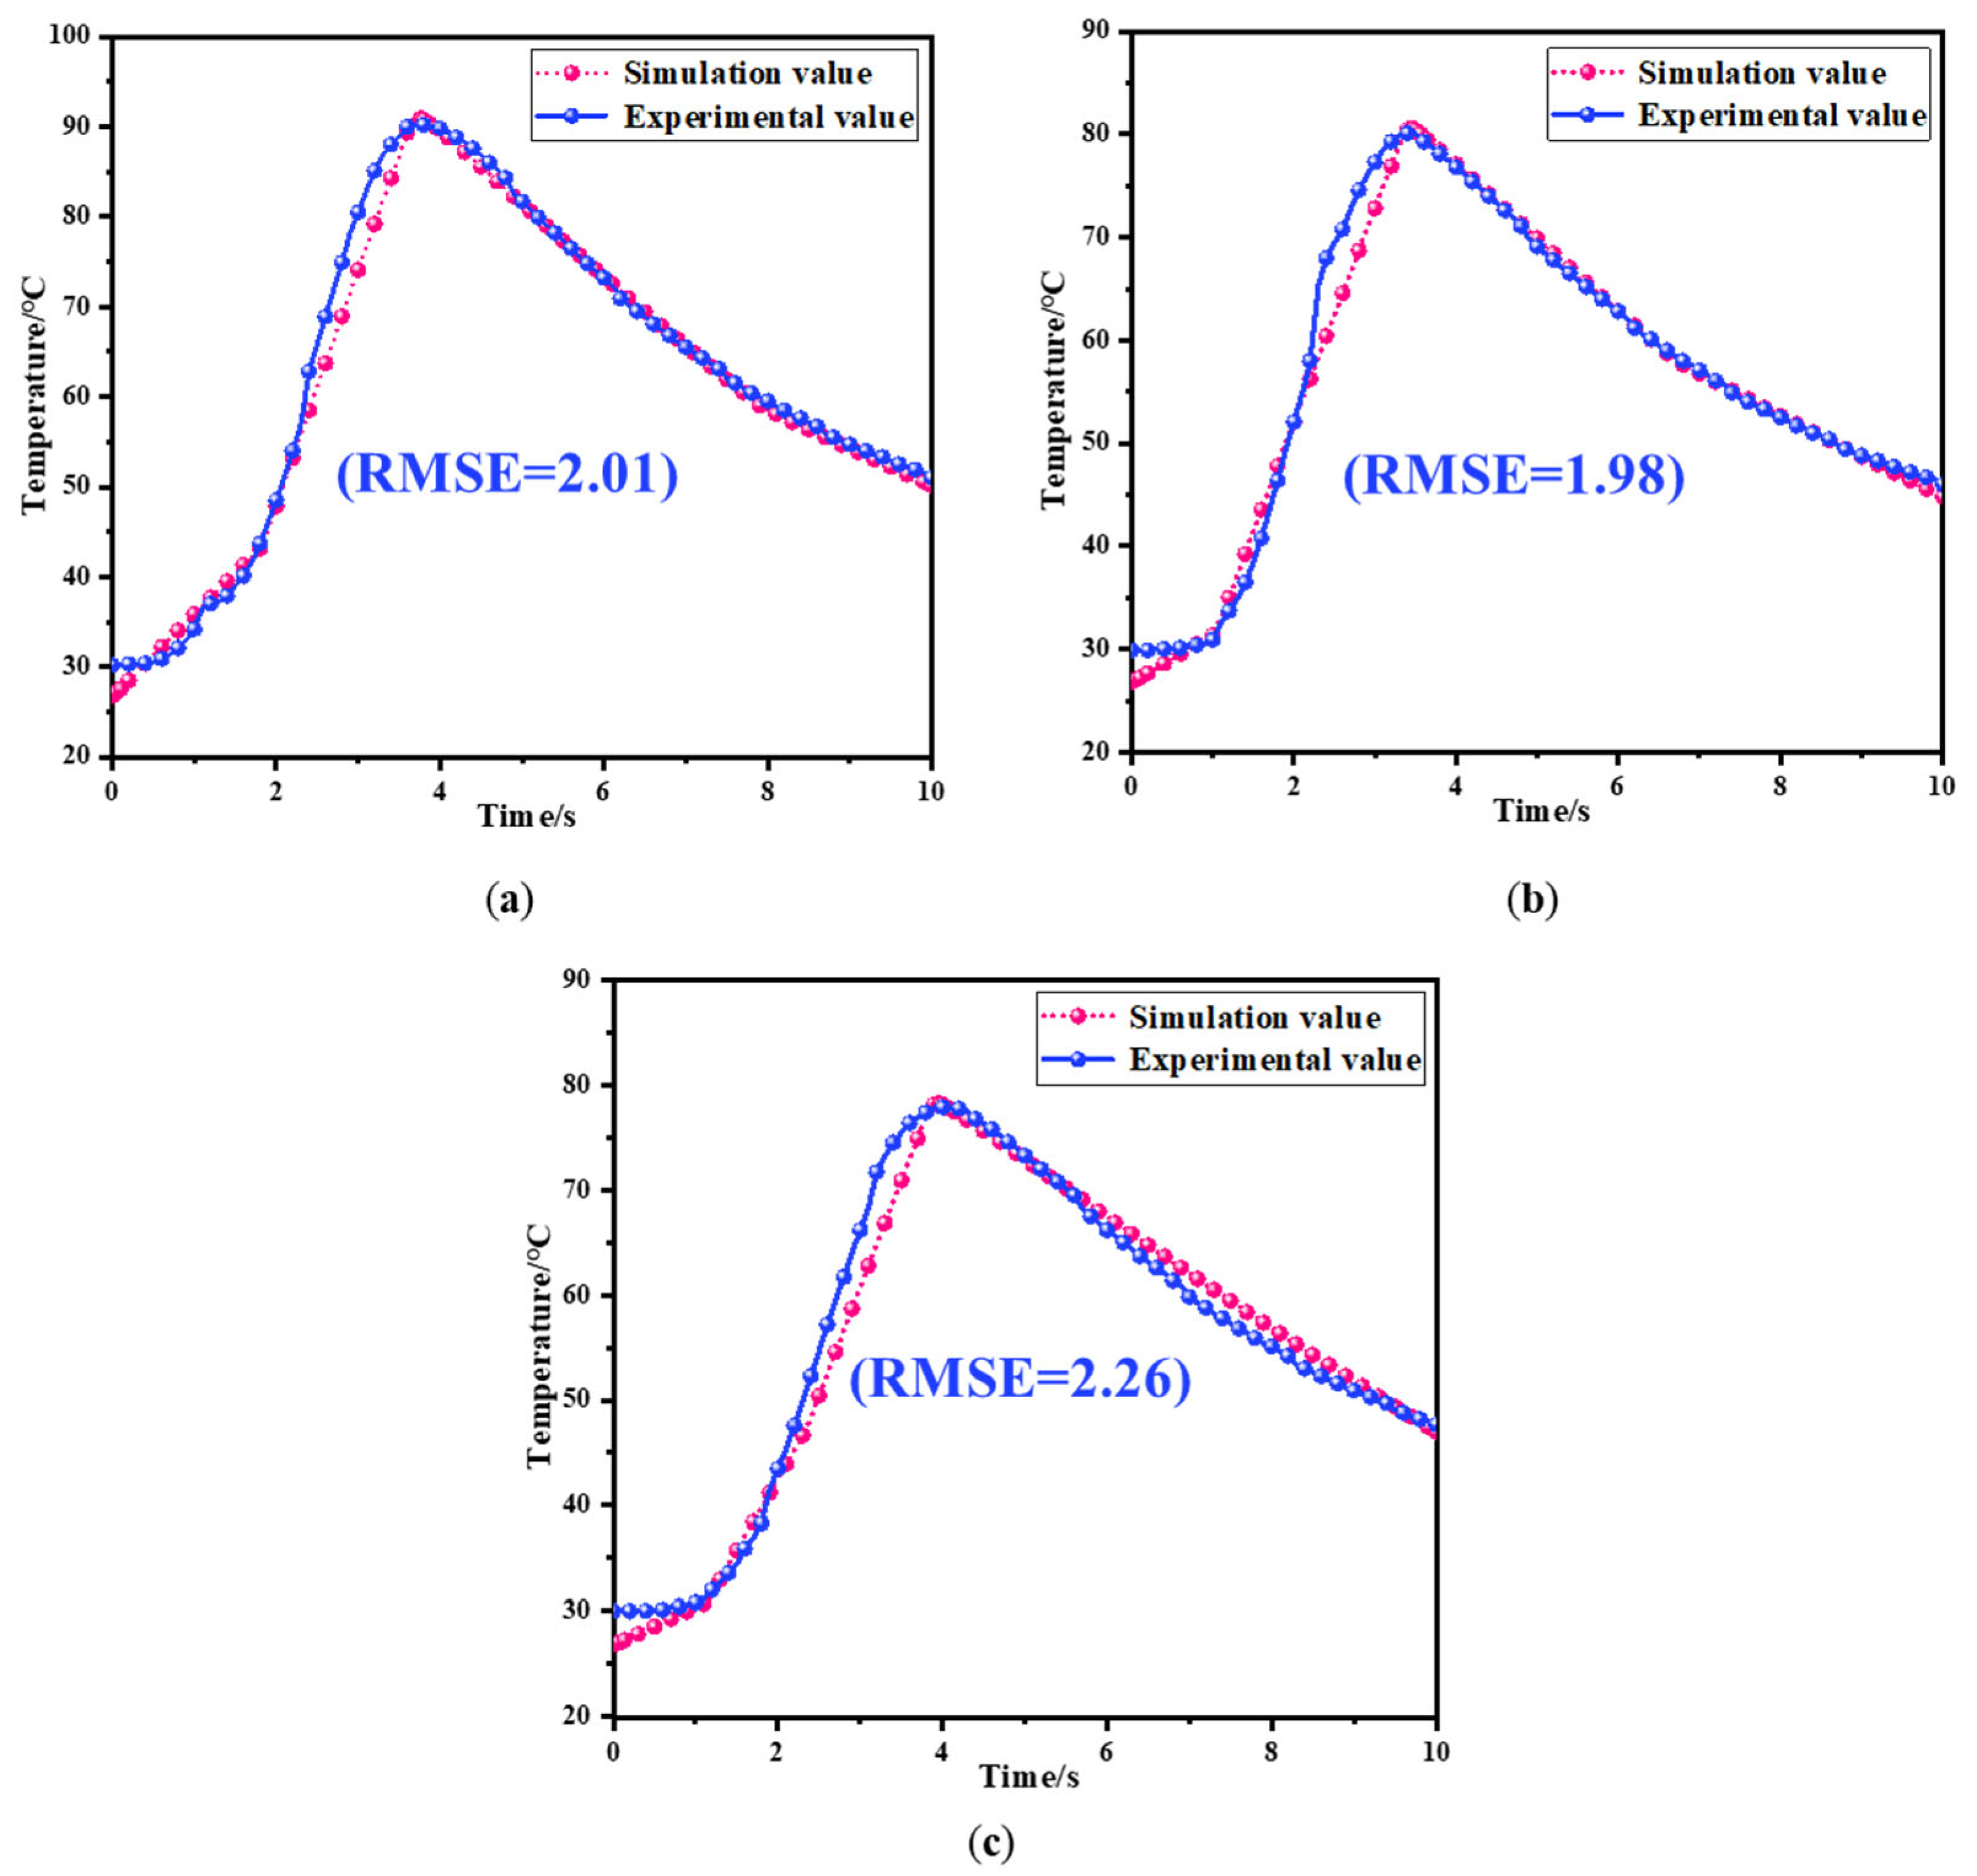
4.4. Model Verification

At a power supply voltage of 200 V, circuit current of 10 A, and gap distances of 0.1 mm, 0.2 mm, 0.3 mm, and 0.4 mm, the arc voltages were measured as 15 V, 15.6 V, 15.9 V, and 16.7 V, respectively. These values are in good agreement with the fitted curve of the arc voltage and distance in the experiment, represented by y = 5.65x + 14.34, with errors within 0.15 V, demonstrating conformity with the evolving pattern of the arc.
The simulated and experimental temperature variation waveforms at a distance of 6 mm from the arc initiation position under different voltage levels are presented in Figure 17. From the graph, it can be observed that the simulated values and experimental values of the temperature are generally consistent at different power supply voltage levels. The root mean square errors (RMSEs) are 2.01 °C, 1.98 °C, and 2.26 °C, respectively. Comparing with the experimental maximum temperatures of 90.2 °C, 80.1 °C, and 77.9 °C, the errors are 2.2%, 2.5%, and 2.9%, respectively. The temperature errors between the simulation and experiment are all below 3% at different power supply voltage levels, indicating a good fitting effect. Due to the excessively high temperature of the arc, which cannot be measured by existing instruments, the accuracy of the simulated arc temperature is demonstrated by the temperature error being less than 3% when compared with the experimental measurements on the battery’s negative electrode surface at a distance of 6 mm from the arc initiation position.
By comparing and analyzing the simulated results with the experimental data, it is verified that the error in the arc voltage at both ends is less than ±0.14 V, and the temperature error is less than 3%. This confirms the accuracy of the model.

5. Conclusions

An arc is an important factor in inducing electrical faults in battery systems, but the research on battery system arcs is still in an initial stage, and there is a lack of research on battery system arc modeling. Therefore, in this paper, we constructed a model that can reflect the generation and evolution of the battery arc, based on the arc generation and evolution mechanism and considering the actual parameters of the battery. Subsequently, a lithium-ion battery arc generation simulation experimental platform was built to further carry out battery arc experiments. The accuracy of the model constructed in this paper is verified by analyzing the experimental results. Therefore, the model proposed in this paper fills the gap in battery system arc simulation, which is of great significance in guiding the research of subsequent battery system arc experiments. In addition, the following conclusions were obtained during the arc simulation and experiment:
(1)
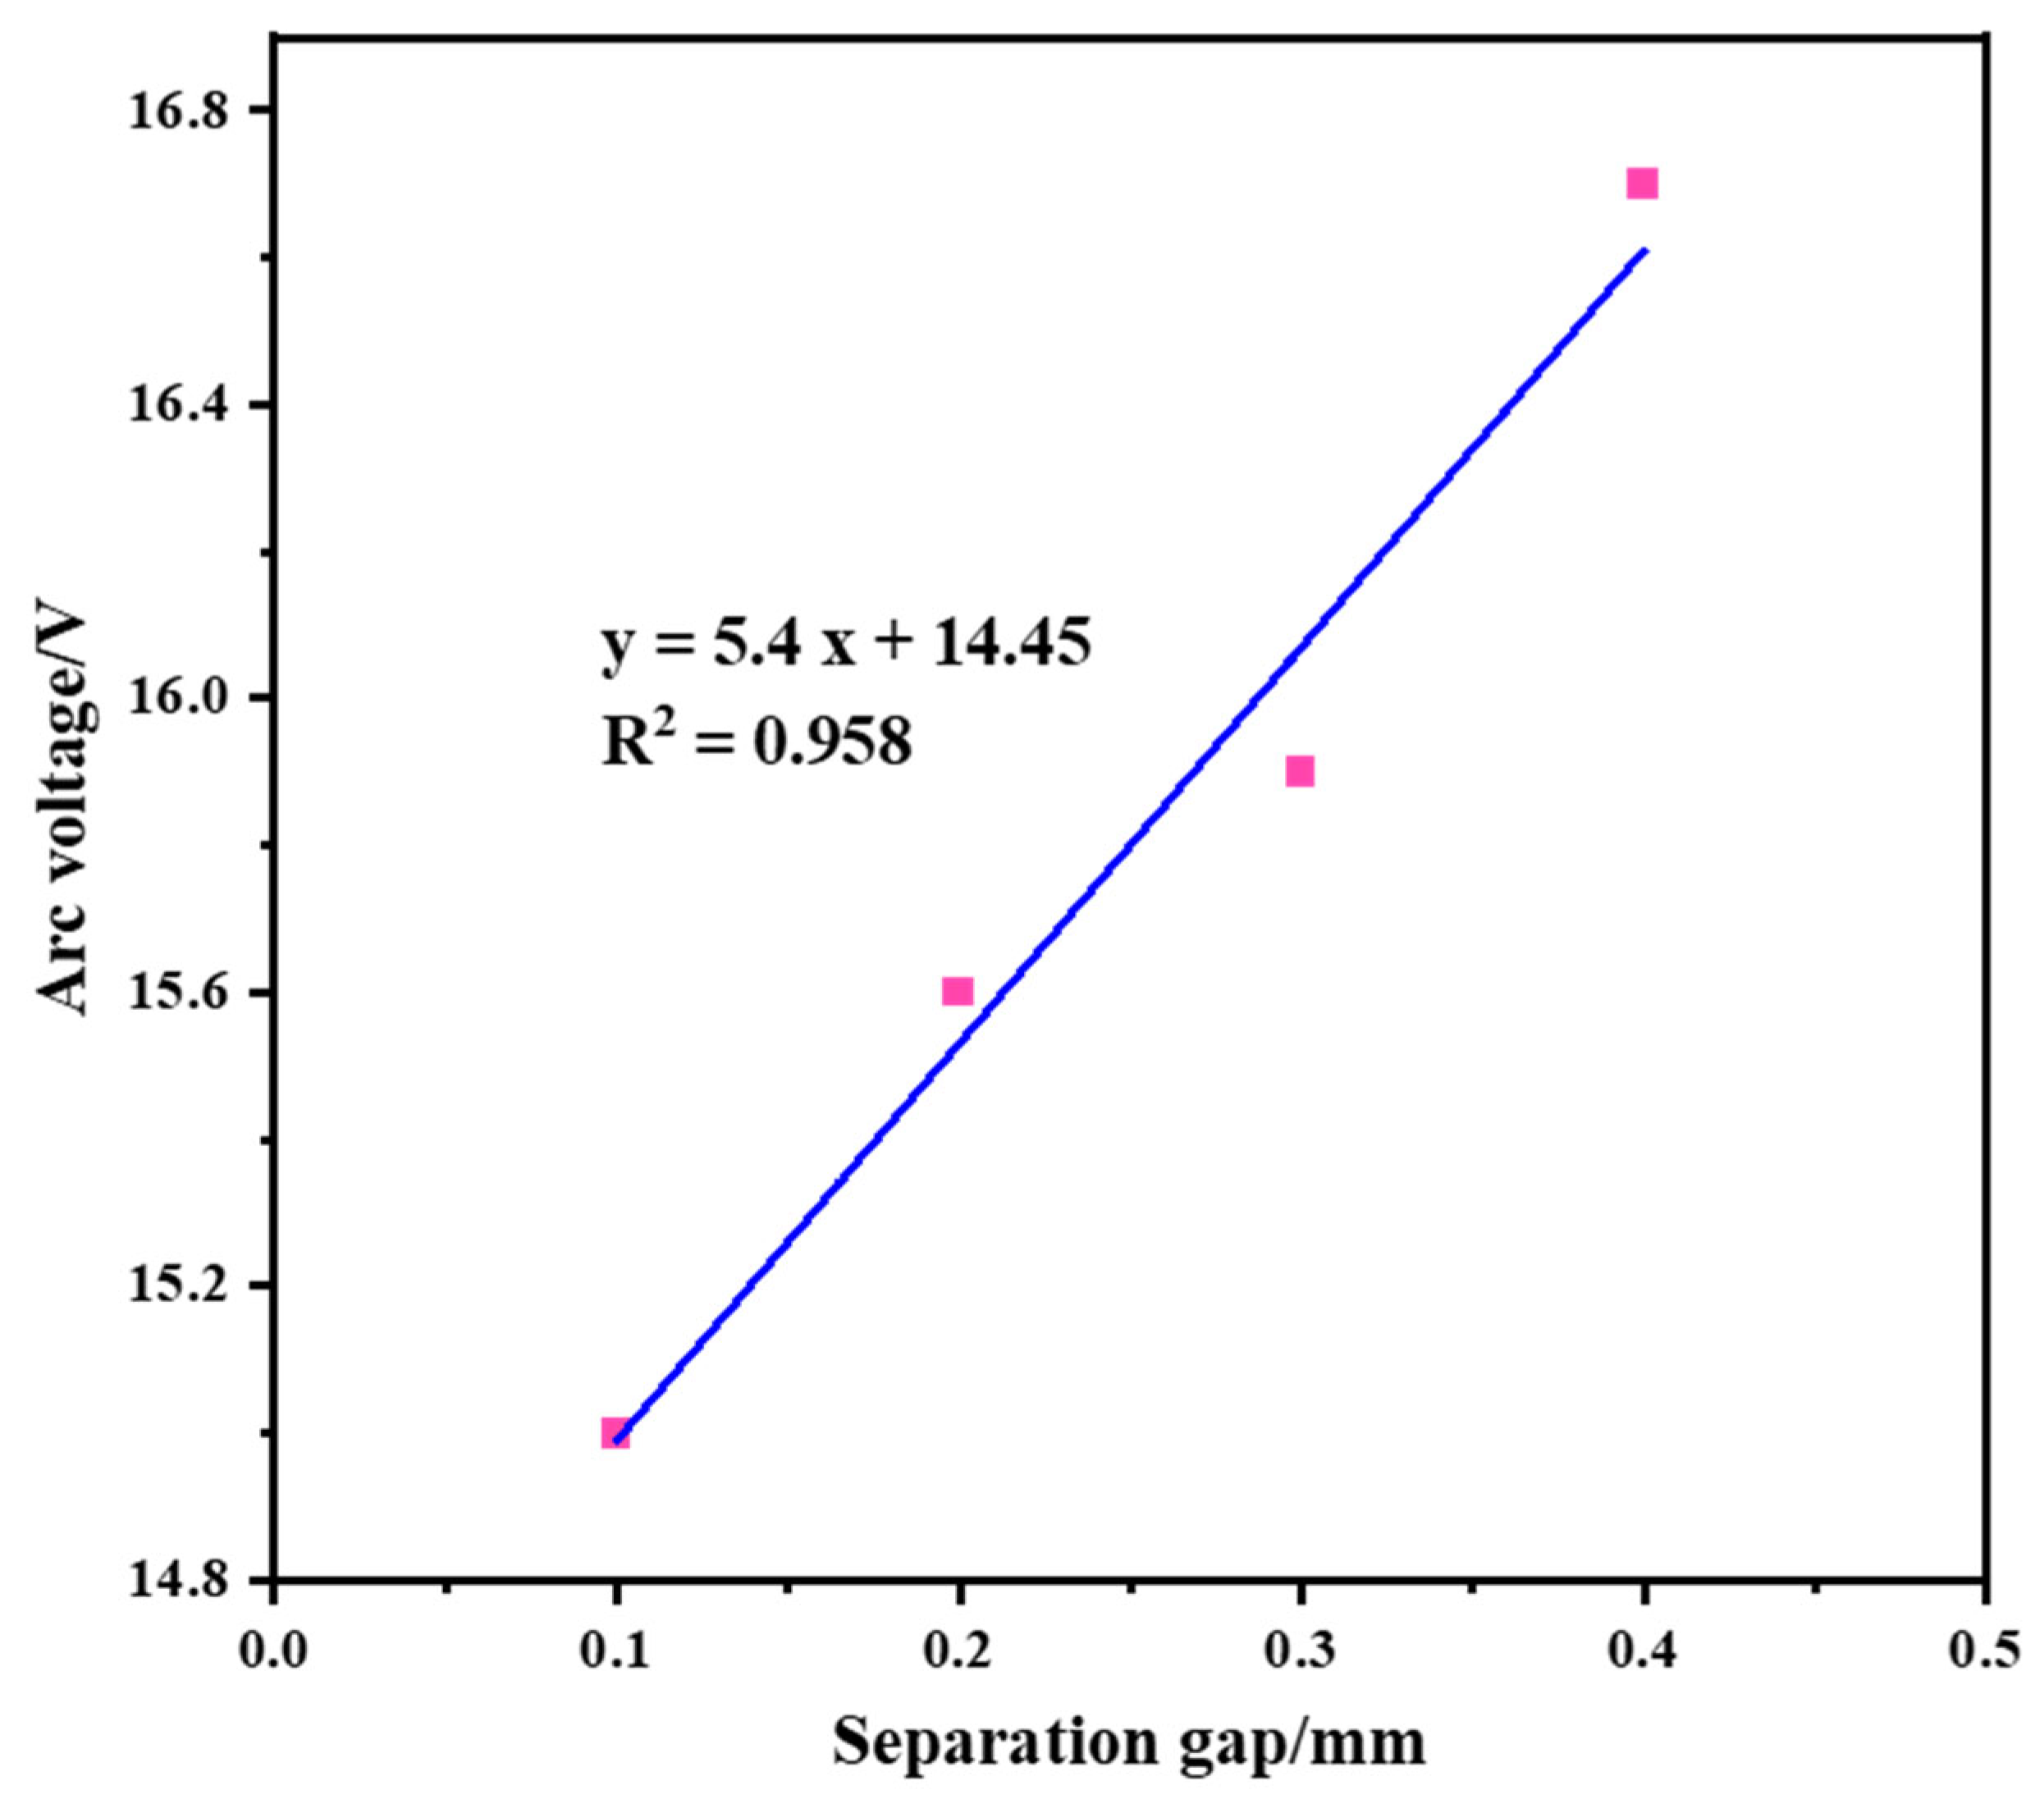
The COMSOL 6.0 software was used to build a model of battery arc, simulate the change in the arc voltage under different gaps, and found the law that the arc voltage increases linearly with the gap. Meanwhile, it was found that the maximum value of the electric field strength was located near the cathode when the arc fault occurred, the maximum value of the magnetic flux density mode was located at the tip of the copper electrode, and the maximum value of the temperature and the flow field velocity of the arc was located at the center of the electrode spacing.
(2)
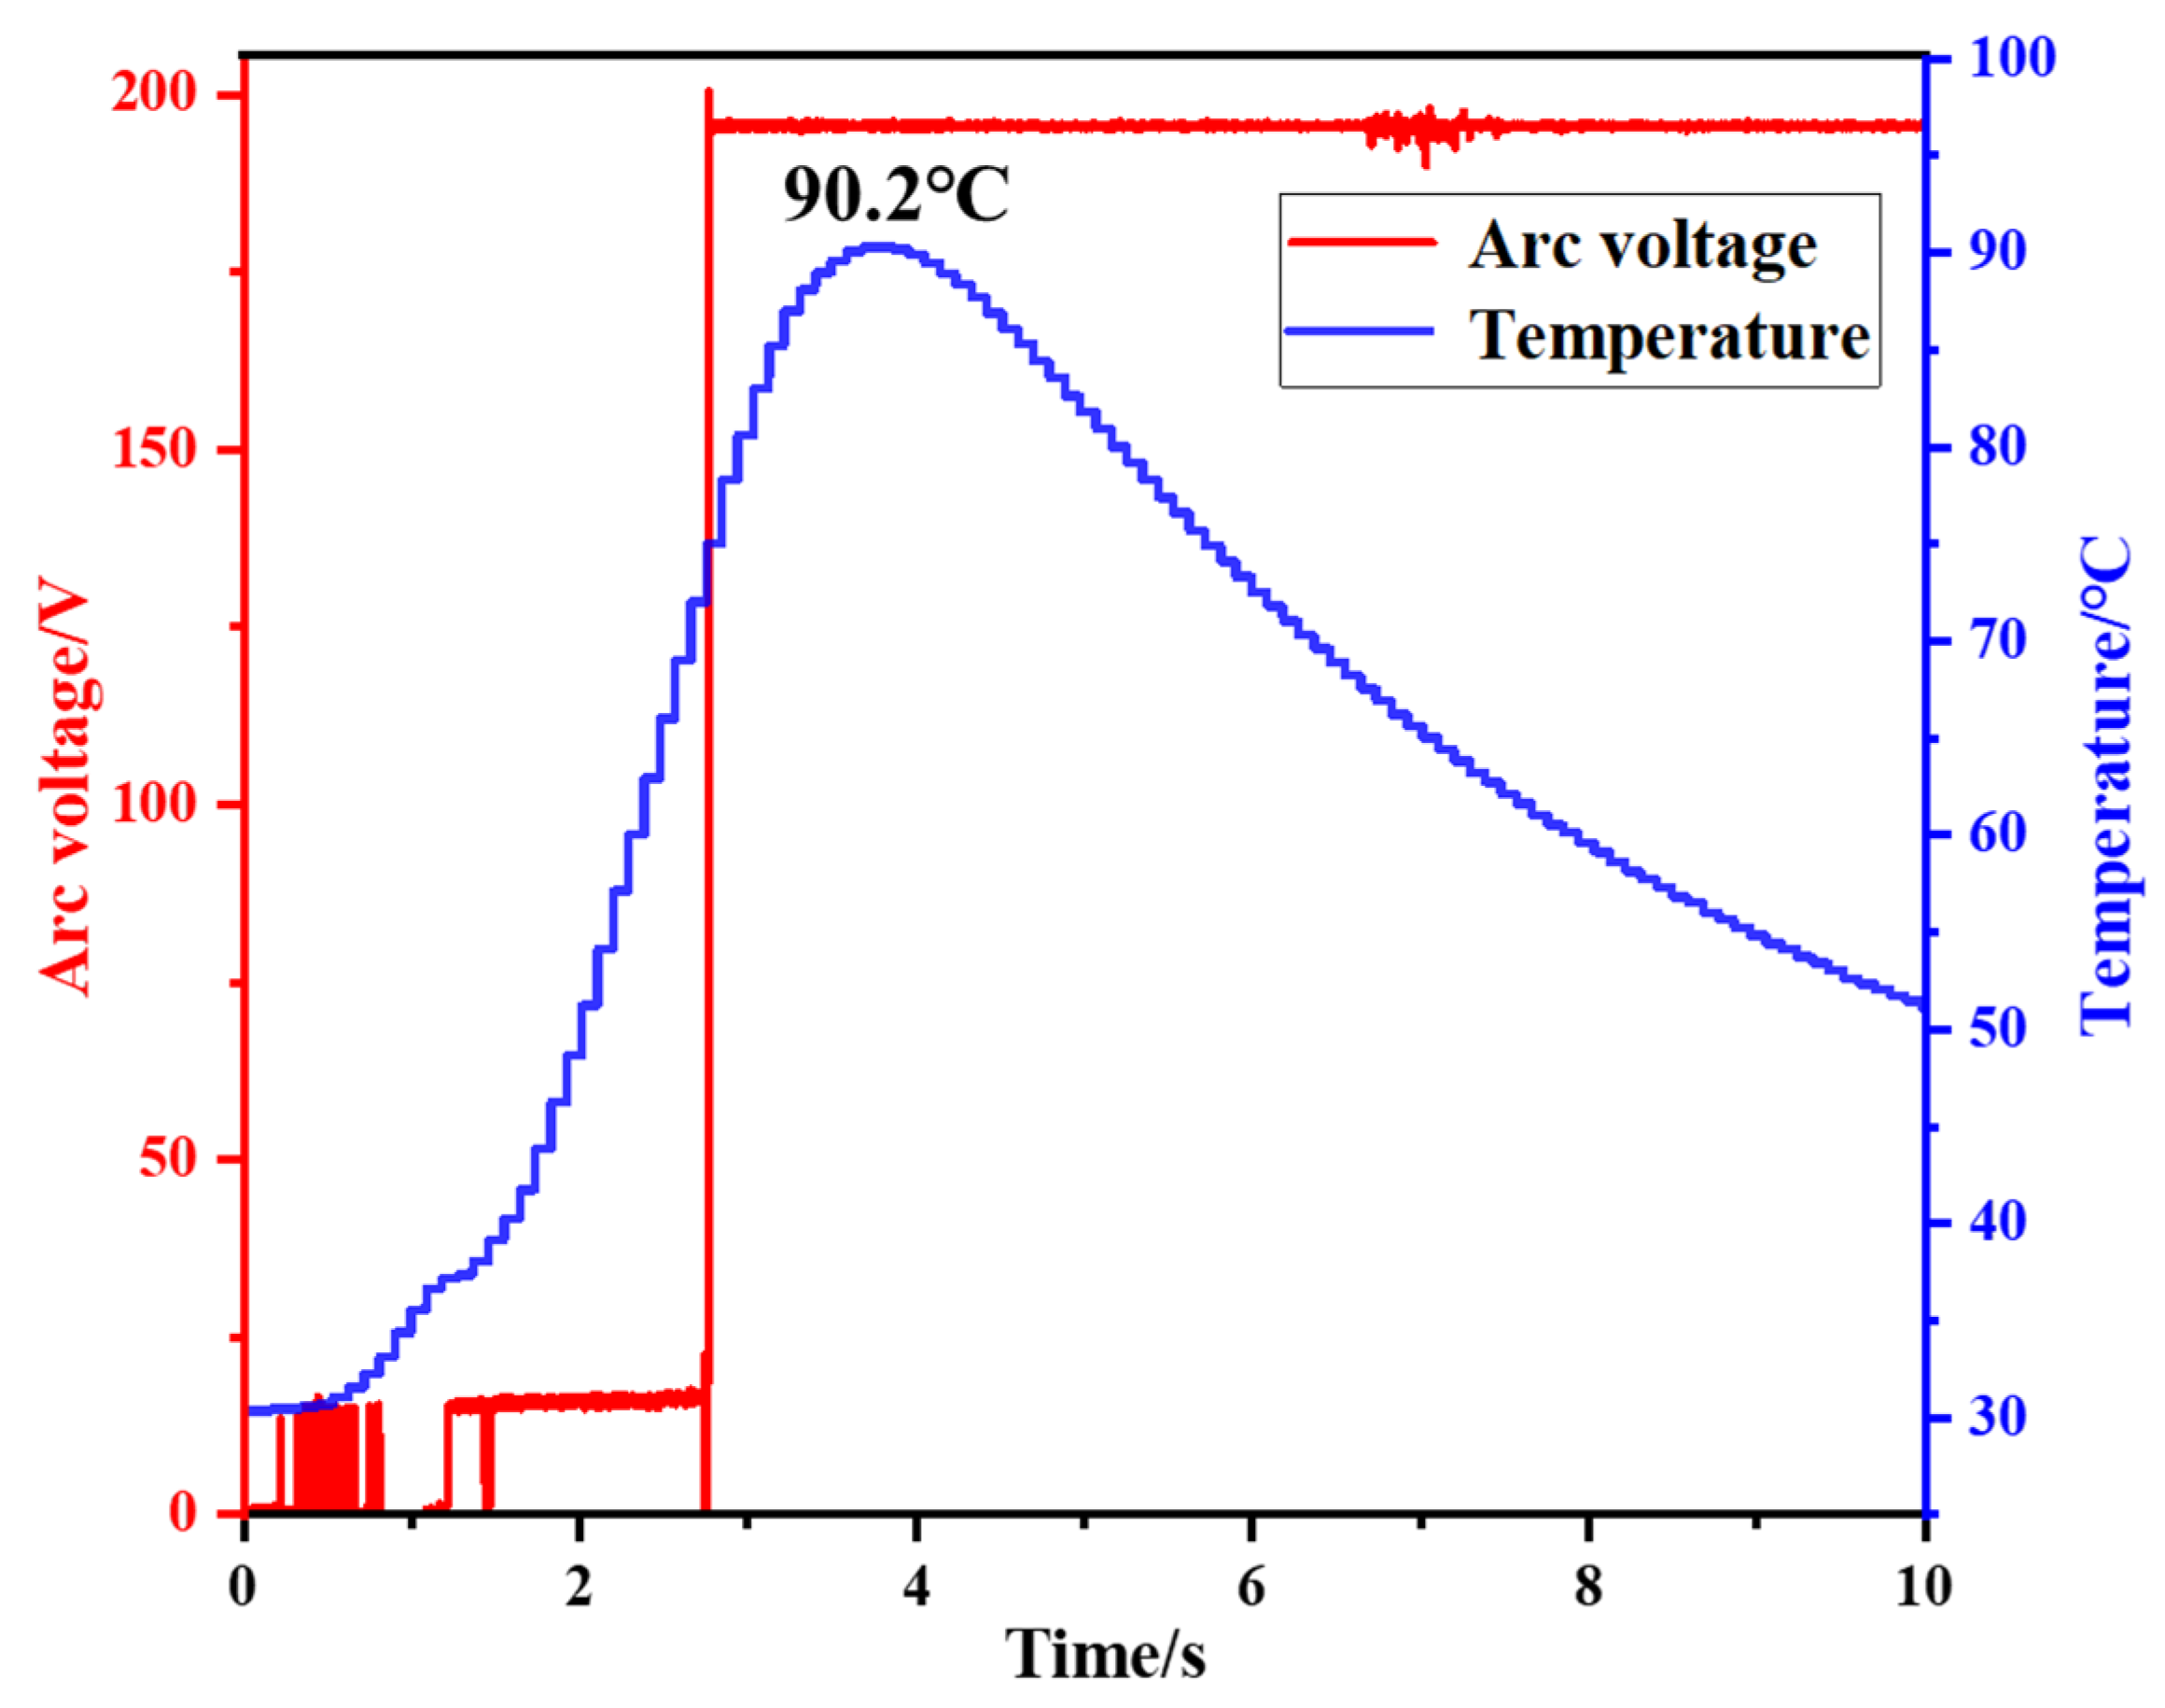
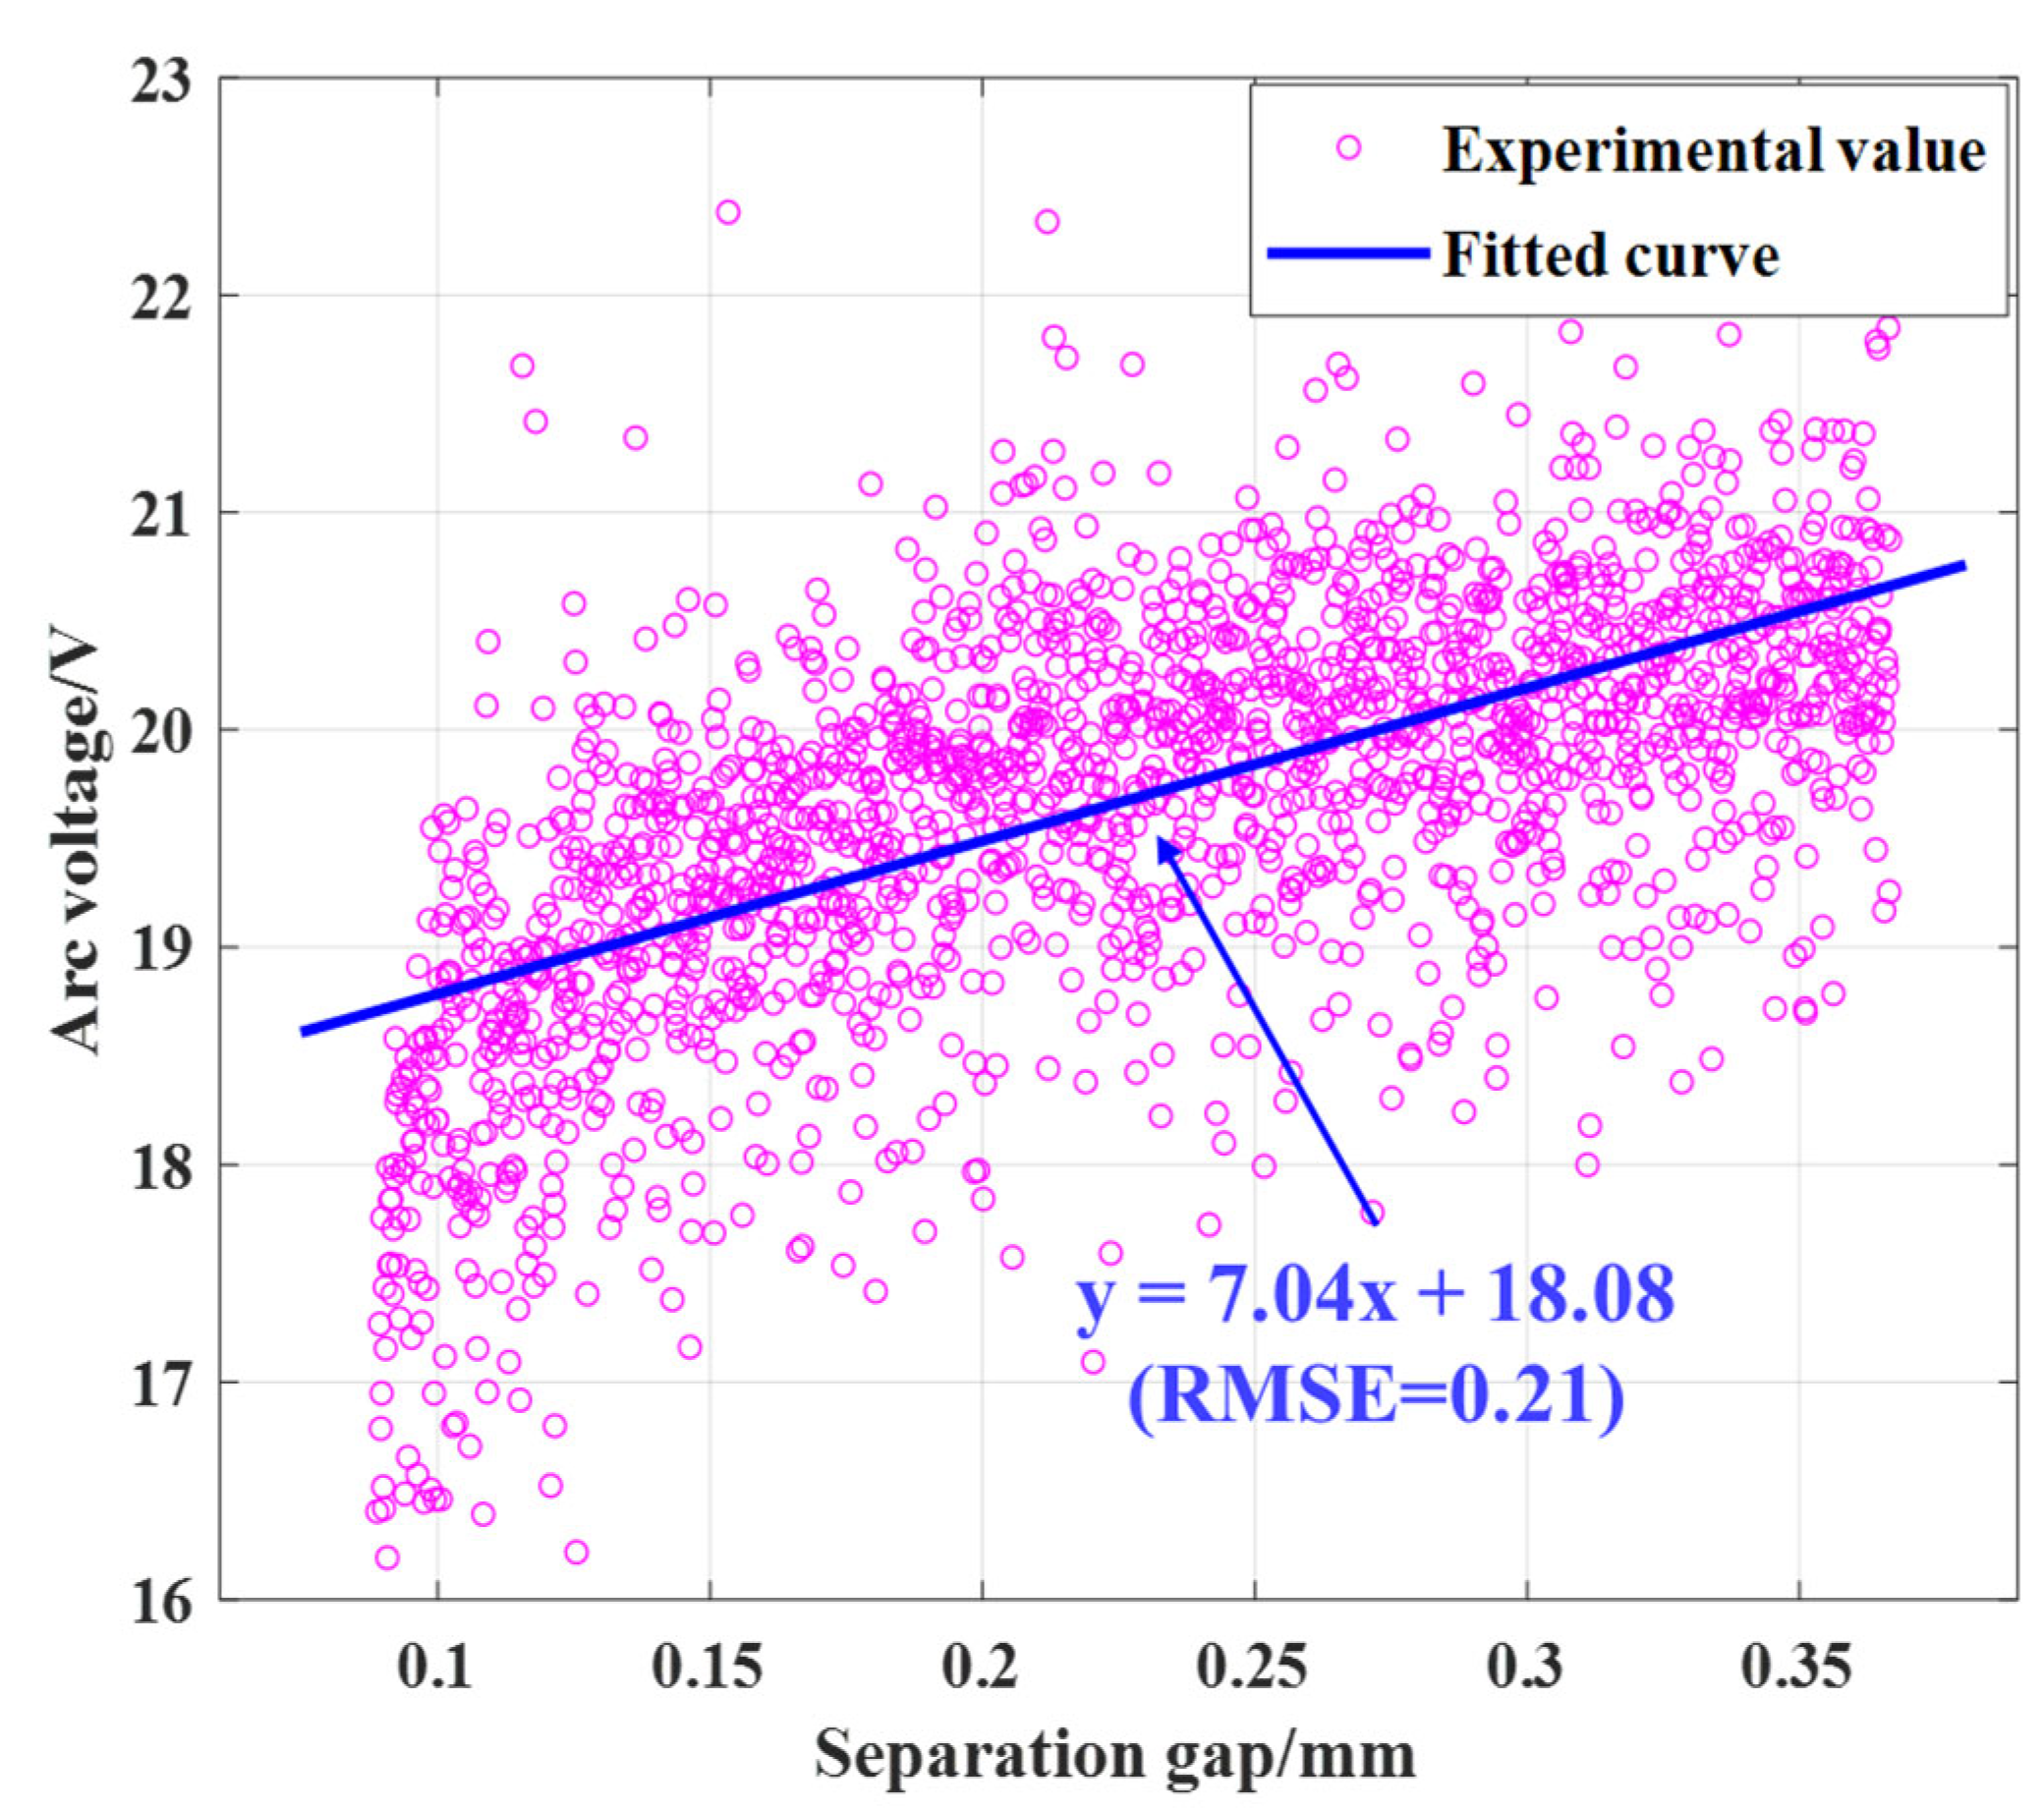
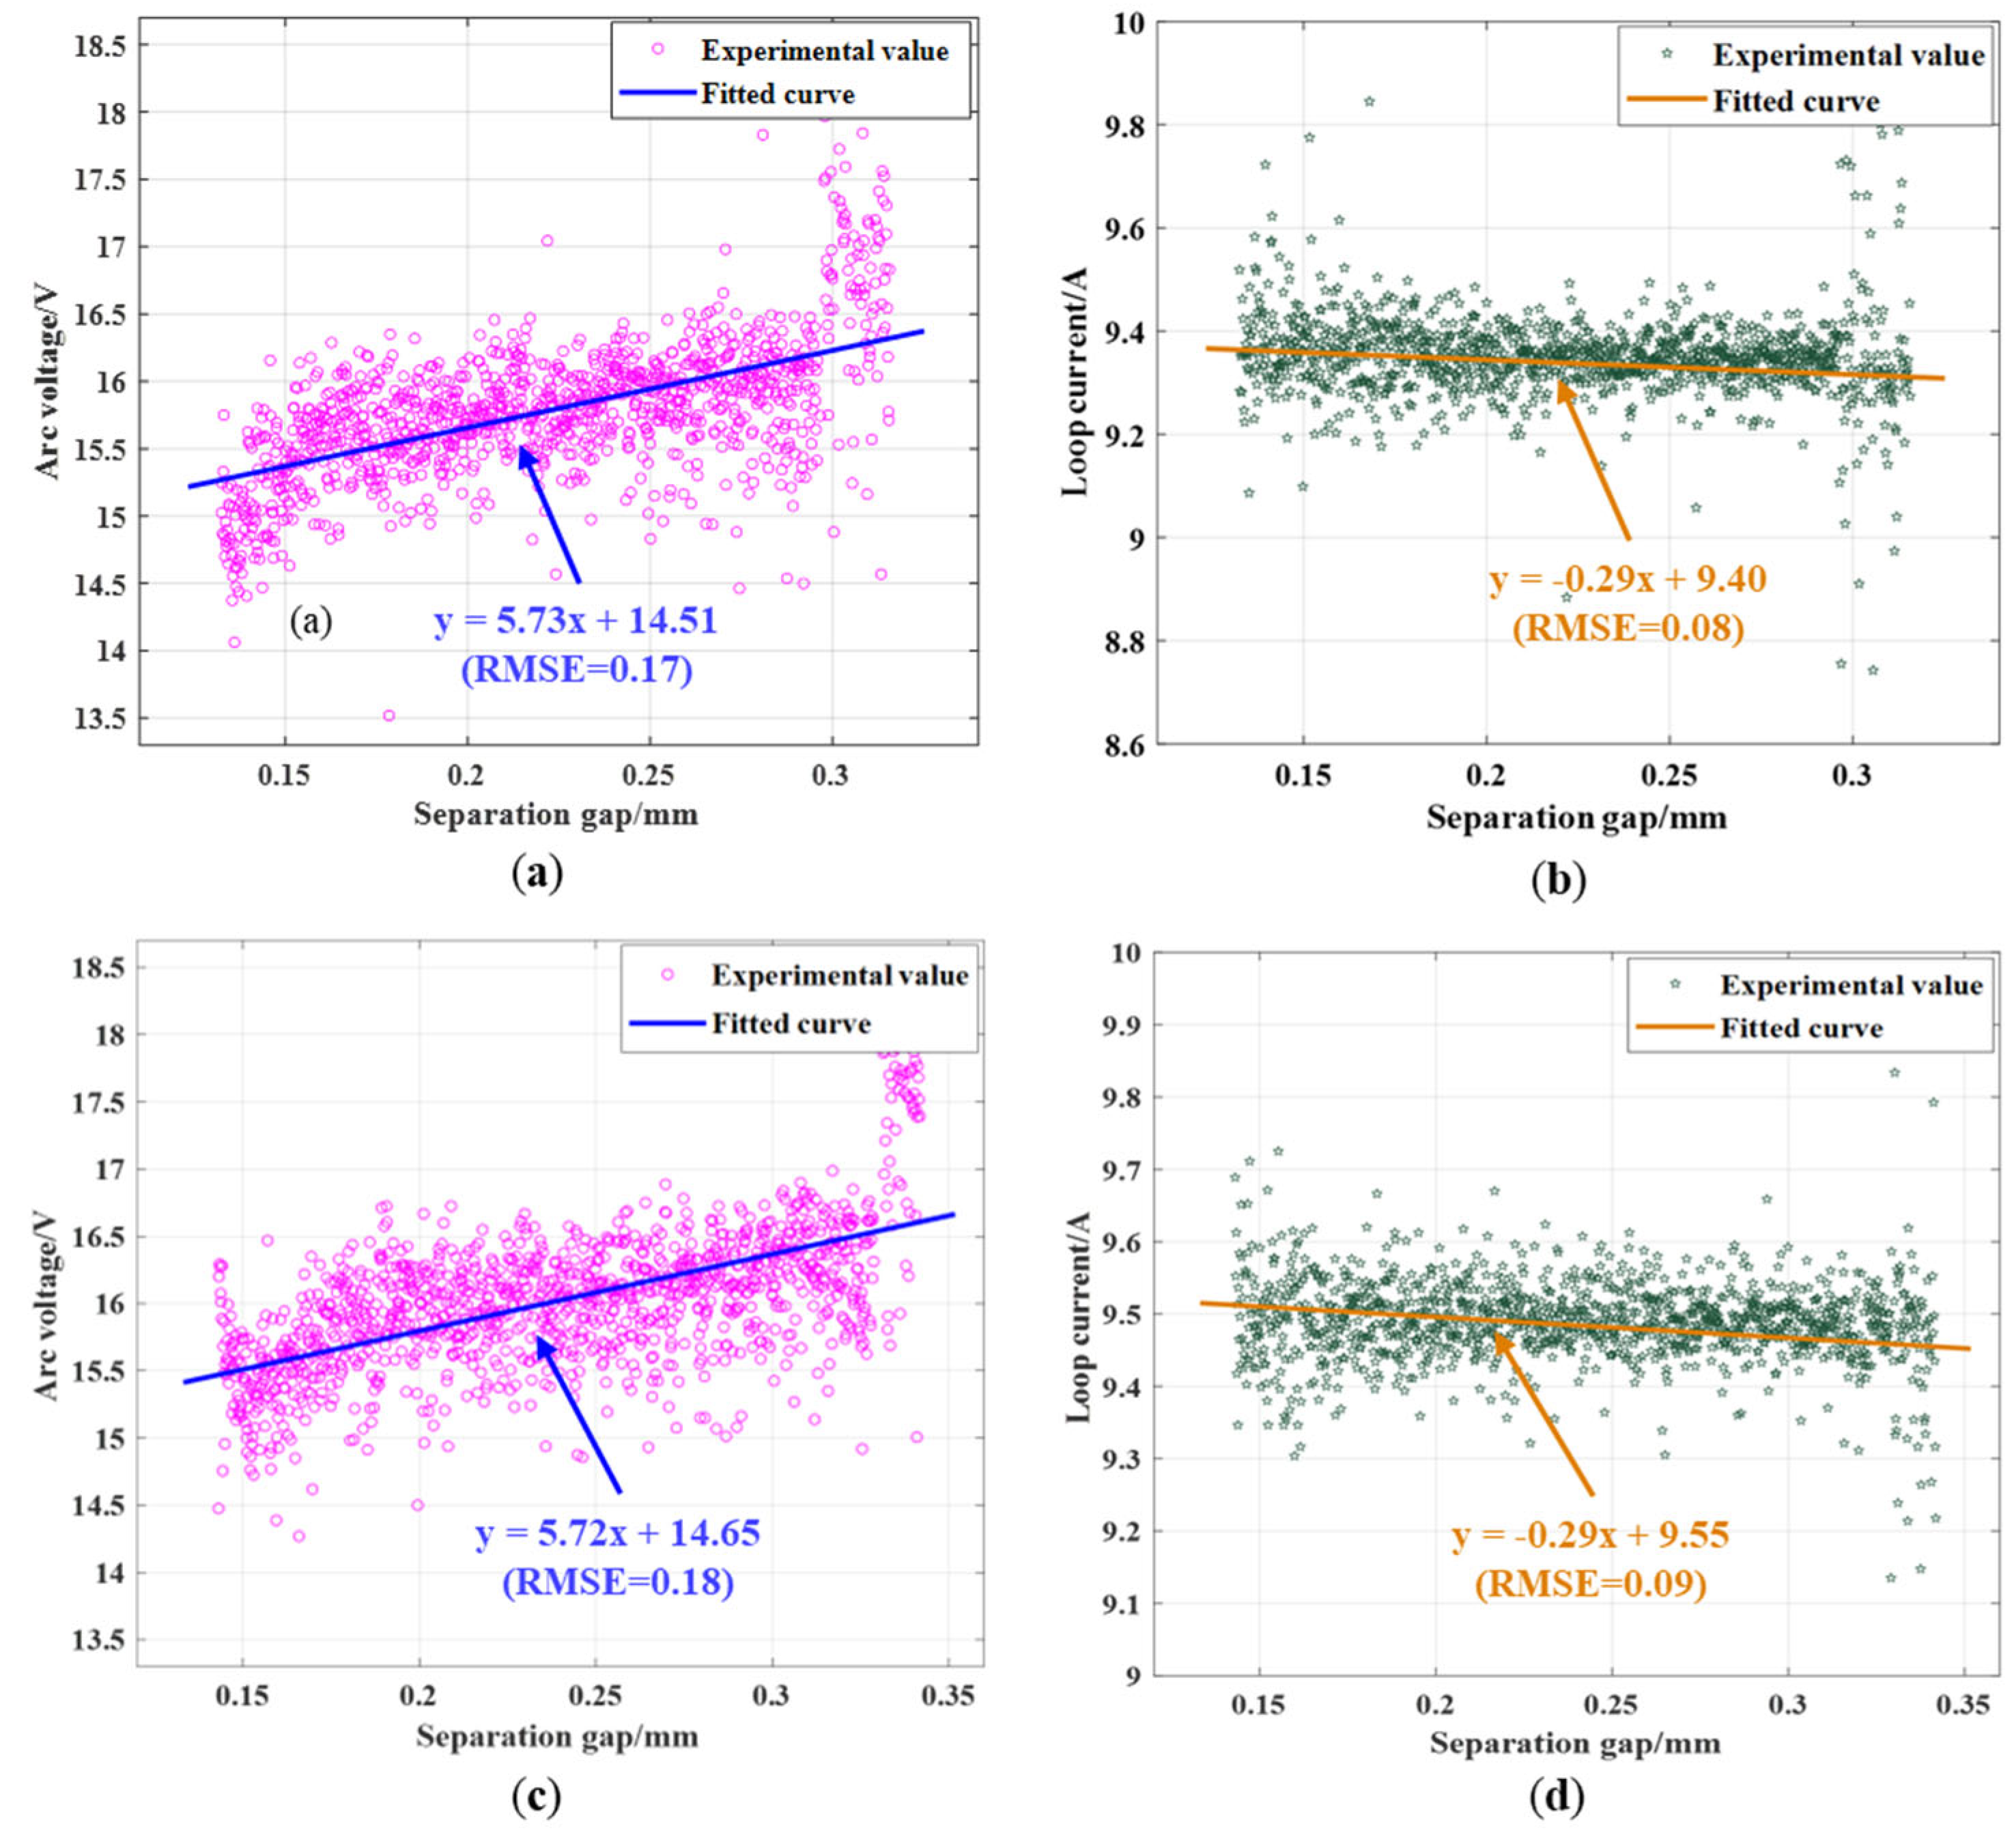
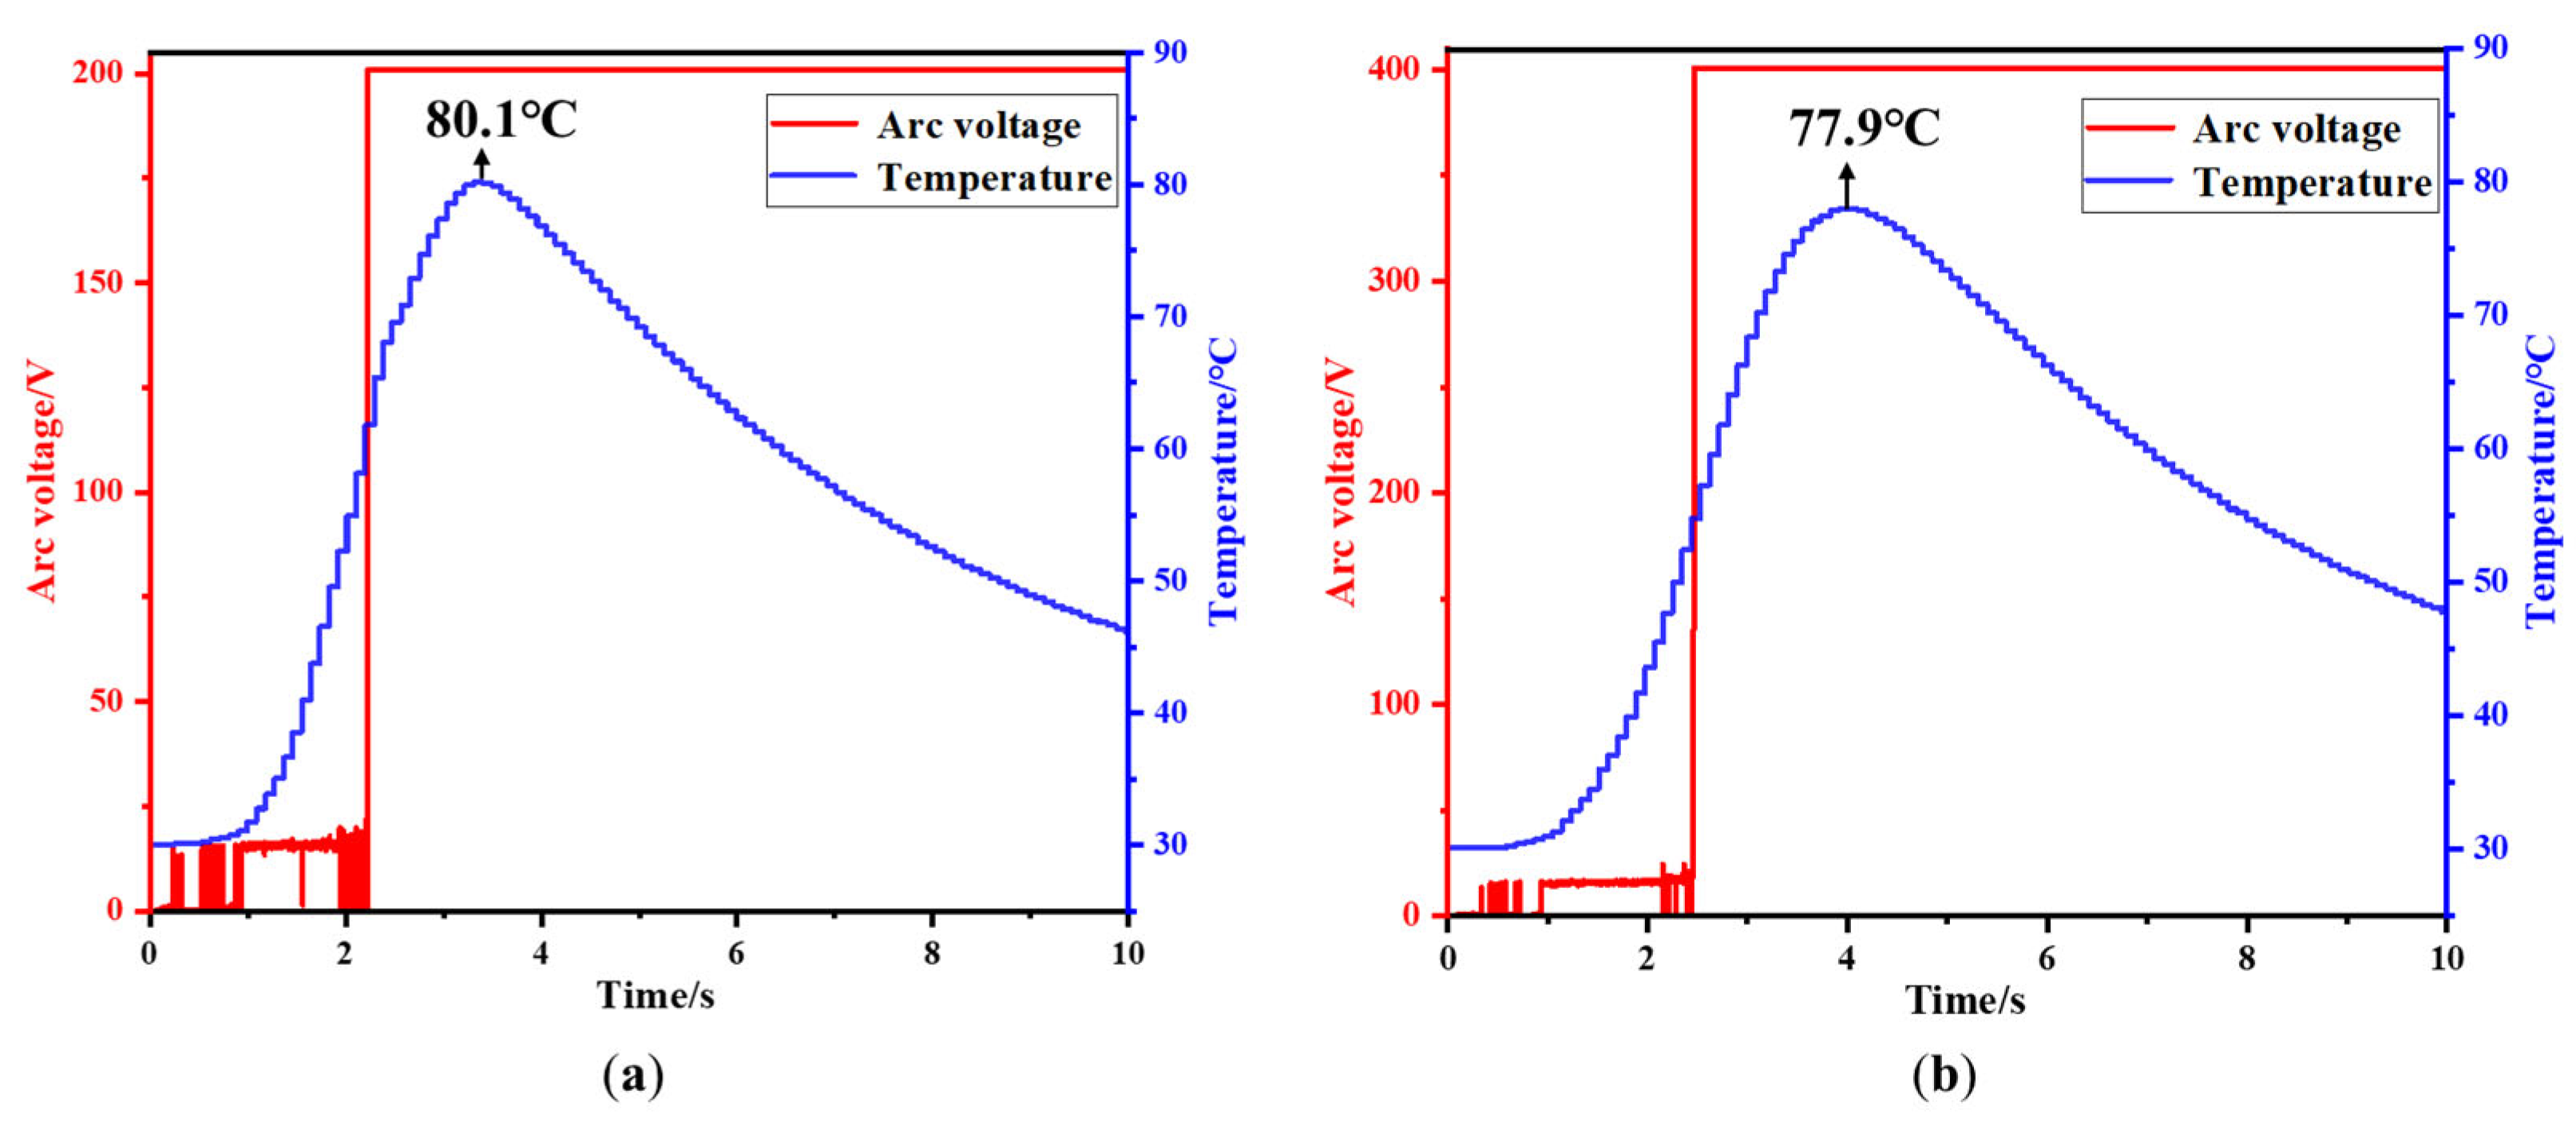
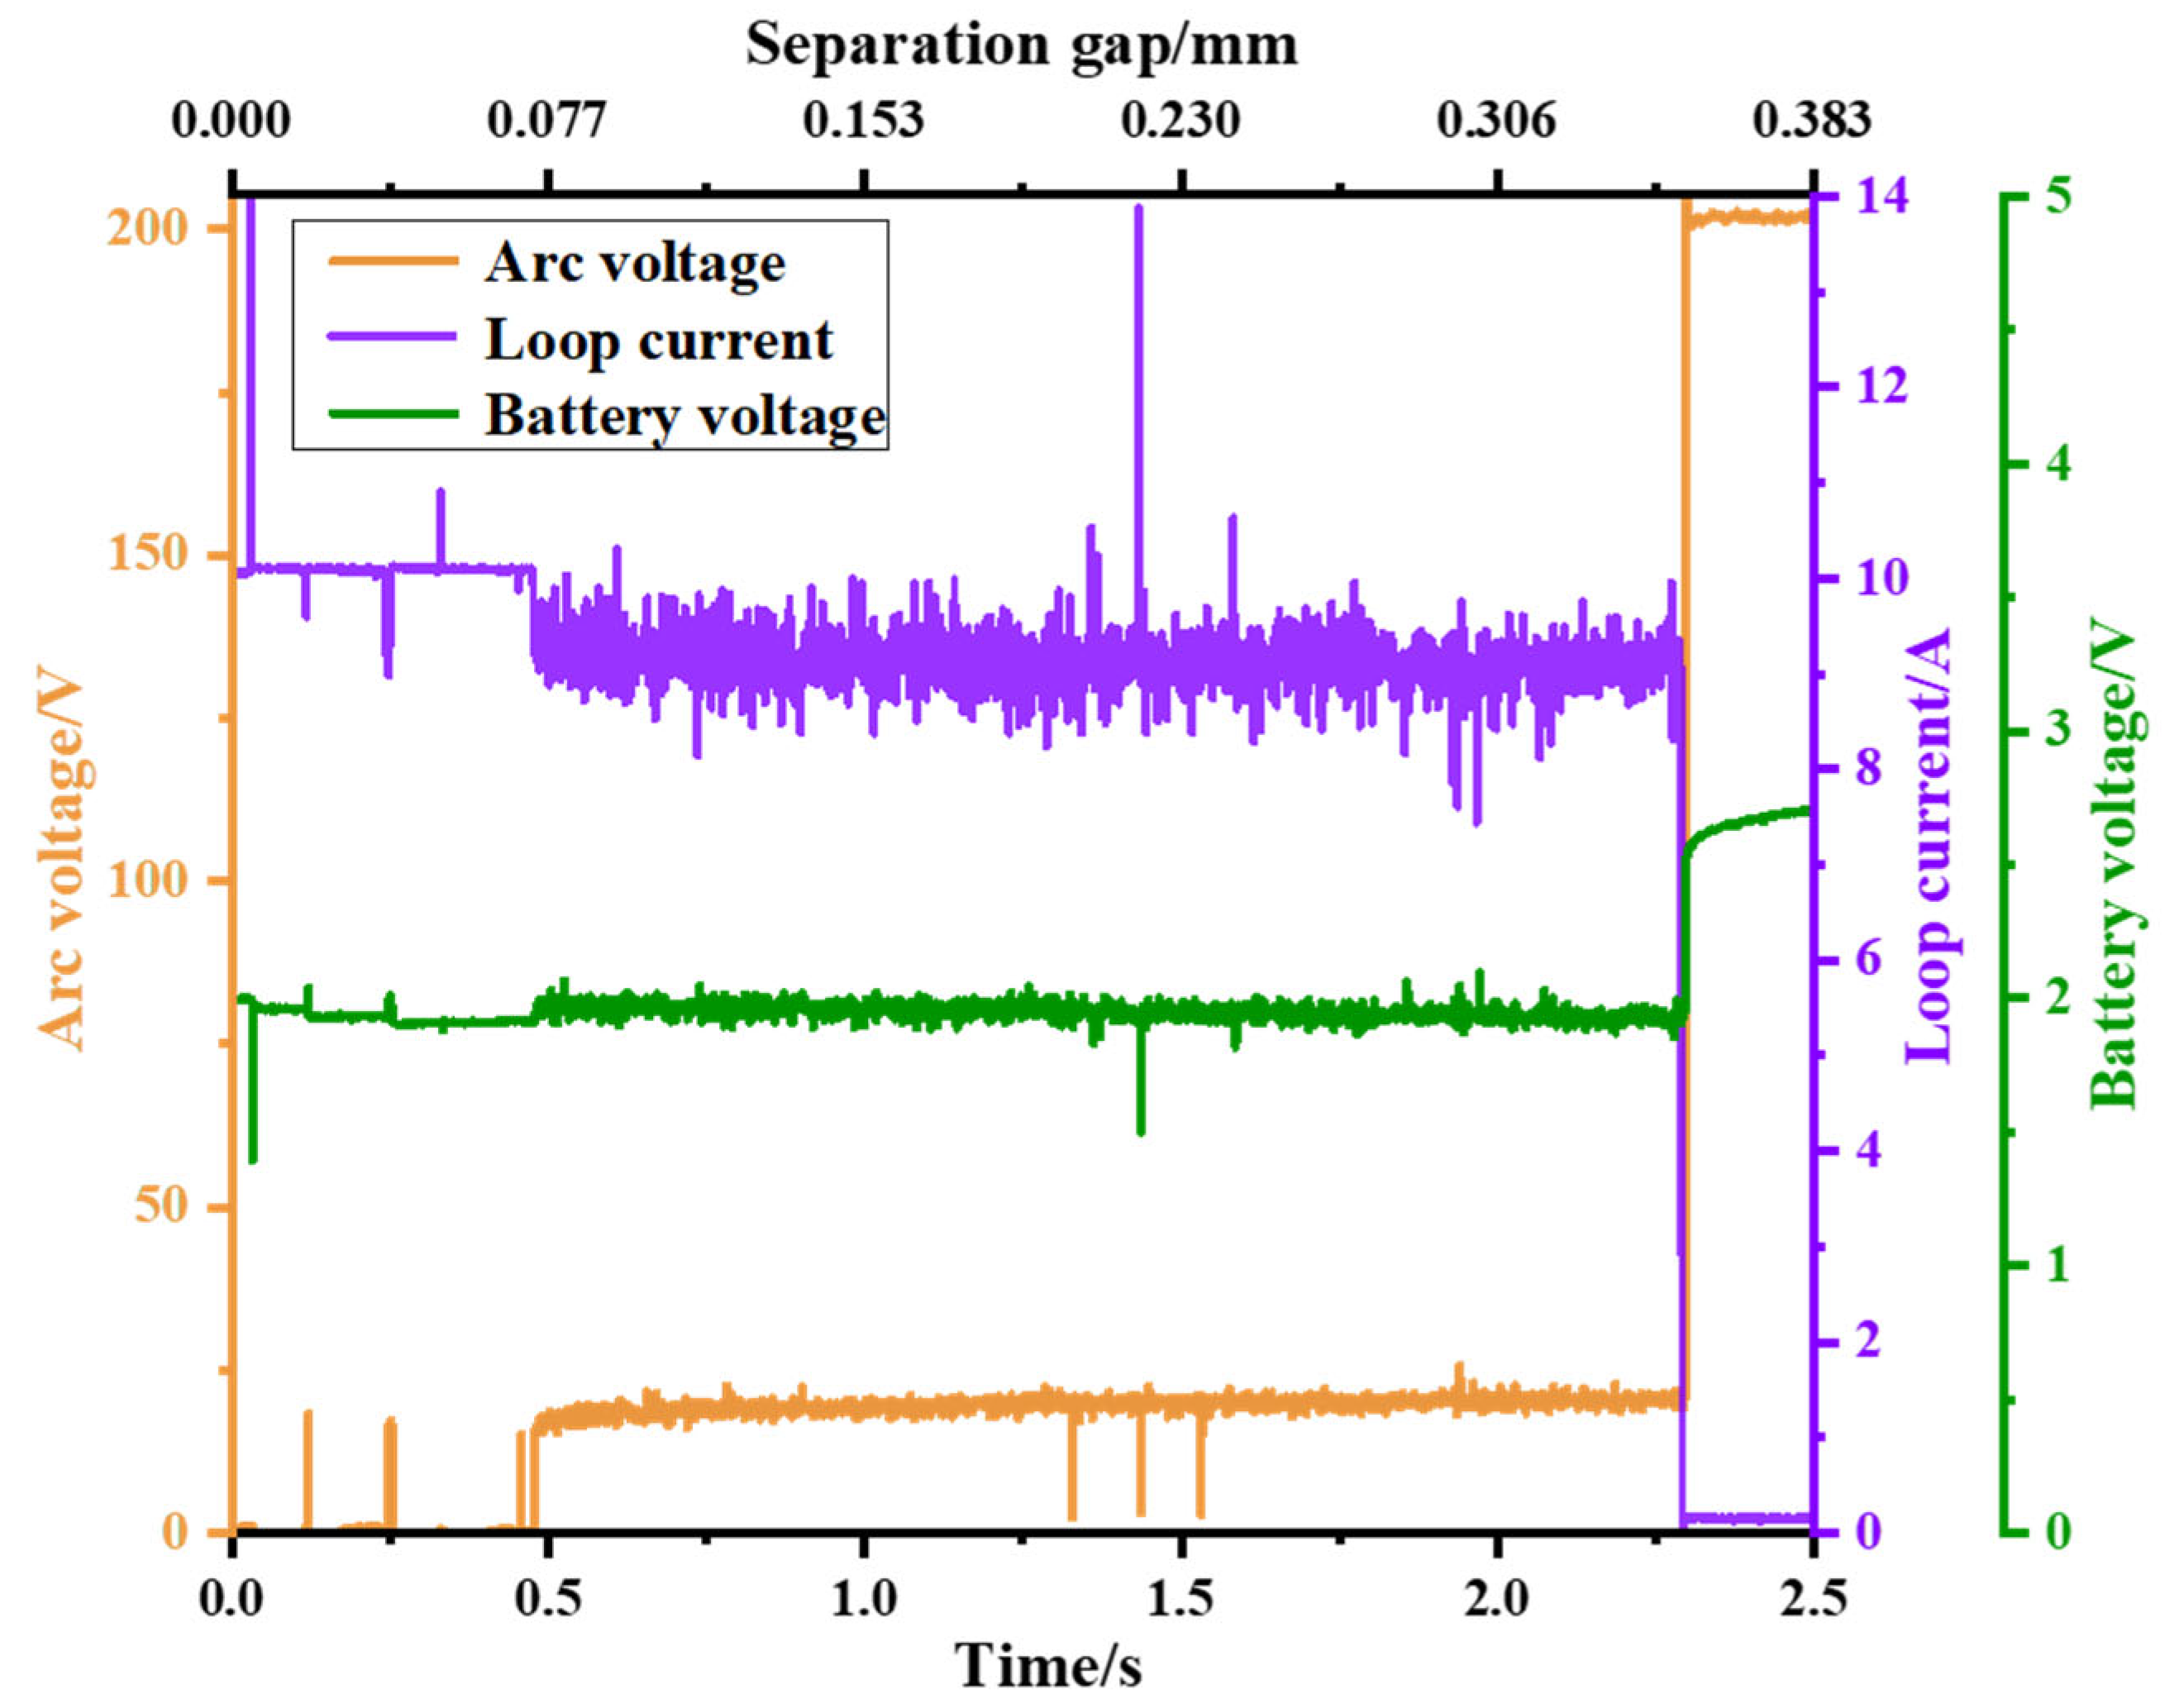
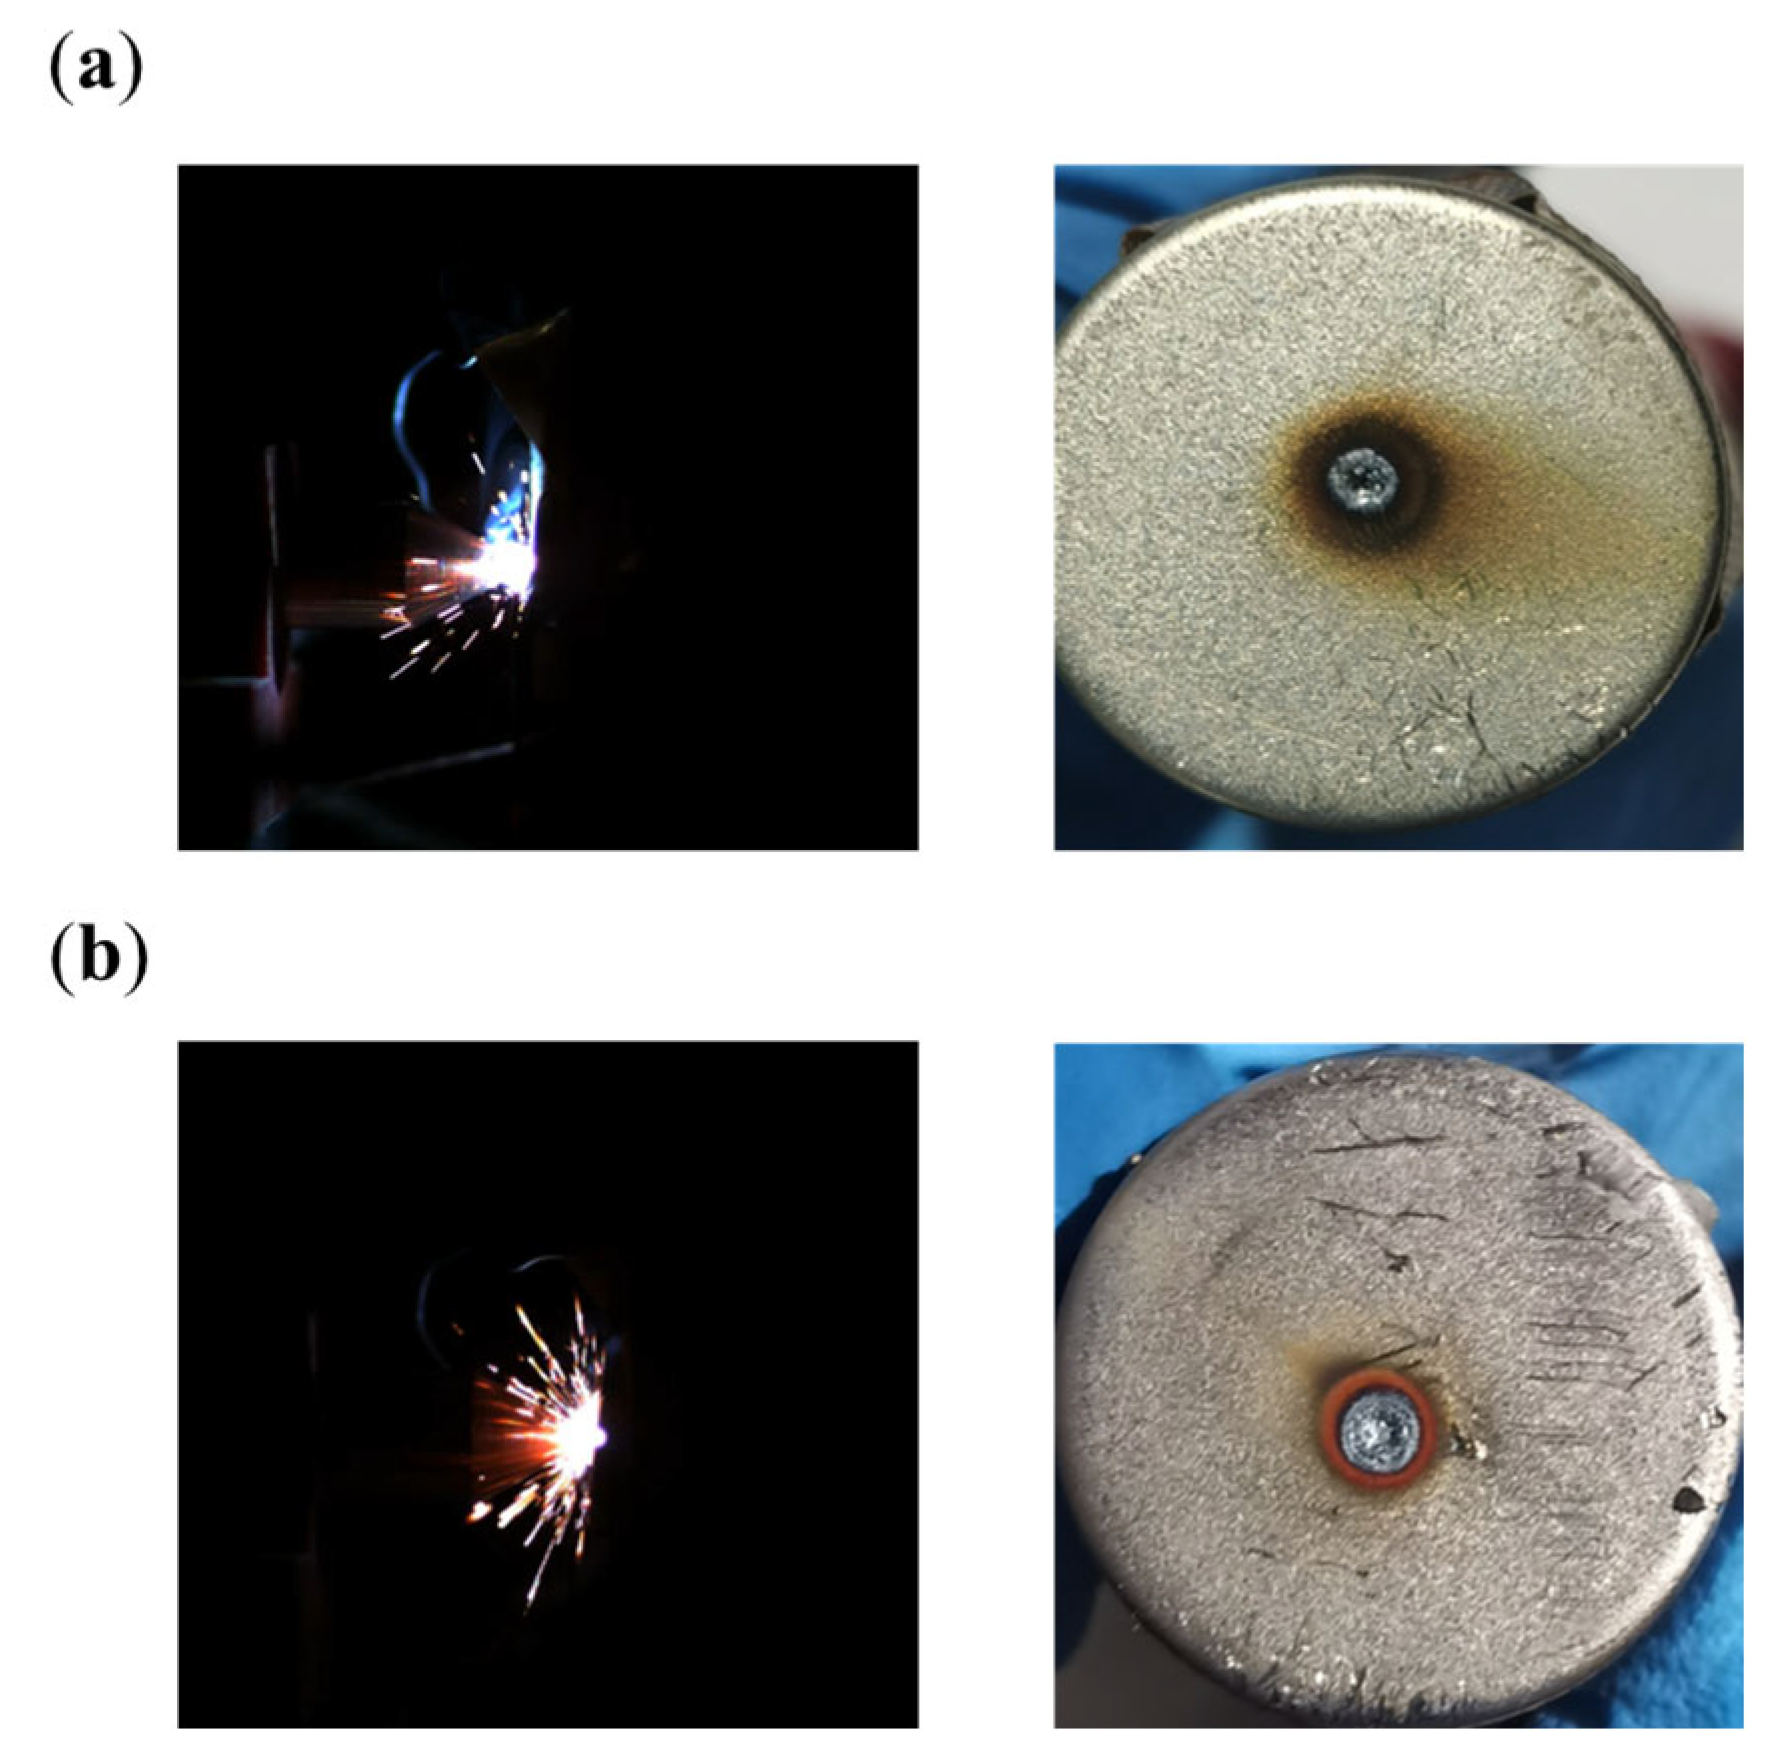
Ensure that the charging current is unchanged, the arc voltage is about 15 V under different supply voltage conditions, and the arc voltage and charging current are linearly changing with the separation gap. Under the discharge current of 10 A, the arc voltage is about 18 V, and the arc voltage also changes linearly with the separation distance. However, compared with the charging condition, the arc fault under the discharging condition is more intense, and the slope of the arc voltage is increased; at the same time, the arc erosion area on the battery surface is increased. The effects of battery disasters caused by arc faults are manifested in case of breakdown and electrolyte leakage, and the main reason for these disasters is the effect of the high arc temperature.
(3)
By comparing and analyzing the simulation results with the experimental data, it was observed that the voltage error at both ends of the arc was less than ±0.14 V, and the temperature error was less than 3%. This validates the accuracy of the battery arc simulation model.

Author Contributions

Conceptualization, B.G.; methodology, C.D., B.G. and Y.L.; software, B.G.; validation, C.D., B.G. and Y.L.; writing—original draft preparation, C.D., B.G. and X.W.; writing—review and editing, C.D., Y.L. and X.W.; visualization, C.D., Y.L. and X.W.; supervision, C.D., Y.L. and X.W.; project administration, Y.L. and X.W.; funding acquisition, C.D. All authors have read and agreed to the published version of the manuscript.

Funding

This work was supported by the National Natural Science Foundation of China (Grant No. 52207241 and No. 52277214) and funded by the China National Postdoctoral Program for Innovative Talents (grant no. BX20220171).

Data Availability Statement

Data are contained within the article.

Acknowledgments

The authors would like to thank Wenqiang Xu for his great support.

Conflicts of Interest

The authors declare no conflicts of interest.

References

  1. Yu, W.H.; Guo, Y.; Shang, Z.; Zhang, Y.C.; Xu, S.M. A review on comprehensive recycling of spent power lithium-ion battery in China. eTransportation 2022, 11, 100155. (In English) [Google Scholar] [CrossRef]
  2. Li, Y.; Wei, Y.; Zhu, F.; Du, J.; Zhao, Z.; Ouyang, M. The path enabling storage of renewable energy toward carbon neutralization in China. eTransportation 2023, 16, 100226. [Google Scholar] [CrossRef]
  3. Zhou, W.; Liu, Z.; An, Y.; Luo, M.; Zhang, X.; Song, S.; Li, C.; Liu, Z.; Gao, Y.; Zhang, H.; et al. Thermal behavior analysis of lithium-ion capacitors at transient high discharge rates. J. Energy Storage 2022, 53, 105208. [Google Scholar] [CrossRef]
  4. Wassiliadis, N.; Steinsträter, M.; Schreiber, M.; Rosner, P.; Nicoletti, L.; Schmid, F.; Lienkamp, M. Quantifying the state of the art of electric powertrains in battery electric vehicles: Range, efficiency, and lifetime from component to system level of the Volkswagen ID.3. eTransportation 2022, 12, 100167. (In English) [Google Scholar] [CrossRef]
  5. Yin, H.; Ma, S.; Li, H.; Wen, G.; Santhanagopalan, S.; Zhang, C. Modeling strategy for progressive failure prediction in lithium-ion batteries under mechanical abuse. eTransportation 2021, 7, 100098. [Google Scholar] [CrossRef]
  6. Chen, Q.; Chen, X.; Li, Z. A fast numerical method with non-iterative source term for pseudo-two-dimension lithium-ion battery model. J. Power Sources 2023, 577, 233258. [Google Scholar] [CrossRef]
  7. Xu, W.Q.; Wu, X.G.; Li, Y.L.; Wang, H.W.; Lu, L.G.; Ouyang, M.G. A comprehensive review of DC arc faults and their mechanisms, detection, early warning strategies, and protection in battery systems. Renew. Sustain. Energy Rev. 2023, 186, 113674. (In English) [Google Scholar] [CrossRef]
  8. Zhou, W.; Liu, Z.; Chen, W.; Zhang, X.; Sun, X.; Luo, M.; Ma, Y. Thermal characteristics of pouch lithium–ion battery capacitors based on activated carbon and LiNi1/3Co1/3Mn1/3O2. J. Energy Storage 2023, 66, 107474. [Google Scholar] [CrossRef]
  9. Hastings, J.K.; Juds, M.A.; Luebke, C.J.; Pahl, B. A study of ignition time for materials exposed to DC arcing in PV systems. In Proceedings of the 2011 37th IEEE Photovoltaic Specialists Conference (PVSC 2011), Seattle, WA, USA, 19–24 June 2011; pp. 003724–003729. (In English). [Google Scholar]
  10. Zhang, Z.Y.; Nie, Y.M.; Lee, W.J. Arc Voltage Characteristics of Medium-Low Voltage Arc Fault in Short Gaps. In Proceedings of the 53rd Annual Meeting of the IEEE-Industry-Applications-Society (IAS), Portland, OR, USA, 23–27 September 2018; IEEE: Portland, OR, USA; New York, NY, USA, 2018. [Google Scholar]
  11. Li, Y.L.; Feng, X.N.; Ren, D.S.; Ouyang, M.G.; Lu, L.G.; Han, X.B. Thermal Runaway Triggered by Plated Lithium on the Anode after Fast Charging. Acs Appl. Mater. Interfaces 2019, 11, 46839–46850. (In English) [Google Scholar] [CrossRef]
  12. Xie, W.; Liu, X.; He, R.; Li, Y.; Gao, X.; Li, X.; Peng, Z.; Feng, S.; Feng, X.; Yang, S. Challenges and opportunities toward fast-charging of lithium-ion batteries. J. Energy Storage 2020, 32, 101837. (In English) [Google Scholar] [CrossRef]
  13. Zhou, W.; Liu, Z.; Chen, W.; Sun, X.; Luo, M.; Zhang, X.; Li, C.; An, Y.; Song, S.; Wang, K.; et al. A Review on Thermal Behaviors and Thermal Management Systems for Supercapacitors. Batteries 2023, 9, 128. (In English) [Google Scholar] [CrossRef]
  14. Abdullah, Y.; Shaffer, J.; Hu, B.; Hall, B.; Wang, J.G.; Emrani, A.; Arfaei, B. Hurst-Exponent-Based Detection of High-Impedance DC Arc Events for 48-V Systems in Vehicles. IEEE Trans. Power Electron. 2021, 36, 3803–3813. (In English) [Google Scholar] [CrossRef]
  15. Augeard, A.; Singo, T.; Desprez, P.; Abbaoui, M. Contribution to the Study of Electric Arcs in Lithium-Ion Batteries. IEEE Trans. Compon. Packag. Manuf. Technol. 2016, 6, 1068–1078. (In English) [Google Scholar] [CrossRef]
  16. Shigeta, M.; Tanaka, M. Visualization of electromagnetic-thermal-fluid phenomena in arc welding. Jpn. J. Appl. Phys. 2020, 59, Sa0805. (In English) [Google Scholar] [CrossRef]
  17. Chu, R.B.; Schweitzer, P.; Zhang, R.C. Series AC Arc Fault Detection Method Based on High-Frequency Coupling Sensor and Convolution Neural Network. Sensors 2020, 20, 4910. (In English) [Google Scholar] [CrossRef] [PubMed]
  18. Cui, R.; Wang, C.; Wang, Y. Application of VMD-ApEn in aviation AC series arc fault detection. Electr. Mach. Control. 2020, 24, 141–149. (In Chinese) [Google Scholar]
  19. Jalil, M.; Samet, H.; Ghanbari, T.; Tajdinian, M. Development of Nottingham Arc Model for DC Series Arc Modeling in Photovoltaic Panels. IEEE Trans. Ind. Electron. 2022, 69, 13647–13655. (In English) [Google Scholar] [CrossRef]
  20. Wang, Q.; Chen, S.; Meng, Y.; Yang, Q.; Li, X. Review of Research on DC Arc Fault Detection Technology in Low Voltage DC System. High Volt. Appar. 2023, 59, 93–103. (In Chinese) [Google Scholar]
  21. Marulanda-Durango, J.; Escobar-Mejía, A.; Alzate-Gómez, A.; Alvarez-López, M. A Support Vector machine-Based method for parameter estimation of an electric arc furnace model. Electr. Power Syst. Res. 2021, 196, 107228. (In English) [Google Scholar] [CrossRef]
  22. Aziz, F.; Haq, A.U.; Ahmad, S.; Mahmoud, Y.; Jalal, M.; Ali, U. A Novel Convolutional Neural Network-Based Approach for Fault Classification in Photovoltaic Arrays. IEEE Access 2020, 8, 41889–41904. (In English) [Google Scholar] [CrossRef]
  23. Huang, K.; Sun, H.; Niu, C.; Wu, Y.; Rong, M.; Yan, G.; Huang, G. Simulation of arcs for DC relay considering different impacts. Plasma Sci. Technol. 2020, 22, 024003. (In English) [Google Scholar] [CrossRef]
  24. Cao, Q.; Liu, X. Simulation Analysis and Experimental Research on Arc Motion in High Voltage DC Relay. Trans. China Electrotech. Soc. 2019, 34, 4699–4707. (In Chinese) [Google Scholar]
  25. Jiang, Y.; Li, Q.; Cui, J.; Wu, J.; Jia, B. Re-Ignition of Intermediate Frequency Vacuum Arc at Axial Magnetic Field. Trans. China Electrotech. Soc. 2020, 35, 3860–3868. (In Chinese) [Google Scholar]
  26. Wu, Q.R.; Yang, K.; Zhang, R.C.; Tu, R.; Zhou, X.J. Numerical study on instantaneous heat transfer characteristics of AC arc-fault. Aip Adv. 2021, 11, 095009. (In English) [Google Scholar] [CrossRef]
  27. Deng, Q.; Xu, P.; Zang, T.L. Simulation Analysis of DC Arc Extinguishing Characteristics of Arcing Horn. In Proceedings of the IEEE IAS Conference on Industrial and Commercial Power System Asia (IEEE I and CPS Asia), Chengdu, China, 18–21 July 2021; IEEE: New York, NY, USA; pp. 1150–1153. [Google Scholar]
  28. Huang, X.; Sun, T.; Wu, Y.; Yang, S.; Zhao, L.; Ning, W.; Wang, L. Study of vacuum arc plasma transport characteristics during the DC interrupting process. J. Phys. D-Appl. Phys. Artic. 2022, 55, 165501. (In English) [Google Scholar] [CrossRef]
  29. Hoerauf, R.; Shipp, D.D. Characteristics and applications of various arc interrupting methods. IEEE Trans. Ind. Appl. 1991, 27, 849–861. (In English) [Google Scholar] [CrossRef]
  30. Shkol’nik, S.M. Anode phenomena in arc discharges: A review. Plasma Sources Sci. Technol. 2011, 20, 013001. (In English) [Google Scholar] [CrossRef]
  31. Ammerman, R.F.; Gammon, T.; Sen, P.K.; Nelson, J.P. DC-Arc Models and Incident-Energy Calculations. Ieee Trans. Ind. Appl. 2010, 46, 1810–1819. (In English) [Google Scholar] [CrossRef]
  32. Miller, H.C. Plasma and Spot Phenomena in Electrical Arcs. IEEE Trans. Plasma Sci. 2021, 49, 4038. (In English) [Google Scholar] [CrossRef]
  33. Wang, C.; Lu, Z.S.; Li, D.N.; Xia, W.L.; Xia, W.D. Effect of the Magnetic Field on the Magnetically Stabilized Gliding Arc Discharge and Its Application in the Preparation of Carbon Black Nanoparticles. Plasma Chem. Plasma Process. 2018, 38, 1223–1238. (In English) [Google Scholar] [CrossRef]
  34. Rong, M.; Li, M.; Wu, Y.; Yang, F.; Wu, Y.; Liu, W.; Li, Y.; Chen, Z. 3-D MHD Modeling of Internal Fault Arc in a Closed Container. IEEE Trans. Power Deliv. 2017, 32, 1220–1227. (In English) [Google Scholar] [CrossRef]
Figure 1. Physical processes and voltage phenomena in the arc region.
Batteries 10 00127 g001
Figure 2. Arc simulation model for batteries under an air gap of 0.4 mm: (a) geometric model; and (b) model boundaries.
Batteries 10 00127 g002
Figure 3. Simulation results of the voltage field when the arc occurred under different air clearances: (a) 0.1 mm; (b) 0.2 mm; (c) 0.3 mm; and (d) 0.4 mm, with a circuit voltage of 200 V and a circuit current of 10 A.
Batteries 10 00127 g003
Figure 4. Arc voltage and different separation gap fitting curves when the supply voltage is 200 V and the circuit current is 10 A.
Batteries 10 00127 g004
Figure 5. Simulation results of the arc phenomenon under a voltage of 200 V and a circuit current of 10 A with a gap of 0.4 mm: (a) electric field; (b) magnetic field; (c) temperature field; and (d) flow field.
Batteries 10 00127 g005
Figure 6. Schematic diagram of the battery arc fault experimental platform: (a) main circuit; and (b) arc generation device.
Batteries 10 00127 g006
Figure 7. The experimental measurement results of the arc voltage, circuit current, and battery voltage under the conditions of a power supply voltage of 200 V and a charging circuit current of 10 A.
Batteries 10 00127 g007
Figure 8. The experimental data of the arc voltage and current under the setting of 200 V + 10 A: (a) the correlation of the arc voltage and separation clearance; and (b) the correlation of the circuit current and separation clearance.
Batteries 10 00127 g008
Figure 9. The variation of the arc voltage and the measured temperature at the position of 6 mm away from the arc generation point on the surface of the battery’s negative electrode.
Batteries 10 00127 g009
Figure 10. Damage to the battery caused by the arc.
Batteries 10 00127 g010
Figure 11. Arc voltage, loop current, battery voltage, and arc traces under the experiment setting with 10 A charging current and different circuit supply voltages: (a) 300 V; and (b) 400 V.
Batteries 10 00127 g011
Figure 12. The experimental data of the arc voltage and current under different experimental settings: (a) the variation of the arc voltage with the separation distance under 300 V + 10 A; (b) the variation of the circuit current with the separation distance under 300 V + 10 A; (c) the variation of the arc voltage with the separation distance under 400 V + 10 A; and (d) the variation of the circuit current with the separation distance under 400 V + 10 A.
Batteries 10 00127 g012
Figure 13. The variation of the arc voltage and the measured temperature at the position 6 mm away from the arc generation point on the surface of the battery negative electrode. Different circuit voltage conditions are compared: (a) 300 V; and (b) 400 V.
Batteries 10 00127 g013
Figure 14. Arc voltage, loop current, and battery voltage under the experimental setting with a 10 A charging current and 200 V supply voltages.
Batteries 10 00127 g014
Figure 15. Arc traces under a circuit voltage of 200 V with different current direction: (a) charging; and (b) discharging.
Batteries 10 00127 g015
Figure 16. The experimental result of the arc voltage with the separation clearance under the setting of 200 V + 10 A.
Batteries 10 00127 g016
Figure 17. The comparison of the simulated and experimental temperature at the position of 6 mm away from the arc generation point on the surface of the battery’s negative pole. Different circuit voltage and separation distance are examined with (a) 200 V + 0.4 mm; (b) 300 V + 0.3 mm; and (c) 400 V + 0.3 mm.
Batteries 10 00127 g017
Table 1. Parameters of each physical property of the material in the numerical model.
ParametersNumerical Values
Copper density/(kg/m3)8940
Copper thermal conductivity/[W/(m·K)]400
Copper constant pressure heat capacity/[J/(kg·K)]385
Copper conductivity/[S/m]5.998 × 107
Steel density/(kg/m3)7850
Thermal conductivity of steel/[W/(m·K)]44.5
Steel constant pressure heat capacity/[J/(kg·K)]475
Steel conductivity/(S/m)4.032 × 106
Initial air temperature/K300
Initial ambient pressure/Pa1.01 × 105
Table 2. Parameters of the battery cell.
EquipmentParameters
Brand21,700
Positive electrode materialTernary
Capacity (Ah)4.8
Dimensions (mm)21 × 70
Internal resistance of the battery (mΩ)45.6 mΩ
Top coverCopper
CasingSteel
Table 3. Initial operating settings.
ParametersPreset Values
Arc generation locationThe center of negative terminal on the battery casing
Power supply voltage Udc (V)200, 300, 400
Electronic load R (Ω)20–40 Ω
Moving speed v (mm/s)0.153
Separation gap L (mm)0.5
Electrode separation time t (s)3.3
High-speed camera frame rate (frames/s)1000
High-speed data sampling frequency (KS/s)1
Disclaimer/Publisher’s Note: The statements, opinions and data contained in all publications are solely those of the individual author(s) and contributor(s) and not of MDPI and/or the editor(s). MDPI and/or the editor(s) disclaim responsibility for any injury to people or property resulting from any ideas, methods, instructions or products referred to in the content.

