
Investigation on Thermal Runaway Hazards of Cylindrical and Pouch Lithium-Ion Batteries under Low Pressure of Cruise Altitude for Civil Aircraft
 , , ,
, , ,
Abstract
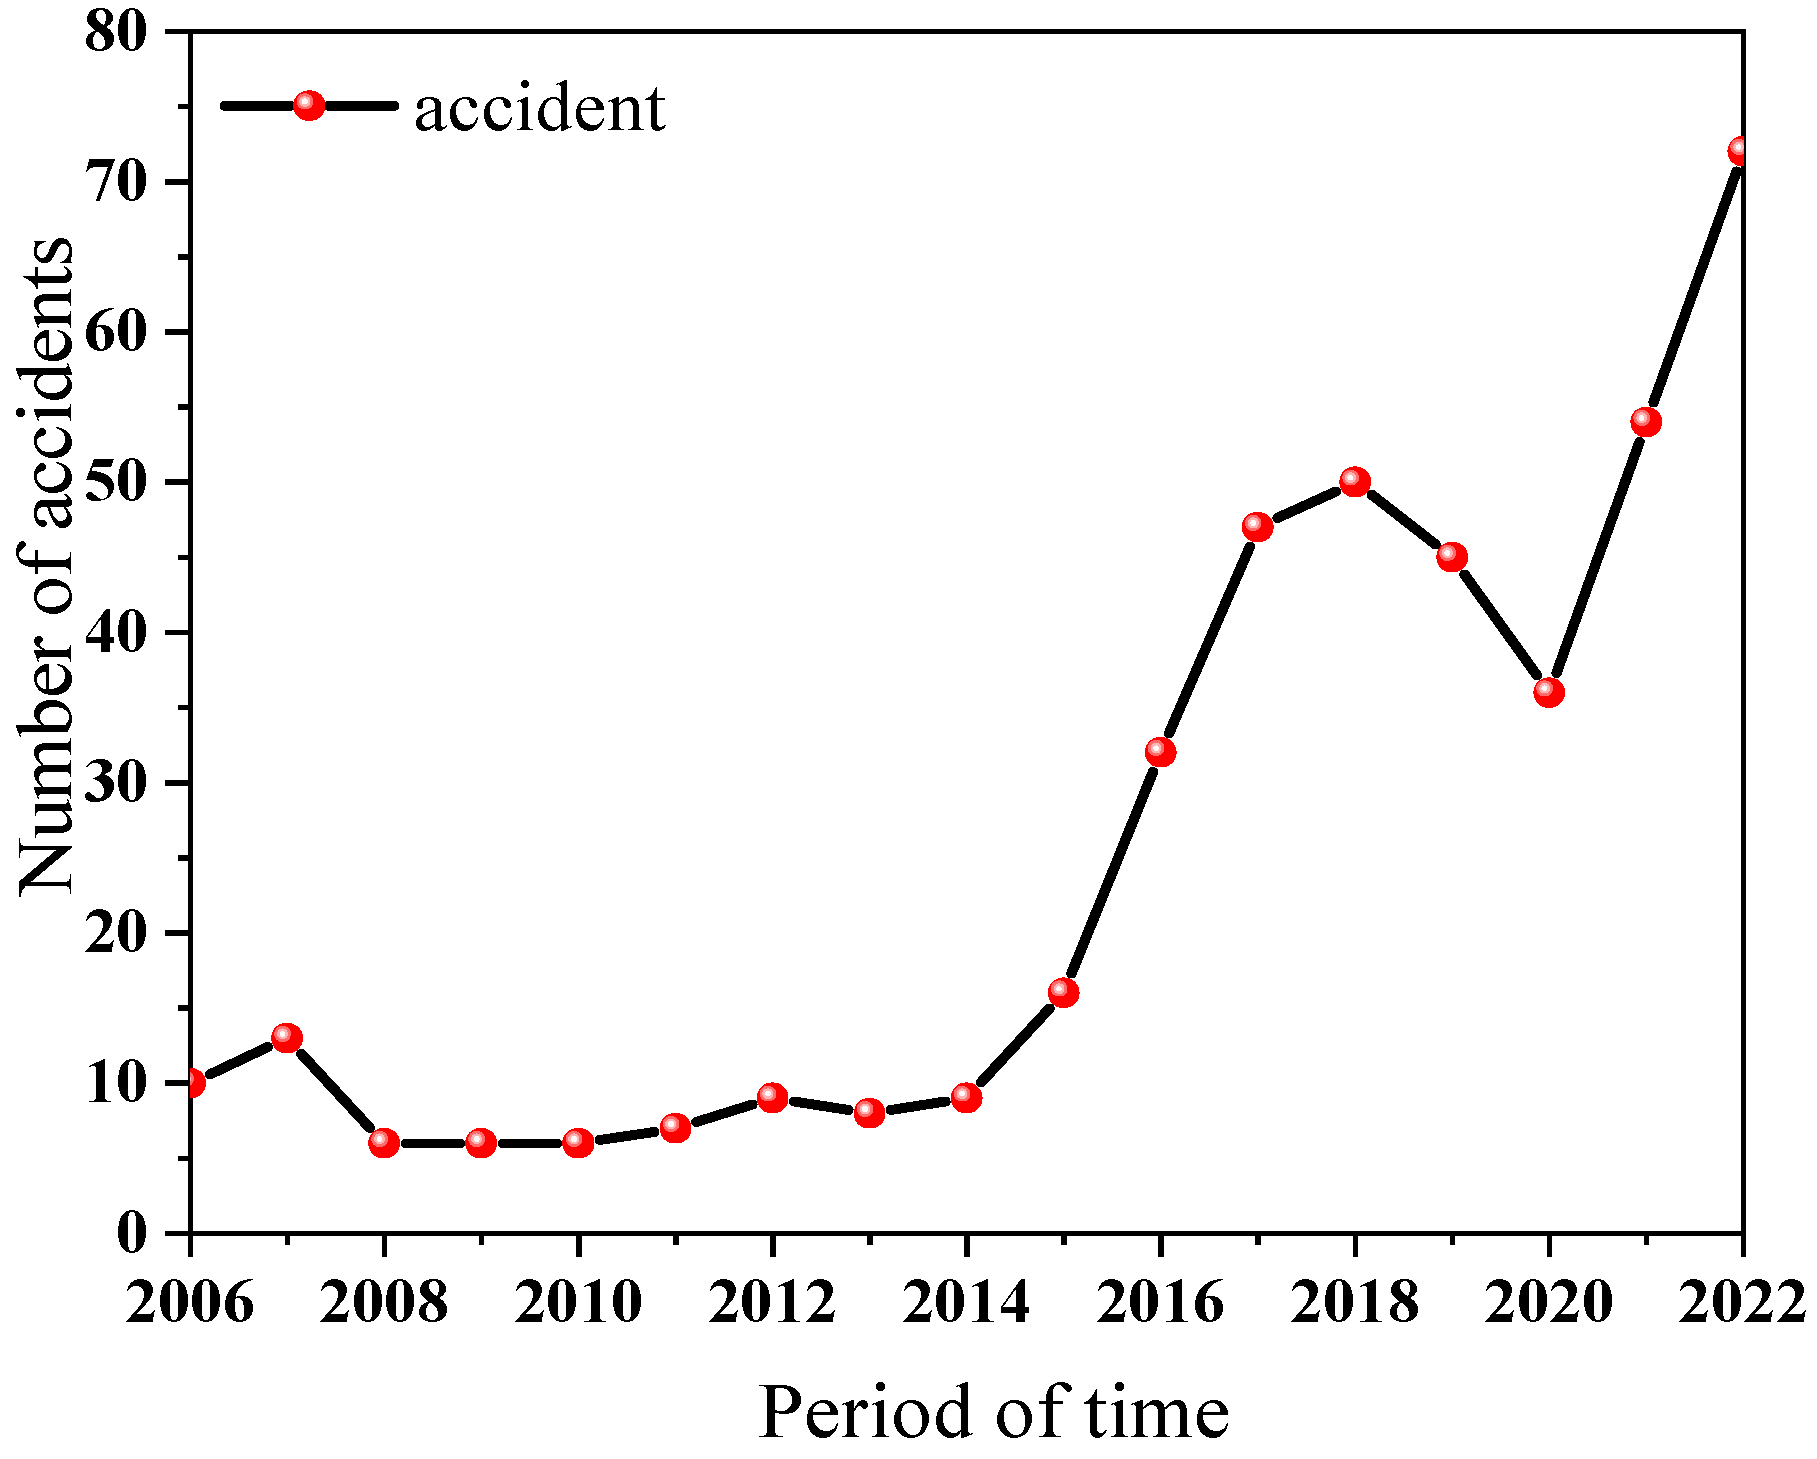
:1. Introduction
2. Experimental
2.1. Sample
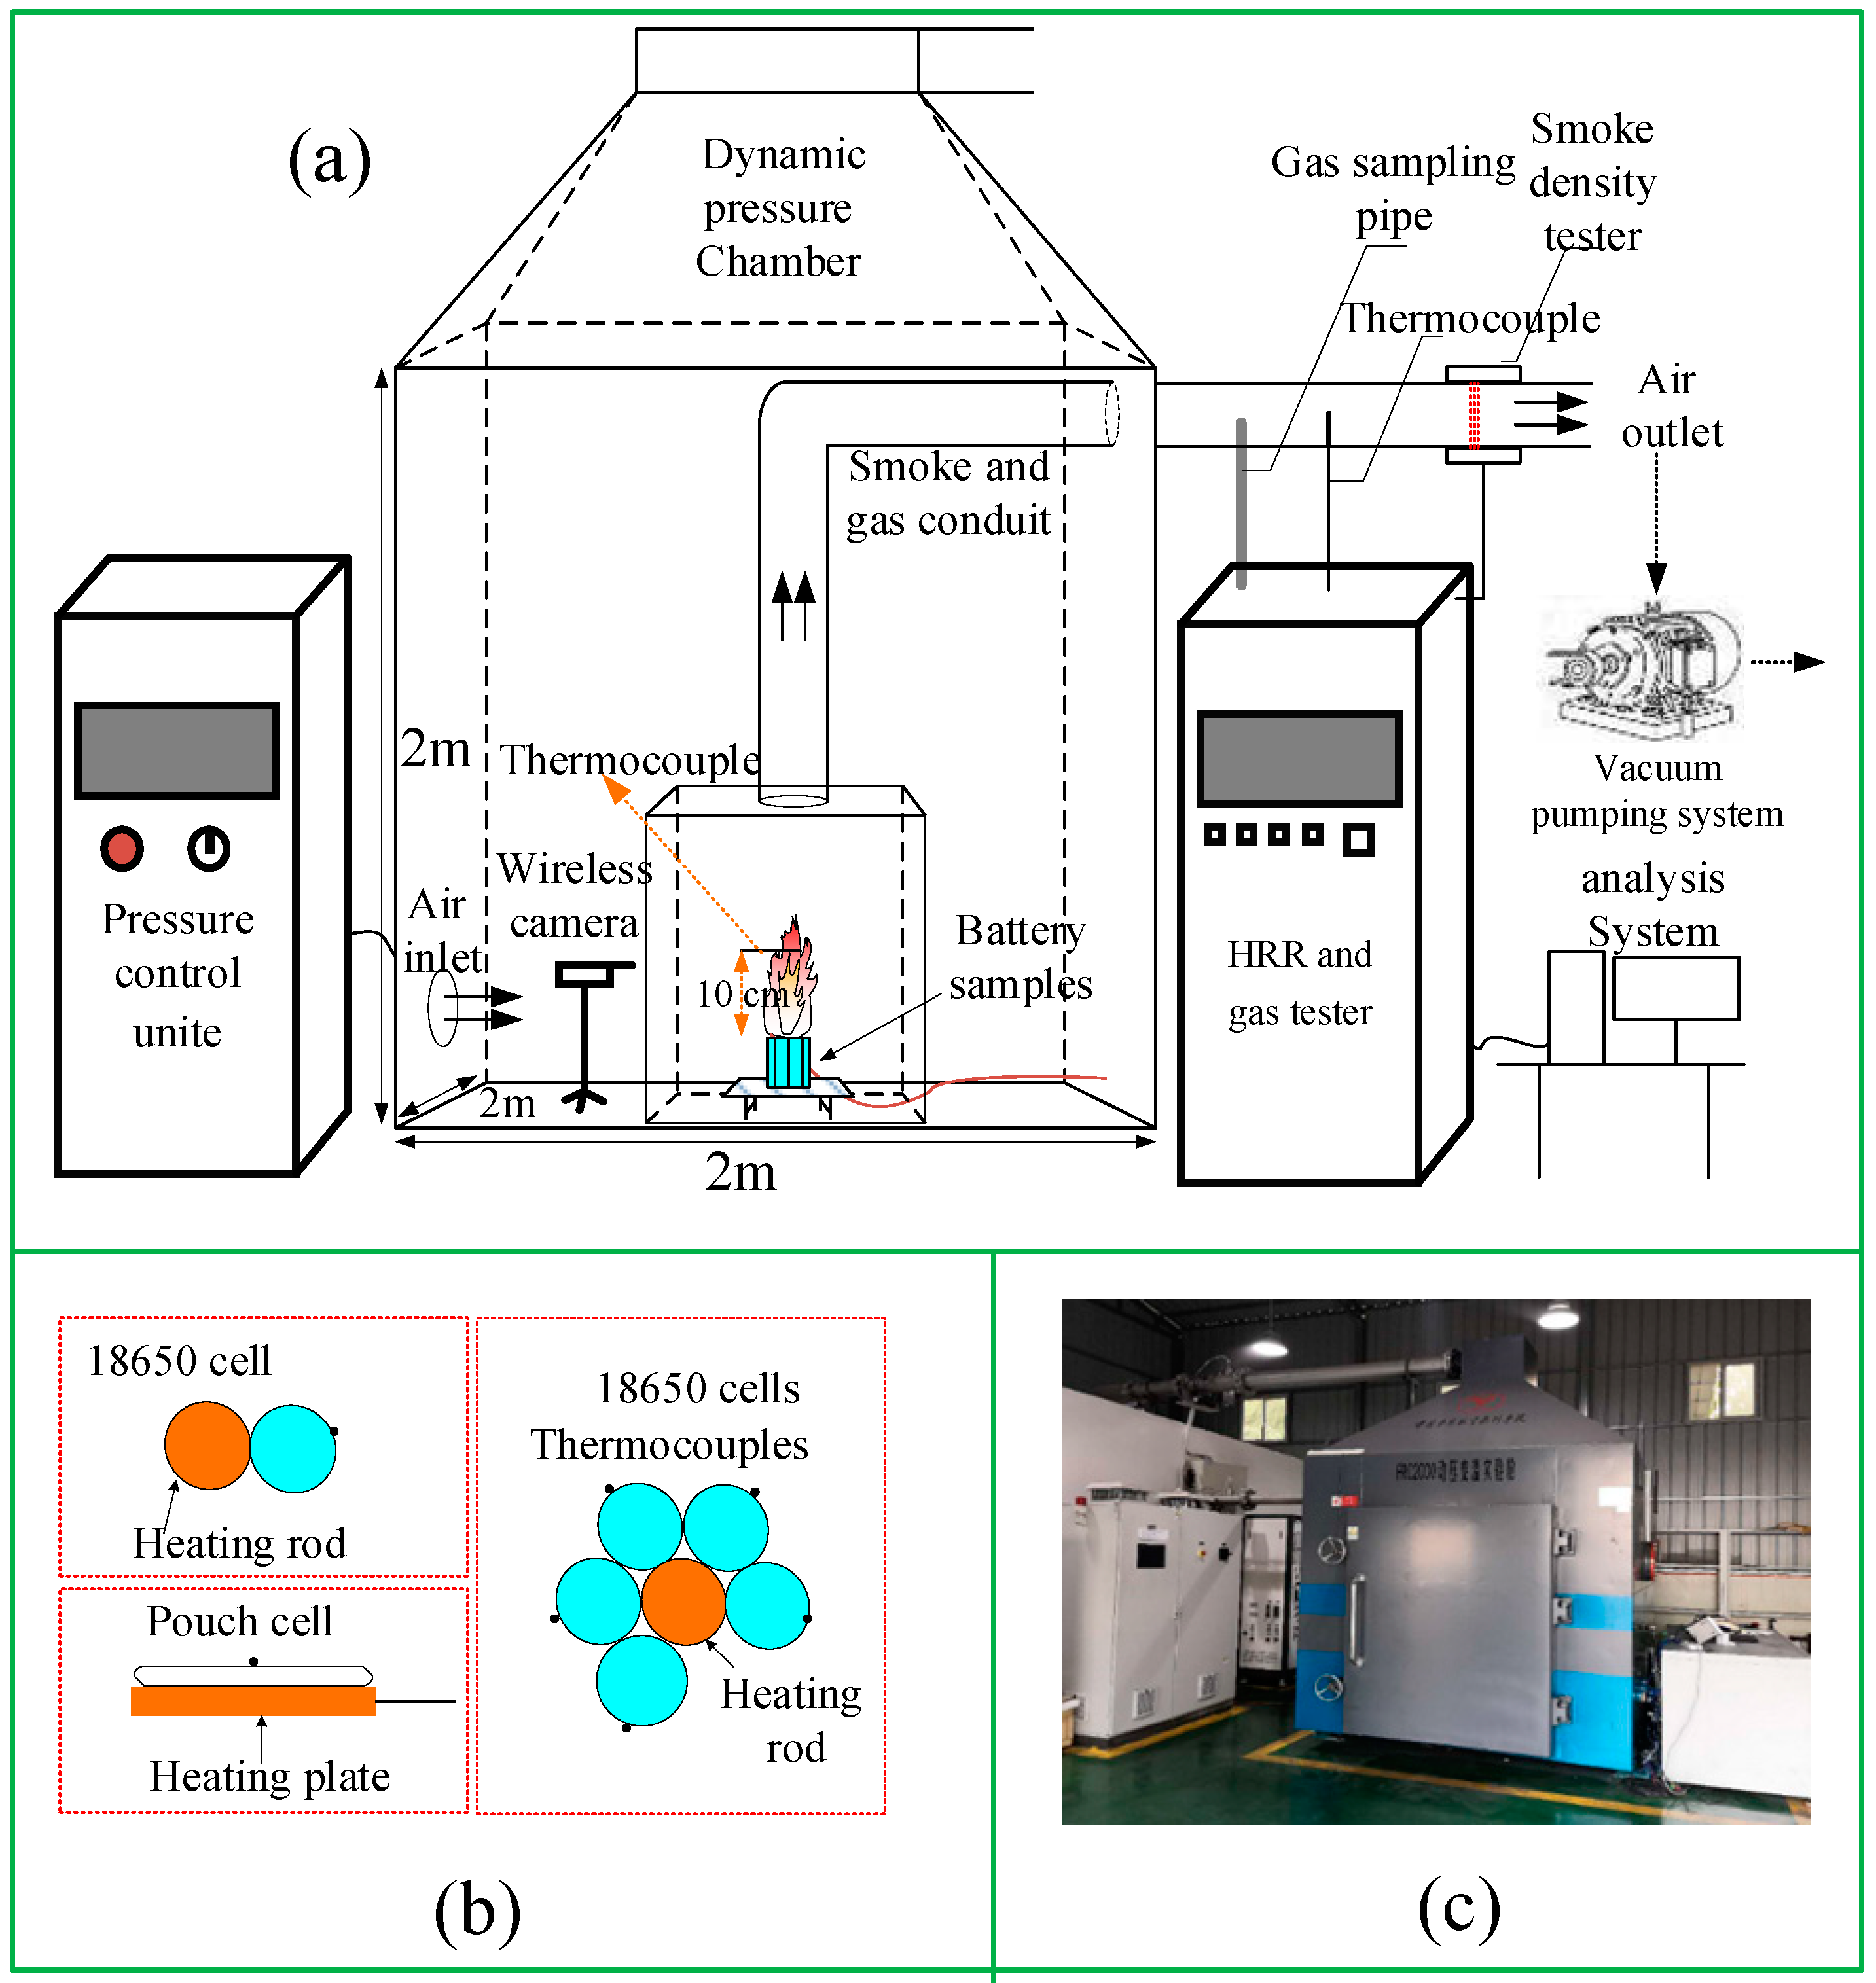
2.2. Apparatus
2.3. Procedures
3. Results and Discussion
3.1. Thermal Runaway Behaviors
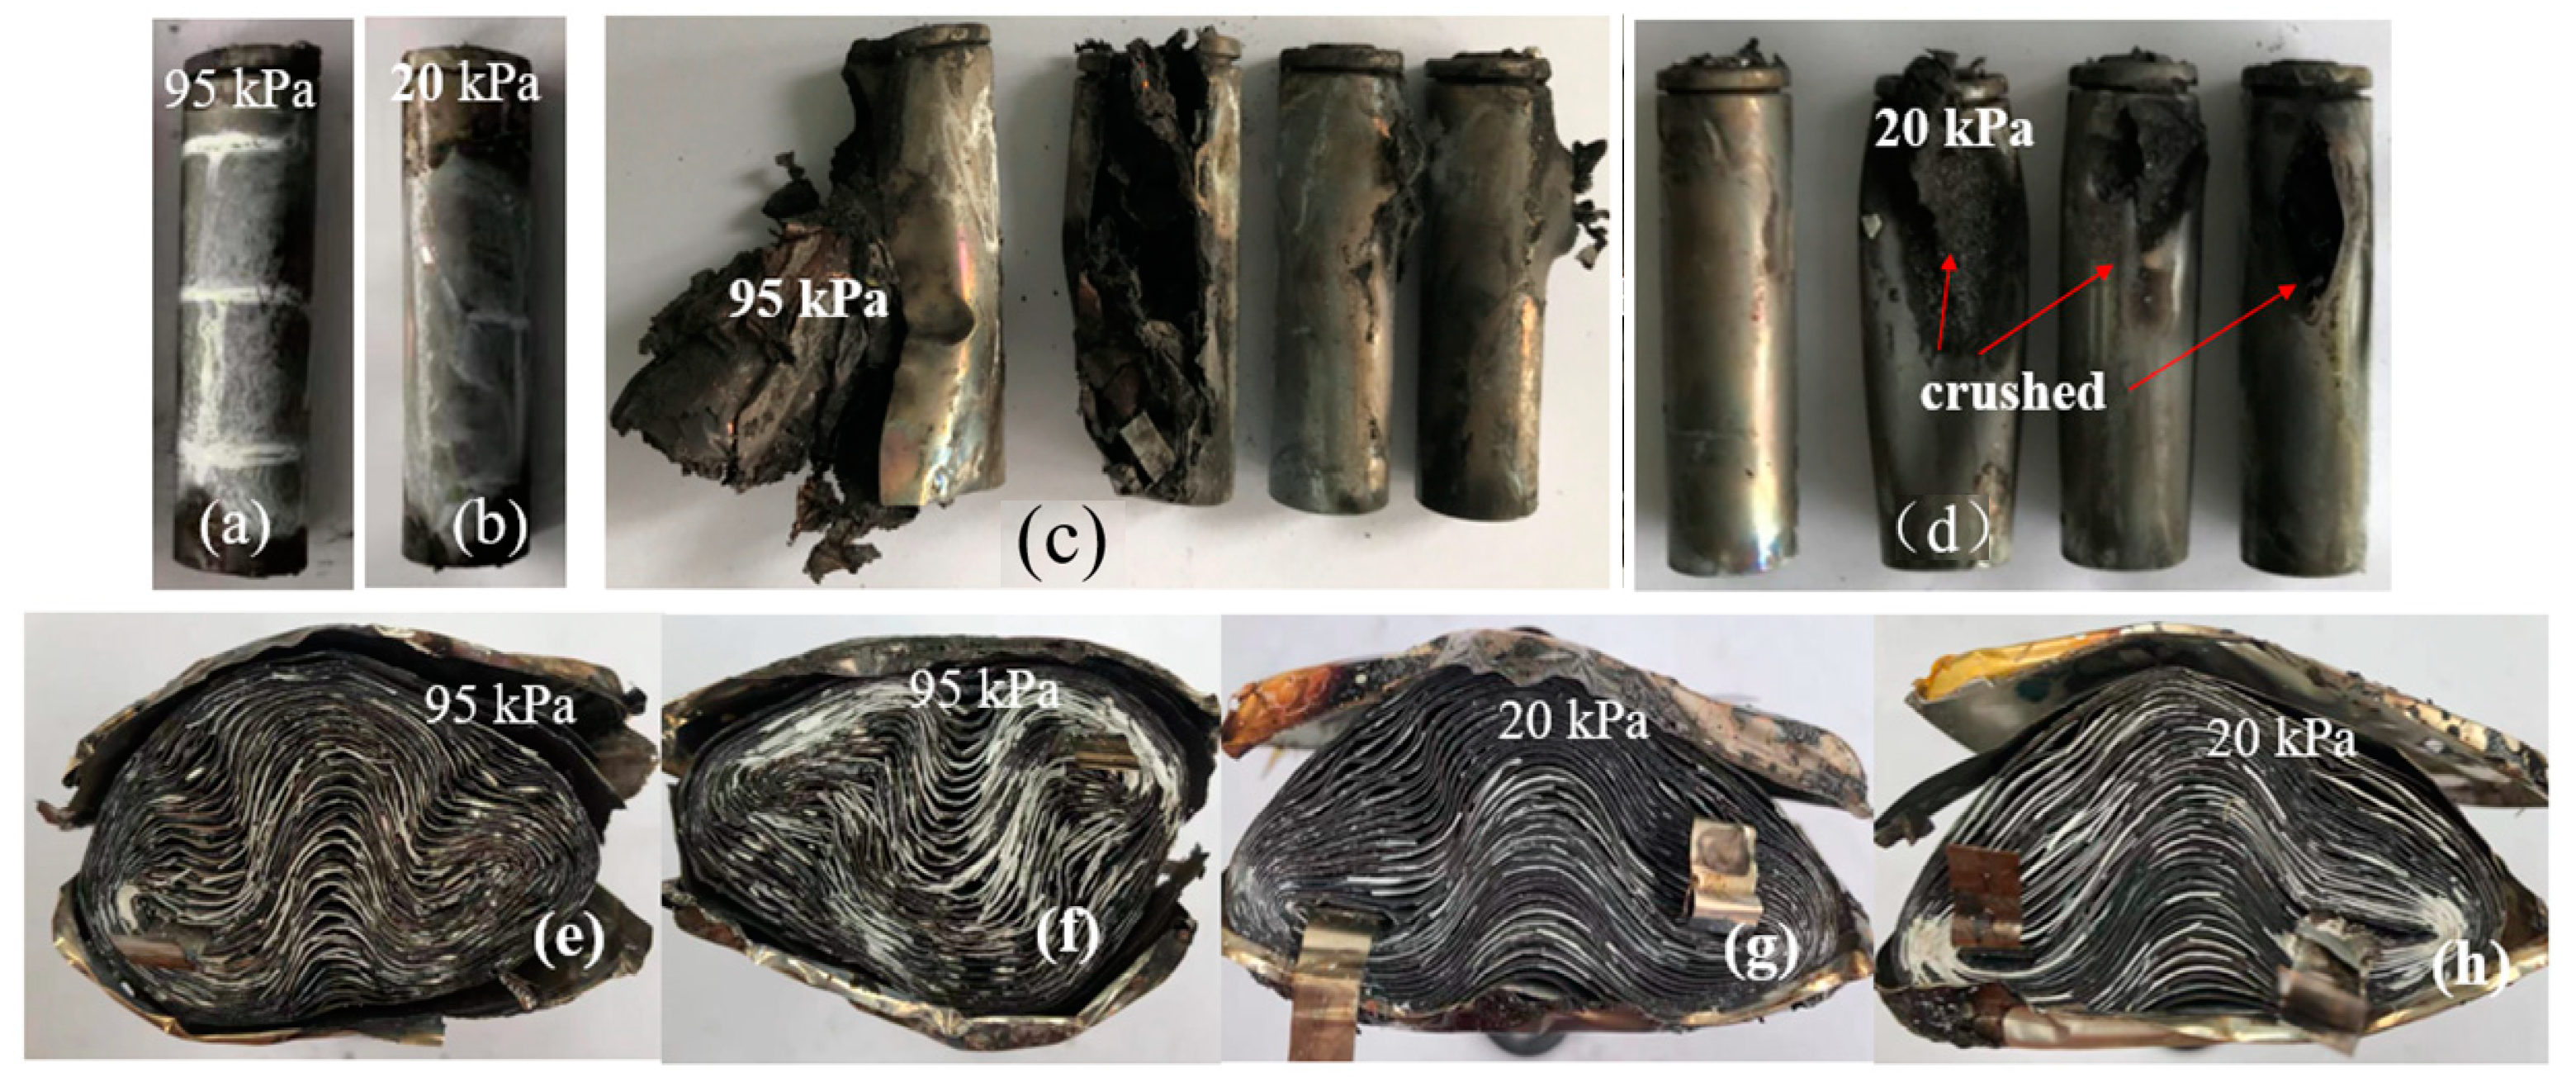
3.1.1. Cylindrical Cells
3.1.2. Pouch Cells
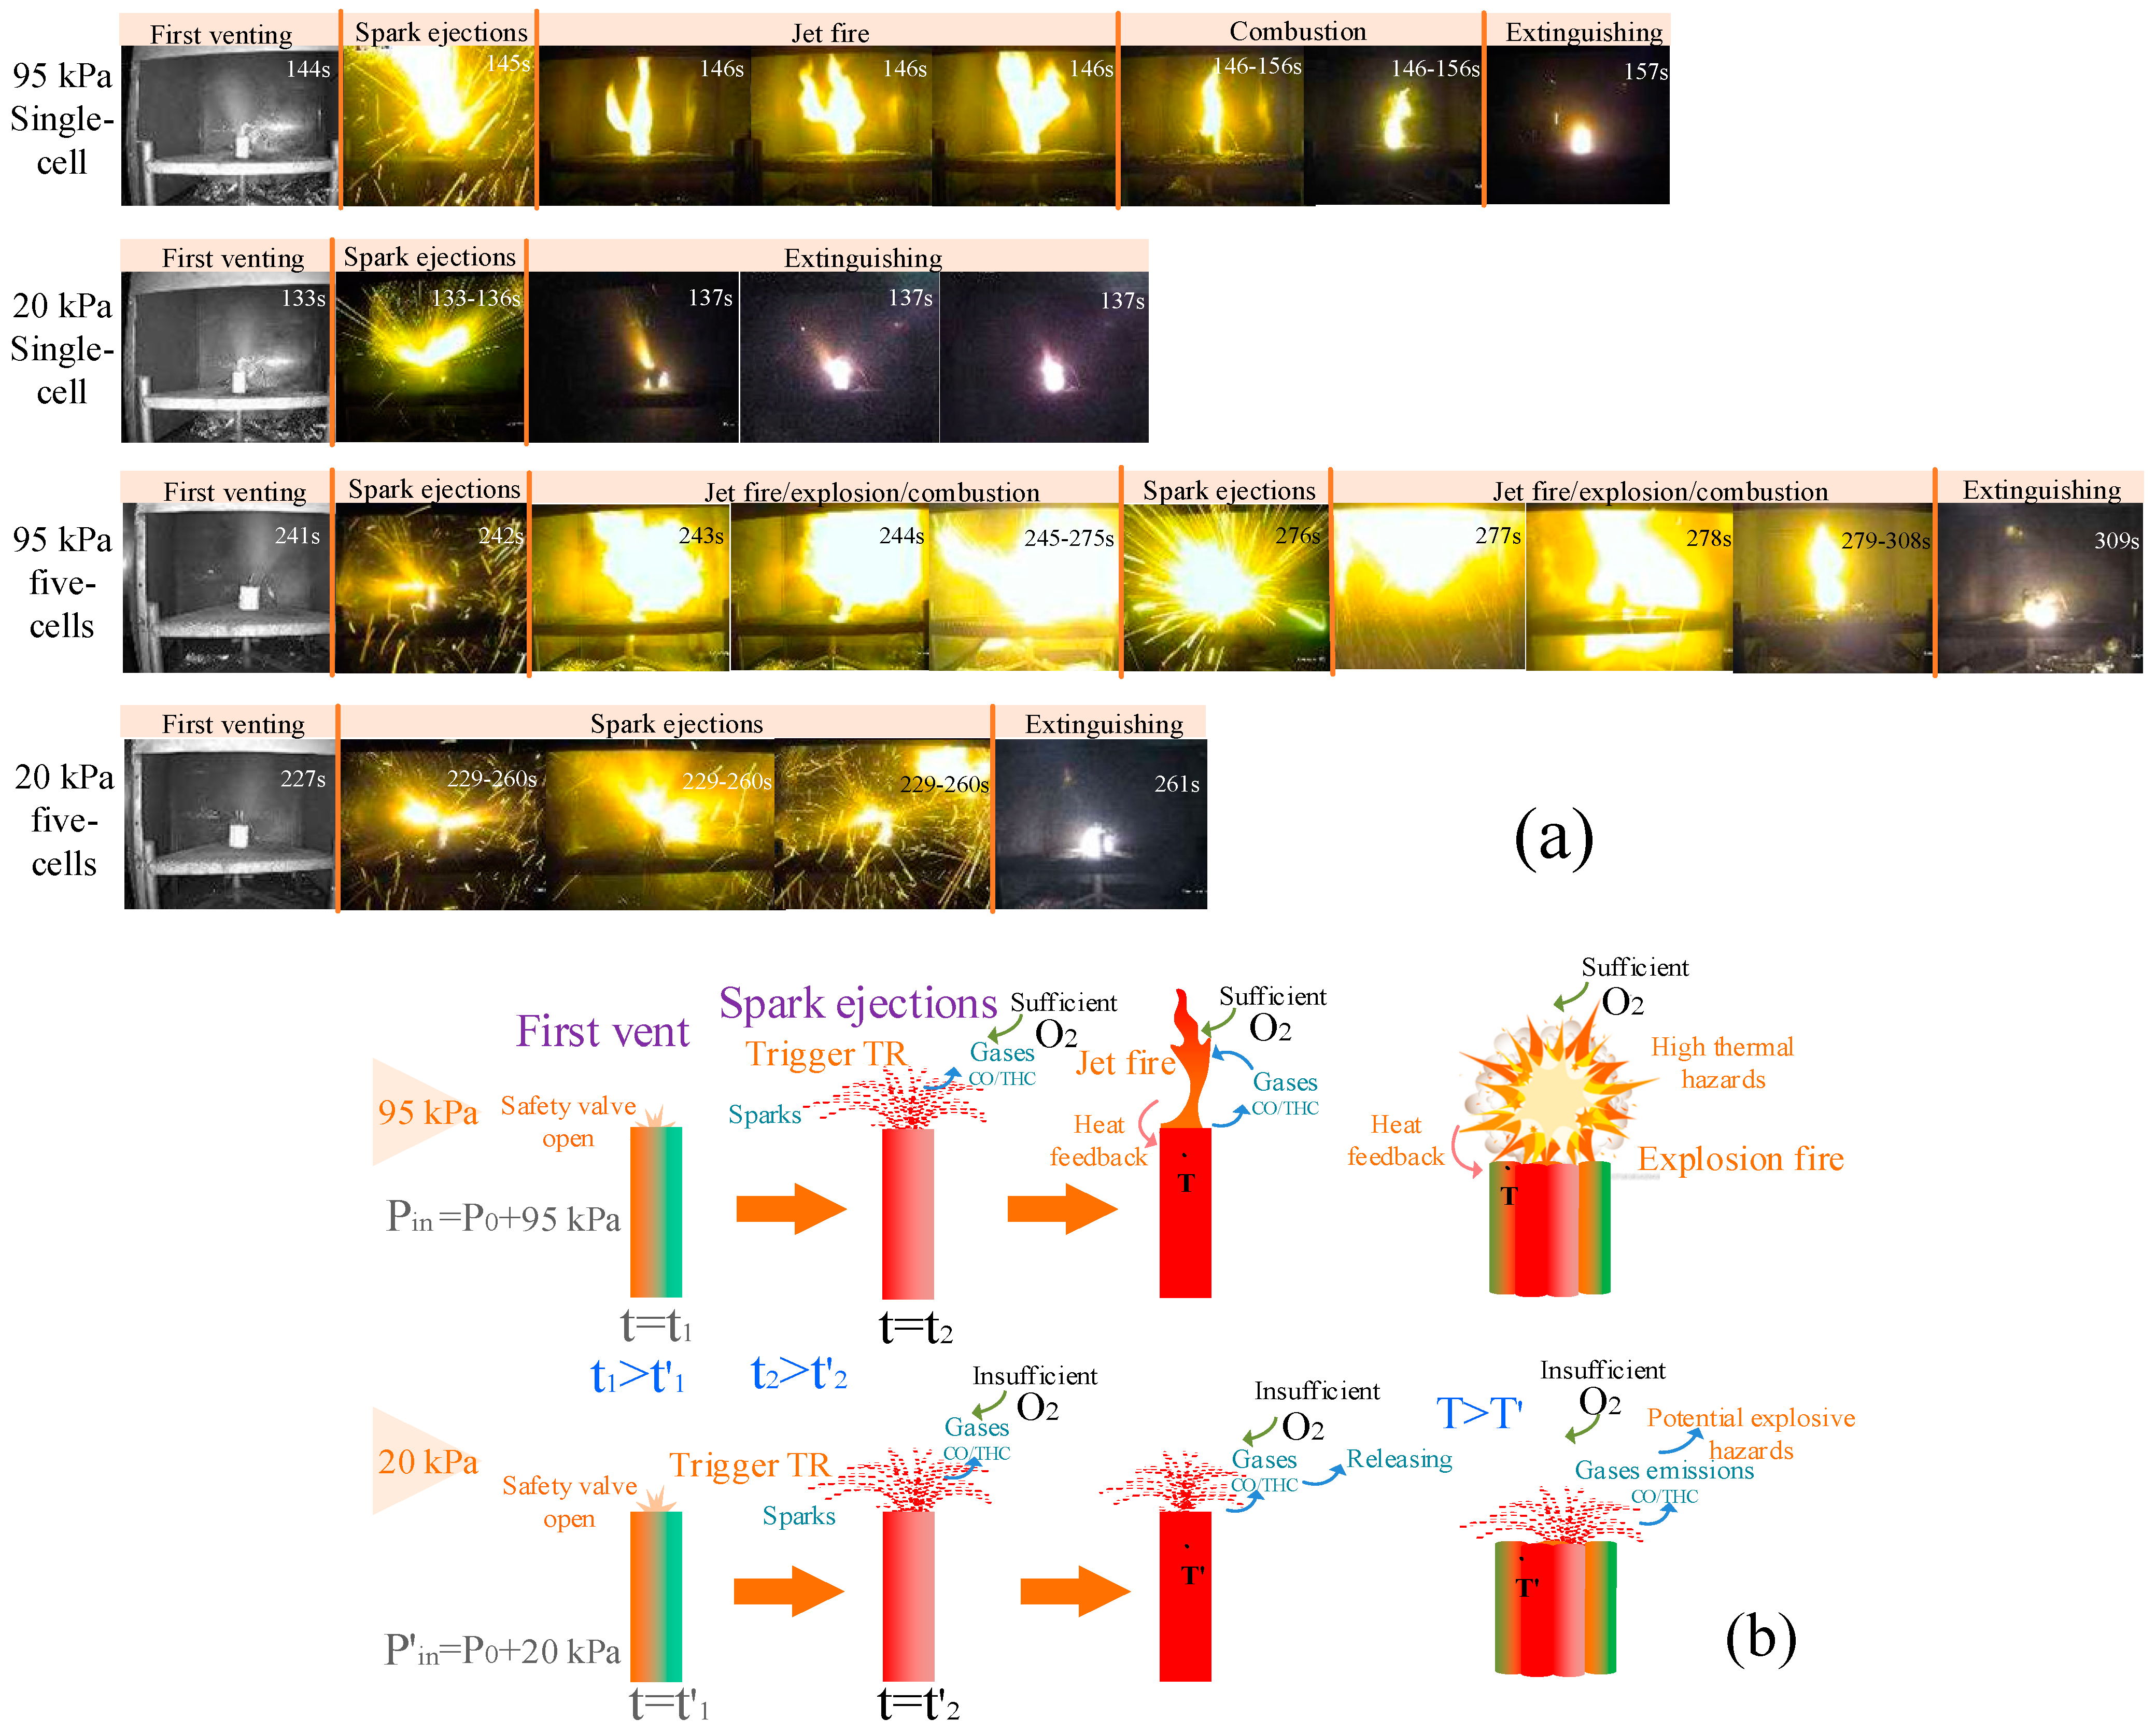
3.2. First Venting and Trigger of TR
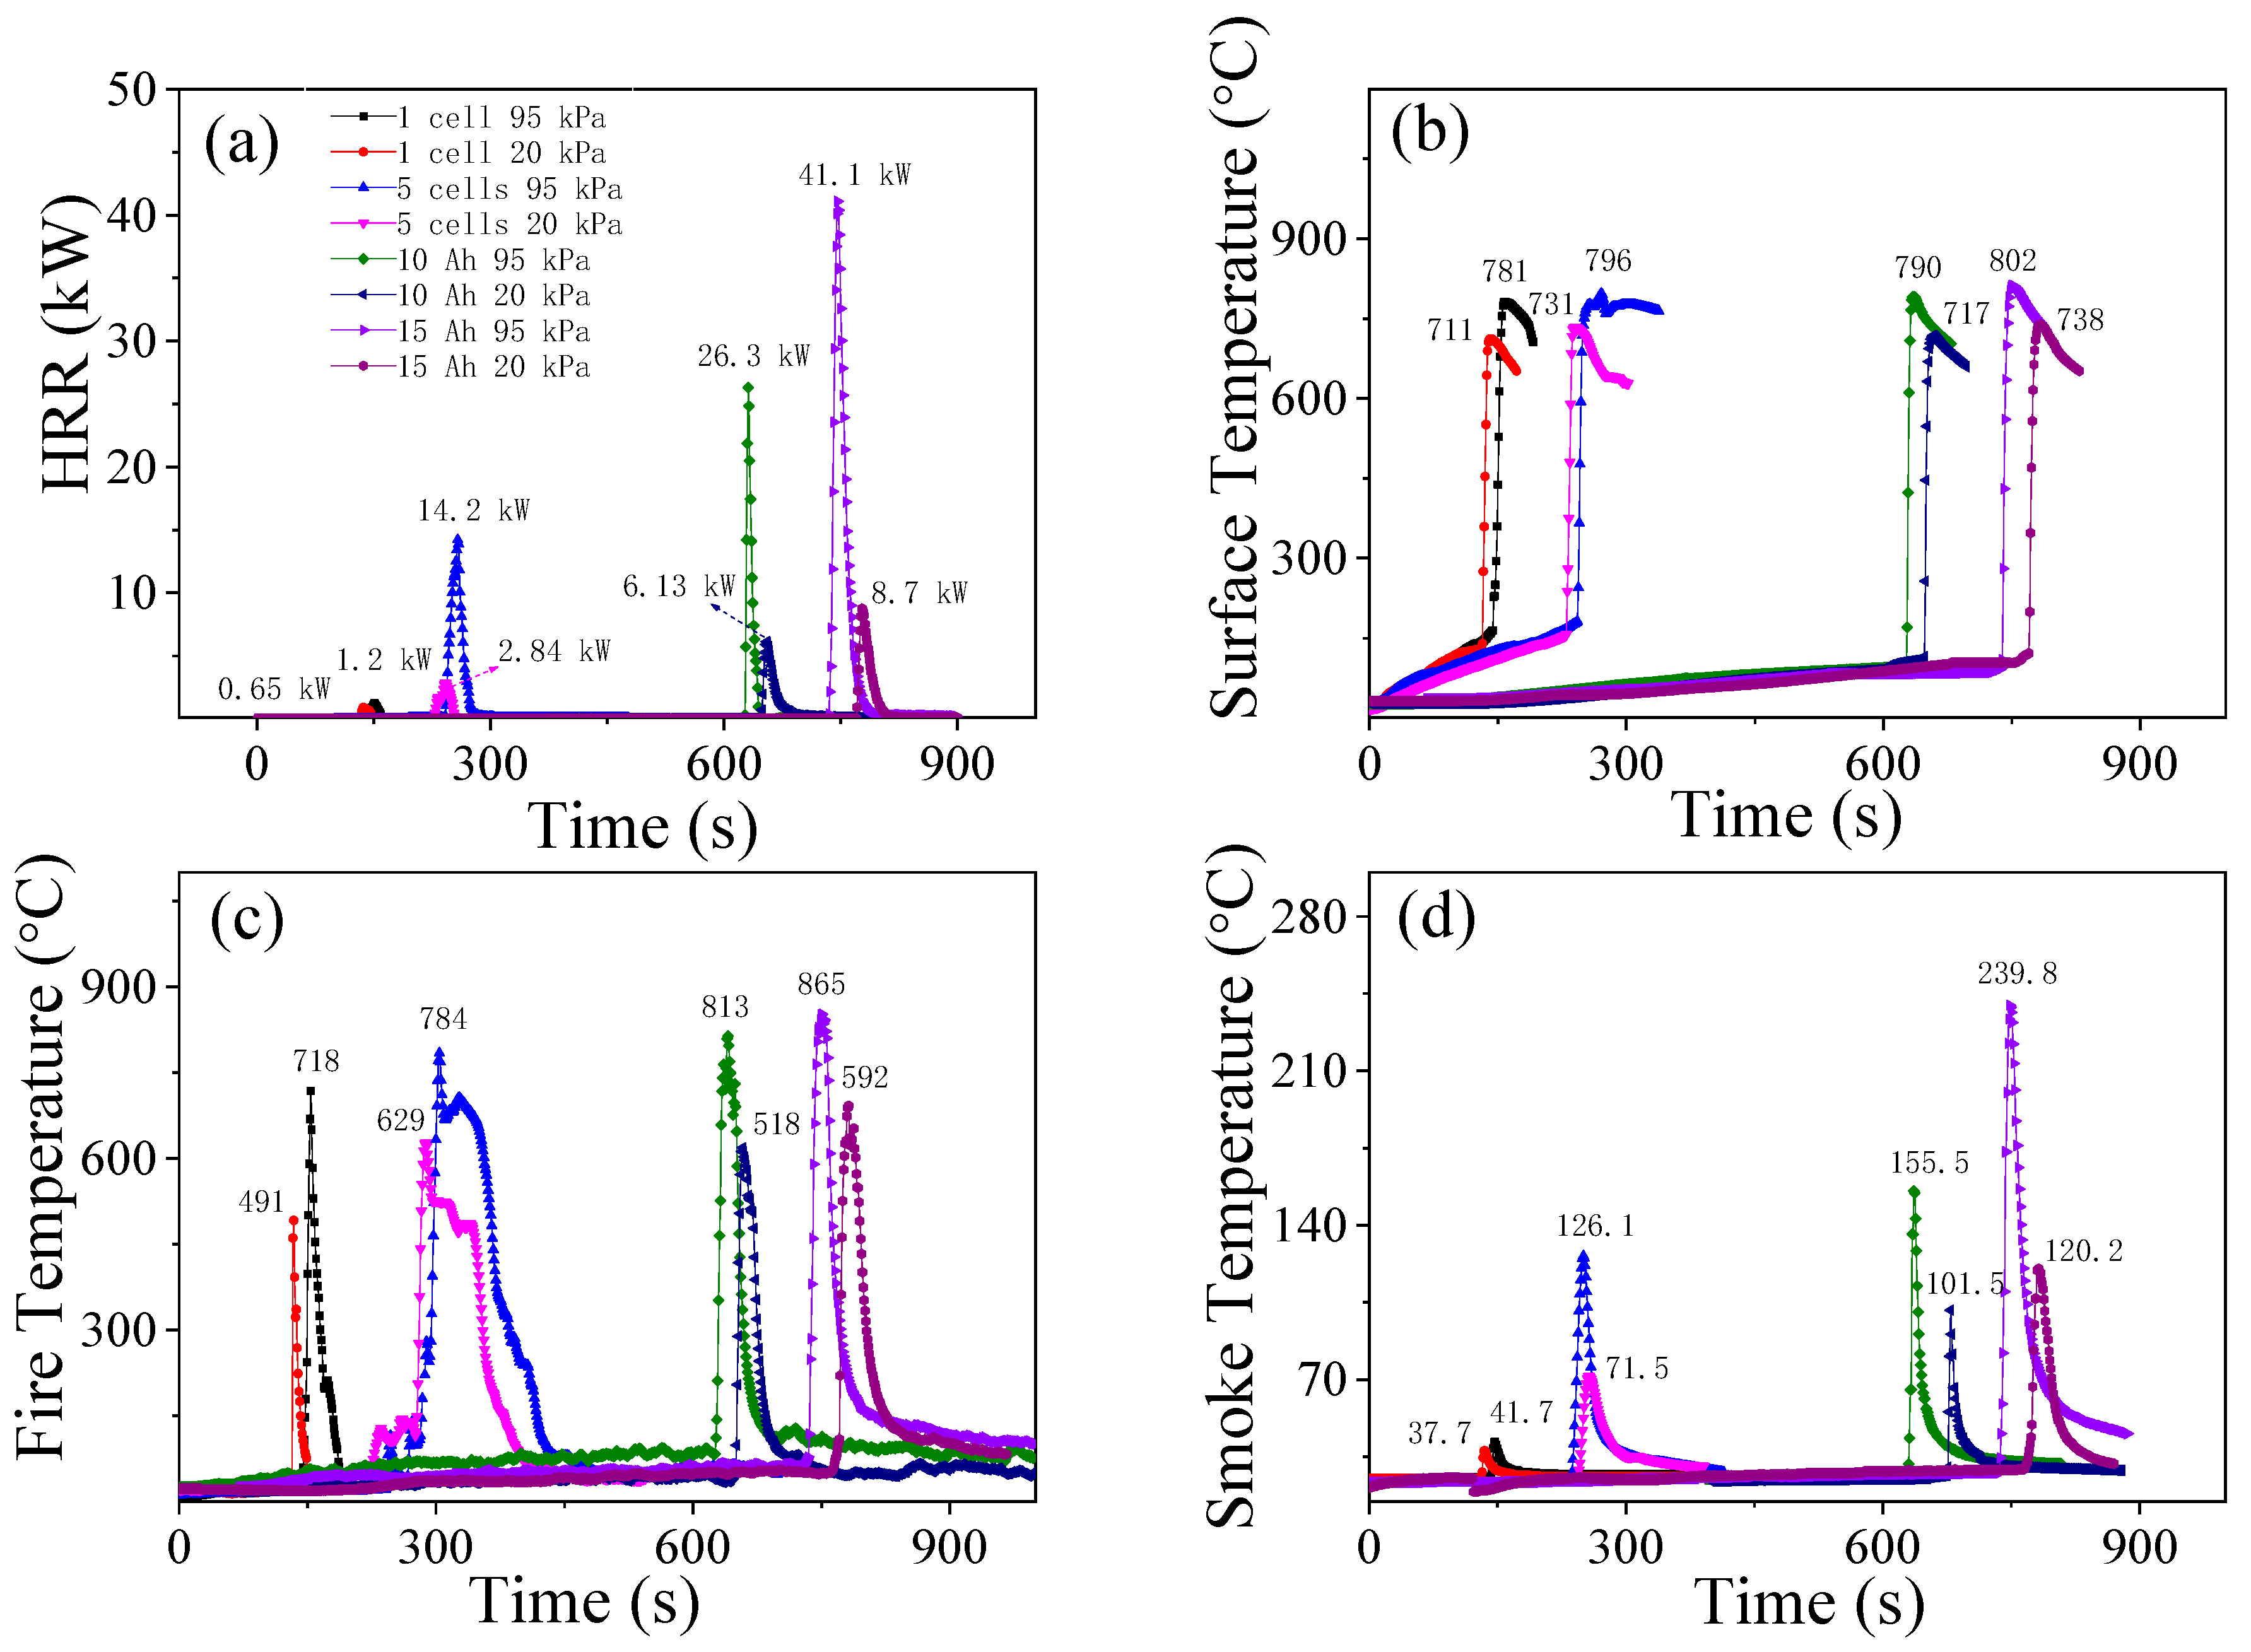
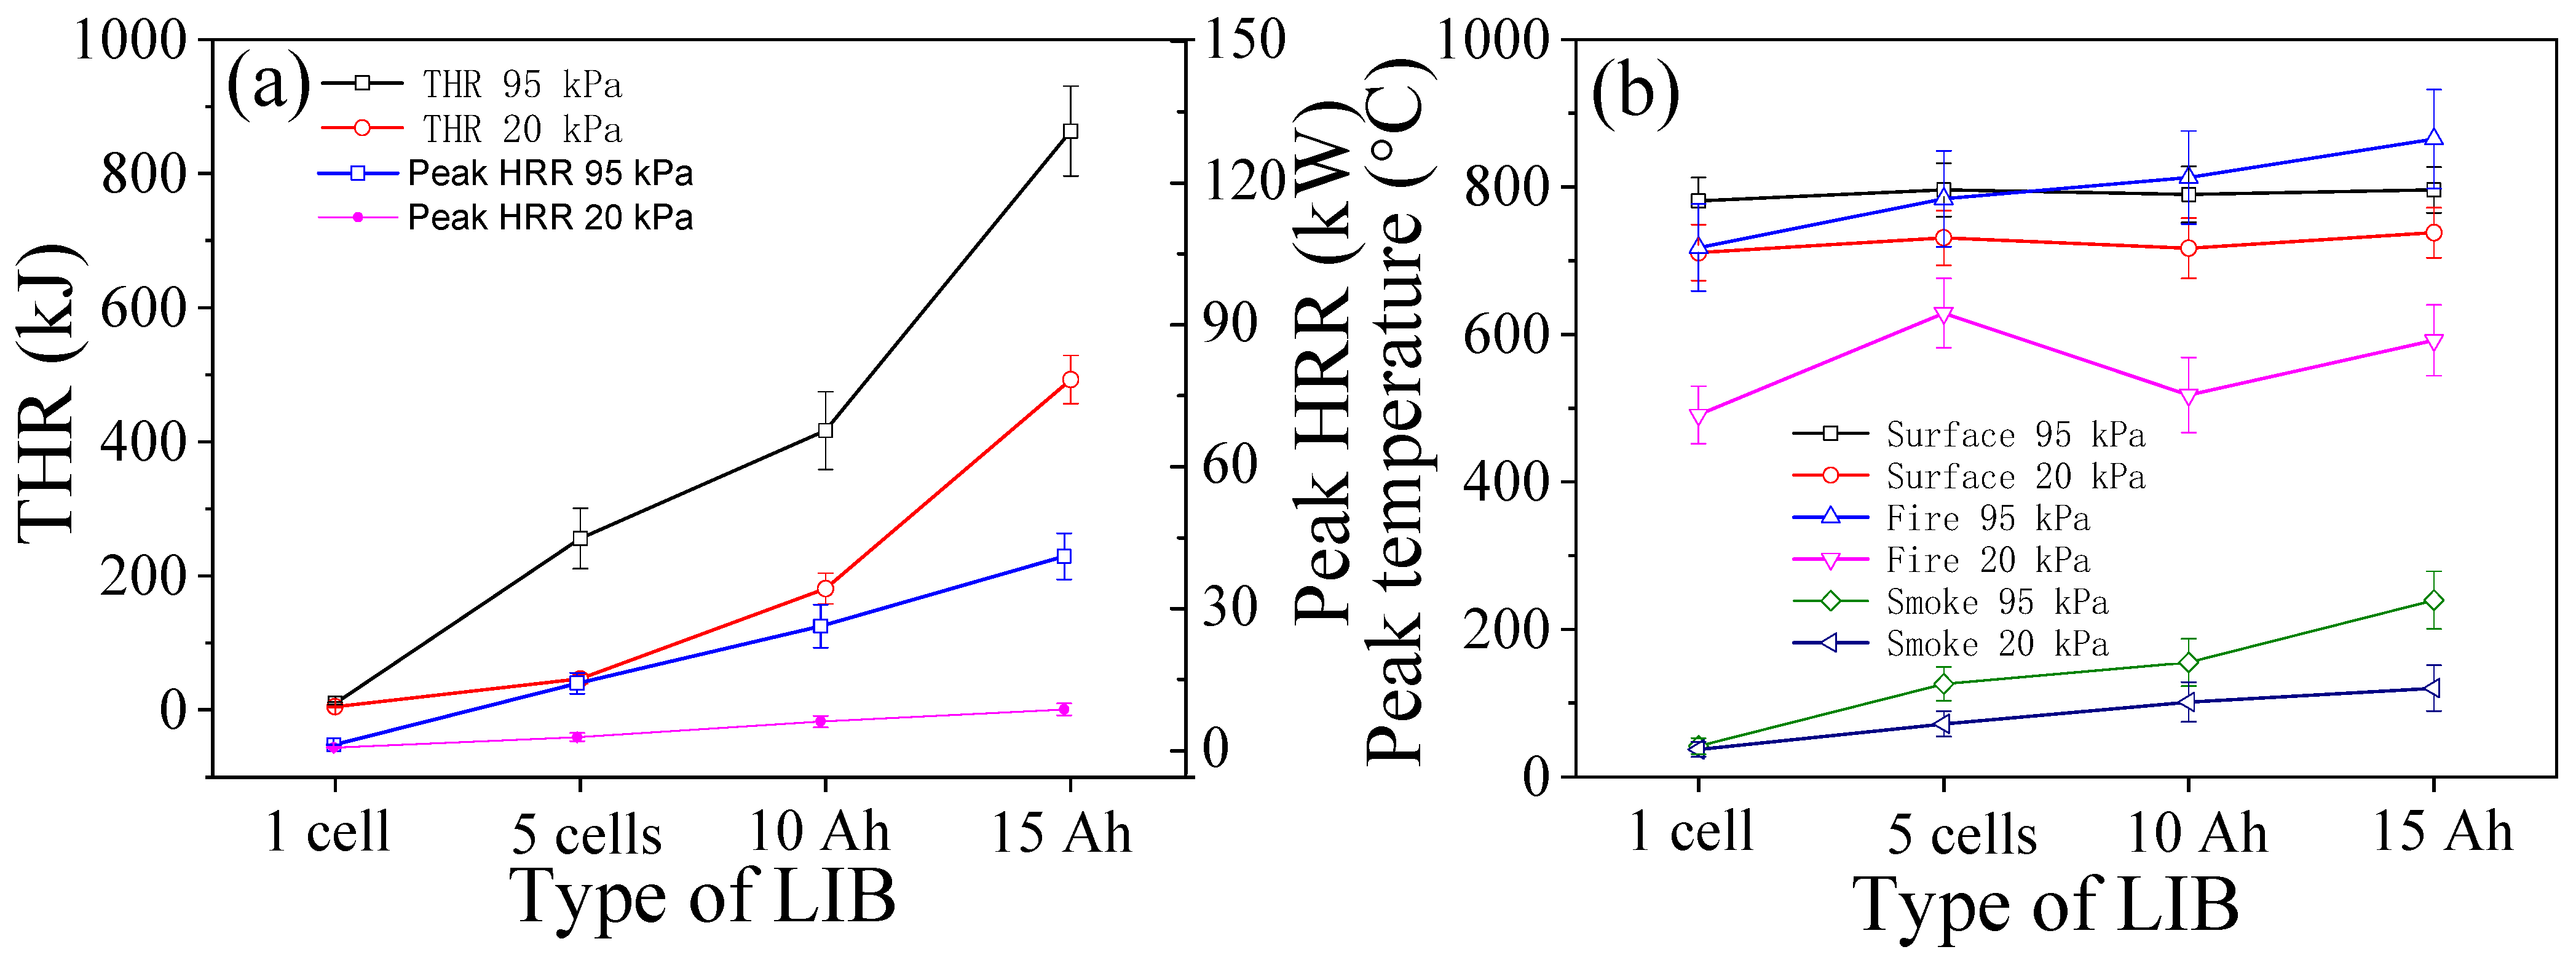
3.3. Heat Release Rates and Temperatures
3.4. Vent Gas Density and O2
3.5. CO2 and CO/CO2
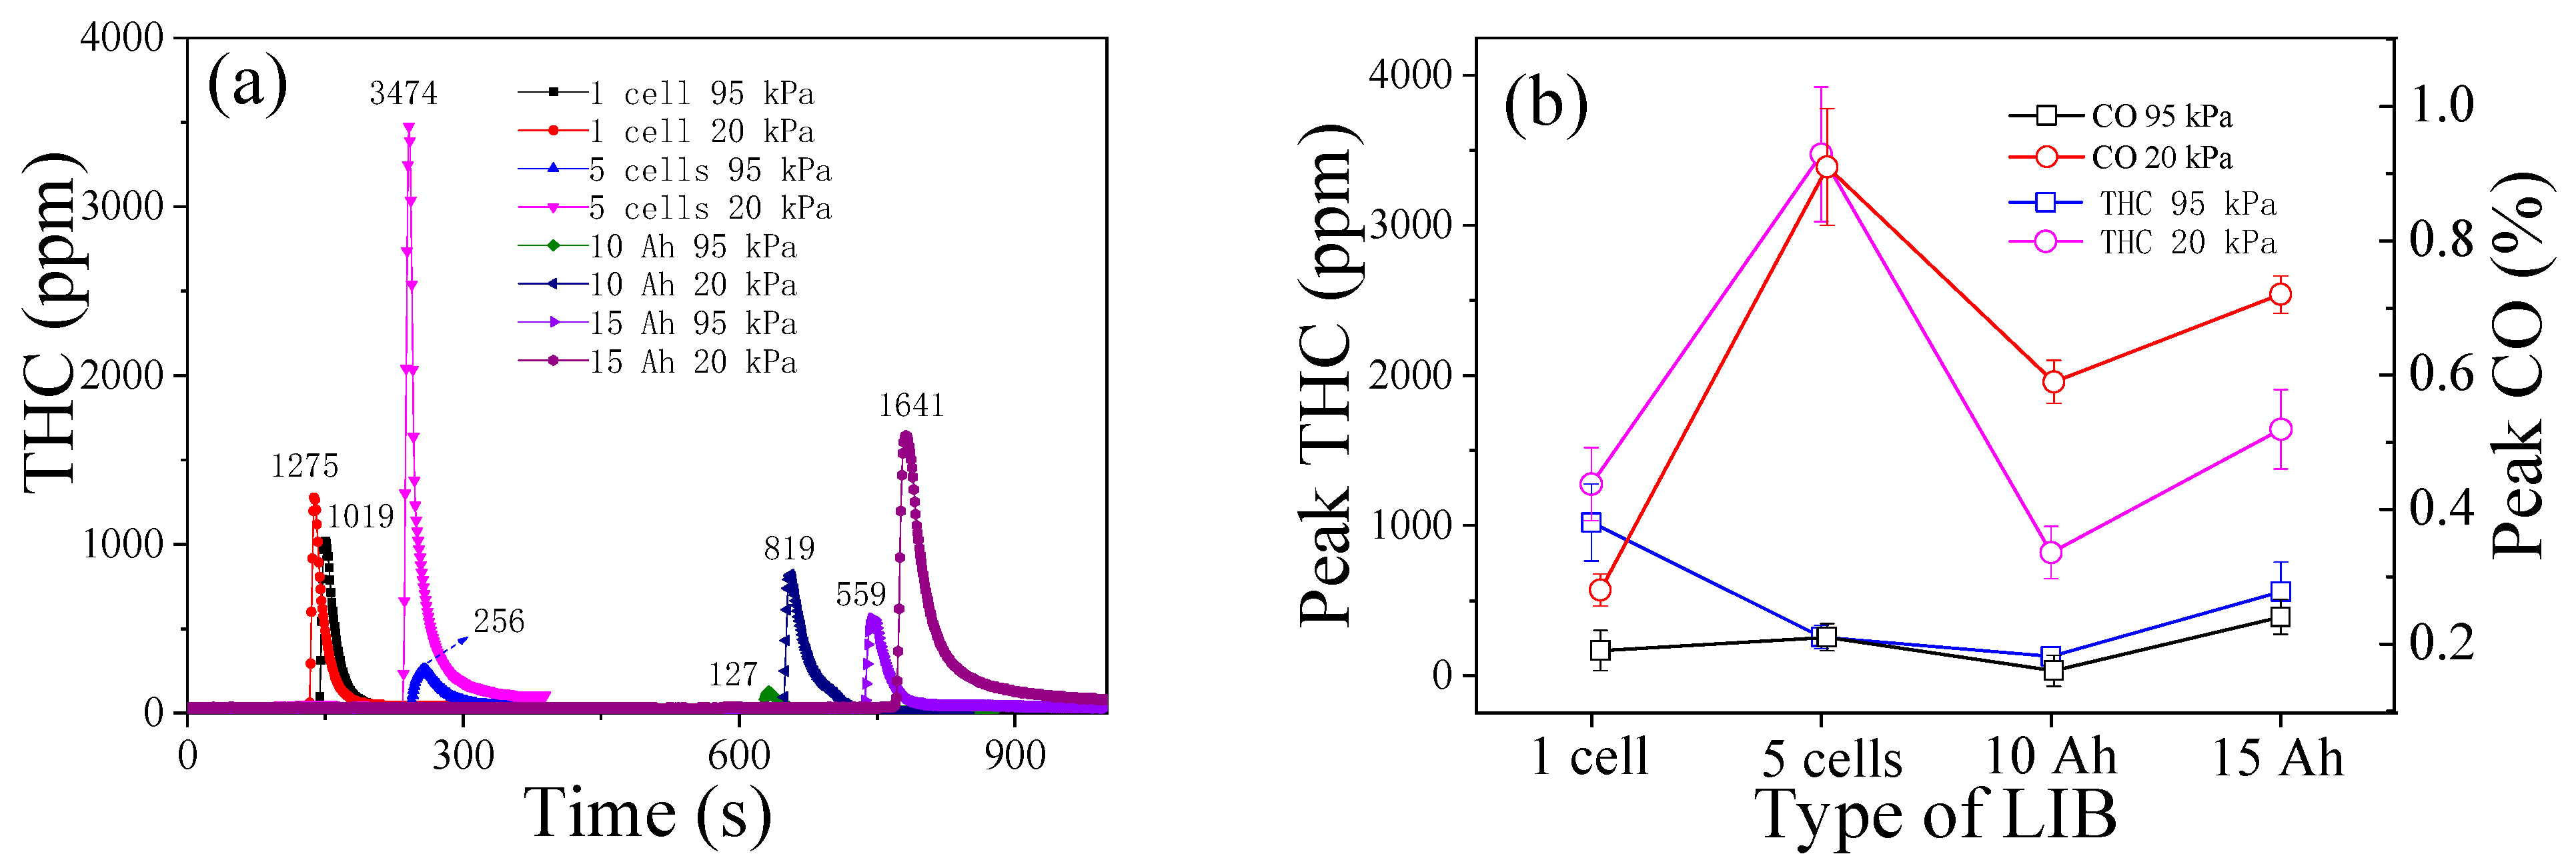
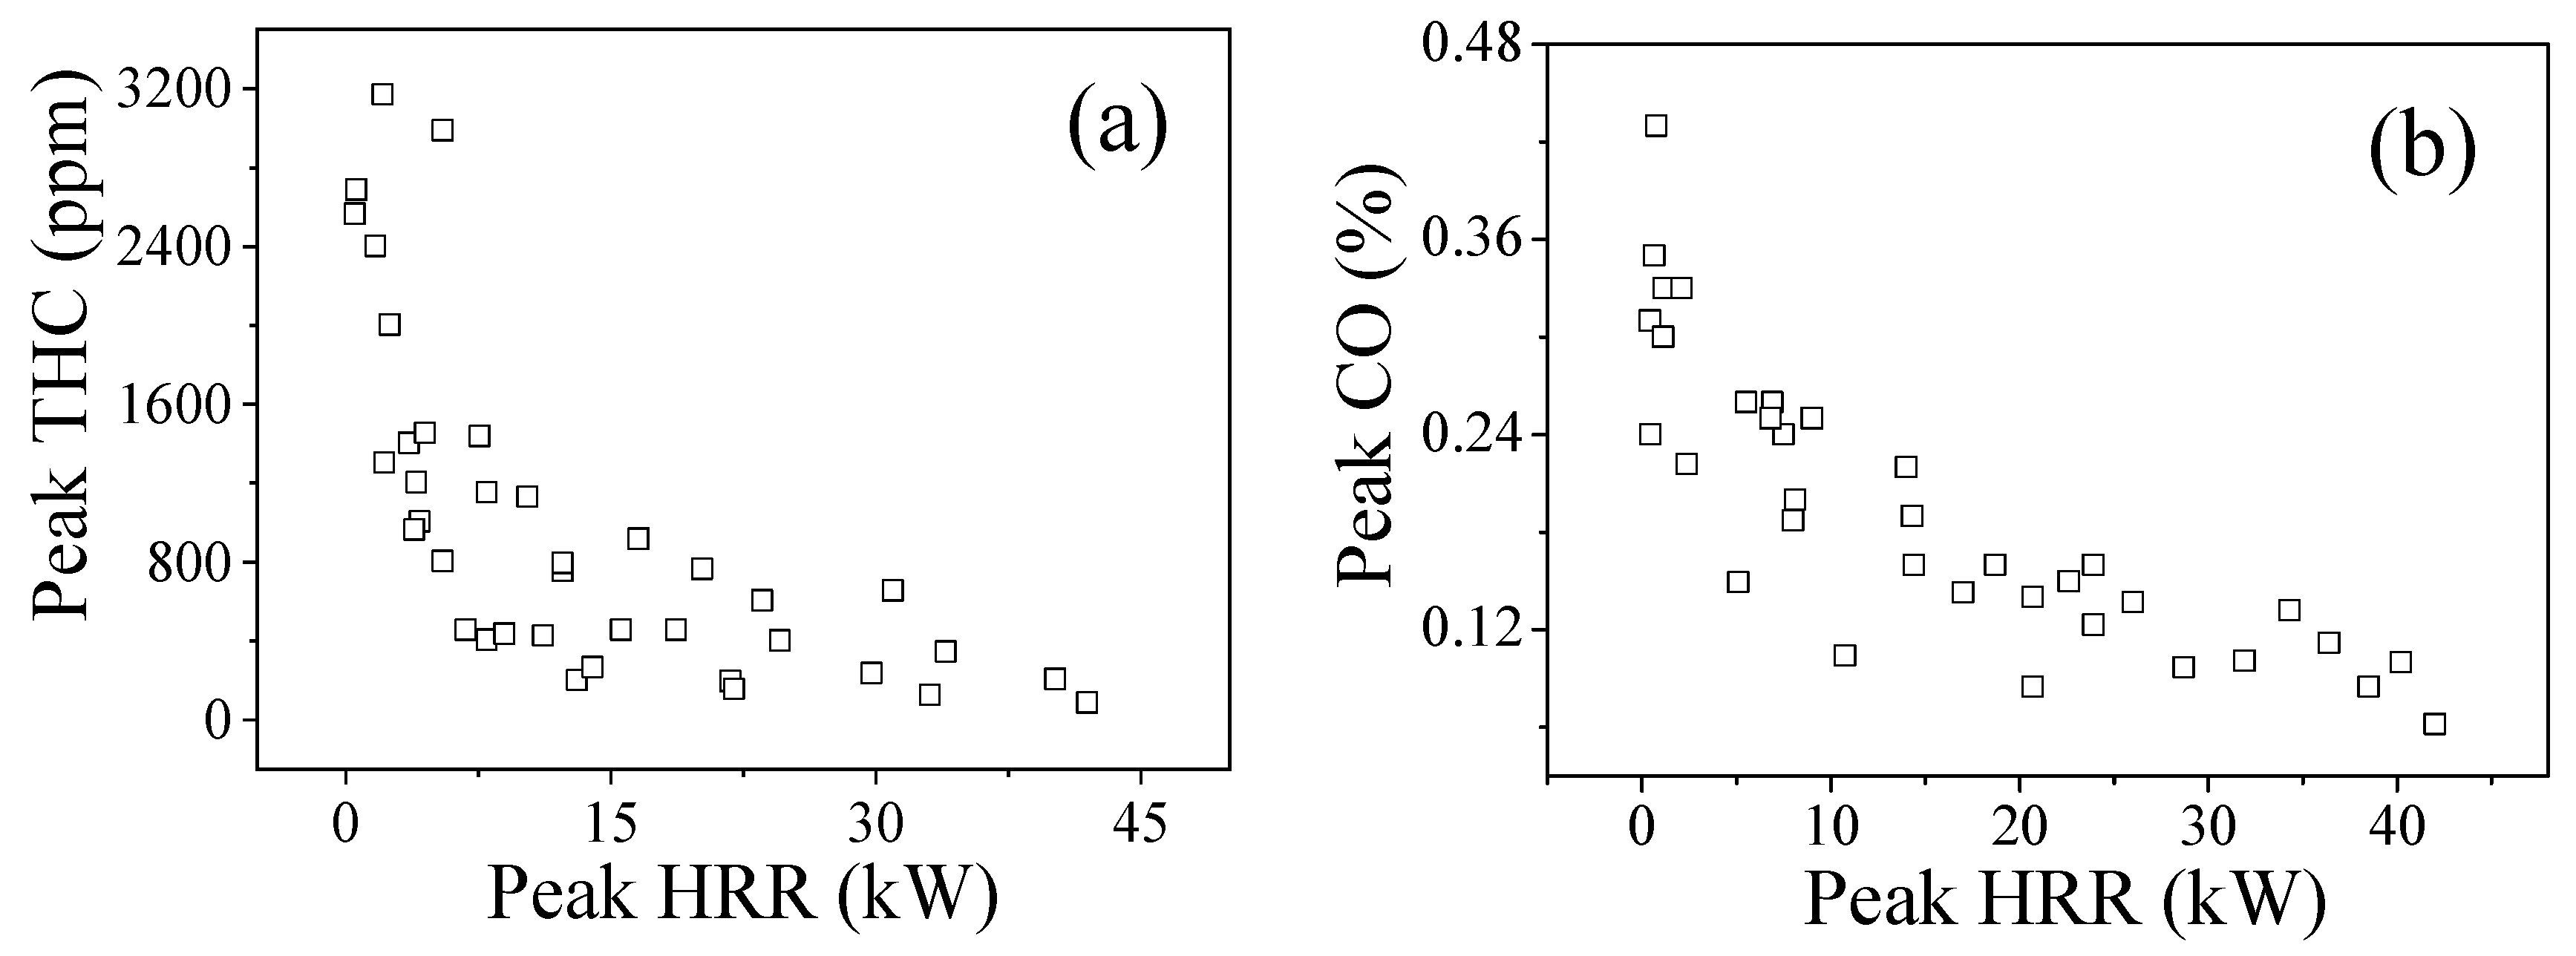
3.6. THC and CO
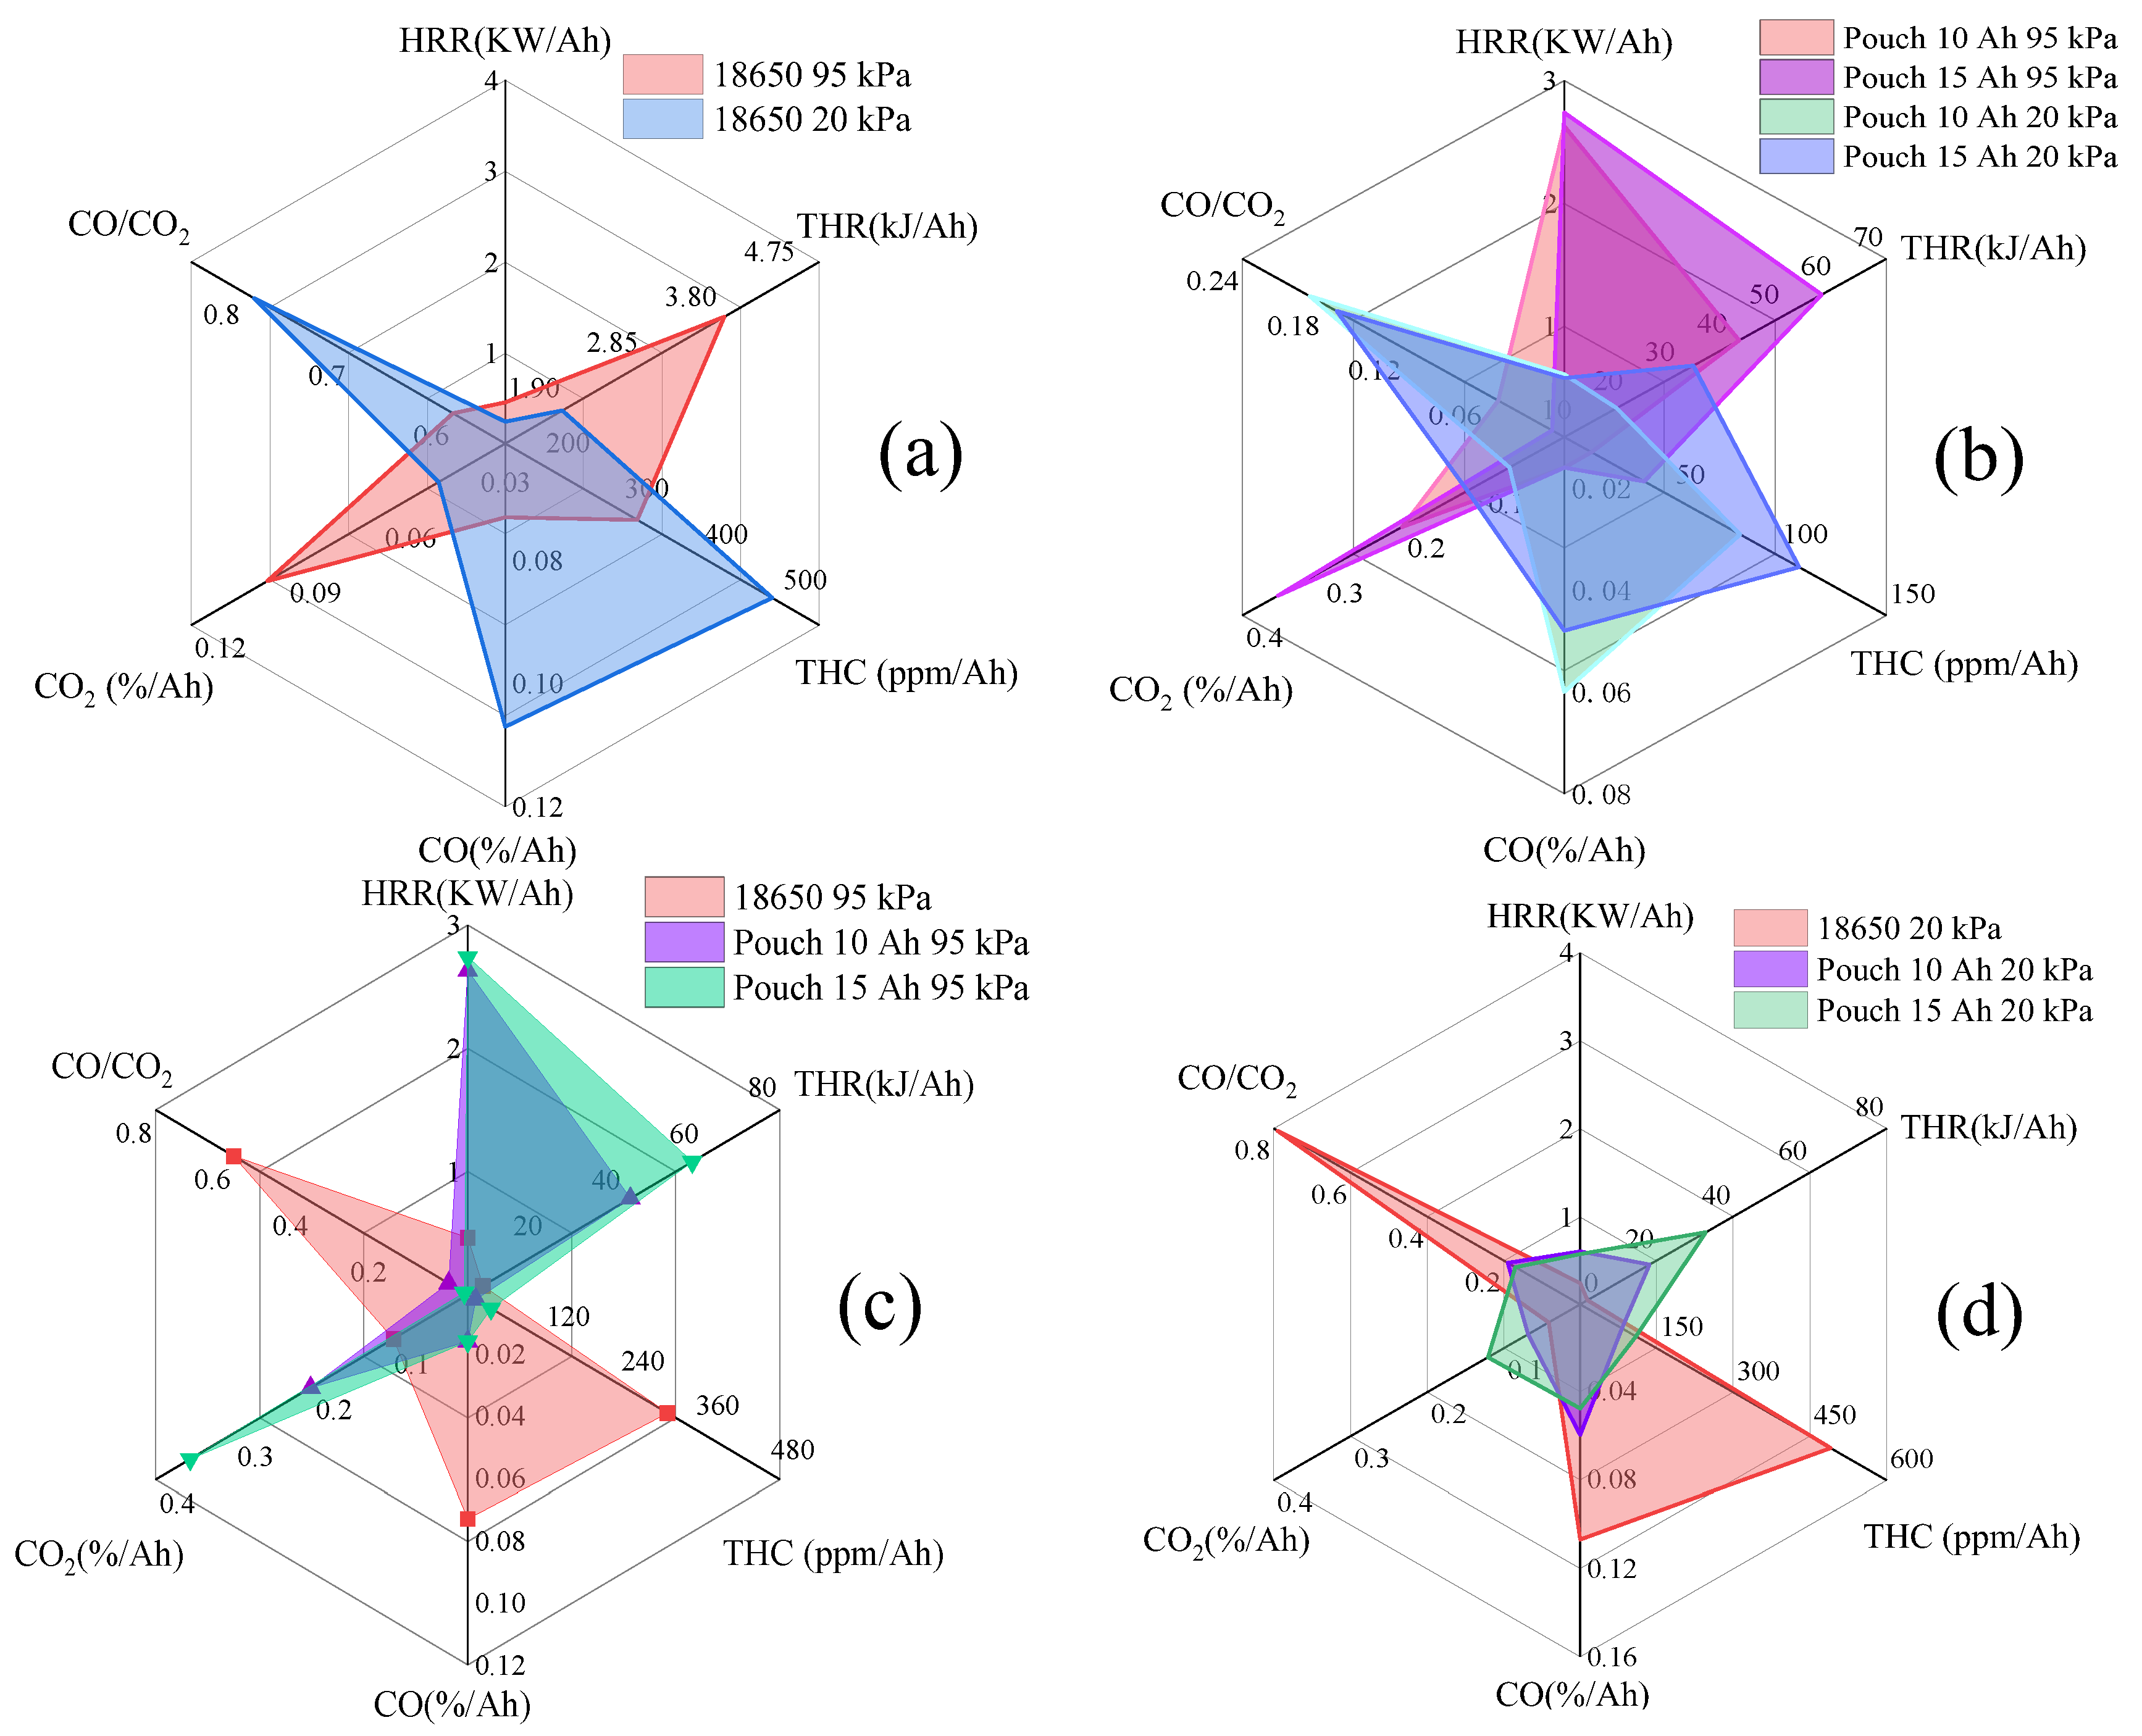
3.7. Hazards Analysis
4. Conclusions
- (1)
- With the pressure drop from 95 kPa to 20 kPa, the average open time of the safety valve (the rupture of the bag for pouch cells) is shortened. The average trigger time of the TR is shortened for cylindrical cells, but delayed for pouch cells under 20 kPa. The average peak values of HRR, THR, surface/fire/smoke temperature, smoke density, and decrease, but the values of THC and increase.
- (2)
- The proportion of and THC varies inversely with the thermal hazards of TR fire. TR behaviors under 20 kPa are not as vigorous as the tests in 95 kPa, without violent fire, explosion, and huge jet flames. The thermal hazards of TR fire under 20 kPa are lower than that in 95 kPa, but the proportion of flammable/potentially explosive gas emissions increases greatly which poses a huge risk, especially in a confined space.
- (3)
- The number of batteries and type of packaging also have an obvious effect on the performance of the TR. Pouch cells have a higher thermal hazard of fire, but lower combustible/toxic emitted gases, than the cylindrical cells both under 95 kPa and 20 kPa. With fierce TR behaviors, the combustible gas products are released at high speeds, leading to a higher risk of toxicity and potential explosion of cylindrical cells than pouch cells in the TR process.
Supplementary Materials
Author Contributions
Funding
Data Availability Statement
Conflicts of Interest
References
- Sripad, S.; Viswanathan, V. Performance Metrics Required of Next-Generation Batteries to Make a Practical Electric Semi Truck. ACS Energy Lett. 2017, 2, 1669–1673. [Google Scholar] [CrossRef]
- Bills, A.; Sripad, S.; Fredericks, W.L.; Singh, M.; Viswanathan, V. Performance Metrics Required of Next-Generation Batteries to Electrify Commercial Aircraft. ACS Energy Lett. 2020, 5, 663–668. [Google Scholar] [CrossRef]
- Feng, X.; Sun, J.; Ouyang, M.; He, X.; Lu, L.; Han, X.; Fang, M.; Peng, H. Characterization of large format lithium ion battery exposed to extremely high temperature. J. Power Sources 2014, 272, 457–467. [Google Scholar] [CrossRef]
- Zhu, X.; Wang, H.; Wang, X.; Gao, Y.; Allu, S.; Cakmak, E.; Wang, Z. Internal short circuit and failure mechanisms of lithium-ion pouch cells under mechanical indentation abuse conditions: An experimental study. J. Power Sources 2020, 455, 227939. [Google Scholar] [CrossRef]
- Xu, J.; Wang, L.; Guan, J.; Yin, S. Coupled effect of strain rate and solvent on dynamic mechanical behaviors of separators in lithium ion batteries. Mater. Des. 2016, 95, 319–328. [Google Scholar] [CrossRef]
- Wang, Q.; Ping, P.; Zhao, X.; Chu, G.; Sun, J.; Chen, C. Thermal runaway caused fire and explosion of lithium ion battery. J. Power Sources 2012, 208, 210–224. [Google Scholar] [CrossRef]
- Li, W.; Wang, H.; Zhang, Y.; Ouyang, M. Flammability characteristics of the battery vent gas: A case of NCA and LFP lithium-ion batteries during external heating abuse. J. Energy Storage 2019, 24, 10077–10086. [Google Scholar] [CrossRef]
- Larsson, F.; Andersson, P.; Blomqvist, P.; Lorén, A.; Mellander, B.-E. Characteristics of lithium-ion batteries during fire tests. J. Power Sources 2014, 271, 414–420. [Google Scholar] [CrossRef]
- Ping, P.; Wang, Q.; Huang, P.; Sun, J.; Chen, C. Thermal behaviour analysis of lithium-ion battery at elevated temperature using deconvolution method. Appl. Energy 2014, 129, 261–273. [Google Scholar] [CrossRef]
- Fredericks, W.L.; Sripad, S.; Bower, G.C.; Viswanathan, V. Performance Metrics Required of Next Generation Batteries to Electrify Vertical Takeoff and Landing (VTOL) Aircraft. ACS Energy Lett. 2018, 3, 2989–2994. [Google Scholar] [CrossRef]
- Feng, X.; Sun, J.; Ouyang, M.; Wang, F.; He, X.; Lu, L.; Peng, H. Characterization of penetration induced thermal runaway propagation process within a large format lithium ion battery module. J. Power Sources 2015, 275, 261–273. [Google Scholar] [CrossRef]
- Lamb, J.; Orendorff, C.J.; Steele, L.A.M.; Spangler, S.W. Failure propagation in multi-cell lithium ion batteries. J. Power Sources 2015, 283, 517–523. [Google Scholar] [CrossRef]
- Ping, P.; Kong, D.; Zhang, J.; Wen, R.; Wen, J. Characterization of behaviour and hazards of fire and deflagration for high-energy Li-ion cells by over-heating. J. Power Sources 2018, 398, 55–66. [Google Scholar] [CrossRef]
- Feng, X.; Ouyang, M.; Liu, X.; Lu, L.; Xia, Y.; He, X. Thermal runaway mechanism of lithium ion battery for electric vehicles: A review. Energy Storage Mater. 2018, 10, 246–267. [Google Scholar] [CrossRef]
- Xu, C.; Feng, X.; Huang, W.; Duan, Y.; Chen, T.; Gao, S.; Lu, L.; Jiang, F.; Ouyang, M. Internal temperature detection of thermal runaway in lithium-ion cells tested by extended-volume accelerating rate calorimetry. J. Energy Storage 2020, 31, 101670. [Google Scholar] [CrossRef]
- Chen, Y.; Liu, N.; Jie, Y.; Hu, F.; Li, Y.; Wilson, B.P.; Xi, Y.; Lai, Y.; Yang, S. Toxicity Identification and Evolution Mechanism of Thermolysis-Driven Gas Emissions from Cathodes of Spent Lithium-Ion Batteries. ACS Sustain. Chem. Eng. 2019, 7, 18228–18235. [Google Scholar] [CrossRef]
- Ouyang, D.; Weng, J.; Chen, M.; Wang, J. Impact of high-temperature environment on the optimal cycle rate of lithium-ion battery. J. Energy Storage 2020, 28, 101242. [Google Scholar] [CrossRef]
- Guo, L.S.; Wang, Z.R.; Wang, J.H.; Luo, Q.K.; Liu, J.J. Effects of the environmental temperature and heat dissipation condition on the thermal runaway of lithium ion batteries during the charge-discharge process. J. Loss Prev. Process Ind. 2017, 49, 953–960. [Google Scholar] [CrossRef]
- Sun, J.; Li, J.; Zhou, T.; Yang, K.; Wei, S.; Tang, N.; Dang, N.; Li, H.; Qiu, X.; Chen, L. Toxicity, a serious concern of thermal runaway from commercial Li-ion battery. Nano Energy 2016, 27, 313–319. [Google Scholar] [CrossRef]
- Koch, S.; Fill, A.; Birke, K.P. Comprehensive gas analysis on large scale automotive lithium-ion cells in thermal runaway. J. Power Sources 2018, 398, 106–112. [Google Scholar] [CrossRef]
- Golubkov, A.W.; Fuchs, D.; Wagner, J.; Wiltsche, H.; Stangl, C.; Fauler, G.; Voitic, G.; Thaler, A.; Hacker, V. Thermal-runaway experiments on consumer Li-ion batteries with metal-oxide and olivin-type cathodes. RSC Adv. 2014, 4, 3633–3642. [Google Scholar] [CrossRef]
- Larsson, F.; Andersson, P.; Blomqvist, P.; Mellander, B.E. Toxic fluoride gas emissions from lithium-ion battery fires. Sci. Rep. 2017, 7, 10018. [Google Scholar] [CrossRef]
- Baird, A.R.; Archibald, E.J.; Marr, K.C.; Ezekoye, O.A. Explosion hazards from lithium-ion battery vent gas. J. Power Sources 2020, 446, 227257. [Google Scholar] [CrossRef]
- Zhang, C.; Santhanagopalan, S.; Sprague, M.A.; Pesaran, A.A. Coupled mechanical-electrical-thermal modeling for short-circuit prediction in a lithium-ion cell under mechanical abuse. J. Power Sources 2015, 290, 102–113. [Google Scholar] [CrossRef]
- Larsson, F.; Bertilsson, S.; Furlani, M.; Albinsson, I.; Mellander, B.-E. Gas explosions and thermal runaways during external heating abuse of commercial lithium-ion graphite-LiCoO2 cells at different levels of ageing. J. Power Sources 2018, 373, 220–231. [Google Scholar] [CrossRef]
- Gao, T.; Wang, Z.; Chen, S.; Guo, L. Hazardous characteristics of charge and discharge of lithium-ion batteries under adiabatic environment and hot environment. Int. J. Heat Mass Transf. 2019, 141, 419–431. [Google Scholar] [CrossRef]
- Zhu, J.; Koch, M.M.; Lian, J.; Li, W.; Wierzbicki, T. Mechanical Deformation of Lithium-Ion Pouch Cells under In-Plane Loads—Part I: Experimental Investigation. J. Electrochem. Soc. 2020, 167, 090533. [Google Scholar] [CrossRef]
- Peng, Y.; Yang, L.; Ju, X.; Liao, B.; Ye, K.; Li, L.; Cao, B.; Ni, Y. A comprehensive investigation on the thermal and toxic hazards of large format lithium-ion batteries with LiFePO4 cathode. J. Hazard. Mater. 2020, 381, 120916. [Google Scholar] [CrossRef]
- Kriston, A.; Kersys, A.; Antonelli, A.; Ripplinger, S.; Holmstrom, S.; Trischler, S.; Döring, H.; Pfrang, A. Initiation of thermal runaway in Lithium-ion cells by inductive heating. J. Power Sources 2020, 454, 227914. [Google Scholar] [CrossRef]
- Ma, Q.; Liu, Q.; Zhang, H.; Tian, R.; Ye, J.; Yang, R. Experimental study of the mass burning rate in n-Heptane pool fire under dynamic pressure. Appl. Therm. Eng. 2017, 113, 1004–1010. [Google Scholar] [CrossRef]
- Li, C.; Yang, R.; Yao, Y.; Tao, Z.; Liu, Q. Factors affecting the burning rate of pool fire in a depressurization aircraft cargo compartment. Appl. Therm. Eng. 2018, 135, 350–355. [Google Scholar] [CrossRef]
- Chen, M.; Liu, J.; He, Y.; Yuen, R.; Wang, J. Study of the fire hazards of lithium-ion batteries at different pressures. Appl. Therm. Eng. 2017, 125, 1061–1074. [Google Scholar] [CrossRef]
- Chen, M.; Ouyang, D.; Weng, J.; Liu, J.; Wang, J. Environmental pressure effects on thermal runaway and fire behaviors of lithium-ion battery with different cathodes and state of charge. Process Saf. Environ. Prot. 2019, 130, 250–256. [Google Scholar] [CrossRef]
- Fu, Y.; Lu, S.; Shi, L.; Cheng, X.; Zhang, H. Ignition and combustion characteristics of lithium ion batteries under low atmospheric pressure. Energy 2018, 161, 38–45. [Google Scholar] [CrossRef]
- Xie, S.; Ren, L.; Yang, X.; Wang, H.; Sun, Q.; Chen, X.; He, Y. Influence of cycling aging and ambient pressure on the thermal safety features of lithium-ion battery. J. Power Sources 2020, 448, 1181–1189. [Google Scholar] [CrossRef]
- Xie, S.; Ren, L.; Gong, Y.; Li, M.; Chen, X. Effect of charging/discharging rate on the thermal runaway characteristics of lithium-ion batteries in low pressure. J. Electrochem. Soc. 2020, 167, 140503. [Google Scholar] [CrossRef]
- Xie, S.; Gong, Y.; Li, G.; Ping, X. Effect of low-pressure environment on thermal runaway behavior of NCM523/graphite pouch cells with different overcharge cycles. J. Energy Storage 2022, 55, 105444. [Google Scholar] [CrossRef]
- Sun, Q.; Liu, H.; Zhi, M.; Chen, X.; Lv, P.; He, Y. Thermal characteristics of thermal runaway for pouch lithium-ion battery with different state of charges under various ambient pressures. J. Power Sources 2022, 527, 231175. [Google Scholar] [CrossRef]
- Sun, Q.; Liu, H.; Zhi, M.; Zhao, C.; Jia, J.; Lv, P.; Xie, S.; He, Y.; Chen, X. Lithium-ion battery thermal runaway propagation characteristics under 20 kPa with different airflow rates. Fire Technol. 2023, 59, 1157–1179. [Google Scholar] [CrossRef]
- Pandian, G.; Pecht, M.; Zio, E.; Hodkiewicz, M. Data-driven reliability analysis of Boeing 787 Dreamliner. Chin. J. Aeronaut. 2020, 33, 1969–1979. [Google Scholar] [CrossRef]
- Yayathi, S.; Walker, W.; Doughty, D.; Ardebili, H. Energy distributions exhibited during thermal runaway of commercial lithium ion batteries used for human spaceflight applications. J. Power Sources 2016, 329, 197–206. [Google Scholar] [CrossRef]
- ISO 9705:1993; Fire Test-Full-Scale Room Fire Test for Surface Products. International Standards Organization: Geneva, Switzerland, 1993.
- Chow, W.K.; Han, S.S. Heat release rate calculation in oxygen consumption calorimetry. Appl. Therm. Eng. 2011, 31, 304–310. [Google Scholar] [CrossRef]
- Lyon, R.E.; Walters, R.N. Energetics of lithium ion battery failure. J Hazard Mater 2016, 318, 164–172. [Google Scholar] [CrossRef] [PubMed]
- Fu, Y.; Lu, S.; Li, K.; Liu, C.; Cheng, X.; Zhang, H. An experimental study on burning behaviors of 18650 lithium ion batteries using a cone calorimeter. J. Power Sources 2015, 273, 216–222. [Google Scholar] [CrossRef]
- Quintiere, J.G. More on methods to measure the energetics of lithium ion batteries in thermal runaway. Fire Saf. J. 2021, 124, 103382. [Google Scholar] [CrossRef]


| Parameter | Cylindrical | Pouch | Pouch |
|---|---|---|---|
| Capacity | 2600 mAh | 10,000 mAh | 15,000 mAh |
| Anode | |||
| Cathode | Graphite | Graphite | Graphite |
| Electrolyte | |||
| Separator | PE | PE | PE |
| Size | Diameter: 18 mm, height: 65 mm | Length: 100 mm, | Length: 150 mm, |
| width: 50 mm, | width: 50 mm, | ||
| thickness: 6 mm | thickness: 6 mm |
Disclaimer/Publisher’s Note: The statements, opinions and data contained in all publications are solely those of the individual author(s) and contributor(s) and not of MDPI and/or the editor(s). MDPI and/or the editor(s) disclaim responsibility for any injury to people or property resulting from any ideas, methods, instructions or products referred to in the content. |
© 2024 by the authors. Licensee MDPI, Basel, Switzerland. This article is an open access article distributed under the terms and conditions of the Creative Commons Attribution (CC BY) license (https://creativecommons.org/licenses/by/4.0/).
Share and Cite
Sun, Q.; Liu, H.; Wang, Z.; Meng, Y.; Xu, C.; Wen, Y.; Wu, Q. Investigation on Thermal Runaway Hazards of Cylindrical and Pouch Lithium-Ion Batteries under Low Pressure of Cruise Altitude for Civil Aircraft. Batteries 2024, 10, 298. https://doi.org/10.3390/batteries10090298
Sun Q, Liu H, Wang Z, Meng Y, Xu C, Wen Y, Wu Q. Investigation on Thermal Runaway Hazards of Cylindrical and Pouch Lithium-Ion Batteries under Low Pressure of Cruise Altitude for Civil Aircraft. Batteries. 2024; 10(9):298. https://doi.org/10.3390/batteries10090298
Chicago/Turabian StyleSun, Qiang, Hangxin Liu, Zhi Wang, Yawei Meng, Chun Xu, Yanxing Wen, and Qiyao Wu. 2024. "Investigation on Thermal Runaway Hazards of Cylindrical and Pouch Lithium-Ion Batteries under Low Pressure of Cruise Altitude for Civil Aircraft" Batteries 10, no. 9: 298. https://doi.org/10.3390/batteries10090298