Abstract
To date, electronic waste (e-waste) is the fastest-growing waste stream worldwide due to technological advancement and the advent of the Fourth Industrial Revolution. Although e-waste is an environmental hazard, these materials are considered good secondary sources of metals. This study examined the bioleaching of metals from printed circuit boards, where a two-step bioleaching approach was used with iron–sulfur-oxidizing microorganisms at different e-waste particle sizes. The metal analysis from the different particle sizes (PSs) showed that copper (Cu), tin (Sn), and lead (Pb) were predominantly deposited in the coarser fraction, ranging from 500 to 710 µm at 28.7, 20.5, and 11.1 wt.%, respectively. On the other hand, metals such as iron (Fe), zinc (Zn), manganese (Mn), nickel (Ni), and aluminum (Al) were mostly deposited in the finer fraction, which ranged from 38 to 150 µm at 37.3, 5.9, 8.8, 1.3, and 4.2 wt.%, respectively. After the bioleaching process, it was observed that higher metal extraction occurred at a PS ranging from 38 to 150 µm, which achieved recovery efficiency rates of 62.9%, 68.2%, 95.3%, 86.1%, 61.9%, 47.2%, 21.2%, and 63.6% for Al, Cu, Fe, Mn, Ni, Pb, Sn, and Zn, respectively, over 10 days.
1. Introduction
The use of electric and electronic equipment (EEE) has rapidly increased over the years due to technological advances and the advent of the Fourth Industrial Revolution (4IR). However, EEE has short lifespans, and this has resulted in the accumulation of electronic waste (e-waste), which has become a severe environmental and human health hazard due to the abundant hazardous metals that the materials possess [1,2]. E-waste is a generic word that refers to various EEE, which has reached the end of their lifecycles and/or have been damaged and cannot be reused. E-waste is mostly embedded with precious metals, such as gold (Au) and silver (Ag); hazardous metals, such as lead (Pb), cadmium (Cd), mercury (Hg), and chromium (Cr); and non-ferrous metals, such as aluminum (Al) and copper (Cu), amongst others. E-waste is also made of toxic materials such as brominated flame retardants, phthalates, polyvinyl chloride, and antimony (Sb), which is also considered to be a critical metal [3]. The improper disposal of electronic waste in landfills causes harm to the environment, leading to pollution and deterioration. Such actions are not only detrimental to human health, but also allow hazardous materials, like chemicals and metals found in e-waste, to seep into groundwater reserves that living organisms rely on for survival.
Printed circuit boards (PCBs) have been noted as one of the e-waste materials that contain valuable metal content, where 28–30% is the metallic portion, and 70–72% is the non-metallic portion, such as polymers, ceramics, plastics, fiberglass, brominated flame retardants, etc. Therefore, PCBs can serve as alternative secondary sources of base, precious, and rare earth metals (REMs) [4]. It is worth mentioning that the element contents deposited on PCBs are ten to a hundred times higher than those of mined natural ores [5]. Recovering metals from PCBs is essential, and the steps involved in the recovery process start with mechanical processing, where the dismantling, milling, and pulverization of PCBs are carried out. It has been reported that finely pulverized fractions of PCBs are supposedly embedded with higher metallic contents than coarser fractions, while ultrafine fractions are poor in metal content [6]. Indigenous processes, such as pyrometallurgy and hydrometallurgy, have been previously used to recover metals from e-waste, but the use of these methods has been disadvantageous due to their severe environmental impact and the production of secondary pollutants, such as brominated and chlorinated di-benzo furans and dioxins, and higher energy inputs and chemical reagent consumption [2,3,7,8]. Bio-hydrometallurgy has gained tremendous attention from researchers as a prominent process to recover metals from e-waste because this process has been deemed to be eco-friendly, has a lower operational cost, and requires lower energy inputs [9]. To date, two different bioleaching approaches have been employed, i.e., direct and indirect approaches (one-step and two-step) [10]. In the one-step bioleaching method, microorganisms are incubated along with the e-waste in the culture medium, and this method can affect microorganisms’ growth and lead to lower metal recovery efficiency (RE) due to the toxicity of e-waste [11,12]. The majority of previous studies have focused on the one-step bioleaching method to recover metals from e-waste, which has been reported to have a negative impact on microorganisms’ growth and lixiviant generation due to the toxic elements embedded in e-waste, thus resulting in lower metal RE [13]. In a two-step bioleaching process, microorganisms are grown in the absence of e-waste until the microorganisms reach their logarithmic growth phase in which the concentration of the lixiviant would be higher, and thereafter, e-waste is added to the media; this approach has been observed to promote a higher metal RE [12,14,15]. In addition to this, numerous studies have explored the use of pure fungal and bacterial cultures for the bioleaching of metals from e-waste, with minimal application of a microbial consortium in the recovery of metals from e-waste. This, therefore, is the first report on the bioleaching of TV PCBs using an iron- and sulfur-oxidizing microbial consortium.
This study uses a two-step bioleaching method to extract the metals of interest from PCBs using a mixed microbial consortium of iron- and sulfur-oxidizing acidophiles. This study also aimed to assess the effect of the particle size (PS) distributions of PCBs on the metal content and to investigate the effect of PS on the bioleaching efficiency of Cu, Ni, Pb, Zn, Mn, Fe, Al, and Sn.
2. Results
2.1. E-Waste Characterization for Metal Content
Particle Size Distribution (PSD)
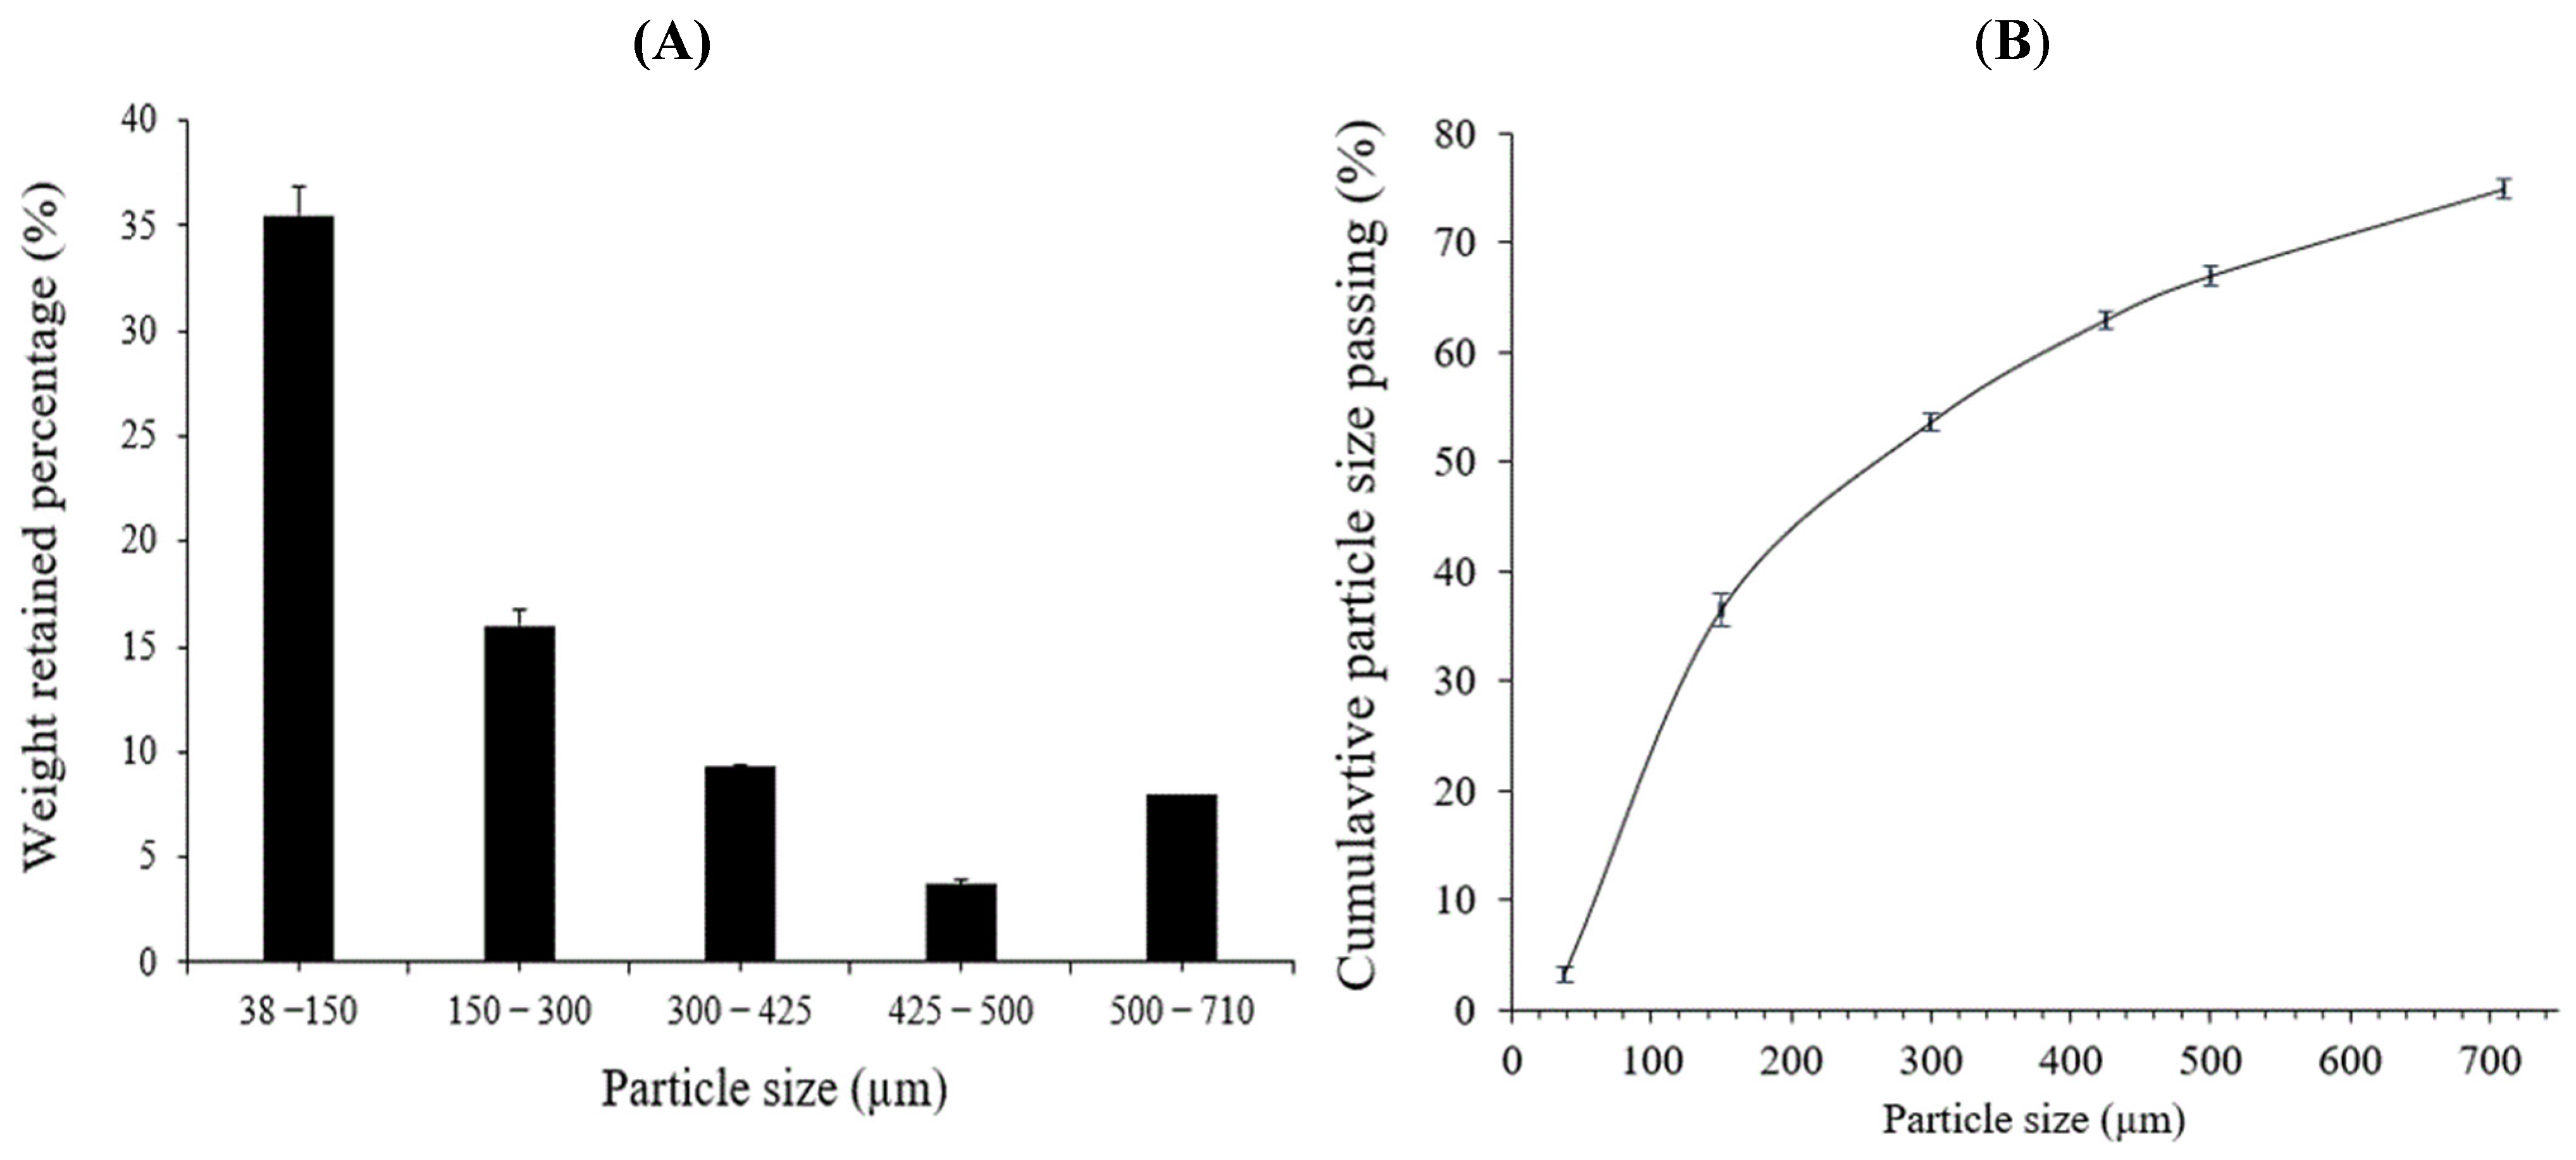
The particle size distributions of the PCBs after pulverization are shown in Figure 1, where the range of PSD in the sample represents the mass percentage passing, and the Cu and Cc values were determined.
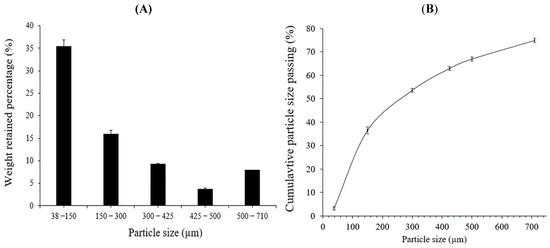
Figure 1.
Particle size distribution of PCB. Weight percentage retained (%) by particle size class (A). (B) Cumulative particle size distribution percentage.
An insight gained into the PCB samples was that their sizes were determined to be 113.5 µm. This indicated that more than half of the PCB samples had a size greater than 113.5 µm.
The d10, d30, d50, and d60 values were determined to be 50.4, 113.5, 255.6, and 383.5 µm, respectively. It was noted that there were no gaps in the size classes since all PSs were represented. Based on the d50 value given, it is worth noting that the PCB samples used were predominantly coarser. To demonstrate that the PCB samples are coarser and well distributed, both criteria conditions need to be satisfied (Cu > 4 and 1 < Cc < 3). In this study, the values of Cu and Cc were 7.6 and 0.67, respectively, and only one criterion condition was satisfied. Therefore, the PCB samples were not well distributed, which demonstrated that the size classes between the coarse and fine particles were limited.
2.2. Printed Circuit Board Element Content Analysis (XRF)
An important aspect of designing bioleaching processes is to determine the elements that are embedded in PCBs in the different PS fractions after mechanical grinding, milling, and pulverization processes. Chemical characterization of PCBs outlined an important aspect based on their PS regarding where the valuable elements are highly embedded, which has been scarcely researched in the literature to date. This study outlined significant information on elemental compositions (wt.%) post-PSD and the concentration of elements at a different PS fraction.
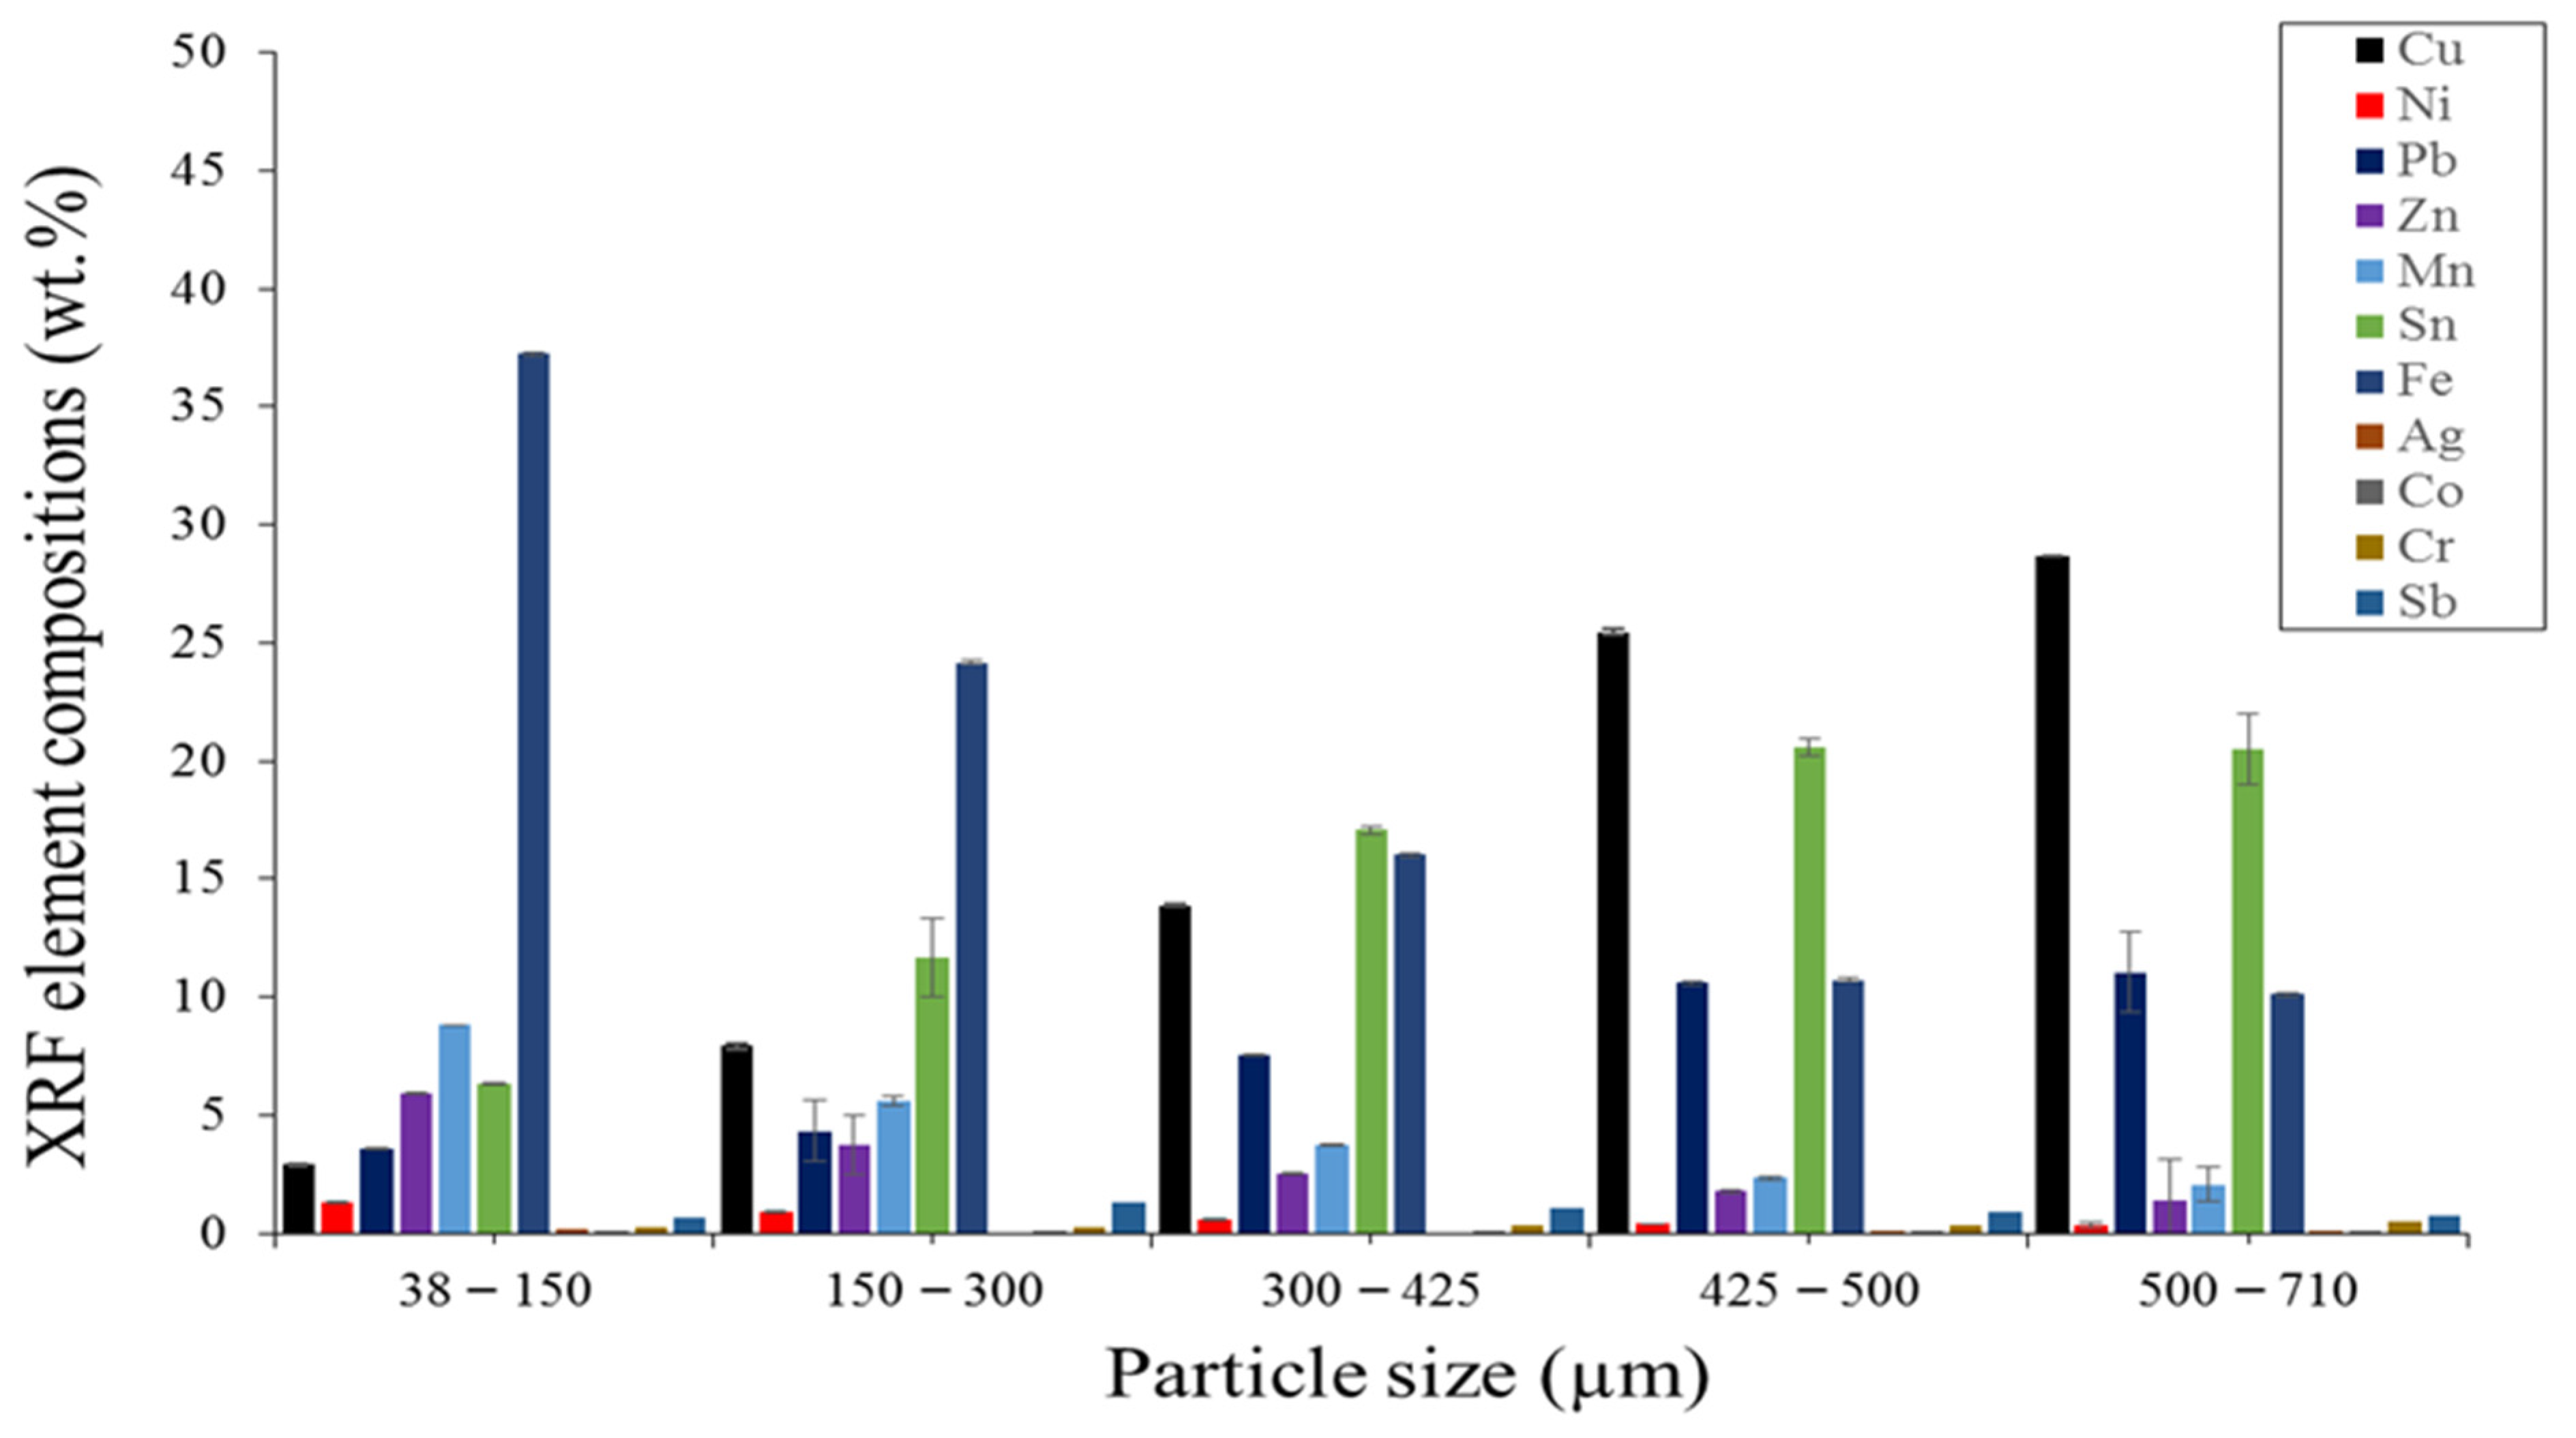
The results obtained from the XRF analysis as represented in Figure 2 comprehensively show the metals embedded in PCB. An indirect relationship between particle size and metal content was observed for Fe, Zn, Mn, and Ni where an increase in PS decreased the metal content. The Cu content (wt.%) behaved differently where an increase in PS increased the Cu content. The XRF results also show a presence of a critical metal, Sb.
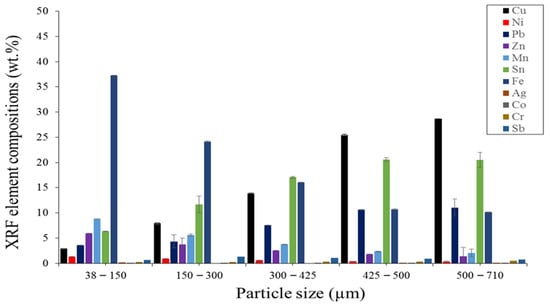
Figure 2.
A profile showing the elemental composition of the PCBs at different particle sizes using X-ray fluorescence.
2.3. The Alkalinity Nature of PCB
In this study, the initial pH of the distilled water used to dissolve the PCBs was measured and found to be 7.62 and after a 24 h period, after allowing the solution to interact with the PCBs, the pH was determined to be 8.37. This increase in pH indicated the alkaline nature of the PCBs.
2.4. Culturing of Microorganisms and Element Bioleaching
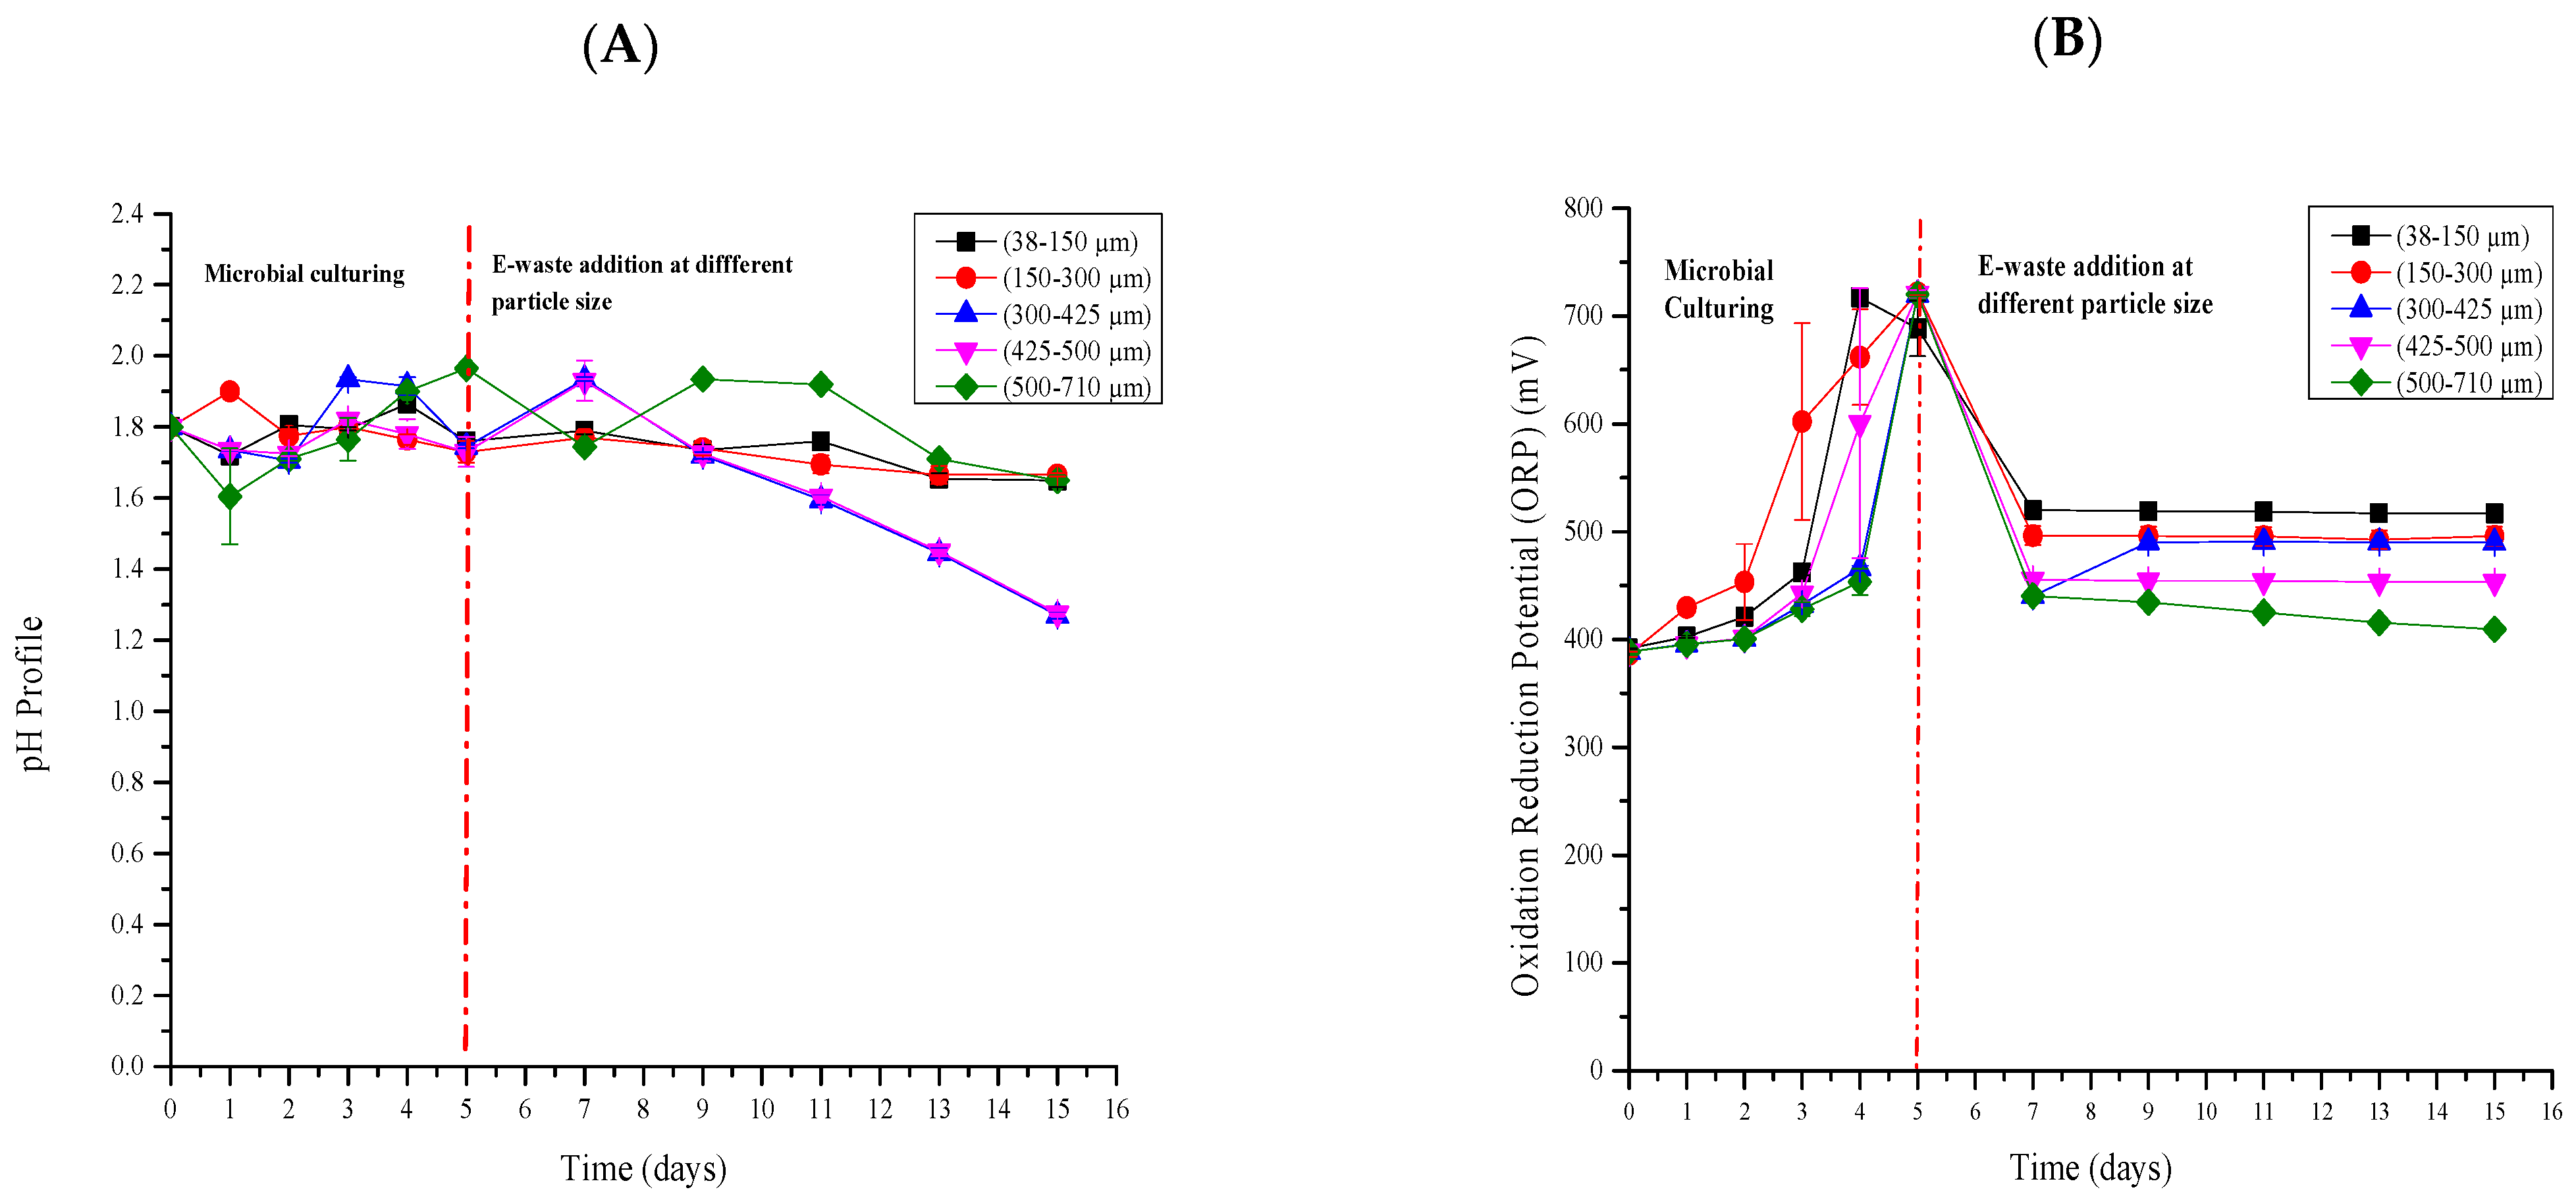
Before the bioleaching process, the acidophilic iron- and sulfur-oxidizing microorganisms were pre-cultured in 9K media, in the absence of PCBs. The two-step process was used to minimize the inhibitory effects of PCBs on microbial growth, which can occur due to the presence of hazardous compounds, which include brominated and phenolic compounds, which are embedded in the PCBs. The pre-culturing continued until the oxidation–reduction potential (ORP) reached a value over 600 mV. Figure 3 represents the profile of the pH and ORP in the culture medium over time, showcasing the changes in these parameters during the bioleaching process.
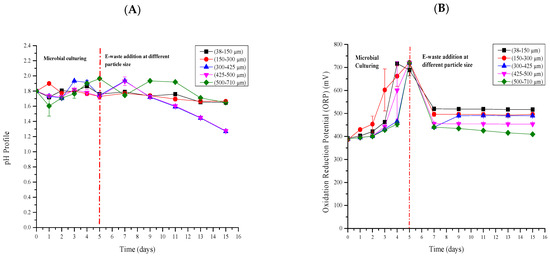
Figure 3.
A profile showing the pH (A) and oxidation–reduction potential over the experimental period (B). The red line on day 5 represents the day the e-waste was added to the medium.
In the first 5 days of the experiment, the study was run without the presence of PCBs and when the ORP was above 600 mV, the PCBs were added at a pulp density (PD) of 1% (w/v). The pH is an important factor in bioleaching systems as it usually controls microbial growth, and the pH increase was observed after the addition of 1% w/v PD as illustrated in Figure 3A. The ORP profile (Figure 3B) also showed a decrease when the e-waste was added, and this decrease varied depending on the PS. However, a significant decrease was witnessed with a PS of 500–700 µm where an ORP of 400 mV on the last day of the experiment occurred, from an ORP of 720 mV.
2.5. The Effects of Particle Sizes on Metal Recovery
The bioleaching of various metals, namely, Zn, Pb, Cu, Mn, Ni, Fe, Al, and Sn, was conducted at different particle sizes (µm), which were the selected metals of the study.
2.5.1. Zinc Bioleaching
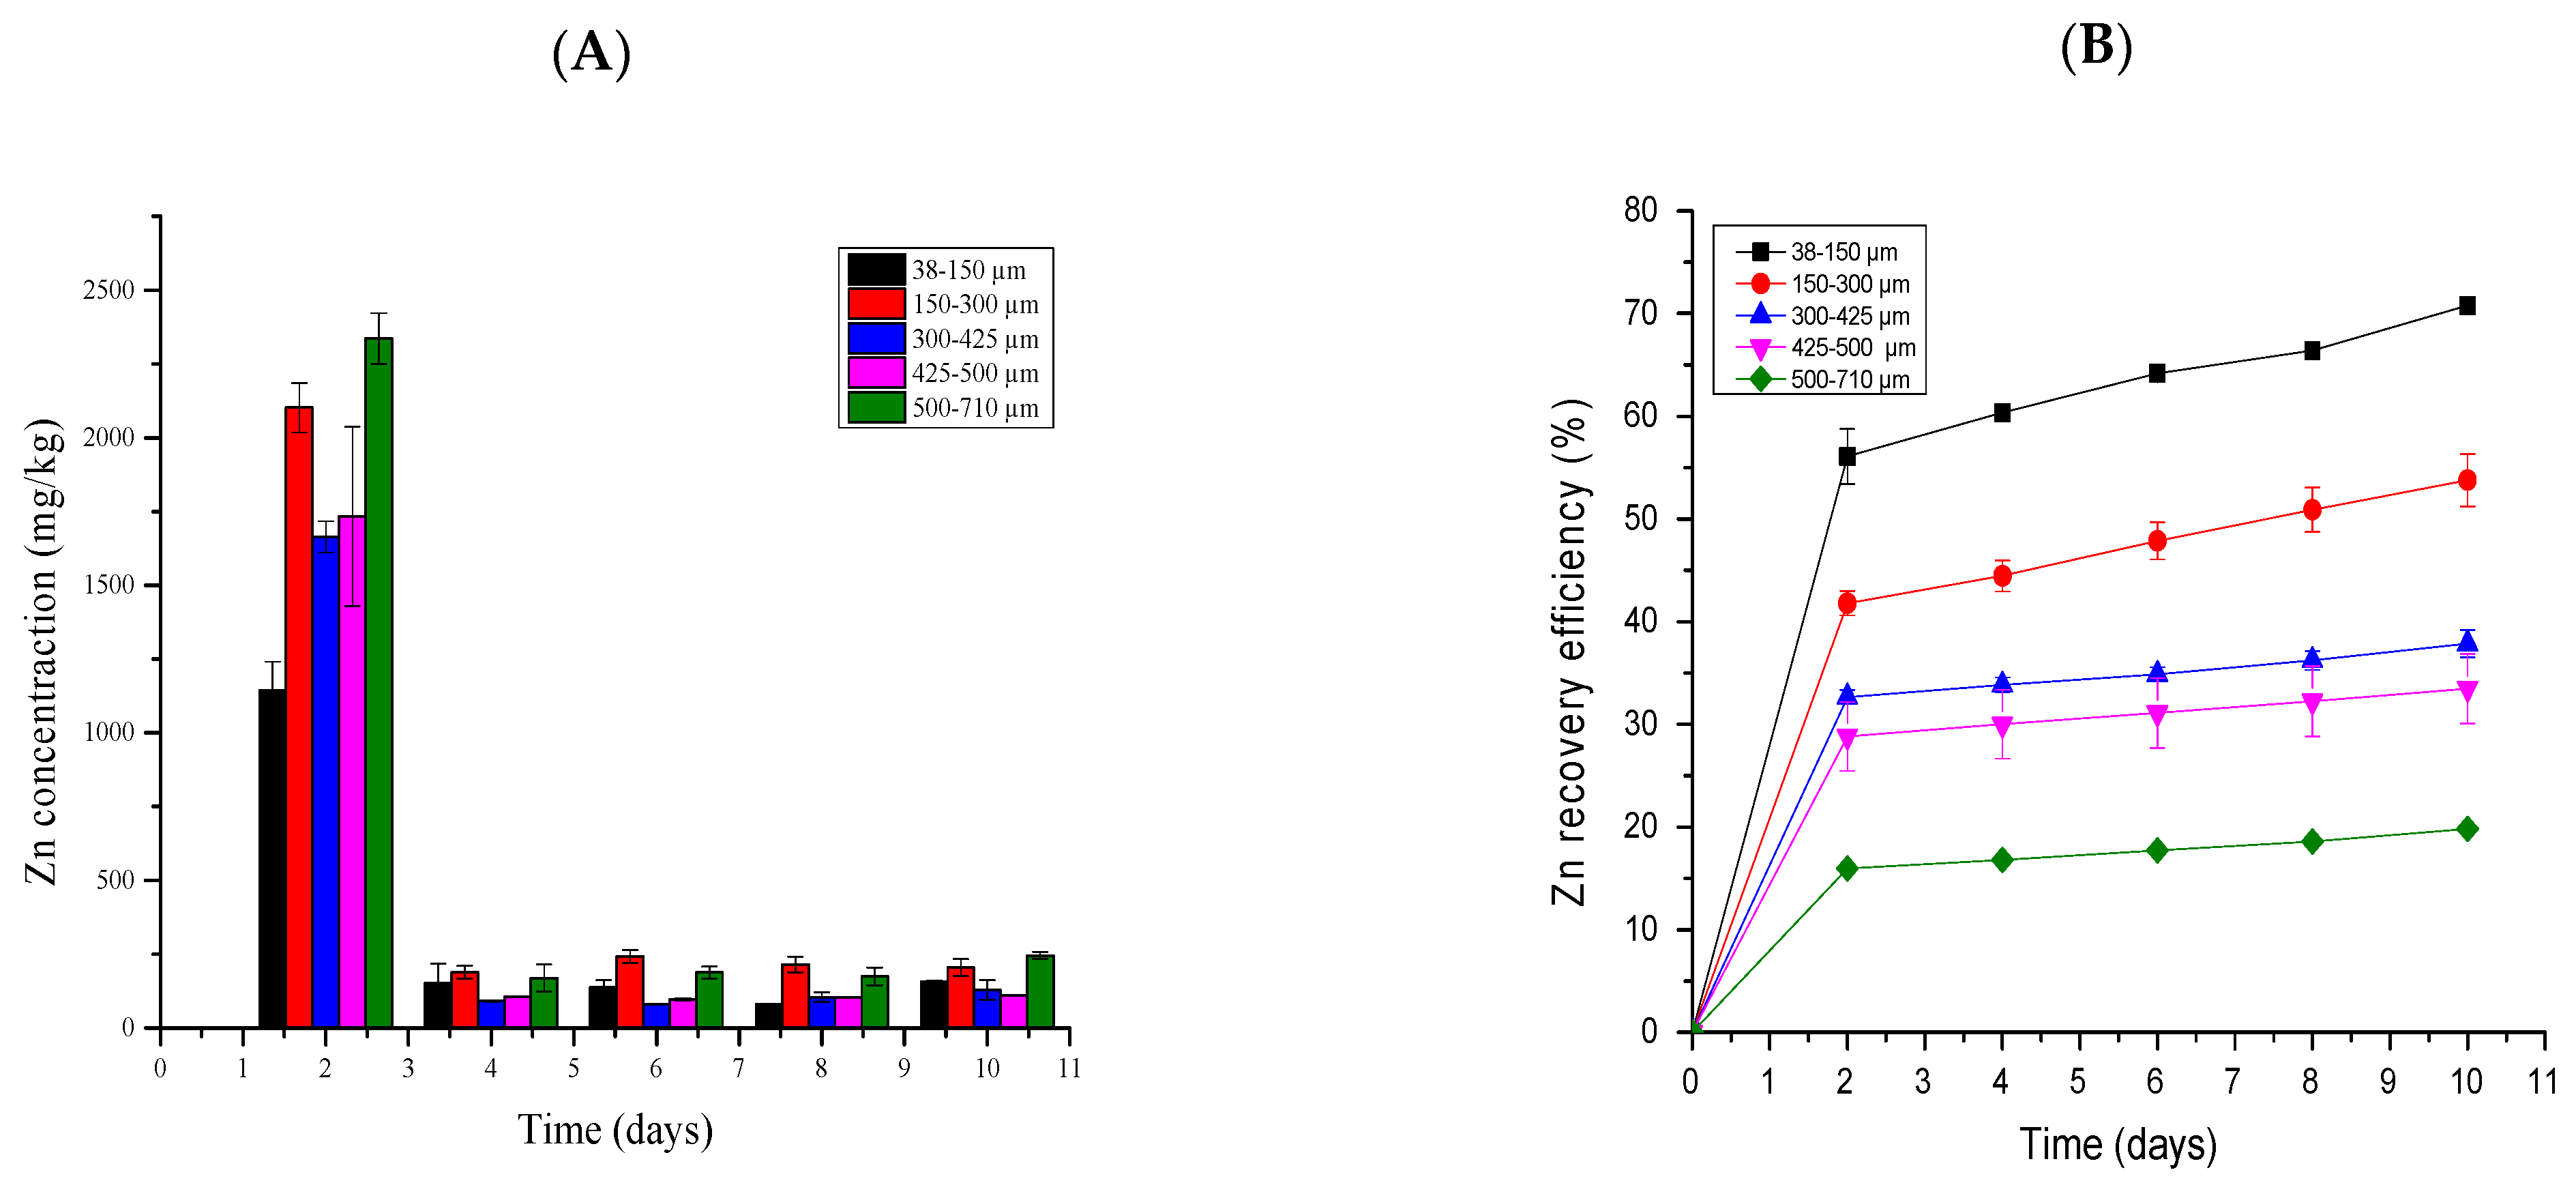
The effects of particle size on Zn bio-dissolution were studied in batch experiments, at 37 temperature and an agitation speed of 150 rpm. The leachate samples were analyzed using the ICP-OES and the metal recovery efficiency of the tested particle sizes and their concentrations were determined as shown in Figure 4.

Figure 4.
A profile showing the Zn dissolution concentration in PCB pulp density (mg/kg) (A) and the effect of particle size on Zn recovery efficiency (%) (B).
In this study, the highest Zn RE achieved was at PS ranging from 38 to 150 µm, which was 70.8%, followed by the particle size ranging from 150 to 300 µm, which achieved the Zn RE of 53.8% on the last day of bioleaching.
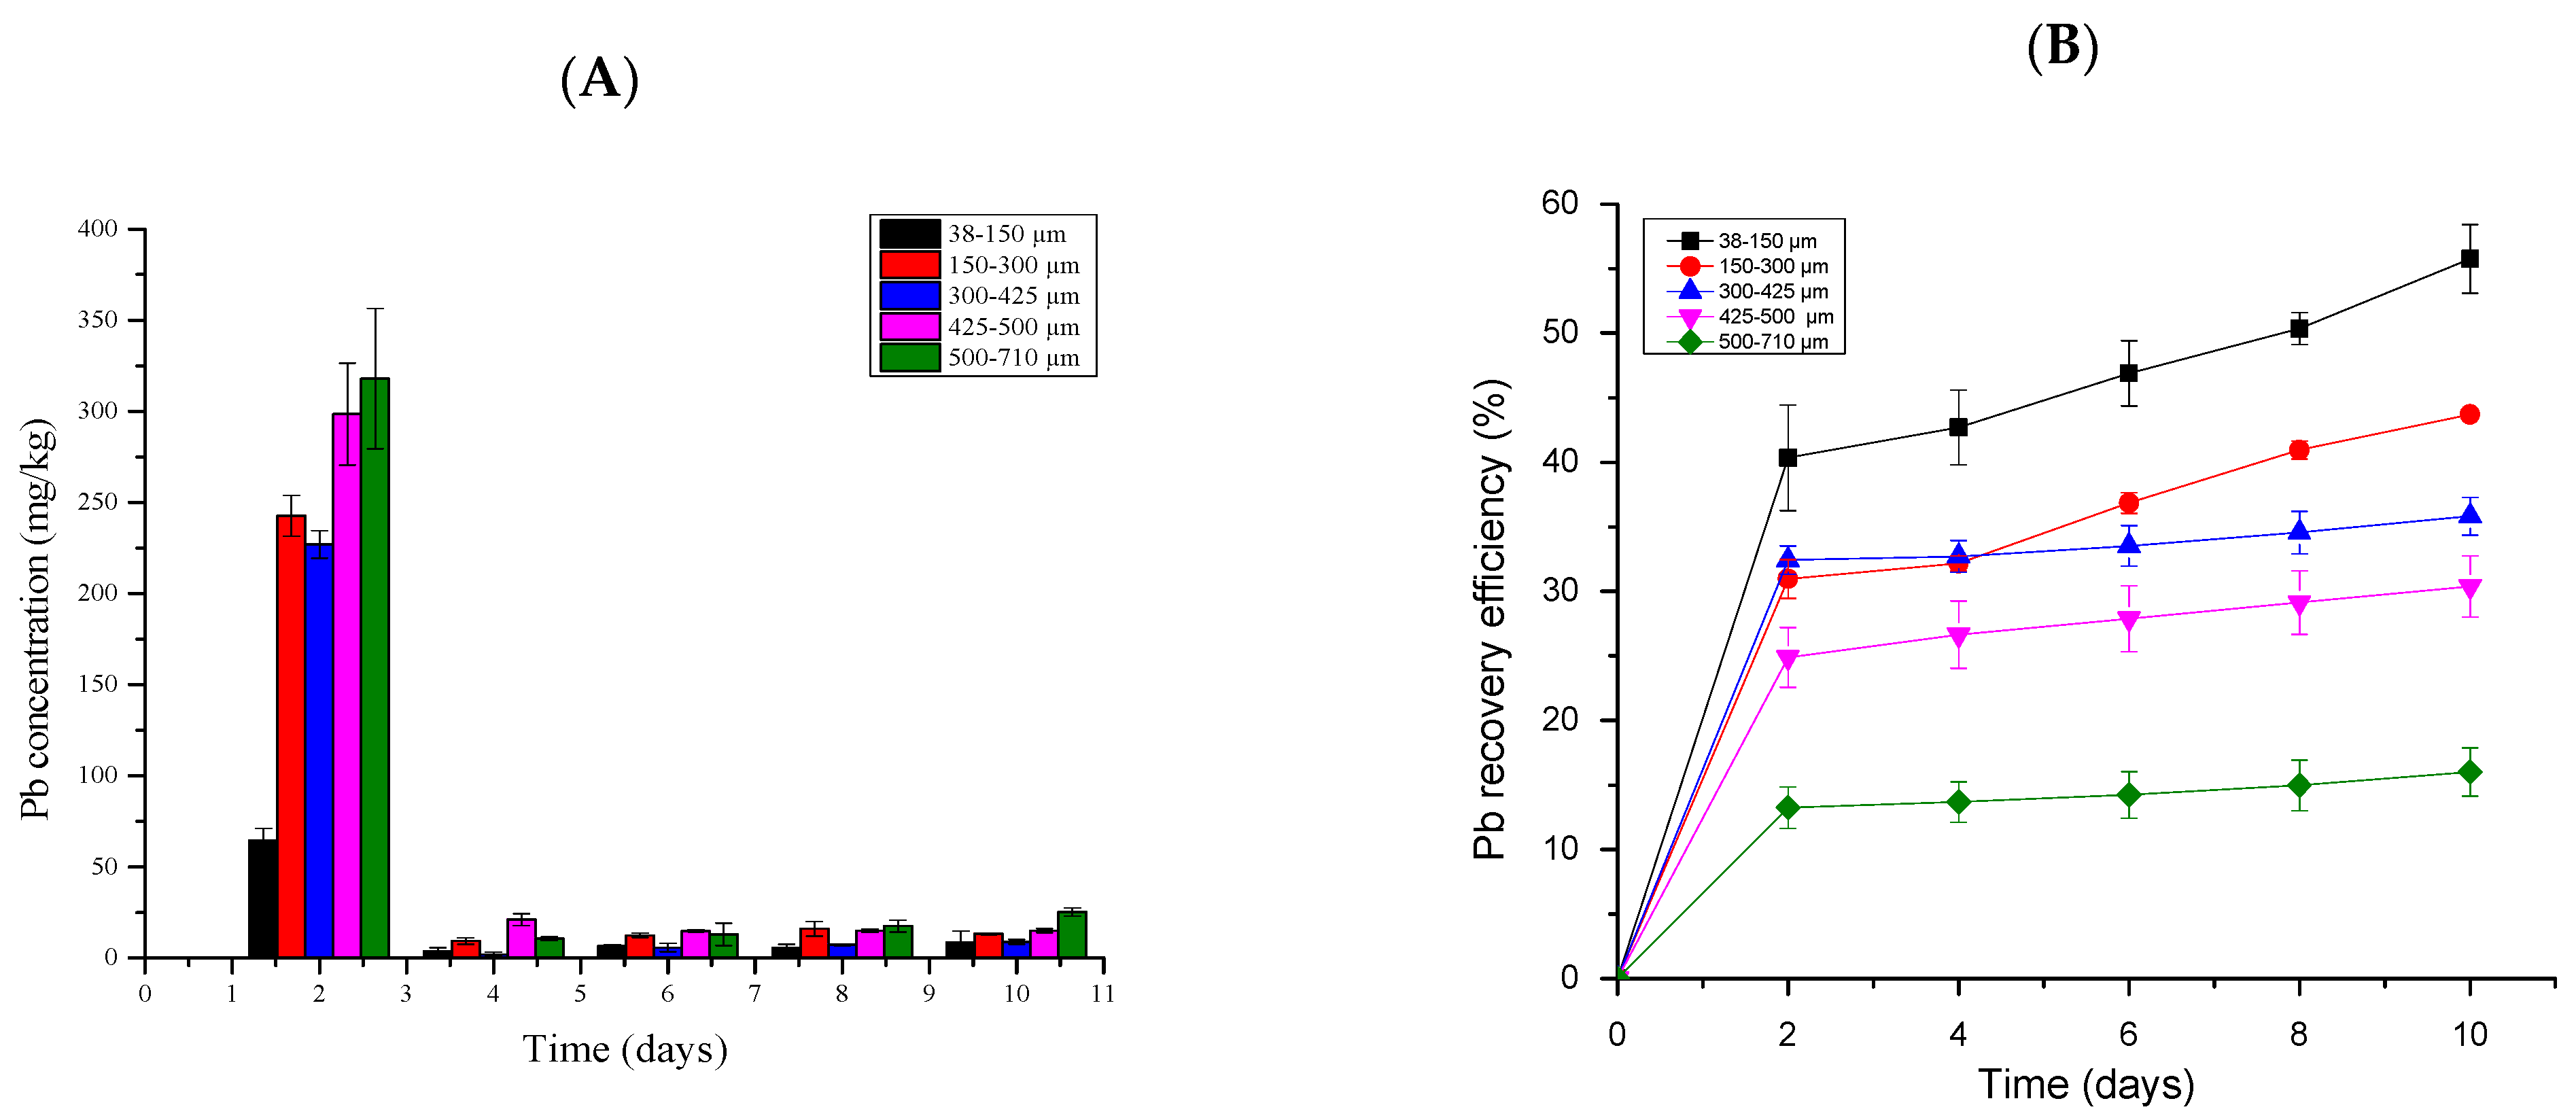
2.5.2. Lead Bioleaching
Figure 5 represents the Pb dissolution concentration and recovery efficiency. Low Pb RE was achieved in this study where the PS ranging from 38 to 150 achieved 47.2% followed by the PS at a range of 150–300, which achieved 36.93% of Pb. The dissolution concentration of Pb decreased over the experimental period irrespective of the tested PS and the highest extraction period was observed on day 2 after inoculation to the media where the highest concentration was observed at 320 mg/kg from a particle size of 500–710 µm (Figure 5A). This observation was expected since Pb is acid-soluble. However, the RE from the PS ranging from 500 to 710 was the lowest, at 14.4%.
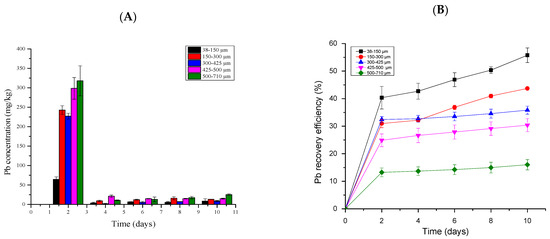
Figure 5.
A profile showing the Pb dissolution concentration per gram of PCB (mg/kg) (A) and the Pb efficiency recovery (%) (B) at different particle sizes.
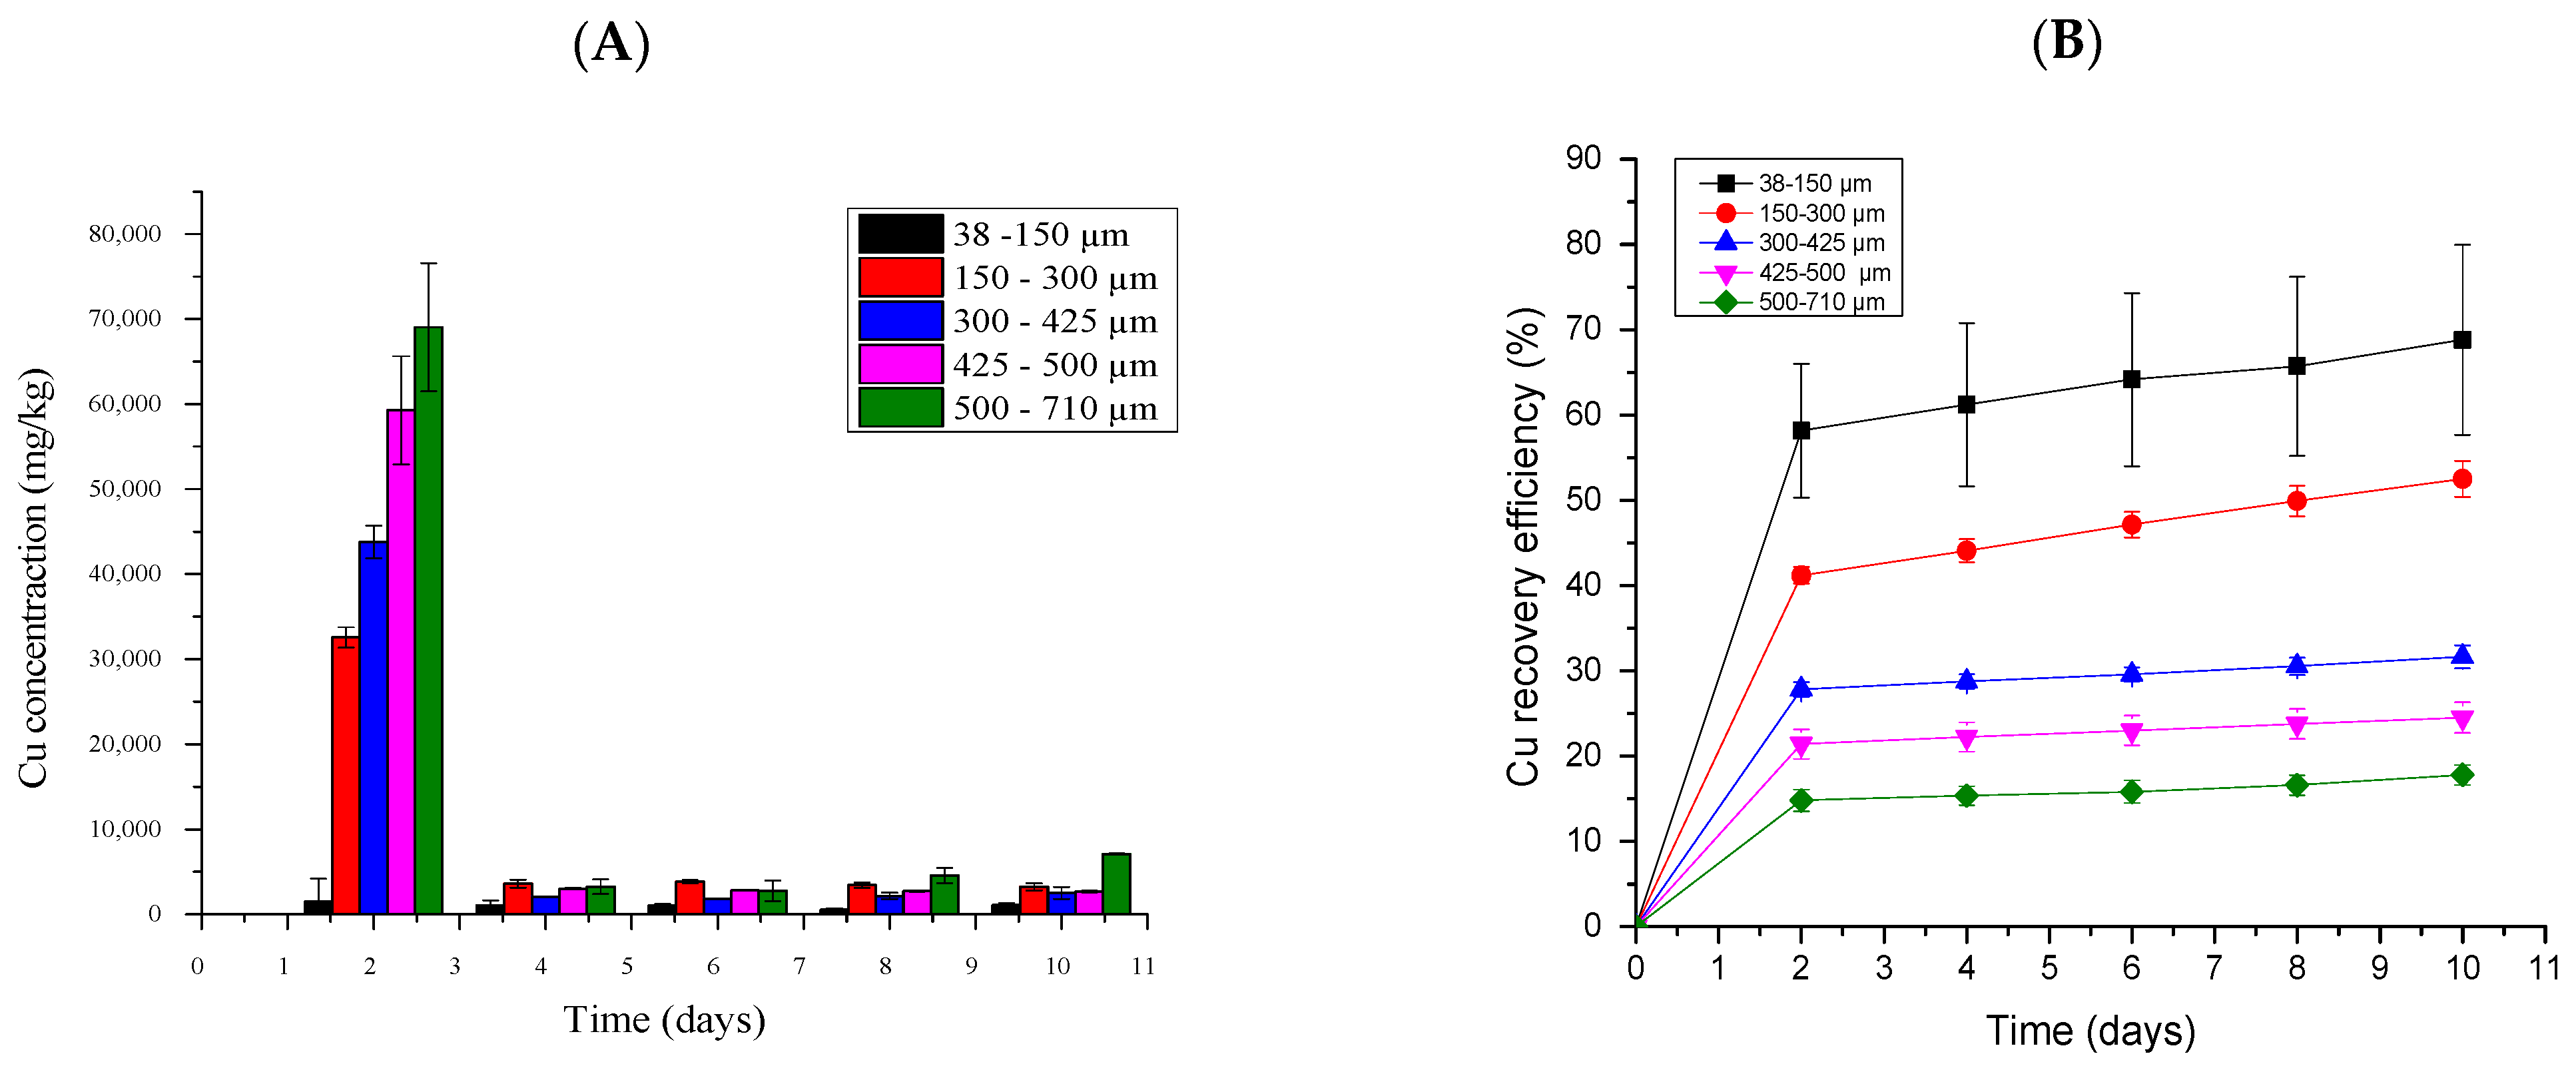
The PS ranging from 38 to 150 µm achieved the best performance where the achieved RE was slightly above 55% as represented in Figure 6B. The data also showed that the PS ranging from 300 to 425 and 425 to 500 achieved an RE of 35.8% and 30.4%, respectively.

Figure 6.
A profile showing the Cu dissolution concentration per gram of PCB (mg/kg) (A) and Cu efficiency recovery (%) (B) at different particle sizes.
2.5.3. Copper Bioleaching
The XRF analysis demonstrated that Cu was the metal that was most abundant in the PCB (Figure 2) and Cu bio-dissolution was tested at varying particle sizes (38–150, 150–300, 300–425, 425–500, and 500–710 µm) for 10 days. The study was conducted to analyze the relationship between PS and metal recovery efficiency. The data in Figure 6A show the Cu was majorly extracted on day 2 after the e-waste was introduced to the medium where the highest Cu concentration was achieved at a PS of 500–710 µm, with a concentration of 6820 mg/kg. Similar to previous findings (see Section 2.5.1 and Section 2.5.2), the PS of 500–710 µm achieved the lower RE, which was 16.1% whereas the lowest PS (38–150 µm) achieved an RE of 68.8%.
The Cu concentration significantly decreased in all PSs throughout the bioleaching time as represented in Figure 6A. The results obtained revealed that the Cu RE decreased with an increase in PS ranging from 38–150 to 500–710 µm, respectively, and a higher Cu RE of 68.8% was obtained at PS ranging from 38 to 150 µm.
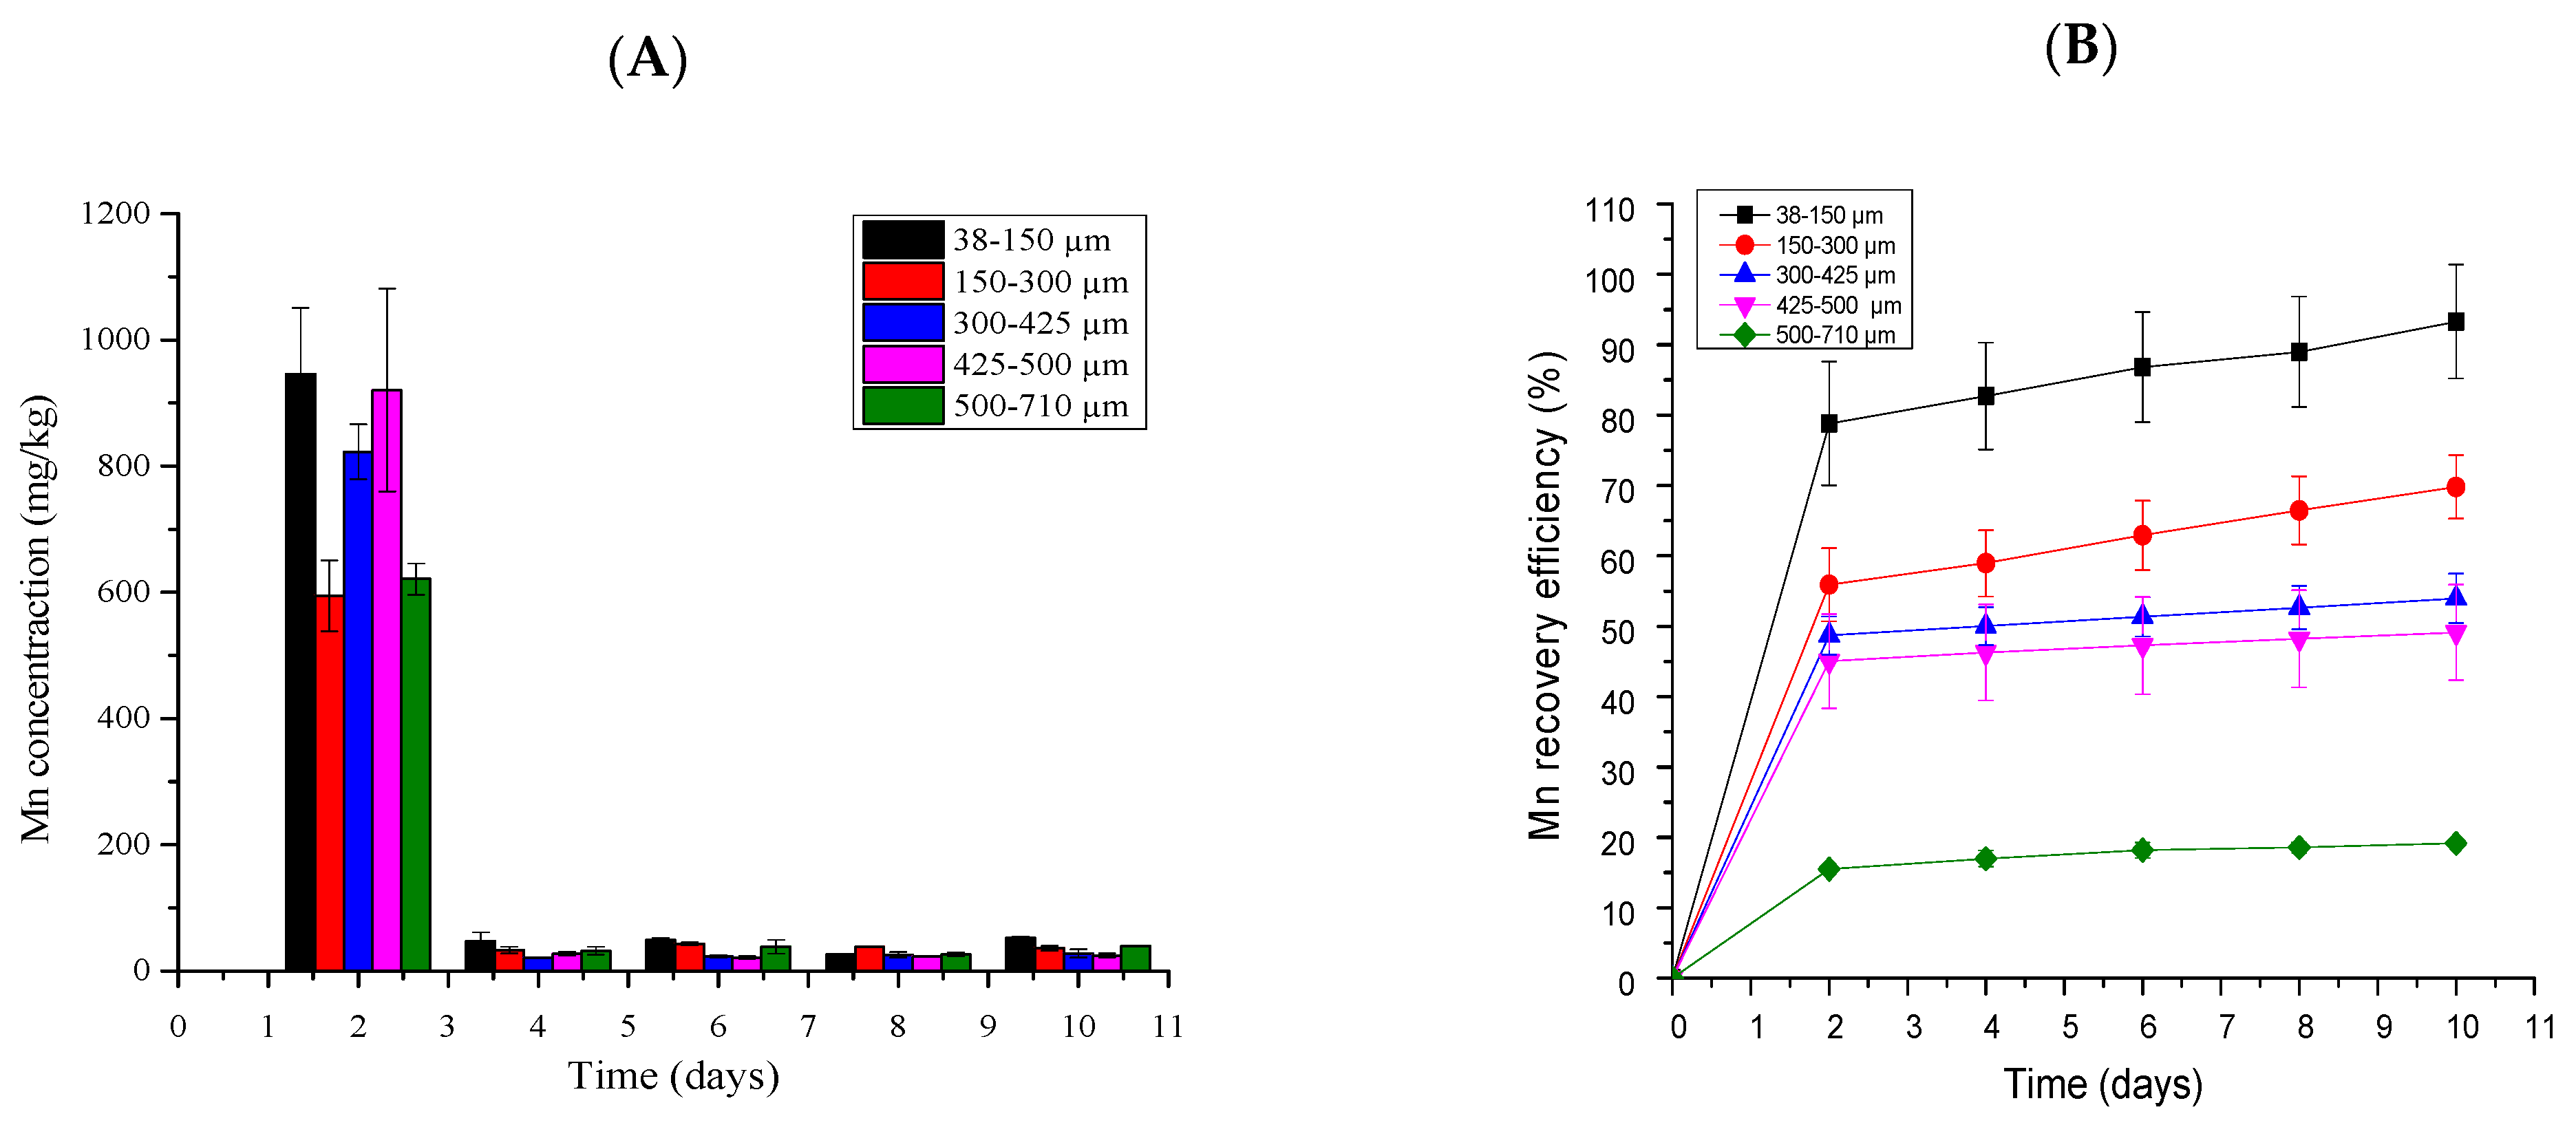
2.5.4. Manganese Bioleaching
Figure 7 shows the profile of the Mn concentration and RE at different PS.

Figure 7.
A profile showing the Mn dissolution concentration per gram of PCB (mg/kg) (A) and Mn efficiency recovery (%) (B) at different particle sizes.
The maximum Mn RE of 93.3% was achieved at PS ranging from 38 to 150 µm while the remaining PS of 150–300, 300–452, 425–500, and 500–710 µm achieved an RE of 69.8%, 57.5%, 42.4%, and 19.8%, respectively. The Mn concentration was the highest at the lowest PS with a concentration of 980 mg/kg, followed by a PS of 425–500 µm at 967 mg/kg. This trend was different from the trends that were witnessed in Zn, Pb, and Cu profiles where the highest PS had the higher concentration of the mentioned metals.
2.5.5. Nickel Bioleaching
Figure 8 shows the Ni RE and dissolution concentration at different PS. The best results were achieved at a PS ranging from 38 to 150 µm with an RE of 67.7% followed by the PS ranging from 150 to 300 µm, which achieved a significant RE of 49%. It was demonstrated that the further increase in PS ranging from 300 to 425, 425 to 500, and 500 to 710 significantly decreased the RE to 41.4%, 36.6%, and 30.9%, respectively (Figure 8B).
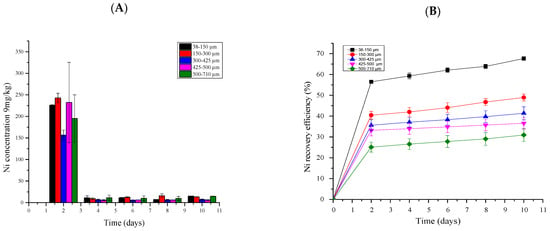
Figure 8.
A profile showing the Ni dissolution concentration per gram of PCB (mg/kg) (A) and Ni efficiency recovery (%) (B) at different particle sizes.
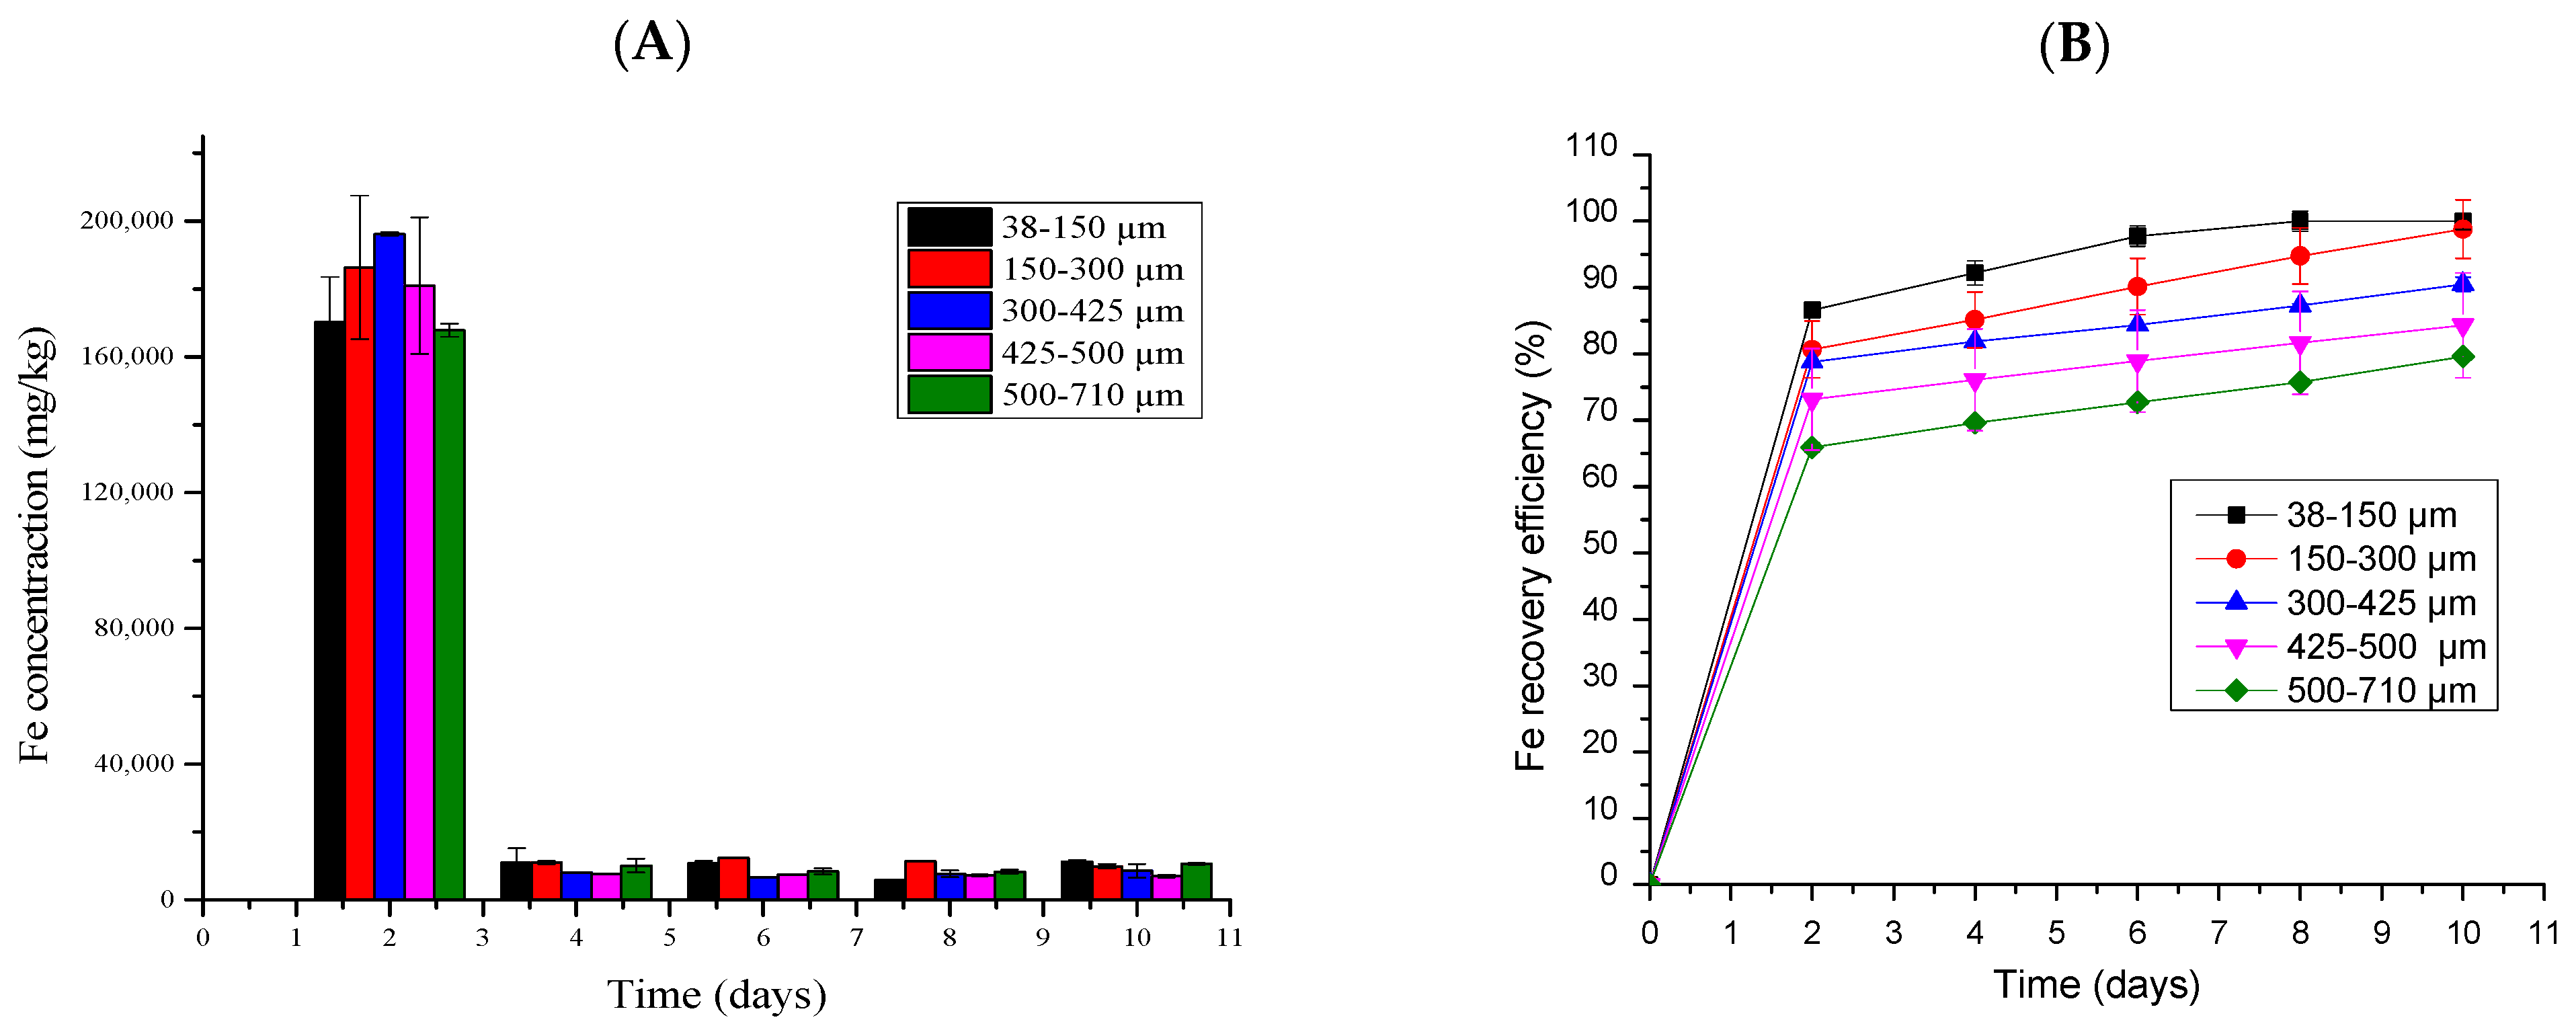
2.5.6. Iron Bioleaching
Figure 9 shows the profile of Fe extraction RE and dissolution concentration at different PS. It was discovered that Fe was readily available for extraction in all the tested PSs. However, the PS ranging from 38 to 150 µm achieved an RE of 95.3% whereas at PS ranging from 150 to 300 µm, a 90% Fe RE was achieved, with the dissolution concentration of 11,240 mg/kg.
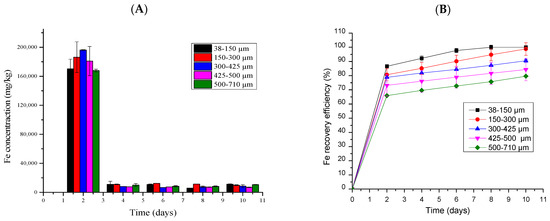
Figure 9.
A profile showing the Fe dissolution concentration per gram of PCB (mg/kg) (A) and Fe efficiency recovery (%) (B) at different particle sizes.
The further increase in the PS ranging from 500 to 710 µm led to the decrease in Fe RE to 54.9%.
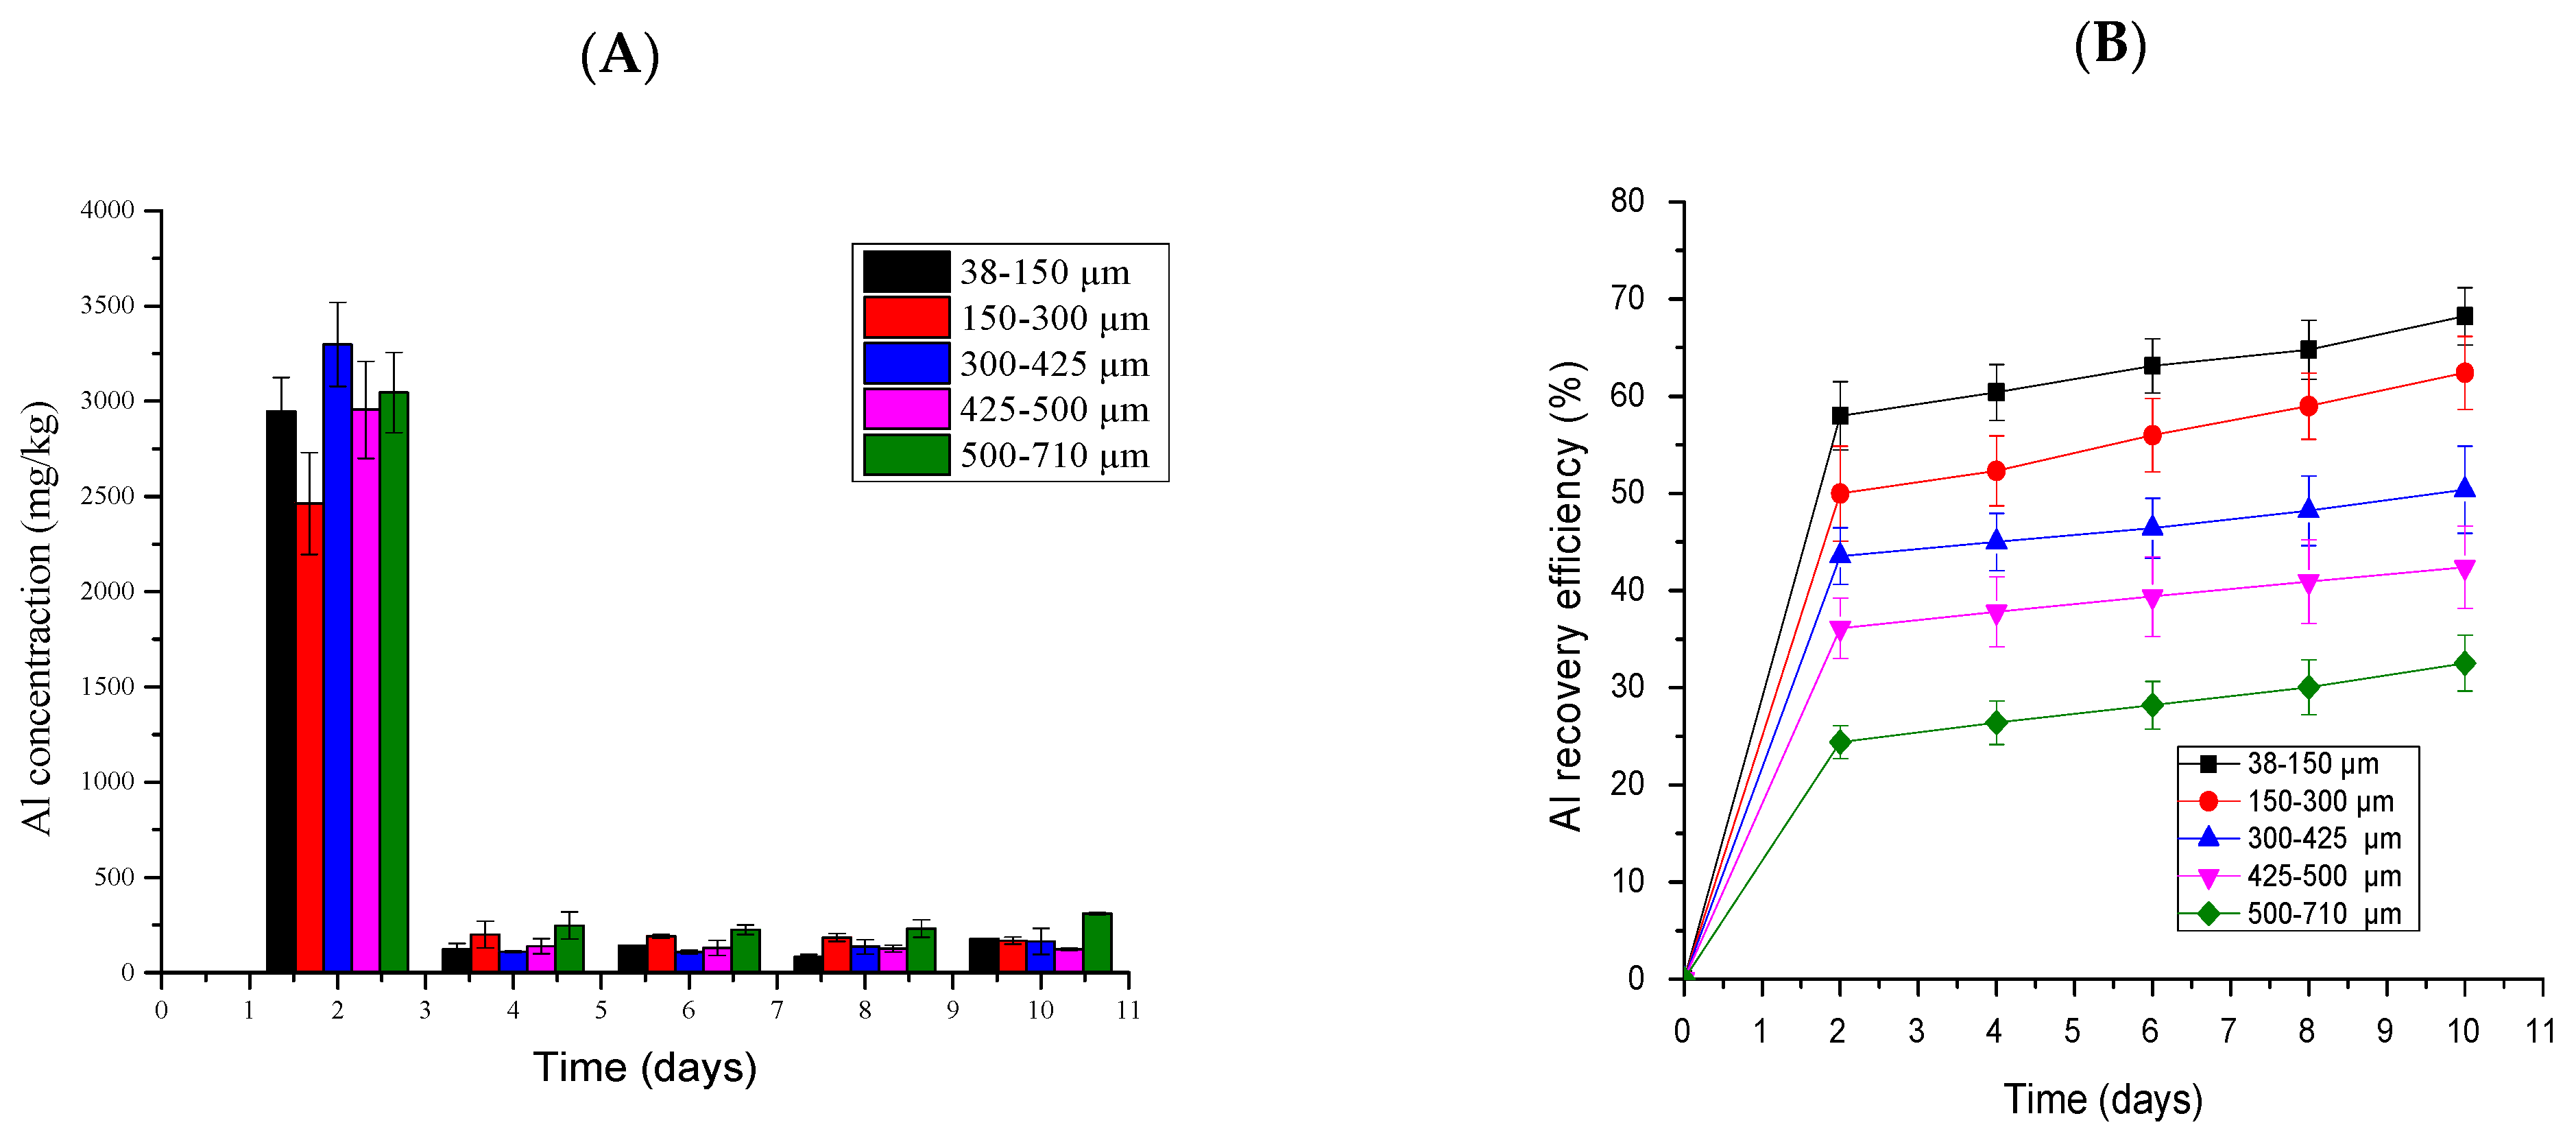
2.5.7. Aluminum Bioleaching
Figure 10 represents the Al dissolution concentration and RE at different PS. The highest dissolution concentration was achieved and observed at a PS of 300–425 µm at a concentration of 3888 mg/kg followed by a PS of 500–710 µm at a concentration of 3115 mg/kg (Figure 10A). The highest Al RE was achieved at PS ranging from 38 to 150 µm at 68.2% while the PS ranging from 150 to 300 µm achieved 58.6%. It was observed that the further increase in PS ranging from 300 to 425, 425 to 500, and 500 to 710 µm decreased the RE to 50.4%, 42.4%, and 32.5%, respectively (Figure 10B).
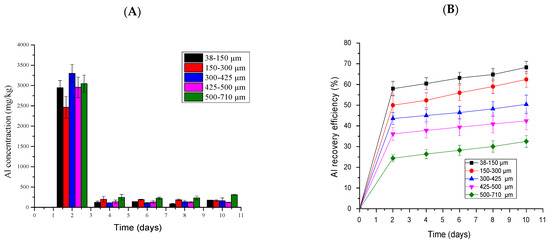
Figure 10.
A profile of the Al dissolution concentration per gram of PCB (mg/kg) (A) and Al efficiency recovery (%) (B) at different particle sizes.
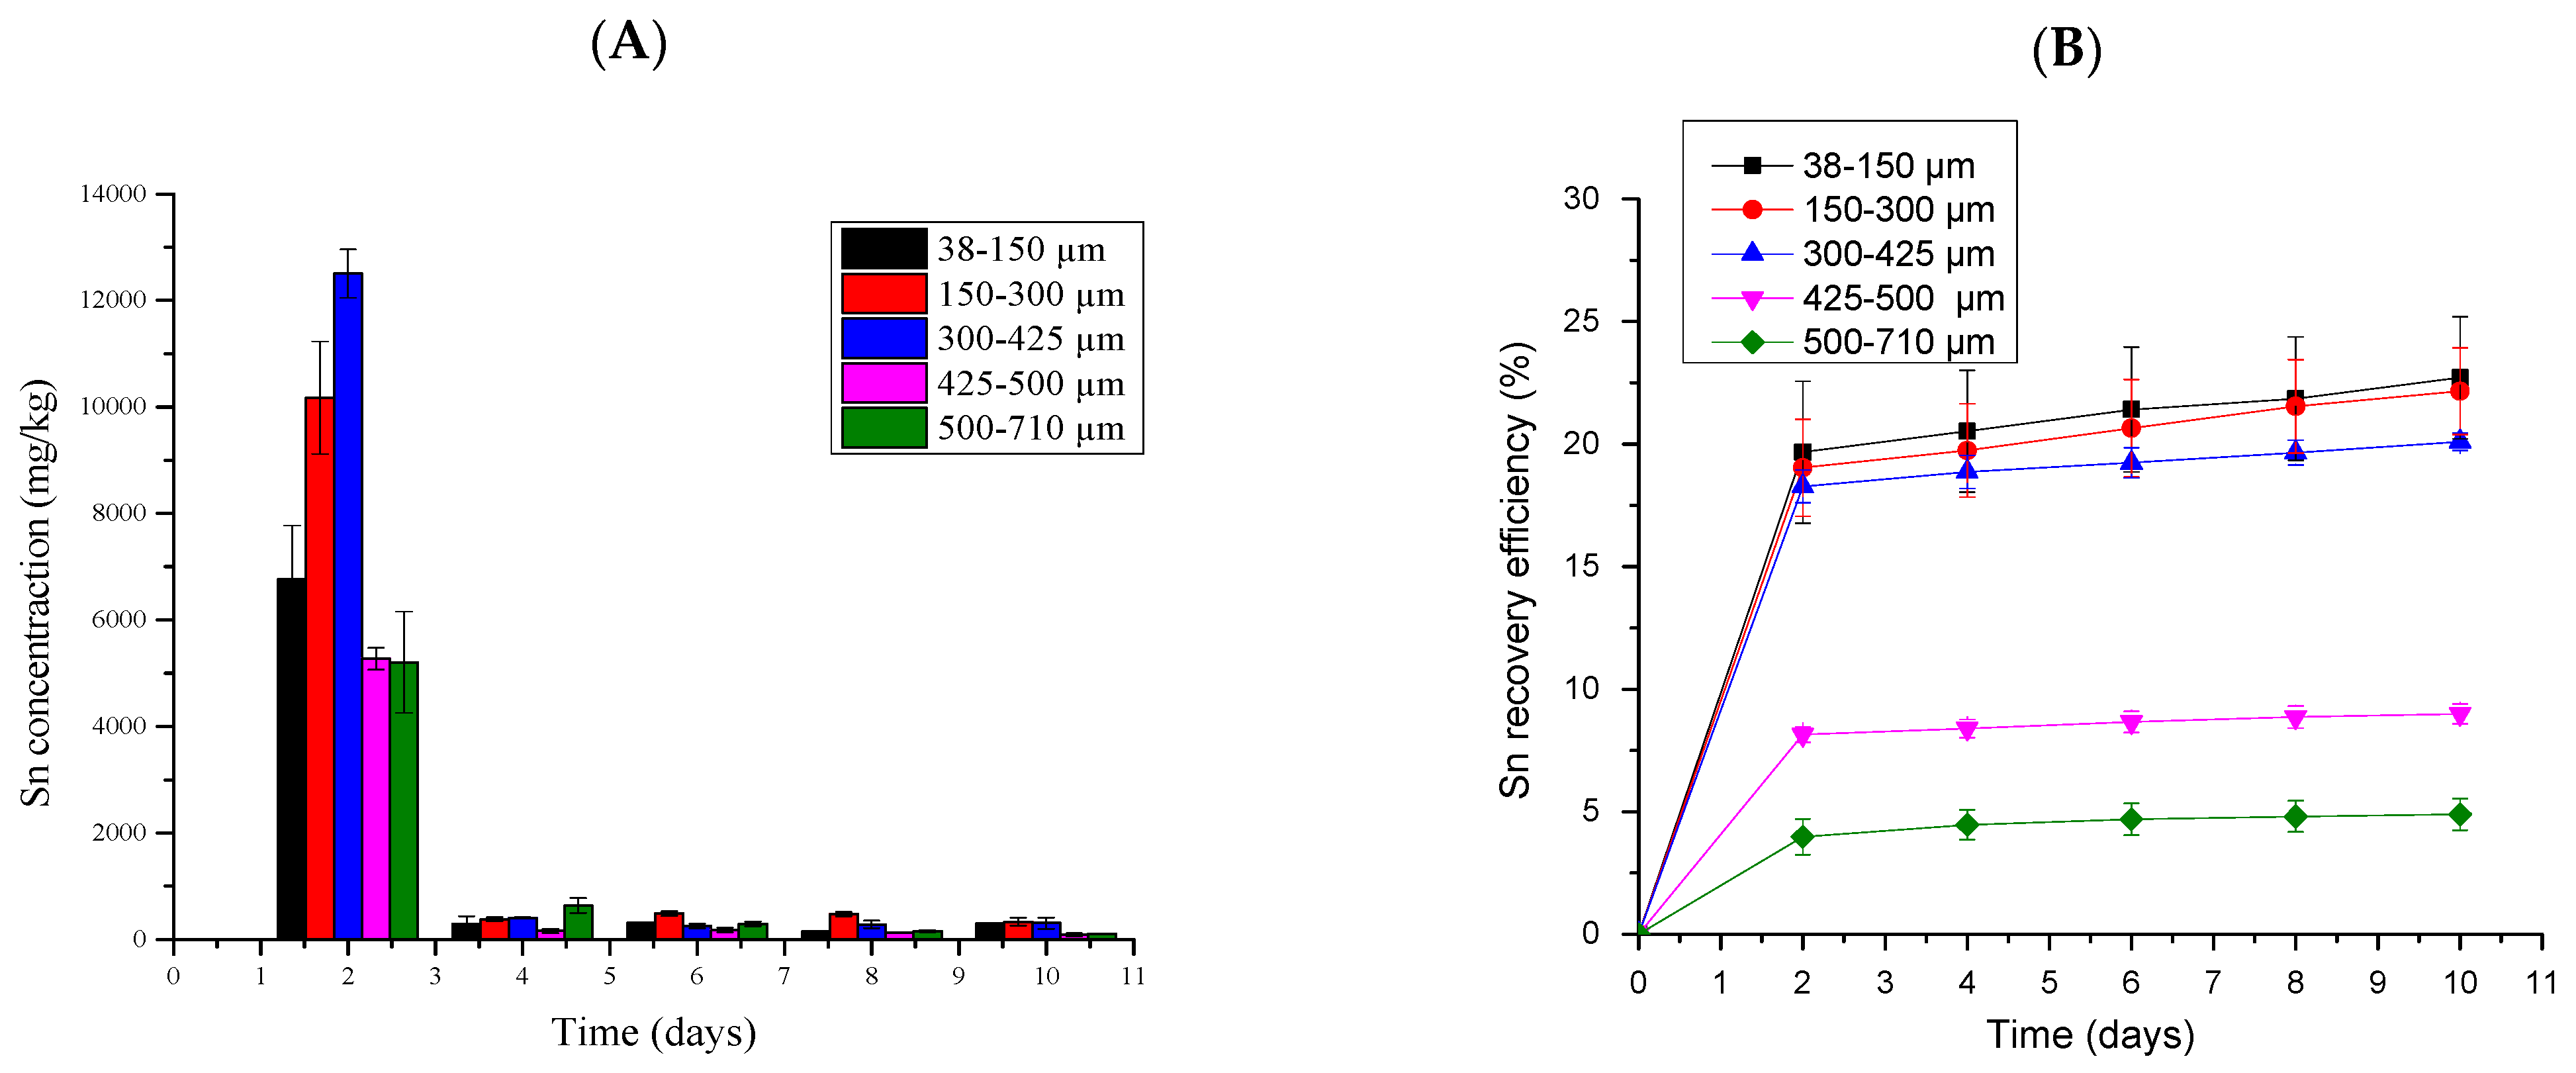
2.5.8. Tin Bioleaching
Figure 11 represents the Sn dissolution concentration and RE, respectively, at different PS. The highest Sn concentration was achieved and observed at a PS of 300–435 µm at a concentration of 12,872 mg/kg followed by a PS of 150–300 µm at 10,765 mg/kg (Figure 11A). The highest RE was observed at a PS ranging from 38 to 150 µm, which was 22.7%, followed by a PS ranging from 150 to 300 µm, which achieved 22.1%. It was noticed that the further increase in the PS ranging from 425 to 500 and 500 to 710 µm decreased the RE, which was 8.9% and 4.9%, respectively (Figure 11B).
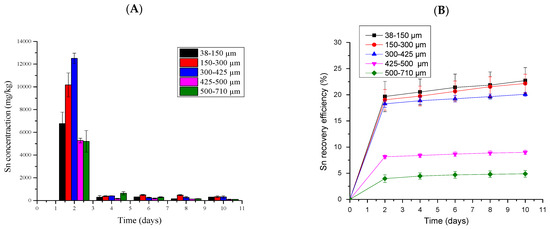
Figure 11.
A profile showing the Sn dissolution concentration per gram of PCB (mg/kg) (A) and Sn recovery efficiency (%) (B) at different particle sizes.
3. Discussion
3.1. E-Waste Characterization for Metal Content
Particle Size Distribution (PSD)
The particle size distribution of the PCBs after the milling was conducted and it was observed that the d10, d30, d50, and d60 were determined to be 50.4, 113.5, 255.6, and 383.5 µm, respectively. It was noted that there were no gaps in size classes since all PSs were represented and similar findings were observed in a study by Khashole [16]. The values of Cu and Cc were 7.6 and 0.67, respectively, and only one criterion condition was satisfied. Therefore, the PCB samples were not well distributed, which demonstrated that the size classes between the coarse and fine particles were limited; a similar finding was observed in a study by Khashole [16].
3.2. Printed Circuit Board Elemental Composition
X-ray fluorescence was used to assess the elemental composition of the PCBs at different PS. This was performed to ascertain if there were any differences in the elemental composition in the different fractions of the PCBs. An indirect relationship between particle size and metal content was observed for Fe, Zn, Mn, and Ni where an increase in PS decreased the metal content; these observations were also witnessed by Pradhan and Kumar [17] where the authors characterized the PCBs at different PS of 0.3–0.212 mm, 0.3–0.6 mm, 0.6–1.18 mm, and >1.18 mm with Fe and Ni. Fe, Zn, Mn, and Ni were highly deposited at finer fractions, which ranged from 38 to 150 µm, with 37.2 wt.%, 5.9 wt.%, 8.8 wt.%, and 1.3 wt.%, respectively. In addition, a study by Khaliq et al. [18] who observed metal content in PCBs from different studies mentioned that the Ni content ranged from 0.28 to 2 wt.%, which agrees with the findings of the present study where the Ni content ranged from 0.3 to 2.1 wt.%. Another study [19] agreed with the findings of the present study where the authors observed the highest Fe content at courser fractions, which were >1000 µm. Cu, Pb, and Sn behaved differently from Fe, Zn, Mn, and Ni where the highest contents of these metals were observed at a PS ranging from 500 to 710 µm compared with the rest of the particle sizes. This finding agrees with the results observed by Veit et al. [20] where the authors revealed that Cu, Pb, and Sn were more embedded in the coarser fraction of the PCBs. A study by Gonzalez-Baez et al. [21] observed that Cu and Sn content increased with the increase in PS whereas Benzal [14] observed that the Cu content in a different PS (200–1000 µm, 1000–3000 µm, 5000 µm, and 10,000 µm) decreased with an increase in PS and the highest Cu content achieved was 39 wt.% at PS of 200–1000 µm. Another study [22] disagrees with the findings of the present study, about Cu, when characterizing the metal content at different PS (<365, 35–500, and 500–750 µm), they found that Cu was highly embedded at the lowest PS of <365 µm, which was 62.1 wt.% and the metal content decreased with the increase in the PS. The differences in the metal content at different PS are associated with heterogeneity of PCB samples themselves [14]. The Al composition varied within the PS, and it was mostly deposited at PS ranging from 38 to 150 µm and similar results were observed by Gonzalez-Baez et al. [21] when the authors characterized the PCB at different PS (<500 µm, 500–1000 µm, 1000–2000 µ, and >2000 µm). A study by Priya and Hait [6] is in agreement with the findings of this study where the authors evaluated the metal content of TV PCB at different PS (38–75 µm, 75–180 µm, 180–250 µm, 250–500 µm, 500–1000 µm, and >1000 µm) and their study revealed that base metals such as Cu, Zn, Al, Pb, and Mn were the highest at PS of 75–180 µm [6]. The findings of these results proved that PCBs can be utilized as a secondary source of several metals based on the elemental content of this material.
3.3. The Alkalinity Nature of the PCB
In this study, the pH variation after the addition of the PCBs was assessed over a 24 h period and it was witnessed that the pH increased from an initial pH of 7.62 to 8.37 after the 24 h period. This increase in pH indicated the alkaline nature of the PCBs. Similar findings were reported in a study conducted by Wang et al. [23], who witnessed that the alkalinity of PCBs is a consistent observation across different studies. The presence of alkali and alkaline earth metals, such as potassium (K), calcium (Ca), sodium (Na), and magnesium (Mg), embedded in the PCBs, could contribute to this phenomenon. This information is supported by a study conducted by Arshadi et al. [13], and Priya and Hait [24], who observed a drastic increase in pH after the PCBs were mixed with distilled water.
3.4. Physicochemical Conditions during the Bioleaching Process
Acidophilic iron- and sulfur-oxidizing microorganisms were used in this study and these organisms were majorly dominated by Leptospirrillum ferriphilum, Acidithiobacillus ferrooxidans, and Acidithiobacillus caldus. The organisms were cultured in 9K media for 5 days until the ORP exceeded 600 mV without the addition of the PCBs. This ORP provides favorable conditions for the bioleaching process to take place since the ferric iron concentration in the media would be high to facilitate the leaching process [25]. To check microbial activity in the bioleaching systems, two key parameters were measured: pH and ORP and these parameters provided insights into the acidolysis (pH) and redoxolysis (ORP) mechanisms involved during the bioleaching process.
In the first 5 days of the experiment, the study was run without the presence of PCBs and when the ORP was above 600 mV, the PCBs were added at a pulp density (PD) of 1% (w/v). The pH is an important factor in bioleaching systems as it usually controls microbial growth, and the pH increase was observed after the addition of 1% w/v PD as illustrated in Figure 3A and this may be due to the alkalinity of the e-waste as described in Section 3.2. The pH of the medium was corrected, when necessary, by adding droplets of 98 v/v% H2SO4 to reduce the alkalinity and the formation of jarosite participates that is caused by a pH above 2 [26]. This increase in pH was also observed in various studies [2,4,27]. The ORP profile also showed a decrease when the e-waste was added, and this decrease varied depending on the PS. However, a significant decrease was witnessed with a PS of 500–700 µm where an ORP of 400 mV on the last day of the experiment occurred, from an ORP of 720 mV. These findings are not peculiar to this study as they were also witnessed by other authors [4,25]. These findings demonstrated that the PS has an impact on microbial activity.
3.5. The Effects of Particle Sizes on Metal Recovery
The bioleaching of the embedded metals within the PCBs was conducted and these metals included Zn, Cu, Mn, Ni, Fe, Al, and Sn. It was witnessed that the PS size of 38–150 µm produced the highest recovery efficiencies with all the assessed metals in this study.
In this study, the highest Zn RE achieved was at PS ranging from 38 to 150 µm, which was 70.8%, followed by the particle size ranging from 150 to 300 µm, which achieved the Zn RE of 53.8% on the last day of bioleaching. A study that was conducted by Rouchalova et al. [26] showed a similar outcome when they evaluated the effect of PS ranging from <40 µm, 40 to 71 µm, 71 to 100 µm, and 100 to 200 µm where the authors achieved a Zn RE of 97.69% at a lower PS ranging from 71 to 100 µm. The lowest Zn RE was observed at higher PS ranging from 500 to 710 µm throughout the bioleaching time, which also agrees with the mentioned study.
The Cu concentration significantly decreased in all PSs throughout the bioleaching period as represented in Figure 6A. The results obtained revealed that the Cu RE decreased with an increase in PS ranging from 38–150 to 500–710 µm, respectively, and a higher Cu RE of 68.8% was obtained at PS ranging from 38 to 150 µm. This higher RE is due to the higher surface area, which improved mass transfer and exposed the metal of interest for leaching [14]. It was observed that a further increase in PS ranging from 300–425 to 500–710 decreases the Cu extraction efficiency from 31% to 28.5%, respectively. These findings agree with a study by Sharada et al. [28] who tested the different PS (20, 50, 150, and +150 mesh) and observed a higher Cu extraction efficiency of 97.9% at PS of 150 mesh and a further increase in PS to +150 mesh decreased the Cu extraction efficiency, which affirm the findings of the present study. The present study is in agreement with the findings observed by Benzal [14] who evaluated different PS ranging from 0.2–1 mm, 1–3 mm, 5 mm, to 10 mm, and revealed that the Cu RE decreased with the increase in PS and achieved a higher Cu extraction efficiency of 37% at PS ranging from 0.2 to 1 mm and a further increase in PS to 10 mm decreased the Cu efficiency recovery to 8.3%. The reason for this phenomenon is due to higher PS possessing a lower surface area, which leads to lower contact between microorganisms and metal-bearing waste particles [29].
It was, however, observed that during Ni bioleaching, the highest concentration of Ni was observed in the PS ranging from 150 to 300 µm although the highest RE was observed in the PS of 38–150 µm. A study by Khatri et al. [3] observed similar findings about the PS ranging from 150 to 300 µm in the present study. The authors investigated the PS at a range from 200 to 250 µm in a two-step bioleaching process and achieved an RE of 58% with unadapted microorganisms [3]. Another study that agreed with the findings of the present study revealed that the further decrease in PS to <37 µm resulted in lower metal RE. A study by Sodha et al. [12] revealed similar findings to the present study when the authors evaluated the effect of PS in a two-step bioleaching process using un-adopted microorganisms. The authors achieved an RE of more than 95% for Cu, Zn, and Ni at PS of 40 µm [12].
It was witnessed that the Fe concentration and RE were high compared to other metals and this is due to the high Fe content in the PCB as shown in the XRF profile. The concentration and Fe RE increase were also influenced by the PS and the increase in the PS ranging from 500 to 710 µm led to the decrease in Fe RE to 54.9% and this could be due to the low surface area, which provides insufficient contact between microorganisms and the metal particles [26], as with the other metals of interest. This study achieved a maximum Al RE of 68.2% whereas a study by García-Balboa et al. [30] achieved an Al RE of more than 34% at PS ranging from 0 to 300 µm over 15 days using adapted microorganisms and this RE was 34% lower than the findings of the present study. The findings of this study demonstrated the importance of PS during the bioleaching process and that a lower PS is preferred since the lixiviant would be able to penetrate within the higher surface area of the PCB for maximum metal recovery. However, it is worth noting that this study utilized microorganisms that were not adapted to the PCBs. It would be interesting to assess microorganisms that are adapted to the PCBs for a longer period to ascertain if these microorganisms can result in higher recovery efficiencies.
4. Materials and Methods
4.1. E-Waste and Microbial Source
The printed circuit boards (PCBs) were sourced from an electronic waste recycling facility, which is based at the University of Johannesburg, South Africa. The iron- and sulfur-oxidizing microorganisms, which were used in the bioleaching process, were sourced from the Bio-metallurgy department at MINTEK, South Africa. These organisms are majorly dominated by Leptospirrillum ferriphilum, Acidithiobacillus ferrooxidans, and Acidithiobacillus caldus. These organisms were maintained in a 1 L working volume stirred tank bioreactor that contained 9K media (3 g of (NH4)2SO4/L, 0.5 g of K2HPO4/L, 0.5 g of MgSO4/L, 0.1 g of KCl/L, 0.01 g of Ca(NO3)2/L) where FeSO4·7H2O was replaced by adding 2 g/L of chalcopyrite as a source of iron and sulfur. The pH was maintained at 1.8. The organisms were sub-cultured every two weeks by withdrawing 150 mL and replacing this loss with 150 mL of 9K media and 2 g of chalcopyrite. This was performed to keep the cultures active and above an Eh of 600 mV.
4.2. E-Waste Preparation and Particle Size Distribution
The PCBs were disassembled and subjected to grinding, milling, and pulverizing processes until a fine powder was obtained. The resultant e-waste powder was separated according to their particle sizes (PSs), namely, 38–150 µm, 150–300 µm, 300–425 µm, 425–500 µm, and 500–710 µm. To determine the particle size distribution (PSD), a round-robin test dry sieve method was performed in triplicate using various sieve trays at 38 µm, 150 µm, 300 µm, 425 µm, 500 µm, and 710 µm. A total of 5 kg of the PCB sample was blended and divided into four equal parts, with 1 kg used for the analysis. During the sieving process, the sieve tray with the largest mesh size (710 µm) was placed at the top, while the one with the smallest mesh size (38 µm) was positioned at the bottom of the stacked sieve trays. The mass of material retained on each sieve was measured to determine the cumulative mass and mass passing percentage. Results were considered invalid if the total mass after sieving indicated a mass loss greater than 0.5%.
To evaluate the PS distribution, important parameters such as d10, d30, d50, and d60 were determined using the Excel best-fit function. These parameters were then used to calculate the coefficient of uniformity (Cu) and coefficient of curvature (Cc) using Equations (1) and (2), respectively. These coefficients provide insights into whether the PCB samples predominantly consist of fine or coarser fractions and if the distribution is well balanced [16].
4.3. Characterization of E-Waste (PCB)
To determine the metal content embedded in the PCBs, two characterization techniques were used: X-ray fluorescence (XRF) and Inductively Coupled Plasma-Atomic Optical Emission Spectrometry (ICP-OES). For the ICP-OES analysis, 0.5 g of PCB powder was digested using an Aqua regia solution at a nitric acid (HNO3)/hydrochloric acid (HCl) ratio of 1:3 (v/v). The PCB powder was digested in 12 mL of the Aqua regia solution, and the solution was stirred and heated at 100 °C using the Hach® DigiBlock (Pretoria, South Africa) for 30 min [24]. After digestion, the digested samples from all particle sizes (PSs) were transferred to 100 mL volumetric flasks and made up to a 100 mL volume using a 1% nitric acid solution. Thereafter, the corresponding digested PS samples were filtered using a 0.22 µm cellulose membrane and the concentration of selected metals (Cu, Fe, Zn, Ni, Mn, Sn, and Al) in the PCB powder was determined using ICP-OES model ICAP6500 Duo (Thermo Scientific, Midrand, South Africa). The metal concentration (MBL) from 1.5 g of e-waste PCB (mg/kg) was determined using Equation (3).
where C is the amount of concentration of metals (mg/L) in the leachate (bioleaching), V is the volume of the bioleaching medium in an Erlenmeyer flask, and W is the total weight of PCB (pulp density) in grams. DF is the dilution factor. The metal efficiency recovery (ER) was determined using Equation (4) [31].
where ER is the metal efficiency recovery, MBL is the amount of metal content in the leachate from 1.5 g of PCB (mg/kg) calculated using Equation (3), MAD is the amount of metal content obtained through acid digestion per gram of PCB (mg/kg).
4.4. Microorganism Culturing and Medium Preparation
Iron- and sulfur-oxidizing microorganisms were used for the experiments. The microorganisms were cultured in 9K media, and the compositions of the media are shown in Table 1.

Table 1.
9K Media compositions [32,33,34].
The nutrients from the 9K media were dissolved in 700 mL of distillate water, and the pH was adjusted to 1.8 with 98% v/v stock sulfuric acid (H2SO4). After that, 44.22 g of FeSO4·7H2O was dissolved in 300 mL of distillate water, and the pH was also adjusted to 1.8 [4]. Thereafter, two solutions were mixed to remove any formation of undesired precipitation, and the pH was re-measured to ensure that the 1 L pH medium was still at the pH of 1.8; if not, the solution was readjusted to 1.8. The non-adapted microorganisms were cultured in 250 mL Erlenmeyer flasks containing 130 mL of the 9K media, and each flask was inoculated with 20 mL of the inoculum. The flasks were then placed in an orbital rotary shaker and incubated at a temperature of 37 °C with a rotary speed set at 150 rpm for 5 days. This incubation condition provides a controlled environment for microbial growth and allows for efficient mixing of the culture [35]. During the 5-day incubation period, the culture growth was monitored by measuring the pH and oxidation–reduction potential (ORP). The ORP measurements were measured until the ORP reached an Eh of ≥600 mV, indicating the desired ORP conditions for the two-step bioleaching. Each test and measurement was performed in duplicate to ensure the accuracy and reliability of the results.
4.5. Bioleaching Tests
A two-step bioleaching approach was followed as described by Kucmanová et al. [4]. The first step involved the bio-oxidation of ferrous iron (Fe2+) to ferric iron (Fe3+) using the non-adapted microorganisms. The effects of particle size on metal recovery were investigated using PS as follows: 38–150, 150–300, 300–425, 425–500, and 500–710 µm. A pulp density (PD) of 1% w/v was used for all the experiments. During the bioleaching test, 5 mL samples of leachate solutions were withdrawn at specific time intervals: 2, 4, 6, 8, and 10 days. These samples were analyzed for Cu, Zn, Pb, Mn, Fe, Ni, Al, and Sn. The purpose of analyzing the leachate solutions at different time points was to track the changes in metal concentrations throughout the bioleaching process. The culture medium volatilization was taken into consideration throughout the experiments using the flask weighing method. This method involved the weighing of the flasks with the media, e-waste, and inoculum at the beginning of the experiment, and during sampling, the flasks were weighed, and the evaporation was accounted for by replacing the evaporated water with sterile distilled water.
4.6. Analytical Methods and Instruments
The mineralogical composition of the printed circuit boards (PCBs) was analyzed using X-ray fluorescence (XRF). To assess the alkalinity of the PCBs, a 0.5 g sample of the PCBs was dissolved in 50 mL of distilled water. The first pH of the distilled water was measured before adding the PCB sample. The pH of the solution was continuously checked using a pH meter (specifically, the 913 model) equipped with a plastic probe (Solitrode with Pt1000). In addition, the oxidation–reduction potential (ORP) of the solution was measured. To ensure the correct pH measurements in the culture medium, a pH probe was calibrated with standard reference buffer solutions (pH of 1, 4, and 7). The ORP measurement was conducted using an ORP electrode combined with a Pt ring (model 6.0451.100). The ORP probe was calibrated with standard redox buffer solutions, and this was performed before analyzing the experimental samples. All experiments were carried out in duplicate, and results were reported in the mean and standard errors.
5. Conclusions
This study showed that the iron- and sulfur-oxidizing microbial consortium was able to extract the metals of interest from the PCBs. The XRF metal characterization showed that the metal content differed at different PS and the highest Cu, Sn, and Pb content of 28.7, 20.5, and 11.1 wt.% was observed at a coarser fraction (500–710 µm). It was also witnessed that the Cu, Sn, and Pb content increased with the increase in the PS while Fe, Ni, Mn, and Zn content decreased with an increase in PS with a higher content. It was also witnessed that the increase in PS had a significant impact on microorganisms’ growth as the ORP decreased drastically with an increase in PS and the media inoculated with a PD from higher PS (500–710 µm) showed the lowest ORP and higher pH. It was found that different PSs have a significant impact on the metal RE and a lower PS ranging from 38 to 150 µm extracted the highest RE, which was 62.9%, 68.2%, 95.3%, 86.1%, 61.9%, 47.2%, 21.2%, and 63.6% (Al, Cu, Fe, Mn, Ni, Pb, Sn, and Zn, respectively). The increase in the PS resulted in lower extraction of the metals of interest and this was attributed to the minimal mineral exposure for subsequent extraction during the leaching process. This was also due to the toxicity of large PS on microbial growth as shown by a drastic decrease in ORP, thus resulting in minimal lixiviant production for efficient metal extraction. This study also revealed the resilience of the mixed microbial consortium in maintaining the low pH conditions, which contributed to the observed extraction efficiencies. Further research should utilize an e-waste-adapted microbial consortium of iron- and sulfur-oxidizing acidophiles and assess if there will be any differences in the extraction efficiencies. Additionally, different temperature regimes should be investigated to compare the leaching efficiencies and perhaps, increasing the operational temperature might yield higher extraction efficiencies.
Author Contributions
Conceptualization, K.M. and L.M.; writing—original draft preparation, K.M.; writing—review and editing, K.M. and L.M.; supervision, L.M.; co-supervision, P.N.N.; project administration, L.M. and P.N.N.; funding acquisition, L.M. and P.N.N. All authors have read and agreed to the published version of the manuscript.
Funding
This research was funded by the National Research Foundation of South Africa (grant number: 138245).
Data Availability Statement
The data associated with this manuscript are embedded within this manuscript.
Acknowledgments
The authors would like to thank the Department of Metallurgy, at the University of Johannesburg, for assisting the authors in PCB characterization. The authors would like to thank Mpendulo Zenzile for assisting with the ICP-OES analysis.
Conflicts of Interest
The authors declare no conflicts of interest.
References
- Morkel, F.D. The Effect of Particle Size Distribution on the Extraction of Gold from Printed Circuit Boards Using Ammonium Thiosulphate; Cape Peninsula University of Technology: Cape Town, South Africa, 2020. [Google Scholar]
- Marra, A.; Cesaro, A.; Rene, E.R.; Belgiorno, V.; Lens, P.N. Bioleaching of metals from weee shredding dust. J. Environ. Manag. 2018, 210, 180–190. [Google Scholar] [CrossRef]
- Khatri, B.R.; Sodha, A.B.; Shah, M.B.; Tipre, D.R.; Dave, S.R. Chemical and microbial leaching of base metals from obsolete cell-phone printed circuit boards. Sustain. Environ. Res. 2018, 28, 333–339. [Google Scholar]
- Kucmanová, A.; Sanny, Z.; Gerulová, K.; Pašák, M.; Czére, I. Preliminary bioleaching experiment of e-waste. Ved. Práce Mater. Fak. Slov. Technol. Univ. V Bratislave So Sídlom V Trnave 2021, 29, 45–54. [Google Scholar] [CrossRef]
- Hubau, A.; Minier, M.; Chagnes, A.; Joulian, C.; Silvente, C.; Guezennec, A.-G. Recovery of metals in a double-stage continuous bioreactor for acidic bioleaching of printed circuit boards (pcbs). Sep. Purif. Technol. 2020, 238, 116481. [Google Scholar]
- Priya, A.; Hait, S. Characterization of particle size-based deportment of metals in various waste printed circuit boards towards metal recovery. Clean. Mater. 2021, 1, 100013. [Google Scholar] [CrossRef]
- Konakcı, R.; Pekcan, M.; Erşan, Y.Ç. Pre-treatment procedure for effective bioleaching of metals from large waste printed circuit board (wpcb) pieces. In Proceedings of the Sixth Edition of EurAsia Waste Management Symposium, İstanbul, Türkiye, 24–26 October 2022. [Google Scholar]
- Priya, A.; Hait, S. Comparative assessment of metallurgical recovery of metals from electronic waste with special emphasis on bioleaching. Environ. Sci. Pollut. Res. 2017, 24, 6989–7008. [Google Scholar] [CrossRef]
- Waghmode, M.; Gunjal, A.; Patil, N. Bioleaching of electronic waste. Pollution 2021, 7, 141–152. [Google Scholar]
- Shah, M.B.; Tipre, D.R.; Dave, S.R. Chemical and biological processes for multi-metal extraction from waste printed circuit boards of computers and mobile phones. Waste Manag. Res. 2014, 32, 1134–1141. [Google Scholar] [CrossRef]
- Adetunji, A.I.; Oberholster, P.J.; Erasmus, M. Bioleaching of metals from e-waste using microorganisms: A review. Minerals 2023, 13, 828. [Google Scholar]
- Sodha, A.B.; Qureshi, S.A.; Khatri, B.R.; Tipre, D.R.; Dave, S.R. Enhancement in iron oxidation and multi-metal extraction from waste television printed circuit boards by iron oxidizing leptospirillum feriphillum isolated from coal sample. Waste Biomass Valorization 2019, 10, 671–680. [Google Scholar] [CrossRef]
- Arshadi, M.; Mousavi, S. Multi-objective optimization of heavy metals bioleaching from discarded mobile phone pcbs: Simultaneous cu and ni recovery using acidithiobacillus ferrooxidans. Sep. Purif. Technol. 2015, 147, 210–219. [Google Scholar] [CrossRef]
- Benzal Montes, E. Study and Optimisation of Copper Bioleaching Process for Electronic Waste Valorisation. Ph.D. Thesis, Universitat Politècnica de Catalunya, Barcelona, Spain, 2021. [Google Scholar]
- Benzal, E.; Solé, M.; Lao, C.; Gamisans, X.; Dorado, A. Elemental copper recovery from e-wastes mediated with a two-step bioleaching process. Waste Biomass Valorization 2020, 11, 5457–5465. [Google Scholar] [CrossRef]
- Khashole, M.F. Low Temperature Optimization of Copper Recovery from E-Waste. Master’s Thesis, University of Kwazulu-Natal, Durban, South Africa, 2021. [Google Scholar]
- Pradhan, J.K.; Kumar, S. Environmental Impact Assessment and Bioleaching of Metals from Electronic Waste (E-Waste); Jaypee University of Information Technology: Solan, India, 2013. [Google Scholar]
- Khaliq, I.; Hof, C.; Prinzinger, R.; Böhning-Gaese, K.; Pfenninger, M. Global variation in thermal tolerances and vulnerability of endotherms to climate change. Proc. R. Soc. B Biol. Sci. 2014, 281, 20141097. [Google Scholar]
- Hubau, A.; Chagnes, A.; Minier, M.; Touzé, S.; Chapron, S.; Guezennec, A.-G. Recycling-oriented methodology to sample and characterize the metal composition of waste printed circuit boards. Waste Manag. 2019, 91, 62–71. [Google Scholar] [CrossRef] [PubMed]
- Veit, H.M.; de Pereira, C.C.; Bernardes, A.M. Using mechanical processing in recycling printed wiring boards. Jom 2002, 54, 45–47. [Google Scholar] [CrossRef]
- Gonzalez-Baez, A.; Pantoja Munoz, L.; Garelick, H.; Purchase, D. Characterisation of rare earth elements in waste printed circuit boards (wpcbs) and their bioleaching potential. In Proceedings of the 16th International Conference on Environmental Science and Technology, Rhodes, Greece, 4–7 September 2019. [Google Scholar]
- Van Yken, J.; Cheng, K.Y.; Boxall, N.J.; Nikoloski, A.N.; Moheimani, N.; Valix, M.; Sahajwalla, V.; Kaksonen, A.H. Potential of metals leaching from printed circuit boards with biological and chemical lixiviants. Hydrometallurgy 2020, 196, 105433. [Google Scholar] [CrossRef]
- Wang, J.; Bai, J.; Xu, J.; Liang, B. Bioleaching of metals from printed wire boards by acidithiobacillus ferrooxidans and acidithiobacillus thiooxidans and their mixture. J. Hazard. Mater. 2009, 172, 1100–1105. [Google Scholar] [CrossRef]
- Priya, A.; Hait, S. Feasibility of bioleaching of selected metals from electronic waste by acidiphilium acidophilum. Waste Biomass Valorization 2018, 9, 871–877. [Google Scholar]
- Işıldar, A.; van de Vossenberg, J.; Rene, E.R.; van Hullebusch, E.D.; Lens, P.N. Two-step bioleaching of copper and gold from discarded printed circuit boards (pcb). Waste Manag. 2016, 57, 149–157. [Google Scholar] [CrossRef]
- Rouchalova, D.; Rouchalova, K.; Janakova, I.; Cablik, V.; Janstova, S. Bioleaching of iron, copper, lead, and zinc from the sludge mining sediment at different particle sizes, ph, and pulp density using acidithiobacillus ferrooxidans. Minerals 2020, 10, 1013. [Google Scholar] [CrossRef]
- Willner, J.; Fornalczyk, A. Extraction of metals from electronic waste by bacterial leaching. Environ. Prot. Eng. 2013, 39, 197–208. [Google Scholar]
- Sharada, H.M.; Abdel-Halim, S.A.; Hafez, M.A.; Elbarbary, T.A.; Abdel-Fatah, Y.; Ibrahim, I.A. Bioleaching of copper from electronic waste using aspergillus niger. Biointerface Res. Appl. Chem. 2021, 12, 8406–8425. [Google Scholar]
- Do, M.H.; Nguyen, G.T.; Thach, U.D.; Lee, Y.; Bui, T.H. Advances in hydrometallurgical approaches for gold recovery from e-waste: A comprehensive review and perspectives. Miner. Eng. 2023, 191, 107977. [Google Scholar] [CrossRef]
- García-Balboa, C.; Martínez-Alesón García, P.; López-Rodas, V.; Costas, E.; Baselga-Cervera, B. Microbial biominers: Sequential bioleaching and biouptake of metals from electronic scraps. MicrobiologyOpen 2022, 11, e1265. [Google Scholar] [CrossRef] [PubMed]
- Jagannath, A.; Shetty, V.; Saidutta, M. Bioleaching of copper from electronic waste using acinetobacter sp. Cr b2 in a pulsed plate column operated in batch and sequential batch mode. J. Environ. Chem. Eng. 2017, 5, 1599–1607. [Google Scholar] [CrossRef]
- Ghassa, S.; Farzanegan, A.; Gharabaghi, M.; Abdollahi, H. Novel bioleaching of waste lithium ion batteries by mixed moderate thermophilic microorganisms, using iron scrap as energy source and reducing agent. Hydrometallurgy 2020, 197, 105465. [Google Scholar] [CrossRef]
- Mostafavi, M.; Mirazimi, S.; Rashchi, F.; Faraji, F.; Mostoufi, N. Bioleaching and kinetic investigation of wpcbs by a. Ferrooxidans, a. Thiooxidans and their mixtures. J. Chem. Pet. Eng. 2018, 52, 81–91. [Google Scholar]
- Arshadi, M.; Yaghmaei, S. Bioleaching of basic metals from electronic waste pcb’s. J. Min. Mech. Eng. 2020, 1, 41–50. [Google Scholar]
- Priya, A.; Hait, S. Biometallurgical recovery of metals from waste printed circuit boards using pure and mixed strains of acidithiobacillus ferrooxidans and acidiphilium acidophilum. Process Saf. Environ. Prot. 2020, 143, 262–272. [Google Scholar] [CrossRef]

Disclaimer/Publisher’s Note: The statements, opinions and data contained in all publications are solely those of the individual author(s) and contributor(s) and not of MDPI and/or the editor(s). MDPI and/or the editor(s) disclaim responsibility for any injury to people or property resulting from any ideas, methods, instructions or products referred to in the content. |
© 2024 by the authors. Licensee MDPI, Basel, Switzerland. This article is an open access article distributed under the terms and conditions of the Creative Commons Attribution (CC BY) license (https://creativecommons.org/licenses/by/4.0/).