Abstract
The substitution of virgin asphalt binder with reclaimed asphalt pavement (RAP) has environmental and economic merits, however, cracking susceptibility arises due to the aged asphalt binder within RAP. The objectives of this study are to (1) enhance the cracking resistance of asphalt mixtures containing 50% RAP utilizing recycling agents (RAs) derived from six petroleum-based and bio-based materials, (2) conduct an environmental impact assessment (represented by global warming potential “GWP”) for high-RAP mixtures including RAs, and (3) estimate the cost effectiveness of including high-RAP content in asphalt mixtures. Based on the RAP asphalt binder performance grade (PG), base asphalt binder PG, and RAP content, the RA contents were determined to achieve a target asphalt binder of PG 76-22. A control mixture was benchmarked for comparison, specified for high-traffic volume roads, and contained PG 76-22 polymer-modified asphalt binder. The engineering performance of studied asphalt mixtures was evaluated using the Hamburg wheel-tracking (HWT), semi-circular bend, Illinois flexibility index, Ideal cracking tolerance, and thermal stress-restrained specimen tensile strength tests. It was found that petroleum-derived aromatic oil, soy-based oil, and tall oil fatty acid-based RAs demonstrated a successful restoration of aged RAP asphalt binder without compromising the permanent deformation resistance. The 50% RAP mixtures emitted less GWP by 41% and 42.9% using petroleum- and bio-oil RAs, respectively, and achieved a 31% cost reduction compared to the control mixtures.
1. Introduction
Reclaimed asphalt pavement (RAP) has been used for decades as a sustainable solution for rising costs and conserving natural resources of asphalt component materials, asphalt binder, and aggregates. Many asphalt industries have been including RAP in newly constructed asphalt pavement with moderate dosages (<25%). However, cracking concerns are raised by asphalt technology professionals and practitioners with high-RAP contents, more than 25%, as determined by NCHRP Report 752 [1]. This is due to the inherent aging of the asphalt binder of RAP (hereinafter referred to as RAP-binder) over the extended service life. Therefore, RAP-binder cannot directly replace virgin asphalt binder [2,3]. The aging process alters the chemical composition and properties of the asphalt binder. As such, aged RAP-binder often contains high-molecular-weight molecules, which have been linked to cracking and reduced durability in pavements [4]. Consequently, increasing the RAP content may have a detrimental effect on pavement performance, potentially leading to increased maintenance and rehabilitation costs.
State Department of Transportations (DOTs) and asphalt industries are looking for effective recycling agents (RAs) in rejuvenating RAP-binder in high-RAP asphalt mixtures and mitigating associated cracking without adversely affecting pavement performance, especially permanent deformation (rutting) [5]. The balanced mixture design (BMD) has been utilized as a design criterion to balance between asphalt mixture cracking and rutting [6]. The Louisiana BMD framework for high-traffic mixtures specifies a maximum rut depth of 6.0 mm and a minimum semi-circular bend (SCB) Jc value of 0.6 KJ/m2 for rutting and cracking acceptance performance, respectively [7].
RAs could be rejuvenating agents (restore aged RAP-binder to its original physical and chemical properties) or softening agents (increase the softening degree of aged RAP-binder allowing higher workability during mixing) [8]. Therefore, mixing both types of RAs to achieve both advantages is sometimes more beneficial than relying on one RA. RAs also are categorized on their generic form and material type, for example, chemical, petroleum- and bio-based/organic RAs. Table 1 shows a summary of literature findings about the effectiveness of petroleum-derived (aromatic oil) and bio-based (especially soy and tall-oils) RAs in RAP mixtures.

Table 1.
Literature summary: petroleum, soy, and tall RAs.
Studies reported on RAs showed discrepancies in results regarding their impact on cracking resistance in asphalt mixtures, Table 1. For instance, a study by the Louisiana Department of Transportation and Development (DOTD) found that adding RAs to a mixture containing 30% RAP decreased its resistance to cracking, compared to a mixture without RAs [8]. Another study utilized soy and tall oils in 30% RAP mixtures and showed poor cracking resistance compared to the DOTD conventional mixture with similar asphalt binder [9]. Few studies have used 50% RAP in asphalt mixtures and conducted asphalt binder and asphalt mixture testing following current BMDs. Few studies have evaluated the effectiveness of various types of RAs and various extraction methods for specific RAs on high-RAP asphalt mixtures. For example, tall oils with different characteristics can be extracted from different sources, which affects their influence on asphalt mixture performance. Furthermore, the environmental impacts or global warming potential (GWP) also need to be assessed. Also, the cost effectiveness of using asphalt mixtures containing 50% RAP needs to be well documented.
2. Objectives and Scope
The study objectives are as follows:
- (1)
- Explore the effectiveness of petroleum- and bio-based RAs in improving the cracking resistance of asphalt mixtures containing 50% RAP;
- (2)
- Conduct an environmental impact assessment for high-RAP mixtures including RAs as measured by CO2 emissions/global warming potential; and
- (3)
- Estimate the cost effectiveness of including high-RAP content in asphalt mixtures.
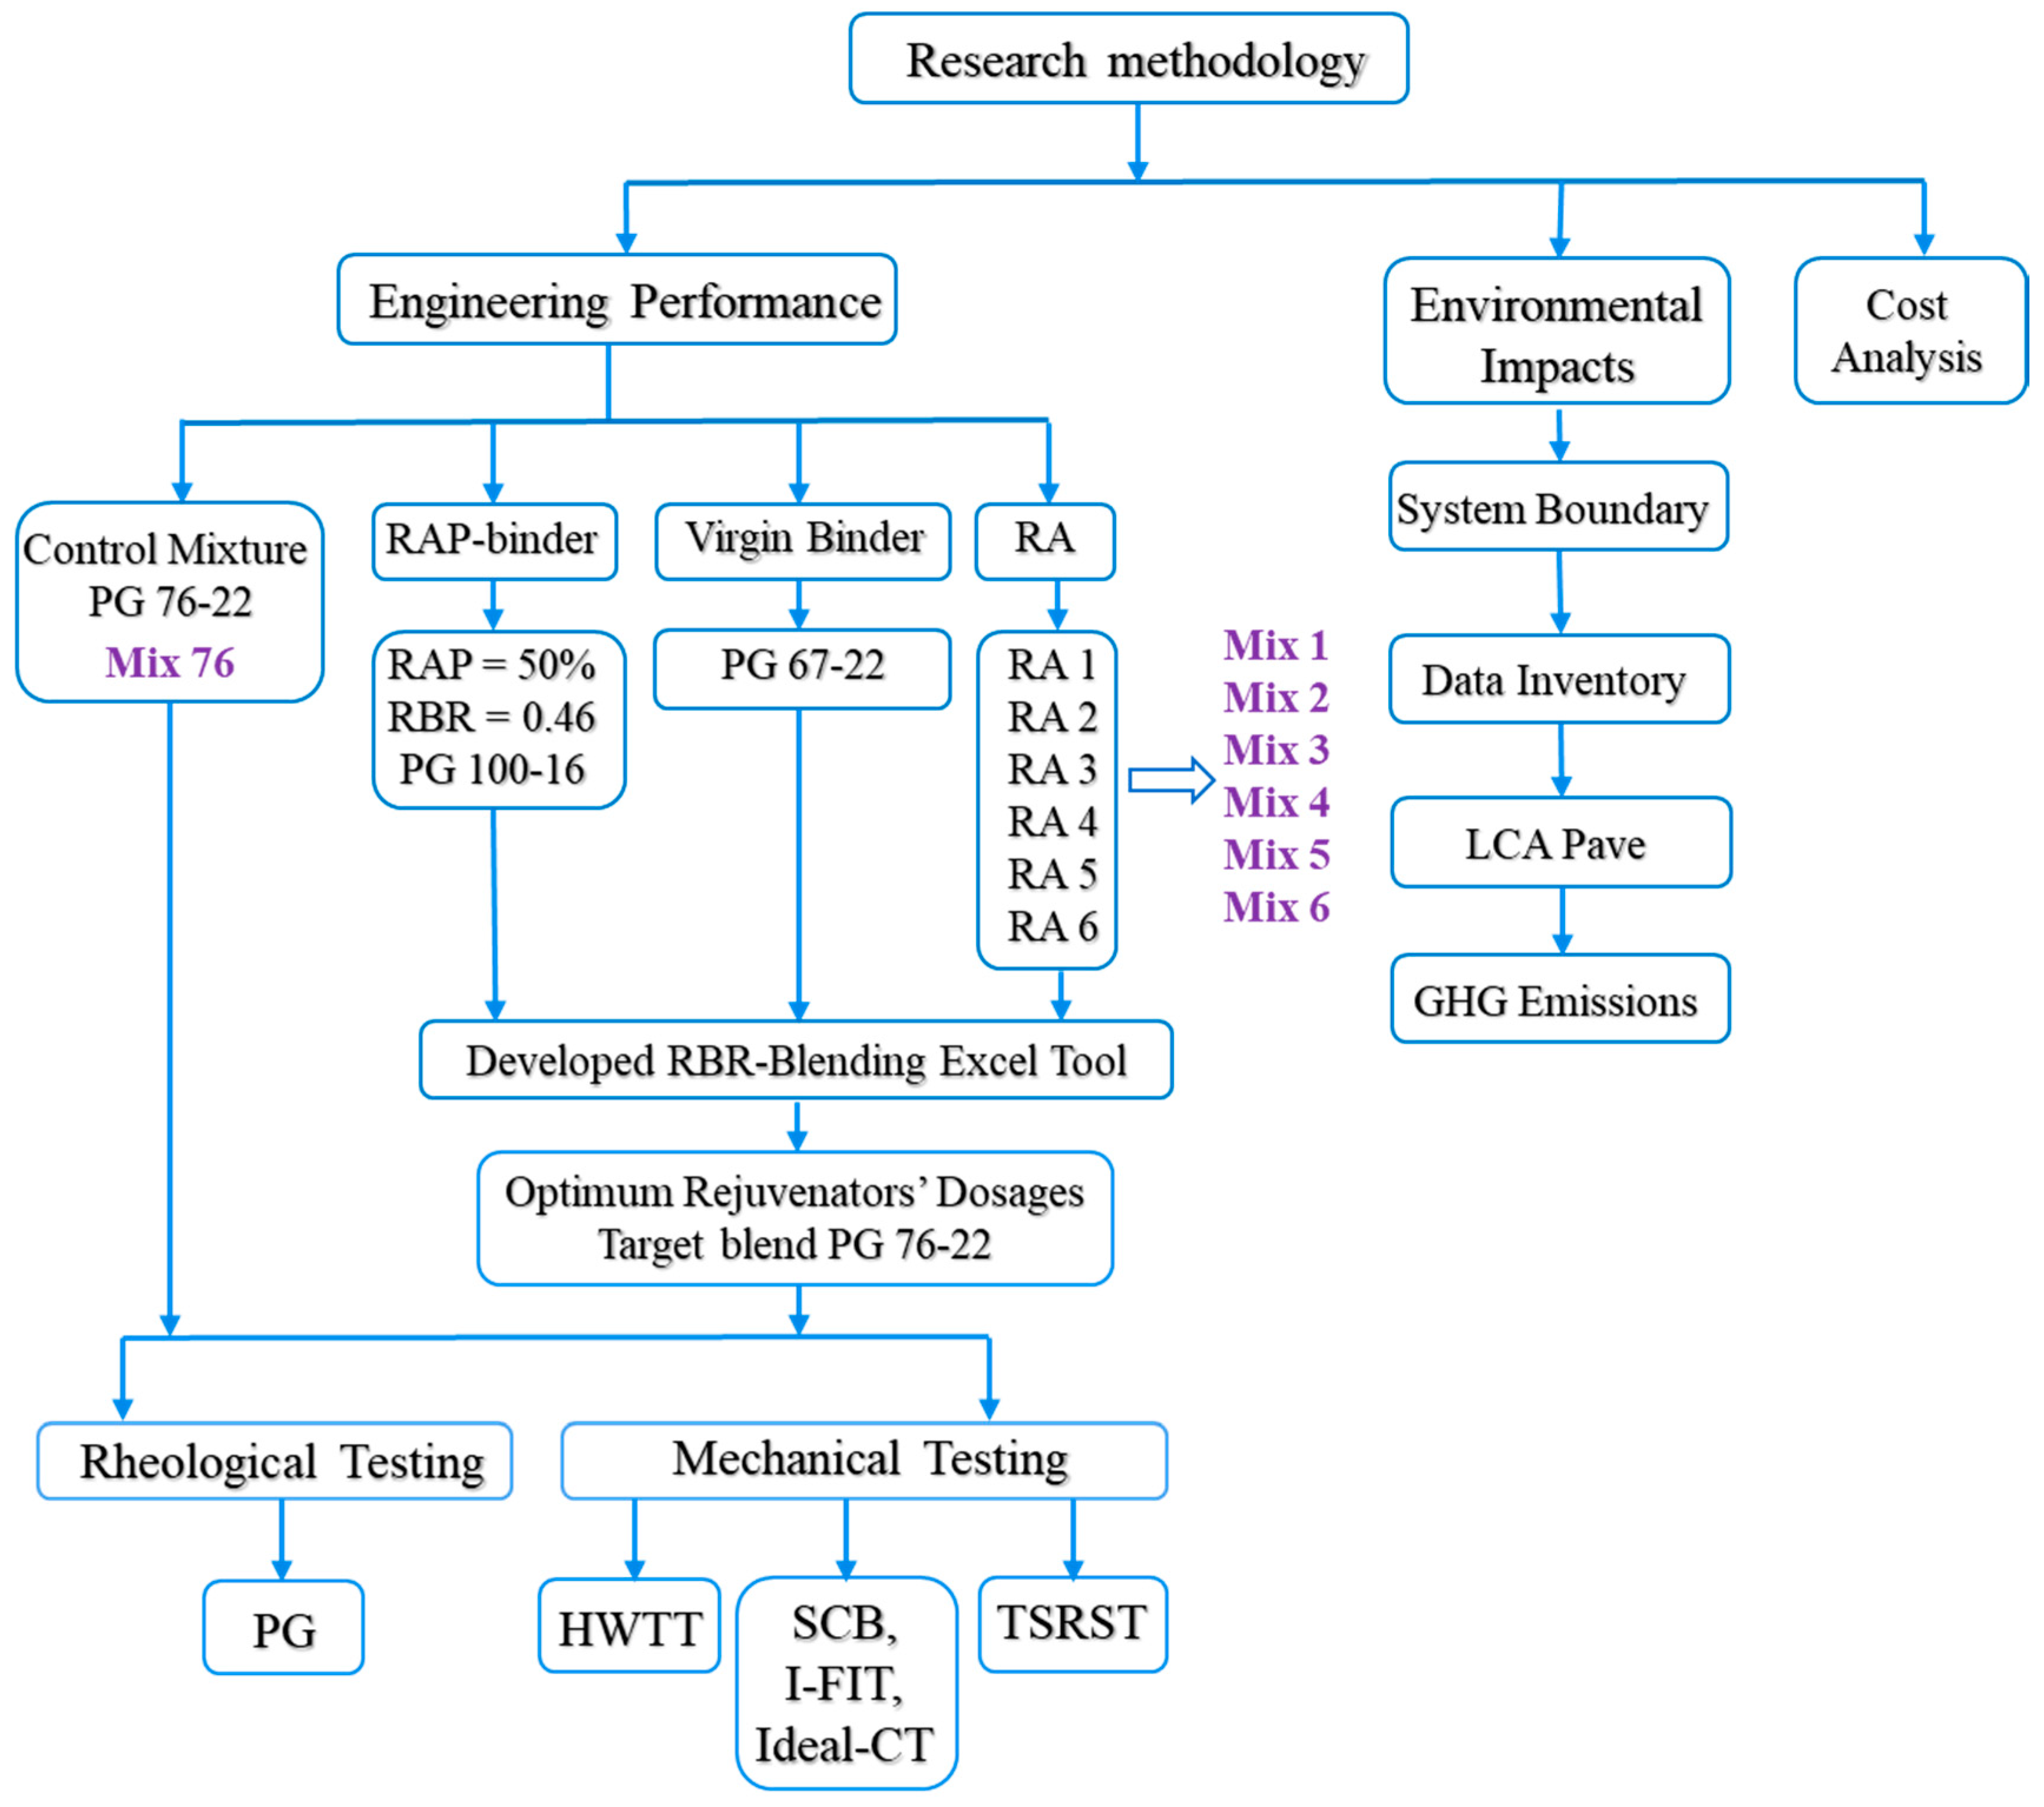
RAs selected in this study included petroleum aromatic extract oil, soy oil, and tall oil derivatives (industrial by-product phytosterol, intermediate industrial phytosterol, purified phytosterol, and fatty acid-derivatives). The effectiveness of RAs in enhancing cracking resistance was assessed in asphalt mixtures containing 50% RAP. Based on the RAP asphalt binder performance grade (PG), base asphalt binder PG, and RAP content, the RA contents were determined to achieve a target asphalt binder of PG 76-22. A control mixture was benchmarked for comparison, specified for high-traffic volume roads, and contained polymer-modified PG 76-22 with no additives. The high-, intermediate-, and low-temperature engineering performance of studied asphalt mixtures were evaluated using the Hamburg wheel-tracking (HWT) test, (semi-circular bend, Illinois flexibility index, Ideal cracking tolerance), and thermal stress-restrained specimen tensile strength test, respectively. Figure 1 illustrates the experimental program used in this project.

Figure 1.
Research methodology. PG: asphalt binder performance grading; RBR: recycled binder ratio (% RAP-binder to total asphalt binder content); RA: recycling agents; HWTT: Hamburg wheel-track testing; SCB: semi-circular bending beam test; I-FIT: Illinois flexibility index test; Ideal-CT: Ideal cracking tolerance; TSRST: thermal stress-restrained specimen tensile strength test; The seven mixtures’ designations are in in purple color.
3. Materials
Three sources of aggregates (coarse sand and limestone #78 and #11) commonly used in Louisiana and meeting specifications for 12.5 mm NMAS were incorporated in this study. DOTD requires the following aggregate physical properties [18]:
- Flat and Elongated Ratio, 5:1, % max. = 10
- Coarse Aggregate Angularity, % crushed, double-faced, min = 90
- Fine Aggregate Angularity, min. = 45
- Sand Equivalent, min. = 40
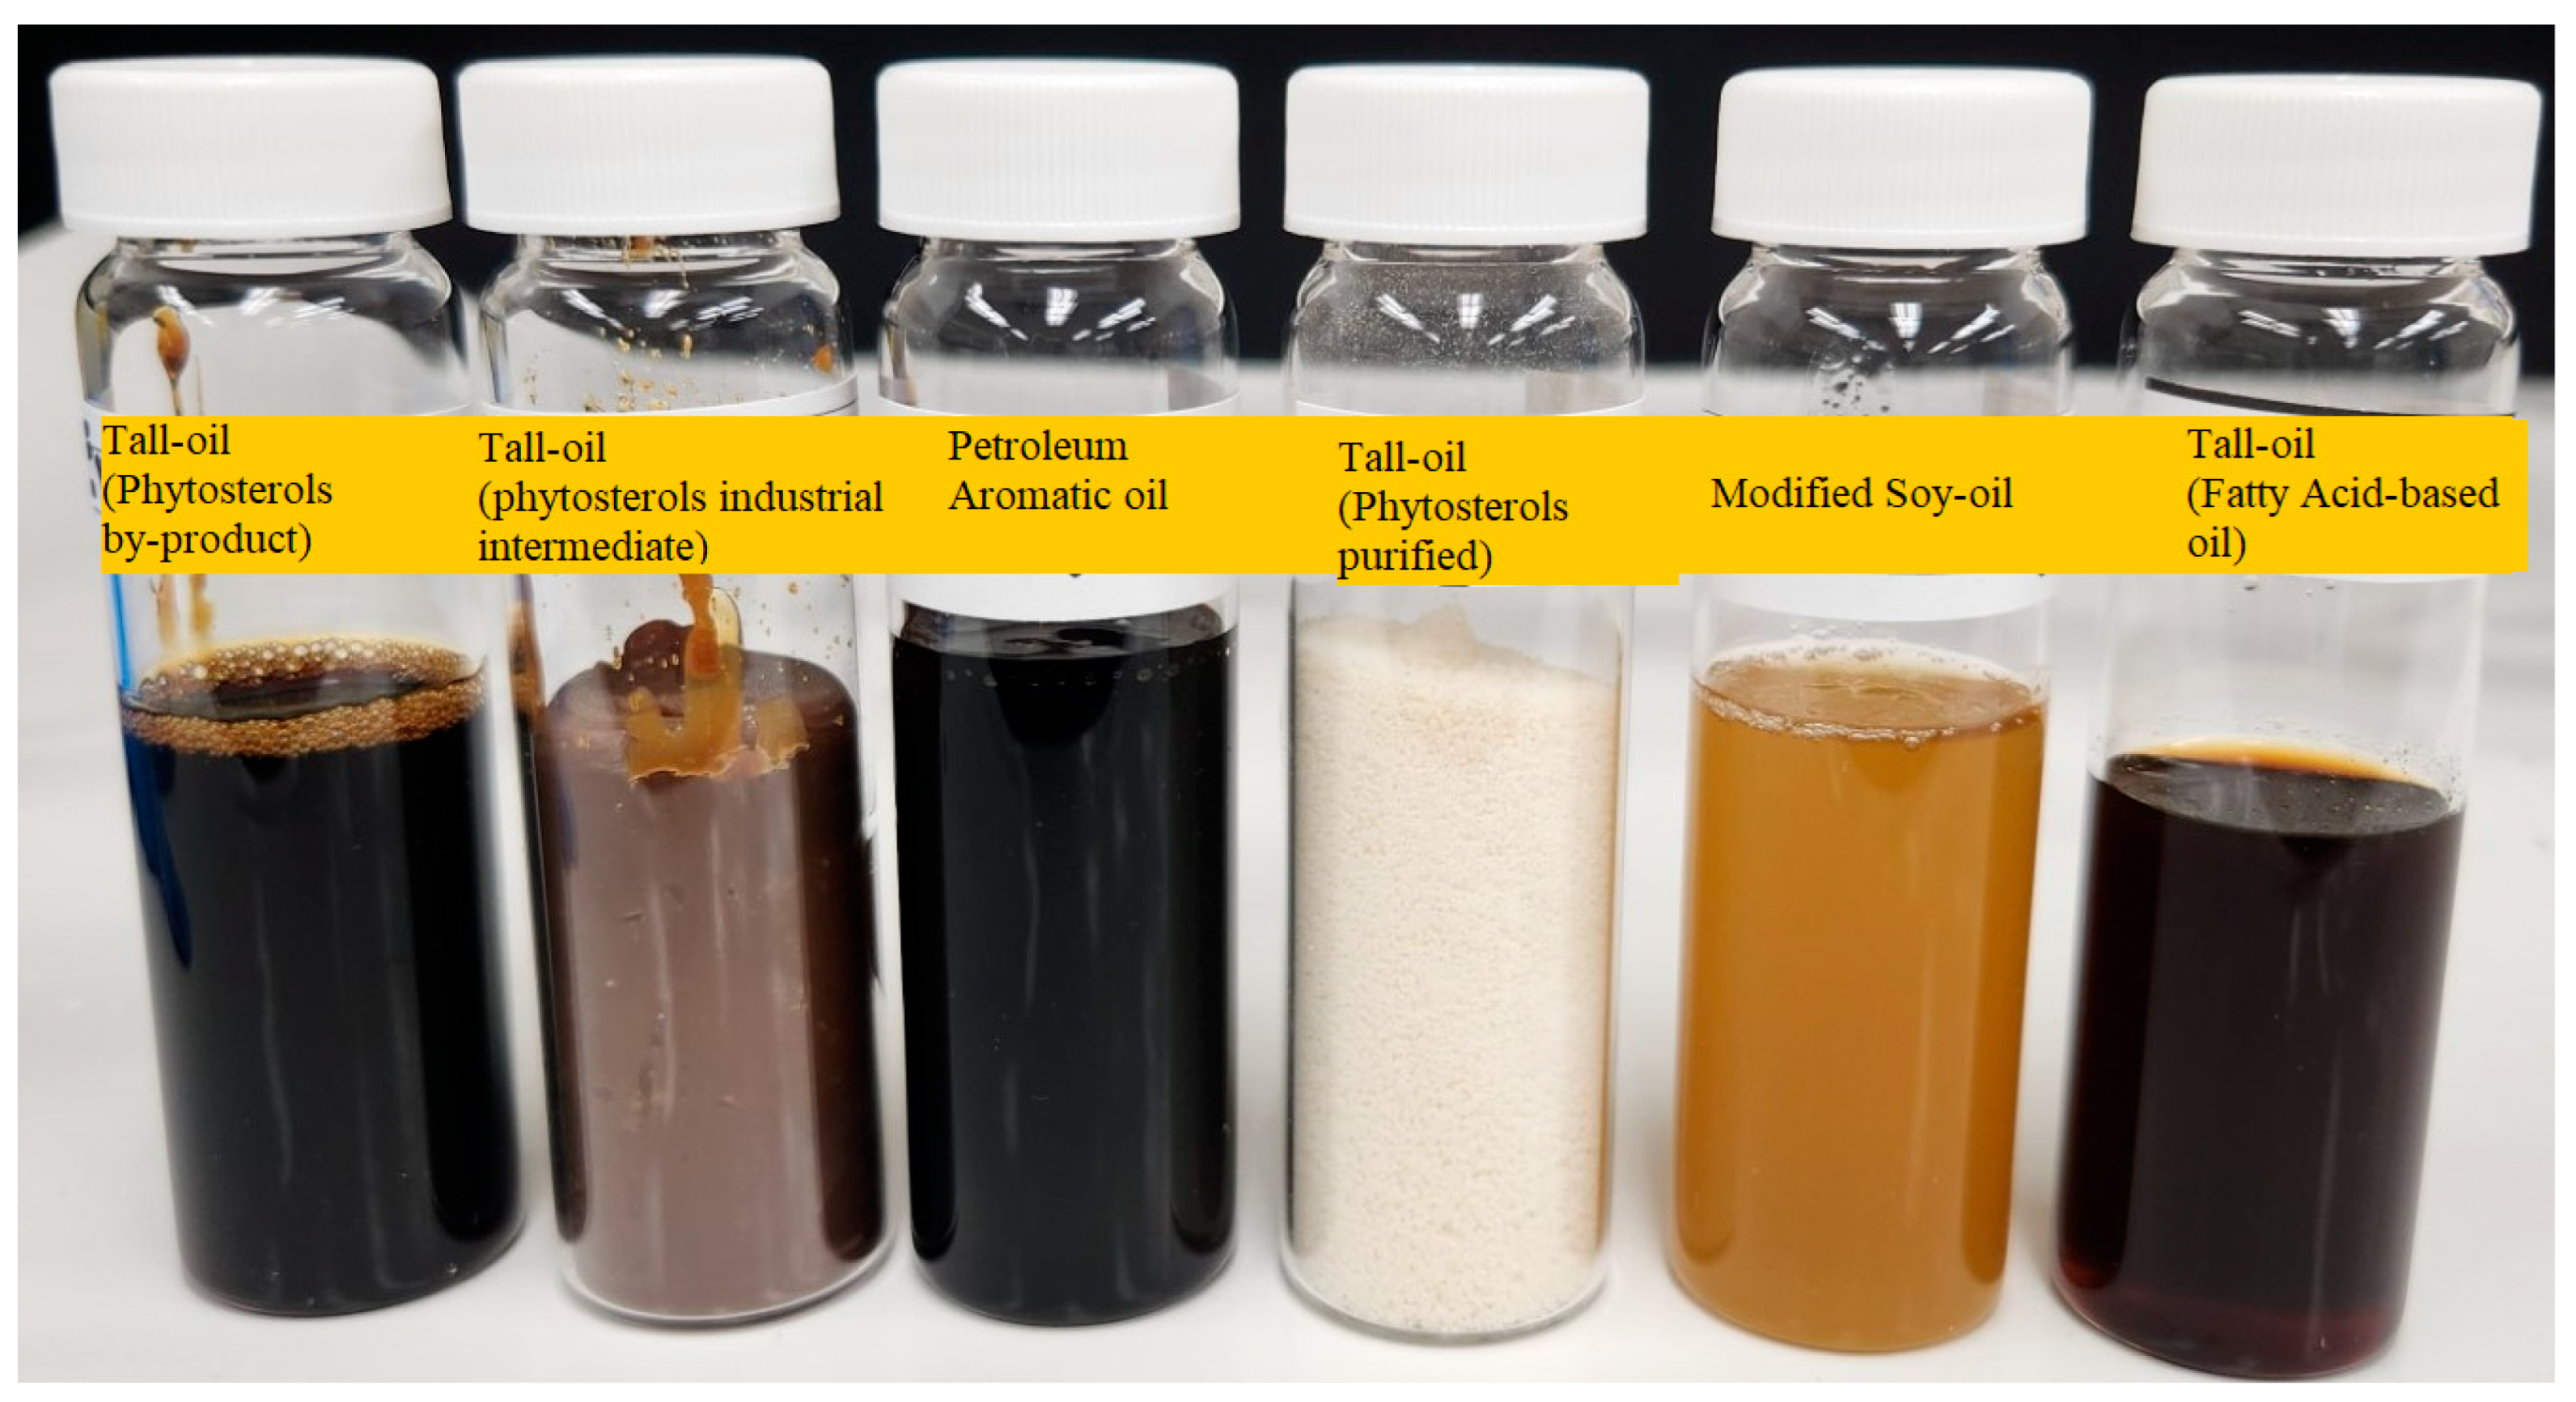
Table 2 presents a list of RA materials, dosages, and classifications used in this study. A picture for the RAs used in this study is shown in Figure 2. Asphalt binder PG 67-22 was utilized as a carrier for RA to deliver to the RAP-binder. A 50% RAP content corresponds to a Reclaimed Binder Ratio (RBR) of 0.46. The RBR represents the weight percentage of the RAP-binder to the total asphalt binder in the mixture. Each RA dosage was carefully optimized by weight to the virgin binder based on the properties of the RAP-binder and the virgin-unmodified asphalt binder to achieve a target asphalt binder of PG 76-22 [1]. For comparative purposes, a conventional SBS polymer-modified asphalt binder that complied with DOTD specifications was also included and evaluated in this investigation [18].
Table 2.
Recycling agents used in this study.
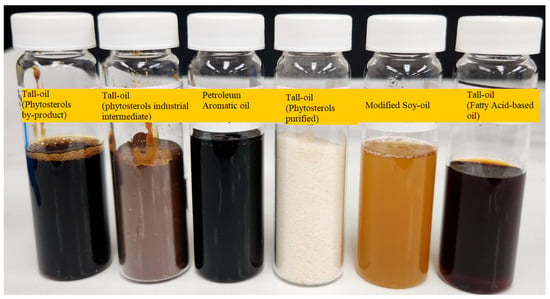
Figure 2.
Recycling agents utilized in this project.
4. Asphalt Binder Extraction
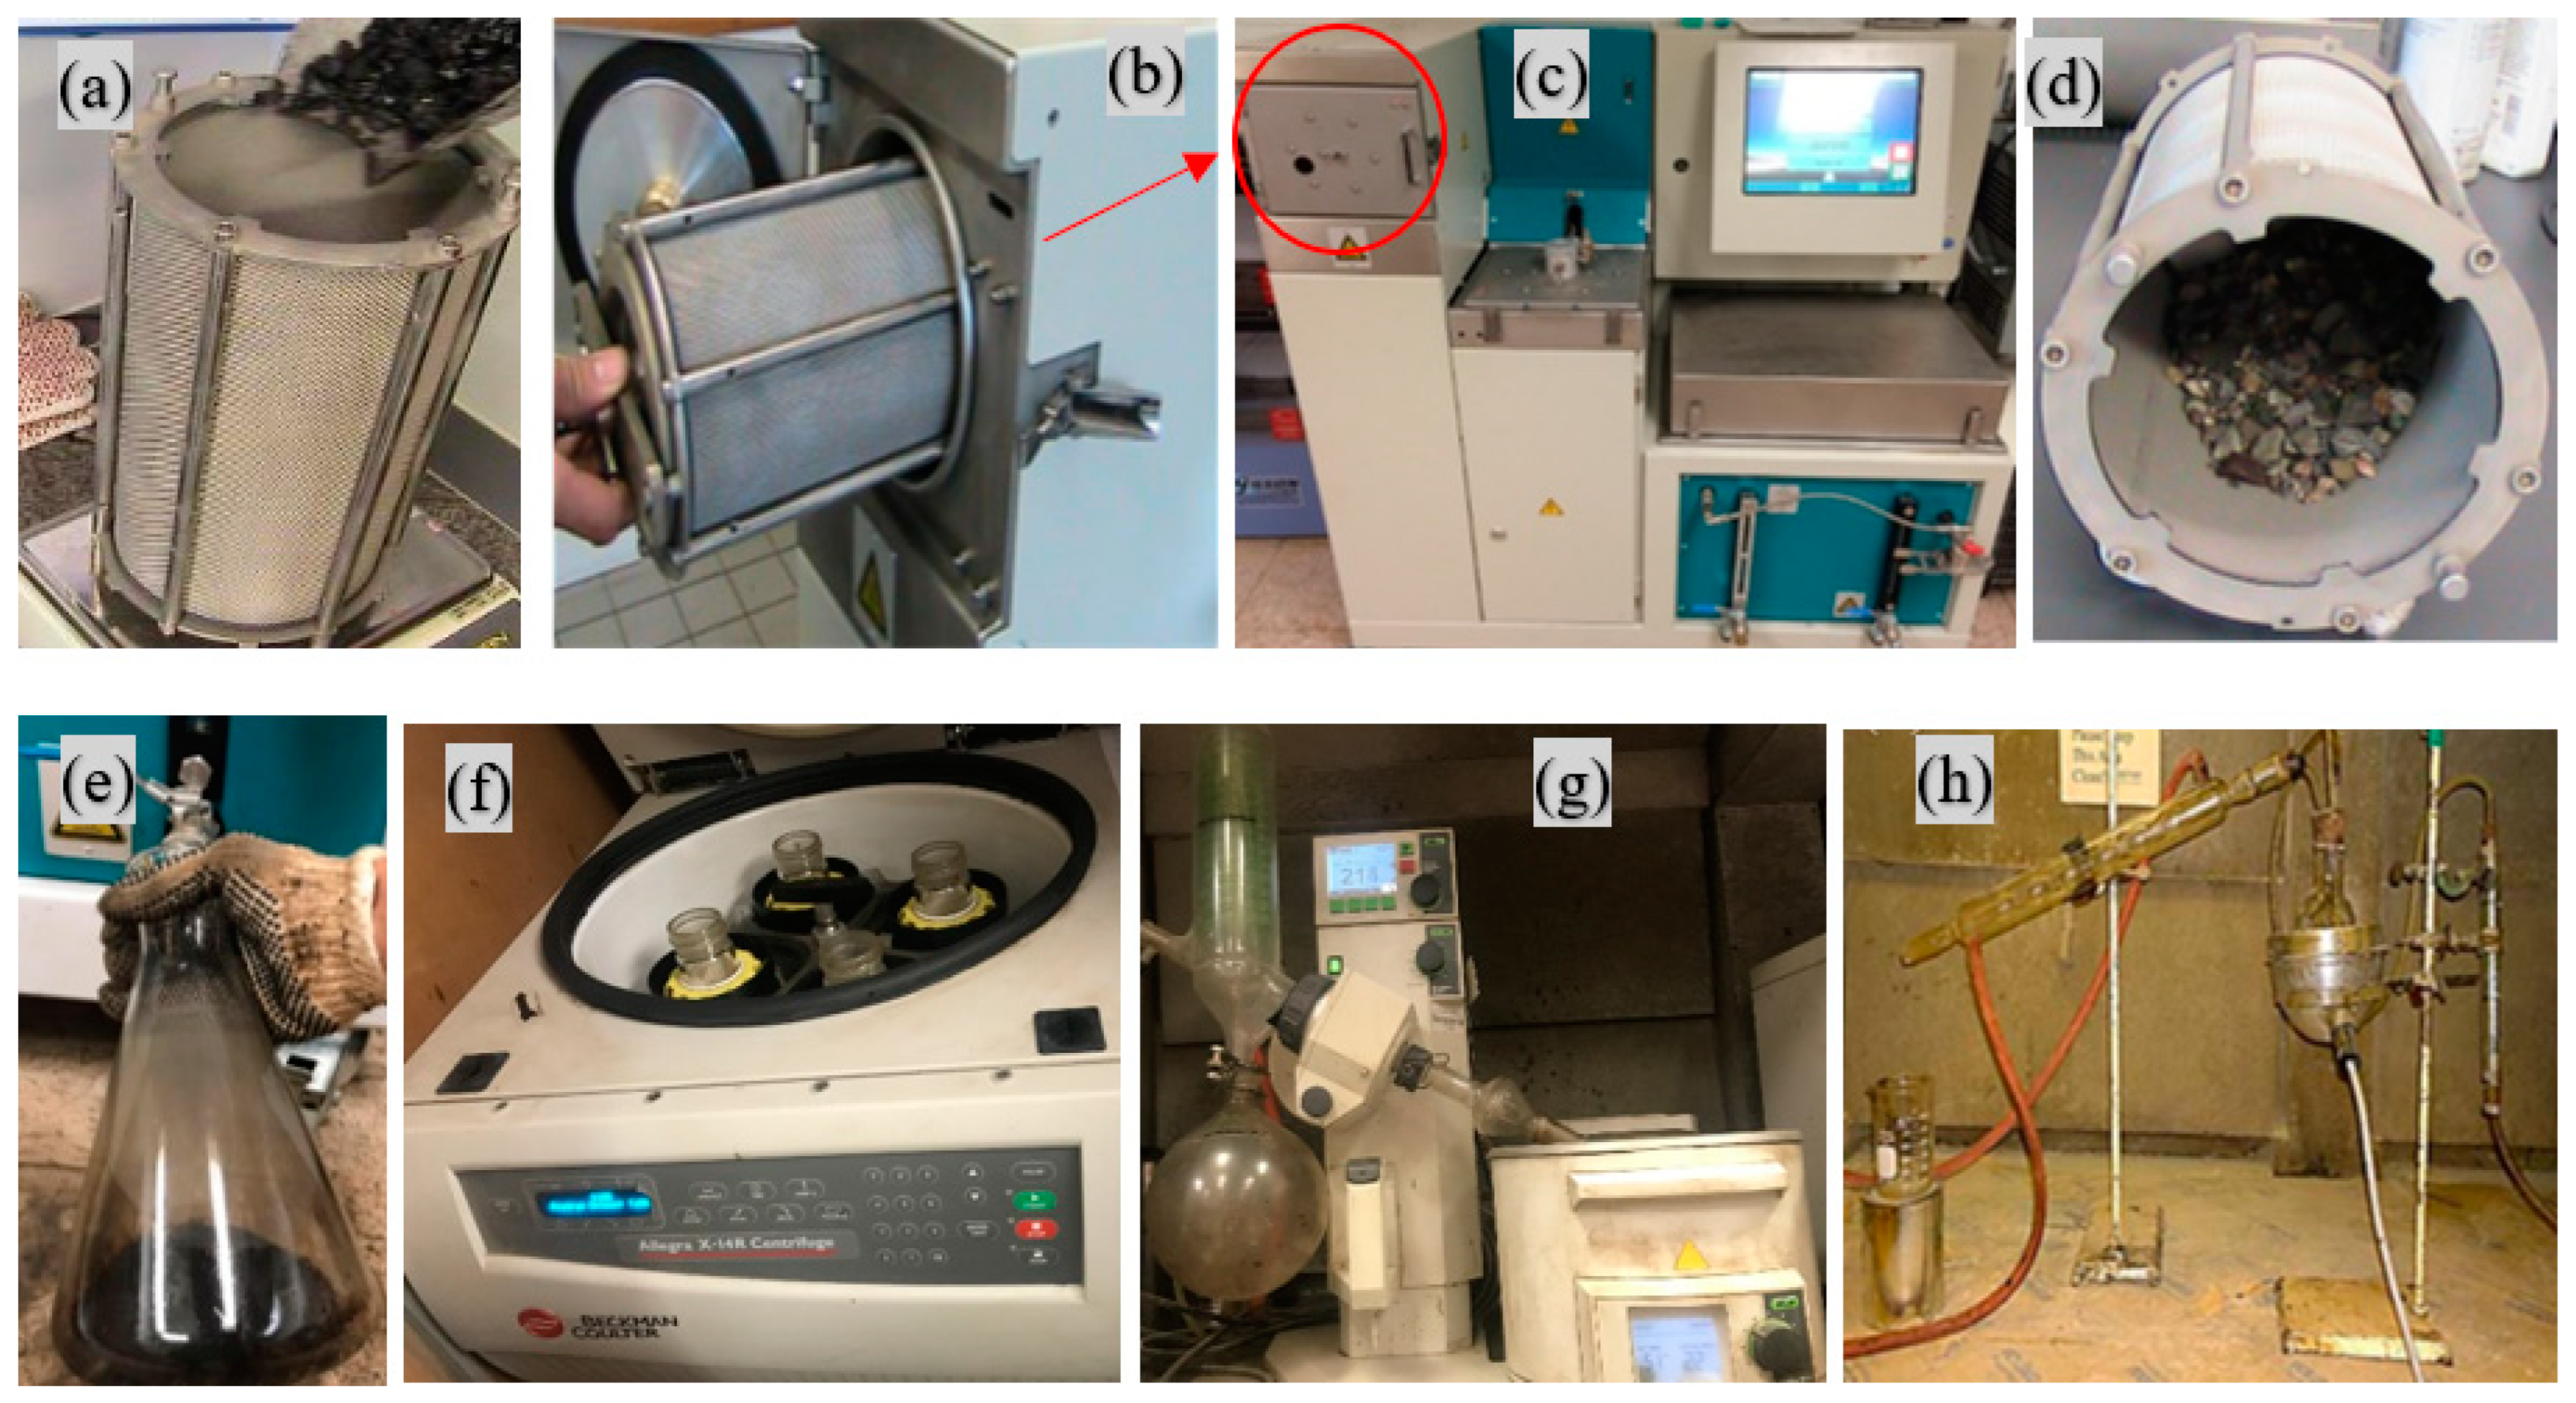
To validate the performance grading of blended binders obtained from the blending tool, the asphalt binders were extracted from the asphalt mixtures and rheologically graded. Asphalt binders were extracted following the ASTM D8159 standard [19] using a trichloroethylene (TCE) solvent type. An automated asphalt analyzer machine was used for extracting asphalt binders from asphalt mixtures. The process starts with adding around 2 kg of loose asphalt mixture into the drum, Figure 3a. The drum is then installed in the machine, Figure 3b. The asphalt mixture in the drum was washed using the TCE solvent and dried for multiple cycles automatically, Figure 3c, resulting in separating aggregates Figure 3d and unrecovered asphalt binder, Figure 3e. An auto-centrifuge (Allegra X-14R) machine was used for removing remaining fillers and fines for 30 minutes at 770 rpm, Figure 3f. Following the initial extraction process, a condenser, specifically an auto-evaporator, was employed to remove a significant portion of the TCE through condensation, Figure 3g. Subsequently, the Abson distillation procedure was implemented to achieve further separation of TCE from the extracted asphalt binder. Finally, the elimination of residual TCE traces was accomplished by introducing carbon dioxide gas. The Abson method was executed in strict adherence to the AASHTO R 59 standard [20]. The configuration for the Abson method is illustrated in Figure 3h.

Figure 3.
Asphalt binder extraction and recovery; (a) adding sample into the drum, (b) placing the drum in the auto-extractor, (c) washing and drying the drum (indicated in red circle), (d) extracted aggregates, (e) extracted unrecovered asphalt binder, (f) removing remaining fillers and fines from asphalt binders, (g) condensing solvent, and (h) removing residual solvent traces.
5. Binder Blending Tool
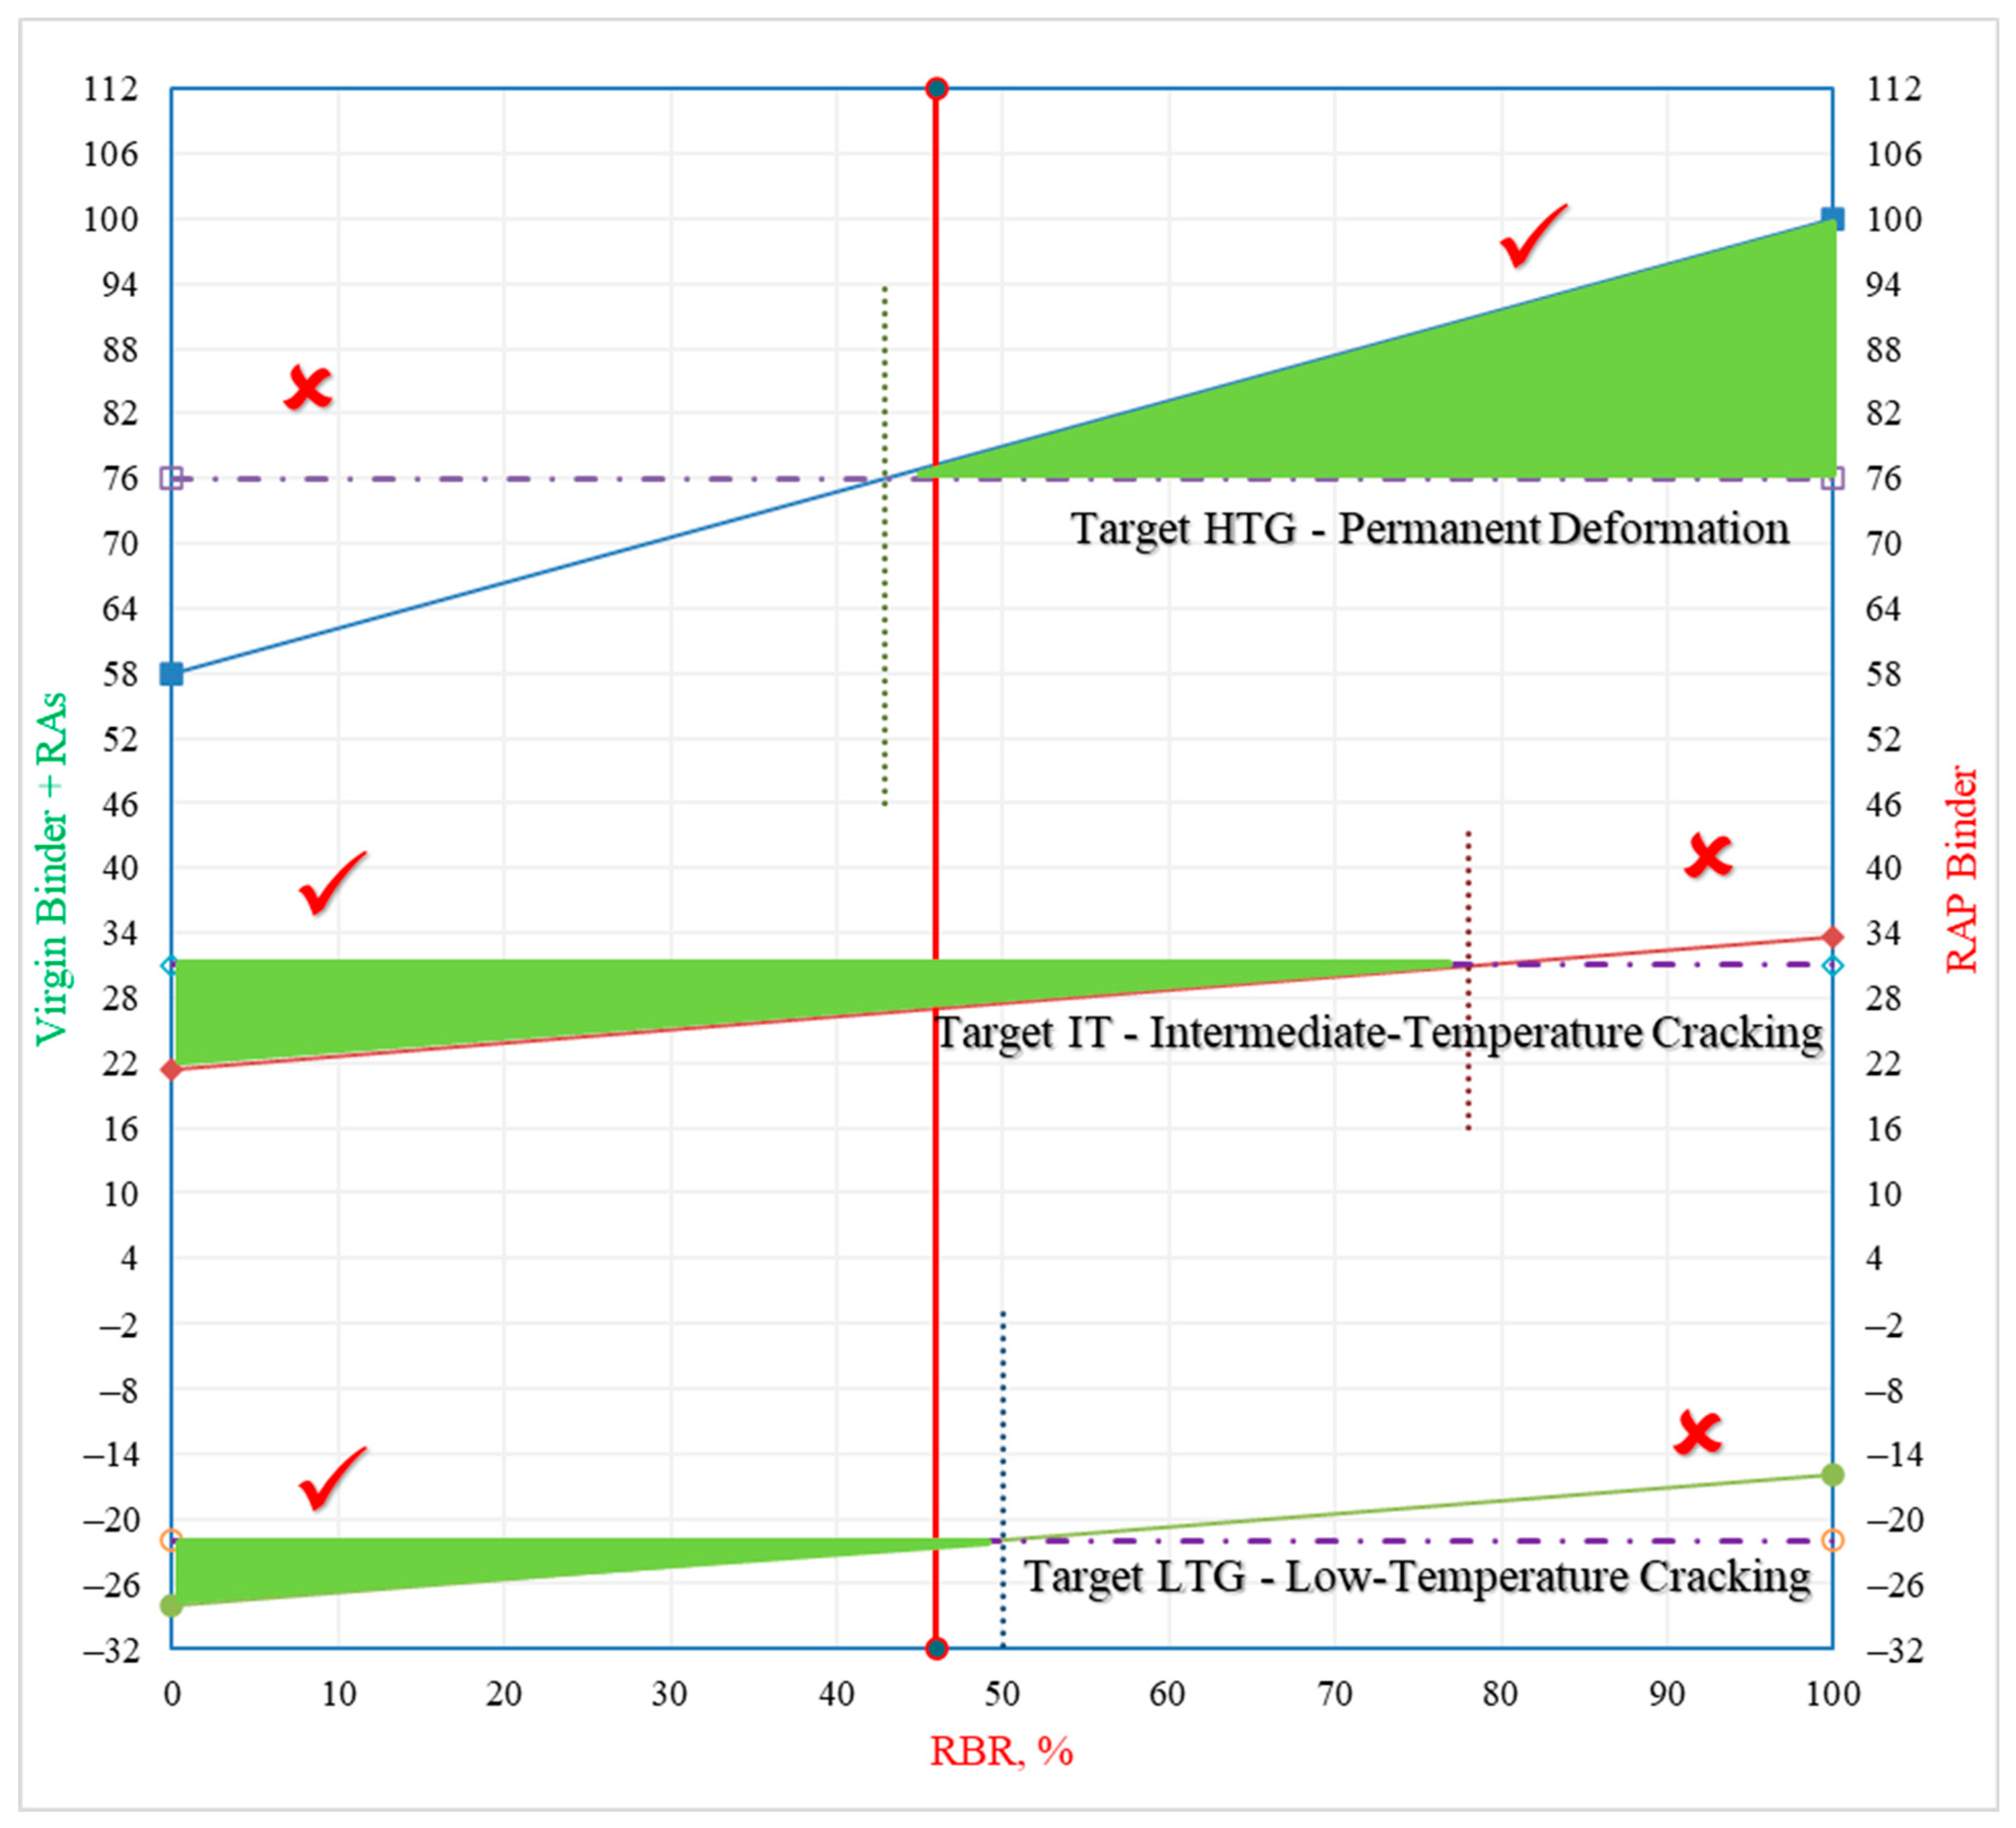
This study developed a blending binder tool to forecast the PG of a final asphalt binder output based on the PG of two blended asphalt binders, following correlations developed in a previous study [21]. The process aimed to find critical grading temperatures where the asphalt might have distressed at the thresholds and introduced the AASHTO M320 protocol [22]. Considering a predetermined RAP content and critical temperatures for both the recycled and new asphalt binders, the developed tool could estimate the final asphalt binder PG and optimize RA dosage. These calculations were explained in a previous study conducted by the authors [9]. All blending equations have been incorporated into an Excel-based blending tool for asphalt binders. Figure 4 presents the blending tool interface, it has two parallel y-axes and an x-axis; the left y-axis presents the PG of soft asphalt binder (virgin asphalt binder blended with an RA), the right y-axis presents the PG of RAP asphalt binder, x-axis presents the RBR level or the percent of RAP-binder in asphalt mixture. The target asphalt binder PG is graphed horizontally across the blending chart for high-, intermediate-, and low-temperature grades, Figure 4.
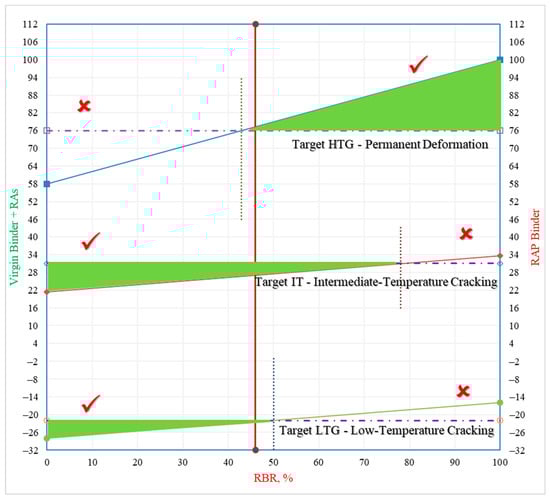
Figure 4.
RAs’ dosage optimization using blending asphalt binders’ tool.
After determining the RAP asphalt binder PG and target asphalt binder PG, an RBR level of 0.46 (for 50% RAP content in the asphalt mixture) was selected. The RBR level is graphed as a red vertical line inside the blending tool chart to intersect with the x-axis, Figure 4. Three lines were then drawn starting at RAP-binder PG points on the right y-axis to the intersecting points between target asphalt binder PG and RBR vertical red line. Those three lines were extended to reach soft asphalt binder (virgin asphalt binder blended with RA) PG. In this example, the required soft asphalt binder was PG 58-28 as shown on the left y-axis, Figure 4. The unmodified PG 67-22 virgin asphalt binder was diluted to meet PG 58-28 asphalt binder grading by blending optimized dosages of RAs. It is worth noting that the three green triangles graphed in the blending chart represent achieving the required target asphalt binder PG. The vertical red line (RBR line) is moved right and left to stay within the three acceptable regions (green triangles), as exemplified by RBR equal to 0.46, Figure 4.
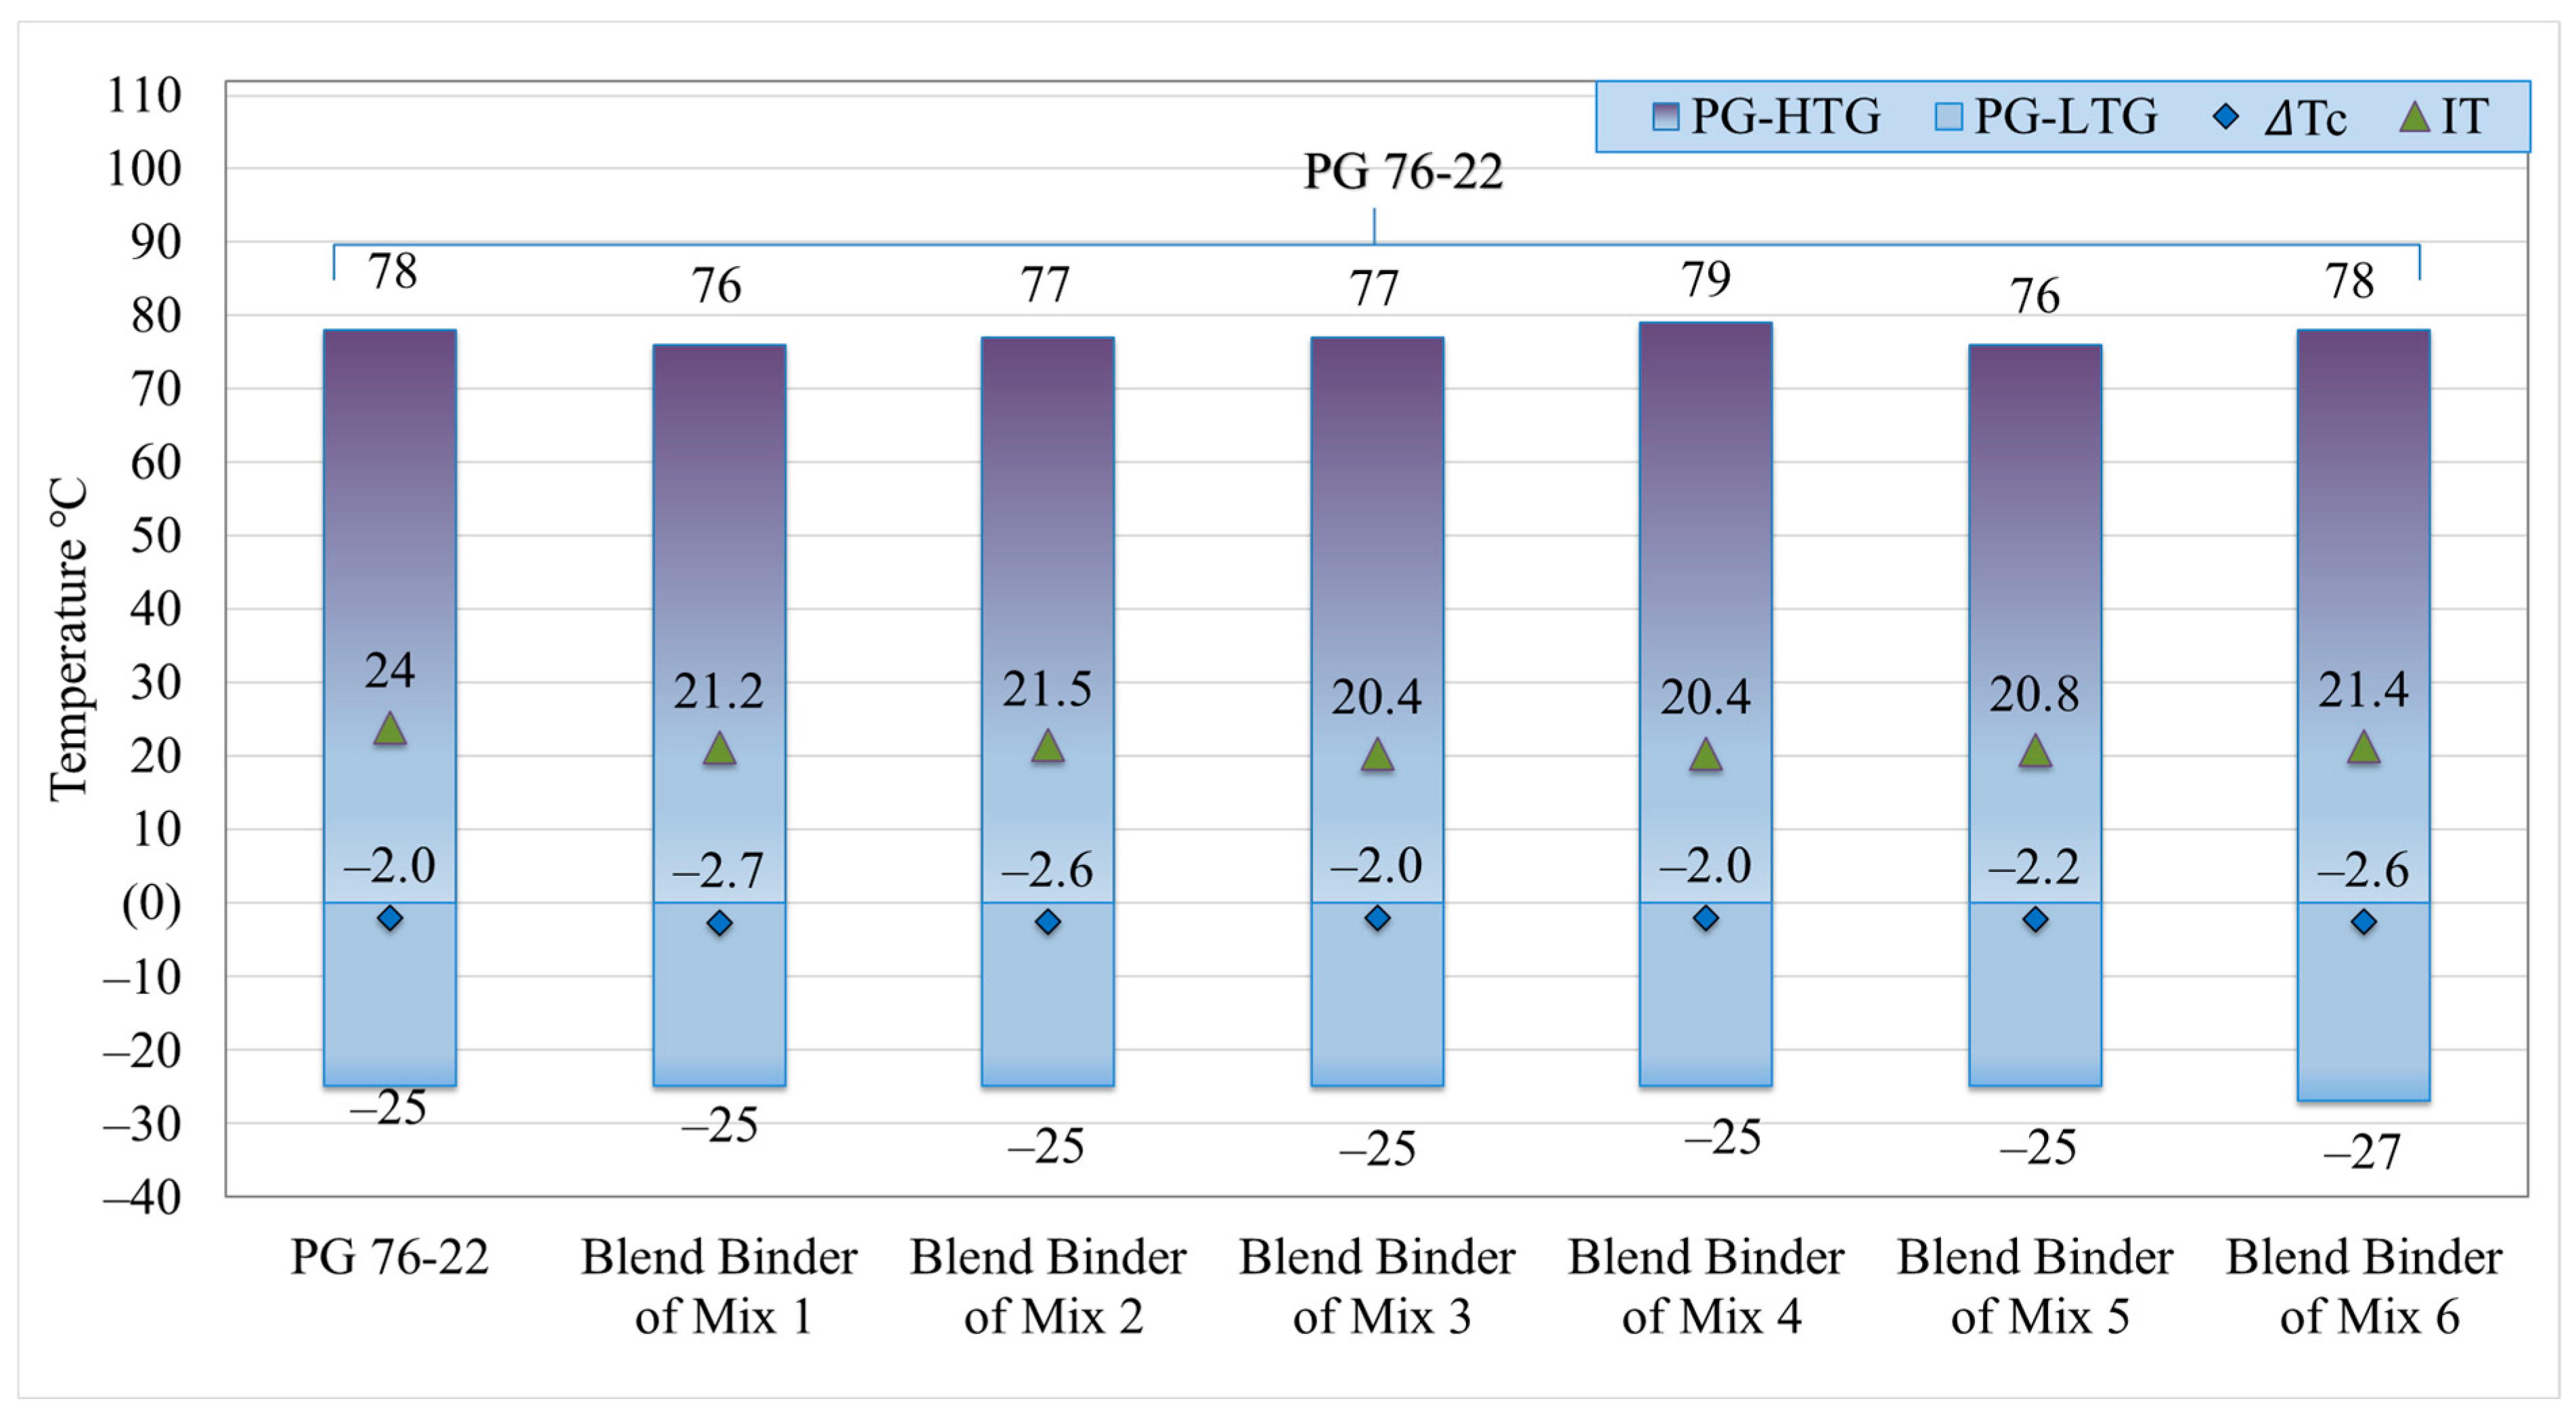
Figure 5 shows that the blended (target) asphalt binders’ PG for studied asphalt mixtures were similar by adjusting the RA content according to the blending binder tool.

Figure 5.
Target asphalt binder grades of the asphalt mixtures containing 50% RAP (blending tool).
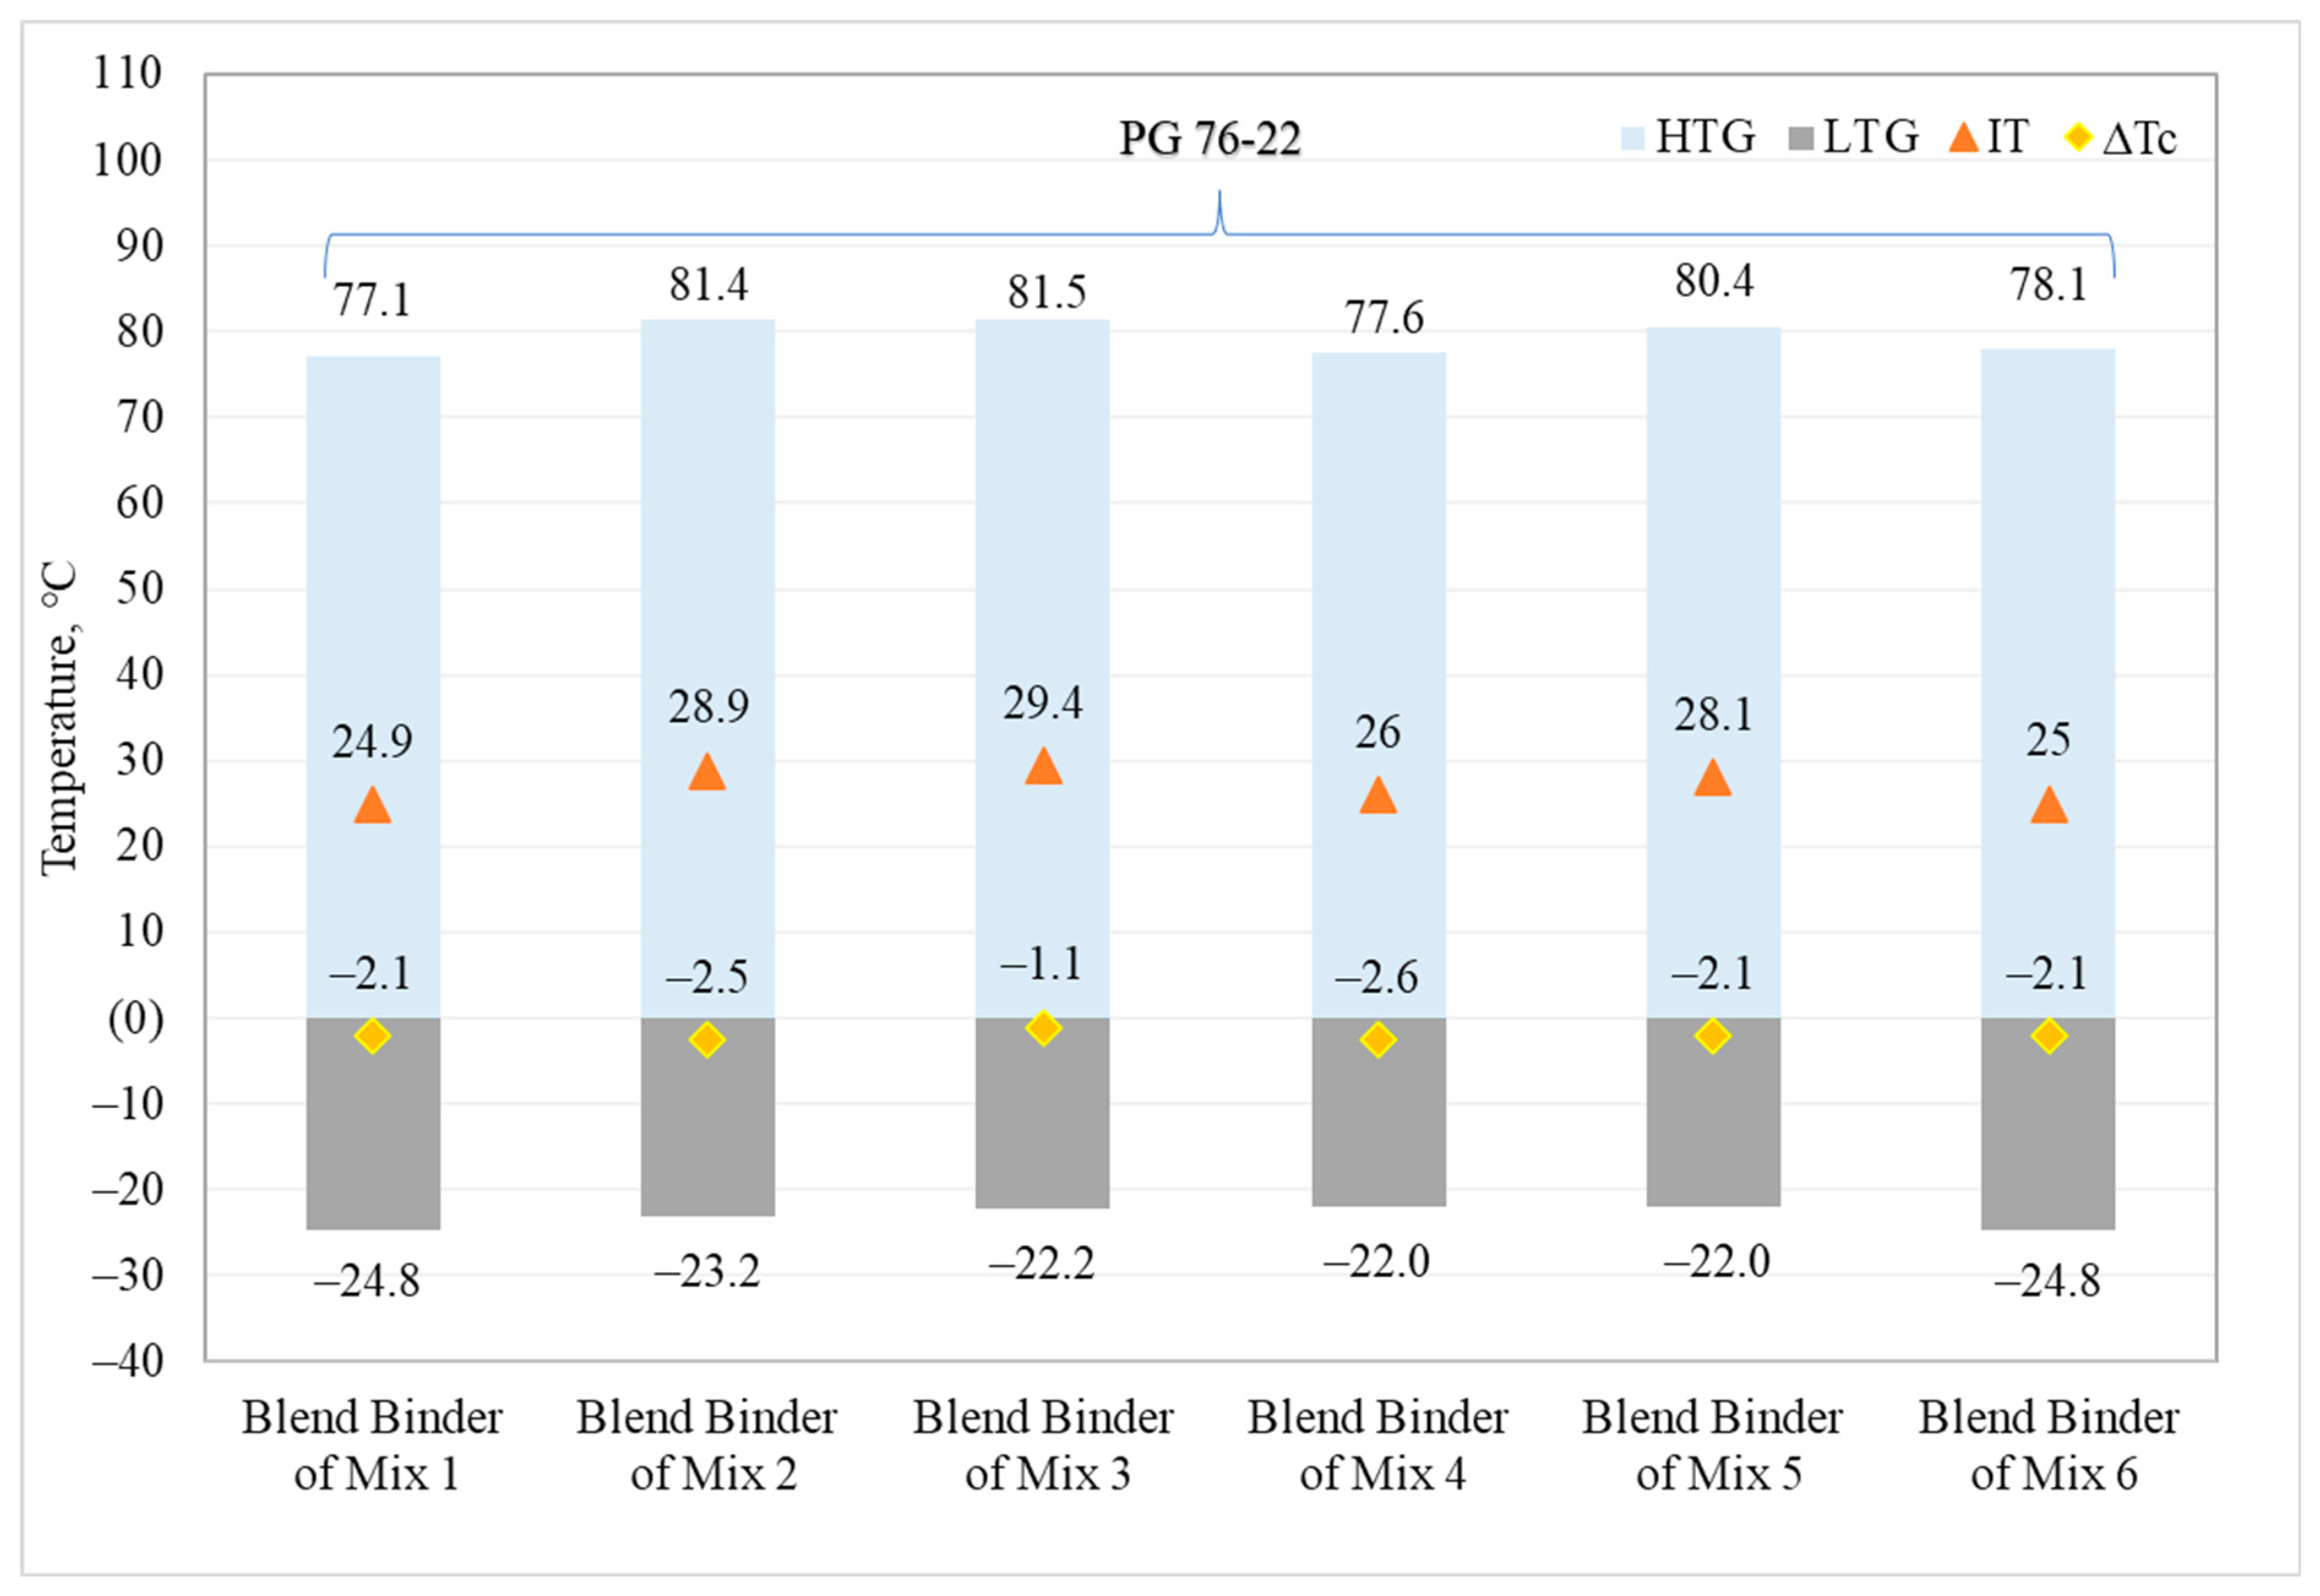
Asphalt binders were extracted from the six asphalt mixtures containing RAP and graded. Figure 6 presents the PG of extracted asphalt binders from asphalt mixtures containing 50% RAP. The PG of the extracted binder achieved the same predicted PG indicated by the blending tool.
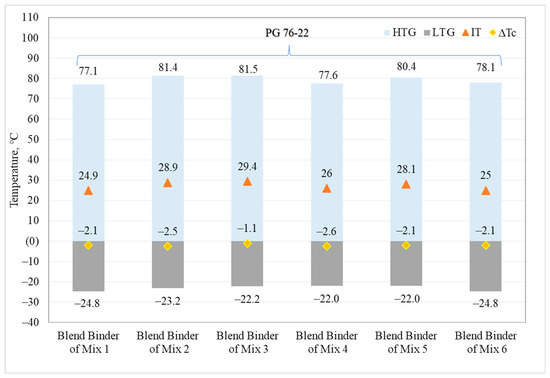
Figure 6.
The PG of extracted asphalt binders from asphalt mixtures containing 50% RAP.
6. Asphalt Mixture Design
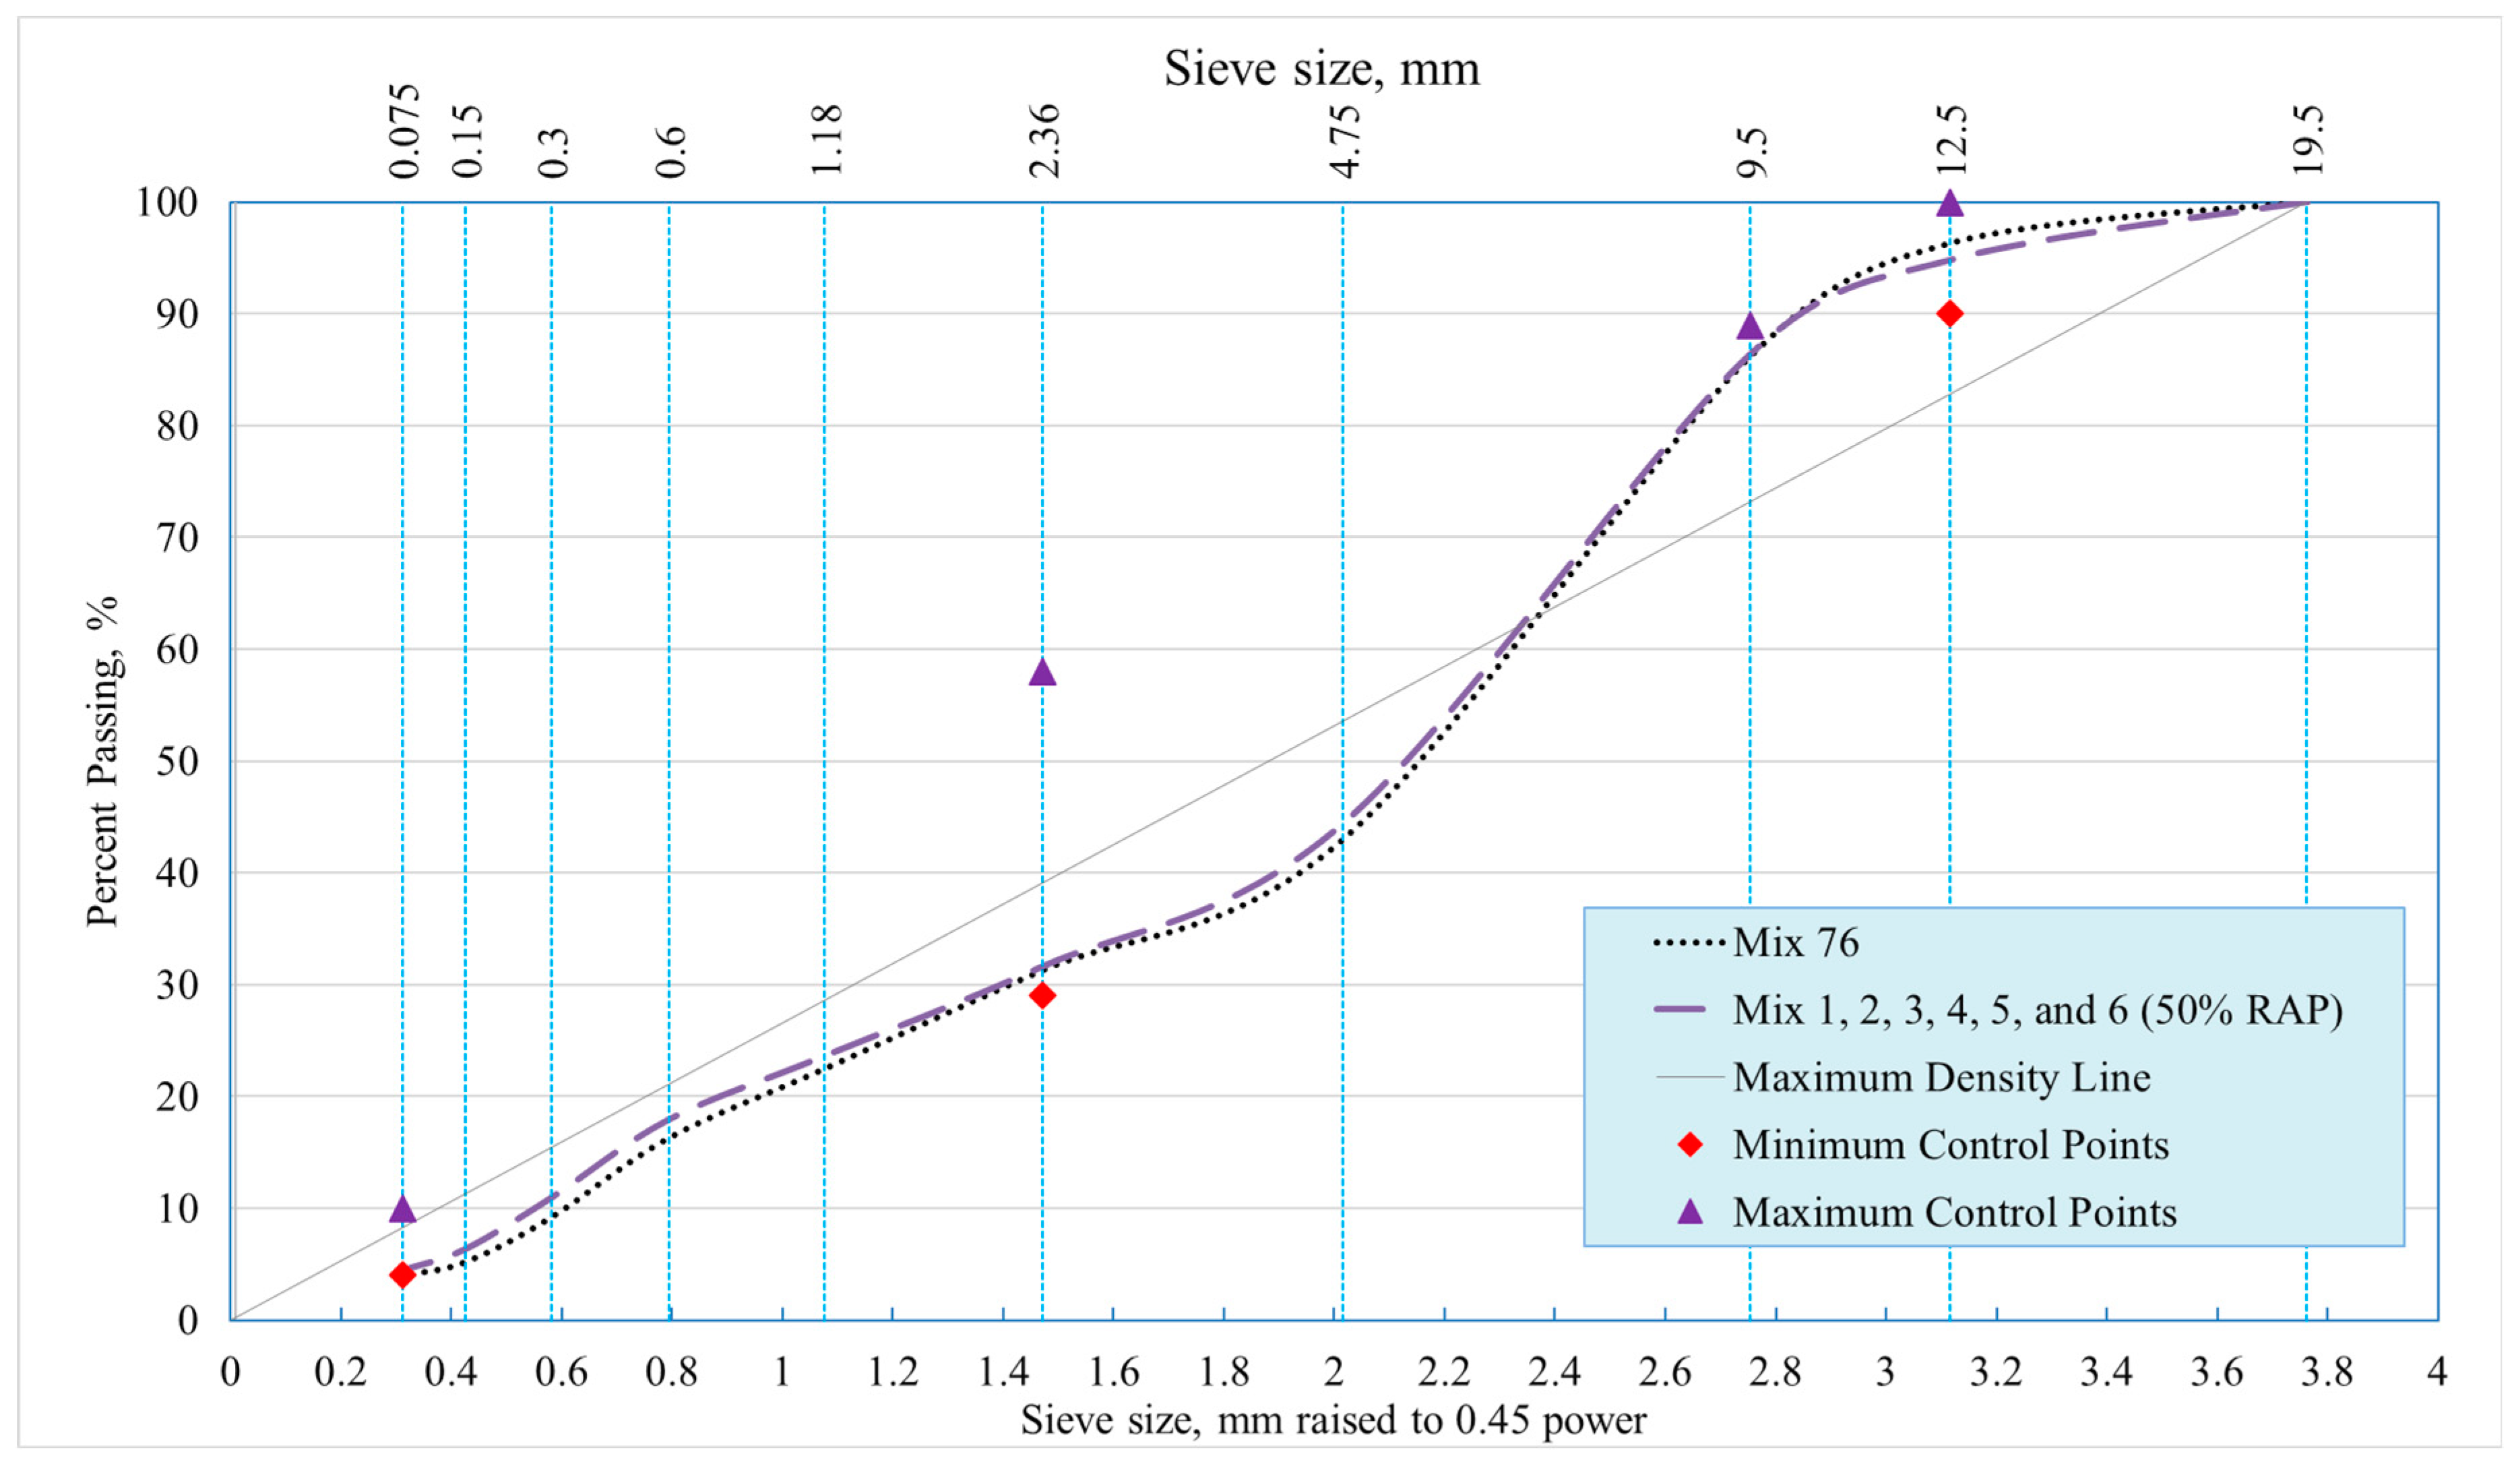
Seven 12.5 mm NMAS asphalt mixtures were designed for traffic volume roads (more than 3 million ESALs) following AASHTO R 35 protocols [23] and DOTD specifications [18]. All asphalt mixtures were prepared to target similar volumetric proportions within DOTD tolerances [18]. Details on the mix design and aggregate composition can be found in Table 3. It is worth mentioning that all asphalt mixtures were of a similar dense gradation on the fine side of the maximum density line, Figure 7. Asphalt mixtures had a 5.3% asphalt content, while the RAP materials contained 4.9% asphalt binder content. The mixing process started with adding an RA to PG 67-22-unmodified asphalt binder and stirring using a paddle mixer at 165 °C. In parallel, RAP-containing materials were first mixed with superheated aggregates [24]. The last step was introducing the asphalt binder including RA to the RAP and aggregate mix to produce asphalt mixture. Asphalt mixtures were then short-term aged for 2 h at 135 °C and compacted using the Superpave gyratory compactor to specific dimensions for testing.
Table 3.
Job mix formulas for asphalt mixtures studied.
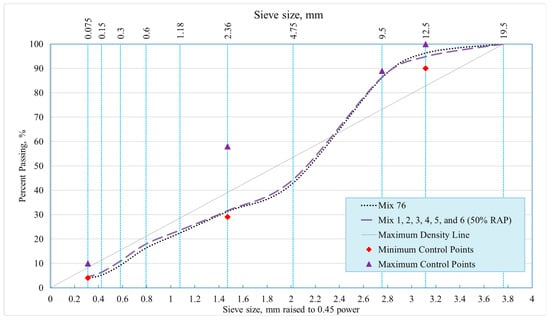
Figure 7.
Aggregates’ gradation for the studied asphalt mixtures.
7. Testing Methods
Table 4 presents performance tests conducted on studied asphalt mixtures. A 7% ± 0.5% air void percentage was utilized in all testing specimens. All specimens were subjected to short- and long-term aging before testing following the AASHTO R30 standard [25] except HWTT specimens (only short-term aging).
Table 4.
List of mechanical tests conducted on asphalt mixtures.
8. Laboratory Test Results and Discussion
The laboratory test results underwent statistical analysis using the Analysis of Variance (ANOVA) function within the Statistical Analysis System (SAS) software version 9.4, SAS Institute, Inc. at Cary, NC, USA [31]. A multiple comparison procedure, specifically Tukey’s Honestly Significant Difference test, was employed at a 95% confidence level to evaluate the means. All the test results showing insignificant differences using the ANOVA function were grouped together across all studied asphalt mixtures for each test performed. These statistical groupings are designated by capital letters (A, B, C, D, etc.), “A” signifies the mean value for the best performance, followed by subsequent letters in descending order. A combination of two or more letters (e.g., A/B) indicates that the means being compared are not statistically distinct, suggesting that the particular mean falls within the range of both referenced groups.
8.1. Permanent Deformation
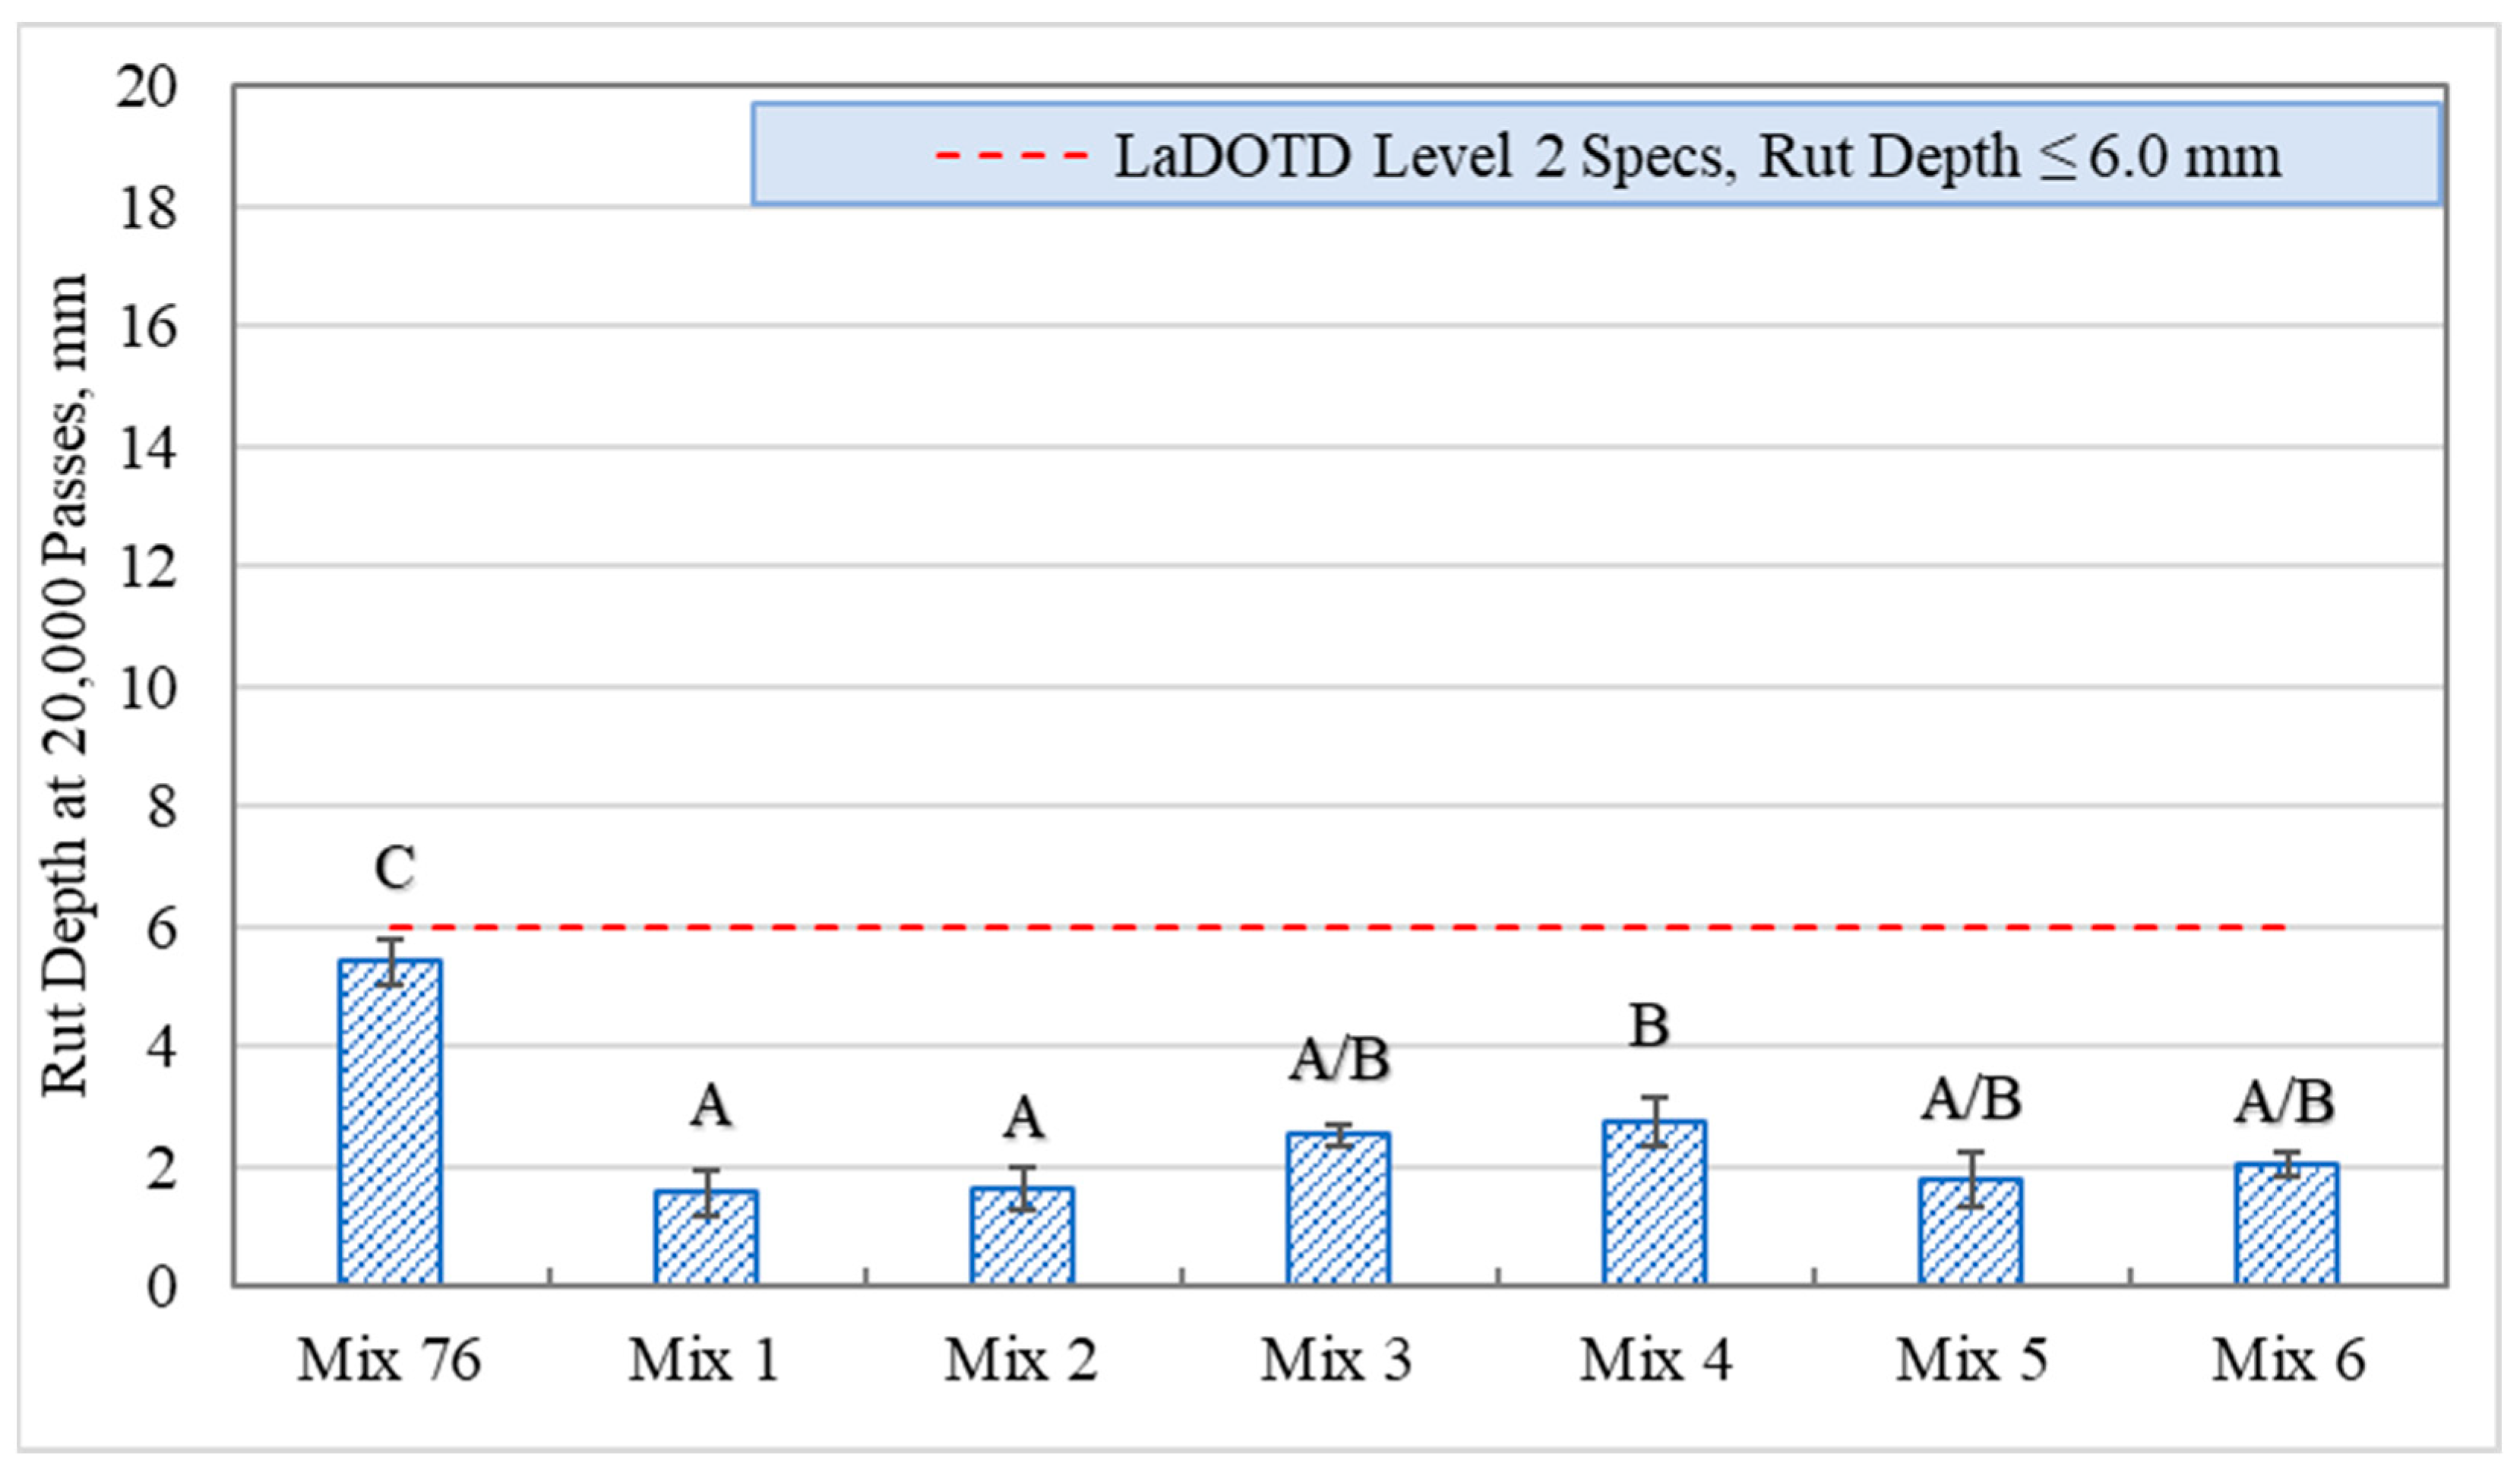
Figure 8 illustrates the rut depth measurements for the evaluated HWT asphalt mixture specimens. Rut depth variability, quantified by the coefficient of variation (CoV), ranged from 7% to 13.5%, with an average of 10%. All asphalt mixtures met the DOTD-specified maximum rut depth of 6 mm at 20,000 load repetitions [18]. However, the control mixture, Mix 76, exhibited greater rut depth at this load level compared to other mixtures containing RAP. This suggests that the incorporation of RAP materials can enhance asphalt mixture stiffness, despite the use of a softer PG 67-22 asphalt binder and RAs. Additionally, the results indicate that the use of RAs did not adversely affect permanent deformation. The evaluated asphalt mixtures exhibited no stripping failure throughout the HWT test.
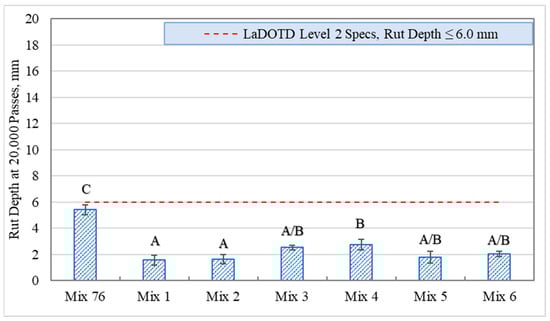
Figure 8.
HWT results—rutting depths.
8.2. Intermediate-Temperature Cracking/Fracture Resistance
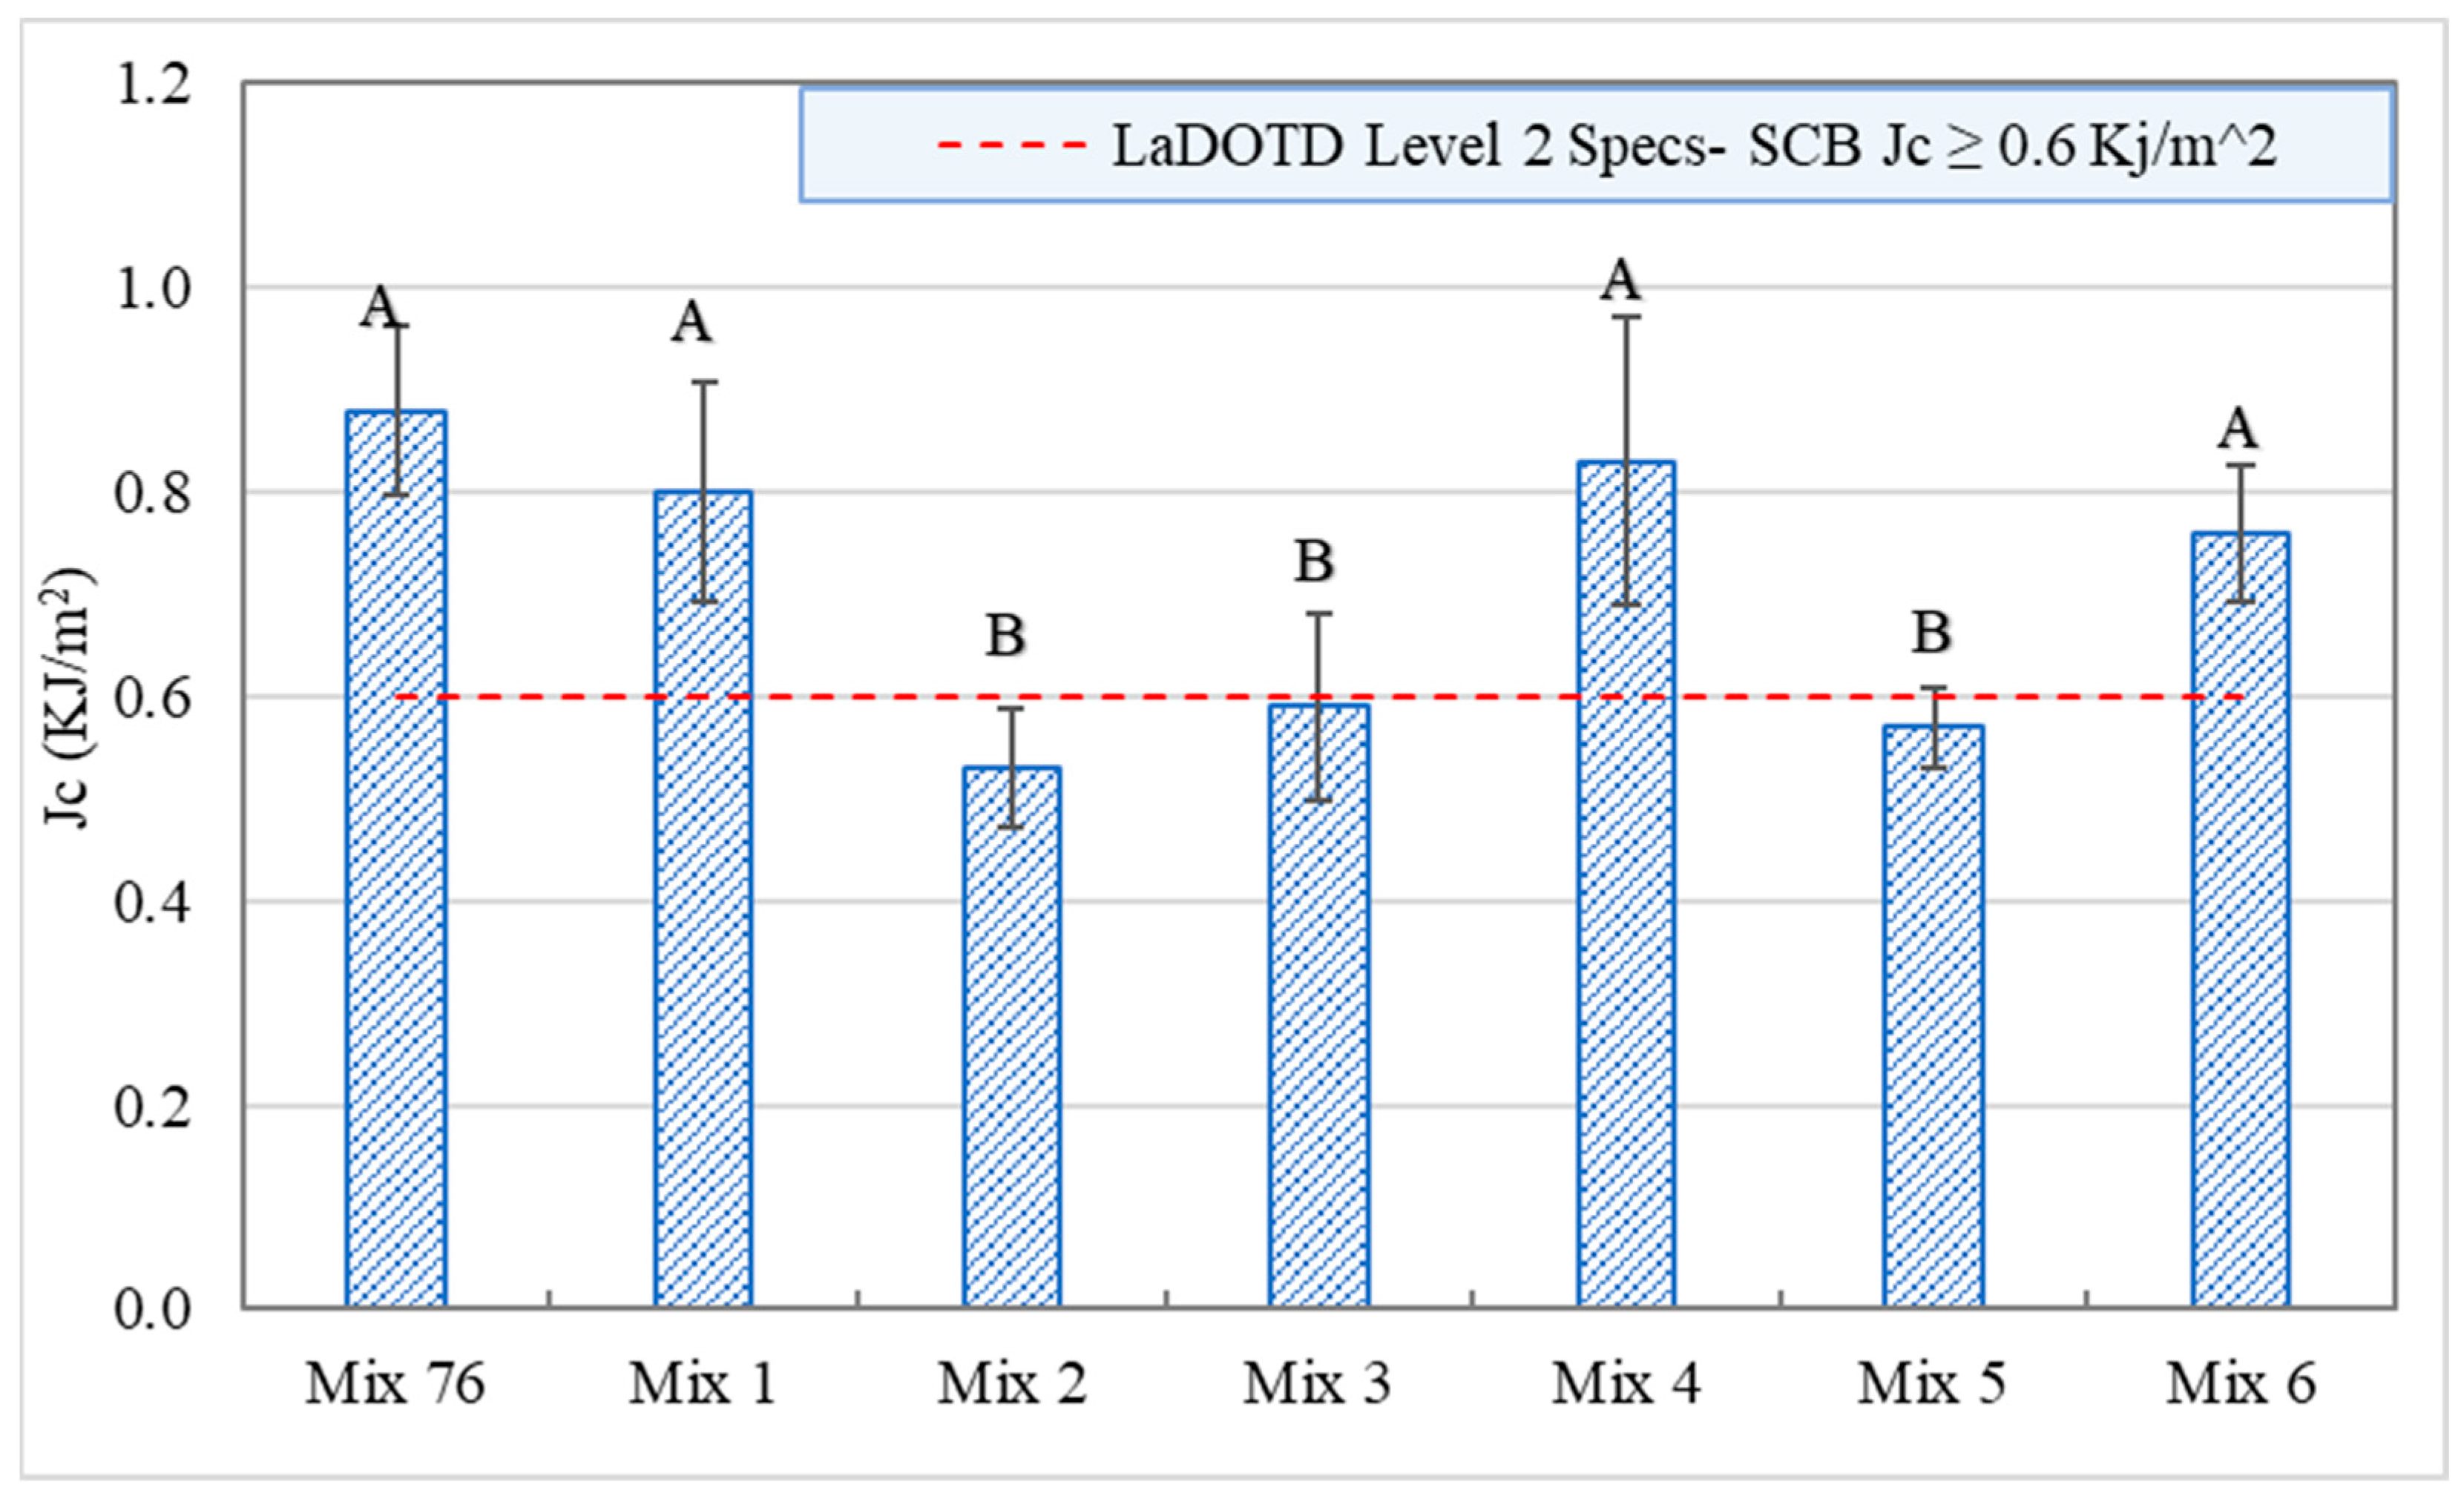
Figure 9 presents the critical strain energy release rate (Jc) values determined from SCB testing for the studied asphalt mixtures. The SCB test is performed at a slow loading rate of 0.5 mm/minute. The CoV for the change in strain energy with notch depth (dU/da) ranged from 7% to 17%, averaging 13%. Enhanced resistance to intermediate-temperature cracking is correlated with higher Jc values. Mixtures 1, 4, and 6, incorporating RA 1, 4, and 6, respectively, demonstrated statistically equivalent SCB Jc values to the control mixture (Mix 76) and met the DOTD specification (Jc ≥ 0.6 kJ/m2). These results indicate that RA 1 (petroleum aromatic extract oil), RA 4 (soy oil blended with tall oil phytosterol intermediate), and RA 6 (tall oil fatty acid) effectively improved the cracking resistance of asphalt mixtures containing 50% RAP. Conversely, Mixtures 2, 3, and 5, containing RA 2, 3, and 5, respectively, exhibited statistically lower SCB Jc values than Mix 76 and did not meet the DOTD design criteria.

Figure 9.
SCB test results—SCB Jc parameter.
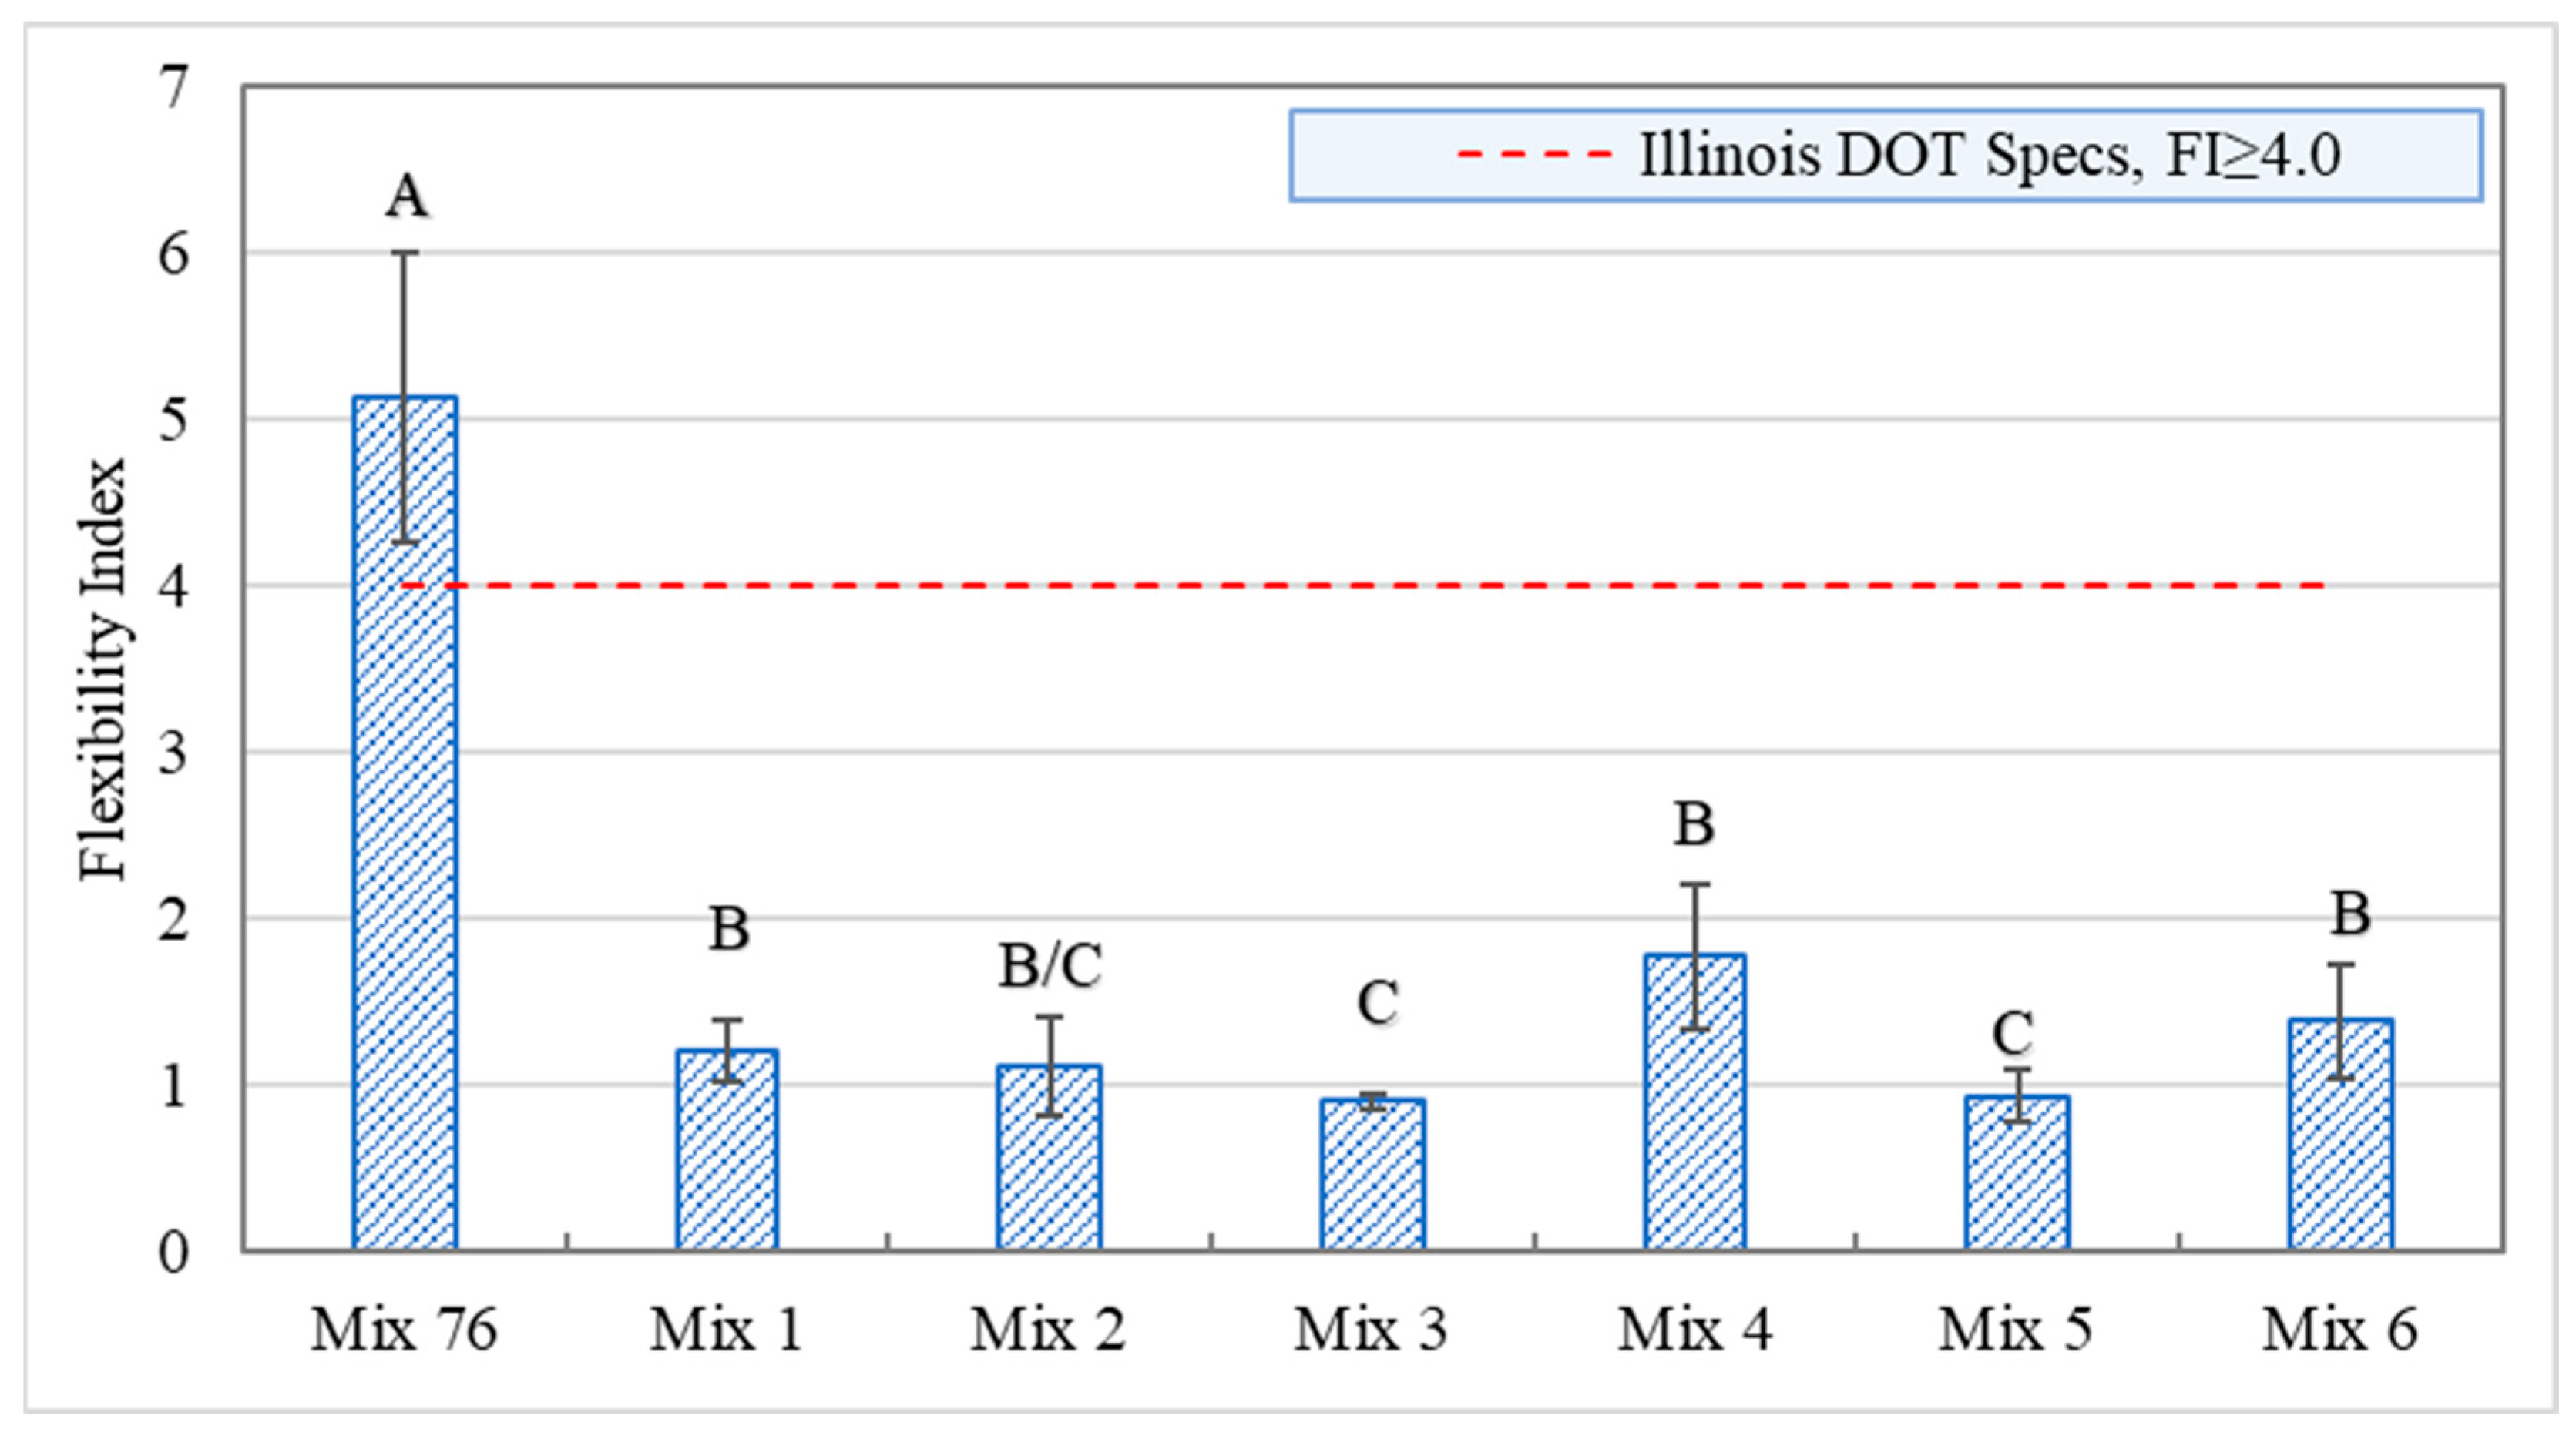
Figure 10 presents the flexibility index (FI) values resulting from the I-FIT test. I-FIT was conducted according to the AASHTO T 393 standard [29]. This test is performed at a fast loading rate of 50.8 mm/minute. Analysis was performed using MATLAB (IFIT 2017 V1.1) software [32]. The CoV of the FI varied between 6% and 25%, with an overall average of 19%. The higher the FI parameter for an asphalt mixture, the better the cracking resistance [33]. The Illinois DOT specifies an FI value greater than 4.0 for hot asphalt mixtures [34]. Asphalt mixtures containing 50% RAP and RAs showed significantly lower FI values than Mix 76. In addition, asphalt mixtures with 50% RAP did not meet the minimum specified FI value of 4.0. Mixes 1, 4, and 6 displayed statistically higher FI values than Mixes 2, 3, and 5. The large difference in FI values between the control mixture Mix 76 and the remaining asphalt mixtures containing 50% RAP might be caused by the high loading rate of 50 mm/min. This could result in a sudden drop for the post-peak region of the load-displacement curve obtained from the I-FIT test that increases slope value and reduces FI value significantly, especially with asphalt mixtures containing high-RAP levels.

Figure 10.
I-FIT test results—flexible index.
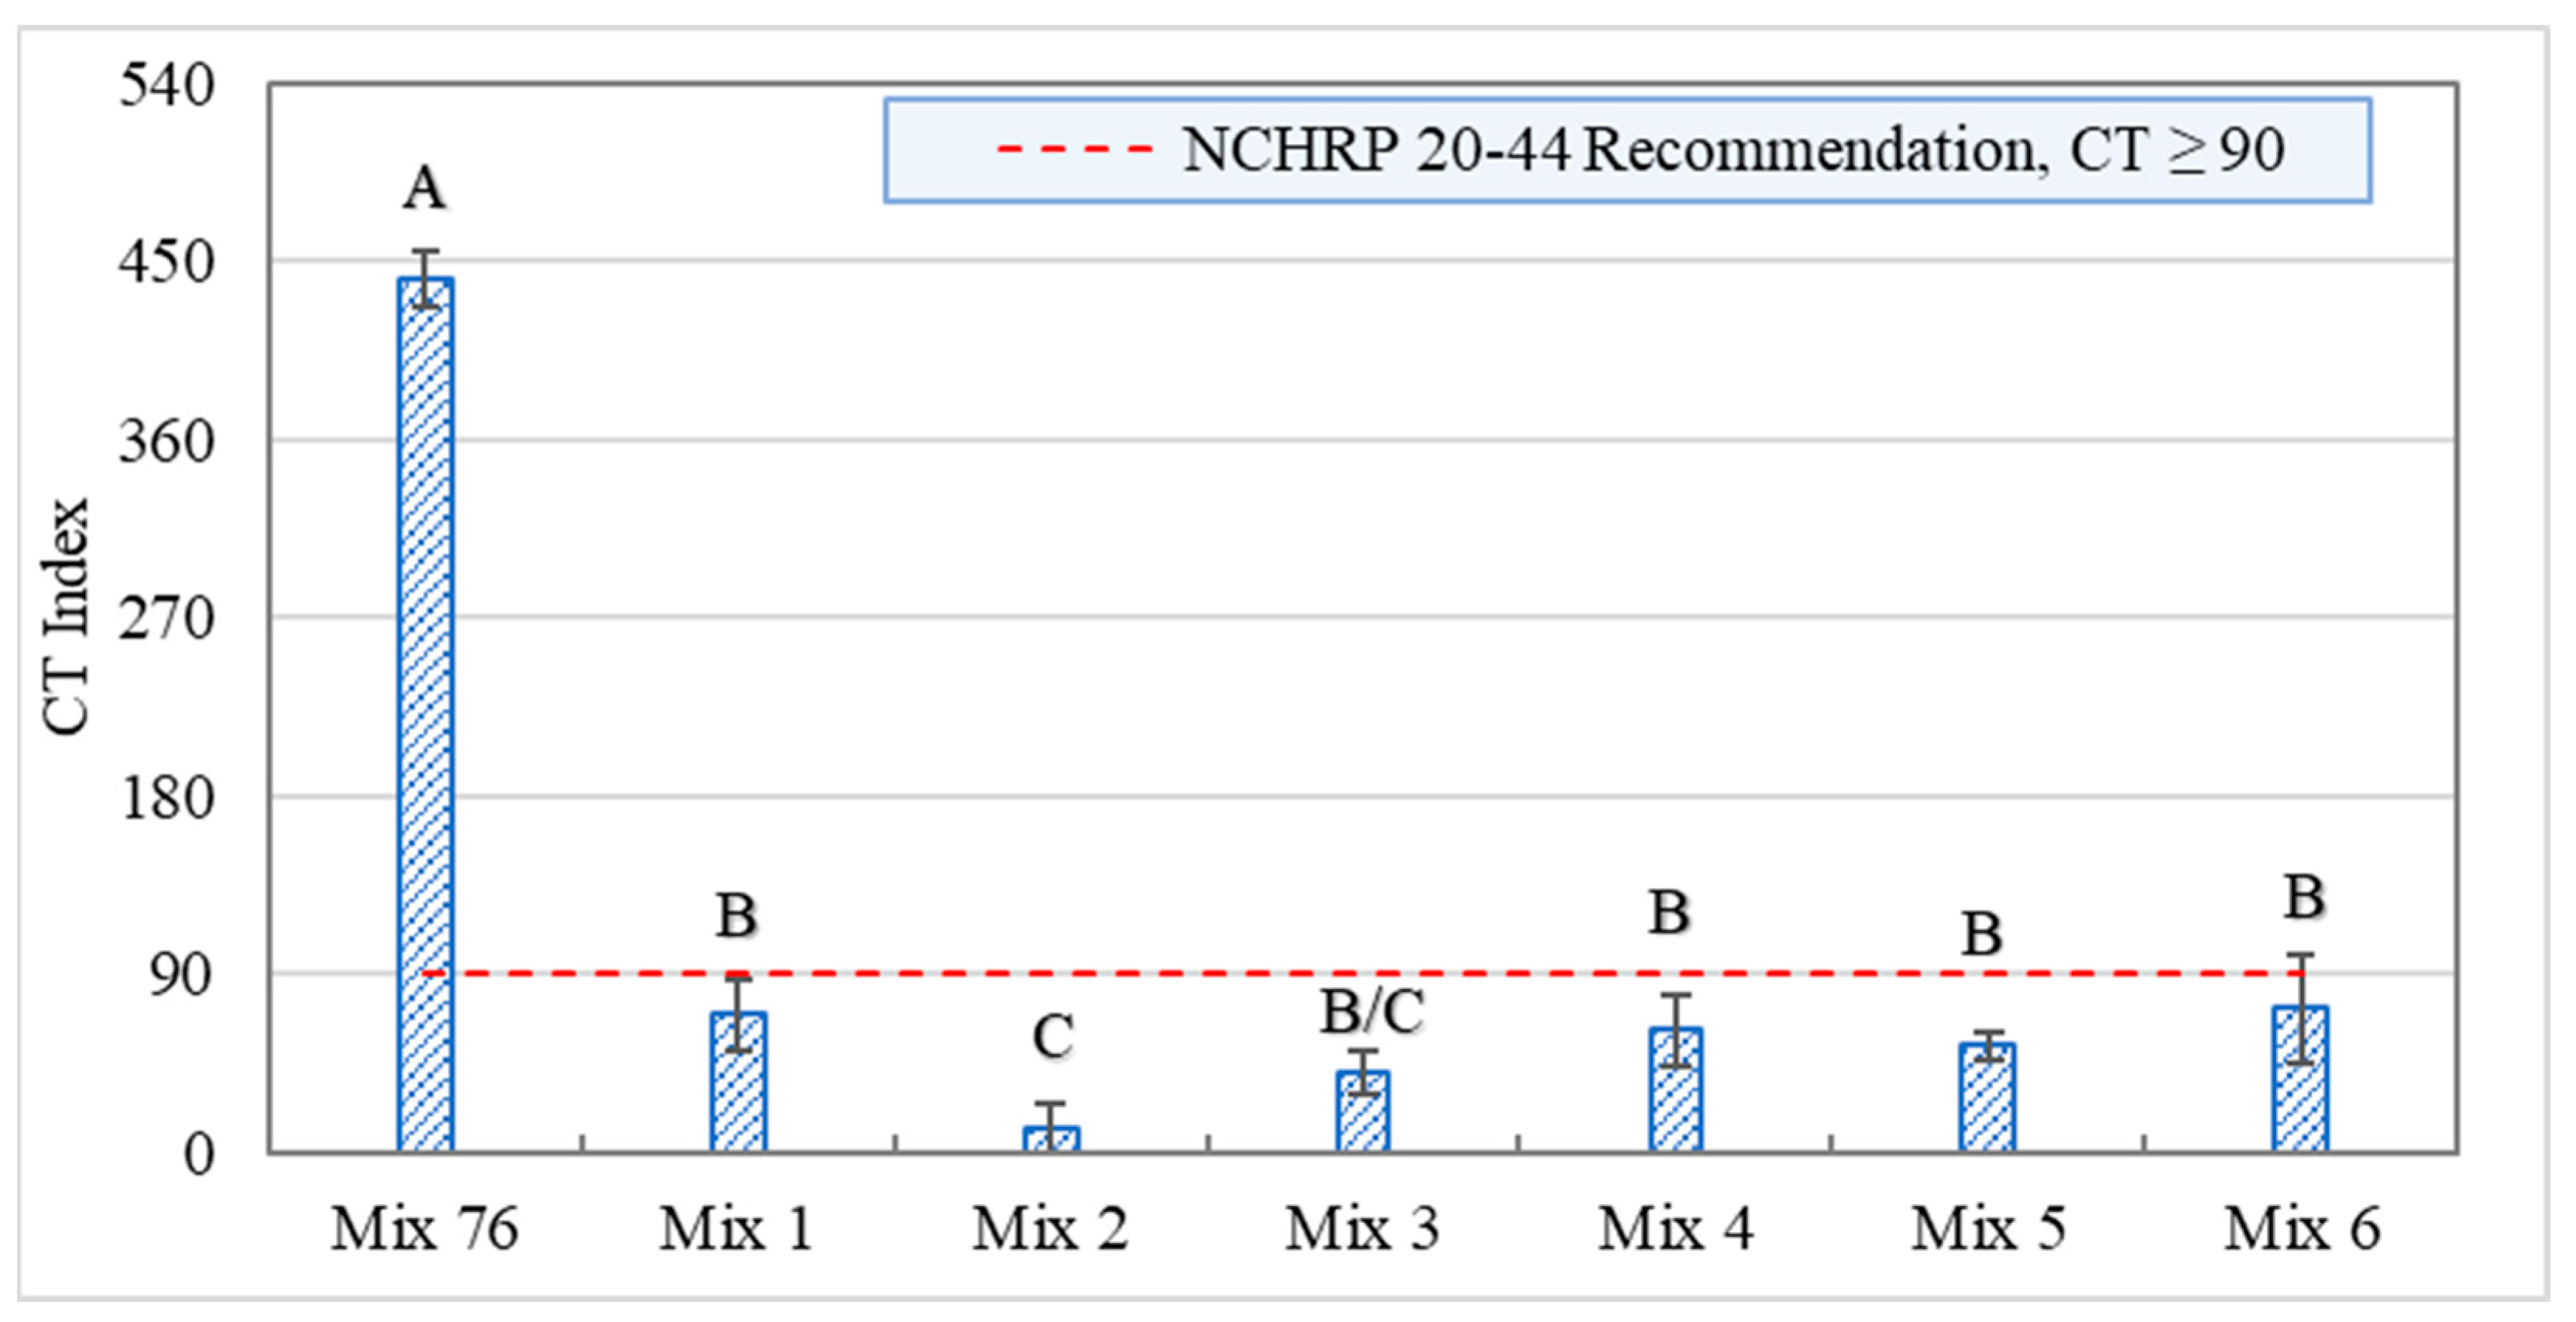
Figure 11 shows Ideal-cracking tolerance results, CT index values, for the asphalt mixtures evaluated following ASTM D8225 standard [28]. This test is also performed at a fast loading rate of 50.8 mm/minute. The CoV of CT values ranged from 3% to 26%, with an overall average of 18%. A minimum CT value of 90 was recommended for asphalt mixtures [35]. The control asphalt mixture Mix 76 achieved statistically higher CT values than asphalt mixtures containing 50% RAP and RAs, Figure 11. In addition, asphalt mixtures containing RAP and RAs did not meet the minimum recommended threshold of 90. Asphalt mixture Mix 2 containing 50% RAP and RA 2 (soy oil) displayed statistically lower FI values than all other asphalt mixtures containing 50% RAP. The large difference in CT values between the control mixture Mix 76 and asphalt mixtures containing RAP might be caused by the fast-loading rate of 50 mm/min used in this test. This causes a sudden drop in the post-peak region of the load-displacement curve obtained from the Ideal CT test, which results in a higher post-peak slope and low CT value.
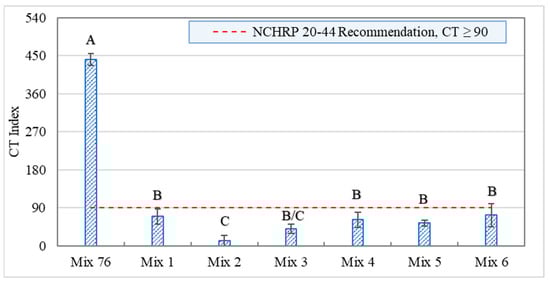
Figure 11.
Ideal CT test results—CT index.
- Summary of test results for intermediate temperature cracking tests
The specifications for cracking test results from SCB, I-FIT, and IDEAL CT typically follow a pass/fail criterion within the balance mixture design BMD framework [18,36]. Table 5 shows a summary of compliances with the criterion through a “Pass/Fail” designation. The control asphalt mixture Mix 76 passed the minimum threshold values for the three cracking tests conducted. Further, Mixes 2, 3, and 5 failed to comply with the minimum criteria established by the cracking tests considered. Conversely, Mixes 1, 4, and 6, containing RA 1 (petroleum aromatic extract), RA 4 (soy oil blended with tall oil phytosterol intermediate), and RA 6 (tall oil fatty acid), respectively, passed the SCB Jc criteria and failed to meet CT and FI criteria.
Table 5.
Summary of compliance of BMD cracking tests criteria of asphalt mixtures evaluated.
The SCB Jc parameter was able to capture the effectiveness of recycling agents R1, R4, and R6 in restoring RAP binder in asphalt mixtures containing 50%RAP, whereas FI and CT parameters lacked this capability. It is worth mentioning that SCB Jc parameter is a fundamental engineering property based on fracture mechanics principles [37]. Further, SCB Jc criteria adopted by Louisiana DOTD [18] were developed [7] and recently verified [38] with long-term field cracking measurements. On the other hand, FI and CT indices and their “Pass/Fail” criteria change from one state agency to another [36].
8.3. Low-Temperature Cracking Resistance
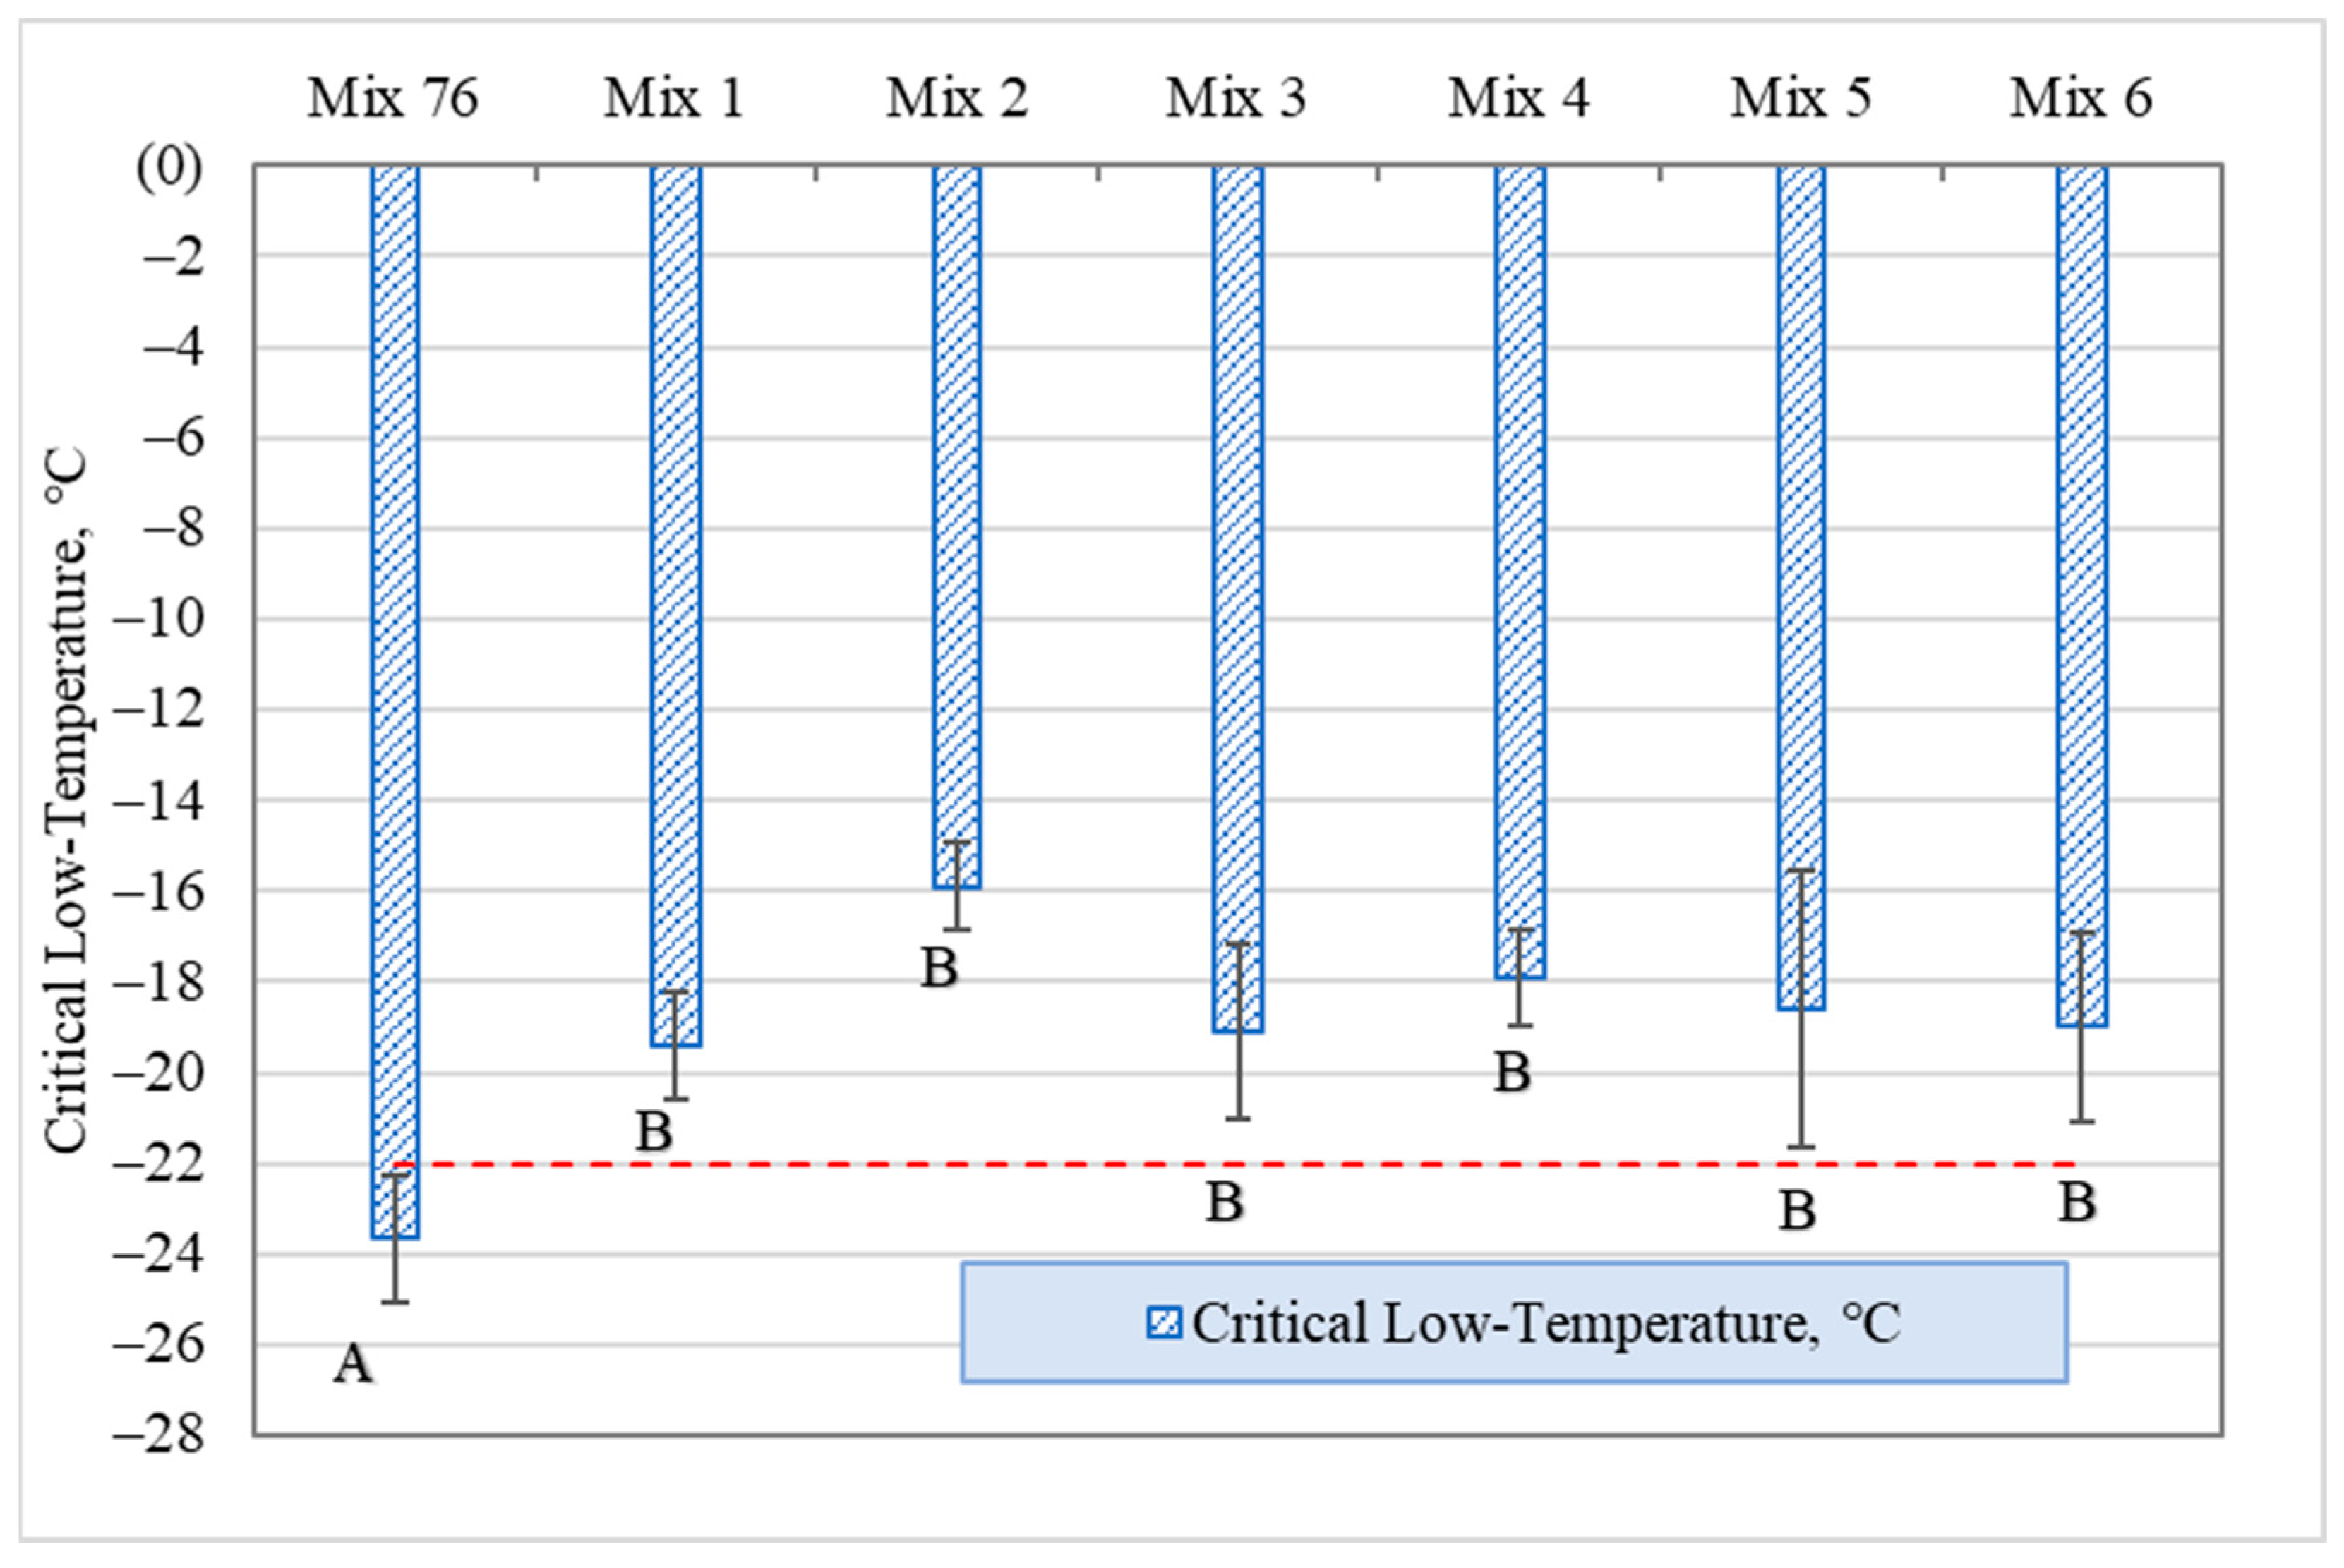
Figure 12 shows critical low-temperature cracking data derived from the TSRST test conducted by the AASHTO TP 10 standard [30]. The CoV values for critical low temperatures exhibited a range of 6.0% to 16.0%, with a mean of 10.0% for the studied asphalt mixtures. As anticipated, Mix 76 demonstrated a critical low temperature cooler than −22 °C due to the incorporation of a conventional PG 76-22 asphalt binder. Conversely, asphalt mixtures incorporating 50% RAP and RAs displayed critical low temperatures slightly warmer than −22 °C, despite utilizing a blended PG 76-22 asphalt binder. Statistical analysis revealed no significant differences in critical low-temperature cracking performance among asphalt mixtures containing 50% RAP.
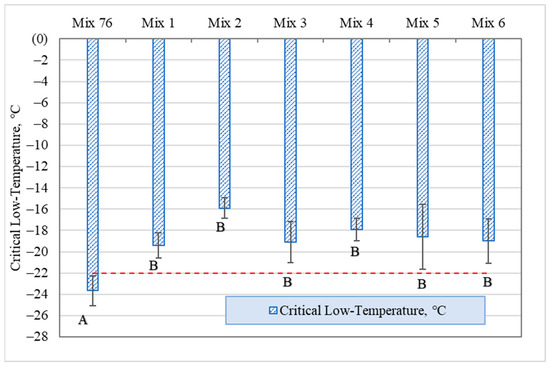
Figure 12.
TSRST test results.
9. Louisiana Balanced Mixture Design (BMD)
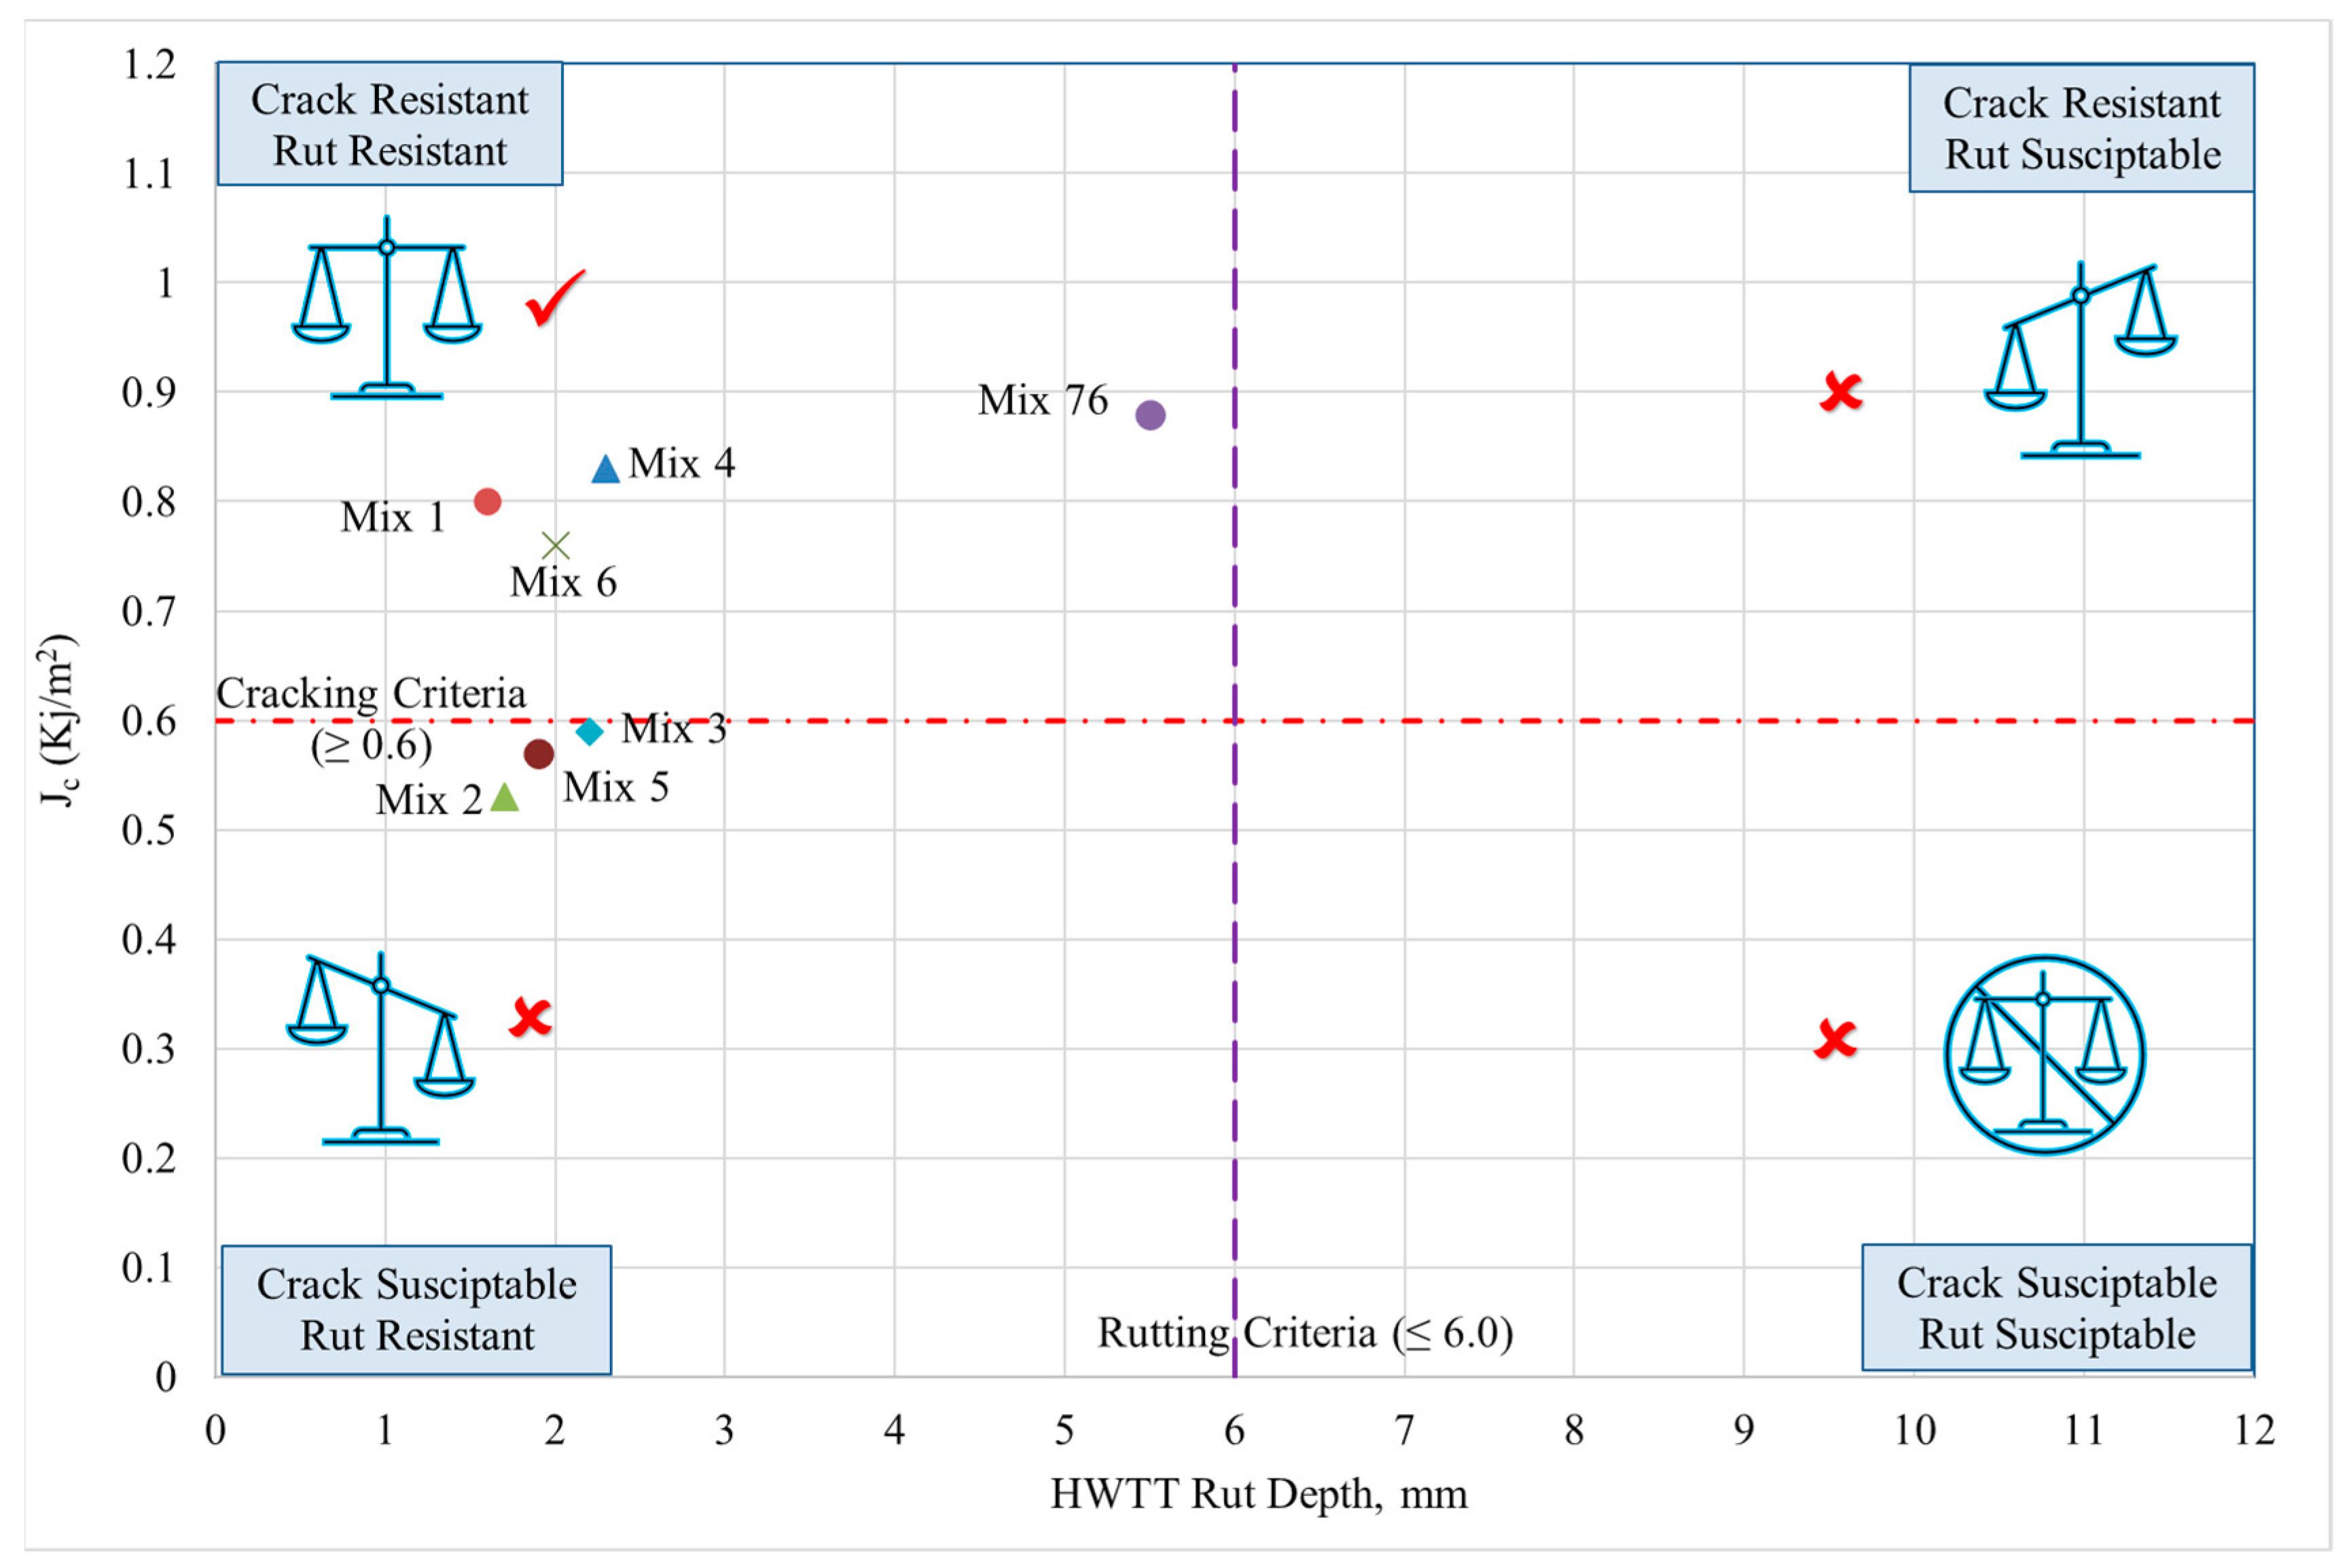
Figure 13 illustrates Louisiana’s BMD framework which employs performance-based criteria to optimize asphalt mixture composition, balancing resistance to cracking and rutting for higher traffic volume than three million ESALs. Level 2 asphalt mixtures, for example, in this study, necessitate a minimum SCB Jc value of 0.6 KJ/m2 to mitigate cracking and a maximum HWT rut depth of 6.0 mm to prevent rutting [18]. The figure’s horizontal dashed line denotes the cracking resistance threshold, while the vertical line indicates the maximum permissible rut depth. The framework is divided into four quadrants representing different performance outcomes. The upper-left quadrant encompasses asphalt mixtures that satisfy both cracking and rutting criteria. Conversely, the top-right and bottom-left quadrants contain mixtures exhibiting deficiencies in either rutting or cracking resistance, respectively. Mixtures in the bottom-right quadrant fail to meet both criteria. As anticipated, the control asphalt mixture, Mix 76, complies with Louisiana’s BMD requirements for Level 2, as depicted in Figure 13. In addition, among the asphalt mixtures containing 50% RAP, Mix 1, Mix 4, and Mix 6 were able to meet both rutting and cracking criteria, which means that RA1 (petroleum oil), RA4 (soy oil and tall oil intermediate industrial), and RA6 (fatty acid-derived tall oil) were effective in enhancing cracking resistance of asphalt mixtures containing 50% RAP mixtures without compromising rutting performance. The remaining asphalt mixtures did not pass the SCB-Jc cracking criteria, Figure 13.
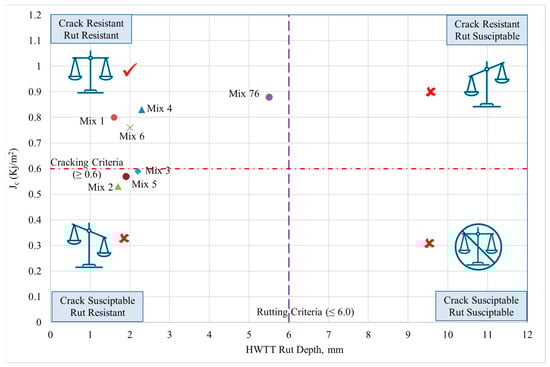
Figure 13.
Louisiana’s balanced mix design framework for asphalt mixtures containing 50% RAP.
10. Environmental Impact Assessment
Environmental assessment in asphalt mixture quantifies the emitted gases from an asphalt mixture that contribute to global warming. In this study, the process-based LCA approach was considered due to having the industrial knowledge of the components of asphalt mixture and the process followed in preparing and mixing them. LCA examines all inputs and outputs over the life cycle of asphalt mixture, from raw material production to the end-of-life stage [39]. Inputs are materials and energy; however, outputs are emissions and waste [40]. LCA of asphalt mixtures consists of three main phases; phase A includes preparing raw materials and producing asphalt mixtures, phase B includes the usage phase of asphalt pavement, and phase C includes the end-of-life stage. Phase A is divided into five sub-phases from A1 to A5. A1 presents materials extraction and upstream production, A2 presents material transportation to a production facility, A3 presents the asphalt mixture production, A4 presents transporting the asphalt mixture to the job site, and A5 presents the placing and compacting. Industry data can be collected for the asphalt mixture components and production. However, agency records are needed for analyzing the use and end-of-life phases. The environmental assessment conducted during the first three sub-phases (A1, A2, and A3) is often called “cradle-to-gate” GWP. However, the environmental assessment until the end-of-life stage is often called “cradle-to-grave” GWP [40].
10.1. System Boundary
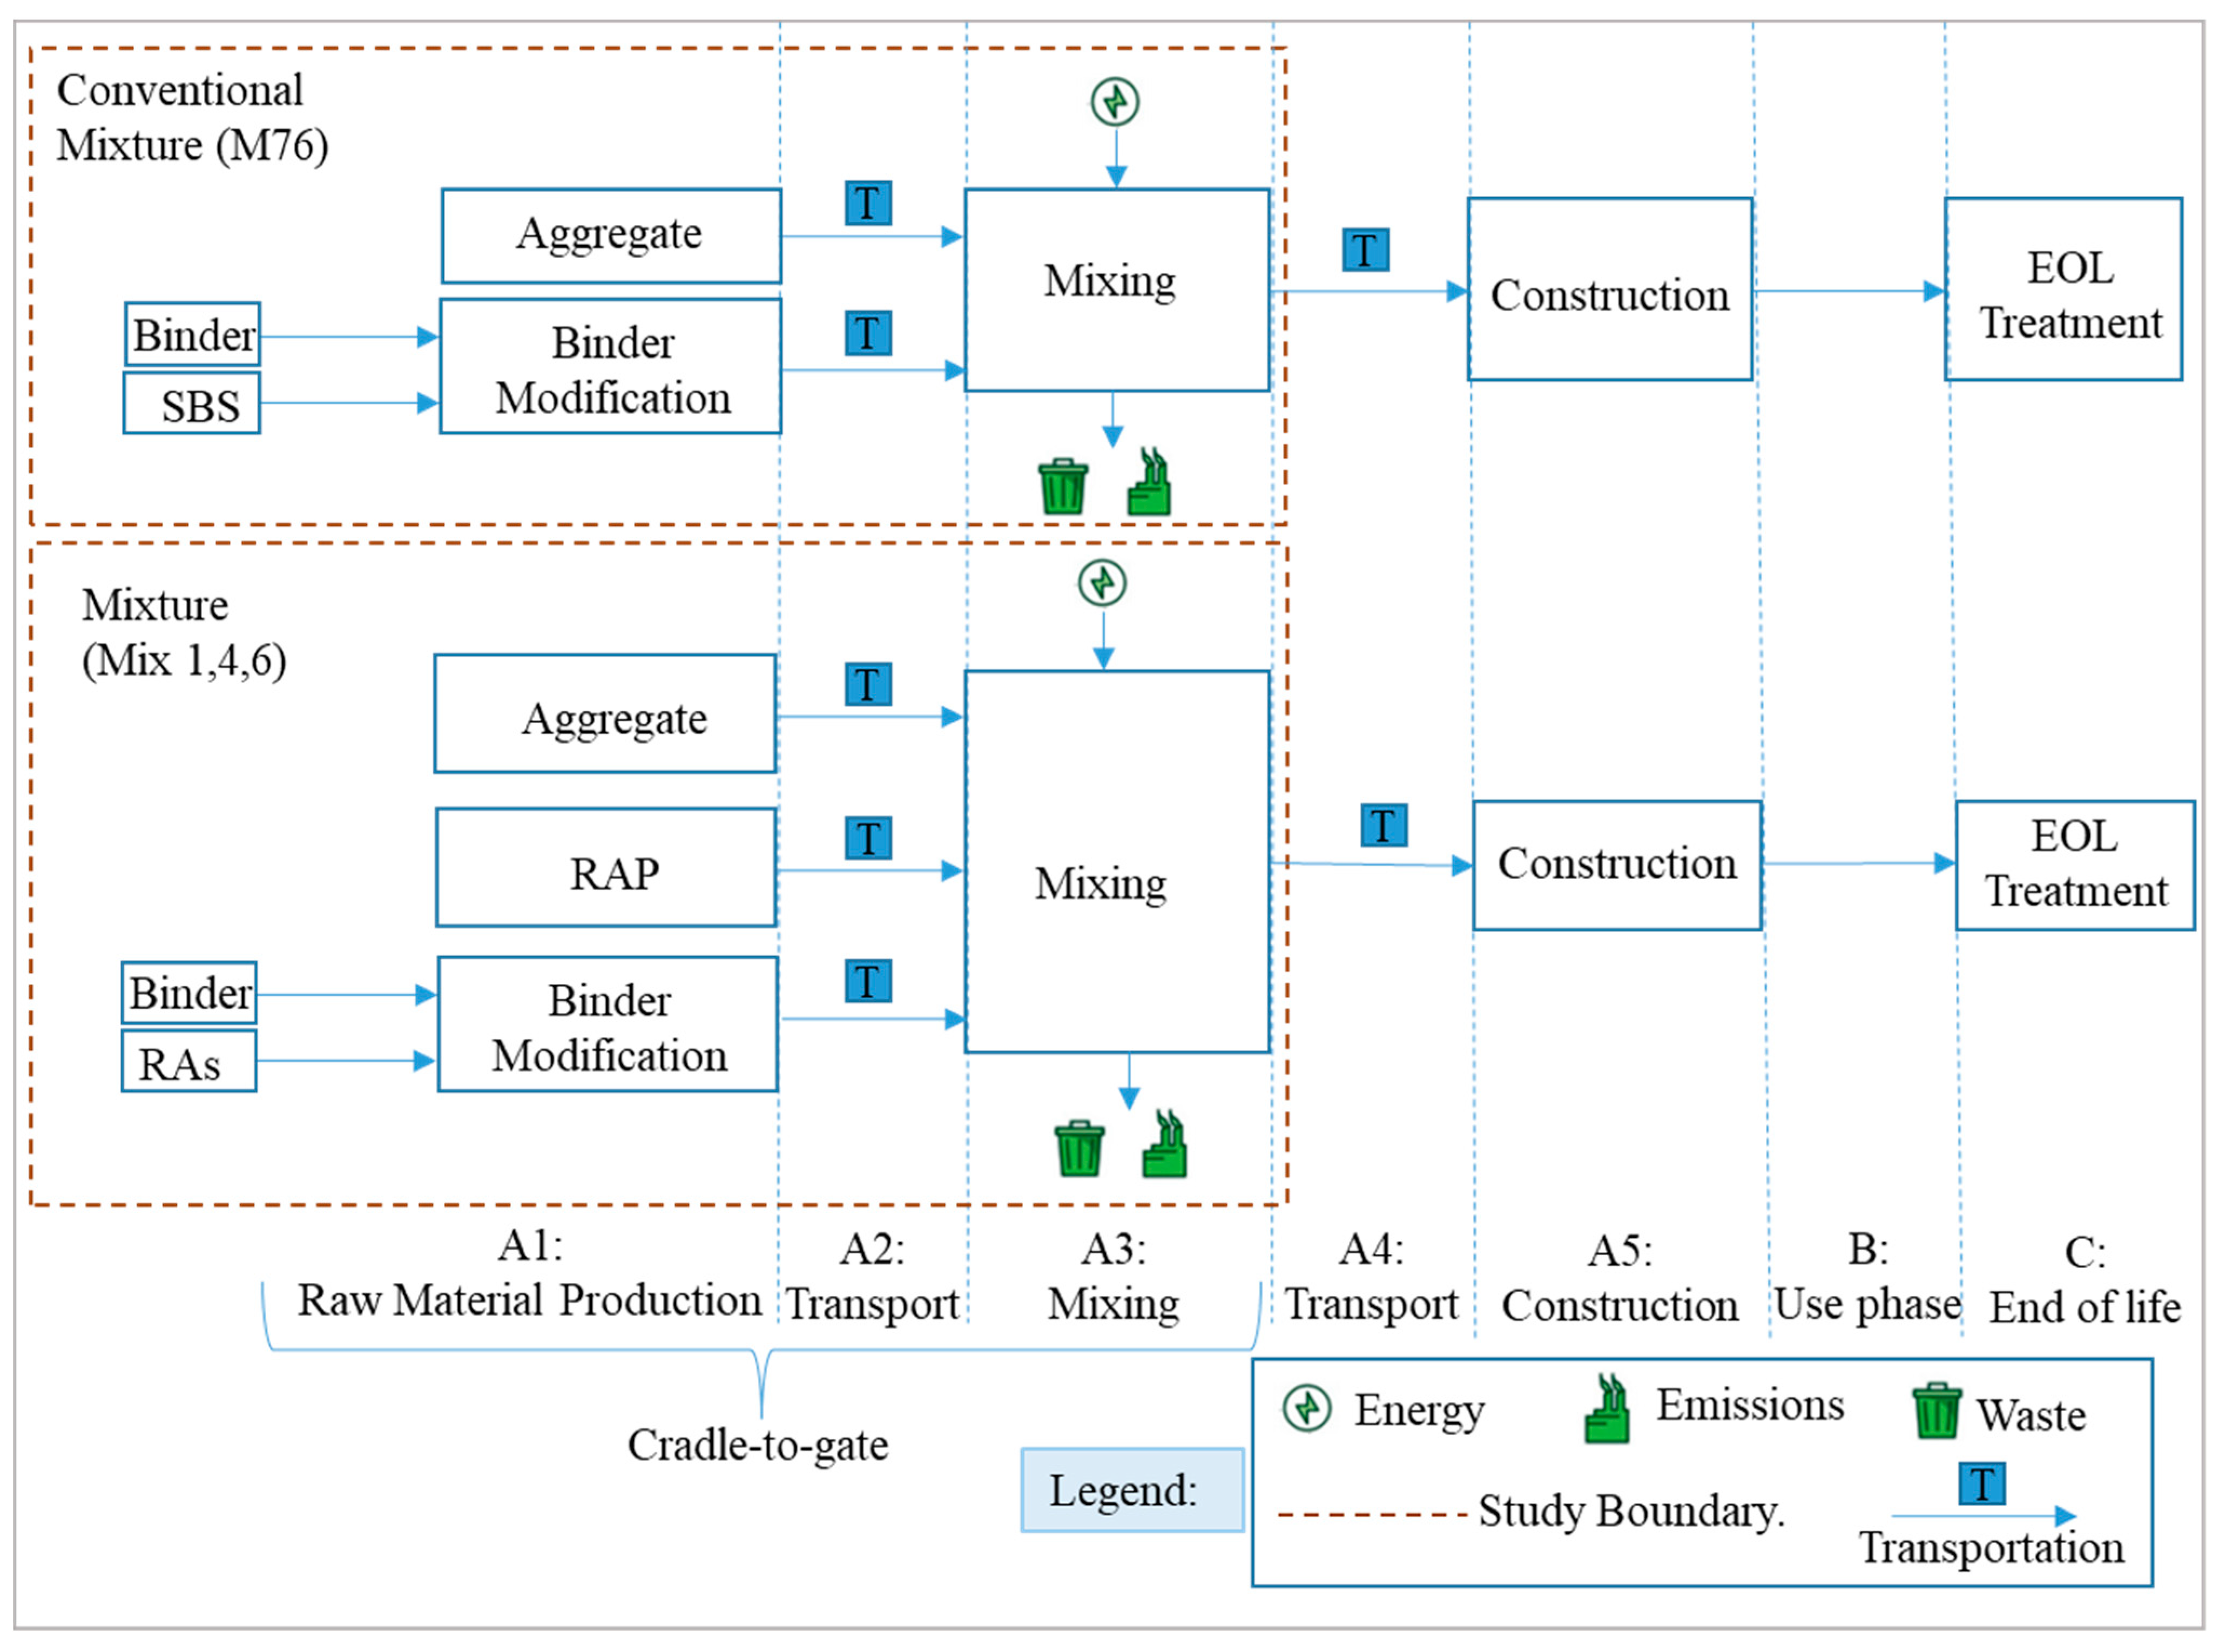
The research investigation was confined to the upstream stages of the life cycle, encompassing cradle-to-gate boundaries (Figure 14). This boundary stemmed from the anticipated uniformity in the construction, utilization, and disposal phases across all asphalt mixtures meeting Louisiana BMD criteria. The system boundary encompassed the extraction and processing of raw materials (A1), transportation (A2), and asphalt mixture production (A3). To guarantee comparable performance characteristics, only the studied asphalt mixtures that passed BMD criteria were further considered for life cycle environmental assessment (Mix 1, Mix 4, and Mix 6). Consequently, only these asphalt mixtures, along with the control asphalt mixture Mix 76, were incorporated into the environmental analysis. The employed declared unit was one short ton (907.18 kg) of asphalt mixture. Subsequent sections present a comparative analysis of mixing processes. While these processes exhibit variations, their energy consumption is anticipated to remain relatively constant. This stability is attributed to the burner’s predominant energy consumption within the asphalt mixture manufacturing plant [41].
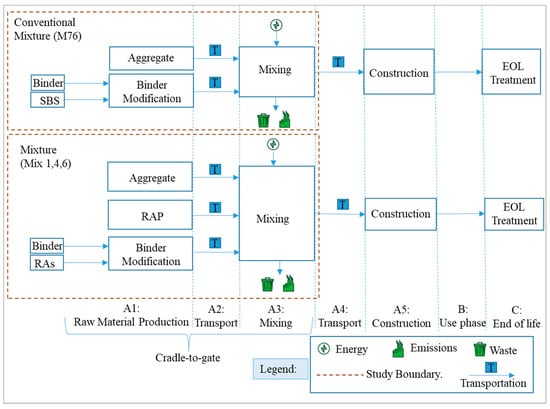
Figure 14.
Environmental assessment system boundary.
10.2. Data Inventory
Publicly available background datasets from the ACLCA Open Standard and the Federal Highway Administration’s LCA Pave tool were incorporated into the data inventory to evaluate potential environmental impacts [42,43]. These datasets contributed to increased transparency and verifiability, thereby supporting green public procurement while also advancing LCA harmonization and enabling result reuse [42,43,44]. In the absence of an industry-standard life cycle inventory for aggregates, publicly accessible EPDs from LCA Pave were utilized to quantify cradle-to-gate environmental impacts of aggregate production. Transportation distances were calculated based on the geographic locations of material suppliers and asphalt mixing plants, with process modeling conducted using the US LCI database [45]. The RA 1 (petroleum oil) production emissions are estimated to emit over 1.2 kg CO2eq per kg of oil [46], and a 2 kg CO2eq per kg was assumed. Soy oil processing and production consumed 7.43 Mega-joules per kg [47], equivalent to 2.06 kWh [48], which can emit 0.89 kg CO2eq [49]. Tall oil is considered a vegetable oil which consumes 487.04 MJ/ton [50], 0.49 MJ/kg, which is 0.1 kg CO2eq [49].
Asphalt mixing processes utilizing both electrical and combustion energy sources were simulated using data derived from the NAPA Life Cycle Assessment. This assessment assumes a natural gas-fired power plant operating at a burner energy efficiency of 2.68 therms per short ton [41]. Due to the absence of comprehensive environmental life cycle inventory data for RAs production, quantification of additional TRACI environmental impact categories, including acidification, eutrophication, ozone depletion, smog formation, human health impacts, and ecotoxicity, was not feasible. TRACI is a tool for reduction and assessment of chemicals and other environmental impacts. Consequently, evaluating potential trade-offs among these categories was not feasible. A detailed examination of input data is presented in Table 6, and data quality was assessed according to the ACLCA Open Standard Addendum on Data Quality of Background Life Cycle Inventory (LCI) Datasets [51] (Table 7).
Table 6.
Life Cycle Inventory Data Source and Material Transportation Distances.
Table 7.
LCA inventory data quality for asphalt mixtures’ component materials.
10.3. LCA Pave
The LCA Pave tool incorporates the TRACI 2.1 methodology to quantify mid-point environmental indicators. TRACI 2.1, a Life Cycle Impact Assessment (LCIA) framework, developed by the U.S. Environmental Protection Agency (EPA) and recognized by the International Organization for Standardization (ISO), provides a standardized approach for assessing environmental impacts [44,52]. Given the asphalt industry’s target of net zero carbon emissions and the policy directives of the Inflation Reduction Act, the analysis prioritized material options with the potential to significantly reduce Global Warming Potential (GWP) [53,54]. Data quality assessments for aggregates and asphalt binders were conducted using a five-point scale within the FHWA LCA Pave software version 1.01 (Table 7). A rating of 1 indicates the highest data quality, while 5 represents the lowest. The evaluation criteria encompassed reliability, data collection methods, temporal coverage, geographic scope, data acquisition technology, process review, and process comprehensiveness.
10.4. Global Warming Potential Emissions
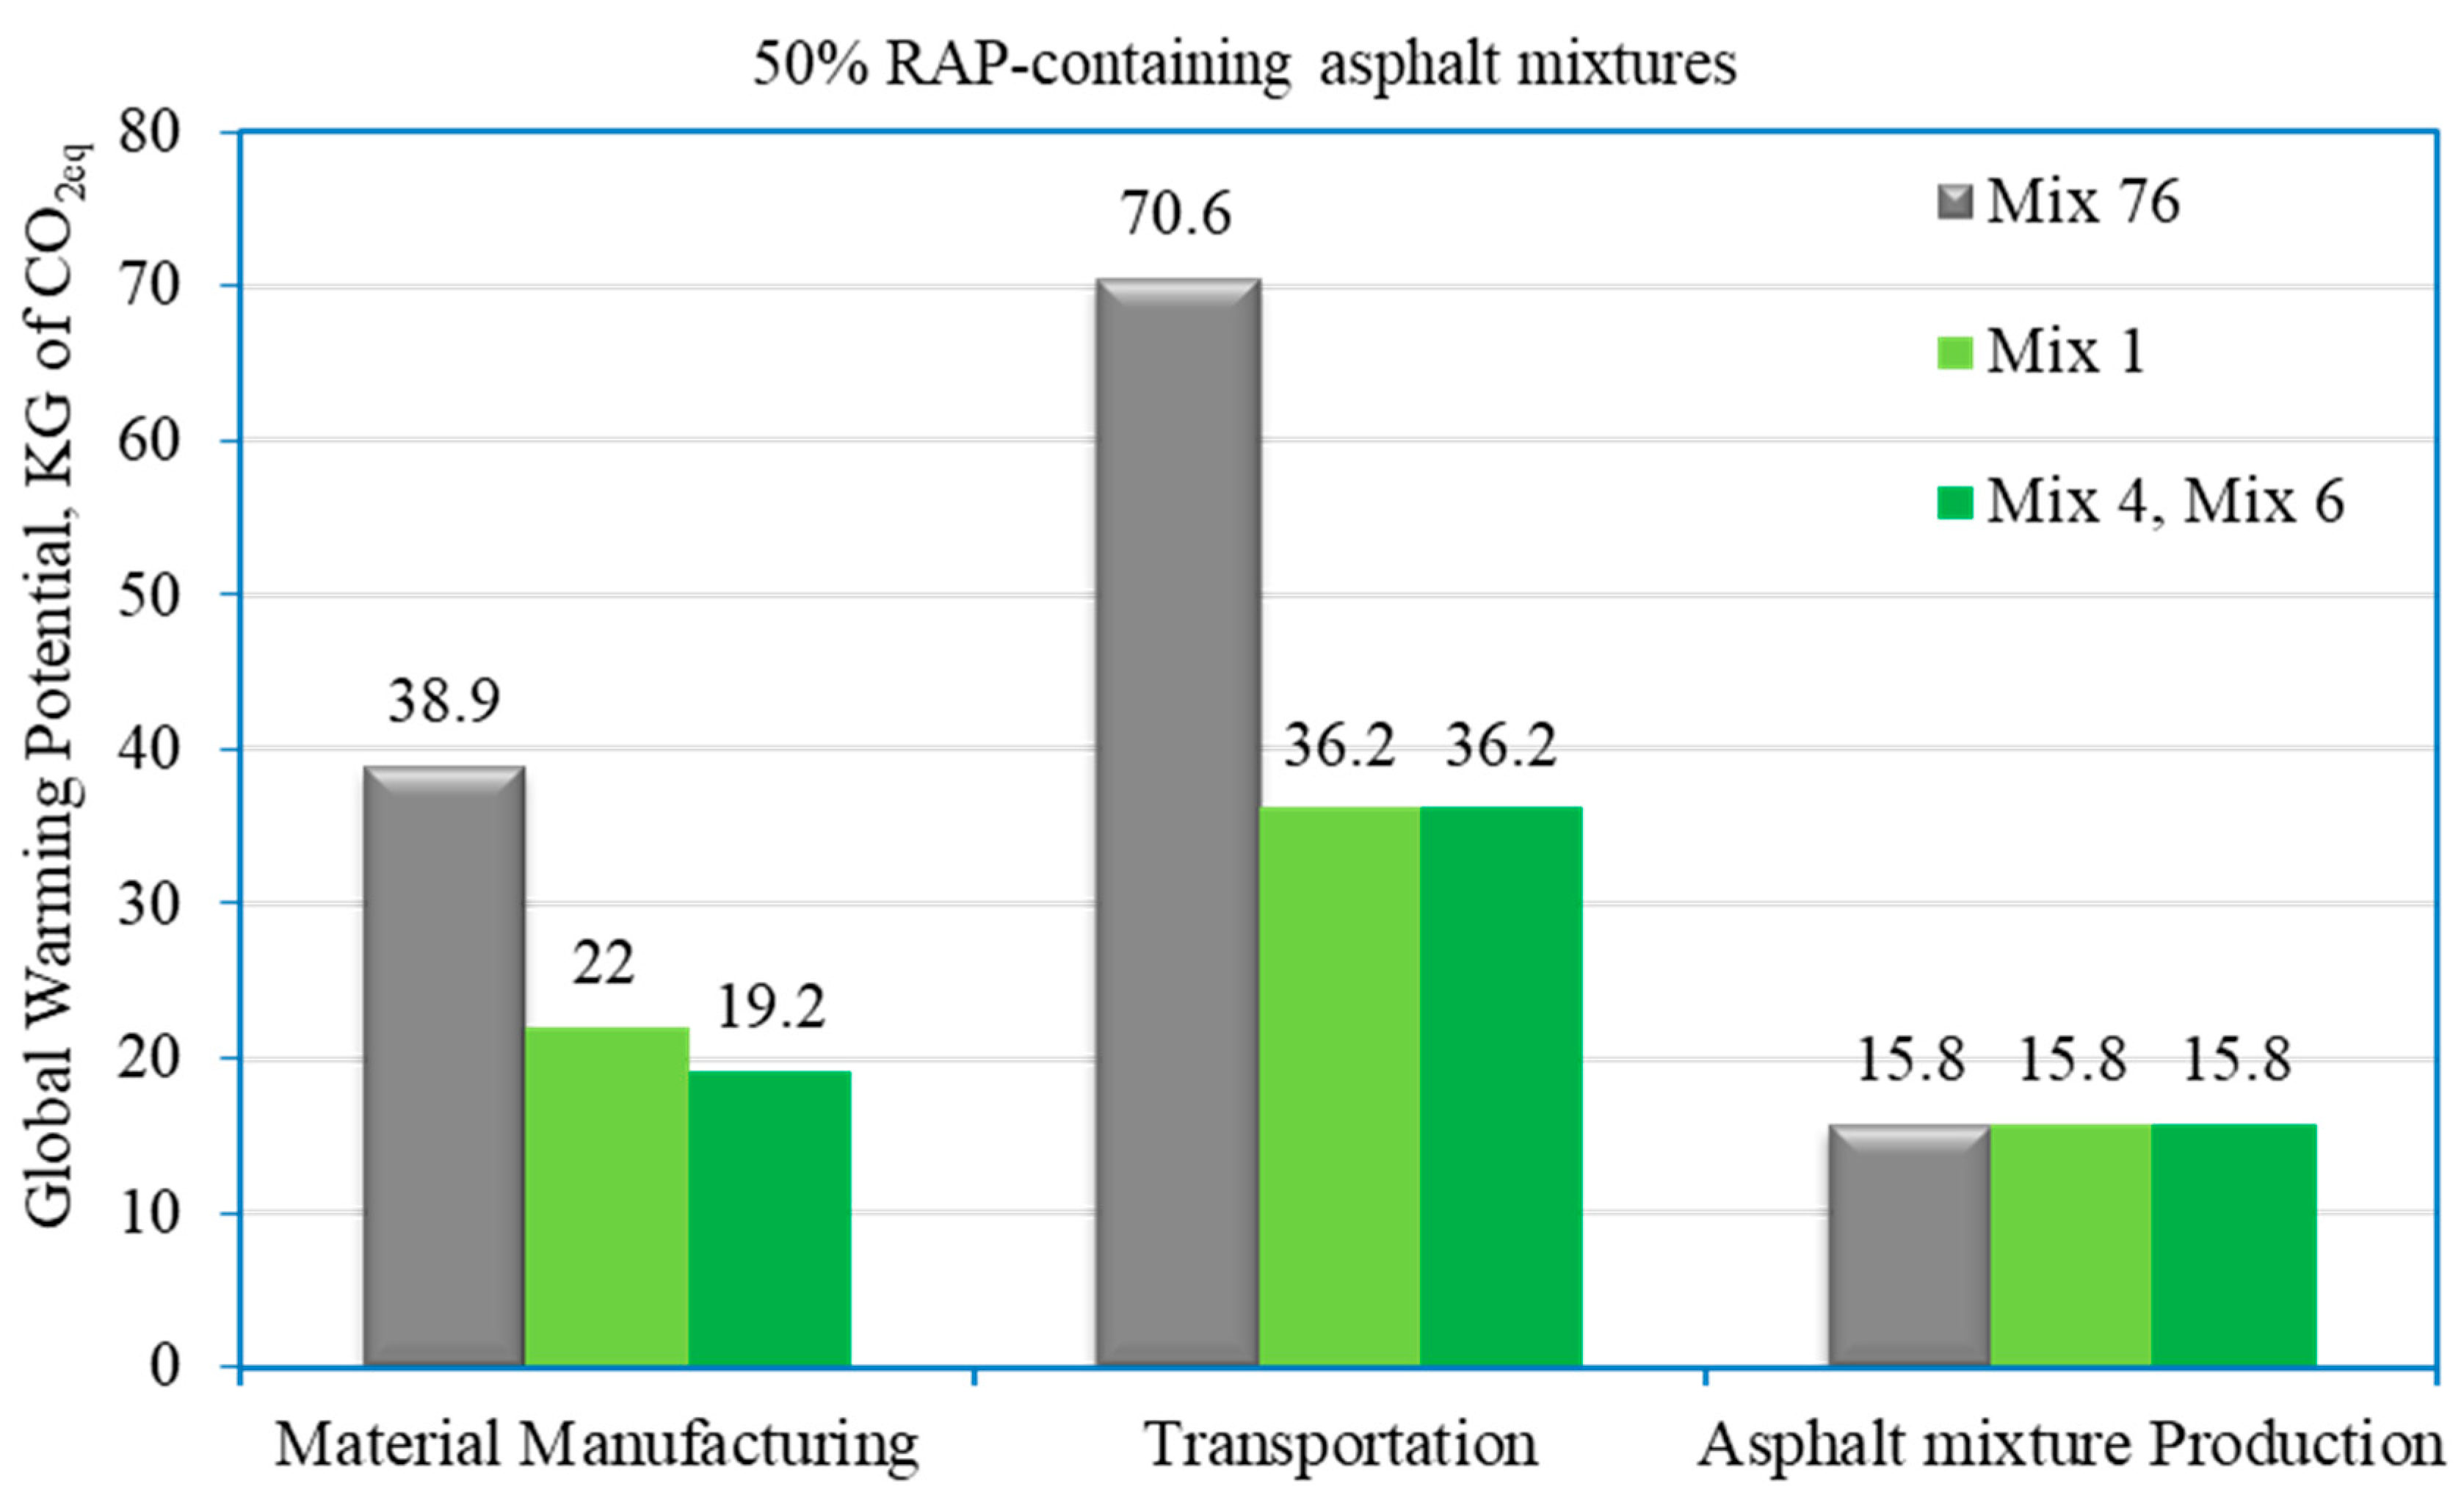
Figure 15 illustrates the GWP contribution percentages for A1, A2, and A3 of the evaluated asphalt mixture. Transportation emerges as the predominant factor, contributing 70.6 Kg CO2eq in the control Mix 76 and 36.2 Kg CO2eq in the asphalt mixtures containing 50% RAP, primarily due to the reduced need to transport asphalt binder and aggregates when incorporating RAP. It is worth mentioning that Louisiana imports aggregates from Kentucky, which increases GWP emissions of A2 to exceed national benchmark. The production of asphalt binders is the second most significant contributor. This difference is attributed to the use of PG 76-22-modified asphalt binder in the control asphalt mixture, whereas approximately half the quantity of virgin-unmodified asphalt binder is used in the asphalt mixtures containing 50% RAP. Production of the asphalt mixture is the third largest contributor, accounting for 15.8 Kg CO2eq of the cradle-to-gate GWP. Aggregate production constitutes a minor portion of overall cradle-to-gate GWP, contributing up to 2%. Incorporating RAP processing minimally affects the GWP. The GWP contribution of RAs varies significantly. Petroleum-based RA 1 exhibits the highest impact, at 3.1 kg CO2eq, while bio-derived RAs contribute as little as 0.3 kg CO2eq.

Figure 15.
Cradle-to-gate GWP percent distribution.
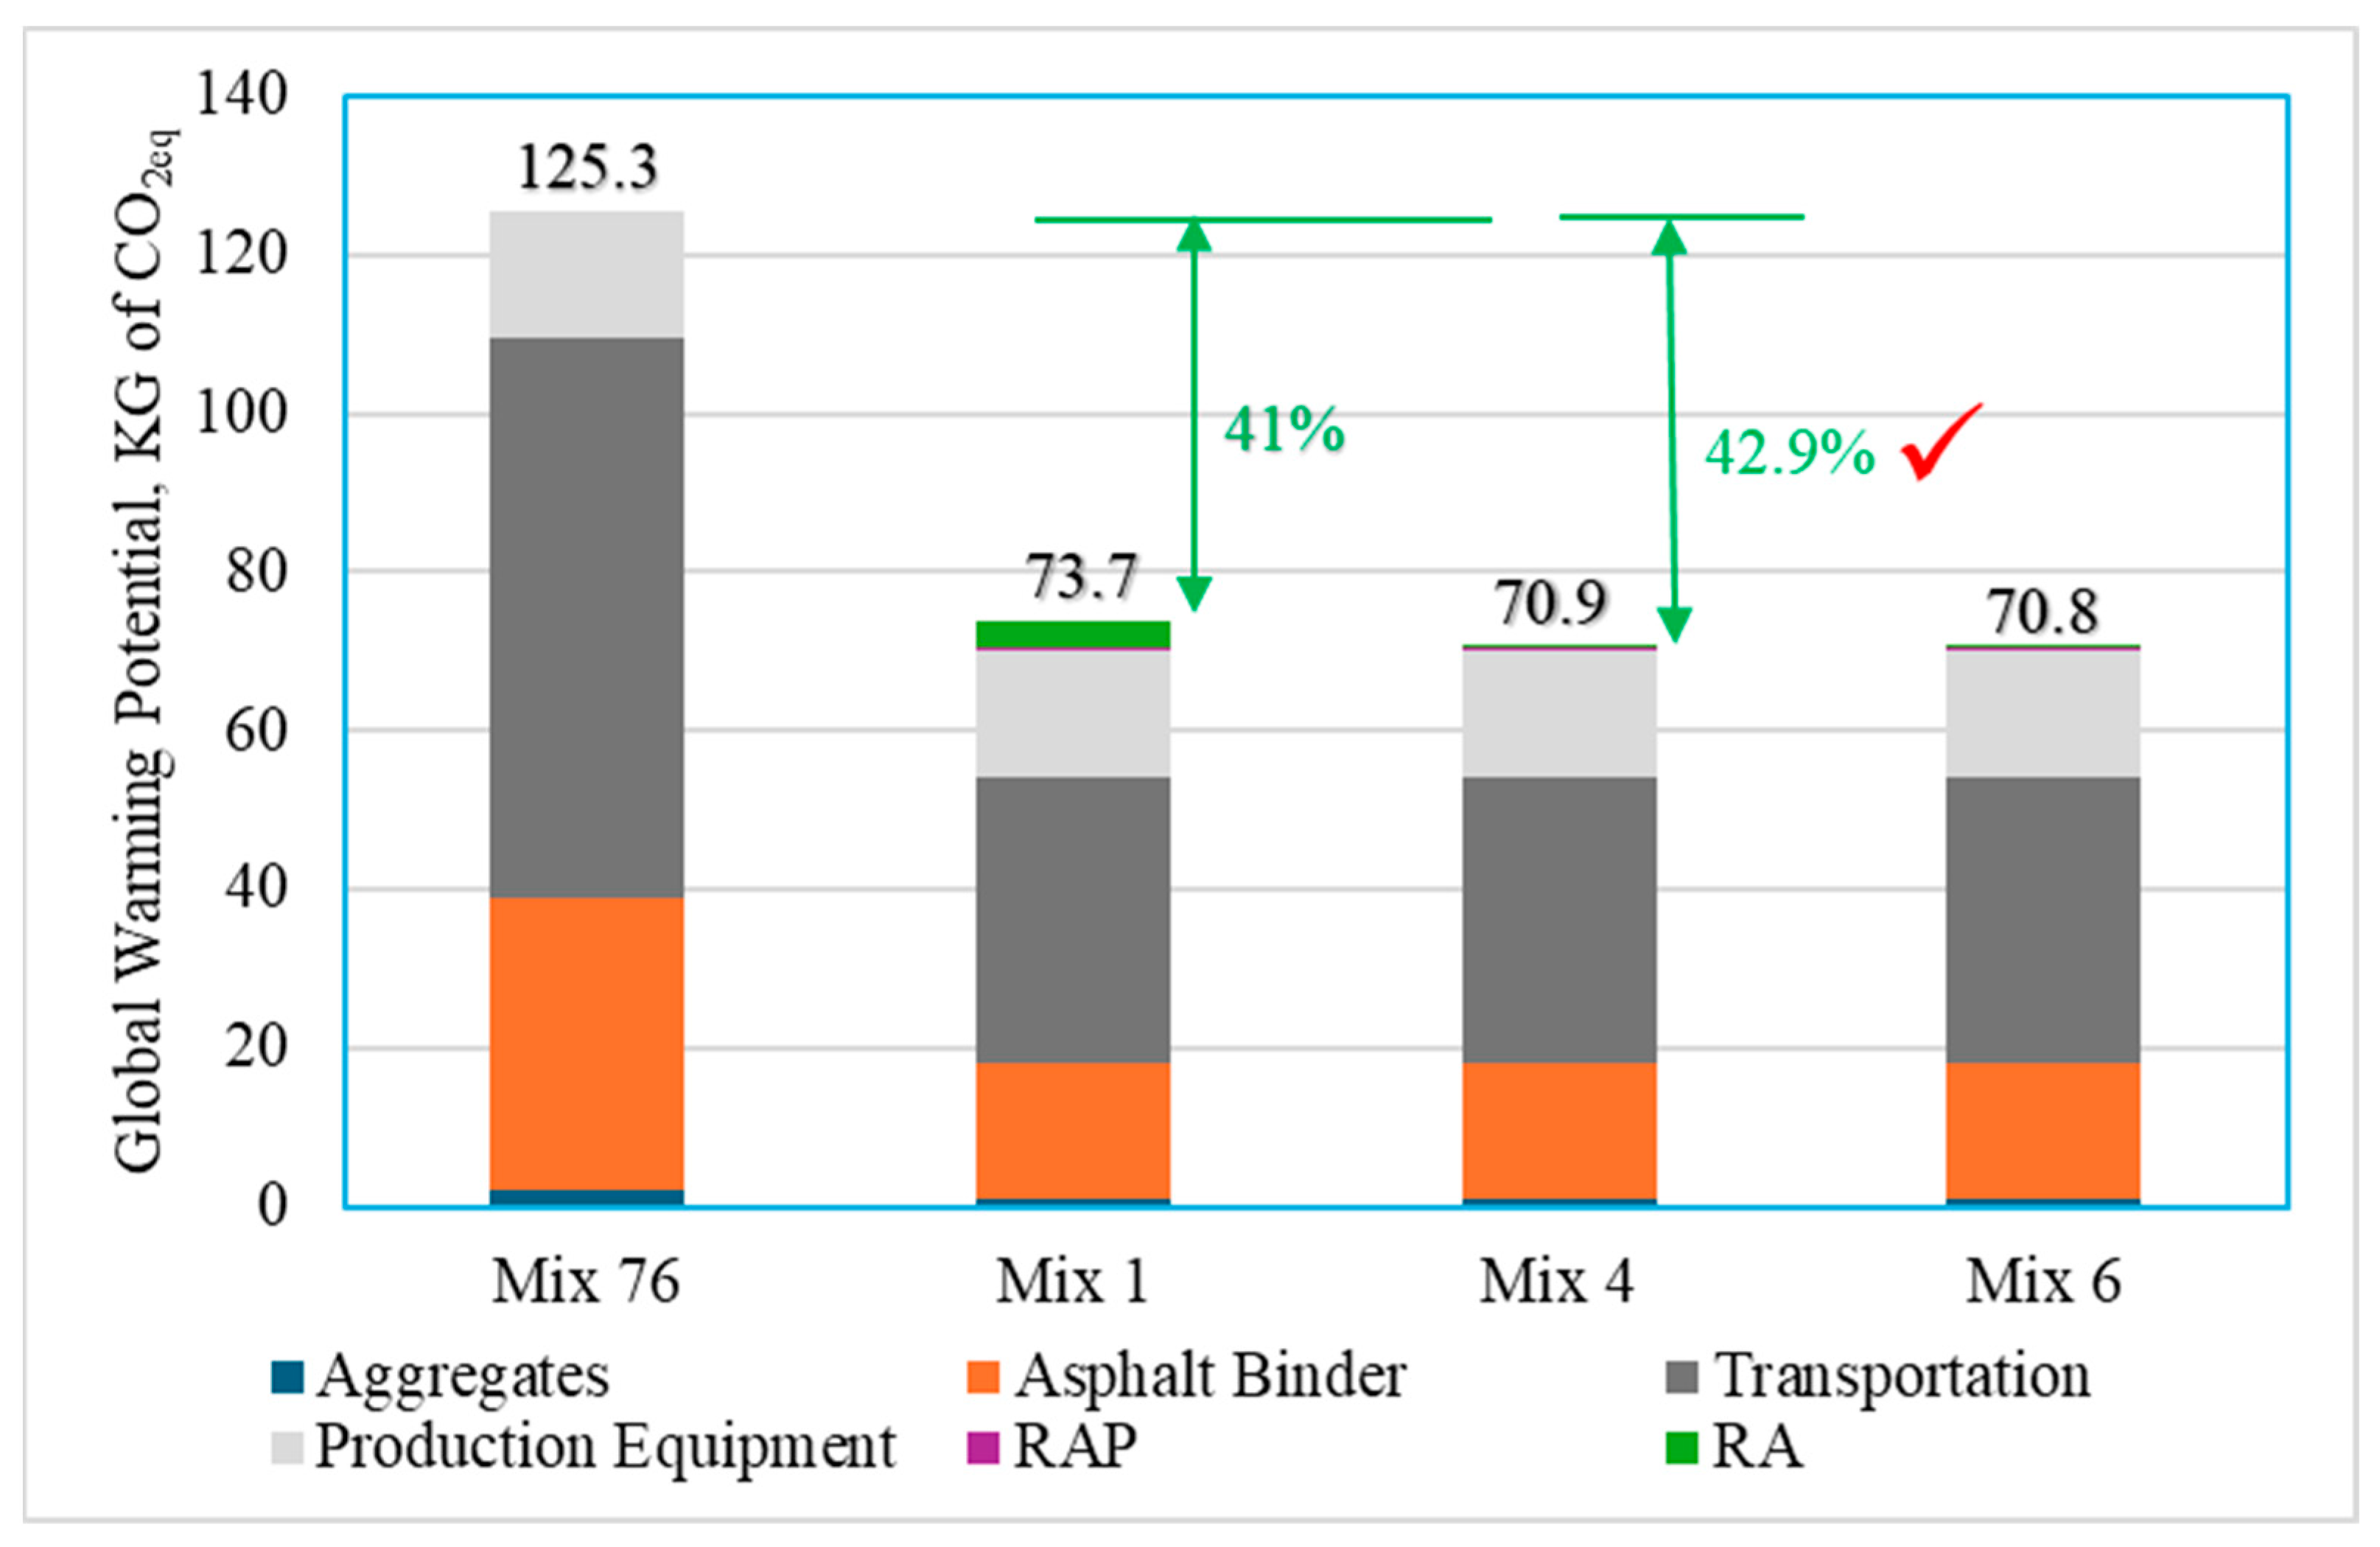
Figure 16 illustrates the GWP for studied asphalt mixtures. Mix 76 has the highest GWP with 125.3 kg CO2eq, while Mix 1 (asphalt mixture containing petroleum oil RA) has a GWP of 76.6 kg CO2eq and Mix 4 and Mix 6 (asphalt mixtures containing bio-oil RAs) have a GWP of 71 kg CO2eq. Figure 16 also presents the reduction in CO2eq when RAs were included in asphalt mixtures. Compared to conventional asphalt mixtures used by DOTD (Mix 76), asphalt mixtures containing 50% RAP emitted less GWP by 41% and 42.9% using petroleum and bio-oil RAs, respectively.
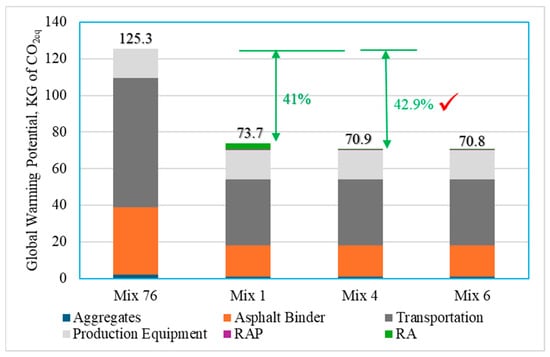
Figure 16.
GWP for the cradle-to-gate unit processes.
11. Cost Analysis
The material costs for asphalt mixtures were estimated. The following estimates for component materials were obtained as per average materials’ prices used locally in Louisiana [55]:
- Cost of asphalt binder PG 76-22: USD 738/ton
- Cost of asphalt binder PG 67-22: USD 612/ton
- Cost of virgin aggregates: USD 45/ton
- Cost of RAP materials: USD 35/ton
- Cost of petroleum aromatic oil: USD 0.55/Ib. or USD 1210/ton.
- Cost of soy oil: USD 0.025/Ib. or USD 55.1/ton.
- Cost of tall oil (by-product phytosterol): USD 0.015/Ib. or USD 33.1/ton.
- Cost of tall oil (intermediate industrial phytosterol): USD 4/Ib. or USD 8820/ton
- Cost of tall oil (purified phytosterol): USD 15/Ib. or USD 33,070/ton
- Cost of tall oil (fatty acid-based oil): USD 2/Ib. or USD 4410/ton
Using these prices, the material cost for one ton of studied asphalt mixtures was calculated as shown in Table 8. It is worth noting that using 50% RAP significantly decreased the asphalt mixture cost by 31%. Cost analysis revealed that RA1, RA2, RA3, and RA6 are not significantly increasing asphalt mixture costs; however, RA4 and RA5 are significantly expensive as purified phytosterol is an expensive material.
Table 8.
Material cost analysis for studied asphalt mixtures.
12. Conclusions
The effectiveness of various recycling agents (RAs) in enhancing the cracking resistance of asphalt mixtures containing high-RAP content was evaluated. RAs employed in this study included petroleum aromatic extract oil, soy oil, and tall oil derivatives (industrial by-product phytosterol, intermediate industrial phytosterol, purified phytosterol, and fatty acid-derivatives). The performance of asphalt mixtures containing 50% RAP and the six RAs was compared to a conventional asphalt mixture that contained asphalt binder PG 76-22 (SBS polymer-modified) and no recycled materials or RAs. A suite of mechanical tests was conducted to evaluate permanent deformation using HWTT, intermediate-cracking resistance using SCB, I-FIT, and IDEAL-CT, and low-temperature cracking resistance using the TSRST test. In addition, environmental impact assessment and reduction in global warming potential (represented by CO2 emissions) were conducted for the asphalt mixtures considered. Based on the evaluation of test results and subsequent analysis, the following conclusions were reached:
- Rutting: The use of RAs did not compromise asphalt mixture resistance to rutting, as all asphalt mixtures studied were able to achieve the DOTD rutting 6.0 mm maximum criteria. The control mixture containing asphalt binder PG 76-22 without RAP or RAs exhibited lower rutting resistance than asphalt mixtures containing 50% RAP.
- Intermediate-temperature cracking: Mix 1, Mix 4, and Mix 6 containing RA 1, RA 4, and RA 6 passed the cracking criteria set by Louisiana DOTD (SCB-Jc ≥ 0.6 KJ/m2). Other asphalt mixtures containing RA 2, RA 3, and RA 5 failed to meet the DOTD cracking criteria. Thus, asphalt mixtures containing recycling agents RA1 (petroleum oil), RA4 (soy oil mixed with industrial intermediate phytosterol tall oil), and RA6 (fatty acid tall oil) enhanced the cracking resistance of 50% RAP-containing asphalt mixtures as proven by the SCB-Jc parameter. The SCB-Jc parameter was able to capture the recycling agents R1, R4, and R6 effectiveness in restoring RAP binder in 50% RAP-containing asphalt mixtures; whereas, FI and CT parameters lacked this capability.
- Low-temperature cracking: The critical low temperature for control mixture Mix 76 was cooler than −22 °C. Asphalt mixtures incorporating 50% RAP and RAs exhibited critical low temperatures warmer than −22 °C. Statistical analysis indicated no significant differences in critical low-temperature performance among 50% RAP-containing asphalt mixtures.
- Environmental assessment: Transportation emerged as the primary source of GHG emissions for the asphalt mixtures investigated, primarily attributed to the out-of-state importation of aggregates. Asphalt binder contributed to emissions to a lesser extent. Asphalt mixtures incorporating 50% RAP exhibited a 41% and 42.9% reduction in GHG emissions compared to the control mixture Mix 76, when utilizing petroleum-based and bio-oil RAs, respectively.
- A construction materials cost analysis revealed a 31% reduction when 50% RAP was incorporated into the asphalt mixture compared to the conventional asphalt mixture. Petroleum aromatic oil, soy oil, tall oil (industrial by-product), and tall oil fatty acid-based oils are considered cost effective; however, tall oils containing purified or intermediate phytosterol are expensive.
For future studies, it is recommended to evaluate the engineering performance of the studied recycling agents in field conditions. Additionally, a cradle-to-grave life cycle assessment should be conducted to assess the environmental impact and greenhouse gas (GHG) emissions associated with these asphalt mixtures. Finally, a comprehensive cost analysis over the lifespan of the asphalt pavement could provide valuable economic insights to guide material selection.
Author Contributions
The authors confirm their contribution to the paper as follows: study conception and design: I.E. and L.N.M.; data collection and analysis: I.E., G.B., L.N.M. and S.C.J.; results’ interpretation: I.E., L.N.M. and S.C.III; draft manuscript preparation: I.E., L.N.M. and S.C.III. All authors have read and agreed to the published version of the manuscript.
Funding
This research was funded by Louisiana DOTD project 21-3B and FHWA Climate Challenge Sustainability Program.
Data Availability Statement
The data presented in this study are available on request from the corresponding author.
Acknowledgments
This study was a part of Louisiana DOTD project 21-3B titled New Generation of Recycling Agents for Durable and Sustainable Flexible Pavements Program. The authors would like to express their gratitude to the Louisiana Transportation Research Center for their support.
Conflicts of Interest
Author Gaylon Baumgardner was employed by the company Paragon Technical Services. The remaining authors declare that the research was conducted in the absence of any commercial or financial relationships that could be construed as a potential conflict of interest.
References
- West, R.C.; Willis, J.R.; Marasteanu, M.O. Improved Mix Design, Evaluation, and Materials Management Practices for Hot Mix Asphalt with High Reclaimed Asphalt Pavement Content; Transportation Research Board: Washington, DC, USA, 2013; Volume 752. [Google Scholar]
- Tarsi, G.; Piergiorgio, T.; Cesare, S. The challenges of using reclaimed asphalt pavement for new asphalt mixtures: A review. Materials 2020, 13, 4052. [Google Scholar] [CrossRef] [PubMed]
- Mariyappan, R.; Palammal, J.; Balu, S. Sustainable use of reclaimed asphalt pavement (RAP) in pavement applications—A review. Environ. Sci. Pollut. Res. 2023, 30, 45587–45606. [Google Scholar] [CrossRef] [PubMed]
- Prosperi, E.; Bocci, E. A review on bitumen aging and rejuvenation chemistry: Processes, materials and analyses. Sustainability 2021, 13, 6523. [Google Scholar] [CrossRef]
- Zaumanis, M.; Mallick, R.B.; Poulikakos, L.; Frank, R. Influence of six rejuvenators on the performance properties of Reclaimed Asphalt Pavement (RAP) binder and 100% recycled asphalt mixtures. Constr. Build. Mater. 2014, 71, 538–550. [Google Scholar] [CrossRef]
- Elnaml, I.; Liu, J.; Mohammad, L.N.; Cooper, S.B., III; Cooper, S.B., Jr. Use of the Iron Chloride Type of Lewis Acid Catalyst in High Reclaimed Asphalt Pavement Content Asphalt Mixtures. Transp. Res. Rec. 2023, 2678, 430–440. [Google Scholar] [CrossRef]
- Cooper, S.B., III; Mohammad, L.N.; Kabir, S.; King, W., Jr. Balanced asphalt mixture design through specification modification: Louisiana’s experience. Transp. Res. Rec. 2014, 2447, 92–100. [Google Scholar] [CrossRef]
- Mohammad, L.N.; Cooper, S.B., Jr.; Kim, M. Sustainable Materials for Pavement Infrastructure: Design and Performance of Asphalt Mixtures Containing Recycled Asphalt Shingles; Report No: FHWA/LA.17/594; Louisiana State University Transportation Research Center: Baton Rouge, LA, USA, 2019. [Google Scholar]
- Elnaml, I.; Mohammad, L.N.; Baumgardner, G.L.; Liu, J.; Cooper, S., III; Cooper, S., Jr. Influence of Petroleum-Based and Bio-Derived Recycling Agents on High-RAP Asphalt Mixtures Performance. Buildings 2024, 14, 567. [Google Scholar] [CrossRef]
- Dony, A.; Colin, J.; Bruneau, D.; Drouadaine, I.; Navaro, J. Reclaimed asphalt concretes with high recycling rates: Changes in reclaimed binder properties according to rejuvenating agent. Constr. Build. Mater. 2013, 41, 175–181. [Google Scholar] [CrossRef]
- Lei, Z.; Bahia, H.; Yi-Qiu, T.; Ling, C. Effects of refined waste and bio-based oil modifiers on rheological properties of asphalt binders. Constr. Build. Mater. 2017, 148, 504–511. [Google Scholar] [CrossRef]
- Qiu, Y.; Ding, H.; Rahman, A.; Wang, W. Damage characteristics of waste engine oil bottom rejuvenated asphalt binder in the non-linear range and its microstructure. Constr. Build. Mater. 2018, 174, 202–209. [Google Scholar] [CrossRef]
- Mogawer, W.S.; Austerman, A.; Roque, R.; Underwood, S.; Mohammad, L.; Zou, J. Ageing and rejuvenators: Evaluating their impact on high RAP mixtures fatigue cracking characteristics using advanced mechanistic models and testing methods. Road Mater. Pavement Des. 2015, 16, 1–28. [Google Scholar] [CrossRef]
- Cao, X.; Wang, H.; Cao, X.; Sun, W.; Zhu, H.; Tang, B. Investigation of rheological and chemical properties asphalt binder rejuvenated with waste vegetable oil. Constr. Build. Mater. 2018, 180, 455–463. [Google Scholar] [CrossRef]
- Elkashef, M.; Podolsky, J.; Williams, R.C.; Cochran, E.W. Cochran. Introducing a soybean oil-derived material as a potential rejuvenator of asphalt through rheology, mix characterisation and Fourier Transform Infrared analysis. Road Mater. Pavement Des. 2018, 19, 1750–1770. [Google Scholar] [CrossRef]
- Elkashef, M.; Williams, C. Improving fatigue and low temperature performance of 100% RAP mixtures using a soybean-derived rejuvenator. Constr. Build. Mater. 2017, 151, 345–352. [Google Scholar] [CrossRef]
- Zaumanis, M.; Mallick, R.B.; Frank, R. Evaluation of rejuvenator’s effectiveness with conventional mix testing for 100% reclaimed Asphalt pavement mixtures. Transp. Res. Rec. 2013, 2370, 17–25. [Google Scholar] [CrossRef]
- Louisiana Department of Transportation and Development. Louisiana Standard Specifications for Roads and Bridges; Louisiana Department of Transportation and Development: Baton Rouge, LA, USA, 2018. [Google Scholar]
- ASTM D8159; Standard Test Method for Automated Extraction of Asphalt Binder from Asphalt Mixtures. American Society for Testing and Materials International: West Conshohocken, PA, USA, 2019.
- AASHTO R 59; Standard Practice for Recovery of Asphalt Binder from Solution by Abson Method. American Association of State Highways and Transportation Officials Designation: Washington, DC, USA, 2011.
- McDaniel, R.S.; Soleymani, H.; Anderson, M.; Turner, P.; Peterson, R. Recommended Use of Reclaimed Asphalt Pavement in the Superpave Mix Design Method; NCHRP Web Document 30; National Cooperative Highway Research Program: Washington, DC, USA, 2000. [Google Scholar]
- AASHTO M 320; Standard Specification for Performance-Graded Asphalt Binder. American Association of State Highways and Transportation Officials Designation: Washington, DC, USA, 2023.
- AASHTO R 35; Standard Practice for Superpave Volumetric Design for Hot Mix Asphalt (HMA). American Association of State Highways and Transportation Officials Designation: Washington, DC, USA, 2009.
- Mohammad, L.N.; Cooper, S.B., Jr.; Elseifi, M.A. Characterization of HMA mixtures containing high reclaimed asphalt pavement content with crumb rubber additives. J. Mater. Civ. Eng. 2011, 23, 1560–1568. [Google Scholar] [CrossRef]
- AASHTO R 30; Standard Practice for Laboratory Conditioning of Asphalt Mixtures. American Association of State Highways and Transportation Officials Designation: Washington, DC, USA, 2009.
- AASHTO T 324; Standard Method of Test for Hamburg Wheel Track Testing of Compacted Hot Mix Asphalt (HMA). American Association of State Highways and Transportation Officials Designation: Washington, DC, USA, 2008.
- ASTM D8044; Standard Test Method for Evaluation of Asphalt Mixture Cracking Resistance using the Semi-Circular Bend Test (SCB) at Intermediate Temperatures. American Society for Testing and Materials International: West Conshohocken, PA, USA, 2016.
- ASTM D8225; Standard Test Method for Determination of Cracking Tolerance Index of Asphalt Mixture Using the Indirect Tensile Cracking Test at Intermediate Temperature. American Society for Testing and Materials International: West Conshohocken, PA, USA, 2019.
- AASHTO T 393; Standard Method of Test for Determining the Fracture Potential of Asphalt Mixtures Using the Illinois Flexibility Index Test (I-FIT). American Association of State Highways and Transportation Officials: Washington, DC, USA, 2022.
- AASHTO TP 10; Standard Test Method for Thermal Stress Restrained Specimen Tensile Strength (TSRST). American Association of State Highways and Transportation Officials Designation: Washington, DC, USA, 1993.
- SAS. Base SAS 9.4 Procedures Guide: Statistical Procedures; SAS Institute Inc.: Cary, NC, USA, 2013. [Google Scholar]
- Illinois Center for Transportation. Illinois Flexibility Index Test (I-FIT). Available online: https://ict.illinois.edu/research/tools/ifit-software (accessed on 15 July 2024).
- Al-Qadi, I.L.; Ozer, H.; Lambros, J. Development of the Illinois flexibility index test. Asph. Mix. 2019, 31, 01722468. [Google Scholar]
- Illinois Department of Transportation. Standard Specifications for Road and Bridge Construction; Illinois Department of Transportation: Springfield, IL, USA, 2022.
- Zhou, F.; Hu, S.; Newcomb, D. Development of a performance-related framework for production quality control with ideal cracking and rutting tests. Constr. Build. Mater. 2020, 261, 120549. [Google Scholar] [CrossRef]
- Li, N.; Hao, P.; Yao, Y.; Zhang, C. The implementation of balanced mix design in asphalt materials: A review. Constr. Build. Mater. 2023, 402, 132919. [Google Scholar] [CrossRef]
- Anderson, T.L.; Anderson, T.L. Fracture Mechanics: Fundamentals and Applications; CRC Press: Sebastopol, CA, USA, 2005. [Google Scholar]
- Pant, S.; Akentuna, M.; Mohammad, L.N.; Cooper, S.B., III; Cooper, S.B., Jr. Field performance validation of the Louisiana balanced asphalt mix design framework. Constr. Build. Mater. 2024, 428, 136251. [Google Scholar] [CrossRef]
- Shaked, S.; Crettaz, P.; Saade-Sbeih, M.; Jolliet, O.; Jolliet, A. Environmental Life Cycle Assessment; CRC Press, Taylor & Francis Group: Abingdon, UK, 2015. [Google Scholar]
- Seo, E.S.M.; Kulay, L.A. Life cycle assessment: Management tool for decision-making. Interfacehs 2006, 1, 1. [Google Scholar]
- Mukherjee, A. Update to the Life Cycle Assessment for Asphalt Mixtures in Support of the Emerald Eco Label Environmental Product Declaration Program; National Asphalt Pavement Association: Greenbelt, MD, USA, 2021. [Google Scholar]
- Bhat, C.G. Life Cycle Information Models with Parameter Uncertainty Analysis to Facilitate the Use of Life-Cycle Assessment Outcomes in Pavement Design Decision-Making; Michigan Technological University: Houghton, MI, USA, 2020. [Google Scholar]
- Strömberg, L.; Hintze, S.; Al-Qadi, I.A.Q.; Okte, E. Assessment of asphalt concrete EPDs in Scandinavia and the United States. In Pavement, Roadway, and Bridge Life Cycle Assessment 2020; CRC Press: Sebastopol, CA, USA, 2020; pp. 82–89. [Google Scholar]
- ISO 21930; Sustainability in Buildings and Civil Engineering Works—Core Rules for Environmental Product Declarations of Construction Products and Services. International Organization for Standardization: Geneva, Switzerland, 2017.
- Meijer, J.; Harvey, J.; Butt, A.; Kim, C.; Ram, P.; Smith, K.; Saboori, A. LCA Pave: A Tool to Assess Environmental Impacts of Pavement Material and Design Decisions-Underlying Methodology and Assumptions; Federal Highway Administration: Washington, DC, USA, 2021. [Google Scholar]
- Shatnawi, S. RePlay® Agricultural Oil Seal and Preservation Agent: A Sustainable and Environmentally Safe Product for Effective Rejuvenation and Sealing of Asphalt Concrete Surfaced Pavements; Shatec Engineering Consultants: El Dorado Hills, CA, USA, 2014. [Google Scholar]
- Li, Y.; Griffing, E.; Higgins, M.; Overcash, M. Life cycle assessment of soybean oil production. J. Food Process Eng. 2006, 29, 429–445. [Google Scholar] [CrossRef]
- Inch Calculator. Megajoules to Kilowatt-Hours Converter. Available online: https://www.inchcalculator.com/convert/megajoule-to-kilowatt-hour/ (accessed on 1 January 2024).
- United States Environmental Protection Agency. Greenhouse Gas Equivalencies Calculator. Available online: https://www.epa.gov/energy/greenhouse-gas-equivalencies-calculator#results (accessed on 1 January 2024).
- Sulaiman, M.A.; Oni, A.O.; Fadare, D.A. Energy and exergy analysis of a vegetable oil refinery. Energy Power Eng. 2012, 4, 358–364. [Google Scholar] [CrossRef]
- Mukherjee, A.; Bhat, C.G. Assessing Data Quality of Background Life Cycle Inventory (LCI) Datasets; American Center for Life Cycle Assessment (ACLCA): Vashon, WA, USA, 2022. [Google Scholar]
- Bare, J.C. Tool for the Reduction and Assessment of Chemical and Other Environmental Impacts (TRACI), Version 2.1-User’s Manual; United States Environmental Protection Agency: Washington, DC, USA, 2012. [Google Scholar]
- NAPA. Asphalt Pavement Industry Goals For Climate Stewardship: Toward Net Zero Carbon Emissions. Available online: https://www.asphaltpavement.org/climate/industry-goals (accessed on 1 February 2023).
- United States Environmental Protection Agency. Inflation Reduction Act Programs to Fight Climate Change by Reducing Embodied Greenhouse Gas Emissions of Construction Materials and Products. 2023. Available online: https://www.epa.gov/inflation-reduction-act/inflation-reduction-act-programs-fight-climate-change-reducing-embodied#:~:text=The%20Inflation%20Reduction%20Act%20invests,and%20other%20greenhouse%20gas%20emissions. (accessed on 15 July 2024).
- LaDOTD. Monthly Price Indices for Asphalt Cement and Fuel. Available online: https://wwwapps.dotd.la.gov/engineering/lettings/lac_price_index/priceindices.aspx (accessed on 20 May 2024).
Disclaimer/Publisher’s Note: The statements, opinions and data contained in all publications are solely those of the individual author(s) and contributor(s) and not of MDPI and/or the editor(s). MDPI and/or the editor(s) disclaim responsibility for any injury to people or property resulting from any ideas, methods, instructions or products referred to in the content. |
© 2024 by the authors. Licensee MDPI, Basel, Switzerland. This article is an open access article distributed under the terms and conditions of the Creative Commons Attribution (CC BY) license (https://creativecommons.org/licenses/by/4.0/).