Abstract
Small yellow croaker (Larimichthys polyactis) is a critical economic fish species in South Korea, where effective management is essential due to concerns over declining populations. This study aims to enhance fishery management strategies by applying machine learning techniques to classify the maturity stages and estimate the length at first maturity (L50 and L95), comparing these results with those obtained using traditional macroscopic methods. Five machine learning models, including Decision Tree (DT), Random Forest (RF), LightGBM (LGBM), EXtreme Gradient Boosting (XGB) and Support Vector Machine (SVM), were developed and evaluated for their effectiveness in predicting maturity stages. The XGB model demonstrated superior performance with the highest evaluation final score and low computation time. Using generalized linear models (GLM), this study estimated L50 and L95 for both machine learning predictions and macroscopic observations. The results showed that machine learning models, particularly XGB, provided more precise estimates with narrower confidence intervals and better model fit than the traditional macroscopic methods. These findings can support more sustainable fisheries management practices by offering reliable tools for setting appropriate regulatory measures, such as minimum landing sizes, which contribute to the conservation of marine resources.
Keywords:
length at first maturity; machine learning; macroscopic methods; fisheries management; small yellow croaker Key Contribution:
Demonstrating that machine learning models can accurately predict the maturity stages and lengths at first maturity. This method improves upon traditional approaches, providing more precise and reliable data for fisheries management.
1. Introduction
Small yellow croaker (Larimichthys polyactis) is one of the most important economic fish species in South Korea, playing a significant role in coastal and commercial fisheries [1,2,3]. This species primarily inhabits The Yellow Sea and the East China Sea and can be found throughout the year under various environmental conditions [4,5,6]. However, in recent years, concerns have arisen over declining catches and resource depletion, necessitating a scientific approach for effective management [1,2,3,7].
To sustainably manage fishery resources, studies on maturity length and reproductive characteristics are essential. Maturity length refers to the minimum length at which a fish reaches sexual maturity, which is crucial for understanding the reproductive potential and population maintenance of fishery resources [8,9,10,11]. Reproductive characteristics are key factors in understanding the reproductive strategies and success rates of fish populations, providing essential data for population dynamics and the development of resource management policies [8,12,13,14,15].
The accurate determination of fish maturity stages is essential for understanding reproductive biology and effectively managing fishery resources. Several methods have been employed to assess these stages, each with unique advantages and limitations. Macroscopic methods, which involve visual examination of external characteristics and gonad appearance, are widely used due to their simplicity and cost–effectiveness. However, these methods are often criticized for their subjectivity and lower accuracy, especially in distinguishing early maturity stages [16,17].
In contrast, histological methods provide a more detailed and reliable assessment by examining the microscopic structure of gonadal tissues, allowing for precise identification of maturity stages. Despite their accuracy, histological methods are time–consuming and require specialized equipment and expertise, which may limit their use in routine assessments [18,19,20].
The Gonadosomatic Index (GSI) method offers a compromise between these approaches by estimating maturity based on the ratio of gonad weight to body weight. Although the GSI method provides a more objective measure of reproductive status compared to macroscopic methods, it can be influenced by factors such as feeding and environmental conditions, potentially affecting its reliability [21,22,23]. Together, these methods provide a toolkit for fisheries biologists, each suitable for different research contexts and management needs.
Recently, machine learning techniques have shown exceptional performance in analyzing complex biological data and predicting patterns [24,25,26,27,28,29,30]. Several machine learning methods have been increasingly applied in ecological and fisheries research due to their ability to handle complex datasets and improve prediction accuracy. Machine learning techniques such as Decision Trees (DT), Random Forest (RF), LightGBM (LGBM), EXtreme Gradient Boosting (XGB), and Support Vector Machines (SVM) are widely used in data analysis and prediction due to their diverse strengths.
DT creates a tree–like model for decision–making but can overfit noisy data [31,32]. RF, an ensemble method that builds multiple decision trees, improves accuracy and stability while reducing overfitting, making it particularly valuable in fisheries management for tasks like classifying maturity stages [33,34]. LGBM and XGB are gradient boosting algorithms designed for efficiency and scalability, providing faster training speeds and better performance on large, structured datasets commonly found in fisheries data [35,36]. SVM is effective for both classification and regression tasks, handling high–dimensional data and modeling complex decision boundaries, making it useful in ecological studies for species classification and outcome prediction [37].
Especially, Cutler et al. [34] introduced RF as a highly accurate statistical classifier in ecology, which was previously underutilized in the field. RF offers several advantages, such as high classification accuracy, the ability to determine the importance of variables, and flexibility in handling various types of analyses, including regression and classification. The study showed that RF outperformed other classifiers in accuracy when applied to diverse ecological data. These findings highlight the potential of machine learning, particularly RF, to enhance ecological data analysis and suggest broader applications in fisheries management for more precise estimations of fish maturity stages and lengths.
While RF has historically been considered a highly accurate model for ecological data analysis, recent studies suggest that XGB often outperforms RF in specific contexts. For instance, Muñoz–Mas et al. [38] demonstrated that XGB outperformed RF and other tree–based models in predicting microhabitat suitability for invasive species. Similarly, Effrosynidis et al. [39] highlighted XGB’s effectiveness in species distribution modeling in the Mediterranean Sea. Moreover, Bergen et al. [40] showed that XGBoost provided superior classification accuracy in predicting animal behavior from environmental features.
Flores et al. [41] applied machine learning to classify the maturity status of Chilean hake (Merluccius gayi gayi) in the Chilean waters. This study demonstrated high predictive accuracy by integrating various variables, including length (TL), gonadosomatic index (GSI), condition factor (Krel), latitude, longitude, depth, and month, highlighting the potential of machine learning techniques in studying reproductive characteristics.
Based on these previous studies, this paper aims to apply various machine learning techniques, including RF and other advanced algorithms, to classify maturity stages and estimate the maturity length of small yellow croaker (Larimichthys polyactis) in South Korean waters. By integrating diverse biological and other relevant factors, this study seeks to enhance the accuracy and speed of maturity length estimation. The application of these techniques is expected to provide a more precise and efficient approach to fishery resource management, offering valuable insights for sustainable practices and policies.
2. Materials and Methods
Figure 1 illustrates the overview of procedure followed in this study for predicting fish maturity stages and estimating length at first maturity, which are critical parameters for fisheries management. The dataset was divided into a training set and a test set. Multiple machine learning algorithms were developed and evaluated to identify the most accurate model for predicting maturity stages. After evaluating the models, the best–performing machine learning model was selected. Using this final model, maturity stages were predicted for the test set, and the results were used to estimate the length at first maturity. These estimates were compared to those derived from the observed macroscopic data to evaluate the performance of the machine learning model. Finally, a comparison between the two methods was made to assess the model’s applicability in fisheries management.
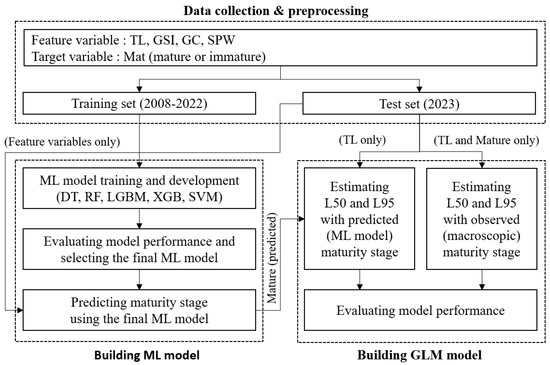
Figure 1.
Schematic diagram illustrating the overall analysis procedure for maturity stage classification and length at first maturity estimation using machine learning models.
2.1. Predicting Maturity Stage Using Machine Learning
2.1.1. Data Collection and Preprocessing
The dataset used in this study consists of a total of 23,545 female specimens measurements of small yellow croaker (Larimichthys polyactis) captured in South Korean waters. The data include total length (TL), gonadosomatic index (GSI), gonad color (GC), month of capture (Month), and maturity stage from macroscopic method (Mat) collected between 2008 and 2023.
- Data Transformation: Categorical variables, such as Month and GC (Gonad Color), were transformed to be suitable for machine learning algorithms. Specifically, The Month variable was converted into an ordered feature called SPW using OrdinalEncoder. It was categorized into three periods: high spawning activity (January to May), post–spawning/recovery (June to September), and off–spawning period (October to December), reflecting the key stages of small yellow croaker’s reproductive cycle. The other categorical feature of GC was transformed using one–hot encoding. Continuous variables, such as TL and GSI were standardized using a StandardScaler to ensure that all input features were on a comparable scale, enhancing the stability and performance of the models [42].
- Feature and target variables: The feature variables used for the machine learning models included TL, GSI, SPW and GC. These variables were chosen because they are significant predictors of fish maturity. TL and GSI provide quantitative measures of size and reproductive investment, while Month and GC capture seasonal and physiological variations in maturity. The target (label) variable for the classification models was the binary maturity stage (mature or immature). This label was derived from the detailed maturity stage information (Mat), which was simplified for the purposes of binary classification. By focusing on whether a fish is mature or not, the models aim to predict the onset of maturity based on the available features.
- Data Splitting: The dataset was divided into training and test sets. The training set included data up to 2022, while the test set consisted of data from the first four months (including spawning season) of 2023. The 2023 dataset was specifically used in the GLM analysis for estimating maturity lengths, as well as for a subsequent comparative analysis to evaluate the predictive performance of the machine learning model against the macroscopic observations. To further evaluate the models during the training process, the training set was split into a training subset and a validation subset. This approach ensured that 80% of the data was used for training and 20% for validation, allowing for effective model tuning and performance monitoring on unseen data.
2.1.2. Machine Learning Model Training and Development
Five machine learning algorithms; DT, RF, LGBM, XGB, and SVM, were employed to classify the maturity stages of small yellow croaker. To evaluate the performance of the machine learning models in classifying the maturity stages of small yellow croaker, three key metrics were considered: accuracy, area under the ROC curve (AUC), and true skill statistic (TSS). These metrics provide a comprehensive assessment of model performance across different aspects of classification.
Each model’s performance was evaluated, and the one with the highest final score, which considered weighted metrics, was selected as the optimal model for maturity stage classification. This weighted approach ensured that the chosen model performed well across multiple metrics, balancing overall prediction accuracy with the model’s ability to handle imbalanced data effectively.
- Accuracy: Accuracy represents the proportion of correctly classified instances (both true positives and true negatives) over the total number of instances in the dataset. It is a straightforward measure of the overall effectiveness of the model, but may be less reliable in cases where the dataset is imbalanced.where TP, TN, FP, and FN represent true positives, true negatives, false positives, and false negatives, respectively.
- Area Under the ROC Curve (AUC): AUC is a widely used metric that evaluates the model’s ability to discriminate between positive and negative classes across different threshold settings. The AUC measures the area under the ROC curve, where a value closer to 1.0 indicates a stronger performance in distinguishing between the two classes. The ROC curve plots the true positive rate (TPR) against the false positive rate (FPR), with AUC providing an aggregated measure of performance across all possible classification thresholds [43].
- True Skill Statistic (TSS): TSS is used to assess the model’s performance by considering both the sensitivity (true positive rate) and specificity (true negative rate). TSS is particularly useful for imbalanced datasets where both false positives and false negatives need to be accounted for. TSS ranges from −1 to 1, where a value of 1 indicates perfect classification, and values closer to 0 indicate no skill [44,45].
- Final Score: The final model selection was based on a weighted evaluation of three key metrics: Accuracy, AUC, and TSS. Specifically, Accuracy was assigned a weight of 0.2, while AUC and TSS were given more importance, each contributing 0.4 to the final score. This balanced approach ensured that the chosen model not only performed well in terms of overall accuracy but also demonstrated strong predictive capabilities across imbalanced data, as reflected by the AUC and TSS scores. The final score for each model was calculated using the following formula:
- Feature Importance: Feature importance scores were computed for the final model to identify the most significant predictors of fish maturity. This analysis helped determine which factors most influence maturity classification [46].
All analyses and data visualization were conducted using Python in a Jupyter Notebook environment [47]. Key libraries included pandas for data manipulation [48], scikit–learn 1.52 for DT, RF, SVM model development and evaluation, XGBoost and LightGBM for gradient boosting algorithms [49].
2.2. Estimating Length at First Maturity
The length at 50% first maturity (L50) and the length at 95% first maturity (L95) are critical metrics for fisheries management, as they help set regulatory guidelines, such as minimum landing sizes. While machine learning models provide precise and efficient classification of maturity stages, the L50 and L95 estimates are conventionally derived using generalized linear models (GLMs) [50] due to their interpretability and widespread use in fisheries management. Therefore, GLM was applied in this study to estimate L50 and L95 from the maturity stage predictions generated by both the macroscopic observations and machine learning methods using the R statistical software 4.4.0 [51].
Logistic regression of GLM was employed to estimate the probability of maturity based on a total length (TL) of the fish. The model is defined as:
where p represents the probability of a fish being mature, x is a total length (TL), is the intercept, and is the slope. The logistic function used to convert the log–odds to probability (p) is given by:
The length at 50% first maturity (L50) is determined when the probability . To calculate L50, we solve for x in the logistic regression equation when :
Similarly, the length at which 95% of the fish population is mature (L95) is calculated when . Setting in the logistic equation:
The logistic regression model’s fit was assessed using the Akaike Information Criterion (AIC) [52] and pseudo R–squared values. Also, to calculate 95% confidence intervals for L50 and L95, a bootstrapping method [53] was applied with 1000 iterations. Bootstrapping allowed for the estimation of the sampling distribution of L50 and L95, providing a more accurate reflection of variability and uncertainty in the estimates.
3. Results
3.1. Machine Learning Model Performance
The performance of five machine learning models: DT, RF, LGBM, XGB and SVM, was evaluated for classifying the maturity stages of small yellow croaker (Larimichthys polyactis). The models were assessed based on three key metrics: Accuracy, AUC and TSS. Additionally, a final score was calculated to determine the overall model performance. The computation times for each model were also considered, which is crucial when selecting a model for practical use (Table 1 and Figure 2).

Table 1.
Performance metrics and computation times for the five machine learning models used to classify the maturity stages of small yellow croaker (Larimichthys polyactis).
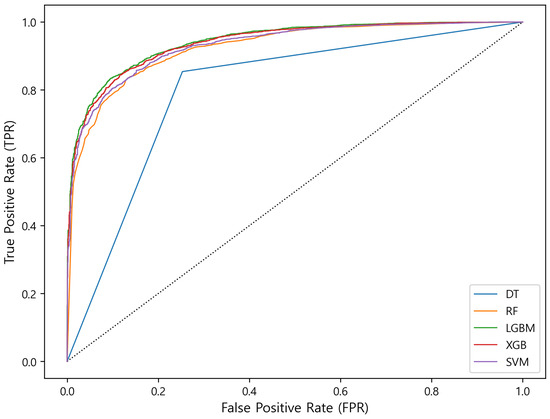
Figure 2.
Receiver operating characteristic (ROC) curves for the five machine learning models used to classify the maturity stages of small yellow croaker (Larimichthys polyactis). The models include DT, RF, LGBM, XGB and SVM.
Among the five models, XGB demonstrated the best overall performance with the highest final score (0.935), closely followed by SVM with a score of 0.933. Although SVM had a slightly lower performance in terms of AUC and accuracy compared to XGB, it had a marginally better TSS score. However, the computation time for SVM was significantly higher (80.26 s) compared to the other models, making it less practical for large–scale applications or real–time analysis. XGB, on the other hand, had a much shorter computation time (0.54 s) while still maintaining strong performance across all metrics, making it the most efficient and effective model overall.
LGBM also performed well with a final score of 0.923 and a very fast computation time (0.36 s), making it another suitable candidate for time–sensitive applications. RF had a slightly lower final score (0.890) but took considerably longer to compute (4.32 s). DT had the lowest final score (0.856) and moderate computation time (0.42 s), reflecting its simplicity and reduced predictive power compared to the more complex ensemble models.
While SVM performed well in terms of accuracy and classification metrics, its long computation time makes it less practical for large–scale applications. XGB, on the other hand, strikes an ideal balance between high performance and low computation time, making it the optimal model for this classification task. As a result, XGB has been selected as the final machine learning model for the classification of maturity stages in small yellow croaker, due to its superior performance across multiple evaluation metrics and its computational efficiency.
The feature importance (F score) plot (Figure 3) illustrates the influence of each variable on the final model of XGB. GSI contributed the most to the model’s accuracy, indicating its crucial role in predicting maturity. TL and SPW were also among the top contributors, underscoring their biological relevance in maturity stage classification. GC features, categorized from GC(1) to GC(29), captured detailed information about gonadal development, further supporting the classification process. While the impact of individual GC categories was smaller, their combined importance highlights the value of including such detailed biological variables in the model.
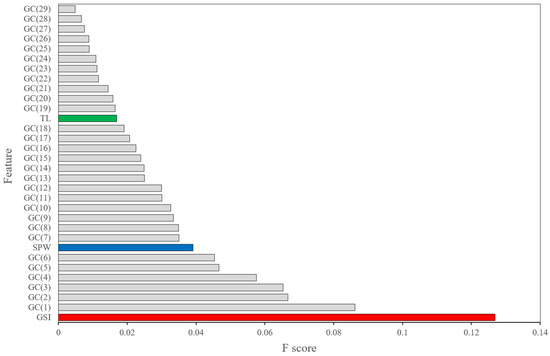
Figure 3.
Feature importance (F score) plot for the XGB model used to classify the maturity stages of small yellow croaker (Larimichthys polyactis). The different colors in the bars represent the various features: the red indicates GSI (gonadosomatic index), the blue represents SPW (spawning period), the green shows TL (total length), and the grey represents the GC (gonad color) categories.
3.2. Length at First Maturity (L50 and L95)
For the macroscopic test dataset of 2023, the GLM estimated L50 at 14.2 cm, with a 95% confidence interval (CI) of [11.8, 15.6] cm, and L95 at 21.7 cm, with a 95% CI of [19.0, 24.3] cm. The Akaike Information Criterion (AIC) for the macroscopic method was 168, and the R–squared value was 0.324, indicating a moderate fit to the data (Table 2 and Figure 4).
Table 2.
Estimated length at first maturity (L50 and L95) for small yellow croaker (Larimichthys polyactis) using the macroscopic method and the machine learning method (XGB). The table includes the 95% confidence intervals (CI), Akaike Information Criterion (AIC), and R–squared values, comparing the precision and model fit between the two methods.
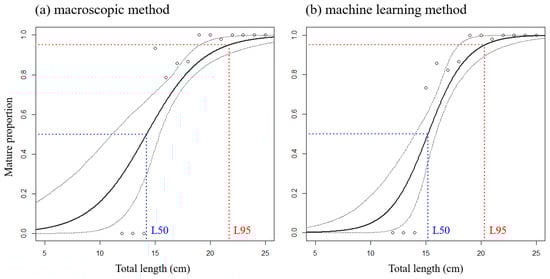
Figure 4.
Logistic regression curves for estimating the length at first maturity (L50 and L95) of small yellow croaker (Larimichthys polyactis) based on (a) macroscopic method and (b) machine learning method. The vertical and horizontal dashed lines indicate L50 and L95, respectively, with their corresponding 95% confidence intervals (CI). The hollow dots represent mature proportion values for each length class, with values in (a) derived from the macroscopic observation, and values in (b) based on predictions from the machine learning model.
In contrast, when using the machine learning method (XGB) to predict maturity stages, the GLM estimated the L50 at 15.2 cm with a 95% CI of [14.1, 15.9] cm, and the L95 at 20.3 cm with a 95% CI of [17.9, 22.4] cm. This model achieved a lower AIC of 138 and a higher R–squared value of 0.459, indicating a better model fit and more precise estimation of the lengths at maturity than the macroscopic method (Table 2 and Figure 4). These results suggest that machine learning–based predictions provide more reliable and accurate estimates of maturity lengths, supporting their use for improved fisheries management decisions.
4. Discussion
This study successfully applied machine learning techniques to classify the maturity stages and estimate the length at first maturity (L50 and L95) of small yellow croaker (Larimichthys polyactis) in South Korean waters. By comparing the machine learning predictions with traditional macroscopic methods, this research demonstrates the potential of advanced computational approaches in fisheries science and management.
4.1. Comparative Analysis of Machine Learning and Macroscopic Methods
The application of machine learning models, specifically XGB, showed higher accuracy and better model fit in predicting maturity stages compared to traditional macroscopic methods. This indicates that machine learning algorithms can effectively handle complex and large datasets, which are typical in ecological studies [24]. The superior performance of XGB, as demonstrated by its highest final score combined with a low computation time, suggests that it can capture intricate patterns and interactions within the data, thereby providing a robust tool for maturity stage classification.
In estimating the length at first maturity, the machine learning model (XGB) provided estimates of L50 and L95 that were slightly different but more precise compared to those derived from the macroscopic method. The GLM analysis using the machine learning predictions showed an L50 of 15.2 cm and an L95 of 20.3 cm, with narrower confidence intervals and better model fit (lower AIC and higher R–squared value) than the macroscopic method (Table 1 and Figure 2). These findings imply that machine learning models, when trained on comprehensive datasets, can provide more reliable and precise estimates.
4.2. Implications for Fisheries Management
The findings of this study have important implications for the management of small yellow croaker fisheries. The enhanced accuracy and precision of machine learning models in classifying maturity stages and estimating maturity lengths could lead to more informed management decisions. By improving the accuracy of maturity stage assessments, fisheries managers can better estimate spawning stock biomass, set appropriate catch limits, and design effective conservation strategies.
For example, the differences observed in L50 and L95 estimates between the macroscopic and machine learning methods could have significant implications for fisheries management policies. If management decisions, such as setting minimum catch sizes or protective measures, are based on these estimates, substantial differences in predicted maturity lengths could lead to unintended consequences for fish populations [54]. For instance, if the size limits are set too high or too low based on inaccurate maturity length estimates, it could result in overfishing of immature individuals or inadequate protection for the spawning population, ultimately affecting the sustainability of the fishery resource [55,56]. Accurate biological parameters, including size at maturity, are crucial to ensure that management measures effectively conserve fish stocks and prevent overfishing, thereby maintaining the sustainability of fisheries [57,58].
Despite the potential bottleneck in using macroscopic and field–derived data to train machine learning models, several advantages make these models highly valuable. One key strength is their ability to mitigate human judgment errors, which can often occur during manual maturity stage identification. The manual classification of fish maturity stages, especially through macroscopic methods, can vary between individuals and depend on the experience and skill level of the observer. This subjectivity is largely eliminated by machine learning models, which rely on standardized input data and consistent algorithms, offering more reliable and reproducible results.
Another significant advantage of machine learning models is the reduction in the time and resources required to process large datasets. Traditional methods, such as histological examinations, are time–consuming, labor–intensive, and require specialized skills and equipment to produce accurate results [14,15,18]. In contrast, machine learning models can rapidly process large datasets with minimal human intervention, allowing for more frequent and extensive monitoring of fish populations [59,60,61,62].
According to an interview with experts in the field, even with the macroscopic method, eliminating the need to extract and visually inspect the gonads can reduce the time required for the maturity assessment process by approximately 30%. Also, even in environments where specialized technicians are unavailable, machine learning models can still deliver trustworthy and consistent results. This democratization of the assessment process ensures that fishery managers in resource–limited settings can implement reliable and efficient monitoring programs, reducing dependency on specialized human resources. This underscores the potential of machine learning to further optimize efficiency in fisheries resource management.
4.3. Limitations and Future Research
Despite the promising results, this study has some limitations. One notable limitation is that the machine learning models were trained using maturity stage data determined by macroscopic methods, which, while useful, are less accurate than histological methods for assessing maturity stages. Histological methods provide more detailed and precise assessments by examining the microscopic structure of gonadal tissues, allowing for more accurate identification of maturity stages. Incorporating histological data into machine learning models could enhance the accuracy of maturity stage classification and improve the precision of estimates for L50 and L95.
Moreover, the dataset used was specific to small yellow croaker in South Korean waters, which may limit the generalizability of the findings to other species or regions. Additionally, the machine learning models relied on the quality and comprehensiveness of the input data; any biases or gaps in the data could affect the model outcomes.
Future research should aim to integrate histological data, as it offers more precise, objective measures of maturity, potentially reducing the current bottleneck caused by macroscopic input data. Additionally, expanding the dataset to include histological information across different species and environments would allow for more generalizable models, thus increasing the applicability of these models for global fisheries management. With better input data, machine learning models could lead to more reliable management outcomes, such as setting more accurate size limits for sustainable fishing practices.
5. Conclusions
This study demonstrates the effectiveness of five machine learning models in classifying maturity stages and estimating the length at first maturity (L50 and L95) of small yellow croaker. Among these, RF, LGBM, and XGB performed particularly well, with XGB standing out as the best performer, offering the highest accuracy and efficiency, making it the most suitable model for fisheries management than traditional macroscopic methods. Once a model has been trained on the relevant data, it can process large datasets consistently and quickly, without the need for ongoing manual classification efforts. By offering improved estimations of maturity stages and maturity lengths, machine learning models can support more accurate fisheries management decisions. This can contribute to sustainable practices, such as setting minimum landing sizes and gear regulations, including mesh or hook size, ultimately helping to preserve fish populations and protect marine resources.
Author Contributions
Conceptualization, H.K.; methodology, H.K. and S.C.Y.; writing—original draft preparation, H.K. and S.C.Y.; writing—review and editing, H.K. and S.C.Y.; visualization, H.K. All authors have read and agreed to the published version of the manuscript.
Funding
This research was funded by NIFS (National Institute of Fisheries Science) grant number R2024002.
Institutional Review Board Statement
Not applicable.
Informed Consent Statement
Not applicable.
Data Availability Statement
The raw data supporting the conclusions of this article will be made available by the authors on request.
Acknowledgments
Thank you very much to the small yellow croaker measurement data collecting team: Moojin Kim, Jinwoo Gim, Ji-Young Ma, Han-Sol Kim, Se-Hyeon Park, Hyun-Sol Park, Eun-Hwa Yoo, Hyun-Ji Yu, Chan-Hee Lee, Hyun-Myoung Lee, Jina Lim, Jae-Woong Chang, and Min-Jin Jo at NIFS. Also, we thank anonymous referees for their valuable comments on an earlier version of the manuscript.
Conflicts of Interest
The authors declare no conflicts of interest.
Abbreviations
The following abbreviations are used in this manuscript:
| GSI | Gonadosomatic Index |
| DT | Decision Trees |
| RF | Random Forest |
| LGBM | Light Gradient-Boosting |
| XGB | EXtreme Gradient Boosting |
| SVM | Support Vector Machines |
| ROC | Receiver Operating Characteristic |
| AUC | Area Under the ROC Curve |
| TSS | True Skill Statistic |
References
- Yeon, I.J.; Lee, D.W.; Lee, J.B.; Choi, K.H.; Hong, B.K.; Kim, J.I.; Kim, Y.S. Long-term changes in the small yellow croaker, Larimichthys polyactis, population in the Yellow and East China Seas. J. Korean Soc. Fish. Ocean Technol. 2010, 46, 392–405. [Google Scholar] [CrossRef]
- Zhang, C.I.; Kim, H.A.; Kang, H.J. Management of small yellow croaker and hairtail in Korean waters using the length-based production value-per-recruit (PPR) analysis. J. Korean Soc. Fish. Ocean Technol. 2016, 52, 220–231. [Google Scholar] [CrossRef]
- Choi, M.J.; Kim, D.H. Assessment and Management of Small Yellow Croaker (Larimichthys Polyactis) Stocks South Korea. Sustainability 2020, 12, 8257. [Google Scholar] [CrossRef]
- Lin, L.S.; Ying, Y.P.; Han, Z.Q.; Xiao, Y.S.; Gao, T.X. AFLP analysis on genetic diversity and population structure of small yellow croaker Larimichthys Polyactis. Afr. J. Biotechnol. 2009, 8, 2700–2706. [Google Scholar]
- Ni, G.; Li, Q.; Kong, L.; Yu, H. Comparative phylogeography in marginal seas of the northwestern Pacific. Mol. Ecol. 2014, 23, 534–548. [Google Scholar] [CrossRef]
- Wang, Y.; Huang, J.; Tang, X.; Jin, X.; Sun, Y. Stable isotopic composition of otoliths in identification of stock structure of small yellow croaker (Larimichthys Polyactis) China. Acta Oceanol. Sin. 2016, 35, 29–33. [Google Scholar] [CrossRef]
- Wang, X.; Lu, G.; Zhao, L.; Yang, Q.; Gao, T. Assessment of fishery resources using environmental DNA: Small yellow croaker (Larimichthys polyactis) in East China Sea. PLoS ONE 2021, 15, e0244495. [Google Scholar] [CrossRef]
- Chen, X.; Liu, B.; Lin, D. Sexual Maturation, Reproductive Habits, and Fecundity of Fish. In Biology of Fishery Resources; Springer: Berlin/Heidelberg, Germany, 2022; pp. 113–142. [Google Scholar] [CrossRef]
- Reed, E.M.; Brown-Peterson, N.J.; DeMartini, E.E.; Andrews, A.H. Effects of data sources and biological criteria on length-atmaturity estimates and spawning periodicity of the commercially important Hawaiian snapper, Etelis coruscans. Front. Mar. Sci. 2023, 10, 1102388. [Google Scholar] [CrossRef]
- Ferreri, R.; McBride, R.S.; Barra, M.; Gargano, A.; Mangano, S.; Pulizzi, M.; Aronica, S.; Bonanno, A.; Basilone, G. Variation in size at maturity by horse mackerel (Trachurus trachurus) within the central Mediterranean Sea: Implications for investigating drivers of local productivity and applications for resource assessments. Fish. Res. 2019, 211, 291–299. [Google Scholar] [CrossRef]
- Smith, J.; Doe, J. Reproductive characteristics and maturity length of the commercially important fish species in the Indo-Pacific region. J. Mar. Biol. 2021, 45, 123–145. [Google Scholar] [CrossRef]
- Bris, A.L.; Pershing, A.J.; Hernandez, C.M.; Mills, K.E.; Sherwood, G.D. Modelling the effects of variation in reproductive traits on fish population resilience. ICES J. Mar. Sci. 2015, 72, 2590–2599. [Google Scholar] [CrossRef]
- Morgan, M.J. Integrating Reproductive Biology into Scientific Advice for Fisheries Management. J. Northwest Atl. Fish. Sci. 2008, 41, 37–51. [Google Scholar] [CrossRef]
- Murua, H.; Saborido-Rey, F. Female reproductive strategies of marine fish species of the North Atlantic. J. Northwest Atl. Fish. Sci. 2003, 33, 23–31. [Google Scholar] [CrossRef]
- Brown-Peterson, N.J.; Wyanski, D.M.; Saborido-Rey, F.; Macewicz, B.J.; Lowerre-Barbieri, S.K. A Standardized Terminology for Describing Reproductive Development in Fishes. Mar. Coast. Fish. 2011, 3, 52–70. [Google Scholar] [CrossRef]
- Costa, A.M. Macroscopic vs. microscopic identification of the maturity stages of female horse mackerel. ICES J. Mar. Sci. 2009, 66, 509–516. [Google Scholar] [CrossRef]
- Min, M.A.; Head, M.A.; Cope, J.M.; Hastie, J.D.; Flores, S.M. Limitations and applications of macroscopic maturity analyses: A comparison of histological and visual maturity for three west coast groundfish species. Environ. Biol. Fishes 2022, 105, 193–211. [Google Scholar] [CrossRef]
- West, G. Methods of Assessing Ovarian Development in Fishes: A Review. Mar. Freshw. Res. 1990, 41, 199–222. [Google Scholar] [CrossRef]
- Murua, H.; Motos, L. Reproductive strategy and spawning activity of the European hake Merluccius merluccius (L.) in the Bay of Biscay. J. Fish Biol. 2006, 69, 1288–1303. [Google Scholar] [CrossRef]
- Prince, J.; Harford, W.J.; Taylor, B.M.; Lindfield, S.J. Standard histological techniques systematically under-estimate the size fish start spawning. Fish Fish. 2022, 23, 1507–1516. [Google Scholar] [CrossRef]
- Flores, A.; Wiff, R.; Díaz, E. Using the gonadosomatic index to estimate the maturity ogive: Application to Chilean hake (Merluccius Gayi Gayi). ICES J. Mar. Sci. 2014, 72, 508–514. [Google Scholar] [CrossRef]
- Flores, A.; Wiff, R.; Ganias, K.; Marshall, C.T. Accuracy of gonadosomatic index in maturity classification and estimation of maturity ogive. Fish. Res. 2019, 210, 50–62. [Google Scholar] [CrossRef]
- Kang, H.; Ma, J.Y.; Kim, H.J.; Kim, H.J. Estimating Length at Sexual Maturity of the Small Yellow Croaker Larimichthys polyactis in the Yellow Sea of Korea Using Visual and GSI Methods. Korean J. Fish. Aquat. Sci. 2020, 53, 50–56. [Google Scholar] [CrossRef]
- Hastie, T.; Tibshirani, R.; Friedman, J. The Elements of Statistical Learning: Data Mining, Inference, and Prediction; Springer: Berlin/Heidelberg, Germany, 2009. [Google Scholar] [CrossRef]
- Genuer, R.; Poggi, J.M. Random Forests with R; Springer: Berlin/Heidelberg, Germany, 2020. [Google Scholar] [CrossRef]
- Gladju, J.; Kamalam, B.S.; Kanagaraj, A. Applications of data mining and machine learning framework in aquaculture and fisheries: A review. Smart Agric. Technol. 2022, 2, 100061. [Google Scholar] [CrossRef]
- Rubbens, P.; Brodie, S.; Cordier, T.; Destro Barcellos, D.; Devos, P.; Fernandes-Salvador, J.A.; Fincham, J.I.; Gomes, A.; Handegard, N.O.; Howell, K.; et al. Machine learning in marine ecology: An overview of techniques and applications. ICES J. Mar. Sci. 2023, 80, 1829–1853. [Google Scholar] [CrossRef]
- Mohale, H.P.; jawahar, P.; Jayakumar, N.; Oli, G.A.; Ravikumar, T. Application Of Deep Learning (Ai) In Marine Fisheries Resource Management. Trends Agric. Sci. 2023, 2, 753–763. [Google Scholar] [CrossRef]
- Kok, C.L.; Ho, C.K.; Tan, F.K.; Koh, Y.Y. Machine Learning-Based Feature Extraction and Classification of EMG Signals for Intuitive Prosthetic Control. Appl. Sci. 2024, 14, 5784. [Google Scholar] [CrossRef]
- Chen, J.; Teo, T.H.; Kok, C.L.; Koh, Y.Y. A Novel Single-Word Speech Recognition on Embedded Systems Using a Convolution Neuron Network with Improved Out-of-Distribution Detection. Electronics 2024, 13, 530. [Google Scholar] [CrossRef]
- Quinlan, J.R. Induction of decision trees. Mach. Learn. 1986, 1, 81–106. [Google Scholar] [CrossRef]
- Fürnkranz, J. Decision Tree. In Encyclopedia of Machine Learning; Springer US: Boston, MA, USA, 2010; pp. 263–267. [Google Scholar] [CrossRef]
- Breiman, L. Random Forests. Mach. Learn. 2001, 45, 5–32. [Google Scholar] [CrossRef]
- Cutler, D.R.; Edwards, T.C., Jr.; Beard, K.H.; Cutler, A.; Hess, K.T.; Gibson, J.; Lawler, J.J. Random forests for classfication in ecology. Ecology 2007, 88, 2783–2792. [Google Scholar] [CrossRef]
- Ke, G.; Meng, Q.; Finley, T.; Wang, T.; Chen, W.; Ma, W.; Ye, Q.; Liu, T.Y. LightGBM: A Highly Efficient Gradient Boosting Decision Tree. In Proceedings of the Advances in Neural Information Processing Systems, Long Beach, CA, USA, 4–9 December 2017; Guyon, I., Luxburg, U.V., Bengio, S., Wallach, H., Fergus, R., Vishwanathan, S., Garnett, R., Eds.; Curran Associates, Inc.: Red Hook, NY, USA, 2017; Volume 30. [Google Scholar]
- Chen, T.; Guestrin, C. XGBoost: A Scalable Tree Boosting System. In Proceedings of the KDD ’16: 22nd ACM SIGKDD International Conference on Knowledge Discovery and Data Mining, New York, NY, USA, 13–17 August 2016; pp. 785–794. [Google Scholar] [CrossRef]
- Cortes, C.; Vapnik, V. Support-vector networks. Mach. Learn. 1995, 20, 273–297. [Google Scholar] [CrossRef]
- Muñoz-Mas, R.; Gil-Martínez, E.; Oliva-Paterna, F.J.; Belda, E.J.; Martínez-Capel, F. Tree-based ensembles unveil the microhabitat suitability for the invasive bleak (Alburnus alburnus L.) and pumpkinseed (Lepomis gibbosus L.): Introducing XGBoost to ecoinformatics. Ecol. Inform. 2019, 53, 100974. [Google Scholar] [CrossRef]
- Effrosynidis, D.; Tsikliras, A.; Arampatzis, A.; Sylaios, G. Species Distribution Modelling via Feature Engineering and Machine Learning for Pelagic Fishes in the Mediterranean Sea. Appl. Sci. 2020, 10, 8900. [Google Scholar] [CrossRef]
- Bergen, S.; Huso, M.M.; Duerr, A.E.; Braham, M.A.; Schmuecker, S.; Miller, T.A.; Katzner, T.E. A review of supervised learning methods for classifying animal behavioural states from environmental features. Methods Ecol. Evol. 2023, 14, 189–202. [Google Scholar] [CrossRef]
- Flores, A.; Wiff, R.; Donovan, C.R.; Gálvez, P. Applying machine learning to predict reproductive condition in fish. Ecol. Inform. 2024, 80, 102481. [Google Scholar] [CrossRef]
- Han, J.; Kamber, M.; Pei, J. Preface. In Data Mining, 3rd ed.; The Morgan Kaufmann Series in Data Management Systems; Morgan Kaufmann: Boston, MA, USA, 2012; pp. 23–29. [Google Scholar] [CrossRef]
- Fawcett, T. An introduction to ROC analysis. Pattern Recognit. Lett. 2006, 27, 861–874. [Google Scholar] [CrossRef]
- Allouche, O.; Tsoar, A.; Kadmon, R. Assessing the accuracy of species distribution models: Prevalence, kappa and the true skill statistic (TSS). J. Appl. Ecol. 2006, 43, 1223–1232. [Google Scholar] [CrossRef]
- Shabani, F. Assessing Accuracy Methods of Species Distribution Models: AUC, Specificity, Sensitivity and the True Skill Statistic. Glob. J. Hum.-Soc. Sci. 2018, 18, 7–18. [Google Scholar]
- Liaw, A.; Wiener, M. Classification and Regression by randomForest. R News 2002, 2, 18–22. [Google Scholar]
- Kluyver, T.; Ragan-Kelley, B.; Pérez, F.; Granger, B.; Bussonnier, M.; Frederic, J.; Kelley, K.; Hamrick, J.; Grout, J.; Corlay, S.; et al. Jupyter Notebooks—A publishing format for reproducible computational workflows. In Positioning and Power in Academic Publishing: Players, Agents and Agendas; Loizides, F., Schmidt, B., Eds.; IOS Press: Amsterdam, The Netherlands, 2016; pp. 87–90. [Google Scholar]
- McKinney, W. Data Structures for Statistical Computing in Python. In Proceedings of the 9th Python in Science Conference, Austin, TX, USA, 28 June–3 July 2010; pp. 56–61. [Google Scholar] [CrossRef]
- Pedregosa, F.; Varoquaux, G.; Gramfort, A.; Michel, V.; Thirion, B.; Grisel, O.; Blondel, M.; Prettenhofer, P.; Weiss, R.; Dubourg, V.; et al. Scikit-learn: Machine Learning in Python. J. Mach. Learn. Res. 2011, 12, 2825–2830. [Google Scholar]
- McCullagh, P. Generalized Linear Models, 2nd ed.; Routledge: London, UK, 1989. [Google Scholar] [CrossRef]
- R Core Team. R: A Language and Environment for Statistical Computing; R Foundation for Statistical Computing: Vienna, Austria, 2021. [Google Scholar]
- Bozdogan, H. Model selection and Akaike’s Information Criterion (AIC): The general theory and its analytical extensions. Psychometrika 1987, 52, 345–370. [Google Scholar] [CrossRef]
- Berrar, D.; Dubitzky, W. Bootstrapping. In Encyclopedia of Systems Biology; Springer: New York, NY, USA, 2013; pp. 158–162. [Google Scholar] [CrossRef]
- Caddy, J.; Mahon, R. Reference Points for Fisheries Management; Number 347 in FAO Fisheries Technical Paper; FAO: Rome, Italy, 1995; p. 83. [Google Scholar]
- Trippel, E.A. Age at Maturity as a Stress Indicator in Fisheries: Biological processes related to reproduction in northwest Atlantic groundfish populations that have undergone declines. BioScience 1995, 45, 759–771. [Google Scholar] [CrossRef]
- Pope, J.G.; Macer, C.T. An evaluation of the stock structure of North Sea cod, haddock, and whiting since 1920, together with a consideration of the impacts of fisheries and predation effects on their biomass and recruitment. ICES J. Mar. Sci. 1996, 53, 1157. [Google Scholar] [CrossRef]
- Hilborn, R.; Walters, C.J. Quantitative Fisheries Stock Assessment: Choice, Dynamics and Uncertainty; Springer: New York, NY, USA, 1992. [Google Scholar] [CrossRef]
- King, M. Fisheries Biology, Assessment and Management, 2nd ed.; John Wiley & Sons: Hoboken, NJ, USA, 2007. [Google Scholar] [CrossRef]
- Gebremedhin, S.; Bruneel, S.; Getahun, A.; Anteneh, W.; Goethals, P. Scientific Methods to Understand Fish Population Dynamics and Support Sustainable Fisheries Management. Water 2021, 13, 574. [Google Scholar] [CrossRef]
- Watson, J.T.; Ames, R.; Holycross, B.; Suter, J.; Somers, K.; Kohler, C.; Corrigan, B. Fishery catch records support machine learning-based prediction of illegal fishing off US West Coast. PeerJ 2023, 11, e16215. [Google Scholar] [CrossRef]
- Olden, J.D.; Lawler, J.J.; Poff, N.L. Machine learning methods without tears: A primer for ecologists. Q. Rev. Biol. 2008, 83, 171–193. [Google Scholar] [CrossRef]
- LeCun, Y.; Bengio, Y.; Hinton, G. Deep learning. Nature 2015, 521, 436–444. [Google Scholar] [CrossRef]


Disclaimer/Publisher’s Note: The statements, opinions and data contained in all publications are solely those of the individual author(s) and contributor(s) and not of MDPI and/or the editor(s). MDPI and/or the editor(s) disclaim responsibility for any injury to people or property resulting from any ideas, methods, instructions or products referred to in the content. |
© 2024 by the authors. Licensee MDPI, Basel, Switzerland. This article is an open access article distributed under the terms and conditions of the Creative Commons Attribution (CC BY) license (https://creativecommons.org/licenses/by/4.0/).