Abstract
Microalgae are promising as prebiotics in aquaculture. Arthrospira maxima has potential nutritional value but is poorly studied. We assessed A. maxima feed supplementation in tilapia fry and evaluated its effect on growth performance and gut microbiota. Fish were cultivated in ponds under 0%, 5%, 10%, and 15% A. maxima inclusion treatments. Growth parameters and biomass proximate analysis were assessed. A meta-amplicon analysis was performed on the gut microbiota using DADA2 and PICRUST2 for functional prediction. Among treatments, the 5% supplementation group seemed to present no negative effect on growth parameters and did not compromise the nutritional quality of tilapia fry biomass. Microbial composition was characterized by Cetobacterium, Pseudomonas and Aeromonas genera, and a predominance of beneficial metabolic pathways. Microbiota of tilapia fry fed with A. maxima showed unique genera with reported beneficial functions in tilapia. The abundance of potential pathogenic taxa was significantly decreased in supplementation treatments, possibly related to valuable compounds of A. maxima. The inclusion of the microalgae supported the stability of the microbiota, favoring the growth of commensal species. This seems to have an effect on decreasing the presence of pathogenic genera in the gastrointestinal tract. Overall, our work proposes 5% feed inclusion of A. maxima to be the most suitable for tilapia fry aquaculture to maintain production rates while improving general health.
Keywords:
aquaculture; microalgae supplementation; gastrointestinal microbiota; meta-amplicon analysis; microbiome profiling Key Contribution:
We provide insights into the utilization of A. maxima as a feed supplement for tilapia fry aquaculture.
1. Introduction
The fish commonly referred to as ‘tilapia’ includes species within the family Cichlidae. These organisms are one of the main animal protein sources for human consumption, ranking as the second most produced in fish farming globally [1]. In recent years, global production of tilapia has been estimated at up to 6.8 million tons in 2020 [2]. Statistics show that only 0.7 million tons (approximately 10%) are obtained by capture, while the remaining 90% is produced by aquaculture farms [2]. The rise in the global population has increased the demand for food worldwide, demanding an expansion in production yields.
Aquaculture of fish facilities better yields and utilization of resources [3]. In this sense, aquaculture of tilapia has benefited the fishery industry by more than doubling the production compared to 20 years ago [2]. Despite its advantages, several challenges have emerged over the years, including microbial diseases in fish. To prevent illness, farmers have resorted to the use of vaccines, antibiotics and parasiticides. However, their cost represents a significant financial burden, and in some cases, their utilization is constrained [4]. Therefore, cheaper yet effective alternatives to vaccines and antibiotics are a hot spot for research. Among these, supplementation with prebiotics, probiotics, and other feed supplements has been explored [5]. Prebiotics are non-digestible compounds, and probiotics are live microbial supplements. Both pre- and probiotics benefit health status by stimulating the gastrointestinal (GI) microbial balance towards the growth of beneficial bacteria and combating undesirable microorganisms [5]. Among these alternatives, microalgae emerge as a promising solution.
Microalgae is a general term for photosynthetic microorganisms from prokaryotic (cyanobacteria) and eukaryotic (green, red, and other microalgae) taxonomic domains. Recently, the biotechnological application of microalgae has been widely studied. These microorganisms are known to present a unique nutritional profile with balanced percentages of carbohydrates, protein, lipids, vitamins, and minerals [6]. Additionally, microalgae can produce bioactive compounds with antioxidant, antimicrobial, antiparasitic and antiviral properties [7]. These characteristics position microalgae as promising feed supplements, functioning as pre- and probiotics [7,8].
It has been proposed that microalgae-based supplements promote growth of tilapia fry and protect against diseases by beneficially affecting the GI microbial communities [7,9]. Previous studies have supported this idea by showing that feeding fish in aquaculture with microalgae supplements results in bigger, healthier, and disease-free fish [10,11]. Also, meta-amplicon studies of the GI microbiota of tilapia fed with microalgae demonstrated an increase in the relative abundance of beneficial bacteria [12].
Arthrospira (also known as spirulina) species are relevant edible microalgae due to their high nutritional value [13]. Among them, A. platensis has been extensively studied as a feed supplement [14]. Previous research in tilapia aquaculture systems has reported that the inclusion of A. platensis at percentages of 30% increases growth, feed utilization efficiency, and improves the health status of fish [15]. Other authors have reported enhanced activity of antioxidant enzymes (e.g., superoxide dismutase, catalase) in tilapia individuals fed with A. platensis supplemented meal [16].
While A. platensis is widely researched in this regard, other promising species, such as A. maxima, are poorly explored. Biochemical characterization of A. maxima revealed total protein and lipid contents of ~43% and ~4%, respectively, along with high antioxidant capacity [17]. These values are similar to or slightly higher than those reported for A. platensis, indicating its potential as a feed supplement. Additionally, previous studies have shown that microalgae might enhance the growth performance of tilapia [18]. These characteristics support the idea that it is a suitable microorganism to increase tilapia production yields.
Therefore, studying the growth performance and bacterial dynamics of tilapia supplemented with microalgae in aquaculture is relevant, as it might provide insights into optimal growth conditions to maximize production yields. Hence, in this research, we aimed to assess the implementation of different concentrations of Arthrospira maxima (spirulina) as a feed supplement in tilapia fry (Oreochromis niloticus) and evaluate its effect on growth performance and GI microbiota.
2. Materials and Methods
2.1. Arthrospira Maxima Culture and Biomass Harvesting
Microalgae biomass was produced at the Bioenergy Laboratory of Biotechnology Research Center (CIB, Instituto Tecnológico de Costa Rica). Culture medium was based on an adapted industrial formulation of Zarrouk, supplemented with 10 g/L of NaHCO3 as carbon source and pH regulator (range between 9 and 10). The initial inoculum for culture was 0.1 g/L (1.7 × 10⁵ cells/mL). Chemical conditions were monitored according to Poveda-Víquez et al. (2023), and a similar production system and conditions were also used as described [19]. Briefly, a raceway system (water level of 0.4 m deep) was employed to maintain the culture in a continuous system and a volumetric capacity of 30,000 L. Cultivation lasted 35 days, and cell growth was evaluated by optical microscope (DM 750, Leica Microsystem, Wetzlar, Germany) and a Neubauer cell counting chamber. Dry weight was monitored through a halogen thermobalance (Radwag Balances and Scales, Toruńska, Poland). Biomass density and culture yield reached an optimal level of 0.71 g/L and 0.98 g/L, respectively, on day 35. Biomass was harvested weekly, centrifugation (4200 rpm, SSD 606,007 Gea Westfalia separator, GEA, Düsseldorf, Germany), and spray-dried using the Galaxie ECO Dryer® 1512 (Galaxie, Buenos Aires, Argentina). The final product was a fine green powder of the A. maxima biomass with a particle size of 150 µm.
2.2. Microalga-Based Feed Preparation
For feeding trials, the commercial Tilapia feed, Acuaoro Tilapia (Belina, Cartago, Costa Rica), served as the control diet (particle size: <1000 µm, 0 × 0). We performed a physical incorporation of the microalgae (experimental diets). Briefly, in a sterile recipient, commercial feed was mixed with the corresponding percentage of A. maxima biomass (5%, 10%, or 15%). The binder Pegalaq (Laquinsa Salud Animal, Cartago, Costa Rica) was later added at a concentration of 75 mL per kilogram of feed and all the ingredients were thoroughly stirred. This binder is used to ensure the correct inclusion of microalgae biomass to the commercial feed, avoiding its later dissociation when thrown to bioassay tanks.
To assess the nutritional quality of both the commercial feed and the A. maxima biomass, proximate analyses were performed at Asesorías Químicas Y Laboratorio A.Q.Y.L. S.A., Costa Rica. These analyses evaluated moisture, crude protein, crude fat, ash, and fiber content in accordance with the AOAC Methods of Analysis 2010. The nutritional parameters of experimental diets were estimated by addition of the corresponding percentages based on values from proximate analysis (Table 1).

Table 1.
Nutritional parameters from proximal analysis of commercial feed, pure A. maxima biomass, and estimation of experimental diets.
2.3. Bioassay Fish Selection
A total of 1200 newly hatched male monosex tilapia Oreochromis niloticus (initial weight: 0.02 g) were utilized for this study (Biopez, Costa Rica). The feeding trial began 9 days post-hatch, following a 9-day acclimation period on commercial feed to adapt the fish to their new environment. The quantity of feed administered was determined in rates of 2% to 3% of body weight (BW), based on manufacturers guidelines. The bioassay was designed as a simple randomized study. Each experimental unit consisted of 50 gallons 8 mm fiberglass tanks with controlled conditions to promote optimal tilapia growth. The tanks were installed with two activated carbon filters (DoPhin F1200 internal filter, Cartago, Costa Rica), an air pump (Xilong XL-2187, Cartago, Costa Rica), white LED light (AROWAN 40 cm lamp, Cartago, Costa Rica), a thermostat (Xilong 200 W, Cartago, Costa Rica), and a glass thermometer (Aquadene, Cartago, Costa Rica). The bottom of the experimental units was decorated with 10 cm of fine river rocks. For instance, temperature maintained at 29–32 °C, dissolved oxygen (maintained at levels above 6 mg/L), pH (7.5 ± 0.5), and ammonia nitrogen (<0.04 mg/L), were monitored daily to ensure optimal living conditions.
2.4. Experimental Design
The bioassay was carried out at the Laboratorio de Sanidad Animal, which is part of the Escuela de Agronegocios at the Instituto Tecnológico de Costa Rica (ITCR), situated in the Cartago province. The experiment was structured into four distinct dietary treatment groups fed with the baseline diet supplemented with the addition of 0% (control), 5%, 10% and 15% microalgae biomass. The treatments were named C, A, B, and D, respectively. Each of the four treatments presented three replicates, with 100 fish allocated per replicate, totaling 12 experimental units. Bioassay was conducted over a period of 8 weeks to assess the effects of A. maxima supplementation on tilapia growth performance and gut microbiota dynamic.
2.5. Bioassay Monitoring
Weekly measurements of ammonia were also performed throughout the 56-day bioassay period. Feeding was conducted manually twice daily, in the morning (8:00–9:00) and in the evening (17:00–18:00), at rates of 2% to 3% BW per feeding, following the feeding guidelines provided by the commercial feed manufacturer. This regimen was adjusted weekly based on growth to ensure the provision of an isocaloric diet and to prevent feeding stress.
For biomass weekly assessment, ten fish from each tank were randomly sampled, measuring length, width, weight, and head size. Growth performance was evaluated through weekly weight measurements, and the data was analyzed using the allometric equation Y = a × b to correlate growth parameters. Calculations of the final biomass and Feed Conversation Ratio (FCR) were accessed as follows. First, the final biomass:
where the ‘number of fish’ is the quantity alive at the end of the experiment, and the FCR:
The Specific Growth Rate (SGR) was calculated using the following formula:
where ‘final’ and ‘initial weight’ was given in grams. Additionally, a proximal analysis of the final biomass of the fry from each treatment was carried out at the end of the experiment in accordance with the AOAC Methods of Analysis 2010. A total harvest and count of the fish were conducted to determine survival rates as follow:
where ‘fish alive’ represents the fish alive at the end of the bioassay and ‘total fish’ is the number of individuals per fiberglass tank at the beginning of the experiment (100 fish).
2.6. DNA Extraction, 16S rRNA Gene High-Throughput Sequencing, and Meta-Amplicon Analysis of Gut Microbiota
2.6.1. DNA Extraction and 16S rRNA Gene Amplicon Sequencing
The intestines of three fish per treatment were obtained with a sterilized dissecting knife, immediately frozen in liquid nitrogen, and stored in a −80 °C freezer. The total DNA of O. niloticus complete gut (including its content) was extracted through the DNeasy® PowerSoil® Pro kit following manufacturer’s instructions with modifications: (i) a complete tilapia gut was mixed with CD1 solution and incubated at 60 °C for 10 min in a thermoblock (AccuBlockTM Digital Dry Bath, Labnet International, Edison, NJ, USA). (ii) After incubation, samples were lysed using a mechanical macerator in cycles of 5 s at 15 s−1 until it was partially homogenized. (iii) Prior dilution, column with CD6 buffer was let to rest for 2 min and later centrifuged. Extracted DNA was stored in a −80 °C freezer until further use.
The quality and purity (260/280 and 260/230 absorption ratios) of extracted DNA was assessed using the QuatiFlour® ONE dsDNA System kit on a Quantus device (Promega, Madison, WI, USA), and Nanodrop Lite Spectrophotometer (Thermo Scientific, Waltham, MA, USA), respectively. The integrity of the samples was verified with 1% agarose gel. Subsequently, the obtained DNA was sent for amplification and sequencing to Macrogen, Inc. (Seoul, Republic of Korea).
2.6.2. Meta-Amplicon Analysis of Gut microbiota
The genomic library was prepared with the Herculase II Fusion DNA Polymerase Nextera XT Index V2 kit. The hypervariable V3–V4 region in the 16S rRNA gene was sequenced through a 2 × 300 bp technique on an Illumina Miseq platform (Seoul, Republic of Korea). For this, the primers Bakt_341F (5′-CCTACGGGNGGCWGCAG-3′) and Bakt_805R (5′-GACTACHVGGGTATCTAATCC-3′) were used.
For meta-amplicon analysis, a total of 24 raw reads files were received, corresponding to forward and reverse files of each of the three replicates from 4 treatments. The DADA2 R package v1.30.0 [20] was used to perform the analysis [21]. First, the raw reads quality was examined using ‘plotQualityProfile()’ function. Later, sequences were trimmed with ‘filterAndTrim()’ command (maxEE = 2, and truncLen values of 300 and 270 for forward and reverse data, respectively). Sequence errors were estimated with the ‘learnError()’ model. The ‘dada()’ algorithm for error correction and denoising was applied. The corrected sequences were merged using ‘mergePairs()’ function, resulting in 12 .fastq files. An amplicon sequence variants (ASVs) count table was created by ‘makeSequenceTable()’ method. The chimeric sequences of the table were removed by ‘removeBimeraDenovo()’ mode of DADA2. A summary of raw sequences during preprocessing can be found in Supplementary Table S1.
For taxonomy assignment, we aligned curated ASVs table against the SILVA rRNA database v138.1 (dataset: silva_nr99_v138.1_train_set.fa) [22]. Alignment was performed through ‘assignTaxonomy()’ command. ASVs count table, taxonomy table and metadata (.tsv file) were used to create a phyloseq-class object with ‘phyloseq()’ command from phyloseq v1.46.0 R package [23]. Non-bacterial (archaea, chloroplast, mitochondria), unclassified and taxa with read count less than 5 were removed using ‘tax_fix()’ function from microViz v0.12.1 R package [24]. The phyloseq-class object was converted into a data frame by ‘psmelt()’ option. From the data frame, unique, shared, and potential pathogenic genera (according to [25]) were retrieved. Graphical data visualization was generated through ggplot2 R package v3.5.0 [26].
ASVs sequences and abundance were extracted from the DADA2 object through script and used to run the Phylogenetic Investigation of Communities by Reconstruction of Unobserved States (PICRUST2) v2.5.2 [27]. PICRUST2 aligns ASVs sequences to reference species tree and associates to KEGG gene family copy number per reference genome [27]. Later, the abundance table of ASVs is combined to the related genes abundance to determine the relative abundance per sample. Finally, genes profiles are mapped into gene pathways to output the predicted metabolic pathways relative abundances [27]. Data was visualized through a heatmap with ‘pheatmap()’ function from pheatmap v1.0.12 R package [28]. Euclidean distances were calculated using the factoextra R package v1.0.7. Except otherwise noted, all commands were used with default parameters.
2.7. Statistical Analysis
Growth parameters and proximal composition were accessed using Shapiro–Wilk and Levene test. Results showed that all data followed a normal distribution and could be considered parametric (p > 0.05), except for moisture (p < 0.05). To determine the significant difference among parameters, we performed a One-way analysis of variances (ANOVA) for parametric data. For non-parametric data, statistical difference was calculated through Kruskal–Wallis test. To differentiate samples with a significant difference, Tukey’s HSD (Honestly Significant Difference) and post hoc Nemenyi tests were employed for parametric and non-parametric data, respectively.
Regarding meta-amplicon data, rarefaction curves were calculated based on observed features of ASVs count table through the ‘rarecurve()’ function from vegan R package v2.6.4 [29]. To assess alpha diversity, we used the curated taxonomy to estimate richness (observed and Chao1) and diversity indexes of Shannon and Simpson using the ‘estimate_richness()’ phyloseq command. Shapiro–Wilk and Levene tests revealed our data followed a normal distribution (p > 0.05), except for the Simpson index values (p < 0.05). Hence, significant differences among the alpha diversity were evaluated with an ANOVA test and Kruskal–Wallis test, for parametric and non-parametric values, respectively. To evaluate variations among treatments, we calculated Bray–Curtis dissimilarities using microViz, aggregating per ‘Genus’. Later, significant differences among values were accessed through a permutational multivariate analysis of variance (PERMANOVA), establishing 1000 permutations. We visualized the Bray-Curtis distances on Principal Coordinate Analysis (PCoA) and non-metric multidimensional scaling (NMDS) analysis with microViz and phyloseq, respectively. Abundances of pathogenic genera and predicted metabolic pathways were analyzed using Shapiro–Wilk and Levene test. All data were categorized as parametric (p > 0.05), and consequently accessed using ANOVA and Tukey’s HSD. All graphics were generated with ggplot2, except otherwise noted.
3. Results and Discussion
3.1. Growth and Nutrional Parameters of Tilapia Fry Supplemented with Arthrospira Maxima
Our results showed no significant difference in the growth performance parameters (p > 0.05) (Table 2). This indicates that microalgae supplementation did not limit or challenge the tilapia fry growth or survival. Additionally, the correlation analysis showed an association between the length and final weight of fish supplemented with 5% of Arthrospira maxima (R2 = 0.98). No other treatment or measurement presented a correlation (R2 < 0.95).
Table 2.
Parameters evaluated for growth performance of tilapia fry (Oreochromis niloticus) fed with different concentrations of microalgae supplement during the 2-month bioassays.
To our knowledge, few studies have tested the performance of A. maxima as a feed supplement for tilapia. Hence, our study pioneers the characterization of this microalga’s potential application in tilapia aquaculture. One related study demonstrated similar results, where A. maxima supplementation had no significant impact on most growth parameters [18]. Only the feed conversion ratio (FCR) differed in the 30% A. maxima supplementation treatment (1.87) [18]. Furthermore, diets with this microalga have been studied in other fish species, showing similar results. A study implementing A. maxima in the feed of Betta fish (Betta splendens) significantly affected growth when using 15% inclusion percentage [30].
Other Arthrospira species have been widely studied, especially A. platensis. Research has demonstrated a significant impact of A. platensis on tilapia growth performance [31]. An experiment testing 30%, 45%, 60% and 75% A. platensis supplementation found 30% treatment as the optimal diet [15]. Other treatments had a lower growth performance and decreased fish survival rates [15]. Moreover, FCR values for A. platensis supplementation range from 0.84–1.80, with 30% inclusion treatment holding the lowest value [16,32]. For A. maxima supplementation trials, a range of 1.87–2.09 FCR is reported [18]. Overall, our results showed FCR varying between 1.65–2.71, values notably above those found in literature. The lowest value (1.65 p > 0.05) resulted from 5% supplementation group.
Another important growth parameter is the specific growth ratio (SGR). To our knowledge, SGR has not been previously measured in studies involving A. maxima supplementation in tilapia fry aquaculture systems. However, SGR values for fish supplemented with A. platensis range from 2.64% to 4.64% [15,32]. In earlier studies, A. platensis was used to replace protein in commercial feeds, resulting in higher SGR values of 12.00% to 15.40% in a twice-enhanced feeding trial [16]. In our study, SGR values ranged from 10.1% to 10.4% (Table 2). These percentages are more comparable to those observed in the twice-enhanced feeding trials, rather than the lower values from A. platensis supplementation alone. This suggests that A. maxima may have a more significant impact on tilapia growth compared to A. platensis. However, this hypothesis requires further validation through a bioassay directly comparing the effects of both species in parallel.
The correlation analysis showing a strong association between the length and final weight in the 5% A. maxima group indicates that this specific supplementation level might have a positive relationship with growth consistency in tilapia fry, as higher R2 values suggest a strong linear relationship. However, since no other treatments or measurements showed a correlation (R2 < 0.95), it suggests that the 5% supplementation may be the most effective in promoting a balanced growth pattern, though overall effects may still be limited without significant differences across treatments. The 5% treatment consistently showed favorable trends, including notably high SGR values compared to other studies. Additionally, from a large-scale commercial perspective, achieving significant benefits with a lower amount of algae supplementation can be economically advantageous for producers.
Arthrospira maxima supplementation had a significant impact (p < 0.05) on the proximate composition of tilapia fry biomass (except for crude fiber and protein, p > 0.05) (Table 3). Protein content reached its highest value under the 10% treatment (14.5% ± 0.7), although it did not differ significantly from other groups. Total lipid percentage decreased as the percentage of microalgae supplementation increased, with the lowest values observed in the 10% and 15% treatments. This behavior is expected and has been reported by other authors [16,33]. Microalgae contain compounds such as polyphenols, which have fat-reducing properties, naturally lowering the lipid content in fish [33].
Table 3.
Proximate composition of tilapia fry biomass after A. maxima supplemented feed 2-month bioassays.
Similar studies found close values to those measured in our proximal analysis. With A. platensis supplementation, the protein and lipid content ranges from 14.34% to 16.40% (m/m) and 2.17% to 2.86% (m/m), respectively [15]. Interestingly, enhanced nutritional properties of tilapia fry are noticeable on 10–30% inclusion treatments [15,16]. Arthrospira is known to improve the digestive enzyme activity of tilapia fry, due to its phycocyanin and beta-carotene content [16]. Additionally, this microalga presents a cell wall composed mainly of peptidoglycan, a soft compound in comparison to cellulose. This characteristic favors a faster cell disruption and nutrient accessibility [32], which might be partially responsible for enhanced nutritional value of tilapia fry biomass.
Obtained values for proximal composition was within the range of healthy tilapia fish (protein = 13–25% and total lipids = 0.79–8.5%) [34]. Only carbohydrates showed a higher percentage than reported in literature (carbohydrates < 1%) [34]. The lower supplementation percentage (5%) did not exhibit a significant difference to the control group, avoiding alterations differently to the 15% and 10% percentages. The 15% and 10% treatments evidenced slightly higher values of protein (p > 0.05) (Table 3). Excess protein content of tilapia might indicate that fish is required to provide more energy for protein excretions rather than growth. Previous studies showed higher inclusion of crude protein to increase the excretion of nitrogenous compounds, without necessarily benefiting fish growth [35]. This might explain the slightly lower growth parameters values found in these treatments, in comparison to control group and 5% inclusion (Table 2). This statement is also supported by the estimated nutritional composition of experimental diets (Table 1). The energetic macromolecules (fat and carbohydrates) are decreased by the microalgae addition, while protein content increases. We consider higher inclusion percentages (10% and 15%) of A. maxima could be compromising the growth as less energetic sources are provided and the diets might have excess protein.
The 5% A. maxima supplementation treatment presented the most convenient values among the parameters: a similar protein and carbohydrates percentages to control group. Although a lipid decrease was expected by the addition of the microalgae, Arthrospira is part of the natural diet of Nile tilapia, as it is common in their natural environment [15]. Some studies have shown that Arthrospira can represent up to 25% of the organic matter consumed by wild tilapia [15]. We considered 5% might be a close value to the natural occurring in the control ponds, explaining the similarity to the control group.
These results indicate that 5% inclusion maintains the nutritional value of tilapia fry biomass. Therefore, considering the growth performance, proximate composition, and commercial feasibility, we suggest that 5% A. maxima supplementation is a promising candidate for further testing in scaling-up trials. This recommendation is similar to previously reported for A. platensis where lower inclusion percentage represented the ideal condition in tilapia and other fish species [16,36]. However, it is different from the one proposed for A. maxima (30% inclusion) [18].
Our study marks a new perspective in the potential of A. maxima as a feed supplement. We believe a slight supplementation of A. maxima favors the maintenance of nutritional quality biomass while improving growth rate in comparison to A. platensis. To dive deeper into the understanding of the microalgae inclusion effect on tilapia fry individuals, we evaluated the gut microbiota through a meta-amplicon approach.
3.2. Gastrointestinal Microbiota Community Composition of Tilapia Fry
The 12 tilapia fry gut samples were sequenced and a total of 1,444,700 sequences were obtained. After preprocessing, sequences were lowered to 857,317 reads, with an average of 71,443 ± 18,490 per sample. This represented a total number of 2970 amplicon sequence variants (ASVs). Rarefaction curves per sample revealed an asymptotic level before the 25,000 reads mark (Supplementary Figure S1). This suggests that estimated richness of ASVs was achieved completely in all samples.
After ensuring samples full estimated richness, taxonomy was assigned to detected ASVs. The gut microbiota of tilapia fry were dominated by two phyla: Fusobacteria (0.27–0.89 of relative abundance) and Proteobacteria (0.07–0.75) (Supplementary Figure S2). Fusobacteria was the most abundant phyla, with Proteobacteria overcoming in only two samples (5% supplementation, second replica, and 15% supplementation, second replica). Interestingly, other phyla presented a higher abundance when Proteobacteria was dominant. Among these, Actinobacteriota and Firmicutes achieve abundances ranging from 0.09–0.15 and 0.03–0.05, respectively.
Our results are consistent with those reported in literature. Fusobacteria, Proteobacteria, Actinobacteria, Planctomycetota, and Firmicutes phyla are commonly found in freshwater species [37]. Microbial co-occurrence networks of cichlids from America and Africa demonstrated major abundance of these phyla across samples [38]. These results provided the idea that these taxa are part of a core microbiota of Cichlidae family [38]. As expected, microbiota study of healthy wild and aquaculture tilapia fish showed the same gut microbial pattern [39,40,41]. However, regardless consistency, studies demonstrated an dysbiotic microbiota in diseased and fish exposed to contamination, particularly at genus level [39,40].
In the genera composition (Figure 1), Cetobacterium was the dominant genus in all samples (0.27–0.89), except for the second replica of 5% treatment (0.08). In this specific sample, Pseudomonas represented the most abundant genus (0.53). This result remains unsurprising as Cetobacterium is part of the Fusobacteria phylum, while Pseudomonas is a Proteobacteria. Both of these were the most abundant phyla in microbiota (Supplementary Figure S2). Moreover, other noticeable genera are Aeromonas (0–0.15, Proteobacteria), Ralstonia (0.001–0.15, Proteobacteria), Mycobacterium (0–0.05, Actinobacteriota), an unclassified genus from the Aeromonadaceae family (0–0.05, Proteobacteria), and Gemmobacter (0–0.02, Proteobacteria).

Figure 1.
Relative abundance of top 20 most abundant genera in the gut microbiota of tilapia fry fed with A. maxima supplemented feed. Associated number refers to the replica.
Cetobacterium, Aeromonas, Mycobacterium, and Gemmobacter are considered part of the core microbiota of tilapia fish [42,43,44]. Remarkably, Cetobacterium is thought to play a key role in tilapia gut. Although the exact function is unclear, its potential for macromolecules biosynthesis insights into a nutrition-related role [45,46,47]. Aeromonas is common in freshwater fish, however, some species represent opportunistic pathogens in tilapia [25]. Moreover, literature is consistent with the presence of Pseudomonas in microbiota of tilapia, in lesser abundance [48]. Interestingly, Ralstonia presented a higher abundance in 10% and 15% inclusion samples. Some studies have proposed that this genus is related to the cycling of nitrogen [49]. As mentioned above, 10% and 15% supplementation treatments presented a higher protein content, possibly indicating these fish to invest more energy in their excretions. Hence, increased Ralstonia abundance might be related to the metabolism of nitrogenous compounds on diets with higher microalgae content.
Other Arthrospira supplementation studies found congruent results. The microbiota among different treatments is composed mostly of Cetobacterium and Aeromonas [39]. Interestingly, this microbial composition was present in healthy fish and fish with probiotic inclusion [39,48]. Additionally, other fish species fed with Arthrospira supplemented feed had a similar microbiome profile [50]. Differently, previous studies have reported a great abundance of Escherichia, Propionibacterium, Plesiomonas and Deefgea in the gut tilapia that were not seen in our results [39,42,48].
It is relevant to remark that phyla and genera microbial composition is consistent among most replicates. This provides a noticeable pattern of the microbiome of tilapia fish fry. Moreover, inclusion of Arthrospira species in feed is widely studied, however, its effect on gut microbiota has only few research. Hence, we expect the microbial profile presented in our study to provide helpful insight for forthcoming research.
To statistically evaluate microbial composition, alpha diversity indexes of richness (Observed and Chao1), Shannon and Simpson were calculated. The supplementation with A. maxima did not seem to have a significant effect in alpha diversity (p > 0.05). The highest diversity value across indexes was found in 15% supplementation treatment, followed by 5% (Figure 2). Contrary, diversity in 10% treatment decreased in comparison with control group, compiling the lowest values.

Figure 2.
Alpha diversity indexes of richness (Observed, Chao1), Shannon and Simpson of the gut microbiota of tilapia fry fed with A. maxima supplemented feed. None of the values presented a significant difference per treatment (p > 0.05).
Previous studies evaluating Arthrospira feed supplementation had no significant difference in alpha diversity [42]. The gut microbiota of tilapia seems to be stable, as same pattern is present in studies of pre- and probiotics implementation. In this research, prebiotics had no significant effect on alpha diversity of gut microbiota whilst considerably improving growth performance of fish [48,51,52,53]. Interestingly, relevant changes in alpha diversity have mostly been reported in diseased or fish exposed to pollution, where dysbiosis is reported [39,54].
Our results describe a microbiota profile similar to literature reports. This suggests that tilapia gut presents a core microbiome consistent in transcontinental fish strains [38]. The stability of this microbiota is reflected in the lack of significant differences in alpha diversity, even in treatments of supplemented feed with proven beneficial additives. Contrary, pollution and illness seemed to severely affect gut microbial composition, causing dysbiosis [55]. We considered that microalgae inclusion had no negative effect in the fish microbiota as it follows similar profiles of healthy fish. Hence, implementation of Arthrospira maxima avoided dysbiosis of gut microbiota. Considering the significant effect of A. maxima on tilapia fry proximal composition discussed in previous sections, this is a desirable outcome. Overall, both aspects favor and fundament the proposal of A. maxima as feed supplement for production of tilapia.
To accesses the potential metabolic function of detected taxa in gut microbiota, we predicted associated pathways using PICRUST2 [27]. The most abundant metabolic pathways were aerobic respiration I (cytochrome C) (PWY-3781), pentose phosphate (non-oxidative branch, NONOXIPENT-PWY), pyruvate fermentation to isobutanol (PWY-7111), pyruvate fermentation to acetone (PWY-6588) and acetyl-CoA fermentation to butanoate (PWY-5676) (Figure 3). The major abundance of aerobic respiration pathways in gut (an anaerobic environment), although odd, might be attributed to presence of facultative anaerobes, as described for several species of Aeromonas [56]. Overall, the top 50 pathways annotated were related to biosynthesis of amino acids, nucleotides, lipids, and basic metabolic processes (e.g., respiration, glycolysis) (Supplementary Table S2). Among the top 50, one of the only catabolic pathways found were related to recycling of nitrogenated bases. Interestingly, this result tracks back to the presence of Ralstonia, associated to this function in the GI, and a potential excess of protein in 10% and 15% inclusion trials. Remarkably, Calvin-Benson-Bassham Cycle, a metabolic route related to carbon fixation in photosynthesis, was among the most abundant. This can be associated with the presence of digested microalgae in the microbiota.

Figure 3.
Top 50 most abundant predicted metabolic pathways annotated by PICRUST2. Values represent the averaged abundance of the samples triplicate. Pathway abbreviation can be found in the Supplementary Material.
The dominance of pathways related to metabolism remains unsurprising as it has been previously described in other fish species [57,58,59]. The supplementation of A. maxima had no significant effect on pathways abundances (p > 0.05). Although a clustering of 5% and 15% inclusion, and 10% and control group is clearly visible in the dendrogram. In this regard, 5% and 15% treatments present a lower abundance than 10% and control groups. We consider that a higher abundance of Cetobacterium genera in microbiota might be responsible for such results. As mentioned, Cetobacterium is considered part of core microbiota of freshwater fish. Previous studies have demonstrated that the genus is able to stabilize gut microbiota, gut barrier thigh junctions and produce vitamin B12 [60]. This proposed the idea of these species as potential probiotics, with promising results enhancing health and fish growth [46,61].
Additionally, 10% and control treatments presented less variation per sample, which indicates a more stable microbiota. A study of gill microbiome demonstrated that stability of microbiota is related with less opportunistic and potential pathogenic bacteria, overall, a better health [62]. We consider that clustering and higher abundance of metabolic pathways of 10% treatment and control group might be caused by a more stable microbiome.
In summary, the 5% inclusion of A. maxima seems like an optimal diet for enhancing nutritional quality of tilapia fry biomass. At this percentage, the growth performance of tilapia fry is not compromised. Additionally, the overall inclusion of the microalgae favors the microbiota stability and predominance of metabolic pathways of beneficial gut bacteria. However, it is worth remembering that PICRUST2 provides bioinformatic prediction based merely on 16S rRNA genes taxonomy. Results should be interpreted with caution as it will be necessary to have a more in-depth analysis based on wet-lab experiments, metabolomics, metatranscriptomics, among others, for further validation.
3.3. Arthrospira Maxima Supplementation Treatment Effect on Gut Microbiota
We evaluated different microbiota composition per treatment using a Principal Coordinate Analysis (PCoA) (Supplementary Figure S3) and a non-metric multidimensional scaling analysis (NMDS) (Figure 4), based on Bray–Curtis distances. Our results showed a differential clustering of those samples in the control group in comparison with treatments. The gut microbiota of tilapia fry supplemented with A. maxima seems to be similar among treatments, as they intertwined in the clustering (Figure 4). However, no significant differences were present in Bray–Curtis distances (p > 0.05).
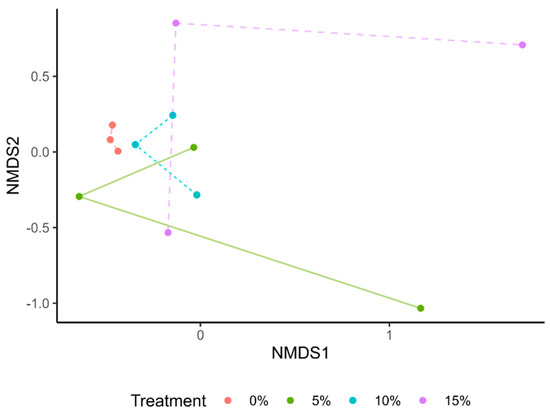
Figure 4.
Non-metric multidimensional scaling (NMDS) analysis of gut microbiota of tilapia fry. None of the values presented a significant difference per treatment (p > 0.05).
Similarly to alpha diversity, the clustering of gut microbiota seems to lack significant differences among treatments. A systematic review recovered several tilapia gut meta-amplicon taxonomies from pre- and probiotics supplementation trials [43]. The PCoA based on these sequences showed no clear grouping, as in our results [43]. However, NMDS analysis of healthy and diseased fish clustered samples differently according to health status [39]. These outcomes support the hypothesis of our fish not being negatively affected by A. maxima supplementation and the prevalence of a healthy microbiota.
To have a deeper understanding of how A. maxima supplementation affects the microbial composition of tilapia fry’s gut, we analyzed shared genera per treatment (Figure 5). A total of 63 genera were present in all samples, which might represent a core microbiome of fish gut. Interestingly, treatment-treatment samples overlap seemly present more shared taxa than treatment-control overlaps. This correlates with previous results, where treatments samples intertwined in NMDS analysis (Figure 4). Moreover, unique taxa per treatment were higher than those genera found only in the control group (Figure 5). Remarkably, the 15% supplementation treatment had 177 unique taxa. Overall, these results indicate a great variability in microbiota per treatment, with more unique genera in supplemented groups. Supplementary Table S3 encloses exclusive genera for each of the treatments.

Figure 5.
Genera shared among the gut of tilapia fry fed with A. maxima supplemented feed.
While reviewing literature, reports of functionality of some of the unique genera were found in different A. maxima supplementation studies. Regarding control group, Clostridium genus has been associated with opportunistic pathogens in microbiota [63]. In some cases, presence of Clostridium species is negatively correlated with production of relevant lipids, such as docosahexaenoic acid [57]. This brought the idea that fish in control group might present a higher abundance of potential pathogenic microorganisms, a hypothesis later explored.
Arthrospira maxima 5% supplementation treatment demonstrated the presence of several genera with reported positive effects in tilapia fish. Anaeromyxobacter is thought to be related with bioremediation of toxic compounds [64]. Deinococcus and Sediminibacterium presented a higher abundance in fish fed with probiotics [43,65]. Oscillochloris is a microalga used as probiotic in biofloc systems [66]. Blastopirellula abundance is significantly increased in fish with enhanced immune response [67]. Kocuria is capable of producing metabolites that inhibit tilapia pathogens [68]. Finally, Pseudorhodoplanes is a genus participating in the regulation of immune and metabolic tolerance under stressful conditions [69].
In 10% inclusion, the most remarkable genera with a positive impact in tilapia fish reported is Terrimicrobium. Previous studies have stated this bacterium to be benefited in bioflocs systems, as its relative abundance is significantly higher in fish fed with probiotics [70].
The 15% supplementation treatment although having a remarkable quantity of unique genera, only a few reported positive effects in tilapia fish. Bifidobacterium is commonly used as a probiotic [71]. Cellulomonas is thought to facilitate the digestion of cellulose by producing digestive enzymes [72]. Moreover, Enhydrobacter is a commensal genus in other fish species, producing antimicrobial compounds [73]. Additionally, some of the genera exhibit a higher abundance in fish fed with probiotics (Finegoldia, Nitrospira, Tepidimonas) [74,75], or produce an enhanced immune response (Rhodopirellula) [67].
It is noticeable that supplementation treatments compose a vast variety of unique beneficial bacteria genera, whereas the control group presents only genera with unknown function and potential pathogens. As mentioned above, this brought up the hypothesis of A. maxima supplementation significantly decreasing relative abundance of potential pathogens. In order to evaluate this idea, we extracted the abundances of common genera with reported pathogenicity in tilapia fish. According to Haenen et al. (2023), the most relevant bacterial infection in tilapia are streptococcosis (Streptococcus), aeromonasis (Aeromonas), francisellosis (Francisella), columnaris (Flavobacterium) and vibriosis (Vibrio) [25].
Neither Francisella nor Vibrio genera were present in our sample. Streptococcus genus was only present in the 10% A. maxima supplementation treatment, with a relative abundance of 0.00027. Streptococcosis is mostly caused by two microorganisms: S. iniae and S. agalactiae [25], whilst other Streptococcus species have even been reported as common probiotics in aquaculture [76]. Hence, we consider the Streptococcus presence in one sample (10% inclusion, second replica) at such low abundance to represent insufficient data to form conclusions regarding fish potential health.
Aeromonas and Flavobacterium genera presented a very significant difference in control group compared to supplementation treatments (p < 0.001) (Figure 6). Previous studies have demonstrated that Arthrospira supplementation can enhance the immune systems of tilapia [77,78,79]. The microalga significantly increases total erythrocyte and leukocyte count, hemoglobin percentage, packed cell volume, immunoglobin M, lysozyme, phagocytic activity, lymphocytes, and eosinophils [77,80]. These parameters are responsible for improving immune response. Specifically, some studies have reported an increase in disease resistance against pathogens such as Aeromonas hydrophila and A. veronii in Arthrospira supplemented diets [81,82]. Although our results cannot ensure a decreased abundance of pathogenic Aeromonas and Flavobacterium species, we report a trend consistent with the literature.
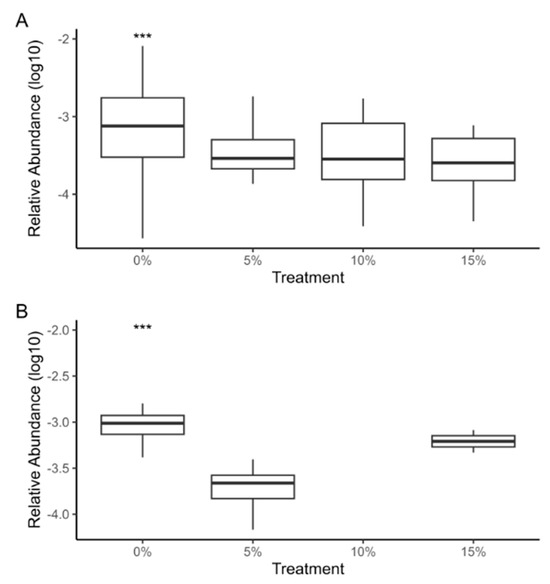
Figure 6.
The logarithmic relative abundance of Aeromonas (A) and Flavobacterium (B) genera in the gut microbiota of tilapia fry fed with A. maxima supplemented feed. The control group presented a very significant difference (p < 0.001) compared to other treatments, this is represented with “***”.
The enhanced immunological response of tilapia with Arthrospira-supplemented diets may, in part, be attributed to secondary and valuable metabolites of microalgae. The presence of (C-)phycocyanin is known to stimulate erythropoietin hormone production, enhancing hematopoiesis, and building immune capacity [77,79]. Moreover, studies have hypothesized that (C-)phycocyanin and polysaccharides play a role in growing leukocytes [83]. Other pigments from Arthrospira (e.g., carotenoids, chlorophyll) are known to possess high antioxidant capacity, reinforcing the oxidative stress response in tilapia [84,85,86]. Additionally, fatty acids from Arthrospira, specifically linoleic and gamma-linoleic, have been positively associated with immune cell activation [87]. Arthrospira also contains volatile hydrocarbons (e.g., heptadecane), which have demonstrated anti-inflammatory properties [88,89].
Antimicrobials compounds are common in Arthrospira species, supporting its biotechnological potential. Bioassays showed high antibacterial capacity, indicating that these microalgae could be promising food additives (as tested in this study) for enhanced disease resistance [90,91]. Interestingly, A. maxima produces a pectin which enhances resistance against pathogenic Aeromonas hydrophila and Edwardsiella piscicida [92].
Aquaculture technique has contributed to the rise in tilapia production to fulfill the global demand. However, intensive tilapia aquaculture comes with increases stress of cultured fish leading to a higher susceptibility to infectious diseases [93]. It has been estimated that the fish farming sector loses more than USD 6 billion annually [94,95]. Tilapia are considered relatively disease-resistant, although they remain highly susceptible to the pathogenic microorganisms described above. In order to deal with this challenge, the use of microalgae as immunostimulants has been proposed [96]. This measure favors the stability of a healthy microbiota in the intestinal tract, as here depicted by the inclusion of A. maxima in tilapia fish diet. The presence of these commensal microbes acts as an immune defense response by antagonizing the pathogens colonization, avoiding dysbiosis and further infections [93].
Previous studies evidenced that microalgae supplementation is able to significantly increase the white blood cell and platelet count, and percentage of lymphocytes in tilapia, key hematobiochemical parameters related to immune response [10]. More specifically, A. platensis nanoparticles inclusion significantly decreased the cumulative mortality of tilapia fish in bioassays with Aeromonas hydrophila infection [82]. Overall, the use of microalgae in aquaculture shows relevant results maintaining the stability of the gut microbiota as well as decreasing the severity of infectious diseases in tilapia. Hence, we consider it relevant to progressively study these beneficial microbes to develop modern solutions against the emerging challenges in aquaculture systems.
As presented, Arthrospira maxima supplementation improved the number of unique genera per treatment, with the highest number observed in the 15% inclusion group. Remarkably, all microbiomes with A. maxima supplementation exhibited unique genera with reported benefits for tilapia, whilst the control group genera had undefined functions and potential pathogens. This guides us to analyze how A. maxima affects the abundance of genera with potential pathogenic species. Our results showed a significant decrease in the relative abundance across all supplementation treatments. Although the presence and abundance of specific pathogenic species cannot be ensured, our results align with existing literature supporting our hypothesis. We considered, in agreement with other authors, that valuable compounds and secondary metabolites in A. maxima are partially responsible for decreased abundance. Additionally, the presence of beneficial genera in the microbiota composition might play a role in this dynamic.
4. Conclusions
Supplementation with Arthrospira maxima at 5% maintained the nutritional value of tilapia fry biomass and growth parameters comparable to the control group. Microalgae inclusion presented similar gut microbial composition to those reported for healthy tilapia and tilapia feed with pre- and probiotics. In this sense, Fusobacteria, Proteobacteria, Actinobacteria and Planctomycetota were the most abundant phyla, and Cetobacterium, Pseudomonas and Aeromonas the most representative genera. Functional predictions revealed a predominance of beneficial metabolic pathways with A. maxima supplementation. This might be associated with a more stable microbial composition in respective samples.
Microbiota composition was similar among inclusion treatments. Microalgae supplementation seems to favor the presence of beneficial species in the gastrointestinal tract. This was reflected in the description of exclusive genera per treatment, where the control group had fewer unique genera compared to A. maxima treatments. In this sense, the genera found in the control group had unknown functions in tilapia and included potential pathogens, while A. maxima-supplemented groups exhibited beneficial bacteria known to support the health of tilapia and other fish species. Further analysis showed that A. maxima inclusion significantly decreased the abundance of genera related to potential pathogens.
Given the emerging infectious diseases causing substantial losses to the global aquaculture sector, the continuous search for solutions remains highly relevant. The biotechnological application of microalgae and their natural products for enhancing the immune response, stabilizing the microbiota, and decreasing the severity of disease should be an area of great research interest. We propose that A. maxima supplementation might serve as a potential preventive measure against infectious diseases in tilapia. In this regard, a 5% A. maxima inclusion appears to be the optimal diet for achieving promising results.
Supplementary Materials
The following supporting information can be downloaded at: https://www.mdpi.com/article/10.3390/fishes9100374/s1, Supplementary Table S1: Summary of the number of sequences during each step of the preprocessing pipeline, Supplementary Figure S1: Rarefaction curves of observed features (amplicon sequence variants, ASVs) per sample. All the analyzed samples converged before reaching the 25,000 reads, indicating that ASV richness was obtained. The 5% supplementation is represented with letter “A”, 10% with “B”, 15% with “D” and the control group with “C”. Associated number to the sample refers to each of the triplicates, Supplementary Figure S2: Relative abundance of top 10 most abundant phyla in the gut microbiota of tilapia fry fed with A. maxima supplemented feed. Associated number refers to the replica, Supplementary Figure S3: Principal Coordinate Analysis of gut microbiota of tilapia fry. None of the values presented a significant difference per treatment (p > 0.05), Supplementary Table S2: Top 50 predicted metabolic pathways annotated with PICRUST, Supplementary Table S3: Unique genera in the gut microbiota of tilapia fry fed with A. maxima supplemented feed.
Author Contributions
Conceptualization, D.R.-V., O.G.-E., R.G.-W., F.M.-V., F.V.-R., F.V.-P., M.C., M.G. and K.N.-M.; methodology, D.R.-V., O.G.-E., R.G.-W., F.M.-V., F.V.-R., F.V.-P., M.C., M.G. and K.N.-M.; software, D.R.-V.; validation, D.R.-V., O.G.-E., R.G.-W., F.M.-V., F.V.-R., F.V.-P., M.C., M.G. and K.N.-M.; formal analysis, D.R.-V., O.G.-E., R.G.-W. and K.N.-M.; investigation, D.R.-V., O.G.-E., R.G.-W., F.M.-V., F.V.-R., F.V.-P., M.C., M.G. and K.N.-M.; resources, D.R.-V., O.G.-E., R.G.-W., F.M.-V., F.V.-R., F.V.-P., M.C., M.G. and K.N.-M.; data curation, D.R.-V., O.G.-E., R.G.-W., F.M.-V., F.V.-R., F.V.-P., M.C., M.G. and K.N.-M.; writing—original draft preparation, D.R.-V.; writing—review and editing, D.R.-V., O.G.-E., R.G.-W., F.M.-V., F.V.-R., F.V.-P., M.C., M.G. and K.N.-M.; visualization, D.R.-V., O.G.-E. and K.N.-M.; supervision, D.R.-V., O.G.-E., R.G.-W., F.M.-V., F.V.-R., F.V.-P., M.C., M.G. and K.N.-M.; project administration, O.G.-E., R.G.-W., F.M.-V., F.V.-R., F.V.-P., M.C., M.G. and K.N.-M.; funding acquisition, O.G.-E., R.G.-W., F.M.-V., F.V.-R., F.V.-P., M.C., M.G. and K.N.-M. All authors have read and agreed to the published version of the manuscript.
Funding
This research was funded by MIDEPLAN-EU grant 5402-1510-1040/9051-03 for project “Acuacultura descarbonizada: Mitigación de carbono mediante la generación de suplementos alimenticios con microalgas nativas”. Bioinformatic analysis of meta-amplicon data for bacterial community description was performed in collaboration with project grant ANID Fondecyt Iniciación 11230475 and ANID FONDECYT Postdoctorado 3230521.
Institutional Review Board Statement
The animal study protocol was approved by the Comité Institucional para el Cuidado y Uso de los Animales (C.I.C.U.A.) of University of Costa Rica (protocol CICUA-9-2023, 27 February 2023).
Informed Consent Statement
Not applicable.
Data Availability Statement
The original data presented in the study are openly available in the National Center for Biotechnology Information at PRJNA1105131 BioProject accession.
Acknowledgments
This research represents the bachelor’s dissertation of D.R.-V., and he would like to thank his tutors O.G.-E., K.N.-M., and R.G.-W. for their companionship and mentorship.
Conflicts of Interest
The authors declare no conflicts of interest.
Correction Statement
This article has been republished with a minor correction to the existing affiliation information. This change does not affect the scientific content of the article.
References
- Wang, M.; Lu, M. Tilapia Polyculture: A Global Review. Aquac. Res. 2016, 47, 2363–2374. [Google Scholar] [CrossRef]
- MacKinnon, B.; Debnath, P.P.; Bondad-Reantaso, M.G.; Fridman, S.; Bin, H.; Nekouei, O. Improving Tilapia Biosecurity through a Value Chain Approach. Rev. Aquac. 2023, 15, 57–91. [Google Scholar] [CrossRef]
- Han, P.; Lu, Q.; Fan, L.; Zhou, W. A Review on the Use of Microalgae for Sustainable Aquaculture. Appl. Sci. 2019, 9, 2377. [Google Scholar] [CrossRef]
- Hai, N. Van Research Findings from the Use of Probiotics in Tilapia Aquaculture: A Review. Fish. Shellfish. Immunol. 2015, 45, 592–597. [Google Scholar] [CrossRef]
- Haygood, A.M.; Jha, R. Strategies to Modulate the Intestinal Microbiota of Tilapia (Oreochromis sp.) in Aquaculture: A Review. Rev. Aquac. 2018, 10, 320–333. [Google Scholar] [CrossRef]
- Patras, D.; Moraru, C.V.; Socaciu, C. Bioactive Ingredients from Microalgae: Food and Feed Applications. Bull. Univ. Agric. Sci. Vet. Med. Cluj-Napoca Food Sci. Technol. 2019, 76, 1. [Google Scholar] [CrossRef]
- Patel, A.K.; Singhania, R.R.; Awasthi, M.K.; Varjani, S.; Bhatia, S.K.; Tsai, M.L.; Hsieh, S.L.; Chen, C.W.; Dong, C. Di Emerging Prospects of Macro- and Microalgae as Prebiotic. Microb. Cell Fact. 2021, 20, 112. [Google Scholar] [CrossRef]
- Oleskin, A.V.; Boyang, C. Microalgae in Terms of Biomedical Technology: Probiotics, Prebiotics, and Metabiotics. Appl. Biochem. Microbiol. 2022, 58, 813–825. [Google Scholar] [CrossRef]
- Sorokin, B.; Gusev, E.; Namsaraev, Z.; Emelianova, A.; Patova, E.; Novakovskaya, I.; Vinokurov, V.; Kuzmin, D. Effect of Microalgae Feed Supplementation on Growth Performance and Feeding Efficiency of Tilapia Fry. J. Appl. Phycol. 2024, 26, 1767–1780. [Google Scholar] [CrossRef]
- Amira, K.I.; Rahman, M.R.; Sikder, S.; Khatoon, H.; Afruj, J.; Haque, M.E.; Minhaz, T.M. Data on Growth, Survivability, Water Quality and Hemato-Biochemical Indices of Nile Tilapia (Oreochromis niloticus) Fry Fed with Selected Marine Microalgae. Data Brief. 2021, 38, 107422. [Google Scholar] [CrossRef]
- Ahamad Bustamam, M.S.; Pantami, H.A.; Shaari, K.; Min, C.C.; Mediani, A.; Ismail, I.S. Immunomodulatory Effects of Isochrysis Galbana Incorporated Diet on Oreochromis sp. (Red Hybrid Tilapia) via Sera-1H NMR Metabolomics Study. Fish. Shellfish. Immunol. 2023, 132, 108455. [Google Scholar] [CrossRef] [PubMed]
- Huang, Z.; Gao, J.; Peng, C.; Song, J.; Xie, Z.; Jia, J.; Li, H.; Zhao, S.; Liang, Y.; Gong, B. The Effect of the Microalgae Chlorella Vulgaris on the Gut Microbiota of Juvenile Nile Tilapia (Oreochromis niloticus) Is Feeding-Time Dependent. Microorganisms 2023, 11, 1002. [Google Scholar] [CrossRef] [PubMed]
- Alagawany, M.; Taha, A.E.; Noreldin, A.; El-Tarabily, K.A.; Abd El-Hack, M.E. Nutritional Applications of Species of Spirulina and Chlorella in Farmed Fish: A Review. Aquaculture 2021, 542, 736841. [Google Scholar] [CrossRef]
- Chang, M.; Liu, K. Arthrospira platensis as Future Food: A Review on Functional Ingredients, Bioactivities and Application in the Food Industry. Int. J. Food Sci. Technol. 2024, 59, 1197–1212. [Google Scholar] [CrossRef]
- Velasquez, S.F.; Chan, M.A.; Abisado, R.G.; Traifalgar, R.F.M.; Tayamen, M.M.; Maliwat, G.C.F.; Ragaza, J.A. Dietary Spirulina (Arthrospira platensis) Replacement Enhances Performance of Juvenile Nile Tilapia (Oreochromis niloticus). J. Appl. Phycol. 2016, 28, 1023–1030. [Google Scholar] [CrossRef]
- AlMulhim, N.M.; Virk, P.; Abdelwarith, A.A.; AlKhulaifi, F.M. Effect of Incorporation of Spirulina platensis into Fish Diets, on Growth Performance and Biochemical Composition of Nile Tilapia, Oreochromis niloticus. Egypt. J. Aquat. Res. 2023, 49, 537–541. [Google Scholar] [CrossRef]
- López-Rodríguez, A.; Mayorga, J.; Flaig, D.; Fuentes, G.; Cotabarren, J.; Obregón, W.D.; Gómez, P.I. Comparison of Two Strains of the Edible Cyanobacteria Arthrospira: Biochemical Characterization and Antioxidant Properties. Food Biosci. 2021, 42, 101144. [Google Scholar] [CrossRef]
- Rincón, D.D.; Velásquez, H.A.; Dávila, M.J.; Semprún, A.M.; Morales, E.D.; Hernández, J.L. Substitution Levels of Fish Meal by Arthrospira (=Spirulina) maxima Meal in Experimental Diets for Red Tilapia Fingerlings (Oreochromis sp.). Rev. Colomb. Cienc. Pecu. 2012, 25, 430–437. [Google Scholar] [CrossRef]
- Poveda-Víquez, G.; Villalta-Romero, F.; Murillo-Vega, F.; Guerrero-Barrantes, M.; Salas-Durán, C. Effect of Inclusion of Arthrospira maxima Microalgae in Laying Hen Diets on Production Parameters and Egg Characteristics. Braz. J. Poult. Sci. 2023, 25, eRBCA-2022-1753. [Google Scholar] [CrossRef]
- Callahan, B.J.; McMurdie, P.J.; Rosen, M.J.; Han, A.W.; Johnson, A.J.A.; Holmes, S.P. DADA2: High-Resolution Sample Inference from Illumina Amplicon Data. Nat. Methods 2016, 13, 581–583. [Google Scholar] [CrossRef]
- R Core Team R: A Language and Environment for Statistical Computing; R Foundation for Statistical Computing: Vienna, Austria. 2021. Available online: https://www.R-project.org/ (accessed on 11 March 2024).
- Quast, C.; Pruesse, E.; Yilmaz, P.; Gerken, J.; Schweer, T.; Yarza, P.; Peplies, J.; Glöckner, F.O. The SILVA Ribosomal RNA Gene Database Project: Improved Data Processing and Web-Based Tools. Nucleic Acids Res. 2013, 41, D590–D596. [Google Scholar] [CrossRef] [PubMed]
- McMurdie, P.J.; Holmes, S. Phyloseq: An R Package for Reproducible Interactive Analysis and Graphics of Microbiome Census Data. PLoS ONE 2013, 8, e61217. [Google Scholar] [CrossRef]
- Oksanen, J.; Simpson, G.L.; Blanchet, F.G.; Kindt, R.; Legendre, P.; Minchin, P.R.; O’Hara, R.B.; Solymos, P.; Stevens, M.H.H.; Szoecs, E.; et al. Vegan: Community Ecology Package 2024. Available online: https://cran.r-project.org/web/packages/vegan/vegan.pdf (accessed on 11 March 2024).
- Haenen, O.L.M.; Dong, H.T.; Hoai, T.D.; Crumlish, M.; Karunasagar, I.; Barkham, T.; Chen, S.L.; Zadoks, R.; Kiermeier, A.; Wang, B.; et al. Bacterial Diseases of Tilapia, Their Zoonotic Potential and Risk of Antimicrobial Resistance. Rev. Aquac. 2023, 15, 154–185. [Google Scholar] [CrossRef]
- Wickham, H. Ggplot2: Elegant Graphics for Data Analysis; Springer: New York, NY, USA, 2016. [Google Scholar]
- Douglas, G.M.; Maffei, V.J.; Zaneveld, J.R.; Yurgel, S.N.; Brown, J.R.; Taylor, C.M.; Huttenhower, C.; Langille, M.G.I. PICRUSt2 for Prediction of Metagenome Functions. Nat. Biotechnol. 2020, 38, 685–688. [Google Scholar] [CrossRef] [PubMed]
- Kolde, R. Pheatmap: Pretty Heatmaps. R Package Version 2019; Volume 1, p. 726. Available online: https://scholar.google.com/citations?view_op=view_citation&hl=en&user=IYhbHFMAAAAJ&citation_for_view=IYhbHFMAAAAJ:M3NEmzRMIkIC (accessed on 11 March 2024).
- Barnett, D.J.M.; Arts, I.C.W.; Penders, J. MicroViz: An R Package for Microbiome Data Visualization and Statistics. J. Open Source Softw. 2021, 6, 3201. [Google Scholar] [CrossRef]
- Patria, M.P.; Amanda, S.P.; Susanti, H.; Susilaningsih, D.; Taufikurahman, T. Growth Response and Color Brightness of Betta Fish (Betta splendens (Regan, 1910)) Supplemented by Spirulina Powder from Algae Arthrospira maxima (Setchell and N. L. Gardner 1917)). J. Agric. Sci. Technol. 2024, 26, 73–83. [Google Scholar] [CrossRef]
- Barraza-Guardado, R.H.; Pérez-Villalba, A.M.; González-Félix, M.L.; Ortega-Urbina, J.A.T.; Muñoz-Hernández, R.; Zúñiga-Panduro, M.; Perez-Velazquez, M.; Barraza-Guardado, R.H.; Pérez-Villalba, A.M.; González-Félix, M.L.; et al. Uso de Microalgas Como Constituyentes Parciales Del Alimento Balanceado Para Engorda de Tilapia (Oreochromis niloticus). Biotecnia 2020, 22, 135–141. [Google Scholar] [CrossRef]
- Teuling, E.; Schrama, J.W.; Gruppen, H.; Wierenga, P.A. Effect of Cell Wall Characteristics on Algae Nutrient Digestibility in Nile Tilapia (Oreochromis niloticus) and African Catfish (Clarus gariepinus). Aquaculture 2017, 479, 490–500. [Google Scholar] [CrossRef]
- Mohammadiazarm, H.; Maniat, M.; Ghorbanijezeh, K.; Ghotbeddin, N. Effects of Spirulina Powder (Spirulina platensis) as a Dietary Additive on Oscar Fish, Astronotus Ocellatus: Assessing Growth Performance, Body Composition, Digestive Enzyme Activity, Immune-Biochemical Parameters, Blood Indices and Total Pigmentation. Aquac. Nutr. 2021, 27, 252–260. [Google Scholar] [CrossRef]
- Hernández-Sánchez, F.; Aguilera-Morales, M.E. Nutritional Richness and Importance of the Consumption of Tilapia in the Papaloapan Region. Rev. Electrónica Vet. 2012, 13, 1–12. [Google Scholar]
- López-Tejeida, S.; García-Trejo, J.F.; Félix-Cuencas, L.; De León-Ramírez, J.J.; Villegas-Villegas, M.; Flores-Tejeida, L.B. Nitrogen Excretion and Oxygen Consumption on Hyper Intensive Tilapia Oreochromis niloticus Culture Using Three Different Commercial Diets. Lat. Am. J. Aquat. Res. 2020, 48, 836–846. [Google Scholar] [CrossRef]
- Mamun, M.A.; Hossain, M.A.; Saha, J.; Khan, S.; Akter, T.; Banu, M.R. Effects of Spirulina Spirulina platensis Meal as a Feed Additive on Growth Performance and Immunological Response of Gangetic Mystus Mystus Cavasius. Aquac. Rep. 2023, 30, 101553. [Google Scholar] [CrossRef]
- Gallet, A.; Yao, E.K.; Foucault, P.; Bernard, C.; Quiblier, C.; Humbert, J.F.; Coulibaly, J.K.; Troussellier, M.; Marie, B.; Duperron, S. Fish Gut-Associated Bacterial Communities in a Tropical Lagoon (Aghien Lagoon, Ivory Coast). Front. Microbiol. 2022, 13, 963456. [Google Scholar] [CrossRef] [PubMed]
- Riera, J.L.; Baldo, L. Microbial Co-Occurrence Networks of Gut Microbiota Reveal Community Conservation and Diet-Associated Shifts in Cichlid Fishes. Anim. Microbiome 2020, 2, 36. [Google Scholar] [CrossRef]
- Ofek, T.; Lalzar, M.; Izhaki, I.; Halpern, M. Intestine and Spleen Microbiota Composition in Healthy and Diseased Tilapia. Anim. Microbiome 2022, 4, 50. [Google Scholar] [CrossRef] [PubMed]
- Bereded, N.K.; Curto, M.; Domig, K.J.; Abebe, G.B.; Fanta, S.W.; Waidbacher, H.; Meimberg, H. Metabarcoding Analyses of Gut Microbiota of Nile Tilapia (Oreochromis niloticus) from Lake Awassa and Lake Chamo, Ethiopia. Microorganisms 2020, 8, 1040. [Google Scholar] [CrossRef]
- Fan, L.; Chen, J.; Meng, S.; Song, C.; Qiu, L.; Hu, G.; Xu, P. Characterization of Microbial Communities in Intensive GIFT Tilapia (Oreochromis niloticus) Pond Systems during the Peak Period of Breeding. Aquac. Res. 2017, 48, 459–472. [Google Scholar] [CrossRef]
- Plaza, I.; García, J.L.; Galán, B.; de la Fuente, J.; Bermejo-Poza, R.; Villarroel, M. Effect of Arthrospira Supplementation on Oreochromis niloticus Gut Microbiota and Flesh Quality. Aquac. Res. 2019, 50, 1448–1458. [Google Scholar] [CrossRef]
- Martinez-Porchas, M.; Preciado-Álvarez, A.; Vargas-Albores, F.; Gracia-Valenzuela, M.H.; Cicala, F.; Martinez-Cordova, L.R.; Medina-Félix, D.; Garibay-Valdez, E. Microbiota Plasticity in Tilapia Gut Revealed by Meta-Analysis Evaluating the Effect of Probiotics, Prebiotics, and Biofloc. PeerJ 2023, 11, e16213. [Google Scholar] [CrossRef]
- Wang, M.; Fan, Z.; Zhang, Z.; Yi, M.; Liu, Z.; Ke, X.; Gao, F.; Cao, J.; Lu, M. Effects of Diet on the Gut Microbial Communities of Nile Tilapia (Oreochromis niloticus) Across Their Different Life Stages. Front. Mar. Sci. 2022, 9, 926132. [Google Scholar] [CrossRef]
- Zhang, Z.; Fan, Z.; Yi, M.; Liu, Z.; Ke, X.; Gao, F.; Cao, J.; Wang, M.; Chen, G.; Lu, M. Characterization of the Core Gut Microbiota of Nile Tilapia (Oreochromis niloticus): Indication of a Putative Novel Cetobacterium Species and Analysis of Its Potential Function on Nutrition. Arch. Microbiol. 2022, 204, 690. [Google Scholar] [CrossRef] [PubMed]
- Colorado Gómez, M.A.; Melo-Bolívar, J.F.; Ruíz Pardo, R.Y.; Rodriguez, J.A.; Villamil, L.M. Unveiling the Probiotic Potential of the Anaerobic Bacterium Cetobacterium sp. Nov. C33 for Enhancing Nile Tilapia (Oreochromis niloticus) Cultures. Microorganisms 2023, 11, 2922. [Google Scholar] [CrossRef] [PubMed]
- Zhu, H.; Qiang, J.; Li, Q.; Nie, Z.; Gao, J.; Sun, Y.; Xu, G. Multi-Kingdom Microbiota and Functions Changes Associated with Culture Mode in Genetically Improved Farmed Tilapia (Oreochromis niloticus). Front. Physiol. 2022, 13, 974398. [Google Scholar] [CrossRef] [PubMed]
- Zhai, Q.; Yu, L.; Li, T.; Zhu, J.; Zhang, C.; Zhao, J.; Zhang, H.; Chen, W. Effect of Dietary Probiotic Supplementation on Intestinal Microbiota and Physiological Conditions of Nile Tilapia (Oreochromis niloticus) under Waterborne Cadmium Exposure. Antonie Van Leeuwenhoek 2017, 110, 501–513. [Google Scholar] [CrossRef]
- Zhou, J.S.; Cheng, J.F.; Li, X.D.; Li, Y.H. Unique Bacterial Communities Associated with Components of an Artificial Aquarium Ecosystem and Their Possible Contributions to Nutrient Cycling in This Microecosystem. World J. Microbiol. Biotechnol. 2022, 38, 72. [Google Scholar] [CrossRef]
- Rosenau, S.; Oertel, E.; Mott, A.C.; Tetens, J. The Effect of a Total Fishmeal Replacement by Arthrospira platensis on the Microbiome of African Catfish (Clarias gariepinus). Life 2021, 11, 558. [Google Scholar] [CrossRef]
- Zheng, Y.; Wu, W.; Hu, G.; Qiu, L.; Meng, S.; Song, C.; Fan, L.; Zhao, Z.; Bing, X.; Chen, J. Gut Microbiota Analysis of Juvenile Genetically Improved Farmed Tilapia (Oreochromis niloticus) by Dietary Supplementation of Different Resveratrol Concentrations. Fish. Shellfish. Immunol. 2018, 77, 200–207. [Google Scholar] [CrossRef]
- Xia, Y.; Lu, M.; Chen, G.; Cao, J.; Gao, F.; Wang, M.; Liu, Z.; Zhang, D.; Zhu, H.; Yi, M. Effects of Dietary Lactobacillus rhamnosus JCM1136 and Lactococcus lactis subsp. lactis JCM5805 on the Growth, Intestinal Microbiota, Morphology, Immune Response and Disease Resistance of Juvenile Nile Tilapia, Oreochromis niloticus. Fish. Shellfish. Immunol. 2018, 76, 368–379. [Google Scholar] [CrossRef]
- Yu, L.; Qiao, N.; Li, T.; Yu, R.; Zhai, Q.; Tian, F.; Zhao, J.; Zhang, H.; Chen, W. Dietary Supplementation with Probiotics Regulates Gut Microbiota Structure and Function in Nile Tilapia Exposed to Aluminum. PeerJ 2019, 2019, e6963. [Google Scholar] [CrossRef]
- Paimeeka, S.; Tangsongcharoen, C.; Lertwanakarn, T.; Setthawong, P.; Bunkhean, A.; Tangwattanachuleeporn, M.; Surachetpong, W. Tilapia Lake Virus Infection Disrupts the Gut Microbiota of Red Hybrid Tilapia (Oreochromis spp.). Aquaculture 2024, 586, 740752. [Google Scholar] [CrossRef]
- Medina-Felix, D.; Vargas-Albores, F.; Garibay-Valdez, E.; Martínez-Córdova, L.R.; Martínez-Porchas, M. Gastrointestinal Dysbiosis Induced by Nocardia sp. Infection in Tilapia. Comp. Biochem. Physiol. Part D Genom. Proteom. 2024, 49, 101154. [Google Scholar] [CrossRef] [PubMed]
- Sugita, H.; Kitao, S.; Narisawa, S.; Minamishima, R.; Itoi, S. Diversity of Culturable Bacterial Communities in the Intestinal Tracts of Goldfish (Carassius auratus) and Their Ability to Produce N-Acyl Homoserine Lactone. Folia Microbiol. 2017, 62, 263–267. [Google Scholar] [CrossRef] [PubMed]
- Wu, Z.; Zhang, Q.; Lin, Y.; Hao, J.; Wang, S.; Zhang, J.; Li, A.; Wu, Z.; Zhang, Q.; Lin, Y.; et al. Taxonomic and Functional Characteristics of the Gill and Gastrointestinal Microbiota and Its Correlation with Intestinal Metabolites in NEW GIFT Strain of Farmed Adult Nile Tilapia (Oreochromis niloticus). Microorganisms 2021, 9, 617. [Google Scholar] [CrossRef] [PubMed]
- Luo, M.; An, R.; Fu, J.; Wan, S.; Zhu, W.; Wang, L.; Dong, Z. Comparative Analysis of the Gut Microbiota in Bighead Carp under Different Culture Patterns. J. Appl. Microbiol. 2022, 132, 1357–1369. [Google Scholar] [CrossRef]
- Morales-Rivera, M.F.; Valenzuela-Miranda, D.; Nuñez-Acuña, G.; Benavente, B.P.; Gallardo-Escárate, C.; Valenzuela-Muñoz, V. Atlantic Salmon (Salmo Salar) Transfer to Seawater by Gradual Salinity Changes Exhibited an Increase in The Intestinal Microbial Abundance and Richness. Microorganisms 2023, 11, 76. [Google Scholar] [CrossRef]
- Qi, X.; Zhang, Y.; Zhang, Y.; Luo, F.; Song, K.; Wang, G.; Ling, F. Vitamin B12 Produced by Cetobacterium somerae Improves Host Resistance against Pathogen Infection through Strengthening the Interactions within Gut Microbiota. Microbiome 2023, 11, 135. [Google Scholar] [CrossRef]
- Xie, M.; Xie, Y.; Li, Y.; Zhou, W.; Zhang, Z.; Yang, Y.; Olsen, R.E.; Ringø, E.; Ran, C.; Zhou, Z. Stabilized Fermentation Product of Cetobacterium somerae Improves Gut and Liver Health and Antiviral Immunity of Zebrafish. Fish. Shellfish. Immunol. 2022, 120, 56–66. [Google Scholar] [CrossRef]
- Dahle, S.W.; Bakke, I.; Birkeland, M.; Nordøy, K.; Dalum, A.S.; Attramadal, K.J.K. Production of Lumpfish (Cyclopterus lumpus L.) in RAS with Distinct Water Treatments: Effects on Fish Survival, Growth, Gill Health and Microbial Communities in Rearing Water and Biofilm. Aquaculture 2020, 522, 735097. [Google Scholar] [CrossRef]
- El-Houseiny, W.; Khalil, A.A. The Effects of Toxigenic Clostridium Perfringens Types A and D on Survival, as Well as Innate Immune, Inflammatory and Oxidative Stress Responses in Nile Tilapia. Aquaculture 2020, 529, 735694. [Google Scholar] [CrossRef]
- Zhou, M.; Wan, Q.; Sarath Babu, V.; Qiu, Q.; Kou, H.; Lin, C.; Zhao, L.; Yang, L.; Li, J.; Huang, Y.; et al. Bacterial Features in Tilapia (Oreochromis niloticus) and Environments in a Goose-Tilapia Polyculture Model. Aquaculture 2018, 497, 313–319. [Google Scholar] [CrossRef]
- Giatsis, C.; Sipkema, D.; Ramiro-Garcia, J.; Bacanu, G.M.; Abernathy, J.; Verreth, J.; Smidt, H.; Verdegem, M. Probiotic Legacy Effects on Gut Microbial Assembly in Tilapia Larvae. Sci. Rep. 2016, 6, 33965. [Google Scholar] [CrossRef] [PubMed]
- McCusker, S.; Warberg, M.B.; Davies, S.J.; Valente, C.d.S.; Johnson, M.P.; Cooney, R.; Wan, A.H.L. Biofloc Technology as Part of a Sustainable Aquaculture System: A Review on the Status and Innovations for Its Expansion. Aquac. Fish Fish. 2023, 3, 331–352. [Google Scholar] [CrossRef]
- Zheng, Y.; Wu, W.; Hu, G.; Qiu, L.; Bing, X.; Chen, J. Varieties of Immunity Activities and Gut Contents in Tilapia with Seasonal Changes. Fish. Shellfish. Immunol. 2019, 90, 466–476. [Google Scholar] [CrossRef] [PubMed]
- Deutsch, Y.; Samara, M.; Nasser, A.; Berman-Frank, I.; Ezra, D. Kocuria Flava, a Bacterial Endophyte of the Marine Macroalga Bryopsis plumosa, Emits 8-Nonenoic Acid Which Inhibits the Aquaculture Pathogen Saprolegnia parasitica. Mar. Drugs 2023, 21, 476. [Google Scholar] [CrossRef] [PubMed]
- Zhao, Z.; Zou, Q.; Han, S.; Shi, J.; Yan, H.; Hu, D.; Yi, Y. Omics Analysis Revealed the Possible Mechanism of Streptococcus Disease Outbreak in Tilapia under High Temperature. Fish. Shellfish. Immunol. 2023, 134, 108639. [Google Scholar] [CrossRef]
- Deng, Y.; Borewicz, K.; van Loo, J.; Olabarrieta, M.Z.; Kokou, F.; Sipkema, D.; Verdegem, M.C.J. In-Situ Biofloc Affects the Core Prokaryotes Community Composition in Gut and Enhances Growth of Nile Tilapia (Oreochromis niloticus). Microb. Ecol. 2022, 84, 879–892. [Google Scholar] [CrossRef]
- Sholihuddin, T.D.; Arief, M.; Kenconojati, H. Effect of Different Bacterial Strain in Probiotics on the Growth Performance of Nile Tilapia (Oreochromis niloticus). IOP Conf. Ser. Earth Environ. Sci. 2020, 441, 012072. [Google Scholar] [CrossRef]
- Chovatiya, S.; Ingle, S.; Patel, D.; Thakkar, B. Isolation of Bacteria Producing Cellulase from Tilapia Fish Gut and Media Optimization for Celluase Production Using Plackett Burman Design. Int. J. Biotech. Trends Technol. 2017, 7, 13–18. [Google Scholar] [CrossRef]
- Abdelhafiz, Y.; Fernandes, J.M.O.; Larger, S.; Albanese, D.; Donati, C.; Jafari, O.; Nedoluzhko, A.V.; Kiron, V. Breeding Strategy Shapes the Composition of Bacterial Communities in Female Nile Tilapia Reared in a Recirculating Aquaculture System. Front. Microbiol. 2021, 12, 709611. [Google Scholar] [CrossRef]
- Xu, C.; Suo, Y.; Wang, X.; Qin, J.G.; Chen, L.; Li, E. Recovery from Hypersaline-Stress-Induced Immunity Damage and Intestinal-Microbiota Changes through Dietary β-Glucan Supplementation in Nile Tilapia (Oreochromis niloticus). Animals 2020, 10, 2243. [Google Scholar] [CrossRef]
- Wang, M.; Yi, M.; Lu, M.; Gao, F.; Liu, Z.; Huang, Q.; Li, Q.; Zhu, D. Effects of Probiotics Bacillus Cereus NY5 and Alcaligenes faecalis Y311 Used as Water Additives on the Microbiota and Immune Enzyme Activities in Three Mucosal Tissues in Nile Tilapia Oreochromis niloticus Reared in Outdoor Tanks. Aquac. Rep. 2020, 17, 100309. [Google Scholar] [CrossRef]
- Tyagi, A.; Singh, B. Microbial Diversity in Rohu Fish Gut and Inland Saline Aquaculture Sediment and Variations Associated with Next-Generation Sequencing of 16S RRNA Gene. J. Fish. Life Sci. 2017, 2, 1–8. [Google Scholar]
- Youssef, I.M.I.; Saleh, E.S.E.; Tawfeek, S.S.; Abdel-Fadeel, A.A.A.; Abdel-Razik, A.R.H.; Abdel-Daim, A.S.A. Effect of Spirulina platensis on Growth, Hematological, Biochemical, and Immunological Parameters of Nile Tilapia (Oreochromis niloticus). Trop. Anim. Health Prod. 2023, 55, 275. [Google Scholar] [CrossRef]
- Awad, L.Z.; El-Mahallawy, H.S.; Abdelnaeim, N.S.; Mahmoud, M.M.A.; Dessouki, A.A.; ElBanna, N.I. Role of Dietary Spirulina platensis and Betaine Supplementation on Growth, Hematological, Serum Biochemical Parameters, Antioxidant Status, Immune Responses, and Disease Resistance in Nile Tilapia. Fish. Shellfish. Immunol. 2022, 126, 122–130. [Google Scholar] [CrossRef] [PubMed]
- Abdalla, O.; Eissa, I.; Kilany, O.; Elbahar, S. Advanced Immunological Studies on the Effect of Spirulina in Cultured Tilap. Suez Canal Vet. Med. J. 2014, 19, 55–70. [Google Scholar] [CrossRef]
- Hegazi, S.; Fadl, S.; Gad, D.M.; Abeer, E.-K.M.S. Effect of Spirulina Incorporated in Diets of Tilapia Nilotica Fresh Water Fish Exposed to Lead Toxicity. J. Vet. Sci. 2014, 1, 633–649. [Google Scholar]
- Elabd, H.; Wang, H.P.; Shaheen, A.; Matter, A. Nano Spirulina Dietary Supplementation Augments Growth, Antioxidative and Immunological Reactions, Digestion, and Protection of Nile Tilapia, Oreochromis niloticus, against Aeromonas Veronii and Some Physical Stressors. Fish. Physiol. Biochem. 2020, 46, 2143–2155. [Google Scholar] [CrossRef]
- Mabrouk, M.M.; Ashour, M.; Labena, A.; Zaki, M.A.A.; Abdelhamid, A.F.; Gewaily, M.S.; Dawood, M.A.O.; Abualnaja, K.M.; Ayoub, H.F. Nanoparticles of Arthrospira platensis Improves Growth, Antioxidative and Immunological Responses of Nile Tilapia (Oreochromis niloticus) and Its Resistance to Aeromonas Hydrophila. Aquac. Res. 2022, 53, 125–135. [Google Scholar] [CrossRef]
- Seyidoglu, N.; Galip, N.; Budak, F.; Uzabaci, E.; Seyidoglu, N.; Galip, N.; Budak, F.; Uzabaci, E. The Effects of Spirulina platensis (Arthrospira platensis) and Saccharomyces Cerevisiae on the Distribution and Cytokine Production of CD4+ and CD8+ T-Lymphocytes in Rabbits. Austral J. Vet. Sci. 2017, 49, 185–190. [Google Scholar] [CrossRef]
- Giorgis, M.; Garella, D.; Cena, C.; Boffa, L.; Cravotto, G.; Marini, E. An Evaluation of the Antioxidant Properties of Arthrospira Maxima Extracts Obtained Using Non-Conventional Techniques. Eur. Food Res. Technol. 2017, 243, 227–237. [Google Scholar] [CrossRef]
- Park, W.S.; Kim, H.J.; Li, M.; Lim, D.H.; Kim, J.; Kwak, S.S.; Kang, C.M.; Ferruzzi, M.G.; Ahn, M.J. Two Classes of Pigments, Carotenoids and C-Phycocyanin, in Spirulina Powder and Their Antioxidant Activities. Molecules 2018, 23, 2065. [Google Scholar] [CrossRef] [PubMed]
- Taalab, H.A.; Mohammady, E.Y.; Hassan, T.M.M.; Abdella, M.M.; Hassaan, M.S. β-Carotene of Arthrospira platensis versus Vitamin C and Vitamin E as a Feed Supplement: Effects on Growth, Haemato-Biochemical, Immune-Oxidative Stress and Related Gene Expression of Nile Tilapia Fingerlings. Aquac. Res. 2022, 53, 4832–4846. [Google Scholar] [CrossRef]
- Huh, J.; Zhang, J.; Hauerová, R.; Lee, J.; Haider, S.; Wang, M.; Hauer, T.; Khan, I.A.; Chittiboyina, A.G.; Pugh, N.D. Utility of ty Acid Profile and in Vitro Immune Cell Activation for Chemical and Biological Standardization of Arthrospira/Limnospira. Sci. Rep. 2022, 12, 15657. [Google Scholar] [CrossRef] [PubMed]
- Kim, D.H.; Park, M.H.; Choi, Y.J.; Chung, K.W.; Park, C.H.; Jang, E.J.; An, H.J.; Yu, B.P.; Chung, H.Y. Molecular Study of Dietary Heptadecane for the Anti-Inflammatory Modulation of NF-KB in the Aged Kidney. PLoS ONE 2013, 8, e59316. [Google Scholar] [CrossRef] [PubMed]
- Taiti, C.; Vito, M.D.; Mercurio, M.D.; Costantini, L.; Merendino, N.; Sanguinetti, M.; Bugli, F.; Garzoli, S. Detection of Secondary Metabolites, Proximate Composition and Bioactivity of Organic Dried Spirulina (Arthrospira platensis). Appl. Sci. 2023, 14, 67. [Google Scholar] [CrossRef]
- Esquivel-Hernández, D.A.; Rodríguez-Rodríguez, J.; Rostro-Alanis, M.; Cuéllar-Bermúdez, S.P.; Mancera-Andrade, E.I.; Núñez-Echevarría, J.E.; García-Pérez, J.S.; Chandra, R.; Parra-Saldívar, R. Advancement of Green Process through Microwave-Assisted Extraction of Bioactive Metabolites from Arthrospira platensis and Bioactivity Evaluation. Bioresour. Technol. 2017, 224, 618–629. [Google Scholar] [CrossRef]
- Sukhikh, S.; Prosekov, A.; Ivanova, S.; Maslennikov, P.; Andreeva, A.; Budenkova, E.; Kashirskikh, E.; Tcibulnikova, A.; Zemliakova, E.; Samusev, I.; et al. Identification of Metabolites with Antibacterial Activities by Analyzing the FTIR Spectra of Microalgae. Life 2022, 12, 1395. [Google Scholar] [CrossRef]
- Edirisinghe, S.L.; Dananjaya, S.H.S.; Nikapitiya, C.; Liyanage, T.D.; Lee, K.A.; Oh, C.; Kang, D.H.; De Zoysa, M. Novel Pectin Isolated from Spirulina maxima Enhances the Disease Resistance and Immune Responses in Zebrafish against Edwardsiella piscicida and Aeromonas hydrophila. Fish. Shellfish. Immunol. 2019, 94, 558–565. [Google Scholar] [CrossRef]
- Debnath, S.C.; McMurtrie, J.; Temperton, B.; Delamare-Deboutteville, J.; Mohan, C.V.; Tyler, C.R. Tilapia Aquaculture, Emerging Diseases, and the Roles of the Skin Microbiomes in Health and Disease. Aquac. Int. 2023, 31, 2945–2976. [Google Scholar] [CrossRef]
- Assefa, A.; Abunna, F. Maintenance of Fish Health in Aquaculture: Review of Epidemiological Approaches for Prevention and Control of Infectious Disease of Fish. Vet. Med. Int. 2018, 2018, 5432497. [Google Scholar] [CrossRef]
- Stentiford, G.D.; Sritunyalucksana, K.; Flegel, T.W.; Williams, B.A.P.; Withyachumnarnkul, B.; Itsathitphaisarn, O.; Bass, D. New Paradigms to Help Solve the Global Aquaculture Disease Crisis. PLoS Pathog. 2017, 13, e1006160. [Google Scholar] [CrossRef] [PubMed]
- Ma, K.; Bao, Q.; Wu, Y.; Chen, S.; Zhao, S.; Wu, H.; Fan, J. Evaluation of Microalgae as Immunostimulants and Recombinant Vaccines for Diseases Prevention and Control in Aquaculture. Front. Bioeng. Biotechnol. 2020, 8, 590431. [Google Scholar] [CrossRef] [PubMed]
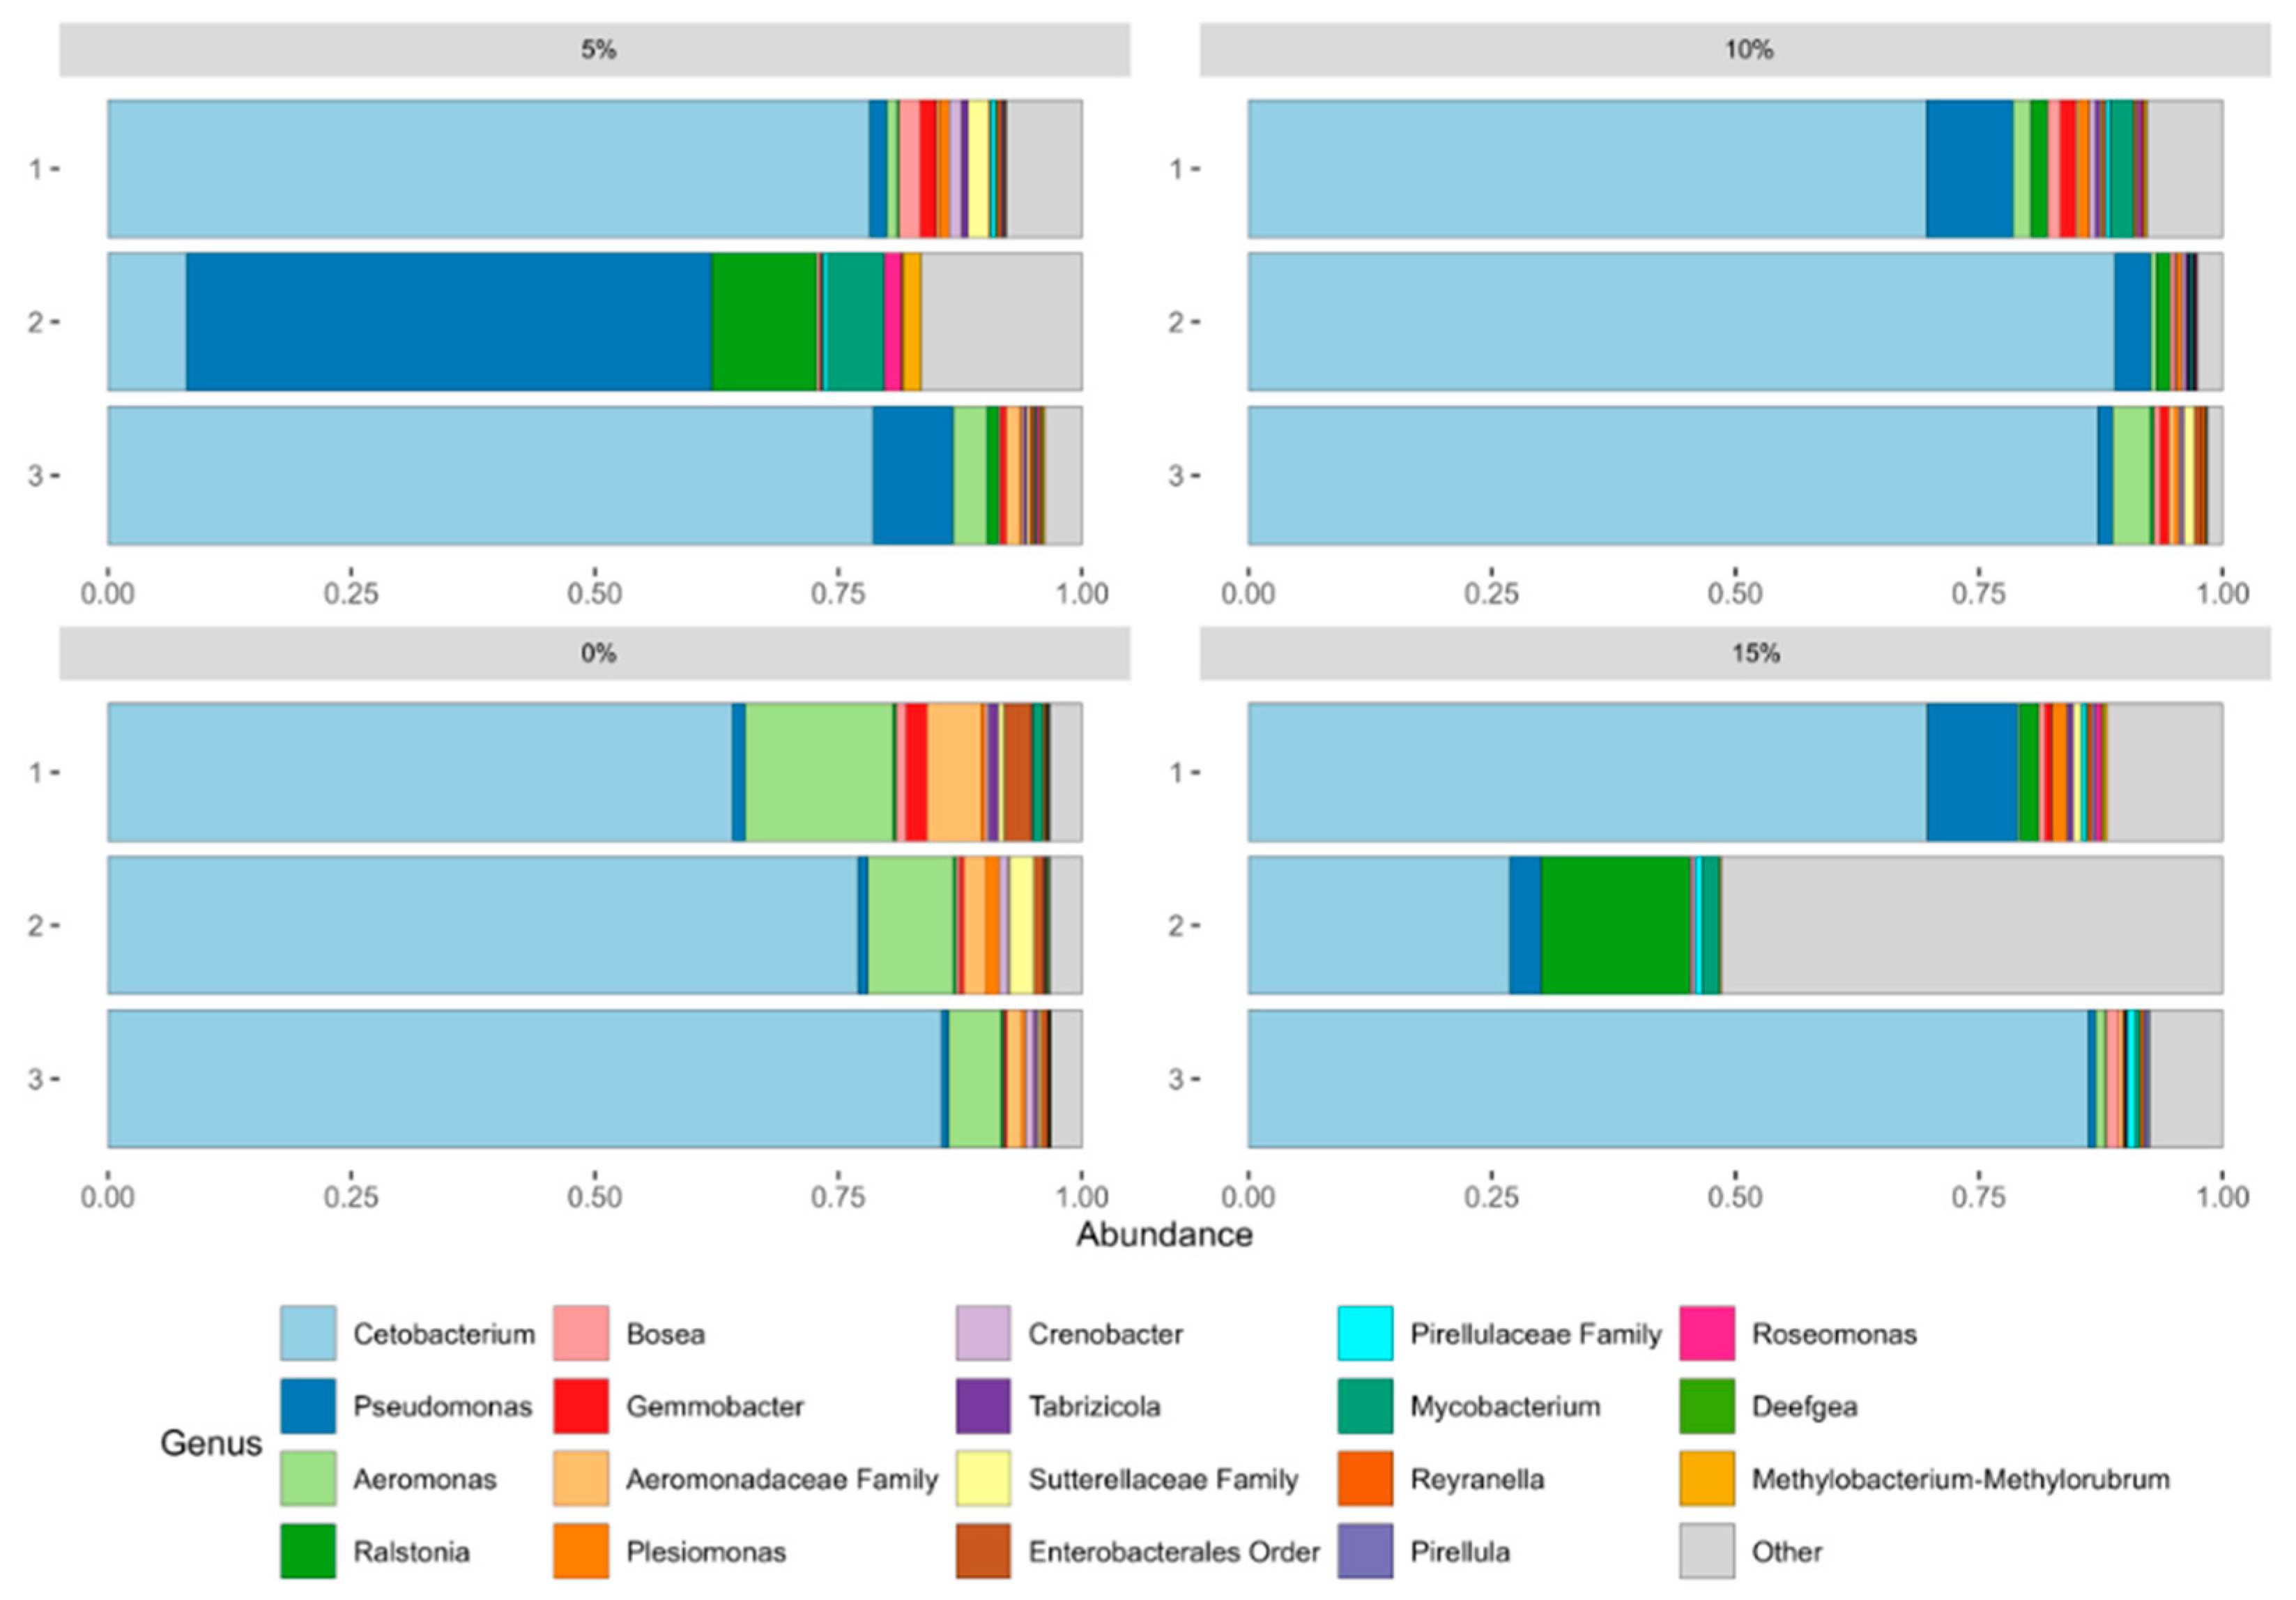
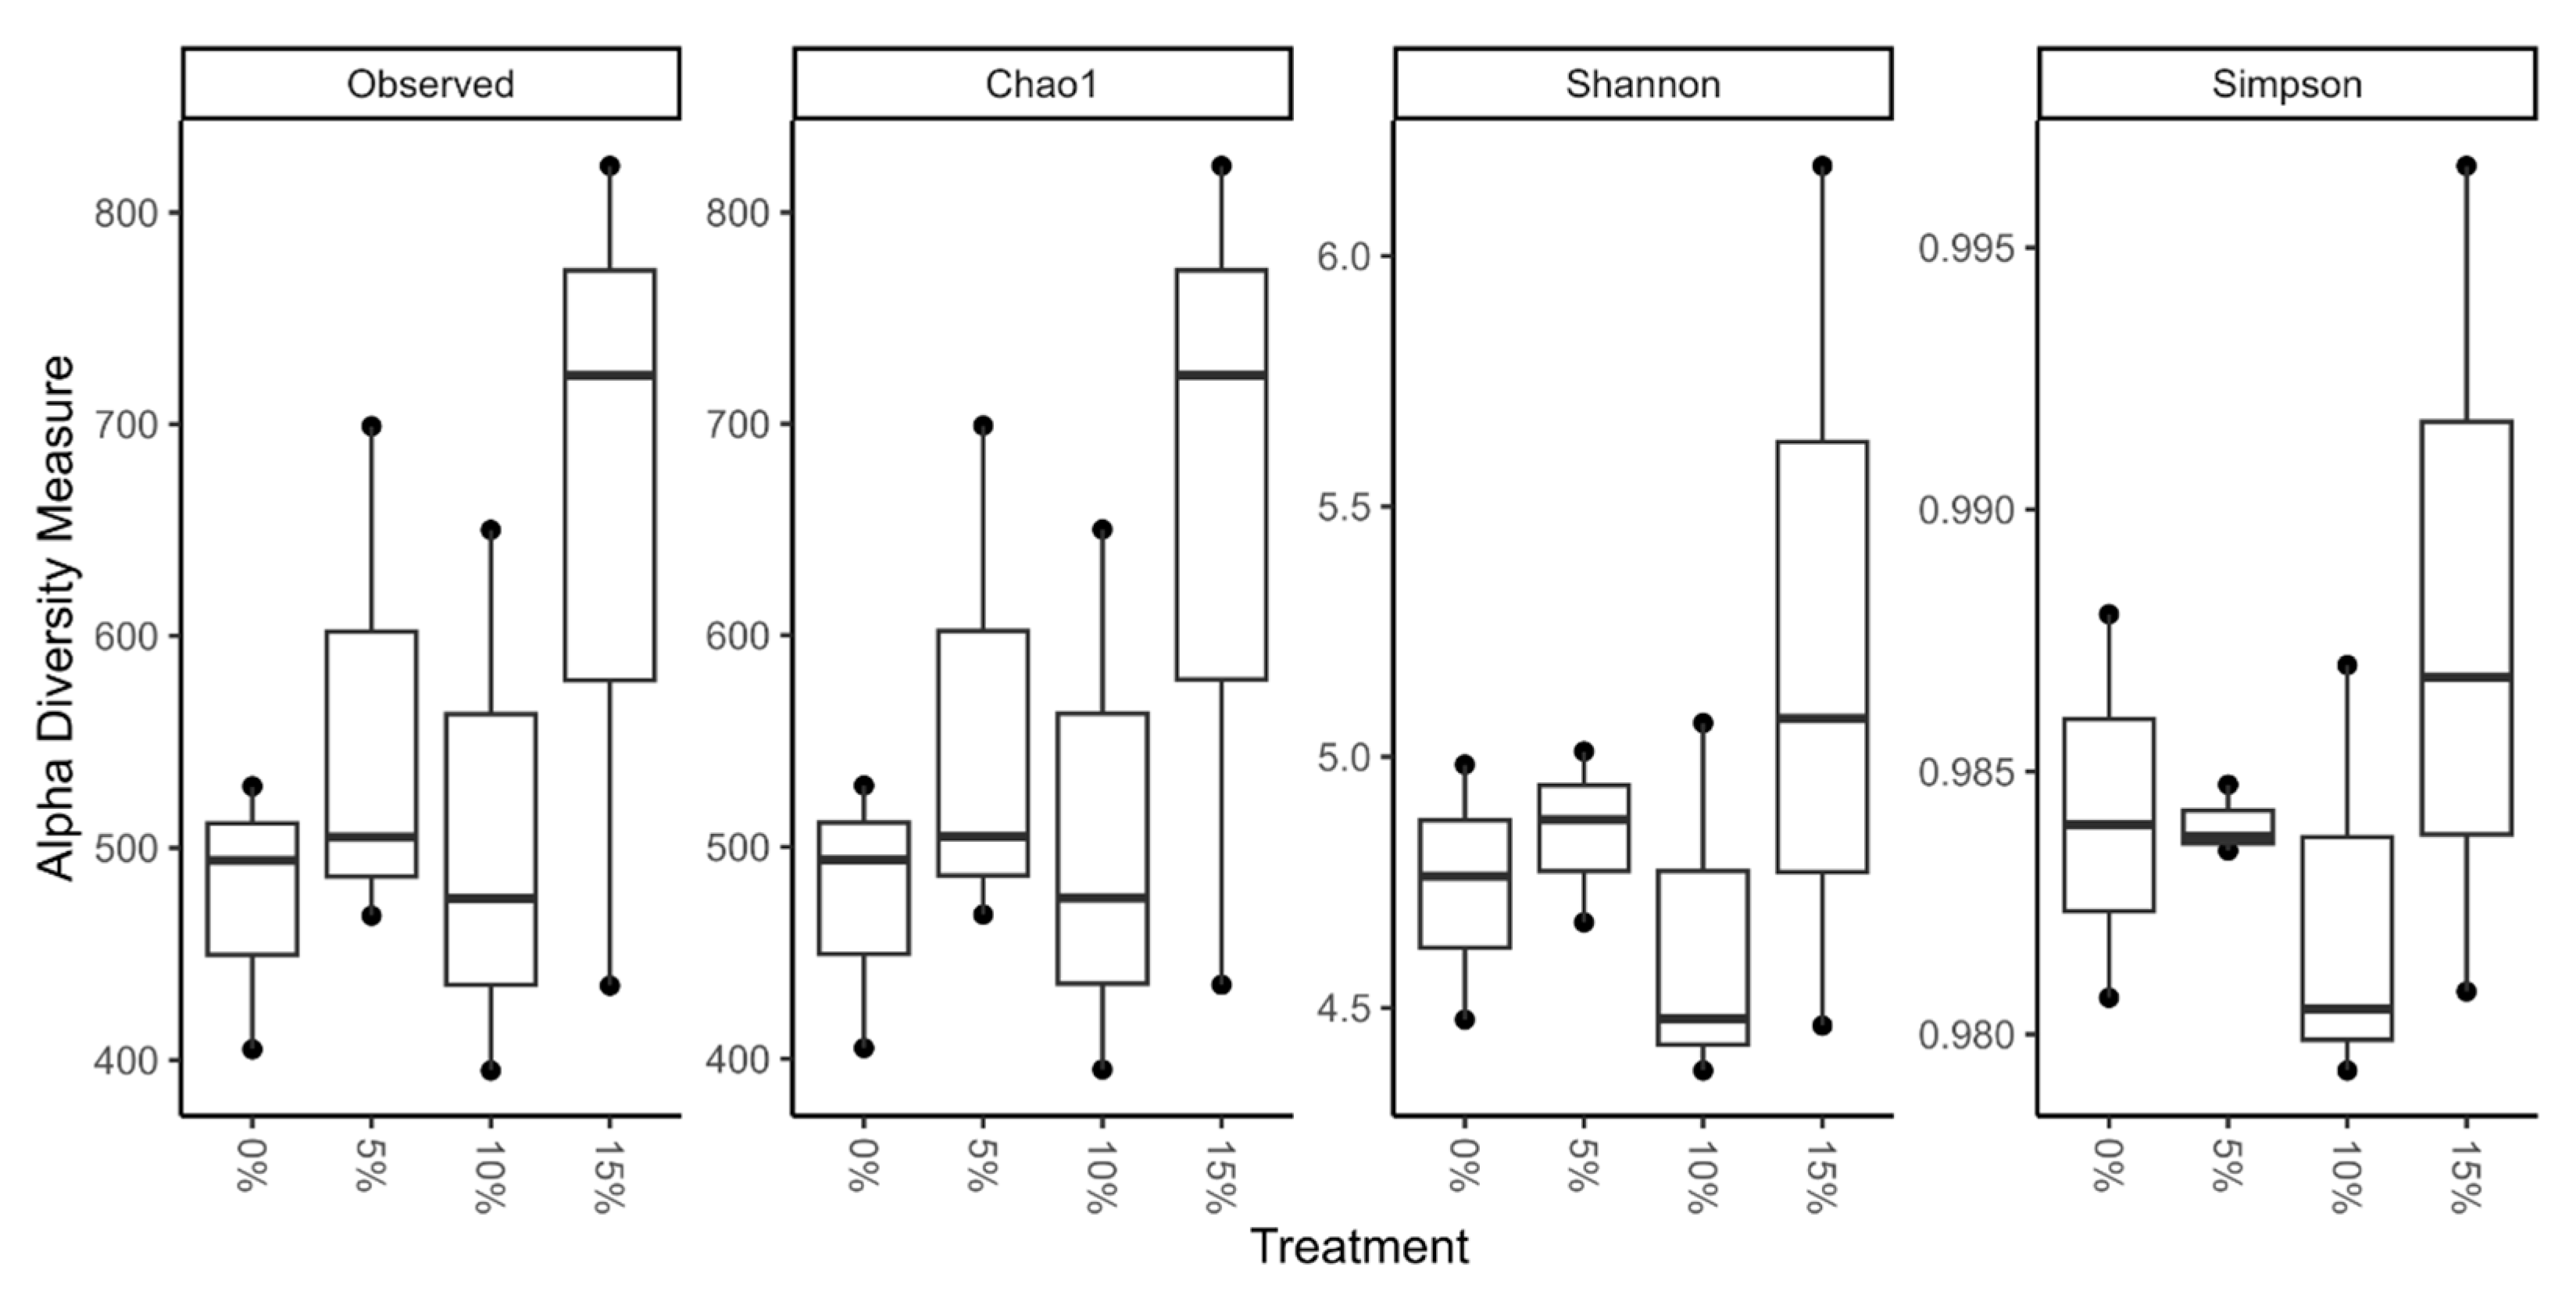
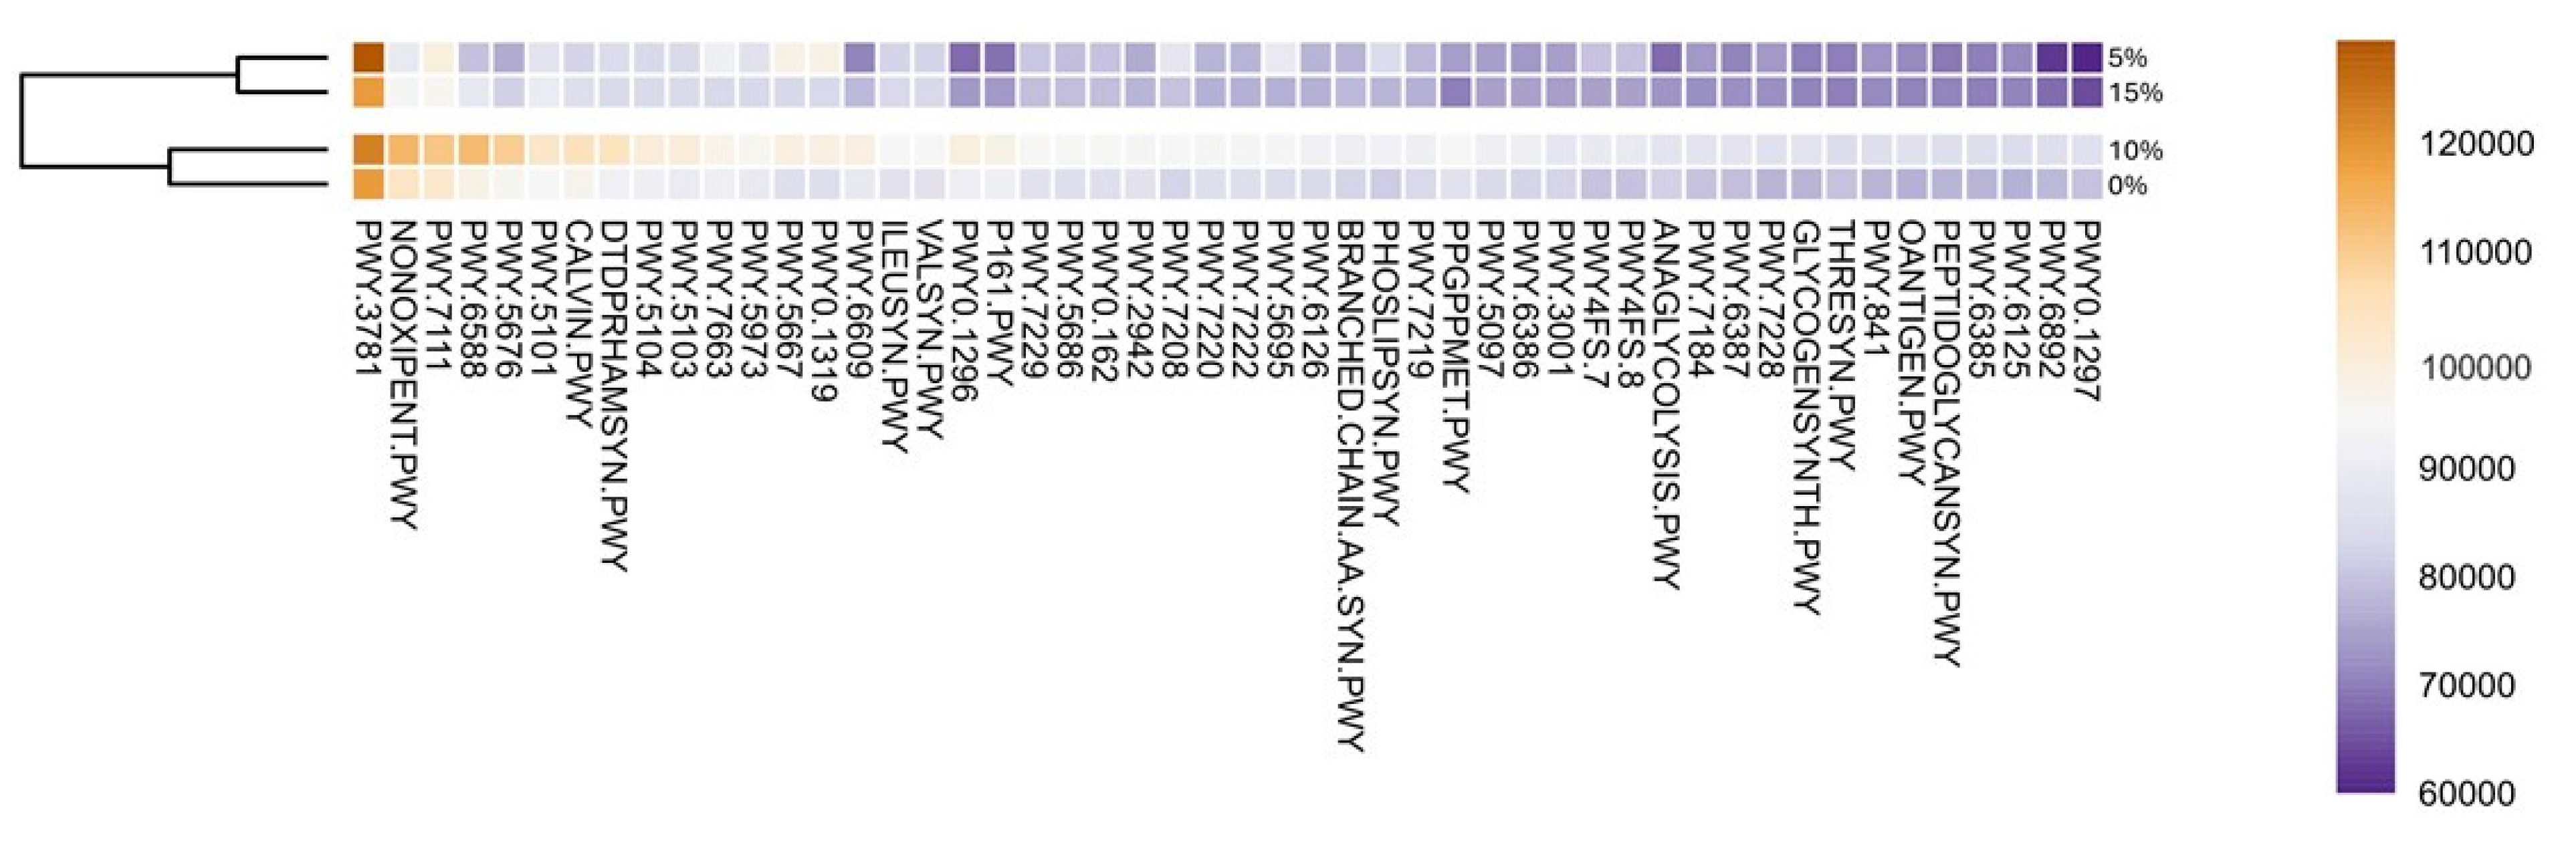
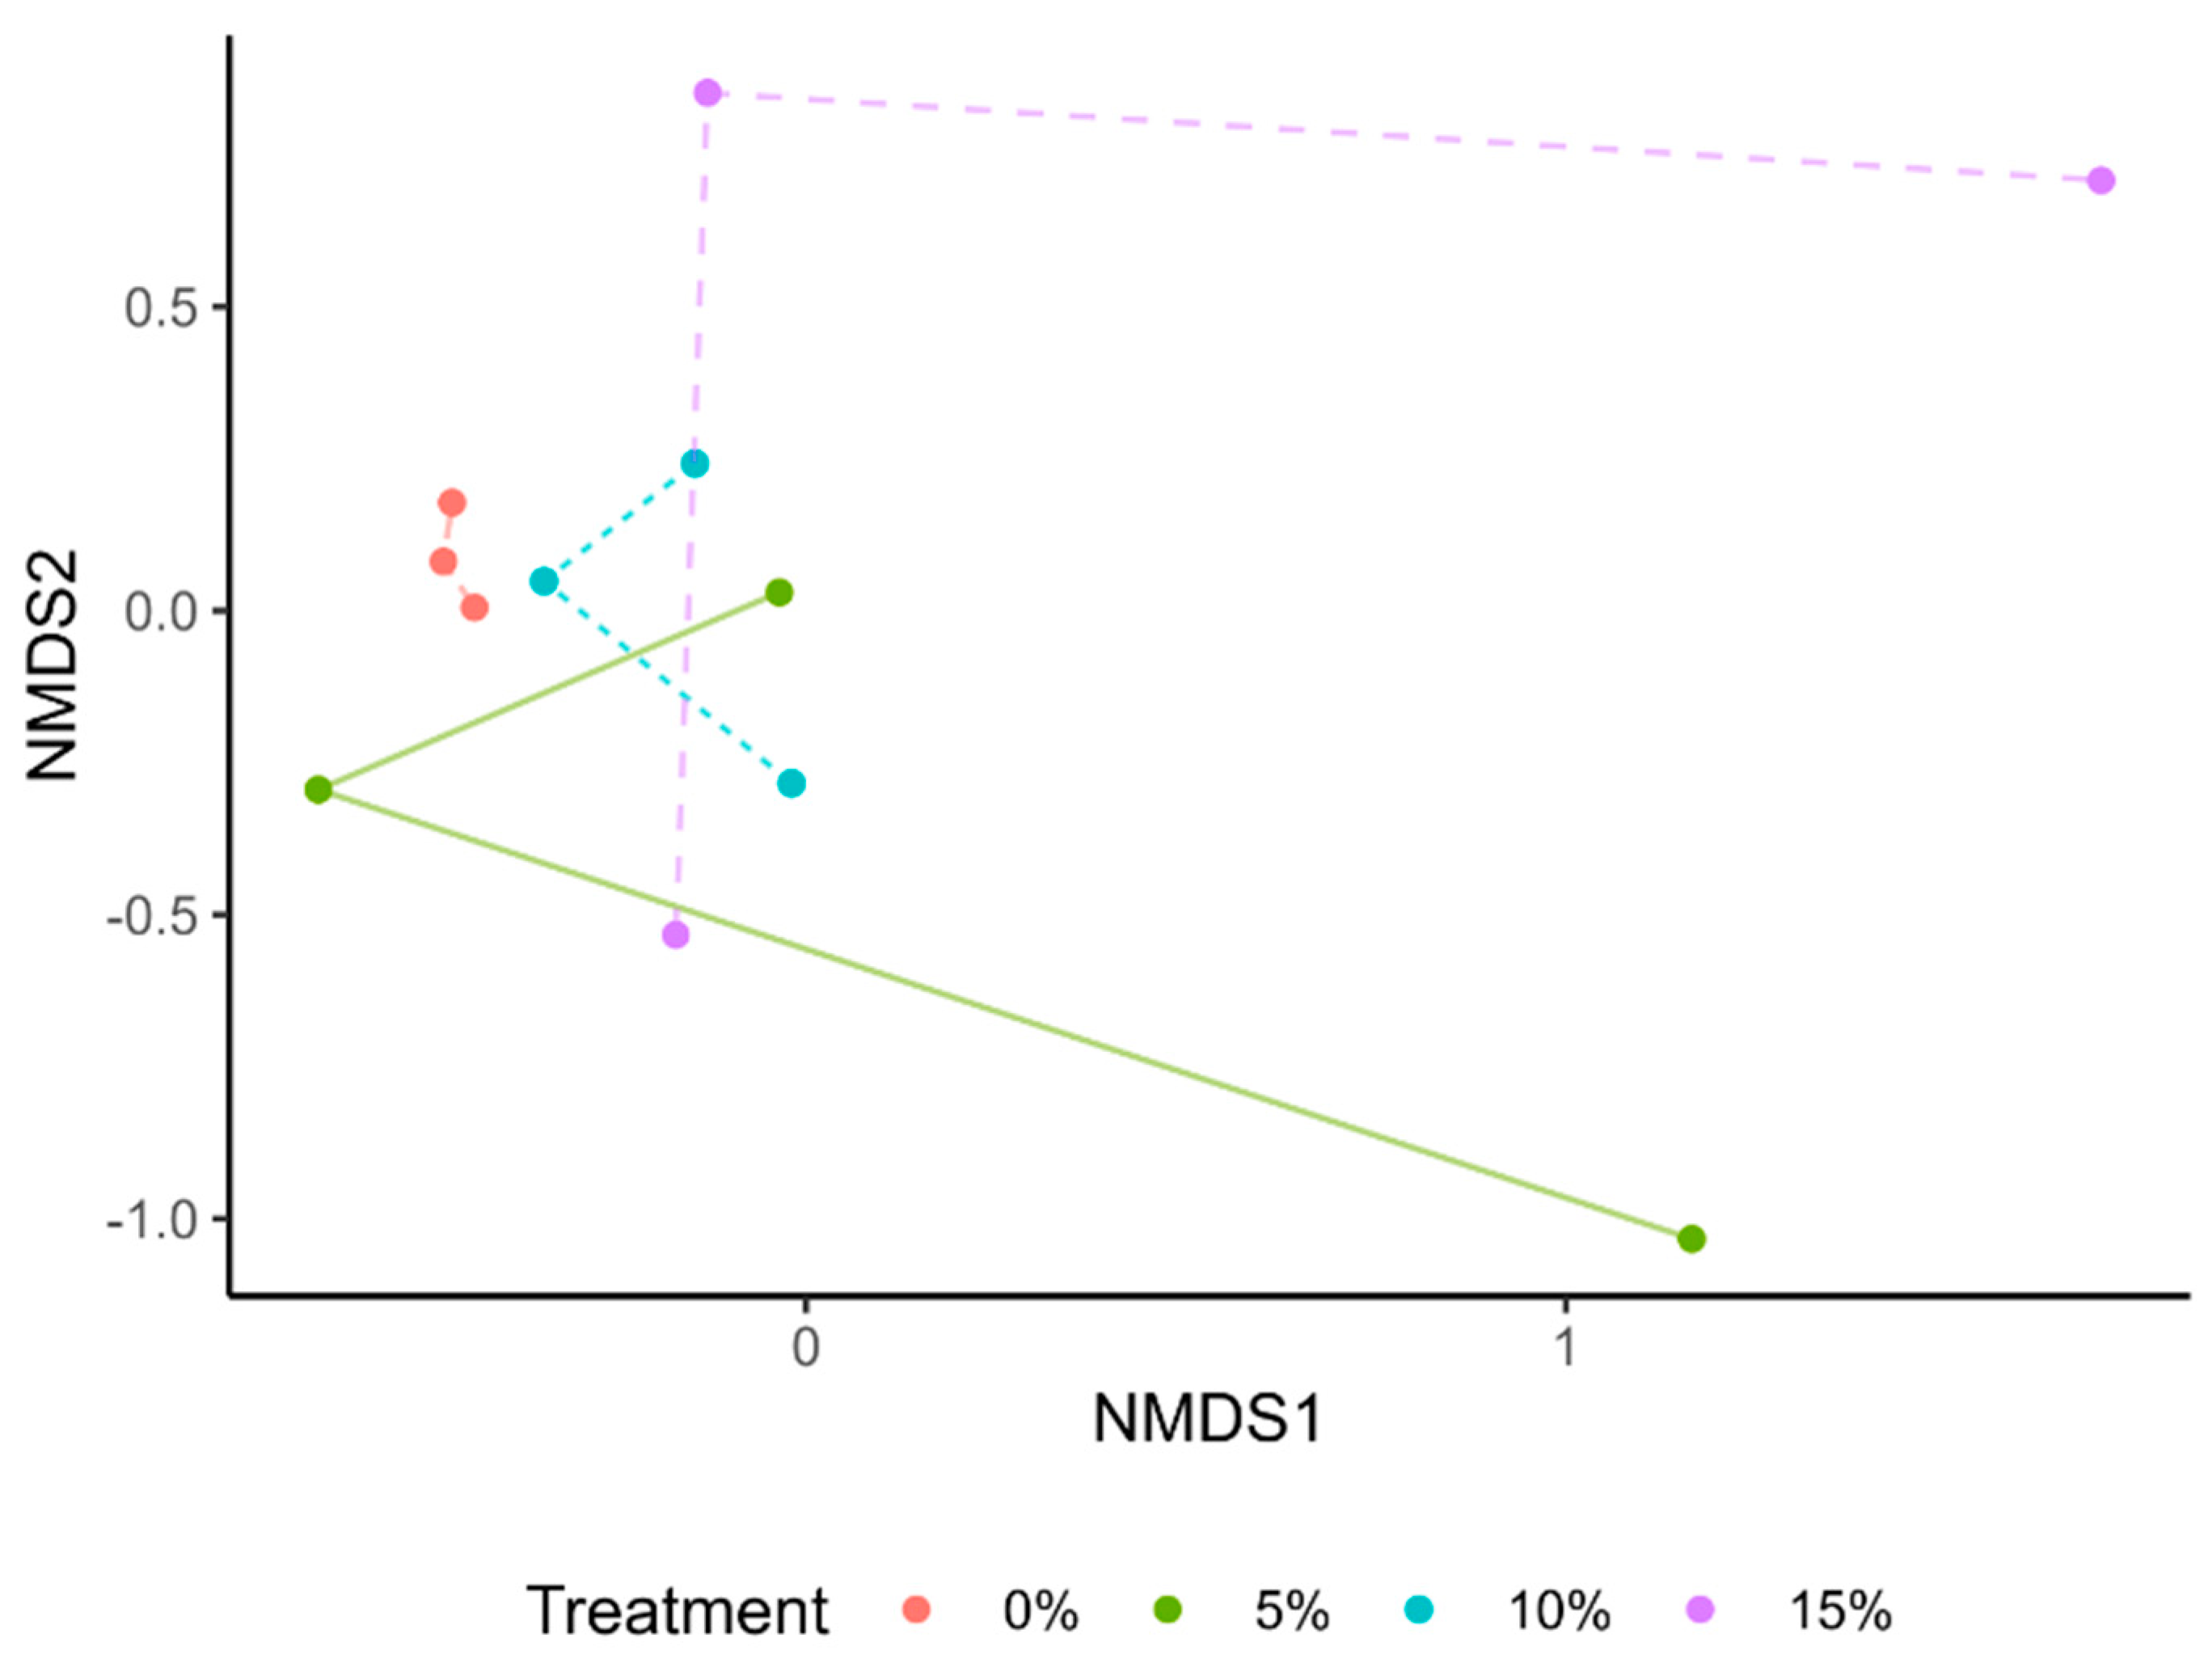
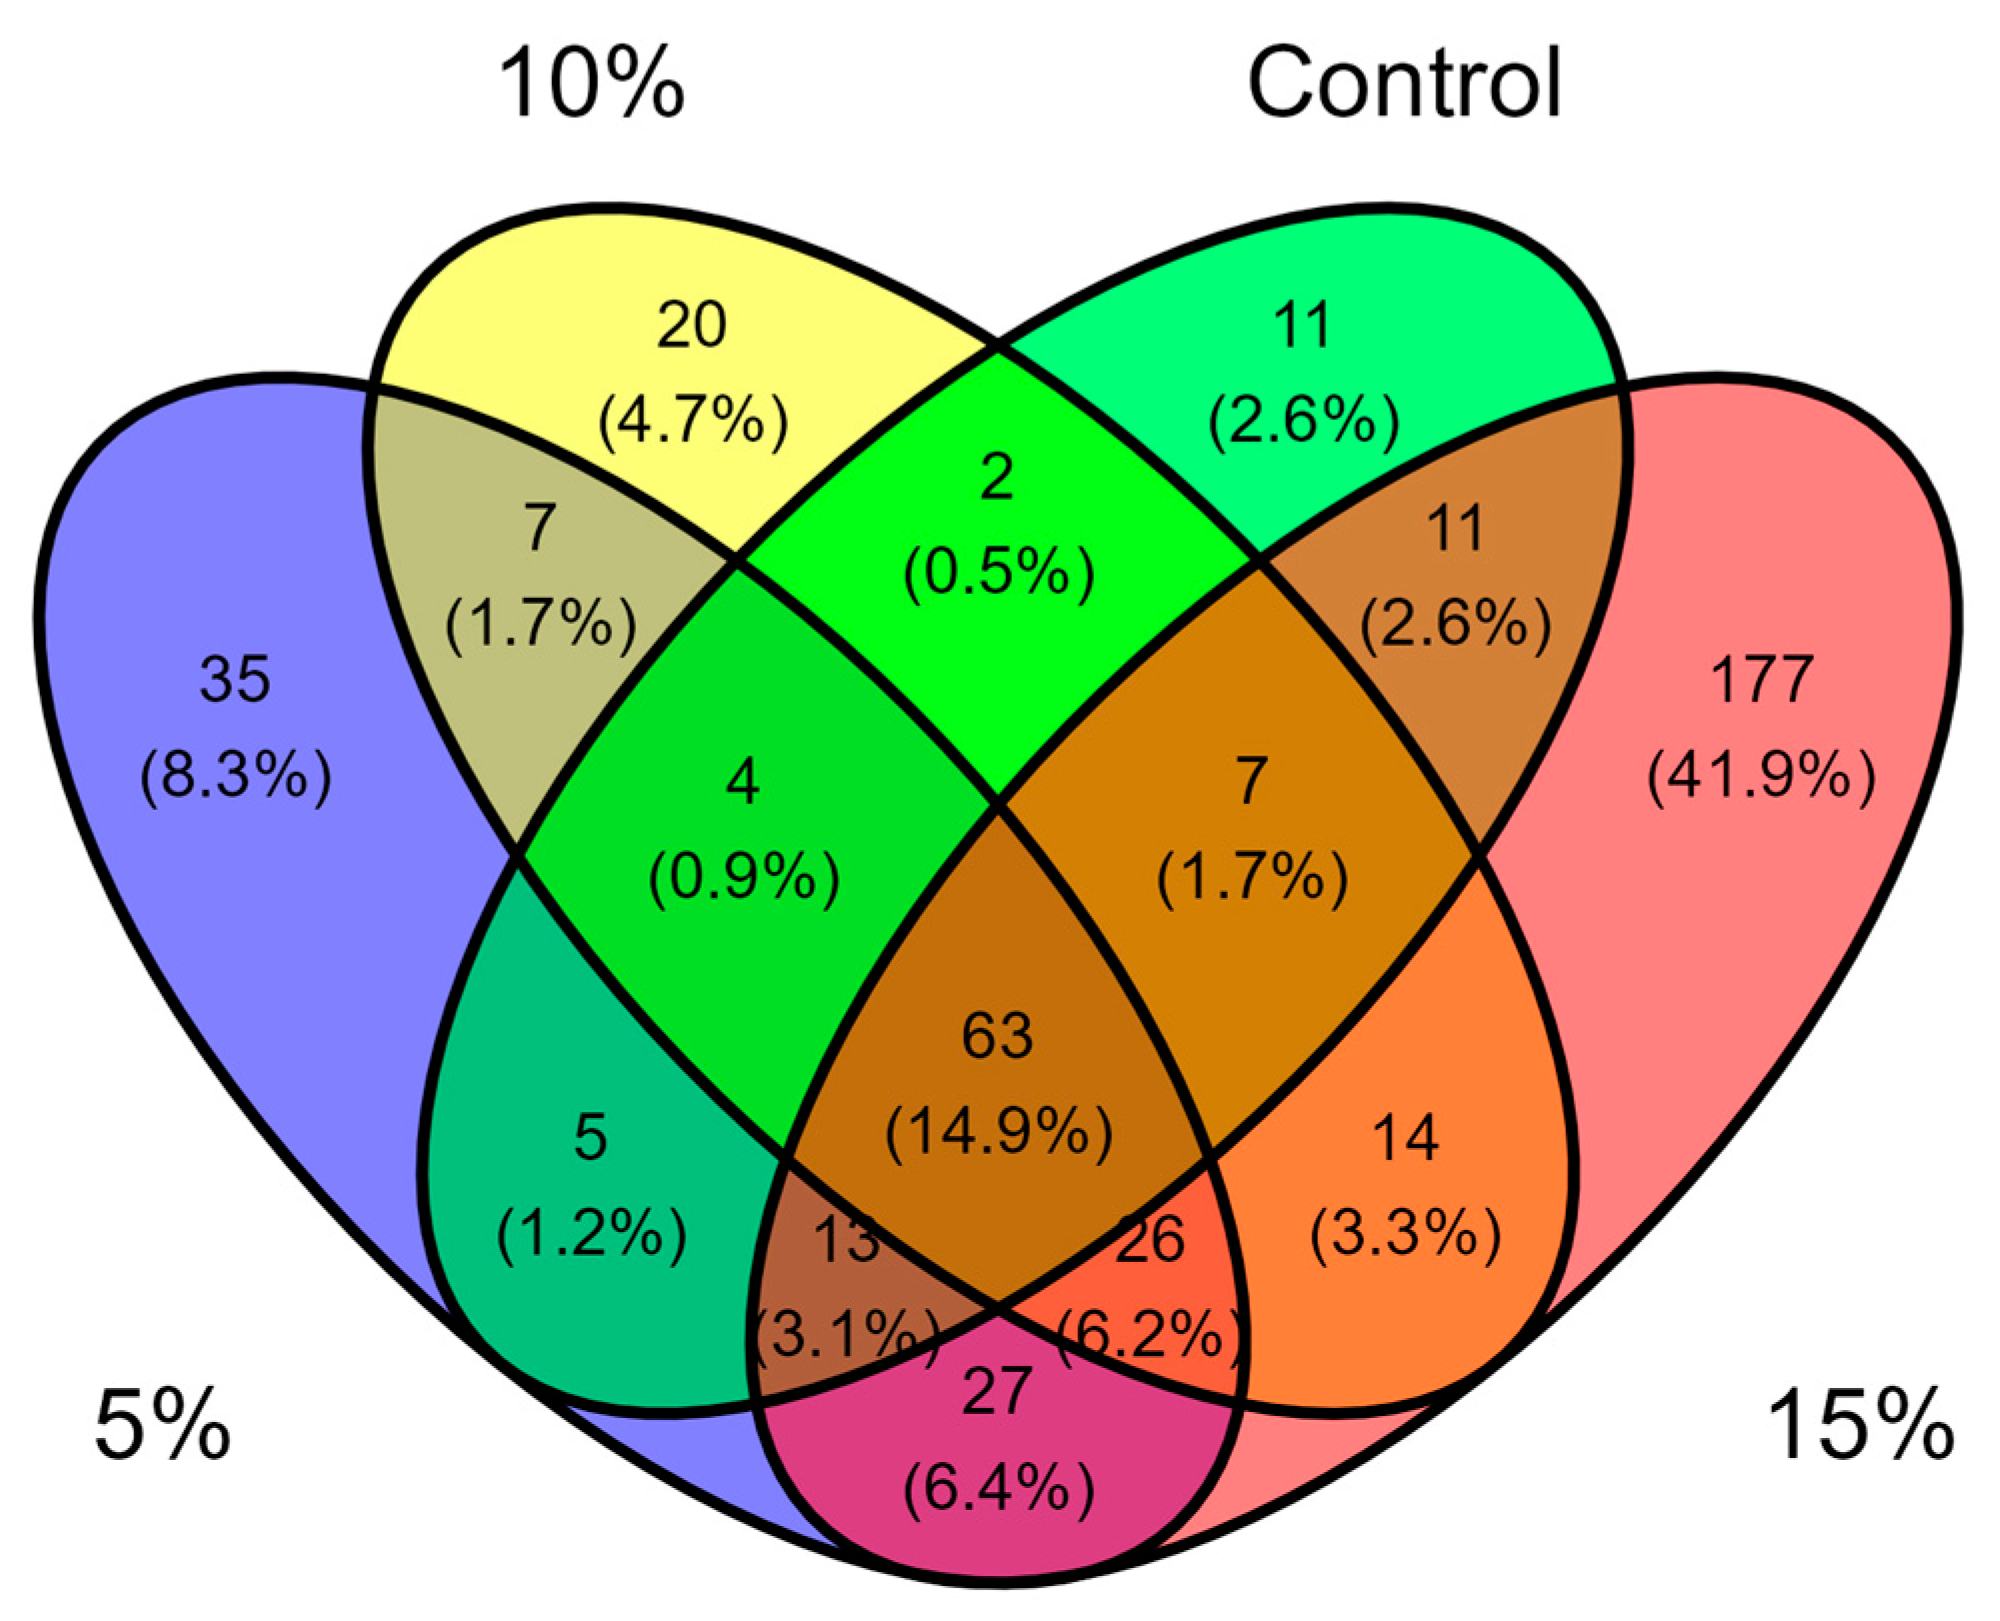

Disclaimer/Publisher’s Note: The statements, opinions and data contained in all publications are solely those of the individual author(s) and contributor(s) and not of MDPI and/or the editor(s). MDPI and/or the editor(s) disclaim responsibility for any injury to people or property resulting from any ideas, methods, instructions or products referred to in the content. |
© 2024 by the authors. Licensee MDPI, Basel, Switzerland. This article is an open access article distributed under the terms and conditions of the Creative Commons Attribution (CC BY) license (https://creativecommons.org/licenses/by/4.0/).