Abstract
Natural food available in ponds can complement formulated feed in fed aquaculture. This study elucidated the natural food intake and its contribution to tambaqui (Colossoma macropomum) growth in fertilized and unfertilized ponds, using stable isotope and stomach contents analyses. Additionally, it described the impact of fertilization management on natural food availability, fish performance, and production costs. Tambaqui juveniles (93.8 ± 15.0 g) were stocked (0.55 fish/m2) in fertilized (Fert) and unfertilized (NoFert) ponds (600 m2) for a culture period of 10 months in quadruplicate. A lower food conversion ratio was observed in Fert ponds. The main natural food items ingested by tambaqui were insects, vegetables, and cladocerans. Plankton contributed 39.4% and 10.7% of muscle formation in Fert and NoFert ponds, respectively. Pond fertilization (2.45 g of nitrogen and 0.80 g of phosphorus per square meter every two weeks) did not significantly affect fish growth, survival, or productivity but had a slightly influence on water quality parameters. However, fertilization increased the zooplankton density (through phytoplankton) in the water, thereby increasing autochthonous food availability for tambaqui consumption. This species demonstrates the ability to alternate between natural food sources and commercial feed without compromising its development. Consequently, tambaqui exhibits suitability for farming within restorative and integrated aquaculture systems as well as intensive systems reliant on commercial feed.
Keywords:
Colossoma; cost-effectiveness; pond fertilization; pond natural food; stable isotope; trophic ecology; plankton Key Contribution:
We described the first register of plankton consumption and their contribution to tambaqui muscle formation in the grow-out ponds. Results indicated that tambaqui can interchange between natural food and commercial feed without compromising its development.
1. Introduction
Many aquaculture systems harness natural biological productivity to support the production of edible aquatic organisms. The extractive species inside the culture ponds can convert particulate and dissolved materials not ingestible by animals of higher trophic levels into biomass, effectively recovering inaccessible energy and nutrients. This process should be explored to restore natural resources from waste and pollution inside ponds, according to a circular economy approach [1]. Nevertheless, nutrient limitation may hinder biological productivity in aquaculture ponds. To compensate, organic and inorganic fertilization may be performed to stimulate natural productivity [2,3]. Fertilization is frequently used in ponds recently stocked with fingerlings or during early grow-out cultures to boost the development of natural food because most fishes have limitations in ingesting or digesting manufactured feed in the early life stages [4]. During the grow-out phase, fertilization has been observed to enhance fish productivity in various species, including Cirrhinus migrala [5], different carps in polyculture [6,7,8], Coptodon rendalli [9], and Labeo rohita [10]. This effect is generally attributed to a rise in natural food, mainly phytoplankton, zooplankton, periphyton, and benthic invertebrates.
Most studies have evaluated the effect of fertilization on pond productivity without the supply of formulated feed. This practice results in limited productivity because the enhancement of natural food is insufficient to feed fish stocked in high densities. Productivity is low in fertilized ponds without an allochthonous diet, while intensively fed ponds bear high productivity. An allochthonous diet is the primary source of nutrients in semi-intensive or intensive fish monocultures [3,11]. Despite this, natural food can supplement the formulated feed in ponds or partially replace it [4,12]. They are even essential in farming certain species for which no suitable and well-balanced diets are available [13,14]. Therefore, understanding the role of fertilization associated with an allochthonous diet may provide information for aquaculture efficiency and align with restoration approaches (sensus Alleway [1]).
The incorporation of ingested food into fish biomass and its contribution to growth is variable. The intake of allochthonous diets or natural biota organisms has been largely studied in fish production by stomach content analysis [10,15,16,17,18,19,20,21,22,23,24,25]. However, this technique does not reveal the contribution of each kind of feed to fish growth because part of the eaten feed is not assimilated. Stable isotope analysis is a tool for quantifying dietary support of fish growth among the ingested feed items with distinct isotope content, since the isotopic compositions of animal tissues resemble their diets [26,27,28,29,30,31]. Since formulated diet is the main cost of production in fish farms [3], understanding its utilization by fish and how it can be replaced or complemented by natural food would help to improve feeding strategies and decrease production costs.
The tambaqui (Colossoma macropomum) is an indigenous fish species from the Amazon River Basin and has been framed in Central and South American countries, including Panama, Honduras, Brazil, Colombia, Peru, and Venezuela. This species has also been farmed in China [32]. This Tambaqui is a low-trophic-level fish that exhibits a remarkable ability to consume natural food sources both in its natural habitat [33,34] and in rearing ponds during all life stages [20,22]. Tambaqui also shows easy captivity adaptation, a low feed conversion ratio (FCR), and fast growth [12,22]. Brazil is the primary producer [35], where tambaqui is farmed in earthen ponds [36]. The farming practices include a direct stocking of juveniles weighing between 2 and 5 g or a preliminary culture phase lasting 2 to 3 months until the fish reach a weight of 70 to 80 g, and then, they are transferred to grow-out ponds where they reach 1.5 to 3 kg within a span of 10 months [12,37].
Tambaqui culture in ponds may be an interesting model for studying the contribution of natural food in the grow-out phase to low-trophic-level fish growth. Combining the determination of stomach content and stable isotopic analyses enables us to determine both the ingested food by fish and its actual assimilation into their body mass. Therefore, the present study aims to describe the intake of natural food and its contribution to tambaqui growth in fertilized and unfertilized ponds. Furthermore, it aims to understand the impact of fertilization on natural food availability, fish performance, and production costs.
2. Material and Methods
A batch of Tambaqui fingerlings (1.18 ± 0.55 g) was purchased from a commercial hatchery (Brejinho de Nazaré, TO, Brazil; 48°35′17.93″ S, 11°1′52.95″ W) and kept in 1000 m2 ponds at a density of 9 fish m−2 [12] for two months until they reached approximately 90 g. During this period, fish were fed three to four times a day with commercial feed (45% crude protein, 1–2.6 mm pellet size).
2.1. Experimental Design and Conditions
Tambaqui juveniles (93.8 ± 15.0 g and 17.6 ± 0.8 cm) were stocked in 600 m2 ponds at 0.55 fish/m2 and reared for 10 months. This density is within the range used in commercial farms, i.e., 0.4–0.7 fish/m2 [37]. Fish were submitted to two experimental conditions (treatments), fertilized ponds (Fert) and unfertilized ponds (NoFert), with four replicates each, in a completely randomized design. Initially, all ponds were drained, disinfected with quicklime (100 g m−2), and limed 24 h later (100 g m−2). The first and biweekly fertilizations were applied only in Fert ponds using 5 g of urea, 3 g of triple superphosphate, and 10 g of rice bran per square meter. This management results in an input of 2.45 g of nitrogen (N) m−2 and 0.80 g of phosphorus (P) m−2 with N:P ratio by mass of 3:1 each two weeks. The combination of chemical and organic fertilization (rice bran) usually results in greater production [4]. The fertilization management in Fert ponds was interrupted in the ninth and tenth months because of a pronounced decrease in water transparency. The inlet water came from a local dam. Ponds received water to seepage reposition and water renovation of a maximum of 3% of the total water volume per day.
Fish were manually fed with a commercial extruded feed twice a day (9:00 h and 15:00 h), six days a week. Feeding rates were adjusted during the culture (Table 1) based on the regular practice in commercial farms. Feeding was over when the fish ceased eating or when the daily dose (Table 1) computed by feed rate was reached. The actual quantity of feed provided was recorded and used to calculate the apparent feed conversion and feed intake. Fortnightly, 30 fish were randomly sampled from each pond, weighed, and then, returned to their respective ponds. Fish mean weight and feeding rate were used to recalculate the quantity of daily feed supplied to each pond. An aliquot of each feed batch was sampled, and they were pooled for proximate analyses (Table 1).

Table 1.
Feed composition, pellet size, and feeding rates used in feed management for tambaqui (Colossoma macropomum) grow-out in ponds for 10 months. Feeding was ceased if the fish stopped eating before reaching the daily feed rate.
At the end of the experiment, ponds were drained, and all fish were harvested and weighed in batches to obtain the total yield. Then, fish were counted, and 10 individuals from each pond were weighed individually. The following variables were calculated: (1) specific growth rate (% SGR day−1) = 100 × [(ln final weight − ln initial weight)/days of experiment]; (2) daily feed intake (% live weight dia−1) = [total feed supplied/(final biomass + initial biomass/2)]/days of experiment × 100; (3) apparent feed conversion ratio (FCR) = total feed supplied/total weight gain; (4) survival = 100 × (final number of fish/initial number of fish). Uneaten feed floated on the pond surface and the amount observed was negligible. Thus, the amount of feed supplied was used as a proxy for the actual feed intake.
2.2. Plankton Availability
Plankton was sampled monthly by dragging a 20 µm mesh net (for phytoplankton) and a 68 µm mesh net (for zooplankton) along each pond, at approximately 30 cm below the surface, over a distance of 10 m. Samples were concentrated in 500 mL and fixed in 4% formalin. Phytoplankton were counted using Neubauer chambers and results were expressed in individuals/L. Zooplankton was quantitatively analyzed using Sedwick–Rafter chambers, and results were expressed in individuals/L for each taxonomic group.
2.3. Stomach Content Analysis
Five fish from each pond were sampled monthly, euthanized with eugenol bath (35 mg/L) [38], individually weighted, and dissected for stomach removal. Fish did not receive formulated feed for 24 h before sampling to enable better observation and identification of the ingested natural food. Stomachs were dissected and fixed in 4% formalin. Then, they were weighed with and without their content. Stomach contents were analyzed qualitatively and quantitatively. Food items were grouped according to the following categories: (a) insects, (b)terrestrial plants, (c) phytoplankton, (d) sediment, (e) copepods, (f) cladocerans, (g) rotifers, (h) ostracods and decapods, and (i) formulated diet. Frequency of occurrence (FO) was calculated as the ratio between the number of stomachs containing a specific food item and the total number of stomachs analyzed [39]. The relative abundance (RA) of each item was calculated considering the relative-fullness method, in which the contribution of each prey category is visually scored as the percentage of the total food content in the stomach [40]. Food selectivity was measured using the Ivlev Electivity Index (Ei) [41] calculated using the equation Ei = (r − p)/(r + p), in which r is the percentage of each item in the fish stomach and p is the percentage of each item in the pond environment. The resulting index values range from −1 to +1. Positive values indicate preferred items, whereas negative values indicate avoided items; h zero indicates no selectivity.
2.4. Isotopic Analysis
Muscle samples were collected from eight fish at the beginning of the study and eight fish per treatment at the end. Feed with different granulometry was sampled and pooled for isotopic analyses. The plankton sample was obtained from a pool of sub-samples collected monthly in Fert and NoFert ponds. The plankton sample included insects, net plankton, ostracods, and decapods. All samples were dried in an oven at 65 °C for 72 h and kept at 4 °C until analysis. The isotopic analyses were carried out at the Center for Stable Isotopes of the Universidade Estadual Paulista (UNESP, Botucatu, Brazil). Each sample was homogenized individually in a cryogenic mill at −196 °C and then weighed in tin capsules (~0.5 mg). Homogenization was necessary to reduce the sample internal variation of feed, because of its granulation, and for plankton because of the diversity of organisms. The capsules were subjected to the simultaneous analysis of isotopic ratios R(15N/14N) sample and R(13C/12C) sample in a CF-IRMS continuous flow isotopic ratio mass spectrometry system, using an IRMS (Delta V, Thermo Scientific, Albuquerque, New Mexico) coupled to an elemental analyzer EA (Flash 2000, Thermo Scientific) through a gas interface (ConFlo IV, Thermo Scientific). The isotopic ratios were expressed as a relative difference from the isotopic ratio δ15N and δ13C according to Equations (1) and (2) below [42] reported on mUr [43], where R(15N/14N) air and R(13C/12C) VPDB are the international standard isotope ratios for N and C, respectively. The standard uncertainty of the simultaneous measure was estimated at ±0.15 mUr and ±0.20 mUr for δ15N and δ13C, respectively. Values of δ15N e δ13C were normalized according isotopic reference materials USGS61, USGS62 and USGS63, respectively [44,45].
2.5. Assimilation of Feed into Muscle Using Isotopic Analysis
First, we estimated feed-specific trophic discrimination factors (Δ) that correct differences in isotope δ13C values between consumers and feeds due to the differential assimilation of feed components and metabolic fractionation [46]. To do so, we used the difference between the steady-state isotope δ13C values for the fish tissue at the beginning of the experiment and the average isotope δ13C values for the formulated feed that fish were consuming before this experiment (Equation (3)).
To obtain the fish isotopic values without the trophic discrimination factors (δfish-Δ), we calculate the difference between the average fish isotopic values at the end of the experiment and the Δ13C. The proportion of plankton (P) in the muscle (expressed in %) of the fish at the end of the experiment in each treatment was assessed using an isotopic balance with δfish-Δ and the isotopic values of the two feeds available (δzooplankton, δfeed) (Equation (4)) [42].
2.6. Water Quality Analyses
Temperature, dissolved oxygen, pH, and total ammonia nitrogen (TAN) were measured in situ three times a week with a specific probe (YSI Professional Plus, Yellow Springs, OH, USA). Transparency was also measured three times a week with a Secchi disc. Alkalinity and hardness, were measured biweekly with commercial colorimetric kits (Alfakit®, Florianópolis, SC, Brazil). Phosphorus was analyzed monthly according to the method described in APHA [47].
2.7. Economic Analysis
A partial budget analysis [48] was used to assess the economic impact of fertilization management on tambaqui grow-out. Only the production costs associated with formulated feed, fertilization inputs, and relevant labor were considered in this analysis since these factors varied between treatments, consistent with previous studies performed by Veverica et al. [49] and Liranço et al. [50]. The fertilization management in each pond was estimated to be completed in 20 min, which was considered to estimate labor costs. The values of each input are described in Table 2.
Table 2.
Values of the items considered in the partial budget economic analysis to introduce fertilization in tambaqui (Colossoma macropomum) grow-out in ponds. Prices were obtained in Palmas-TO, Brazil, in January 2020. (US$ 1.00 = R$ 5.26).
2.8. Statistical Analysis
Data normality (Shapiro–Wilk) and homogeneity (Bartlett) of the residues were evaluated and the transformation of Box & Cox [51] was used when these premises were not met. To assess the differences between treatments for final weight, SGR, daily feed ingested, feed conversion rate, fish yield, survival, alkalinity, hardness, and Zooplankton density, data were subjected to Student’s t-test. Phytolankton density, dissolved oxygen concentration, transparency, pH and TAN data were analyzed considering the periods of evaluation and using a mixed model as a technique of measures repeated in time. Ponds were considered experimental units and evaluated as aleatory effects. Treatments, months, and their interactions were evaluated as fixed effects. When significant ANOVA was obtained, the means were compared using the Tukey test. The other variables did not meet normality and/or homoscedasticity even with transformed data, and thus, they were analyzed using a non-parametric Kruskal–Wallis test. The data were presented as the mean ± standard deviation, and statistical significance was assumed at a level of p close to 0.05. All statistical analyses were performed using the 4.2.3 R software [52].
2.9. Legal and Ethical Aspects
The study complied with official Brazilian guidelines for the care and use of animals for scientific and educational purposes (Concea—CEUA protocol 42/2018).
3. Results
3.1. Tambaqui Performance in Ponds
The growth of fish during the culture period, final mean weight, survival, and yield showed no significant difference between the Fert and NoFert treatments (Figure 1A; Table 3). The daily feed intake and feed conversion ratio (FCR) were observed to be lower in Fert ponds compared to NoFert ponds (Table 3).
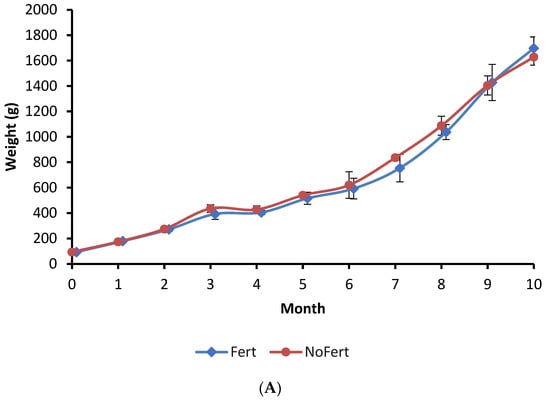
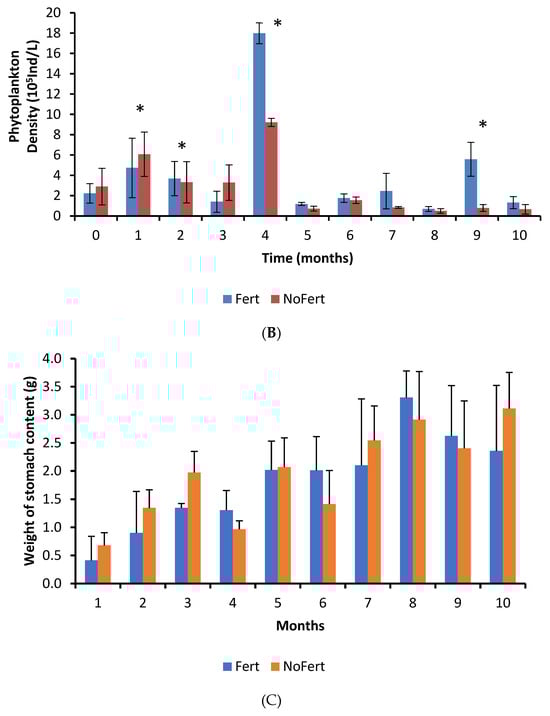
Figure 1.
Growth of tambaqui (Colossoma macropomum) (A), the variation of phytoplankton in water pond (B), and weight of stomach content of tambaqui (C) during grow-out in fertilized (Fert) and unfertilized (NoFert) ponds. No significant difference in fish growth was observed between treatments (p = 0.2525). The weight of stomach content (p = 0.0019) was higher in fertilized ponds. Whiskers indicate SD. Ind. = individuals; * indicates significant differences between treatments each time.
Table 3.
Performance of tambaqui (Colossoma macropomum) produced in fertilized (Fert) and unfertilized (No Fert) ponds for 10 months. SGR = specific growth rate.
3.2. Plankton Community
The interaction between fertilization management and culture time was significant for phytoplankton density (p < 0.0001). Phytoplankton abundance was initially lower in fertilized ponds during the first month, but significantly higher during the second, fourth, and ninth months (Figure 1B). The peak of phytoplankton in the fourth month coincided with an abnormally high concentration of phosphorous in the inlet water. The average zooplankton density in the water of fertilized ponds (1079 ± 261 individuals/L) was higher than in unfertilized ponds (716 ± 161 individuals/L) (p = 0.0561).
Fertilization increased the densities of cladocerans, copepods, and rotifers inside ponds by approximately twofold (Table 4). However, the great variability in the samples obtained in the different ponds during culture decreased the power of the t-test [51]. Thus, no significant statistical differences were observed. The frequency of occurrence and relative abundance of food items in stomach contents had significant variations over time, but it did not exhibit any pattern. Insects, followed by vegetable fragments, cladocerans, and copepods showed the highest frequency of occurrence inside stomachs (Table 4). There were interactions between treatments and culture duration regarding the frequency of occurrence for copepods; higher frequencies were observed in fertilized ponds during the fifth month, while lower frequencies occurred during the seventh.
Table 4.
Density of zooplankton groups in pond water and frequency of occurrence (FO) and relative abundance (RA) of food items in the stomach content of tambaqui (Colossoma macropomum) produced in fertilized (Fert) and unfertilized (NoFert) ponds. FM = fertilization management. DIP = density inside ponds. NQ = not quantified. Different letters in the same column indicate significant differences between treatments.
3.3. Stomach Content
The interaction between fertilization management and culture time was not significant for the weight of tambaqui stomach content, but an independent effect was observed. The weight of stomach content showed a tendency to increase with time in both treatments (p < 0.0001) and was higher in unfertilized than in fertilized ponds (p = 0.0019) (Figure 1C).
The most abundant food items inside the stomachs were insects, vegetable fragments, and cladocerans (Table 4). Cladocerans were more abundant in fertilized ponds, while all the others showed similar abundance in both treatments (Table 4). Formulated feed showed a low abundance and occurred in the fish stomach content from the seventh month onward (Table 4). However, we have observed that tambaqui ingested commercial feed since the first month. The adults and larvae of insects that live in the water column or are associated with the water surface were observed. No typically benthic insects were identified. Electivity indexes were very similar in both treatments. Thus, data were pooled and showed together. Electivity indexes for cladocerans and copepods did not show a pattern during the culture. However, they showed that tambaqui had a slight preference for cladocerans and avoidance of copepods (Figure 2). Tambaqui showed great preference for ingesting insects and avoided rotifers during all growth phases (Figure 2).
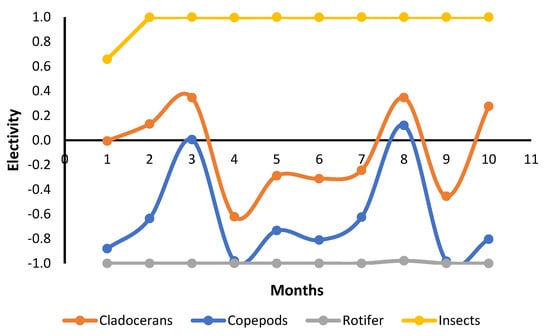
Figure 2.
Variation in Ivlev electivity index (Ei) for tambaqui, Colossoma macropomum, produced in ponds in each month of culture.
3.4. Stable Carbon and Nitrogen Isotopes as Indicators of Food Assimilation
At the beginning of the experiment, the fish showed δ15N = +7.37 ± 0.64 mUr and δ13C = −20.86 ± 0.32 mUr. At the end, fish produced in fertilized ponds showed δ15N = +8.78 ± 0.74 mUr and δ13C = −19.07 ± 0.57 mUr; similar values were found for fish produced in unfertilized ponds, which showed δ15N = +8.27 ± 0.46 mUr and δ13C = −18.59 ± 0.40 mUr. Trophic discrimination factors were Δ15N = +4.16 mUr and Δ13C = +1.72 mUr between fish muscle and diet. The dispersion of isotopic values is shown in Figure 3. The commercial feed showed δ15N = +1.69 mUr and δ13C = −19.40 mUr, the plankton of fertilized ponds δ15N = +4.51 mUr and δ13C = −22.92 mUr, and the plankton of unfertilized pond showed δ15N = +10.47 mUr and δ13C = −27.96 mUr. At the end of the experiment, the proportions of plankton and commercial feed in fish muscle were 39.4% and 60.6% for fish produced in fertilized ponds and 10.67% and 89.33% for unfertilized ponds, respectively. These proportions were calculated from δ13C values. Vegetables were not considered for isotopic analysis and only insects caught in zooplankton samples were included.
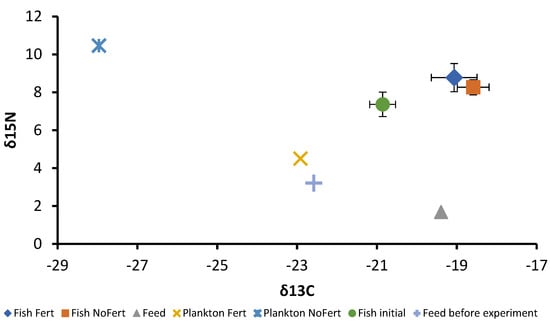
Figure 3.
Dispersion of the mean and standard deviation (Whiskers) values of δ15N (mUr) and δ13C (mUr) of plankton, formulated feed, and tambaqui Colossoma macropomum before and after the grow-out phase subjected to fertilization (Fert) and no fertilization (NoFert) management.
3.5. Water Quality
The temperature was very similar in all ponds during the entire culture. Only water transparency and dissolved oxygen showed a significant interaction between fertilization management and time of culture (Table 5). Lower transparency occurred in the third and ninth months, while higher oxygen values were observed in Fert ponds in the seventh and ninth months. The pH was affected by the fertilization management and the time of culture without interactions between these factors. However, the variation among ponds was very low. TAN was influenced only by the time of culture, without differences among treatments. The concentration of phosphorous in the water was higher in Fert ponds and varied over time without a pattern. Alkalinity and hardness showed no temporal pattern and did not differ between the treatments.
Table 5.
Mean values (±SD) of water quality parameters obtained in ponds of tambaqui (Colossoma macropomum) produced in fertilized (Fert) and unfertilized (NoFert) ponds for 10 months. Alkalinity and hardness were not subjected to ANOVA with measures repeated in time because they did not meet normality or homoscedasticity even after transformations. TAN = total ammonia nitrogen.
3.6. Economic Analysis
As no difference was observed for final weight and survival among treatments, the average biomass of 370.6 kg was used to perform the economic analysis. The feed conversion rate (FCR) was used to calculate the feed needed to produce the fish biomass in each treatment. In general, it was necessary to have 8% of 4 mm, 35% of 6 mm, and 57% of 10 mm formulated feed for tambaqui grow-out. These percentages were used to estimate the total feed cost. Fourteen fertilization events were computed for each pond during culturing. These values were used to estimate fertilization and the relevant labor costs. Despite the fertilization decrease FCR by 9%, this procedure increases production costs by 8% (Table 6).
Table 6.
Economic costs of feed, fertilization, and labor to supply fertilizers in tambaqui (Colossoma macropomum) produced in fertilized (Fert) and unfertilized (NoFert) ponds for 10 months. Prices were obtained in Palmas-TO, Brazil, in January 2020. Monetary values are in US Dollars (US$ 1.00 = R$ 5.26).
4. Discussion
Tambaqui consumed zooplankton, fragments of vegetables, and formulated feed during the entire grow-out phase in both fertilized and unfertilized ponds. Results indicated that pond fertilization increased zooplankton density in the pond water, through phytoplankton, thereby enhancing natural food availability. This allowed a greater exploration of natural biota as food, characterized by a selective increase in zooplankton ingestion by the tambaqui. Consequently, zooplankton accounted for 39.4% of all assimilated food, whereas it constituted only 10.7% in unfertilized ponds. On the other hand, this greater assimilation of natural food did not lead to higher growth or productivity. This suggests that this species can interchange between natural food and a commercial diet without compromising its development.
The limited availability of natural food may have constrained the contribution of this food to muscle tissue growth, as evidenced by zooplankton density in unfertilized ponds. The lack of natural food was compensated by the increase in formulated feed ingestion, showed by a higher feed conversion rate (computed only using the feed supplied) of tambaqui in unfertilized ponds. A high contribution of natural food to fish growth was also observed in juvenile channel catfish (Ictalurus punctatus) reared in nursery ponds receiving eutrophic water [53]. In this culture, natural food accounted for 57–58% of muscle tissue growth when fish were fed commercial feeds at varying rates, suggesting that the availability of formulated feed did not determine the consumption of natural food, and rather, it was primarily influenced by its own abundance [53].
The stable isotope analysis has been utilized in food assimilation studies to quantify the contribution of natural food to fish growth in farm ponds [27,28,29,30,54]. However, this is the first study of tambaqui in ponds, despite the importance of this species for aquaculture. As previously observed for other species, alterations in the isotopic signal were detected in both treatments due to intake and nutrient assimilation from natural food and commercial feed [53,54,55]. Fish reared in unfertilized ponds exhibited higher δ13C enrichment, indicating greater formulated feed assimilation as confirmed by food-type assimilation analysis and lower cladocerans ingestion resulting in a higher FCR. On the other hand, zooplankton impacts more intensively in δ14N enrichment [56], which explains the higher δ14N enrichment in tambaqui produced in fertilized ponds, corroborating the higher contribution of natural food in this pond management. The high assimilation of plankton by tambaqui demonstrates that these low-trophic fish may play an important role in recovering energy and nutrients in pond systems even when receiving allochthonous feed. This characteristic places the species as a promising candidate for restorative aquaculture in fed or unfed cultures in which aquaculture provides ecological benefits to the environment leading to improved environmental sustainability and ecosystem services, in addition to the supply of food [1].
Interestingly, differences in plankton isotopic signals from fertilized and unfertilized ponds were observed, which can be related to fertilization management. Narimbi et al. [30] observed that an inorganic nitrogen source was the main isotopic signal responsible for phytoplankton in ponds of tilapia culture even when organic fertilizer was available. Similarly, in the present study, lower δ14N values were observed in plankton from fertilized ponds. This observation can be explained by the utilization of urea as a nitrogen source, which presents a δ14N signal close to zero [57].
The density of phytoplankton and concentration of TAN in the pond water did not differ between fertilized and unfertilized ponds during most of the culture period. Probably, in fertilized ponds, phytoplankton rapidly assimilated the added nitrogen and phosphorous, and the populations were regulated by the zooplankton, which increased with the cascade effect. Zooplankton supports the nutrient flow between phytoplankton and fish, contributing to restoring nutrients and energy in the pond system [58]. However, Brucet et al. [59] and Vakkilainen et al. [60] highlighted a more significant influence of fish predation than nutrient enrichment (via phytoplankton) in regulating zooplankton populations.
We observed a high presence of insects and terrestrial plants in tambaqui stomachs. The vegetables were seeds and leaf fragments, possibly from the vegetation that surrounded ponds. Conversely, insects and terrestrial plants have low importance in tambaqui food in Amazonian rivers [33,56]. The differences may be related to the availability of these food items in the water or a change in the food preference of tambaqui in culture ponds. In the present study, isotopic analyses neglected vegetables and insects because we chose the principal items observed in the natural field. Although insects were present in the zooplankton sample, it may not have covered all the diversity and abundance of insects present in the ponds. Thus, the contribution of these natural food items to tambaqui muscle tissue growth was subestimated.
The density of cladocerans, copepods, and rotifers was quite variable during the culture; however, on average, it was approximately double in fertilized ponds. Nevertheless, only cladocerans were more abundant in the stomachs of fish raised in fertilized ponds, indicating a feed preference for this group. These results may be due to the capacity to catch prey or selectivity pre- or post-capture. Larvae of tambaqui showed substantial ingestion of rotifers [61], while juveniles [62] and adults (present results) showed low consumption of it. Thus, it is likely that a gill raker limitation to capture this small prey is developed with the growth of tambaqui. On the other hand, copepods have similar or higher sizes than cladocerans, and thus lower consumption of them indicates an avoidance and a real preference for cladorerans. Therefore, further research should be conducted on fertilization management to boost cladocerans and insect populations. An additional benefit of increased zooplankton density in fishponds is the action of this community to improve the effectiveness of the biological carbon pump that regulates the atmospheric carbon dioxide levels, which is an ecosystem service of aquaculture [58,63]. Techniques promoting the intensification of natural food such as fertilization, the addition of substrates for growing periphyton, and bottom nutrients suspension may contribute to reducing tambaqui’s reliance on formulated feed and enable ecological intensification of production through ecological processes and functions [64].
The natural biota plays a crucial role in nutrient cycling within aquaculture ponds, contributing to biogeochemical cycles and solar energy fixation. These fundamental processes form the basis for a restorative aquaculture practice [1,58]. The observed 8% decrease in the feed conversion ratio (FCR) in fertilized ponds indicates that the natural biota can partially substitute commercial diet in tambaqui production without compromising productivity, thereby reducing reliance on formulated feed. Therefore, an increase in natural food is desirable in this production system. Isotopic analyses showed that about 40% of tambaqui biomass comes from the aquatic biota. Therefore, tambaqui may be a candidate for restorative aquaculture practices. This characteristic may bring a new perspective to the production of this Amazon species.
The lower weight of tambaqui stomach content in fish produced in fertilized ponds could be because of the fastest movement of natural food in the gut [65] and its greater digestibility [65,66]. On the other hand, higher ingestion of formulated feed and its high participation in muscle building in unfertilized ponds justify the greater weight of stomach content in this treatment because it is less digestible. The stomachs were fixed in formalin solution until the analysis, and natural food may have had higher dehydration than formulated feed due to its humidity (~90%), increasing the difference observed [67]. Formulated feed was observed inside tambaqui stomachs despite the feeding stopped a day before gut samples. This presence is due to the long time elapsed from ingestion to gastric evacuation. In tambaqui, the gut is empty after 24 h of the last feeding only in 50% of fish [68]. In pacu, Piaractus mesopotamicus, a species of the same family of tambaqui, gastric emptying can occur in 56 h, depending on water temperature [69]. The ingestion rate of tambaqui decreased during the development, as it was demonstrated by the ratio of stomach weight and total fish weight.
In general, fertilization promotes an increase in natural food productivity in fishponds, which supplement formulated feed and result in higher fish growth and productivity [4]. The positive effect of fertilization on fish production was described for many fish species, such as carps in monoculture and polyculture [2,5,8,70], red-breasted tilapia (Coptodon rendalli, former Tilapia rendalli) [9], Nile tilapia (Oreochromis niloticus), North African catfish (Clarias gariepinus) [49], and pirarucu (Arapaima gigas) [71]. However, in the present study, fertilization did not improve tambaqui productivity, similar to what was observed by Gomes and Silva [22] in tambaqui and Duodu et al. [72] in Nile tilapia (Oreochromis niloticus) in combining feed with fertilization (N:P ratio of 1:1 and 1.6:1, respectively). In the present study, the commercial feed supplied in unfertilized ponds compensated for the lower natural food ingestion and did not affect fish growth. Thus, commercial feed available for tambaqui is probably well-balanced and allows fish to grow with a low dependence on natural food. As tambaqui is not a territorial or aggressive fish, it may be produced in intensive systems where natural food is negligible.
The water quality parameters meet those recommended for fish production by Boyd [73] in both fertilized and unfertilized ponds. Therefore, they did not affect the growth and survival of tambaqui. The temperature was similar in ponds of both treatments and fluctuated according to weather variations over the study (cf. INMET data [74]). Transparency was lower, and phytoplankton density was higher in some months in fertilized ponds, corroborating the impact of fertilization procedure in ponds described by Boyd [4]. The dissolved oxygen increased up to the fifth month, when it decreased, possibly because of an elevation in fish biomass that demands more oxygen. TAN decreased until the middle of the production cycle when it increased owing to an elevation in tambaqui biomass, as observed previously by Gomes and Silva [22] and indicated by Boyd [75]. Boyd [73] reports that feed and fertilizers are the primary sources of TAN in aquaculture systems. The similarity among treatments suggests that fertilizers had a low impact on TAN levels or that the ammonia was rapidly assimilated by phytoplankton in fertilized ponds. However, phosphorous concentration was significantly higher in fertilized ponds, suggesting that the ratio N:P in fertilizer was unbalanced for fulfilling the phytoplankton requests. Alkalinity and hardness were similar in all ponds of both treatments, probably because they were equally limed. Generally, the results indicated that the fertilization of earthen ponds using 5 g of urea, 3 g of triple superphosphate, and 10 g of rice bran per square meter produces a low effect on water quality in tambaqui ponds.
Fertilization management increased production costs despite reduced feed use. The costs of fertilizer and labor to handle it surpassed the expenditure reduction in commercial feed by 8%. Duodu et al. [72] also observed a slight increment in the production costs of Nile tilapia (Oreochromis niloticus) in Ghana when fish were produced by combining inorganic fertilization (1.6:1, N:P ratio) with commercial feed. As inorganic fertilizers are expensive, organic fertilizers could be an alternative to decrease the costs [76]. Further studies should be conducted to define the cost-effective composition and quantity supplied of fertilizers to lead to the best composition of zooplankton to feed tambaqui.
Generally, a large amount of nutrients is accumulated in fishpond bottoms [77]. Thus, techniques to suspend the sediments, such as aeration, may contribute to making nutrients laid in sediment available to the phytoplankton community [60]. The use of benthic species integrated with the culture of tambaqui may resuspend nutrients in the sediment by bioturbation with no cost [77,78,79]. Therefore, the culture of tambaqui combined with benthic feeders or iliophagus species may be advantageous to recovering sequestered nutrients, saving fertilizers and commercial diet. This practice increases the circularity and restorative capacity of the production system. In addition, it increases the productivity and diversity of products, transforming pollution into biomass of high economic value. Further studies should be performed to determine the best species and stocking densities and ratios for improving productivity in integrated systems.
5. Conclusions
Results indicated that the fertilization of tambaqui farming ponds with 2.45 g of nitrogen and 0.80 g of phosphorus per square meter (N:P ratio by mass of 3:1) every two weeks combined with a commercial diet does not affect fish growth, survival, and productivity and has a limited effect on water quality and production costs. However, fertilization can increase zooplankton density in the water column (via phytoplankton), which raises natural biota and autochthonous food availability. Natural food may represent about 40% (at least) of all assimilated food in the tambaqui muscles. However, this species can interchange between natural food and commercial feed without compromising its development. Therefore, tambaqui may be farmed in restorative and integrated aquaculture systems, following the principles of the circular economy, but also in intensive systems that rely on commercial feed. Further studies should be conducted increasing the levels of nitrogen and phosphorus and varying their ratio (N:P) in fertilizers, as well as the frequency of fertilization to determine the optimal fertilization management to improve tambaqui production in semi-intensive aquaculture.
Author Contributions
Conceptualization, A.F.L.; data curation, A.F.L.; formal analysis, A.F.L., A.G.P.d.R., V.E.C. and W.C.V.; investigation, A.F.L. and A.G.P.d.R.; methodology, A.F.L. and V.E.C.; project administration, A.F.L.; writing—original draft, A.F.L. and V.E.C.; writing—review and editing, W.C.V. All authors have read and agreed to the published version of the manuscript.
Funding
This research was part of BRS Aqua Program, supported by the Brazilian Development Bank—Technologic Fund (BNDES-Funtec), grant number 16.2.0225.1, Ministry of Agriculture, Livestock And Food Supply (MAPA), grant number 00350.000111/2014-50, Brazilian Agricultural Research Corporation (EMBRAPA), grant number 21.17.02.001.05.00, and the Brazilian National Council For Scientific and Technological Development (CNPq), grant number 421502/2017-7.
Institutional Review Board Statement
The study was conducted in accordance with the Brazilian guidelines for the care and use of animals for scientific and educational purposes and approved by the Animal Ethics Committee of EMBRAPA FISHERIES AND AQUACULTURE (protocol code 42/2018).
Informed Consent Statement
Not applicable.
Data Availability Statement
Data are contained within the article.
Conflicts of Interest
Author Adriana F. Lima and Anderson G. P. Reis were employed by the company Brazilian Agricultural Research Corporation (EMBRAPA). The remaining authors declare that the research was conducted in the absence of any commercial or financial relationships that could be construed as a potential conflict of interest.
References
- Alleway, H.K.; Waters, T.J.; Brummett, R.; Cai, J.; Cao, L.; Cayten, M.R.; Costa-Pierce, B.A.; Dong, Y.; Hansen, S.C.B.; Liu, S.; et al. Global principles for restorative aquaculture to foster aquaculture practices that benefit the environment. Conserv. Sci. Pract. 2023, 5, e12982. [Google Scholar] [CrossRef]
- Bhakta, J.N.; Bandyopadhyayl, P.K.; Jana, B.B. Effect of different doses of mixed fertilizer on some biogeochemical cycling bacterial population in carp culture pond. Turk. J. Fish. Aquat. Sci. 2006, 6, 165–171. Available online: http://www.trjfas.org/pdf/issue_6_2/165_171.pdf (accessed on 11 August 2021).
- Boyd, C.E.; D‘Abramo, L.R.; Glencross, B.D.; Huyben, D.C.; Juarez, L.M.; Lockwood, G.S.; McNevin, A.A.; Tacon, A.G.J.; Teletchea, F.; Tomasso, J.R.; et al. Achieving sustainable aquaculture: Historical and current perspectives and future needs and challenges. J. World Aquac. Soc. 2020, 51, 578–633. [Google Scholar] [CrossRef]
- Boyd, C.E. Aquaculture pond fertilization. CAB Rev. 2018, 13, 1–12. [Google Scholar] [CrossRef]
- Garg, S.K.; Bhatnagar, A. Effect of fertilization frequency on pond productivity and fish biomass in still water ponds stocked with Cirrhinus mrigala (Ham.). Aquac. Res. 2000, 31, 409–414. [Google Scholar] [CrossRef]
- Garg, S.K.; Bhatnagar, A. Effect of different doses of organic fertilizer (cow dung) on pond productivity and fish biomass in stillwater ponds. J. Appl. Ichthyol. 1999, 15, 10–18. [Google Scholar] [CrossRef]
- Bhakta, J.N.; Sarkar, D.; Jana, S.; Jana, B.B. Optimizing fertilizer dose for rearing stage production of carps under polyculture. Aquaculture 2004, 239, 125–139. [Google Scholar] [CrossRef]
- Tabinda, A.B.; Ayub, M. Effect of high phosphate fertilization rate on pond phosphate concentrations, chlorophyll a, and fish growth in carp polyculture. Aquac. Int. 2010, 18, 285–301. [Google Scholar] [CrossRef]
- Kang’Ombe, J.; Brown, J.A.; Halfyard, L.C. Effect of using different types of organic animal manure on plankton abundance, and on growth and survival of Tilapia rendalli (Boulenger) in ponds. Aquac. Res. 2006, 37, 1360–1371. [Google Scholar] [CrossRef]
- Rahman, M.M.; Nagelkerke, L.A.J.; Verdegem, M.C.J.; Wahab, M.A.; Verreth, J.A.J. Relationships among water quality, food resources, fish diet and fish growth in polyculture ponds: A multivariate approach. Aquaculture 2008, 275, 108–115. [Google Scholar] [CrossRef]
- Milstein, A.; Azim, M.E.; Wahab, M.A.; Verdegem, M.C.J. The effects of periphyton, fish and fertilizer dose on biological processes affecting water quality in earthen fish ponds. Environ. Biol. Fishes 2003, 68, 247–260. [Google Scholar] [CrossRef]
- Woynárovich, A.; Van Anrooy, R. Field Guide to the Culture of Tambaqui Colossoma macropomum, Cuvier, 1816. In FAO Fisheries and Aquaculture Technical Paper; FAO: Rome, Italy, 2019; Volume 624, Available online: https://books.google.com.br/books?id=WbKIDwAAQBAJ&printsec=frontcover&source=gbs_ge_summary_r&cad=0#v=onepage&q&f=false (accessed on 11 November 2022).
- Azim, M.E.; Verdegem, M.C.J.; Khatoon, H.; Wahab, M.A.; Van Dam, A.A.; Beveridge, M.C.M. A comparison of fertilization, feeding and three periphyton substrates for increasing fish production in freshwater pond aquaculture in Bangladesh. Aquaculture 2002, 212, 227–243. [Google Scholar] [CrossRef]
- Azim, M.E.; Little, D.C. Intensifying aquaculture production through new approaches to manipulating natural food. CAB Rev. 2007, 1, 23. [Google Scholar] [CrossRef]
- Cremer, M.C.; Smitherman, R.O. Food habits and growth of silver and bighead carp in cages and ponds. Aquaculture 1980, 20, 57–64. [Google Scholar] [CrossRef]
- Spataru, P.; Wohlfarth, G.W.; Hulata, G. Studies on the natural food of different fish species in intensively manured polyculture ponds. Aquaculture 1983, 35, 283–298. [Google Scholar] [CrossRef]
- Chakrabarti, R.; Jana, B.B. Plankton intake as a function of body weight by common carp fry in different feeding conditions. Aquaculture 1991, 93, 21–34. [Google Scholar] [CrossRef]
- Sipauba-Tavares, L.H.; Braga, F.M.D.S. Study on feeding habits of Piaractus mesopotamicus (Pacu) larvae in fish ponds. Naga ICLARM Q. 1995, 22, 24–29. [Google Scholar]
- Mai, M.G.; Zaniboni-Filho, E. The effect of storage age in external tanks in the larvicultura performance of Salminus brasiliensis (Osteichthyes, Characidae). Acta Sci. Anim. Sci. 2005, 27, 287–296. [Google Scholar]
- Sipaúba-Tavares, L.H.; Braga, F.M.S. The feeding activity of Colossoma macropomum larvae (tambaqui) in fishponds with water hyacinth (Eichhornia crassipesEichhornia crassipes) fertilizer. Braz. J. Biol. 2007, 67, 459–466. [Google Scholar] [CrossRef]
- Ribeiro, D.F.O.; Oliveira Nuñer, A.P. Feed preferences of Salminus brasiliensis (Pisces, Characidae) larvae in fish ponds. Aquaculture 2008, 274, 65–71. [Google Scholar] [CrossRef]
- Gomes, L.C.; Silva, C.R. Impact of pond management on tambaqui, Colossoma macropomum (Cuvier), production during growth-out phase. Aquac. Res. 2009, 40, 825–832. [Google Scholar] [CrossRef]
- Castelo Branco, M.A.; Arruda, M.A.; Gamito, S. Feeding habits of Solea senegalensis in earthen ponds in Sado estuary. J. Sea Res. 2010, 64, 446–450. [Google Scholar] [CrossRef]
- Aya, F.A.; Corpuz, M.N.C.; Garcia, L.M.B. Diet composition, feed preferences and mouth morphology of early stage silver therapon (Leiopotherapon plumbeus, Kner 1864) larvae reared in outdoor tanks. J. Appl. Ichthyol. 2015, 31, 77–82. [Google Scholar] [CrossRef]
- Lima, A.F.; Tavares-Filho, A.; Moro, G.V. Natural food intake by juvenile Arapaima gigas during the grow-out phase in earthen ponds. Aquac. Res. 2018, 49, 2051–2058. [Google Scholar] [CrossRef]
- Cyrus, M.D.; Bolton, J.J.; Macey, B.M. The use of stable isotope ratios δ13C and δ15N to track the incorporation of Ulva and other important dietary ingredients into the gonads of the sea urchin Tripneustes gratilla. Aquac. Nutr. 2020, 26, 174–185. [Google Scholar] [CrossRef]
- Asano, Y.; Hayashizaki, K.I.; Eda, H.; Khonglaliang, T.; Kurokura, H. Natural foods utilized by Nile tilapia, Oreochromis niloticus, in fertilizer-based fish ponds in Lao PDR identified through stable isotope analysis. Fish. Sci. 2010, 76, 811–817. [Google Scholar] [CrossRef]
- Filbrun Jesse, E.; Reynolds, C.A.; Culver, D.A. Effects of feeding rate on habitat quality in fish rearing ponds. J. World Aquac. Soc. 2013, 44, 198–209. [Google Scholar] [CrossRef]
- Abimorad, E.G.; Ducatti, C.; Castellani, D.; Jomori, R.K.; Portella, M.C.; Sartori, M.M.P.; Carneiro, D.J. Dietary lysine deficiency increases the incorporation rate of nitrogen-free compounds in muscle of pacu (Piaractus mesopotamicus). Aquaculture 2017, 479, 522–527. [Google Scholar] [CrossRef]
- Narimbi, J.; Mazumder, D.; Sammut, J. Stable isotope analysis to quantify contributions of supplementary feed in Nile Tilapia Oreochromis niloticus (GIFT strain) aquaculture. Aquac. Res. 2018, 49, 1866–1874. [Google Scholar] [CrossRef]
- Zhou, H.; Gu, B. Using stable isotope analysis to assess the relationship among dietary protein sources, growth, nutrient turnover and incorporation in Nile tilapia (Oreochromis niloticus). Aquac. Nutr. 2020, 26, 1443–1452. [Google Scholar] [CrossRef]
- Hilsdorf, A.W.S.; Hallerman, E.; Valladão, G.M.R.; Zaminhan-Hassemer, M.; Hashimoto, D.T.; Dairiki, J.K.; Takahashi, L.S.; Corrêa Albergaria, F.C.; Gomes, M.E.S.; Venturieri, R.L.L.; et al. The farming and husbandry of Colossoma macropomum: From Amazonian waters to sustainable production. Rev. Aquac. 2022, 14, 993–1027. [Google Scholar] [CrossRef]
- Goulding, M.; Carvalho, M. Life history and management of the tambaqui (Colossoma macropomum, Characidae): An important Amazonian food fish. Rev. Bras. Zool. 1982, 1, 107–133. [Google Scholar] [CrossRef]
- Da Silva, J.A.M.; Pereira-Filho, M.; de Oliveira-Pereira, M.I. Seasonal variation of nutrients and energy in tambaqui’s (Colossoma macropomum Cuvier, 1818) natural food. Braz. J. Biol. 2000, 60, 599–605. [Google Scholar] [CrossRef]
- FAO. Fishery and Aquaculture Statistics—Yearbook 2020. In FAO Yearbook of Fishery and Aquaculture Statistics; FAO: Rome, Italy, 2023. [Google Scholar] [CrossRef]
- Valladão, G.M.R.; Gallani, S.U.; Pilarski, F. South American fish for continental aquaculture. Rev. Aquac. 2018, 10, 351–369. [Google Scholar] [CrossRef]
- Valenti, W.C.; Barros, H.P.; Moraes-Valenti, P.; Bueno, G.W.; Cavalli, R.O. Aquaculture in Brazil: Past, present and future. Aquac. Rep. 2021, 19, 100611. [Google Scholar] [CrossRef]
- Roubach, R.; Gomes, L.C.; Leão Fonseca, F.A.; Val, A.L. Eugenol as an efficacious anaesthetic for tambaqui, Colossoma macropomum (Cuvier). Aquac. Res. 2005, 36, 1056–1061. [Google Scholar] [CrossRef]
- Hyslop, E.J. Stomach contents analysis—A review of methods and their application. J. Fish Biol. 1980, 17, 411–429. [Google Scholar] [CrossRef]
- Amundsen, P.-A.; Sánchez-Hernández, J. Feeding studies take guts—Critical review and recommendations of methods for stomach contents analysis in fish. J. Fish Biol. 2019, 95, 1364–1373. [Google Scholar] [CrossRef]
- Ivlev, V.W. Experimental Ecology of the Feeding of Fishes; Yale University Press: New Haven, CT, USA, 1961; p. 302. [Google Scholar]
- Coplen, T.B. Guidelines and recommended terms for expression of stable-isotope-ratio and gas-ratio measurement results. Rapid Commun. Mass Spectrom. 2011, 25, 2538–2560. [Google Scholar] [CrossRef]
- Brand, W.A.; Coplen, T.B. Stable isotope deltas: Tiny, yet robust signatures in nature. Isot. Environ. Health Stud. 2012, 48, 393–409. [Google Scholar] [CrossRef]
- Paul, D.; Skrzypek, G.; Fórizs, I. Normalization of measured stable isotopic compositions to isotope reference scales—A review. Rapid Commun. Mass Spectrom 2007, 21, 3006–3014. [Google Scholar] [CrossRef]
- Schimmelmann, A.; Qi, H.; Coplen, T.B.; Brand, W.A.; Fong, J.; Meier-Augenstein, W.; Kemp, H.F.; Toman, B.; Ackermann, A.; Assonov, S.; et al. Organic reference materials for hydrogen, carbon, and nitrogen stable isotope-ratio measurements: Caffeines, n-alkanes, fatty acid methyl esters, glycines, l-valines, polyethylenes, and oils. Anal. Chem. 2016, 88, 4294–4302. [Google Scholar] [CrossRef]
- Britton, J.R.; Busst, G.M.A. Stable isotope discrimination factors of omnivorous fishes: Influence of tissue type, temperature, diet composition and formulated feeds. Hydrobiologia 2018, 808, 219–234. [Google Scholar] [CrossRef]
- APHA. Standard Methods for the Examination of Water and Waste Water, 21st ed.; American Public Health Association: Washington, DC, USA, 2017. [Google Scholar]
- Engle, C.R. Aquaculture Economics and Financing: Management and Analysis; John Wiley & Sons: Hoboken, NJ, USA, 2010. [Google Scholar]
- Veverica, K.; Bowman, J.; Gichuri, W.; Izaru, P.; Mwau, P.; Popma, T. Relative Contribution of supplemental feed and inorganic fertilizers in semi-intensive tilapia production. In Seventeenth Annual Technical Report; McElwee, K., Burke, D., Niles, M., Cummings, X., Egna, H., Eds.; Pond Dynamics/Aquaculture CRSP, Oregon State University: Corvallis, OR, USA, 2000; pp. 23–28. [Google Scholar]
- Liranço, A.D.D.S.; Romagosa, E.; Scorvo-Filho, J.D. Growth performance of Pseudoplatystoma corruscans stocked in rearing systems: Semi-intensive (ponds) and intensive (cages). Ciência Rural. 2011, 41, 524–530. Available online: http://www.scielo.br/scielo.php?pid=S0103-84782011000300027&script=sci_arttext&tlng=es (accessed on 9 March 2018). [CrossRef]
- Box, G.E.P.; Cox, D.R. An analysis of transformation. J. R. Stat. Soc. 1964, 26, 211–243. [Google Scholar] [CrossRef]
- R Core Team, R. A Language and Environment for Statistical Computing; R Foundation for Statistical Computing: 2021, Viena, Austria. Available online: https://www.r-project.org/ (accessed on 15 June 2023).
- Filbrun, J.E.; Culver, D.A. Stable isotopes reveal live prey support growth of juvenile channel catfish reared under intensive feeding regimens in ponds. Aquaculture 2014, 433, 125–132. [Google Scholar] [CrossRef]
- Jomori, R.K.; Ducatti, C.; Carneiro, D.J.; Portella, M.C. Stable carbon (δ13C) and nitrogen (δ15N) isotopes as natural indicators of live and dry food in Piaractus mesopotamicus (Holmberg, 1887) larval tissue. Aquac. Res. 2008, 39, 370–381. [Google Scholar] [CrossRef]
- Lima, A.F.; Rodrigues, A.P.O.; Costa, V.E. Frozen zooplankton is efficient as natural food during pirarucu Arapaima gigas weaning. Aquac. Res. 2021, 52, 4227–4236. [Google Scholar] [CrossRef]
- Oliveira, A.C.B.; Martinelli, L.A.; Moreira, M.Z.; Soares, M.G.M.; Cyrino, J.E.P. Seasonality of energy sources of Colossoma macropomum in a floodplain lake in the Amazon—Lake Camaleão, Amazonas, Brazil. Fish. Manag. Ecol. 2006, 13, 135–142. [Google Scholar] [CrossRef]
- Bateman, A.S.; Kelly, S.D. Fertilizer nitrogen isotope signatures. Isot. Environ. Health Stud. 2007, 43, 237–247. [Google Scholar] [CrossRef]
- Lomartire, S.; Marques, J.C.; Gonçalves, A.M. The key role of zooplankton in ecosystem services: A perspective of interaction between zooplankton and fish recruitment. Ecol. Indic. 2021, 129, 107867. [Google Scholar] [CrossRef]
- Brucet, S.; Boix, D.; Quintana, X.D.; Jensen, E.; Nathansen, L.W.; Trochine, C.; Meerhoff, M.; Gascón, S.; Jeppesena, E. Factors influencing zooplankton size structure at contrasting temperatures in coastal shallow lakes: Implications for effects of climate change. Limnol. Oceanogr. 2010, 55, 1697–1711. [Google Scholar] [CrossRef]
- Vakkilainen, K.; Kairesalo, T.; Hietala, J.; Balayla, D.M.; Becares, E.; Van De BUnd, W.J.; Van Donk, E.; Fernandez-Alaez, M.; Gyllstrom, M.; Hansson, L.-A.; et al. Response of zooplankton to nutrient enrichment and fish in shallow lakes: A pan-European mesocosm experiment. Freshw. Biol. 2004, 49, 1619–1632. [Google Scholar] [CrossRef]
- Sipaúba-Tavares, L.H. Análise da seletividade alimentar em larvas de tambaqui (Colossoma macropomum) e tambacu (híbrido, pacu Piaractus mesopotamicus e tambaqui Colossoma macropomum) sobre os organismos zooplanctônicos. Acta Limnol. Bras. 1993, 6, 114–132. [Google Scholar]
- Lima, A.F.; Pereira, A.S.; de Oliveira Costa-Fernandes, T.; Rodrigues, A.P.O.; Costa, V.E.; Maciel-Honda, P.O. The effect of nursery production system (in cage and pond) on performance, health status, and plankton ingestion of the low trophic level fish tambaqui, Colossoma macropomum. Aquaculture 2024, 586, 740721. [Google Scholar] [CrossRef]
- Chary, K.; van Riel, A.; Muscat, A.; Wilfart, A.; Harchaoui, S.; Verdegem, M.; Filgueira, R.; Troell, M.; Henriksson, P.J.G.; de Boer, I.J.M.; et al. Transforming sustainable aquaculture by applying circularity principles. Rev. Aquac. 2023, 16, 656–673. [Google Scholar] [CrossRef]
- Aubin, J.; Callier, M.; Rey-Valette, H.; Mathé, S.; Wilfart, A.; Legendre, M.; Slembrouck, J.; Caruso, D.; Chia, E.; Masson, G.; et al. Implementing ecological intensification in fish farming: Definition and principles from contrasting experiences. Rev. Aquac. 2019, 11, 149–167. [Google Scholar] [CrossRef]
- Watanabe, T.; Kiron, V. Prospects in larval fish dietetics. Aquaculture 1994, 124, 223–251. [Google Scholar] [CrossRef]
- Bakke, A.M.; Glover, C.; Krogdahl, Å. Feeding, digestion and absorption of nutrients. Fish Physiol. 2010, 30, 57–110. [Google Scholar] [CrossRef]
- Mitra, G.; Mukhopadhyay, P.K.; Ayyappan, S. Biochemical composition of zooplankton community grown in freshwater earthen ponds: Nutritional implication in nursery rearing of fish larvae and early juveniles. Aquaculture 2007, 272, 346–360. [Google Scholar] [CrossRef]
- da Silva Reis, Y.; Leite, J.L.R.; de Almeida, C.A.L.; Pereira, D.S.P.; Vidal, L.V.O.; de Araujo, F.G.; Fortes-Silva, R. New insights into tambaqui (Colossoma macropomum) feeding behavior and digestive physiology by the self-feeding approach: Effects on growth, dial patterns of food digestibility, amylase activity and gastrointestinal transit time. Aquaculture 2019, 498, 116–122. [Google Scholar] [CrossRef]
- Dias-Koberstein, T.C.R.; Carneiro, D.J.; Urbinati, E.C. Gastrointestinal passage time length and gastric emptying of pacu (Piaractus mesopotamicus) in different temperatures. Acta Scientiarum Anim. Sci. 2005, 27, 413–417. [Google Scholar]
- Garg, S.K.; Bhatnagar, A. Effect of varying closes of organic and inorganic fertilizers on plankton production and fish biomass in brackish water fish ponds. Aquac. Res. 1996, 27, 157–166. [Google Scholar] [CrossRef]
- Rezende, F.P.; Lima, A.F. Effect of pond fertilization on growth performance of pirarucu during grow-out phase. Lat. Am. J. Aquat. Res. 2022, 50, 22–30. [Google Scholar] [CrossRef]
- Duodu, C.; Boateng, D.; Edziyie, R. Effect of pond fertilization on productivity of tilapia pond culture in Ghana. J. Fish. Coast. Manag. 2020, 2, 56–64. [Google Scholar] [CrossRef]
- Boyd, C.E. Water Quality: An Introduction; Springer: Cham, Switzerland, 2020; 440p. [Google Scholar] [CrossRef]
- INMET. INMET Tempo. 2021. Available online: https://tempo.inmet.gov.br/ (accessed on 19 October 2021).
- Boyd, C.E.; Ammonia Nitrogen Dynamics in Aquaculture. Global Aquaculture Advocate. Available online: https://www.aquaculturealliance.org/advocate/ammonia-nitrogen-dynamics-in-aquaculture/ (accessed on 8 October 2018).
- Das, S.K.; Jana, B.B. Pond fertilization regimen: State-of-the-art. J. Appl. Aquac. 2003, 13, 35–66. [Google Scholar] [CrossRef]
- Flickinger, D.L.; Costa, G.A.; Dantas, D.P.; Moraes-Valenti, P.; Valenti, W.C. The budget of nitrogen in the grow-out of the Amazon River prawn (Macrobrachium amazonicum Heller) and tambaqui (Colossoma macropomum Cuvier) farmed in monoculture and in integrated multitrophic aquaculture systems. Aquac. Res. 2019, 50, 3444–3461. [Google Scholar] [CrossRef]
- Flickinger, D.L.; Costa, G.A.; Dantas, D.P.; Proença, D.C.; David, F.S.; Durborow, R.M.; Moraes-Valenti, P.; Valenti, W.C. The budget of carbon in the farming of the Amazon river prawn and tambaqui fish in earthen pond monoculture and integrated multitrophic systems. Aquac. Rep. 2020, 17, 100340. [Google Scholar] [CrossRef]
- Flickinger, D.L.; Dantas, D.P.; Proença, D.C.; David, F.S.; Valenti, W.C. Phosphorus in the culture of the Amazon River prawn (Macrobrachium amazonicum) and tambaqui (Colossoma macropomum) farmed in monoculture and in integrated multitrophic systems. J. World Aquac. Soc. 2020, 51, 1002–1023. [Google Scholar] [CrossRef]


Disclaimer/Publisher’s Note: The statements, opinions and data contained in all publications are solely those of the individual author(s) and contributor(s) and not of MDPI and/or the editor(s). MDPI and/or the editor(s) disclaim responsibility for any injury to people or property resulting from any ideas, methods, instructions or products referred to in the content. |
© 2024 by the authors. Licensee MDPI, Basel, Switzerland. This article is an open access article distributed under the terms and conditions of the Creative Commons Attribution (CC BY) license (https://creativecommons.org/licenses/by/4.0/).