Article

Improving the Hydrodynamic Performance of Underwater Tags for Blue Shark Monitoring

1
MEtRICs Research Centre, University of Minho, 4800-058 Guimarães, Portugal
2
CMEMS Research Centre, University of Minho, 4800-058 Guimarães, Portugal
3
ALGORITMI Research Centre, University of Minho, 4800-058 Guimarães, Portugal
4
LABELS—Associate Laboratory, 4800-058 Guimarães, Portugal
5
CEiiA, Av. D. Afonso Henriques, 1825, 4450-017 Matosinhos, Portugal
*
Author to whom correspondence should be addressed.
Inventions 2024, 9(3), 48; https://doi.org/10.3390/inventions9030048
Submission received: 15 March 2024 / Revised: 17 April 2024 / Accepted: 18 April 2024 / Published: 26 April 2024

Abstract

:
The use of tag devices in marine environments has become indispensable in attaining a better understanding of marine life and contributing to conservation efforts. However, the successful deployment and operation of underwater tags both depend significantly on their hydrodynamic characteristics, particularly their resistance to motion and stability in various environmental conditions. Herein, a comprehensive study on the hydrodynamic characteristics and optimization of an underwater tag designed for monitoring blue sharks is presented. Firstly, a validation process is conducted by comparing the computational fluid dynamics (CFD) results with the experimental data from Myring’s study, focusing on the resistance characteristics of the tag’s body and the impact of various operational conditions. Subsequently, the validated CFD model is applied to assess the hydrodynamic performance of the tag under different flow conditions, velocities, and angles of attack. Through iterative simulations, including mesh independence studies and boundary condition adjustments, the study identifies key parameters influencing the tag’s resistance and stability. Furthermore, the paper proposes and implements design modifications, including the incorporation of stabilizing fins, aimed at minimizing resistance and improving the tag’s equilibrium position. The effectiveness of these design enhancements is demonstrated through a comparative analysis of resistance and pitching moments for both preliminary and optimized tag configurations. Overall, the study provides valuable insights into the hydrodynamic behavior of underwater tags and offers practical recommendations for optimizing their design to minimize interference with the movement of tagged marine animals.

1. Introduction

Underwater tagging technology plays a crucial role in understanding the behavior and ecology of marine animals [1,2,3,4]. These devices provide researchers with valuable data on migration patterns, behavior, and ecological interactions [5,6,7,8]. Moreover, the data collected from tag devices contribute to the development of evidence-based conservation policies and protected marine areas [9,10,11,12]. However, their use in marine environments comes with challenges [13]. Ensuring the welfare of tagged animals, minimizing the environmental impact of the tags, and addressing data accuracy issues are ongoing considerations in marine research. To ensure that the acquired data accurately reflect the typical behavior of the animal and can be generalized for the entire species, it is imperative to guarantee that the tagging process does not disrupt the animal carrying the tag [14,15]. For this reason, researchers have dedicated considerable efforts to advancing hydrodynamic tags tailored for specific applications [16,17].
Computational fluid dynamics (CFD) offers researchers the ability to analyze complex flow problems with precision in several engineering areas, including aquatic research [18,19,20]. Nevertheless, it is of great importance to validate the numerical model. Pan et al. [21] were able to predict within a 5% discrepancy margin, when compared with experimental results, the force and moment coefficients for a submarine shape inspired in Myring’s design [22]. Another example was presented by Bartolomeu et al. [23], who correlated simulated data through CFD with the experimental data gathered in Myring’s work, towing a torpedo-shaped body through a water tank. Although the presented cases refer to large-scale bodies when compared to the ones typical of a tagging device and not necessarily operating in the same range of Reynolds number, one particular paper presented the results of a laminar flow across a micro autonomous underwater vehicle, which was 200 mm in length [17]. The authors could find some correlation between the few experimental data and simulated results. On the other hand, Wang and co-workers [24] proposed a micro hydropower system to enhance the energy supply for marine animal telemetry tags, allowing them to collect environmental and biological behavior data during migrations and dives. The researchers developed a mathematical model for the power system and validated it through experimental tests. The results showed that the energy efficiency is minimally influenced by the dive depth and showed to be a highly efficient method for ultra-high head hydropower generation in marine environments.
Artificial intelligence is another tool that that can help us to have a deeper understanding of the underwater world in regard to topics such as species conservation, pollution monitoring, and sustainable fisheries management [25,26]. This synergy can greatly improve aquatic monitoring and the exploration of the ocean depths. Furthermore, AI-powered robots, such as the CUREE robot [25], are an example of that, as they can operate autonomously, minimizing human interference with marine life.
Despite the efforts made so far, as technology continues to advance, researchers are exploring innovative solutions to enhance the capabilities of tag devices, while mitigating potential drawbacks. For instance, blue sharks are one of the most widely spread species of sharks and also one of the most fished [6]. Although there are a lot of unknowns about their existence, distribution, and habits, they are considered to be “near threatened” [27,28,29] according to the extinction scale. Bearing this in mind, a non-intrusive shark tagging-device conceptualization was previously developed [30], aiming to not harm the animals and not disrupt their natural behavior. In the present work, the optimization of this shark tagging device is presented, highlighting the integration of stabilizing elements such as fins. CFD simulations were conducted by using Ansys Fluent software, and their validation was conducted.

2. Materials and Methods

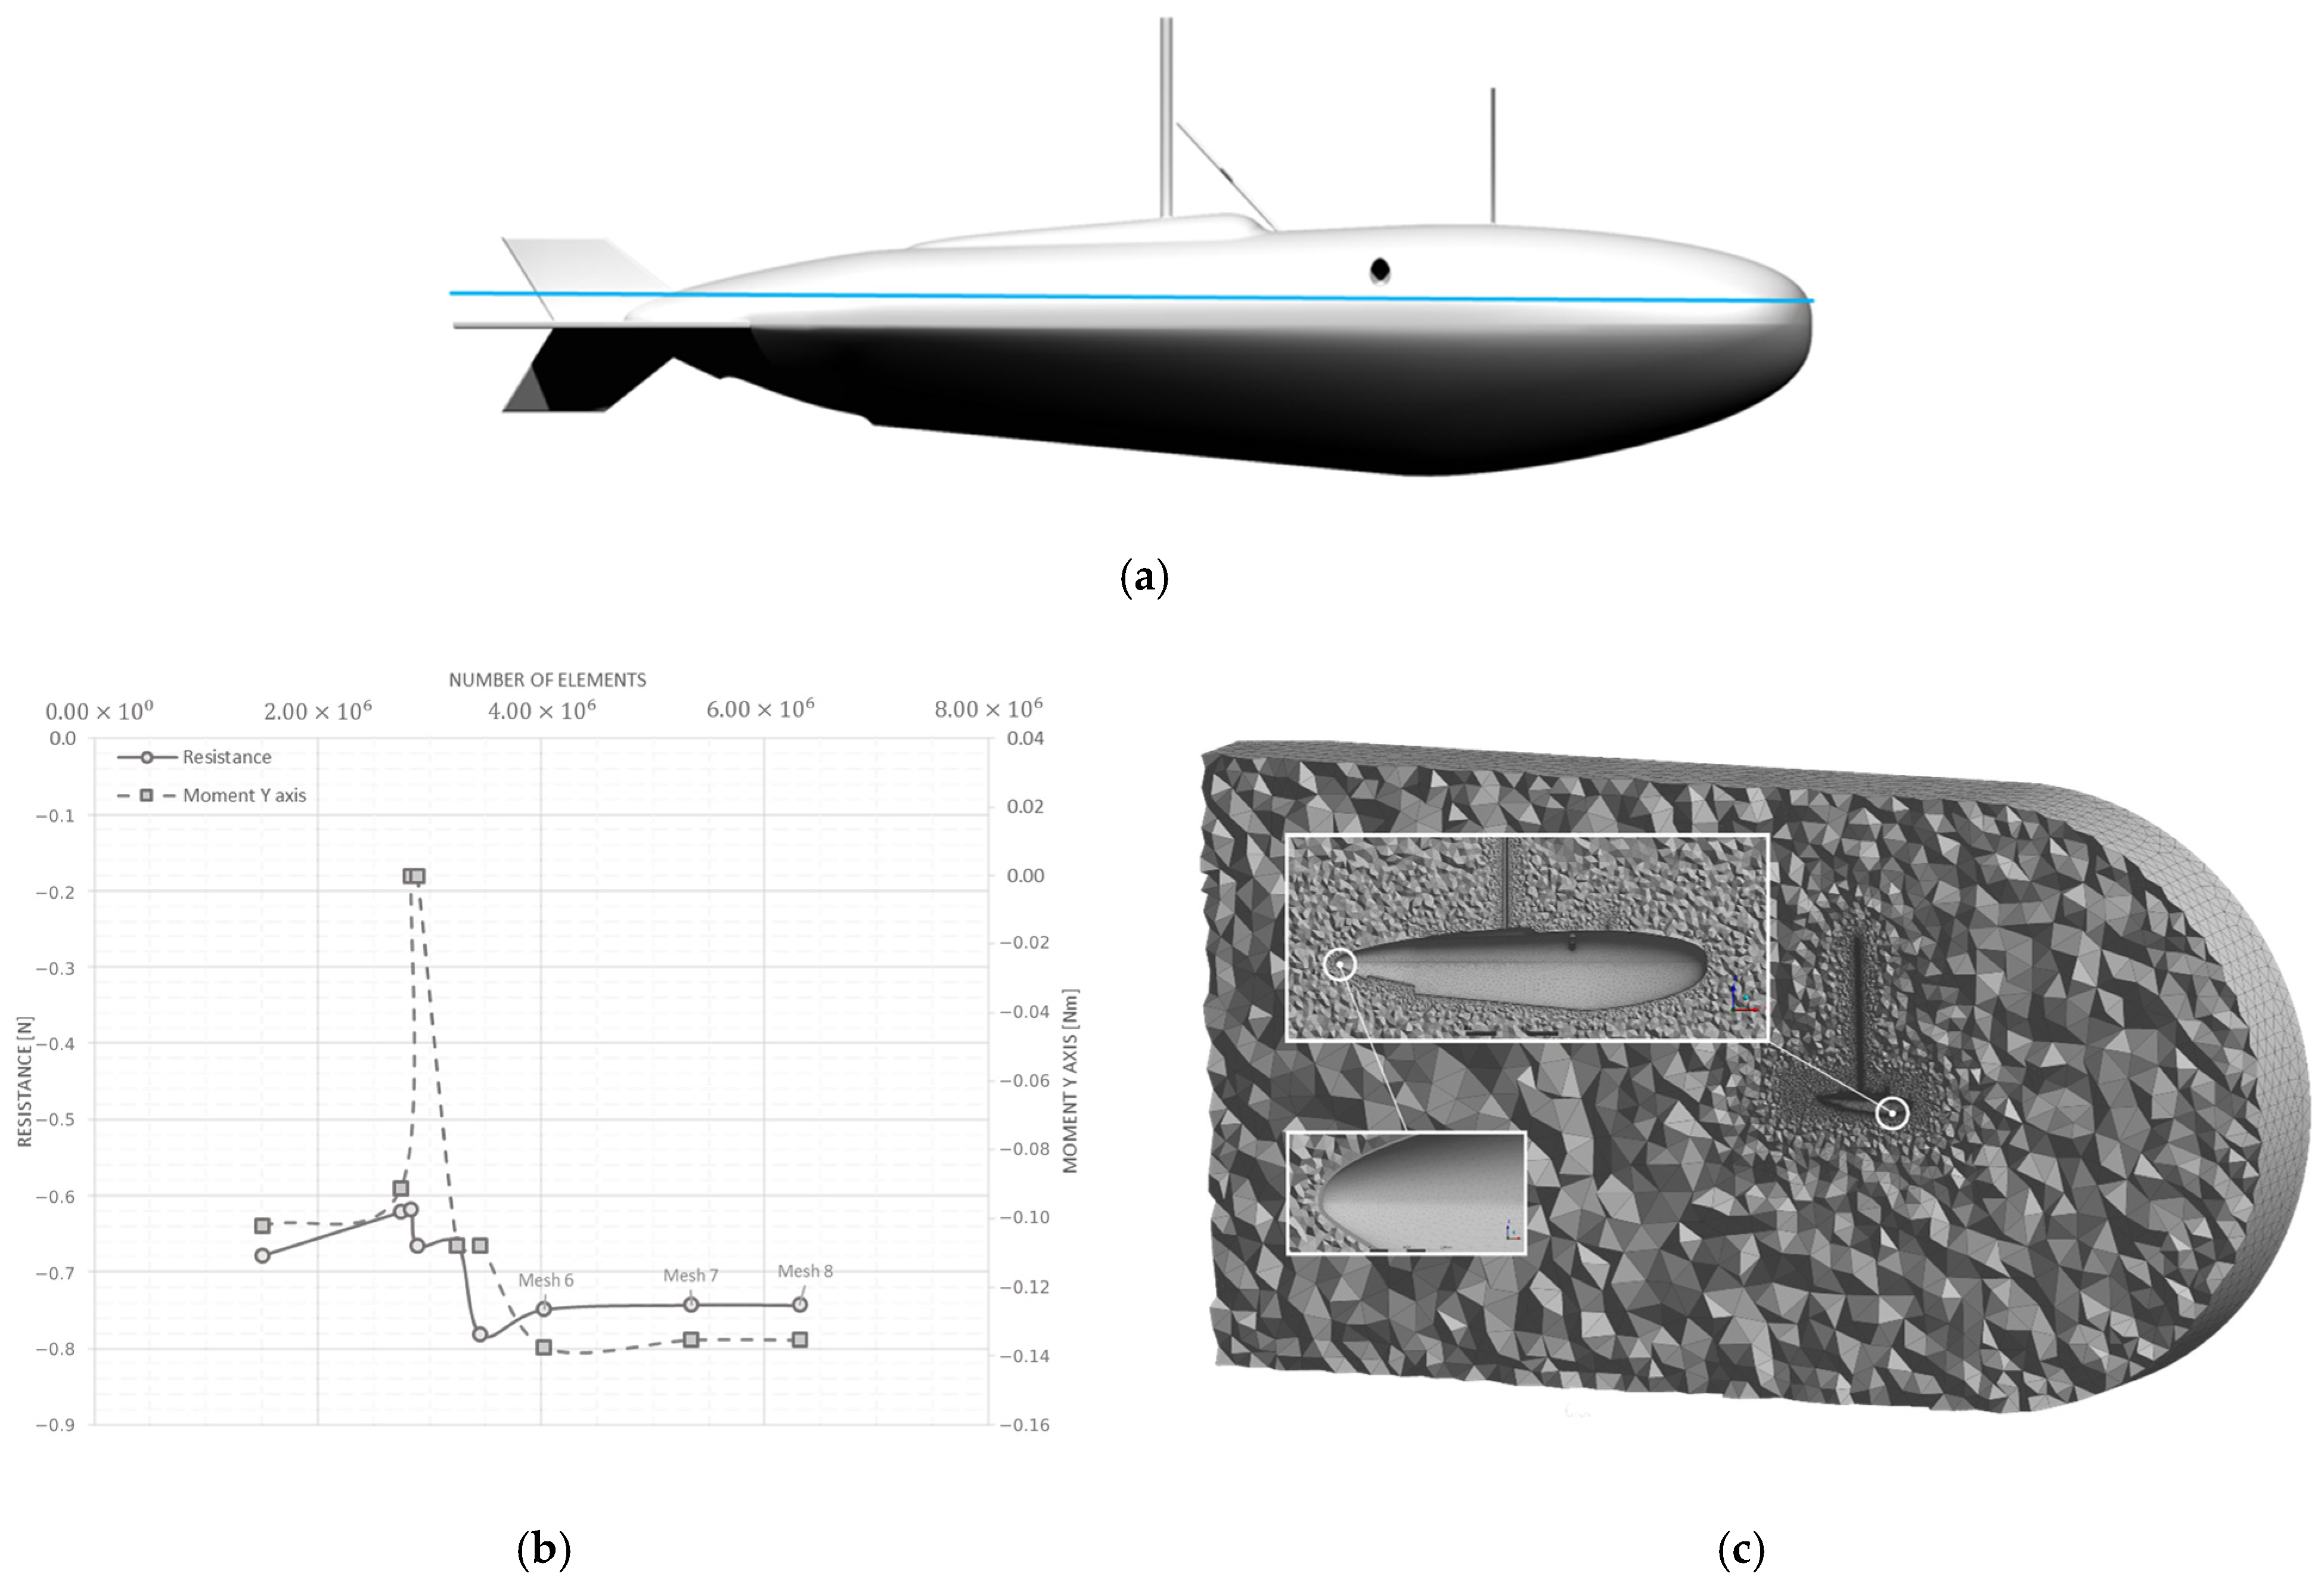
2.1. Geometry and Mesh

The conceptual shape of the tag’s body device is simulated in order to study the effects of the flow conditions (Figure 1a) [28]. In this way, the flow domain around the tag was also modelled. To ensure that the full development of the wake would be well captured, a length downstream of the body of three times its length was kept [23,31]. The domain was designed with a curved inlet region, allowing for the flexibility of inlet directions.
The next step consisted of discretizing the domain into small elements, forming the mesh to perform the CFD simulation. In the first stage, the elements forming the faces of the body were downsized, assuring shape fidelity. Subsequently, the first layers of elements around the body were refined so that they gradually grow from the body until the free stream region. This refined region, also known as the inflation layer, allows us to capture the viscous phenomena inside the boundary layer of the flow. Furthermore, the first layer’s height is a determinant factor for the y+ mesh value, which is the non-dimensional distance of this height based on the local fluid velocity. Lastly, the wake region also needs to be more refined compared to the undisturbed region of the flow, which may be achieved by implementing a control volume—in this case, a cylinder. These regions are prone to the formation of vortices and reverse flow, hence affecting the overall resistance. A mesh independence study was necessary in order to choose the best domain discretization (Figure 1b).
Figure 1b shows the results obtained with the different meshes, in which it is visible that mesh 6 yields basically the same results as meshes 7 and 8, having 2 million elements less than the latter. For this reason, mesh 6 was selected for simulating the different operational cases. Figure 1c depicts the mesh size along a longitudinal plane, including the regions of refined mesh (as inserts).

2.2. Governing Equations

The fluid flow around the tag was simulated utilizing a finite volume-based simulation approach implemented into the Ansys FLUENT R19 software. This solves the three-dimensional equations for mass (Equation (1)) and momentum (Equation (2)), assuming conservation for each variable:
v = 0
· ρ v v = p + · τ ¯ ¯
The fluid was assumed incompressible and turbulent. In turbulent flows, such as those expected around the tag, chaotic fluctuations in velocity and pressure are verified [32]. In the present work, the k ω   S S T model was chosen since it not only reveals a better agreement with the experimental [20] results but is also able to capture the viscous effects inside the boundary layer opposite to the k ϵ model [32].
This is an empirical model based on modelled transport equations for the turbulent kinetic energy, k , and the specific dissipation rate, ω (Equations (3) and (4)):
x i ρ k u i = x j k k x j + G k Y k + S k
x i ρ ω u i = x j ω ω x j + G ω Y ω + D ω + S ω
where G k represents the generation of turbulence kinetic energy due to mean velocity gradients; G ω represents the generation of ω ; ω and k represent the effective diffusivity of k and ω , respectively; Y k and Y ω represent the dissipation of k and ω due to turbulence; D ω represents the cross-diffusion term; and, finally, S k and S ω are user-defined source terms.

2.3. Boundary Conditions and Fluid Properties

The selected fluid for the simulations was liquid water. However, its density was adjusted to 1025 kg m−3, and its dynamic viscosity was defined as 0.001518 kg m−1 s−1 to better reflect seawater at a 1000 m depth [33].
To close the differential equations (Equations (1) and (2)), an inlet velocity was assumed based on the flow direction and magnitude, as well as a pressure outlet on the opposite wall. Also, the wet surfaces of the tag were defined as walls, and the lateral boundaries were defined as walls with a free-slip condition to avoid the influence of its viscous effects on the remaining flow.
The turbulence intensity was set to 0.05%, as recommended by Ansys for free stream flows. As for the turbulence length scale, it was set to 7% of the bodies’ length, which is an appropriate approximation for a flow across an obstacle [34]. Nonetheless, the turbulence generated in the shear layers makes the result insensitive to this value.

3. Numerical Model Validation

Before proceeding with the various tests and obtaining the results, a validation of the numerical model is important. The model was applied to a known geometry whose accurate experimental results are available in the literature.

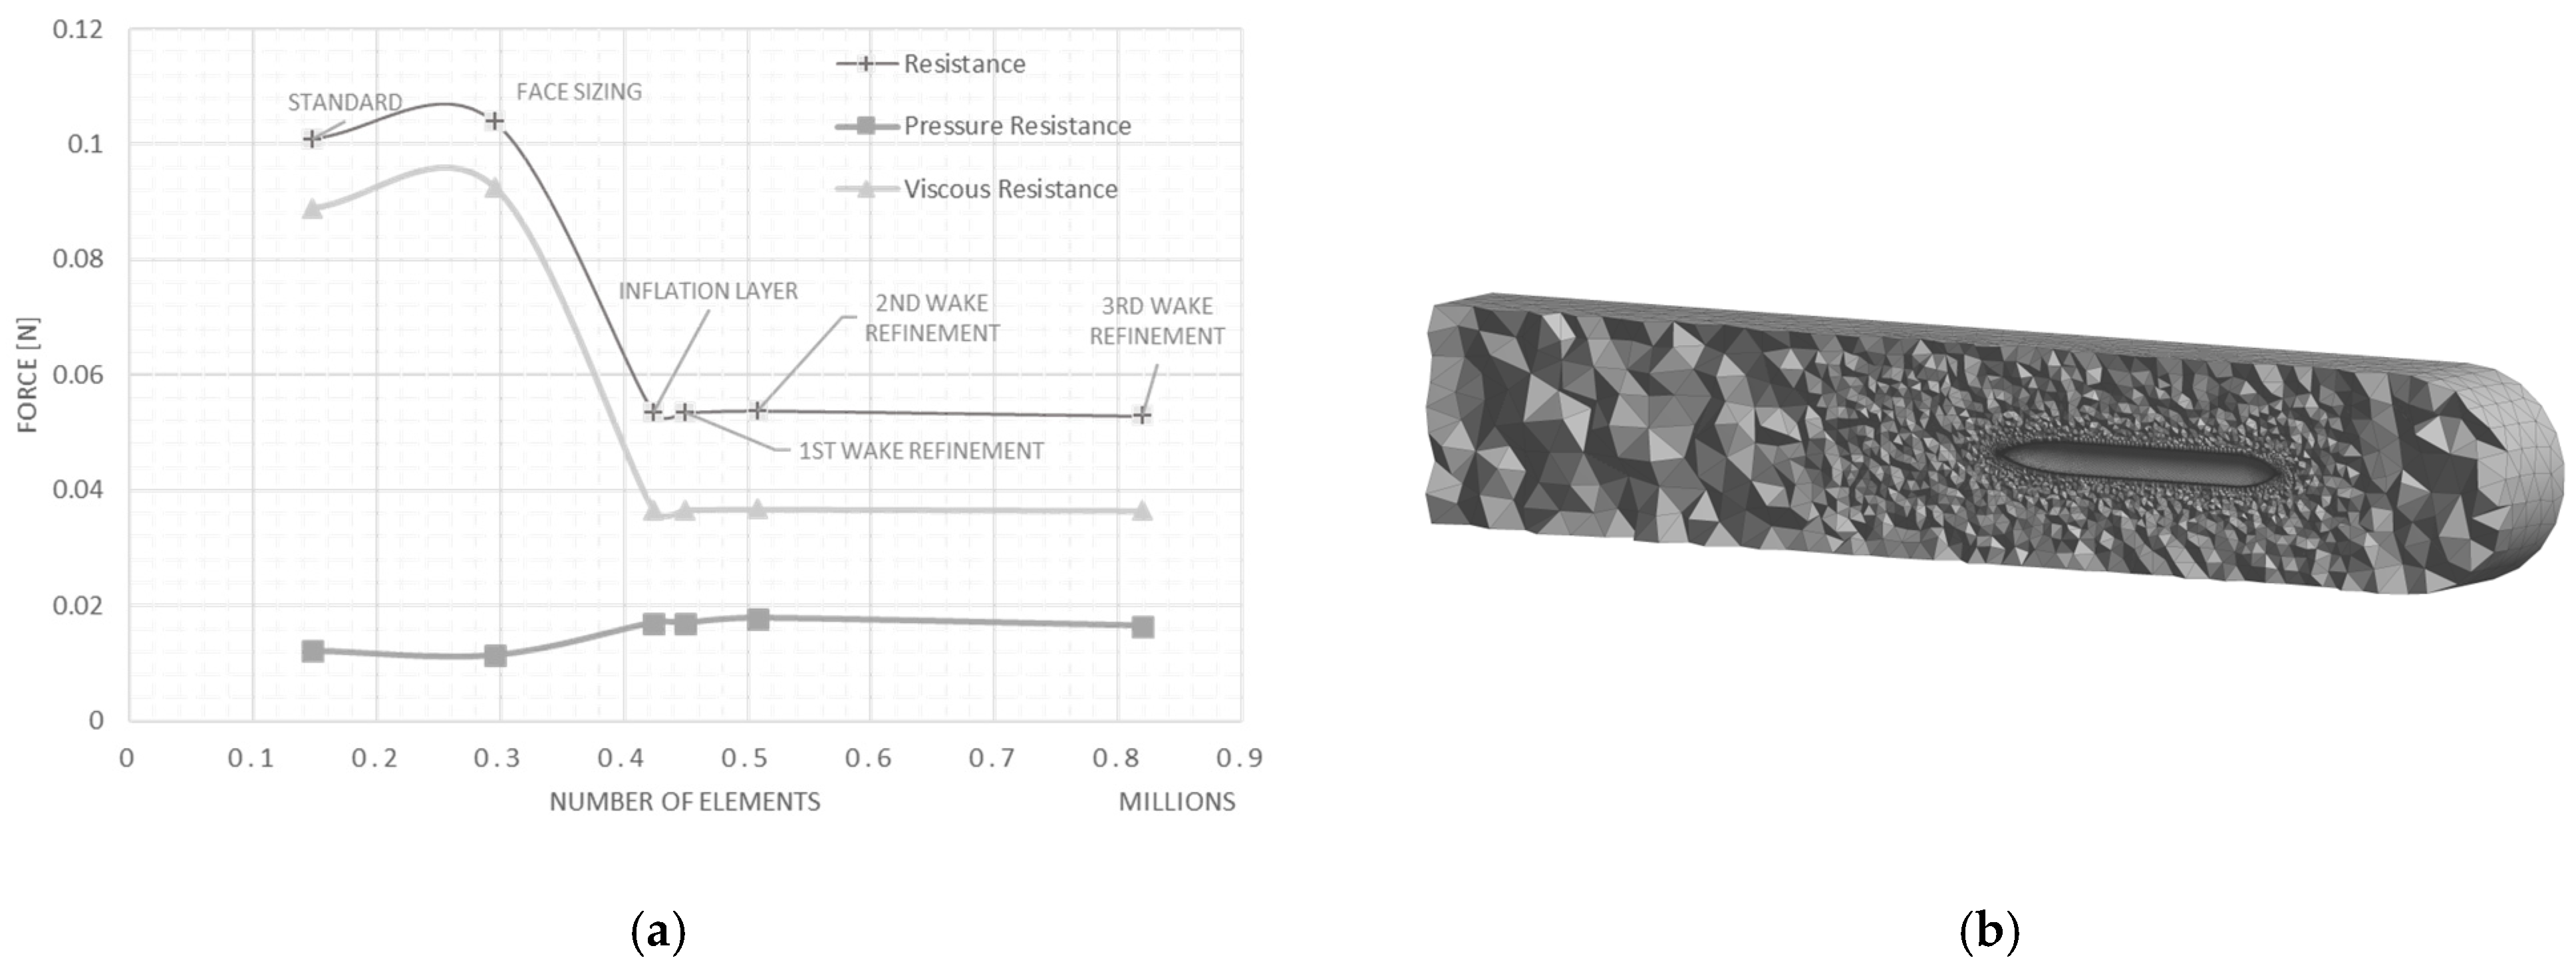
3.1. Geometry and Mesh

Amongst all the reviewed works, Myring’s study [22] emerges as a reference for many designs of underwater vehicles. Moreover, this work is the most detailed in terms of resistance characterization. As such, the intended flow conditions ought to be implemented, based on one of his designs, and the model validated through comparison with his results. The geometry studied by Myring is defined by equations that provide the radius ( r ) at a given axial location ( x ), as described in Equations (5)–(7):
Nose   section :                                                       r = 1 2 D 1 x a a 2 1 n
Mid - section :                                                         r = 1 2 D
Tail   section :                 r = 1 2 D 3 D 2 100 a b 2 tan α 100 a b x a b 2 + D 100 a b 3 tan α 100 a b 2 x a b 3
where a and b are the nose and mid-section lengths, n represents the nose index, and α represents the tail semi-angle. Although these equations are based on percentage values, the output was scaled to match the tag’s desired 300 mm maximum length, assuring, by this manner, similitude between this case and the tag’s studies. Figure 2a displays the resultant body, which is based on Myring’s model B.
As mentioned before in the tag case, the flow domain was also modelled. Figure 2b represents a longitudinal cross-section view the flow domain used, and the same boundary conditions are illustrated.
Although the flow conditions are the same as in the tag case, since the geometry changed, it was required to perform a new mesh independency study to find the ideal compromise between the number of elements—hence, the computational time—and the accuracy in resistance prediction. The rationale behind the process remained the same, and convergence, based on the number of cells, was searched for the resistance and pitching moment.
Figure 3a represents the mesh independency in the study of the drag force performed for the Myring’s shape at 1 m s−1 and an angle of attack of zero degrees. Studying this diagram, it is possible to conclude that the last three meshes provide approximately the same results. As such, it was decided, for computational economic purposes, to use the one with fewer elements to proceed with the validation study. In Figure 3b, it is possible to visualize the selected mesh.

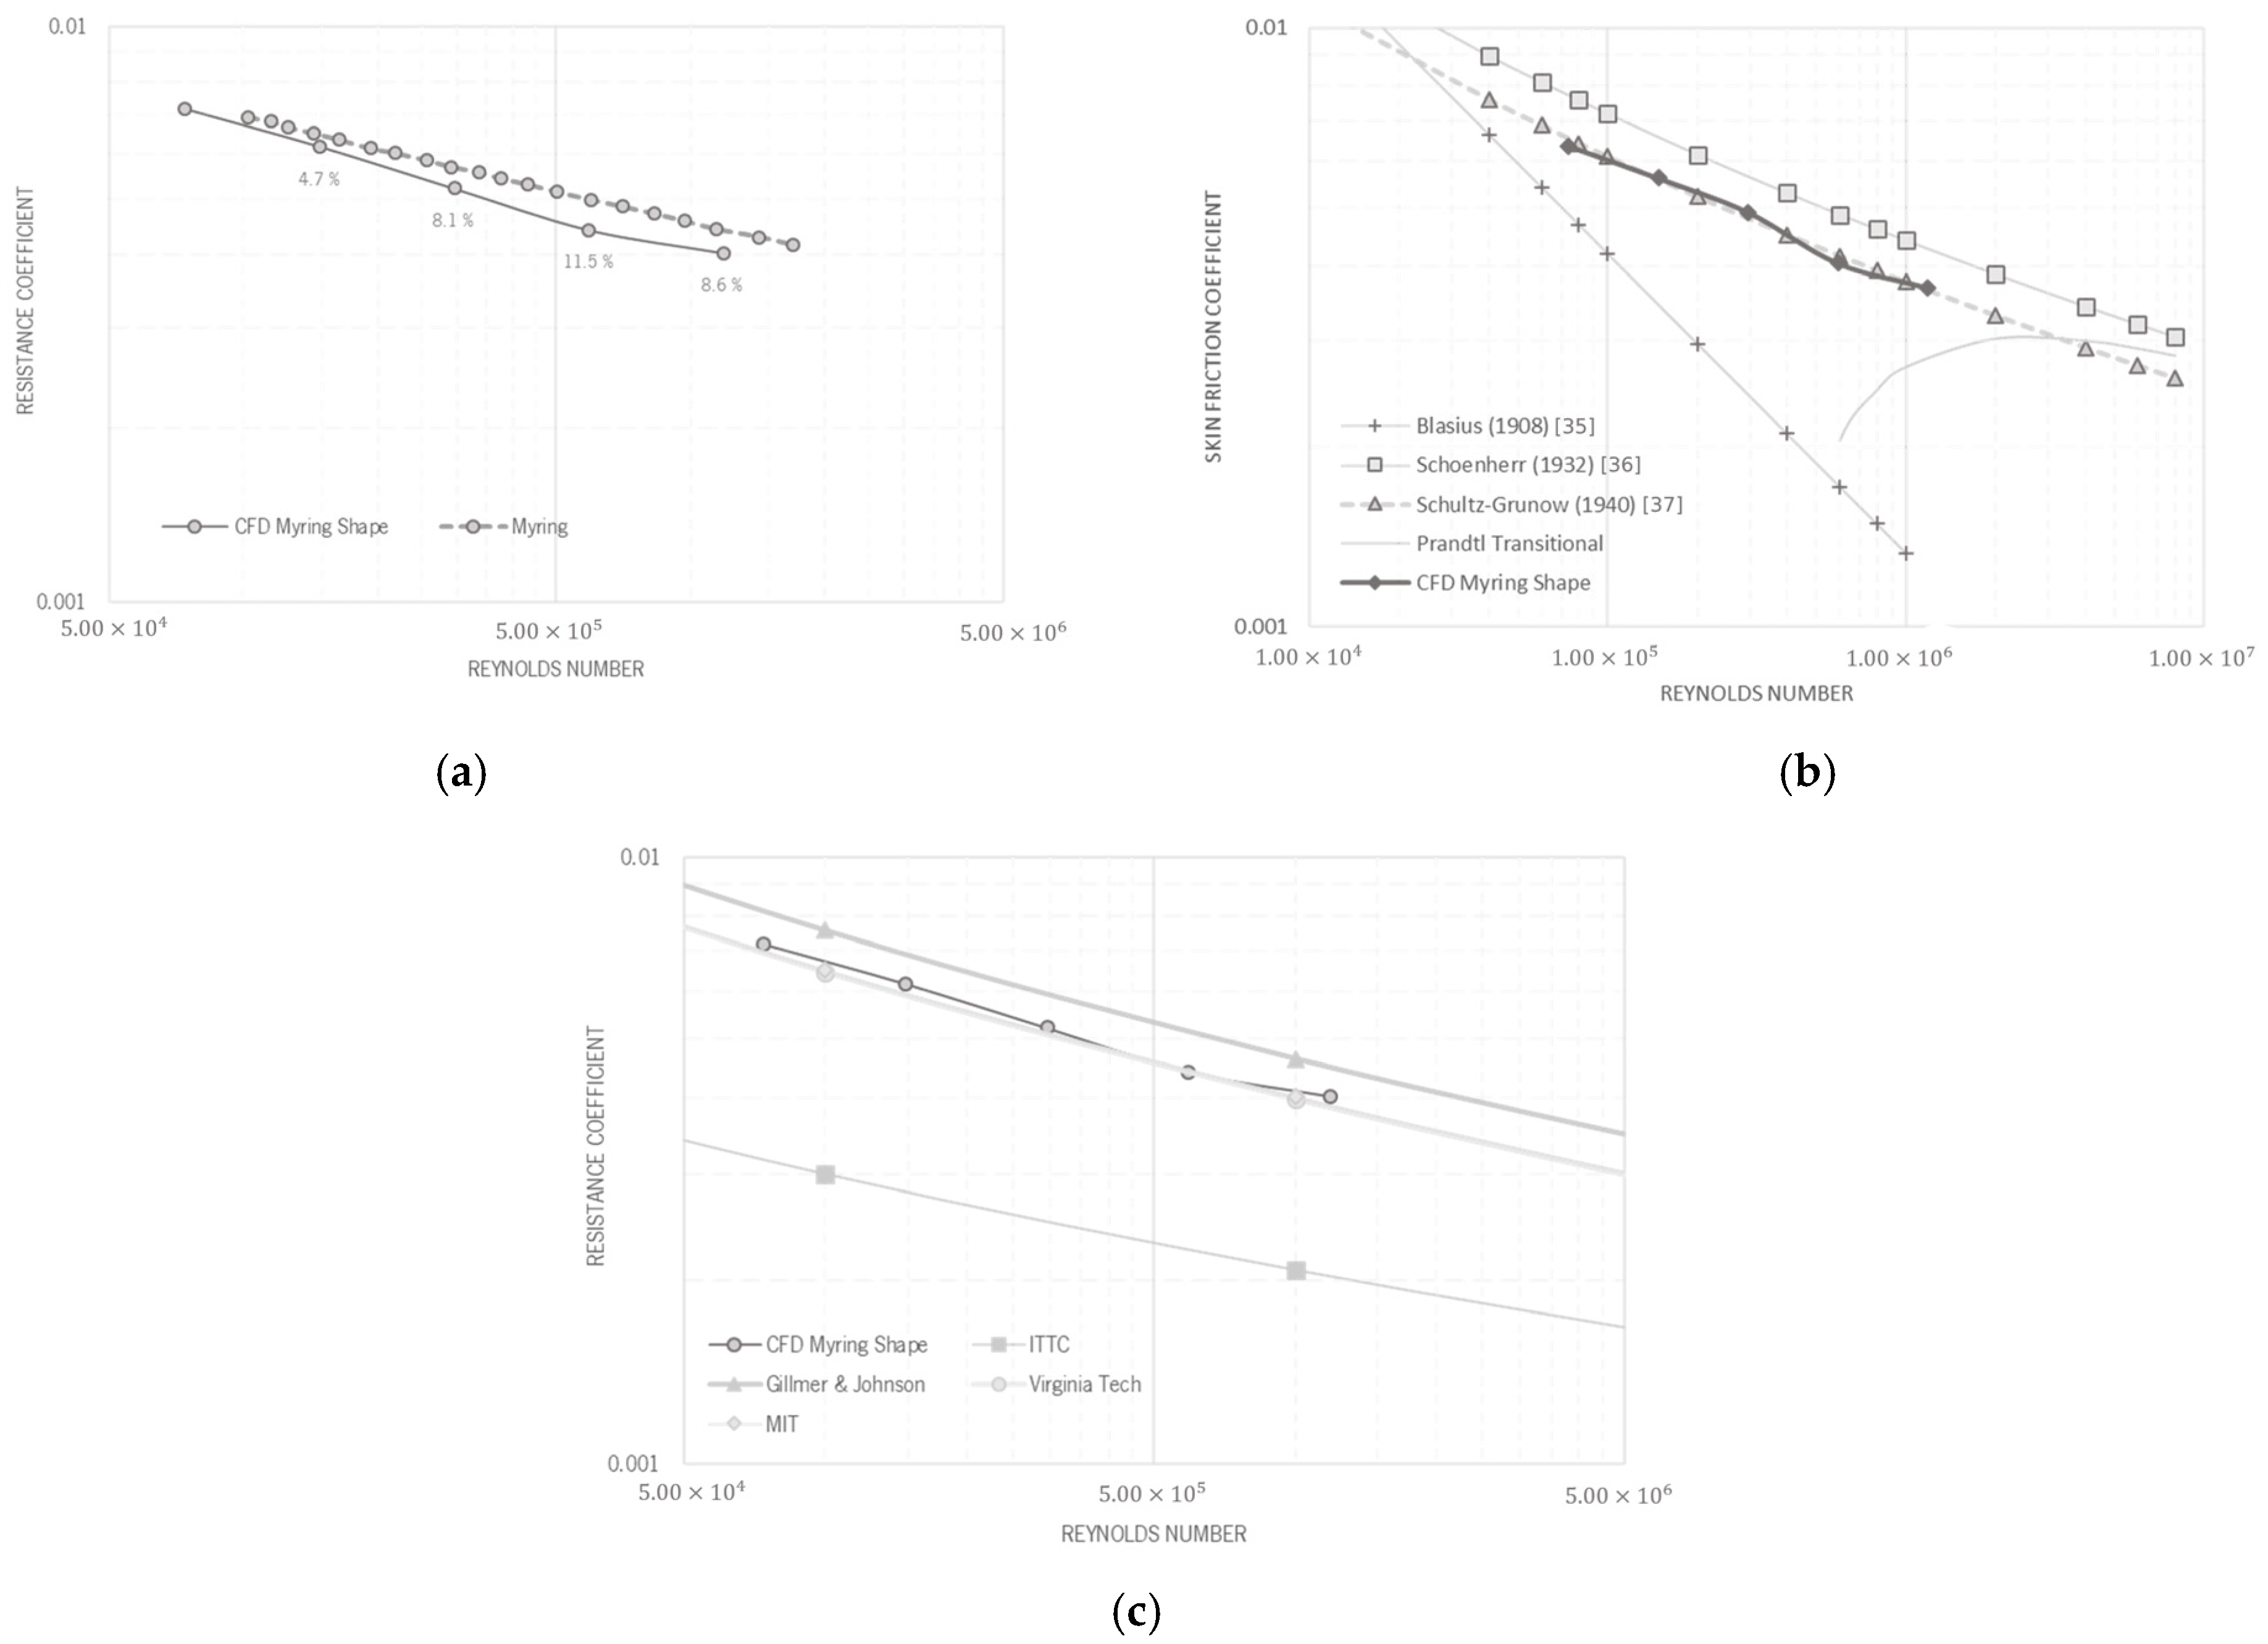
3.2. Validation Results

Once the mesh was defined, a set of computations were run. For each one, the flow velocity was varied—consequently, the flow Reynolds number. To enable comparability of the results, the tested range comprehends the expected real-world conditions of the tag.
The output results were the forces acting on the body. For all simulated scenarios, a major contribution of the skin friction resistance was verified, which always represented more than 90% of the total resistance. As such, the resistance coefficient was plotted against Myring’s own results [22] based on the wet surface area, displayed in Figure 4a.
A good agreement may be found with the experimental data obtained by Myring across all the Reynolds numbers. Figure 4b depicts this comparison, and good agreement with the Schultz-Grunow model was observed. This is of great significance for the present study since this is the only model that is suitable for the given range of Reynolds numbers.
To close the validation process, based on the Schultz-Grunow model, the three analytical models of total resistance and the ITTC line were also compared with the CFD results, as displayed in Figure 4c.
The computational results are in good agreement with the viscous models (from the Massachusetts Institute of Technology—MIT and Virginia Tech, Blacksburg, VA, USA), except for the ITTC (International Towing Tank Conference) line, which revealed poor agreement. This fact may result from the verified transitional Reynolds, for which this line tends to emulate laminar flow. As such, the model was successfully validated; consequently, the same process ought to be applied to the designed tag.

4. Results and Discussion

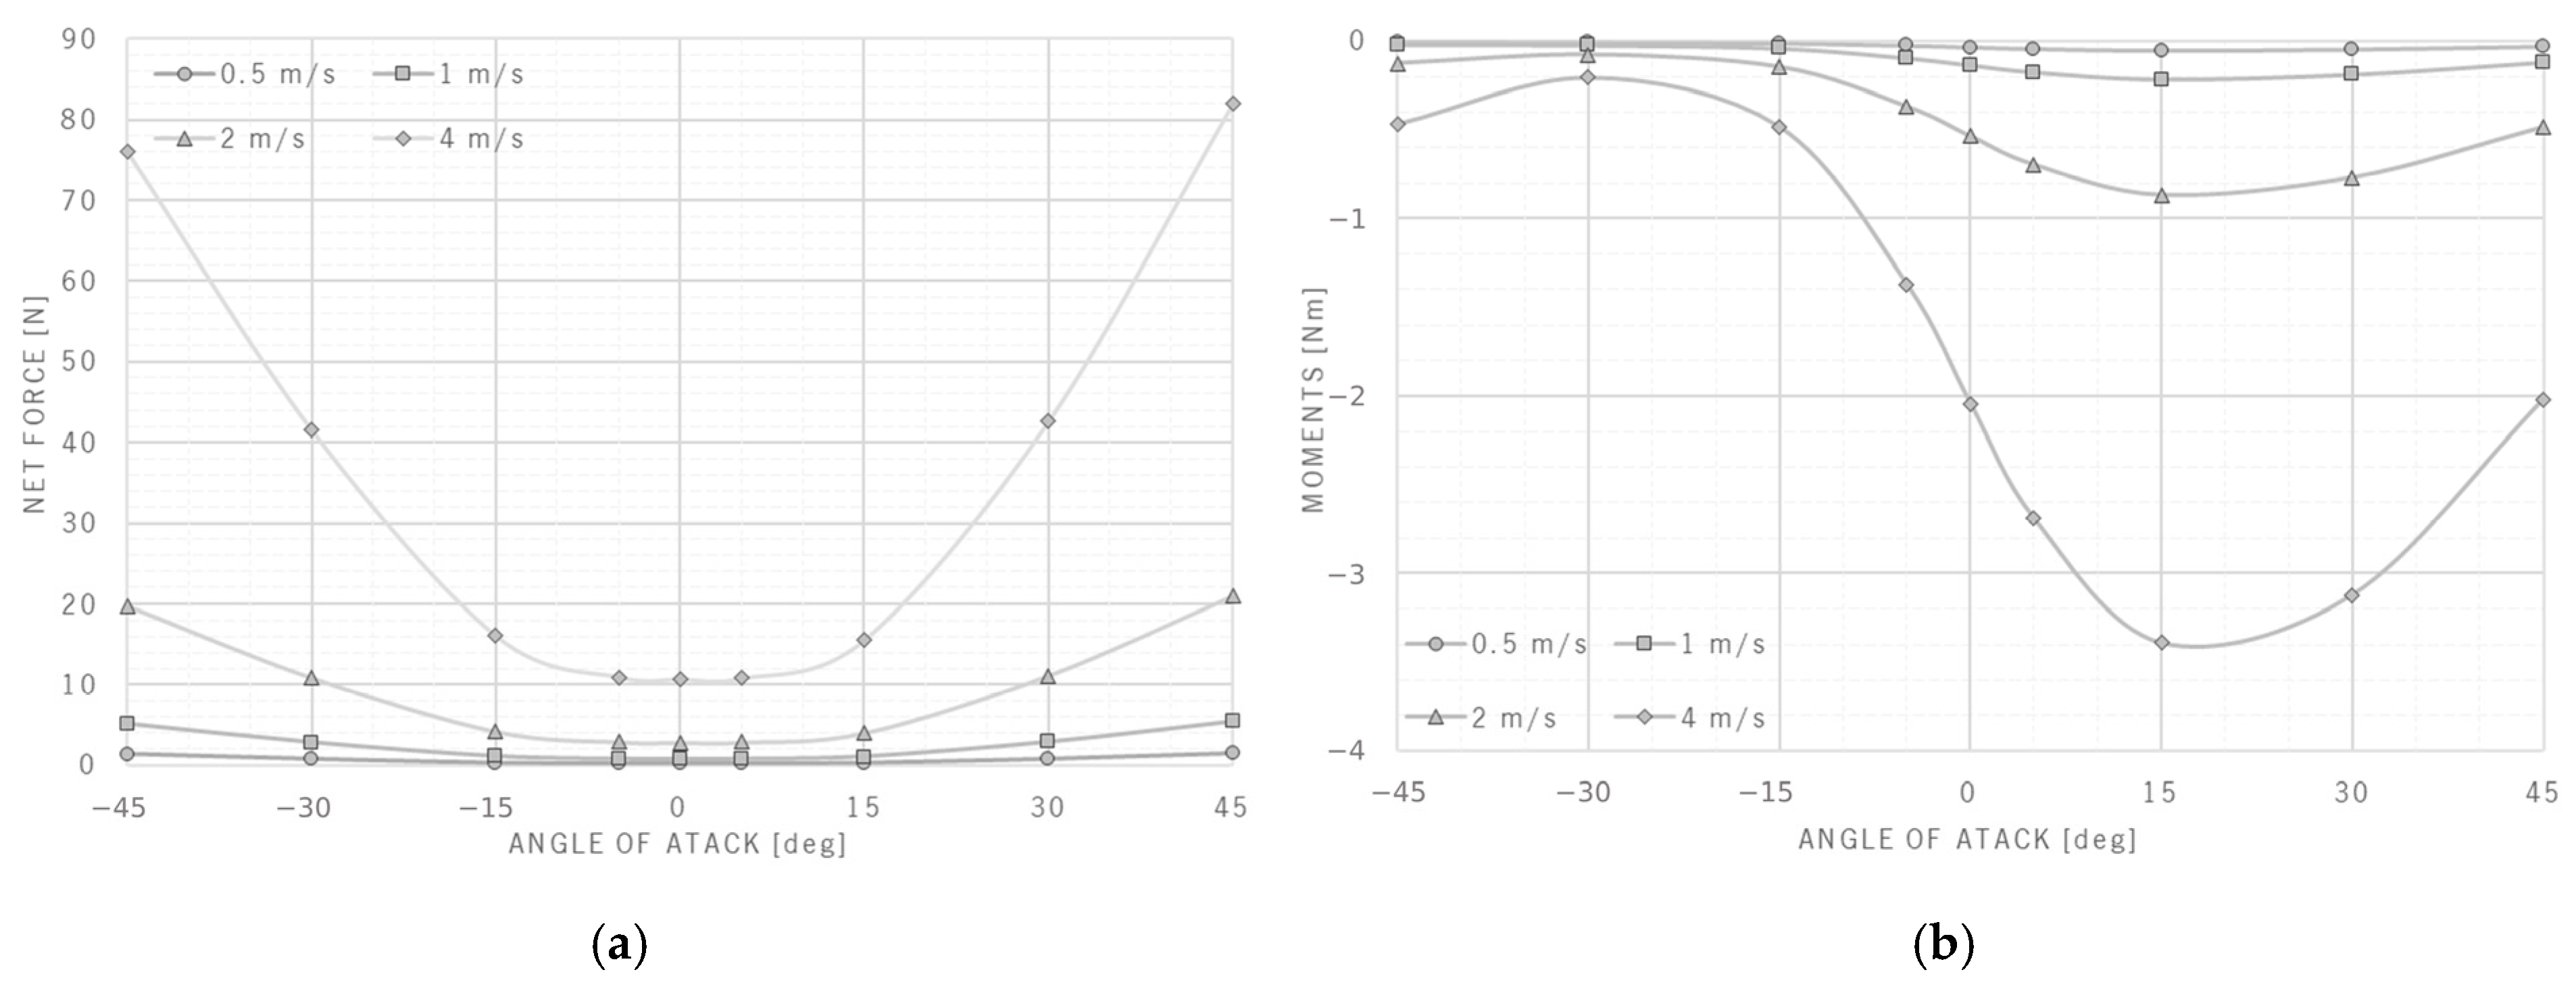
4.1. Motion and Drag

As the present study intended to evaluate the effect of the attached tag on the shark, it was important to predict and minimize the resulting forces on the animal for several operative scenarios. These, ought to represent the common and critical volitional behaviors of blue sharks and, consequently, the conditions in which the tag will operate during its active periods. Simulations were run for 36 different scenarios, with velocities ranging between 0.5 and 4 m s−1; and angles of attack of 0, ±5, ±15, ±30, and ±45 degrees, aiming to generate enough data to interpolate most situations that the tag would face.
Every case ran through one thousand iterations, and this decision was found to be sufficient for convergence (residuals were below 10−4) of every case tested. In all scenarios, the forces and moments in the three-orthogonal axis, exerted exclusively by the flow on the tag, were obtained. The results are summarized in Figure 5a,b, and their careful analysis allows us to form some preliminary conclusions.
In the present state of concept maturation, it is noticeable that the tag’s body was hydrodynamically unstable. In fact, as the moments for any of the given angles are negative, the tag always tends to pitch up. Although no cases where the angle of attack exceeds 45 degrees were simulated, it is predictable that the tag’s equilibrium in pitch would reside at higher angles of attack. This, in turn, would reflect in higher drag and consequently stronger pulling forces for the shark towing it. It is also possible to note that the resistance imposed on the motion is highly dependent on the angle of attack, being smaller at lower angles of attack.
To better understand the origin of the resistance, it was important to identify which are its main contributors. The calculated resistance was decomposed by the contributions of the different sections of the domain. These results for the simulation of 4 m s−1 at a 0° angle of attack are illustrated by the diagram in Figure 6, which also shows the flow’s velocity around the profile of the concept.
Evident on the pie chart displayed is the preponderance of the resistance induced by the shark’s body. However, it is important to note that this simulation does not account for the interaction flow-solid. As such, it does not account for the eventual bending of this antenna in the direction of the flow, which would surely decrease its resistance. Consequently, one may assume that these results represent very conservative estimates for resistance.
Nevertheless, a comparison between these results and those obtained for the resistance of a blue shark swimming at zero-degree angle of attack was performed. This comparison was performed while assuming the concept will be eventually stable for angles of attack between −15 and 15 degrees. Table 1 presents this comparison. (The resistance values for the shark were granted by CEiiA. A second-degree interpolation to these results was used to extrapolate the values of resistance for the same velocities at which the concept was tested.)
It was important to note that, at high velocities, the impact of the concept’s resistance represents less than 20% of the shark’s own resistance. Despite the simplifications imposed on the simulations, these are very good indicative values, within the range reported by other researchers Hazekamp et al. [15], highlighting the potential of this design.

4.2. Assessment of the Operation Attitude

As mentioned, for each one of the scenarios simulated, the forces in the x, y, and z directions, exerted by the flow on the tag, were derived, as well as the moments with respect to its center of mass. These data were then used to determine the static load conditions that the tag was subject to in each one of the situations by balances of force and moment.
These static conditions were all built in a spreadsheet based on variable coordinates for the attachment point relative to the tags referential. These coordinates, together with the ones of the buoyancy center, were rotated according to the tag’s angle of attack. This condition tries to duplicate the situation where the shark moves at constant speed and depth in an approximately straight line, as shown in Figure 7.
Figure 7b displays, in the grey color, the relative positions of these points for all scenarios simulated, as well as the schematics of forces acting on the body. The net force on the x-axis may be estimated by Equation (8):
F x = F F l o w _ X U ; α
The resultant force on the z-axis is given by Equation (9):
F z = F G + F B + F F l o w _ Z U ; α
And the resultant pitching moment around the CG is determined by Equation (10):
M y   = M F l o w y U ; α + F B x C B α x C G + F z x A t t a c h m e n t   x C G + F x   z A t t a c h m e n t   z C G
where x C B , x C G , and x A t t a c h m e n t   represent the x coordinates of the center of buoyancy, center of mass, and attachment point; similarly, z A t t a c h m e n t   refers to the z coordinate of the attachment point.
Interpolating these results allowed us to determine the natural attitude of this tag configuration by finding the angle at which the pitch moment is null. The direction and magnitude of the force affecting the shark were also determined by the net force on the tag’s attachment point. The resultant force and pitch moments based on the angle of attack and velocity are plotted, respectively, in Figure 8a,b.
A detailed understanding of the computational data is of the highest importance when taking the design optimization process to a higher level. We observed that minimum resistance occurs at zero degrees of pitch angle, and one may conclude that this is the ideal operative condition. As such, consulting the pitch-moment diagram at a zero-degree attack angle allows us to determine the necessary counter-moment on the tag’s shape to make this its natural position.
It is also possible to make use of the resultant force angle to adjust the tether’s length to avoid contact with the shark’s body and maximize surfacing opportunities at a given depth.

5. Improved Design

5.1. Design of Stabilizing Elements

As determined in the previous section, the angle of attack that offers less resistance to the motion of the tag is at zero degrees. As such, to ensure minimal effort variation from the shark carrying the tag, it is important to pursue ways of making this angle of attack coincide with its equilibrium position.
Several approaches could have been taken, for instance, at a high velocity. Since the natural tendency of the tag is to pitch up at about twenty degrees, one could have increased or moved weight forward. However, this would disturb the static stability. Another alternative would be adjusting the attachment point in search of a better suiting equilibrium moment. This method is simple and convenient, and it may result in some improvements depending on the body’s shape. For the present work, shifting the attachment point 25 mm forward in the longitudinal axis allowed a correction of roughly five degrees. However, it would hardly be enough to ensure the ideal condition of a zero-degree angle of attack.
Hence, the need arises for the use of stabilizing elements such as fins. The physical principle behind these elements is based on the use of surface areas, in strategic points and orientations, so that the forces acting on them due to the external flow balance, in a swift manner, the moments of the body.
As aforementioned, fins generate corrective moments on the tag’s body through the lift forces exerted by incoming flows. The degree of complexity of these elements may vary depending on their purpose. However, for the present application, simplicity and ease of manufacture were the guidelines for their design. As such, the design would consist of flat plates with the required surface area to generate the counter moment needed.
Analyzing the simulated results, it is possible to conclude that for the worst-case scenario, at 4 m s−1, the desired counter-moment was approximately 1.8 Nm. To generate the desired lift, the fins had to be placed in the rear of the tag. Taking a conservative approach, the generated forces were considered to act at the minimum distance between the center of mass and the fins. This distance was calculated while assuming that a 20 mm length of the fin was inserted in the tag’s body to provide proper support, resulting in a 144 mm arm. Figure 9a illustrates this concept.
Knowing the desired moment, M F i n s , and the arm, Δ x , of the lift force, it is possible to determine the required magnitude of the lift force, F L i f t , by Equation (11):
M F i n s = F L i f t Δ x   F L i f t = 12.5   N
Since the design is based on a flat plate, which only produces lift at a non-null angle of attack, α , a maximum desirable angle of pitch between ±4 degrees was established. Within this range, according to [38], the lift coefficient, C L i f t , for a flat plate may be estimated by Equation (12):
C L i f t = 2 π sin α 0.44
Inputting this information into the dimensionless lift force equation [39], the required surface area ( S ) to correct the pitching moment is obtained using Equation (13):
C L i f t = F L i f t 0.5   ρ   u 2   S S = 3.46 × 10 3   m 2
Using this value as a reference, horizontal fins were designed. Their design was inspired by conventional torpedo fins. At this stage, smaller fins were also inserted vertically to make the tag more agile in following the shark’s direction changes. Both fins are represented in Figure 9b, assembled with the tag. Once these components were modelled and assembled in the tag, it was important to reiterate across the hydrodynamic assessment process to verify the intended changes.

5.2. Improved Tag Concept

Having designed and sized the stabilizing elements, a new series of simulations was run to verify the tag’s hydrodynamic enhancements. The same procedure was used as the one for the preliminary design. The mesh created for the fins’ surfaces and its inflation layer was similar to the one of the main sections of the body. Figure 10 displays the flow domain.
It was found that, as desired, the natural equilibrium position is now at a smaller angle of attack for all the studied velocities. For instance, at 4 m s−1, the worst case considered, this angle decreased from about 20 to only 5 degrees. Figure 11a contains a diagram that compares the resistance and pitch moment on both designs, with and without fins, at 4 m s−1. The results for the drag force show a minimum angle of attack of 0°. Experimental data measured by Bartolomeu [23] shows a similar behavior for axisymmetric shapes with a high length/diameter ratio. As the ratio L/D decreases, the U shape (due to the symmetry of the shape) of this relationship becomes less evident. Also, the moment shows a symmetry in absolute value for negative angles of attack; this corresponds to a nose up, and for positive angles of attack, the reversed is observed.
As expected, an overall higher resistance was verified in the model equipped with fins, especially for higher attack angles. However, the resistance at the equilibrium position of this model is approximately half of the one verified case in which the fins were not included. By shifting the tendency of the tag to remain at about 5 instead of the original 20 degrees, the associated motion resistance stands to be about 14 N instead of the initial 28 N. Moreover, including the stabilizers, a pitching moment that progresses much more smoothly through the variation of attack angles was obtained. This, in practice, is expected to translate into an easier learning process to adapt the animal’s swimming technique to the added effort of carrying the tag. Pan et al. [21] numerically investigated the influence of the angle of attack on the moment acting on the submarine-shaped underwater vehicle. The authors show a nearly linear influence of the angle of attack, as observed in the present study (Figure 11a).
Although ensuring that critical scenarios are optimized, such as high-velocity motion, attention must also be paid to scenarios at the remaining range of expected velocities.
In Figure 11b, a two-variable surface plot allows us to roughly interpolate pitching moments between all studied cases. Careful inspection of this plot shows that the intersection line between the darkest blue and grey areas represents the equilibrium conditions for pitch angle. Through this line, one may see that between 1 and 4 m s−1, the tag will naturally pitch to an angle of attack between ±5 degrees, assuring in such a way small resistance to its motion.
However, for lower velocities, this does not remain the case. At these smaller velocities, the tag tends to pitch at a very negative angle, as displayed in the diagram Figure 11c for 0.5 m s−1. In the same plot, it is possible to contrast the pitching moment with the respective resistance, which leads to the conclusion that for this velocity a decrease in pitch represents a decrease in resistance.

6. Conclusions

With technological advancement, the continued refinement of tag devices promises to deepen our understanding of marine ecosystems and contribute to the sustainable management of ocean resources. In this regard, CFD has played a pivotal role in understanding and simulating complex fluid flow phenomena.
Herein, the integration of CFD with empirical data and innovative design approaches has allowed for the development of a more efficient and environmentally friendly tagging device. The addition of stabilizing fins has been shown to drastically reduce the tag’s resistance and pitching moments, enabling it to maintain equilibrium at shallow angles of attack across a wide range of velocities. This not only enhances the device’s performance but also minimizes its impact on the natural behavior of blue sharks during tagging operations.
For the initial design, the VHF transmitter’s antenna is the main source of drag, adding up to 20% to the shark’s own drag. The skin friction resulted in a negative moment that pitches up the tag, increasing the drag. This phenomenon increases with velocity.
In order to maintain the tag attitude at minimum drag (0°), balancing fins (with a 34.6 cm2 area) were added to the tag. This feature enables the operation at an equilibrium attitude that reduces the drag.

Author Contributions

Conceptualization, S.F.T. and J.C.T.; methodology, V.C.; software, J.A.; validation, J.A. and V.C.; formal analysis, J.A.; investigation, A.A.; resources, S.F.T.; data curation, V.C.; writing—original draft preparation, V.C.; writing—review and editing, S.F.T.; visualization, A.A.; supervision, J.C.T. and S.F.T.; project administration, T.B.; funding acquisition, J.C.T. All authors have read and agreed to the published version of the manuscript.

Funding

This research received no external funding.

Data Availability Statement

The raw data supporting the conclusions of this article will be made available by the authors upon request.

Acknowledgments

Violeta Carvalho thanks for her Ph.D. grant from FCT with reference UI/BD/151028/2021. This work was supported by FCT—Portuguese Foundation for Science and Technology through the R&D Unit Project Scope UIDB/00319/2020 (ALGORITMI) and R&D Units Project Scope UIDP/04077/2020 (METRICS).

Conflicts of Interest

The authors declare that they have no known competing financial interests or personal relationships that could have appeared to influence the work reported in this paper.

References

  1. Hammerschlag, N.; Gallagher, A.J.; Lazarre, D.M. A review of shark satellite tagging studies. J. Exp. Mar. Biol. Ecol. 2011, 398, 1–8. [Google Scholar] [CrossRef]
  2. Witt, M.J.; Doherty, P.D.; Godley, B.J.; Graham, R.T.; Hawkes, L.A.; Henderson, S.M. Basking Shark Satellite Tagging Project: Insights into Basking Shark (Cetorhinus maximus) Movement, Distribution and Behaviour Using Satellite Telemetry; Final Report; Scottish Natural Heritage: Stirling, Scotland, 2016; 72p.
  3. Cooke, S.J.; Hinch, S.G.; Wikelski, M.; Andrews, R.D.; Kuchel, L.J.; Wolcott, T.G.; Butler, P.J. Biotelemetry: A mechanistic approach to ecology. Trends Ecol. Evol. 2004, 19, 334–343. [Google Scholar] [CrossRef]
  4. Cooke, S.J.; Midwood, J.D.; Thiem, J.D.; Klimley, P.; Lucas, M.C.; Thorstad, E.B.; Eiler, J.; Holbrook, C.; Ebner, B.C. Tracking animals in freshwater with electronic tags: Past, present and future. Anim. Biotelem. 2013, 1, 5. [Google Scholar] [CrossRef]
  5. Pouca, C.P.V. High-Resolution Diving Behaviour of Satellite Tagged Blue Sharks under Different Oceanographic Gradients. Master’s Thesis, Universidade do Porto, Porto, Portugal, 2012. [Google Scholar]
  6. Queiroz, N.; Humphries, N.E.; Noble, L.R.; Santos, A.M.; Sims, D.W. Spatial dynamics and expanded vertical niche of blue sharks in oceanographic fronts reveal habitat targets for conservation. PLoS ONE 2012, 7, e32374. [Google Scholar] [CrossRef]
  7. Nielsen, J.L.; Arrizabalaga, H.; Fragoso, N.; Hobday, A.; Lutcavage, M.; Sibert, J. (Eds.) Reviews: Methods and Technologies in Fish Biology and Fisheries; Springer: Berlin/Heidelberg, Germany, 2009. [Google Scholar] [CrossRef]
  8. Ahuekwe, E.F.; Isibor, P.O.; Akinduti, P.A.; Salami, A.O.; Onuselogu, C.C.; Oshamika, O.O.; Oyesola, O.L.; Ichor, T.; Ezekiel, O.M.; Oziegbe, O.; et al. Application of Nanochitosan in Tagging and Nano-Barcoding of Aquatic and Animal Meats; Adetunji, C., Hefft, D., Jeevanandam, J., Danquah, M.B.T.-N.G.N., Eds.; Academic Press: New York, NY, USA, 2023; pp. 483–498. [Google Scholar] [CrossRef]
  9. Baeyaert, J.; Graça, G.; Sobral, A.; Prieto, R.; Afonso, P.; Fontes, J. EcoDive Azores—Summer Season—Short Report. 2016. Available online: https://www.researchgate.net/publication/318724014_EcoDive_Azores_-_Summer_Season_2016_Short_Report (accessed on 10 April 2024).
  10. Grusha, D.S.; Patterson, M.R. Quantification of drag and lift imposed by pop-up satellite archival tags and estimation of the metabolic cost to cownose rays (Rhinoptera bonasus). Fish. Bull. 2005, 103, 63–70. [Google Scholar]
  11. Arai, N.; Okuyama, J. Biologging. In Field Informatics; Springer: Berlin/Heidelberg, Germany, 2012; pp. 21–38. [Google Scholar] [CrossRef]
  12. Domeier, M.L.; Nasby-Lucas, N. Two-year migration of adult female white sharks (Carcharodon carcharias) reveals widely separated nursery areas and conservation concerns. Anim. Biotelem. 2013, 1, 2. [Google Scholar] [CrossRef]
  13. Trotter, A.W.; Rathjens, L.; Schmiegel, S.; Mews, S.; Cowley, P.D.; Gennari, E. Short-term effects of standard procedures associated with surgical transmitter implantation on a benthic shark species requiring anaesthesia. Fish. Res. 2024, 270, 106880. [Google Scholar] [CrossRef]
  14. Gleiss, A.C.; Norman, B.; Liebsch, N.; Francis, C.; Wilson, R.P. A new prospect for tagging large free-swimming sharks with motion-sensitive data-loggers. Fish. Res. 2009, 97, 11–16. [Google Scholar] [CrossRef]
  15. Hazekamp, A.A.H.H.; Mayer, R.; Osinga, N. Flow simulation along a seal: The impact of an external device. Eur. J. Wildl. Res. 2010, 56, 131–140. [Google Scholar] [CrossRef]
  16. Zhang, D.Y.; Luo, Y.H.; Li, X.; Chen, H.W. Numerical simulation and experimental study of drag-reducing surface of a real shark skin. J. Hydrodyn. 2011, 23, 204–211. [Google Scholar] [CrossRef]
  17. Shaari, M.F. Drag Analysis of Contractile Water Jet Locomoted Micro AUV in Laminar Fluid. Appl. Mech. Mater. 2015, 799, 1188–1192. [Google Scholar] [CrossRef]
  18. Cheng, B.; Qin, D.; Hu, Z. Research on the propulsion motor cooling by the coupled flow field of unmanned underwater vehicles. Appl. Therm. Eng. 2024, 237, 121797. [Google Scholar] [CrossRef]
  19. Liu, B.; Xu, X.; Pan, D. Resistance reduction optimization of an amphibious transport vehicle. Ocean Eng. 2023, 280, 114854. [Google Scholar] [CrossRef]
  20. Karim, M.; Rahman, M.; Alim, A. Numerical computation of viscous drag for axisymmetric underwater vehicles. J. Mek. 2018, 26, 9–21. [Google Scholar]
  21. Pan, Y.; Zhang, H.; Zhou, Q. Numerical prediction of submarine hydrodynamic coefficients using CFD simulation. J. Hydrodyn. Ser. B 2012, 24, 840–847. [Google Scholar] [CrossRef]
  22. Myring, D.F. A Theoretical Study of Body Drag in Subcritical Axisymmetric Flow. Aeronaut. Q. 1976, 27, 186–194. [Google Scholar] [CrossRef]
  23. Bartolomeu, T.C. Hydrodynamic Optimization of a Torpedo-Shaped Hull. Ph.D. Thesis, Universidade da Beira Interior, Covilhã, Portugal, 2016. [Google Scholar]
  24. Wang, J.; Cui, Z. Modeling and experiment validation of a seawater micro hydropower system for marine animal telemetry tag. Renew. Energy 2021, 174, 73–85. [Google Scholar] [CrossRef]
  25. Wang, G. Machine Learning for Inferring Animal Behavior from Location and Movement Data. Ecol. Inform. 2019, 49, 69–76. [Google Scholar] [CrossRef]
  26. Thiede, S.; Ghafoorpoor, P.; Sullivan, B.P.; Bienia, S.; Demes, M.; Dröder, K. Potentials and Technical Implications of Tag Based and AI Enabled Optical Real-Time Location Systems (RTLS) for Manufacturing Use Cases. CIRP Ann. 2022, 71, 401–404. [Google Scholar] [CrossRef]
  27. Szpilman, M. Tubarões no Brasil: Guia Prático de Identificação; Mauad Editora Ltd.a: Rio de Janeiro, Brazil, 2004. [Google Scholar]
  28. Stevens, J. Prionace glauca, Blue Shark, IUCN Red List Threat. Species 2009, 11. [Google Scholar] [CrossRef]
  29. Geng, Z.; Wang, Y.; Kindong, R.; Zhu, J.; Dai, X. Demographic and harvest analysis for blue shark (Prionace glauca) in the Indian Ocean. Reg. Stud. Mar. Sci. 2021, 41, 101583. [Google Scholar] [CrossRef]
  30. Azevedo, J.; Bartolomeu, T.; Teixeira, S.; Teixeira, J.C. Design Concept of a Non-invasive Tagging Device for Blue Sharks José. In International Conference Innovation in Engineering; Springer International Publishing: Cham, Switzerland, 2022. [Google Scholar]
  31. Moonesun, M.; Korol, Y.M.; Dalayeli, H. CFD analysis on the bare hull form of submarines for minimizing the resistance. Int. J. Marit. Technol. 2015, 3, 1–16. [Google Scholar]
  32. ITTC. Recommended Procedures—Fresh water and Seawater Properties. Proc. ITTC—Section 7.5-02-01-03. 2011. Available online: https://www.ittc.info/media/7989/75-02-01-03.pdf (accessed on 10 April 2024).
  33. Fluent. ANSYS Fluent 12.0 User’s Guide; Ansys Inc.: Canonsburg, PA, USA, 2009; Volume 15317, pp. 1–2498. [Google Scholar] [CrossRef]
  34. Versteeg, H.K.; Malalasekera, W. An Introduction to Computational Fluid Dynamics; Pearson Education Limited: Edinburgh, UK, 2007. [Google Scholar] [CrossRef]
  35. Blasius, H. Grenzschischten in Flussigkeiten mit Kleiner Reibung, 1908; Translated into NACA Technical Memorandum 1256 as the Boundary Layer in Fluids with Little Friction. 1950. Available online: https://ntrs.nasa.gov/citations/20050028493 (accessed on 10 April 2024).
  36. Schoenherr, K.E. Resistance of Flat Surfaces Moving through a Fluid. Ph.D. Thesis, Johns Hopkins University, Baltimore, MD, USA, 1932. [Google Scholar]
  37. Shultz-Grunow, F. New Frictional Resistance Law for Smooth Plates; NACA Technical Memorandum 986; National Advisory Commitee for Aeronautics: Washington, DC, USA, 1941.
  38. Newman, J.N.; Landweber, L. Marine Hydrodynamics. J. Appl. Mech. 1978, 45, 457. [Google Scholar] [CrossRef]
  39. White, F.M. Fluid Mechanics, 8th ed.; Academic Press: New York, NY, USA, 2016. [Google Scholar]
Figure 1. (a) Validated concept. (b) Mesh independency study for the tag concept design. (c) Validated concept’s mesh.
Inventions 09 00048 g001
Figure 2. (a) Myring’s model B scaled to a length of 300 mm. (b) Section view of the flow domain used for validation of the model.
Inventions 09 00048 g002
Figure 3. (a) Mesh independency study and (b) final mesh for Myring’s shape case study.
Inventions 09 00048 g003
Figure 4. (a) Comparison of CFD resistance coefficient results with Myring’s results. (b) Comparison of CFD skin-friction coefficients with analytical models [35,36,37]. (c) Comparison of CFD results with viscous resistance models.
Inventions 09 00048 g004
Figure 5. (a) Forces imposed on the concept’s body by the flow. (b) Moments imposed on the concept’s body by the flow.
Inventions 09 00048 g005
Figure 6. Resistance breakdown and velocity contours of final concept at 2 m s−1 and 0° angle.
Inventions 09 00048 g006
Figure 7. (a) Simulated phenomenon. (b) Forces applied to the tag at a 15° angle of attack (not to scale).
Inventions 09 00048 g007
Figure 8. (a) Resistance on validated concept based on flow velocity and angle of attack. (b) Pitching moments verified on validated concept based on flow velocity and angle of attack.
Inventions 09 00048 g008
Figure 9. (a) Acting point of the lift force generated by the stabilizing elements. (b) Stabilizing elements of the tag.
Inventions 09 00048 g009
Figure 10. Tag final concept flow domain.
Inventions 09 00048 g010
Figure 11. (a) Comparison of y-moment and resistance for preliminary and optimized design at 4 m s−1. (b) Pitching moment variation with velocity and angle of attack. (c) Low-velocity pitch equilibrium and resistance.
Inventions 09 00048 g011
Table 1. Influence of concept’s body on shark’s resistance.
VelocityShark Resistance−15° Angle of Attack−5° Angle of Attack0° Angle of Attack5° Angle of Attack15° Angle of Attack
ResistanceVariationResistanceVariationResistanceVariationResistanceVariationResistanceVariation
m s−1NN%N%N%N%N%
0.50.80.3360.2250.2250.2250.336
1.05.31.1210.8140.7140.8141.120
2.023.24.2182.9132.8122.9124.017
4.098.416.11711.01210.71110.81115.616
Disclaimer/Publisher’s Note: The statements, opinions and data contained in all publications are solely those of the individual author(s) and contributor(s) and not of MDPI and/or the editor(s). MDPI and/or the editor(s) disclaim responsibility for any injury to people or property resulting from any ideas, methods, instructions or products referred to in the content.

