1. Introduction
The issue of walkability is increasingly present in studies on active mobility [
1] and is being analyzed and developed with interdisciplinary approaches to evaluate the performance of urban sectors in terms of pedestrian use and improved quality of life [
2], considering not only the physical characteristics of the paths but also social and perceptual ones. This approach is necessary to interpret the development of an urban context and the daily activities of its users. The information derived from these analyses can support the planning and design of a new urban shape [
3,
4] that is as consistent as possible with the development of the settlement and its social and functional aspects. Complexity in the definition of walkability thus arises from the copresence and combination of different factors that make up the city system. The study described in this paper concerns the analysis of walkability in the city L’Aquila (Italy), which is in its final phase of reconstruction after the 2009 Abruzzo earthquake. The paper focuses on the neighborhood of Pettino, near the Coppito Campus of the University of L’Aquila, which was chosen as a pilot area for this methodology. Some extensions are made for the entire city of L’Aquila, with some limitations, thanks to the effort of an extended working group that helped the research team collect the data. This is a city that has been undergoing continuous changes since 2009 due to the reconstruction process. This condition has given rise to continuous transformations of the settlement system, its mobility network and consequently the social structure, causing spontaneous and not always planned transformations that have also generated new centralities [
5].
The overall goal of walkability research is to identify the performance of the city’s current pedestrian network to structure public policies [
6] and strategies consistent with it aiming at settlement and infrastructural rebalancing, and especially the development of active mobility, also concerning the principles of the SDGs of Agenda 2030 [
7].
The research illustrated in this paper fits into the scenario by expanding the activities through an innovative interdisciplinary urban planning and transportation approach. This integrates the use of spatial information platforms [
8] related to digital twin and city information modeling [
9,
10] with complex information systems oriented to the construction of dynamic (open-source) models of a three-dimensional representation of phenomena.
With this innovative approach, the paper outlines the methodology adopted for the analysis of walkability and associated infrastructure and describes the initial results. The proposed methodology is defined by the integration of three approaches: (i) geometric/morphological, (ii) proximity, and (iii) sociality. This paper mainly explores the application of the part of the methodology devoted to approaches (i) and (ii).
The paper is structured as follows.
Section 2 describes the literature review, highlighting what is missing and the that our research aims to fill.
Section 3 describes the research methodology:
Section 3.1 describes the methodology for the geometric–morphological approach and
Section 3.2 describes that for the proximity approach.
Section 4 describes the application of the methodology to the case study of the city of L’Aquila, in post-earthquake reconstruction (2009):
Section 4.1 reports the results of the application of the methodology for the geometric–morphological approach and
Section 4.2 presents some elaborations for the proximity approach. Conclusions are given in
Section 5.
2. Literature Review
In the scientific literature, walkability is addressed by three approaches that appear quite distinct, the experiences of which are almost all oriented to the definition of a walkability index [
11], weighted/unweighted, sometimes characterized by a very complex method to the algorithms and the amount of information used [
12,
13]. They are, on the other hand, very little oriented to the definition of urban design, land use [
14] or infrastructure design techniques [
15], aimed at a walkable city, often relegated to guidelines [
16].
The first approach focuses on walkability analysis carried out based on directly or indirectly observable factors and components, also taken from Google Maps [
17], and essentially covering dimensional and morphological characteristics of streets, intersections [
18] and sidewalks [
19], pedestrian safety, maintenance status, and accessibility to services and facilities [
3,
6,
20,
21,
22]. An example is the capability-wise walkability score (CWS) developed by Blečić et al. [
4] based on three macro-environments of observation, the current condition of urban design (density, integration, etc.), physical features (the characteristics of streets concerning their walkability), and land-use patterns (urban functions related to walkability). The goal is to associate a walkability score with each street. More focused on urban characteristics is the method studied by Poklewski-Koziełł et al. [
23], which analyzes walkability based on three parameters: the land-use mix, residential density, and street connectivities, thus providing more detail on urban design. To this data, Liao et al. [
24] add information on neighborhood crime, which is an additional indicator to be considered along with personal safety and its evaluation [
20,
25]. Another study in the field of this first approach is the Sidewalk Walkability Assessment of Urban Roads (SWAUR) [
26] method, which integrates neighborhood walkability with sidewalk quality for the assessment of sidewalk walkability. In addition, some applications combine observable data, considered as points of interest (POI) with mobile data [
27,
28], or use the space syntax integration score [
29,
30] or network analysis [
31] to analyze the level of connectivity [
32], or use walkability as a performance indicator for urban spaces [
33].
The second approach focuses on the social response to walkability needs and is therefore an expression of qualitative rather than quantitative methods like the previous one. In this case, the preferences/propensity and values of citizens and their visual and social perceptions [
8,
20,
34] or the contextual and dynamic characteristics related to pedestrians [
12] are analyzed. In such an approach, studies use, on the one hand, methodologies inherent to sociological sciences, e.g., the administration of questionnaires [
8,
35,
36], and, on the other hand, innovative perceptual analysis methodologies, which involve citizens and users determining some characteristics of walkability (feasibility, accessibility, safety, comfort, enjoyability, etc.), using methods such as augmented reality, virtual reality or deep learning and artificial intelligence [
34]. In some cases, information is collected as well using on-site surveys using concealed camcorders; in this case, many factors are observed for each pedestrian, such as gender, age, direction, distractions, carrying objects, etc. [
37].
A third approach, which has been very little investigated compared to the first two, relates walkability to the concept of the 15-min city [
38]. In this sense, Rhoads et al. [
39] proposed a framework for assessing multi-factor walkability using percolation theory and insights into pedestrian behavior. The aim is to favor the pedestrian perspective of short-distance access over the automobile perspective. The data used can be specifically related to the first approach, namely physical characteristics of the sidewalk network, edge attributes (related to hazards), urban amenities and services, percolation characteristics used to measure the robustness of networks, and finally pedestrian ego hoods (the total amount length) of the sidewalk a pedestrian at that location has access to within a limited time, 15 min in that case). Attention to this issue is also given by Carra et al. [
40], who focus particularly on the role of urban regeneration of centrality as an action of studying urban walkability scenarios. This is similar to the approach of Serra-Coch et al., who, instead of using the 15-min city concept, use the transit-orientated development standard (TOD standard) [
41] based on the central role of stations, or that of D’Orso et al., who introduce the concept of microtransit, which provides pick-up/drop-off (PUDO) locations that can be reached quickly, easily and safely by pedestrians [
42].
A fourth approach that integrates the first two is very rarely seen in the literature. For example, Fancello et al. [
8] integrate capability-wise walkability analysis [
4] with a multicriteria analysis of citizens’ preferences, intending to group individuals by considering both their socioeconomic factors (gender [
43], age, occupation, health status, etc.) and their value function attributes that influence individuals’ evaluation of the road network. Socioeconomic factors are also considered by Gusman et al. [
20], whose method distinguishes observable from non-observable factors by pedestrians. Choi et al., on the other hand, combine a huge number of micro-information involving traffic safety, driver destinations, crime safety, accessibility and enjoyability [
13,
43].
Such approaches, most often based on the use of vector or raster GIS tools, are often aimed only at analysis, but in some cases, they also have the goal of defining walkability decision maps [
8] aimed at improving public policies for the development of walkable cities.
The literature review shows that scientific research in the field of walkability analysis lacks an integrated approach that holds together the following criteria:
Geometric–quantitative, based on directly or indirectly measurable data in the contexts under consideration;
Qualitative, based on citizens’ perceptions;
Relational, that is, based on the user–infrastructure relationship, which can be addressed, for example, through the concept of the 15-min city and urban centrality [
44].
There is also a lack of an approach that uses these analytical criteria to define urban design actions aimed at the walkable city, i.e., the analysis–design connection of infrastructure and city is missing.
Our study aims to fill these gaps using geometric–morphological, proximity (with special reference to the centrality system) and sociality criteria and indicators, defining urban design actions to improve the performance of the analysis indicators.
3. Methodology
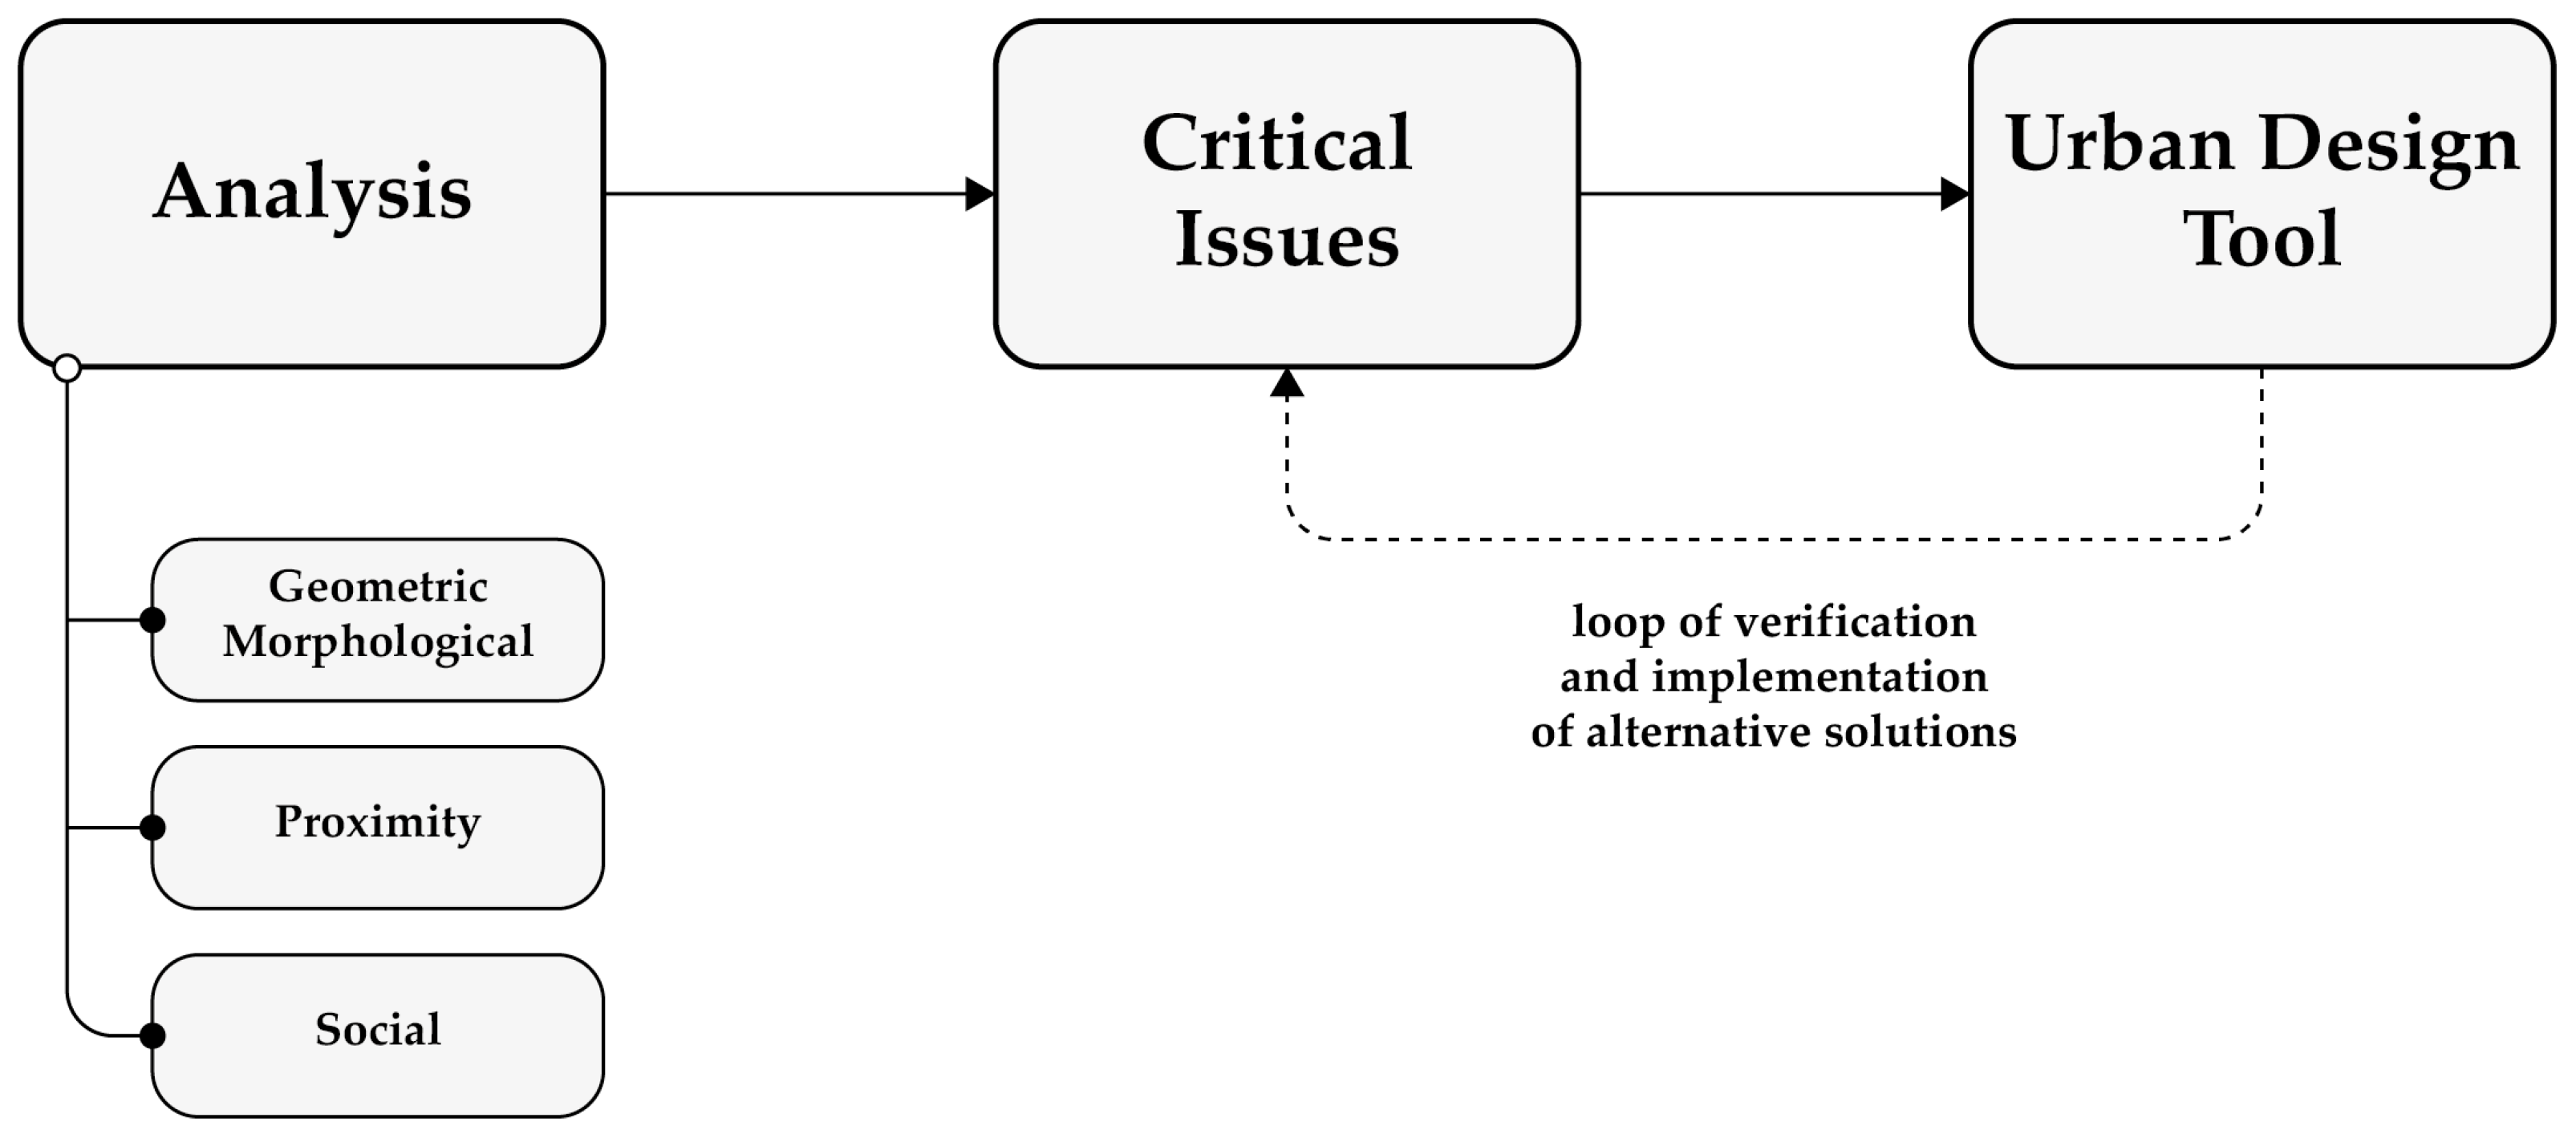
As already mentioned in the introduction, the study proposes a methodology through which to analyze the level of walkability of an urban context that is developed in different stages that are closely related to each other. Through each of these, different aspects of the existing road network are analyzed by interpreting its characteristics according to criteria that can be translated into indices and then into overall indices. The information is subsequently visualized through specifically developed thematic cartographies.
Three distinct stages comprise the overall methodology for measuring walkability (
Figure 1), which is based on three approaches: (i) geometric–morphological, (ii) proximity, and (iii) sociality.
The creation of a street graph, which is linked to the data required to specify its geometric–morphological approach using GIS systems, forms the basis of the study.
The resulting analyses allow the creation of an I
g index (geometric–morphological index) that can be used to evaluate an area’s walkability first. This is surrounded by the subjectively evaluable I
p (proximity index) and I
s (sociality index), which are both able to evaluate the socio-individual approach [
44]. This subjectivity stems from two sources: the understanding of what makes a place walkable and relevant, and the significance of walkability to each citizen’s overall well-being in the surrounding area. The approach is connected because the “circumstances” that affect citizens’ decisions about walkability are the features, functionality, quality, and condition of the urban context [
34,
45]. This multi-criteria analysis, which employed the three indices, yielded a fourth index, known as the “walkability overall index” (I
w), which was created by summarizing the other three.
This overall index can be used to determine the walkability performance of the context at hand as well as to inform the development of plans and urban design and initiatives aimed at implementing the pedestrian network and enhancing its capacity and performance. The application of this general methodology is currently underway in our research. This paper describes the development, application, and results to obtain the geometric–morphological index and the initial processing to determine the proximity index.
The goal of the methodology, summarized in
Table 1, is to analyze the physical properties of the current road network using first the geometric–morphological approach (I
g), as will be covered in more detail below, to comprehend and assess them using the fundamental indices given in the table. The features of the road network concerning the city system and all its facets and purposes are explained using the second index (proximity, I
p). It considers where important services and facilities, public transportation stops, intermodal interchanges, and residential buildings are located within urban areas and centrality [
44]. To better understand the current social dynamics and the various needs of each age group, it also evaluates the resident population’s distribution based on the registry age. The third index, “sociality” (I
s), is the most intricate in terms of both its definition and its outwardly straightforward structure. It is an index whose fundamental nature is subjective rather than numerical. We define it using data collection techniques from a strictly sociological field [
8], some of which are rooted in topics important to urban geography. It entails the distribution of surveys to each resident population in a way that bridges, for instance, technological gaps (older age groups) and those related to interest, which are occasionally diminished or superficial because of a lack of information sharing regarding the condition, upkeep, and potential uses of places in common. Our parallel study on the potential of digital platforms [
8], such as digital twins, demonstrates the great usefulness of these tools to facilitate information sharing and involves stakeholders and citizens in planning, programming, and decision-making processes in addressing the latter aspects.
3.1. Geometric–Morphological Approach
The complete contents of the geometric–morphological walkability index are displayed in
Table 2. Based on the examination of aerial photos, site surveys, and cartography, the seven indices presented in
Table 2 pertain to the geometric and morphological features of current roads.
Each road arch was given a corresponding value, and the results were added up to determine which parts of the road currently have a walkability level defined by a value scale with a maximum of 6 (the sum of the maximum scores corresponding to each item). Since most indices indicate the presence or absence of a particular type of element (sidewalks, road or sidewalk deformity, presence of pavement, etc.), the ranges assigned to each item are of the Boolean type (‘0–1’), with the range being defined by the number of items. The thickness of the lines that represent the road system itself indicates which of its sections are walkable based on the parameters mentioned, allowing for the visualization of an unprecedented picture of the city. This is achieved by classifying the road network in the GIS environment based on the final score (1) and, consequently, the geometric–morphological index.
It should be noted that the indices and their ranges are positive polarity when it comes to the walkability issue: wider streets are assigned a positive value (‘1’), and the presence of sidewalks and bicycle/pedestrian paths (‘1’) is deemed preferable to their absence. The analyzed area can be given a general walkability score using the data, which is primarily of a numerical type. After the information about the remaining areas is gathered, a ranking capable of supporting planning and pro-grammatic choices can be established by establishing different priorities for intervention. To this end, an average (M
Ig) is made between the values assigned to the stretches of Formula (2) in which n
e is the number of elements considered.
The average of the values then becomes a direct component of the walkability overall index (Iw), in which the three indices developed, representing the approaches already mentioned, allow each urban area to be given a total walkability score.
3.2. Proximity Approach
Research on the synthetic proximity index is still in its early phases. The next section reports on the initial findings of the works conducted on it. The goal of the proximity approach is to establish a relationship between the parts of the city and the users, the citizens, by verifying whether the pedestrian paths are efficient for accessing the main services and facilities, bus stops, and consequently urban centralities [
44], also referring to the concept of the 15-min city [
38,
39].
For the proximity analysis, which was essentially determined by assessing the degree of accessibility to certain urban elements, for each urban part analyzed, points of interest were first identified that could act as attractors both on a neighborhood and city scale. The main public buildings, housing, services, and facilities included the hospital, university, administrative offices, civil defense, and main school hubs but also the main commercial attractors. These are the main urban components that help to understand how the urban machine works.
4. The Case Study
The case study to which the methodology is applied is the city of L’Aquila. It was hit by a destructive earthquake in 2009 and is currently in the final phase of its reconstruction, which has mainly involved building without taking the opportunity to redevelop the urban framework, which already presented many criticalities before the earthquake [
3,
5].
For the application of the methodology, the city of L’Aquila was subdivided into eight zones (
Figure 2), which roughly represent the most densely populated districts and areas. They present the characteristics of more or less large districts, which have their own urban and infrastructural autonomy, also concerning the services, facilities and commercial system.
As stated earlier, this application in this paper is limited to the geometric–morphological approach and partially to the proximity approach.
Currently, the data collection and analyses developed are concentrated on zone 1 (
Figure 3), even if, in the following sections, there will be some elaborations covering all zones.
Data that are helpful in developing the analysis can be found on the Abruzzo Region’s open-data Geoportal (
http://opendata.regione.abruzzo.it/ accessed on 5 December 2023). Since it includes information about the road graph, the CTR (technical–regional map) from the regional territorial database (DBTR) updated to 2007 (the most recent updated official data available) was specifically used. The graph’s axis lines are used to depict the road network.
4.1. The Geometric–Morphological Approach
On the application of the geometric–morphological approach methodology, the characteristics linked to the graph’s elements, as previously mentioned, are of various kinds and can be linked to Boolean values. The information currently accessible on the regional open-data portal is:
Road section width: segments are classified based on whether their width is less than 3.5 m or more than 7 m. The latter are thought to have a higher propensity for walkability since, at a later stage of design, they would be appropriate for changes focused on increasing walkability.
Travel speed: segments are classified by the Italian Highway Code’s associated travel speed (greater than 50 km/h for highways, main and secondary suburban roads; less than 50 km/h for local, neighborhoods, and urban roads).
Road surface condition: segments are categorized in the database based on whether they have pavement.
The sustainable urban mobility plan (PUMS) [
46], which was released by the City of L’Aquila, contains information on sustainable mobility routes, such as bike and pedestrian paths. Specifically, the analysis focuses on the existence of bike and pedestrian pathways intended to form a soft mobility system with a maximum travel speed of 15 km/h.
Manual data collection is used with Google Earth Pro’s free Street View service and multispectral satellite imagine analysis [
9] to find information about the presence of sidewalks and surface irregularities on roads. Since the country’s coverage of this kind of data is regrettably highly uneven, automating the process for the area under investigation is not currently feasible.
After measuring the geometric–morphological quantities, the road graph segments with varying line thicknesses were linked to Boolean values, which were represented through thematic maps (
Figure 4) for each of the seven basic indices described in
Section 3.1.
It is deemed helpful to clarify that the increased thickness allotted to the street graph sections is to be interpreted as referring to the characteristics that improve the section’s walkability.
The concept of walkability, as defined by the street graph enhanced with the data, is graphically represented in
Figure 5, which shows an image of the city created by the geometric–morphological overall index, which is derived from the Formula (1) of the values obtained from the various indices.
Figure 6 presents an initial outcome of the aforementioned methodology extended to the entire urban area of the city, wherein the graph is depicted with varying thicknesses and color intensities based on the Ig index value. Nevertheless, this portrayal is incomplete since I
g7—which deals with the lack of obstructions on pavements—is not considered currently. This decision was made because of the inherent limitations of the surveying process used to gather the data.
Although, as already stated, many data collection operations are not automatable, to capture some information on street infrastructure concerning obstacles, in addition to the already mentioned Google Street View and satellite images, we are using the Mapillary application [
34,
47] by automatically analyzing a series of photos taken along both continuous and non-continuous road sections (
https://www.mapillary.com, accessed on 5 December 2023). After being imported into the application’s proprietary system, these images are analyzed using computer vision technologies that enable the creation of 3D reconstructions of the objects in the images through object recognition through image comparison with database entries. After that, the elements are precisely mapped in space, producing unpublished geospatial data that can be seen on specialized maps. An early outcome of the working group’s investigation into this tool is displayed in
Figure 7. Zone 6 in
Figure 1 represents the area covered, which is in L’Aquila’s historic center.
It is possible to confirm how the application recognizes and maps various element types and categories based on the image. Specifically, the following elements were found and shown, among others: street signals, streetlights, banners, billboards, benches, bike racks, crosswalks, manholes, poles, and traffic lights.
Owing to their open-source nature, these data can be empirically verified as to the degree of walkability of the analyzed road sections, and they can also be imported into a GIS environment in a way that enriches the database used to determine the Ig7. The analysis’s experiential component allows for a deeper exploration of the data than what is officially available online (such as the graph that serves as the basis and the accompanying information).
4.2. The Proximity Approach
The proximity overall index describes the relationship between users, and thus citizens, and the system of services, facilities, bus stops and centralities, analyzed in terms of accessibility. The basic proximity indices, as described in
Table 1, are related to I
p1—services and facilities proximity, I
p2—centrality/15-min city, and I
p3—bus-stop proximity. The first index is still under development as it is based on complex information to be found, while for the second and third, preparatory elaborations were produced (not yet the indices).
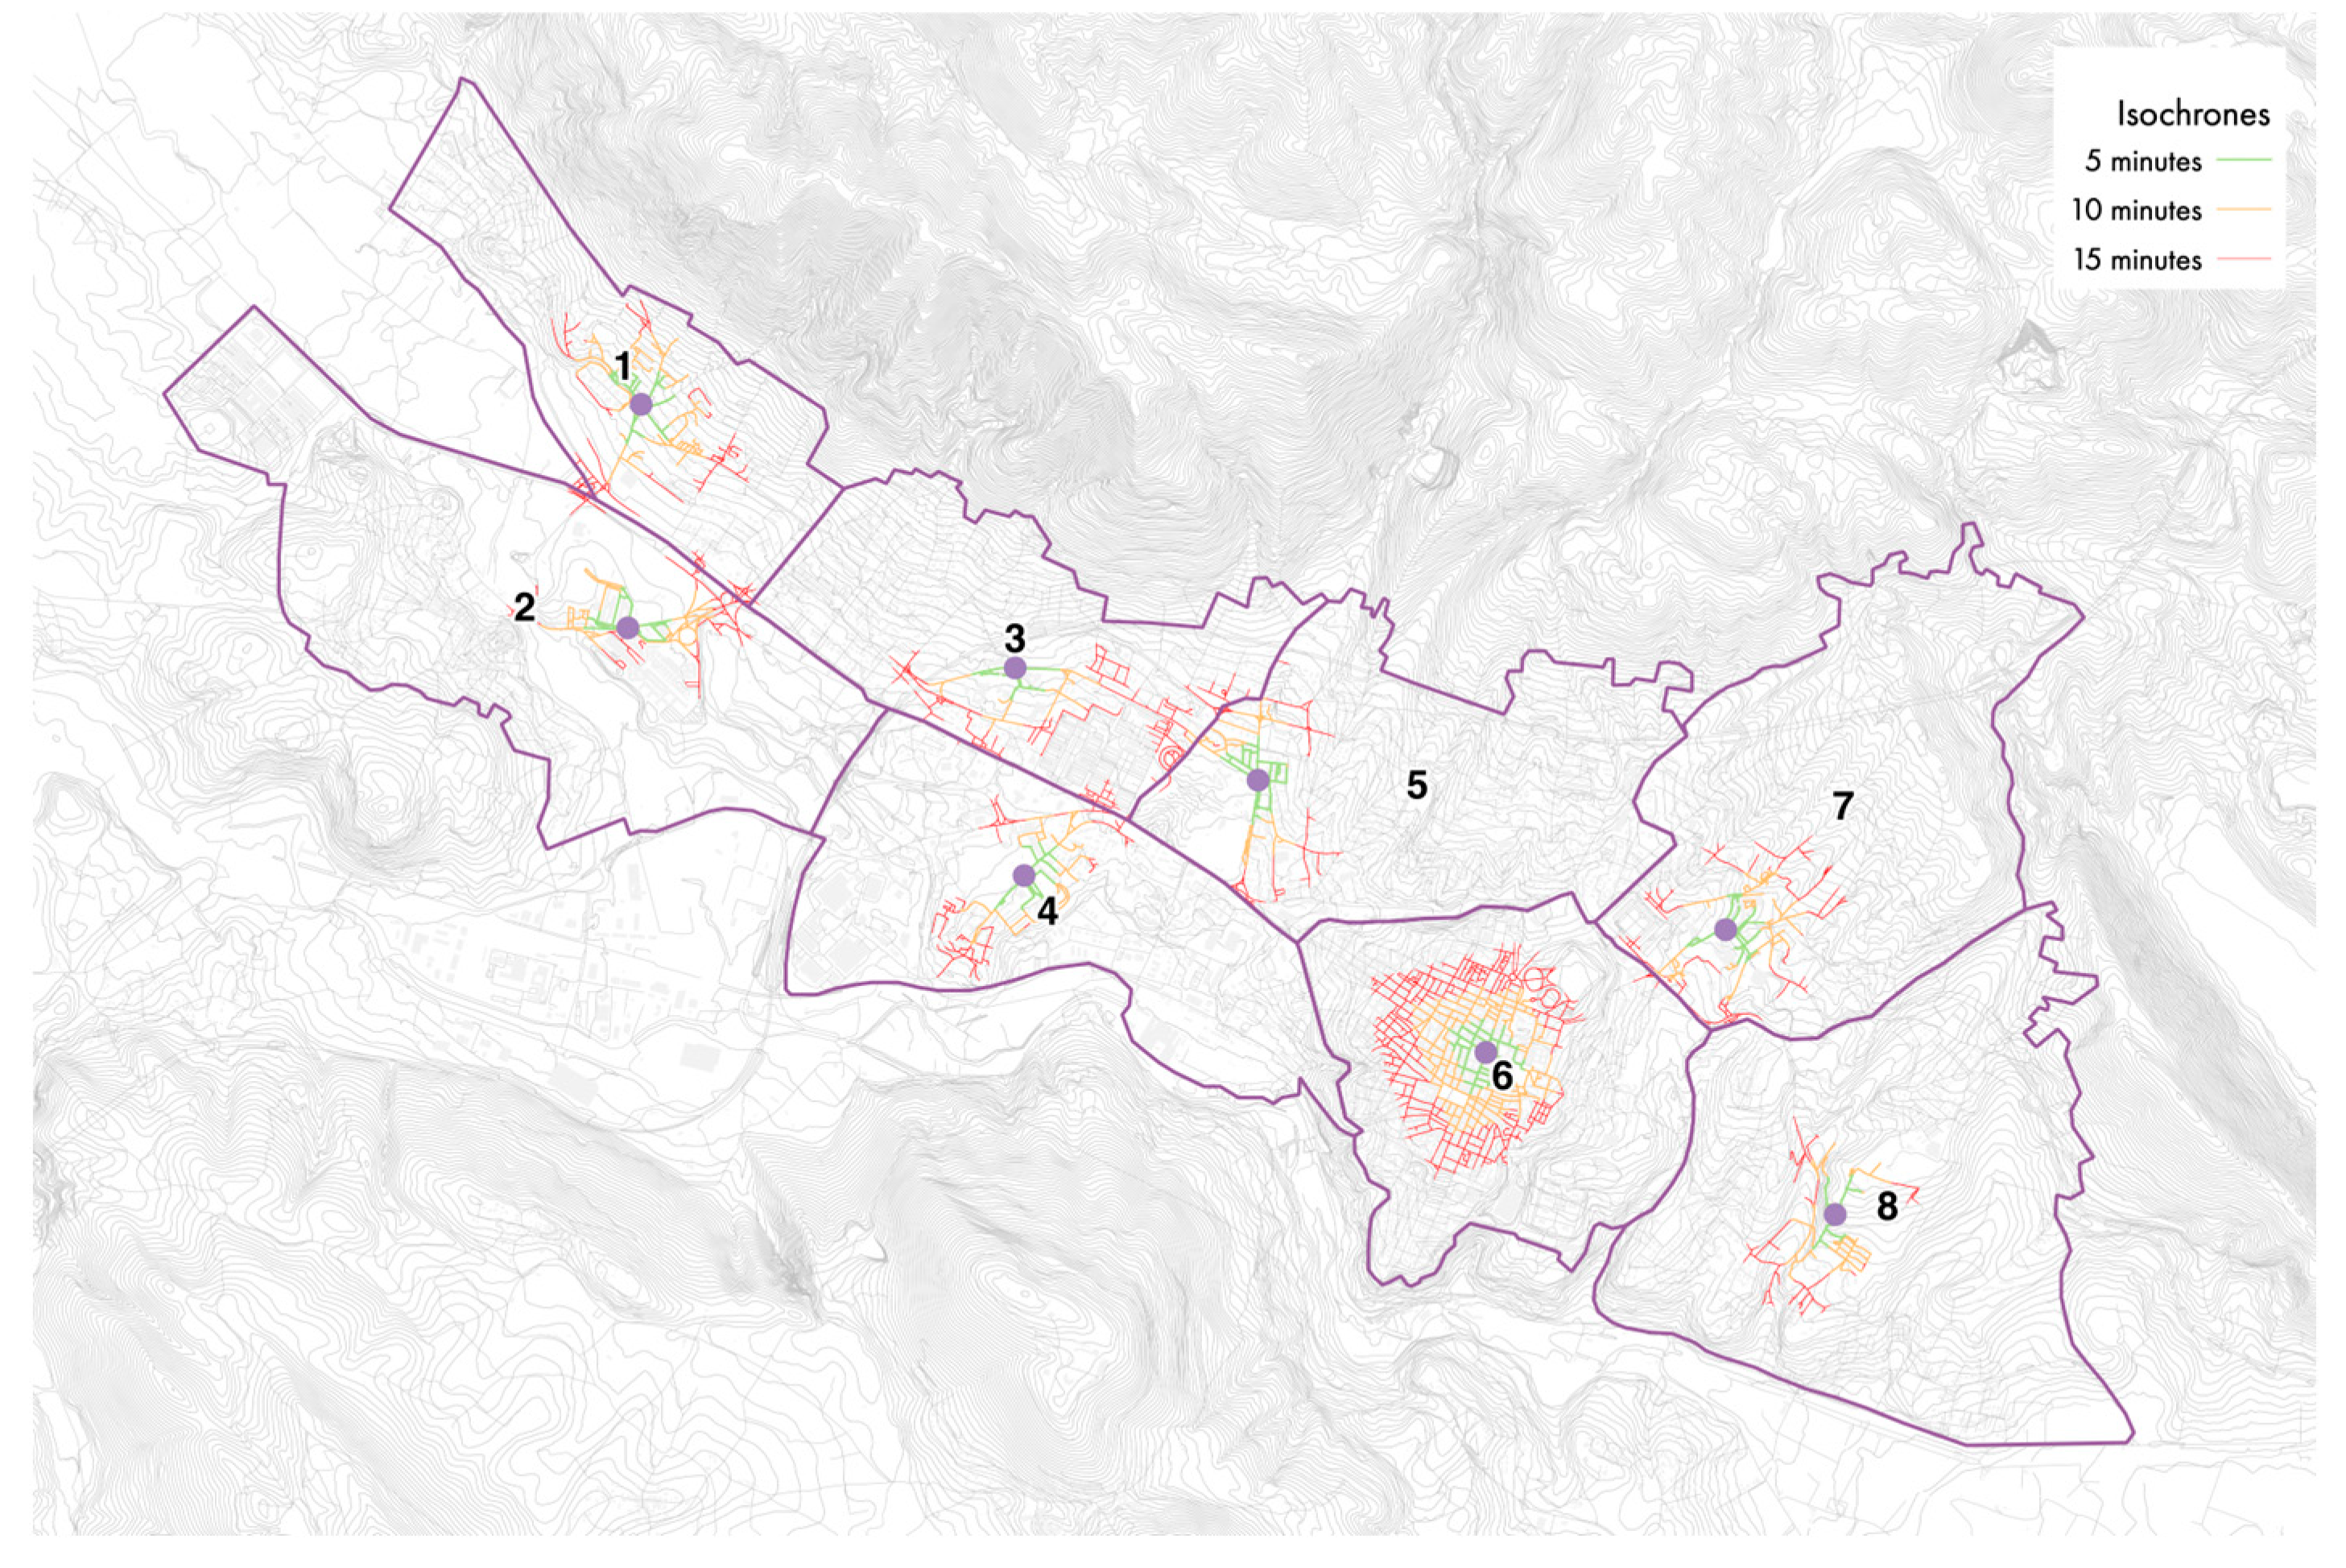
The urban centralities were identified based on the analysis of the eight zones into which the city of L’Aquila was divided. They are the barycentral points of these zones, determined by considering the concentration of public spaces, public facilities, services and commercial. From these barycentric points, the 5-, 10- and 15-min isochrones were determined on the actual streets using GIS tools, thus defining the city’s 15-min character, as depicted in
Figure 8. The speed of travel is adjusted to consider various user typologies, including those based on age and potential disabilities, to analyze how walkable the road network is. A walking speed of 2.50 km/h is taken into consideration (assuming 0.7 m/s as the average user movement speed).
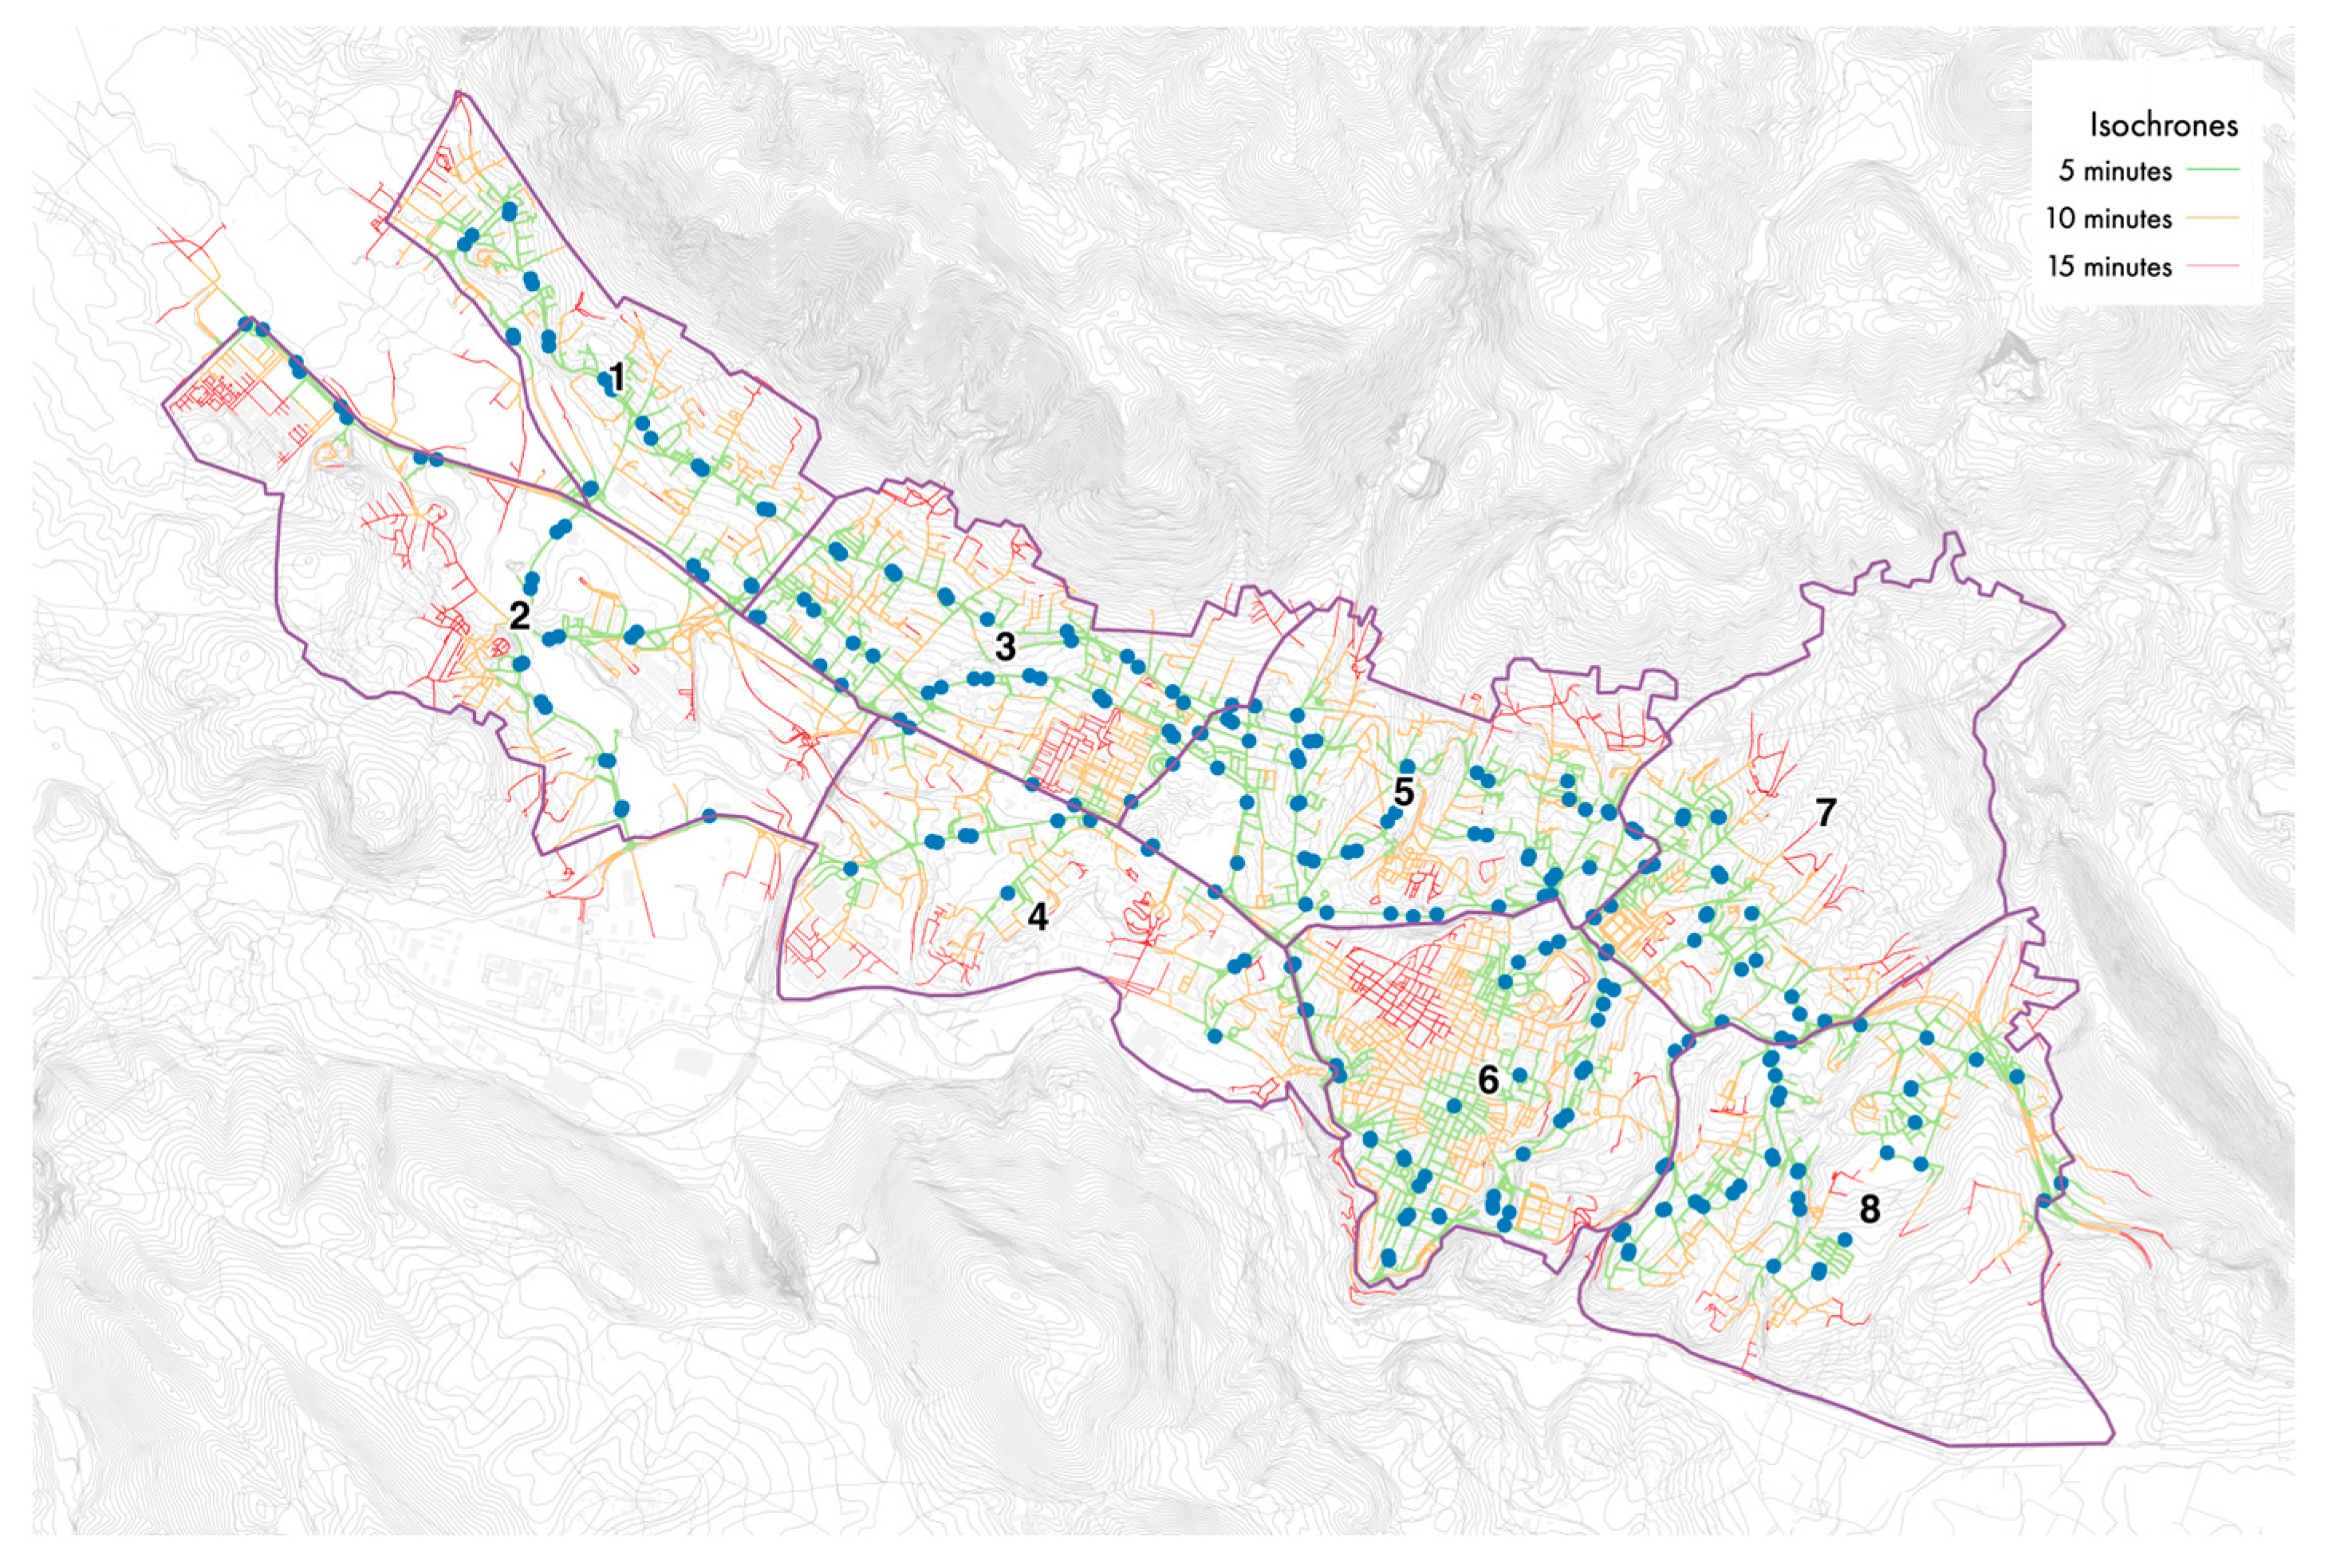
In a similar way, the accessibility of bus stops (public transport) was analyzed by determining the 5-, 10- and 15-min isochrones on the streets. The various proximity levels for the eight zones are displayed in
Figure 9.
At the current stage of research, we are adding an accessibility value related to the time interval to each road network segment; this analysis enhances the database associated with the road graph. Three proximity classes are defined by evaluating the results based on the proportion of the entire road network that falls within each of the time intervals. In addition, we are determining the first basic index Ip1 on accessibility to the system of public services and facilities, which will be useful in determining the synthetic proximity index.
5. Conclusions
The research described in this paper concerns the measurement of the walkability of a city, through three sets of indices—(i) geometric–morphological, (ii) proximity, and (iii) sociality—aimed at forming a walkability overall index that integrates three approaches that, in the scientific literature, are often addressed separately. The aim is, on the one hand, to determine the level of walkability of the street infrastructures of our cities, and, on the other hand, to define and apply planning and urban design techniques to improve the level and make the city walkable, considering active mobility. At present, the research is at the stage of determining the walkability overall index of the infrastructure network and starting to define possible urban design practices to improve the use of urban areas on foot. The paper describes the partial application of the general methodology to the case study of the city of L’Aquila (Italy), and of the index relating to the geometric–morphological approach (i) (developed entirely in its seven basic indices) and that relating to the approach (ii) proximity (almost completely developed, two basic indices out of three). This is because it is very difficult and expensive to collect the information necessary for the analyses, from a very high and varied number of sources, and therefore requires a lot of time.
The results of this first application highlight that, regarding geometric–morphological aspects, many infrastructures have very low indices, and their current shape would thus not be able to accommodate pedestrian mobility. For these streets, it will therefore be necessary to apply urban design and urban planning techniques capable of modifying the urban form and adapting it to accommodate the function of this type of mobility. Regarding the aspects of proximity, connected to that of accessibility, it turns out that the current structure of the urban shape is not capable of supporting a walkable city. Urban centralities (concentrations of public spaces, services, facilities and commercial areas) have very small areas that can be reached in 15 min. This also occurs with bus stops, which leave many parts of the city uncovered and can be reached in more than the aforementioned 15 min. Therefore, it is clear already from these first results that the structure of the city must be reconsidered. The parts of the city must be reconnected by an urban repair project that significantly increases the walkability overall index.
The limitations of this type of approach are essentially related to the intrinsic characteristics of the methodology used: First, the reductionism of the method, which, for the analysis of walkability, uses indicators determined by successive syntheses, meaning that there is only one walkability overall index. This aspect is overcome, however, by keeping the original data in the information system but, above all, the basic indices that are very useful in establishing what type of urban design technique to apply in the future to improve the walkability of the infrastructures and thus of the city. Another limitation is the lack of data on certain physical aspects of streets (e.g., existing geographical databases do not always report the presence of pavements, even if they exist; the presence of obstacles, the material and condition of the pavement; etc.) and above all on social aspects. Concerning physical data, in this study, we have tried to compensate for this by introducing the combined use of multispectral satellite images from which geographical data on the condition of roads can be obtained, as well as with automatic crowdsourced road mapping applications (Mapillary). Regarding social data, we are instead preparing a sample campaign that will use surveys to collect useful information, which will also be reduced to numerical indices.
Regarding the next steps of the research, the methodology to close the analyses on the proximity approach will be implemented and the approach on social aspects will be addressed. Furthermore, the research team is currently involved in international research collaboration within the Erasmus + UPGRADE project framework to verify the applicability of the proposed methodology in different contexts. Since the project’s participating universities are in Egypt and Lebanon and the reference cities—Alexandria, Cairo, and Beirut—are much larger than L’Aquila, the research groups are collaborating to find homogeneous areas to apply the methodology to confirm the comparability and replicability of the findings.


