
Mega-Events: Assessing Road Safety through an Operating Framework. An Application for the Milano–Cortina 2026 Winter Olympic Games †

 ,
, 


Abstract
1. Introduction
2. Data and Methods
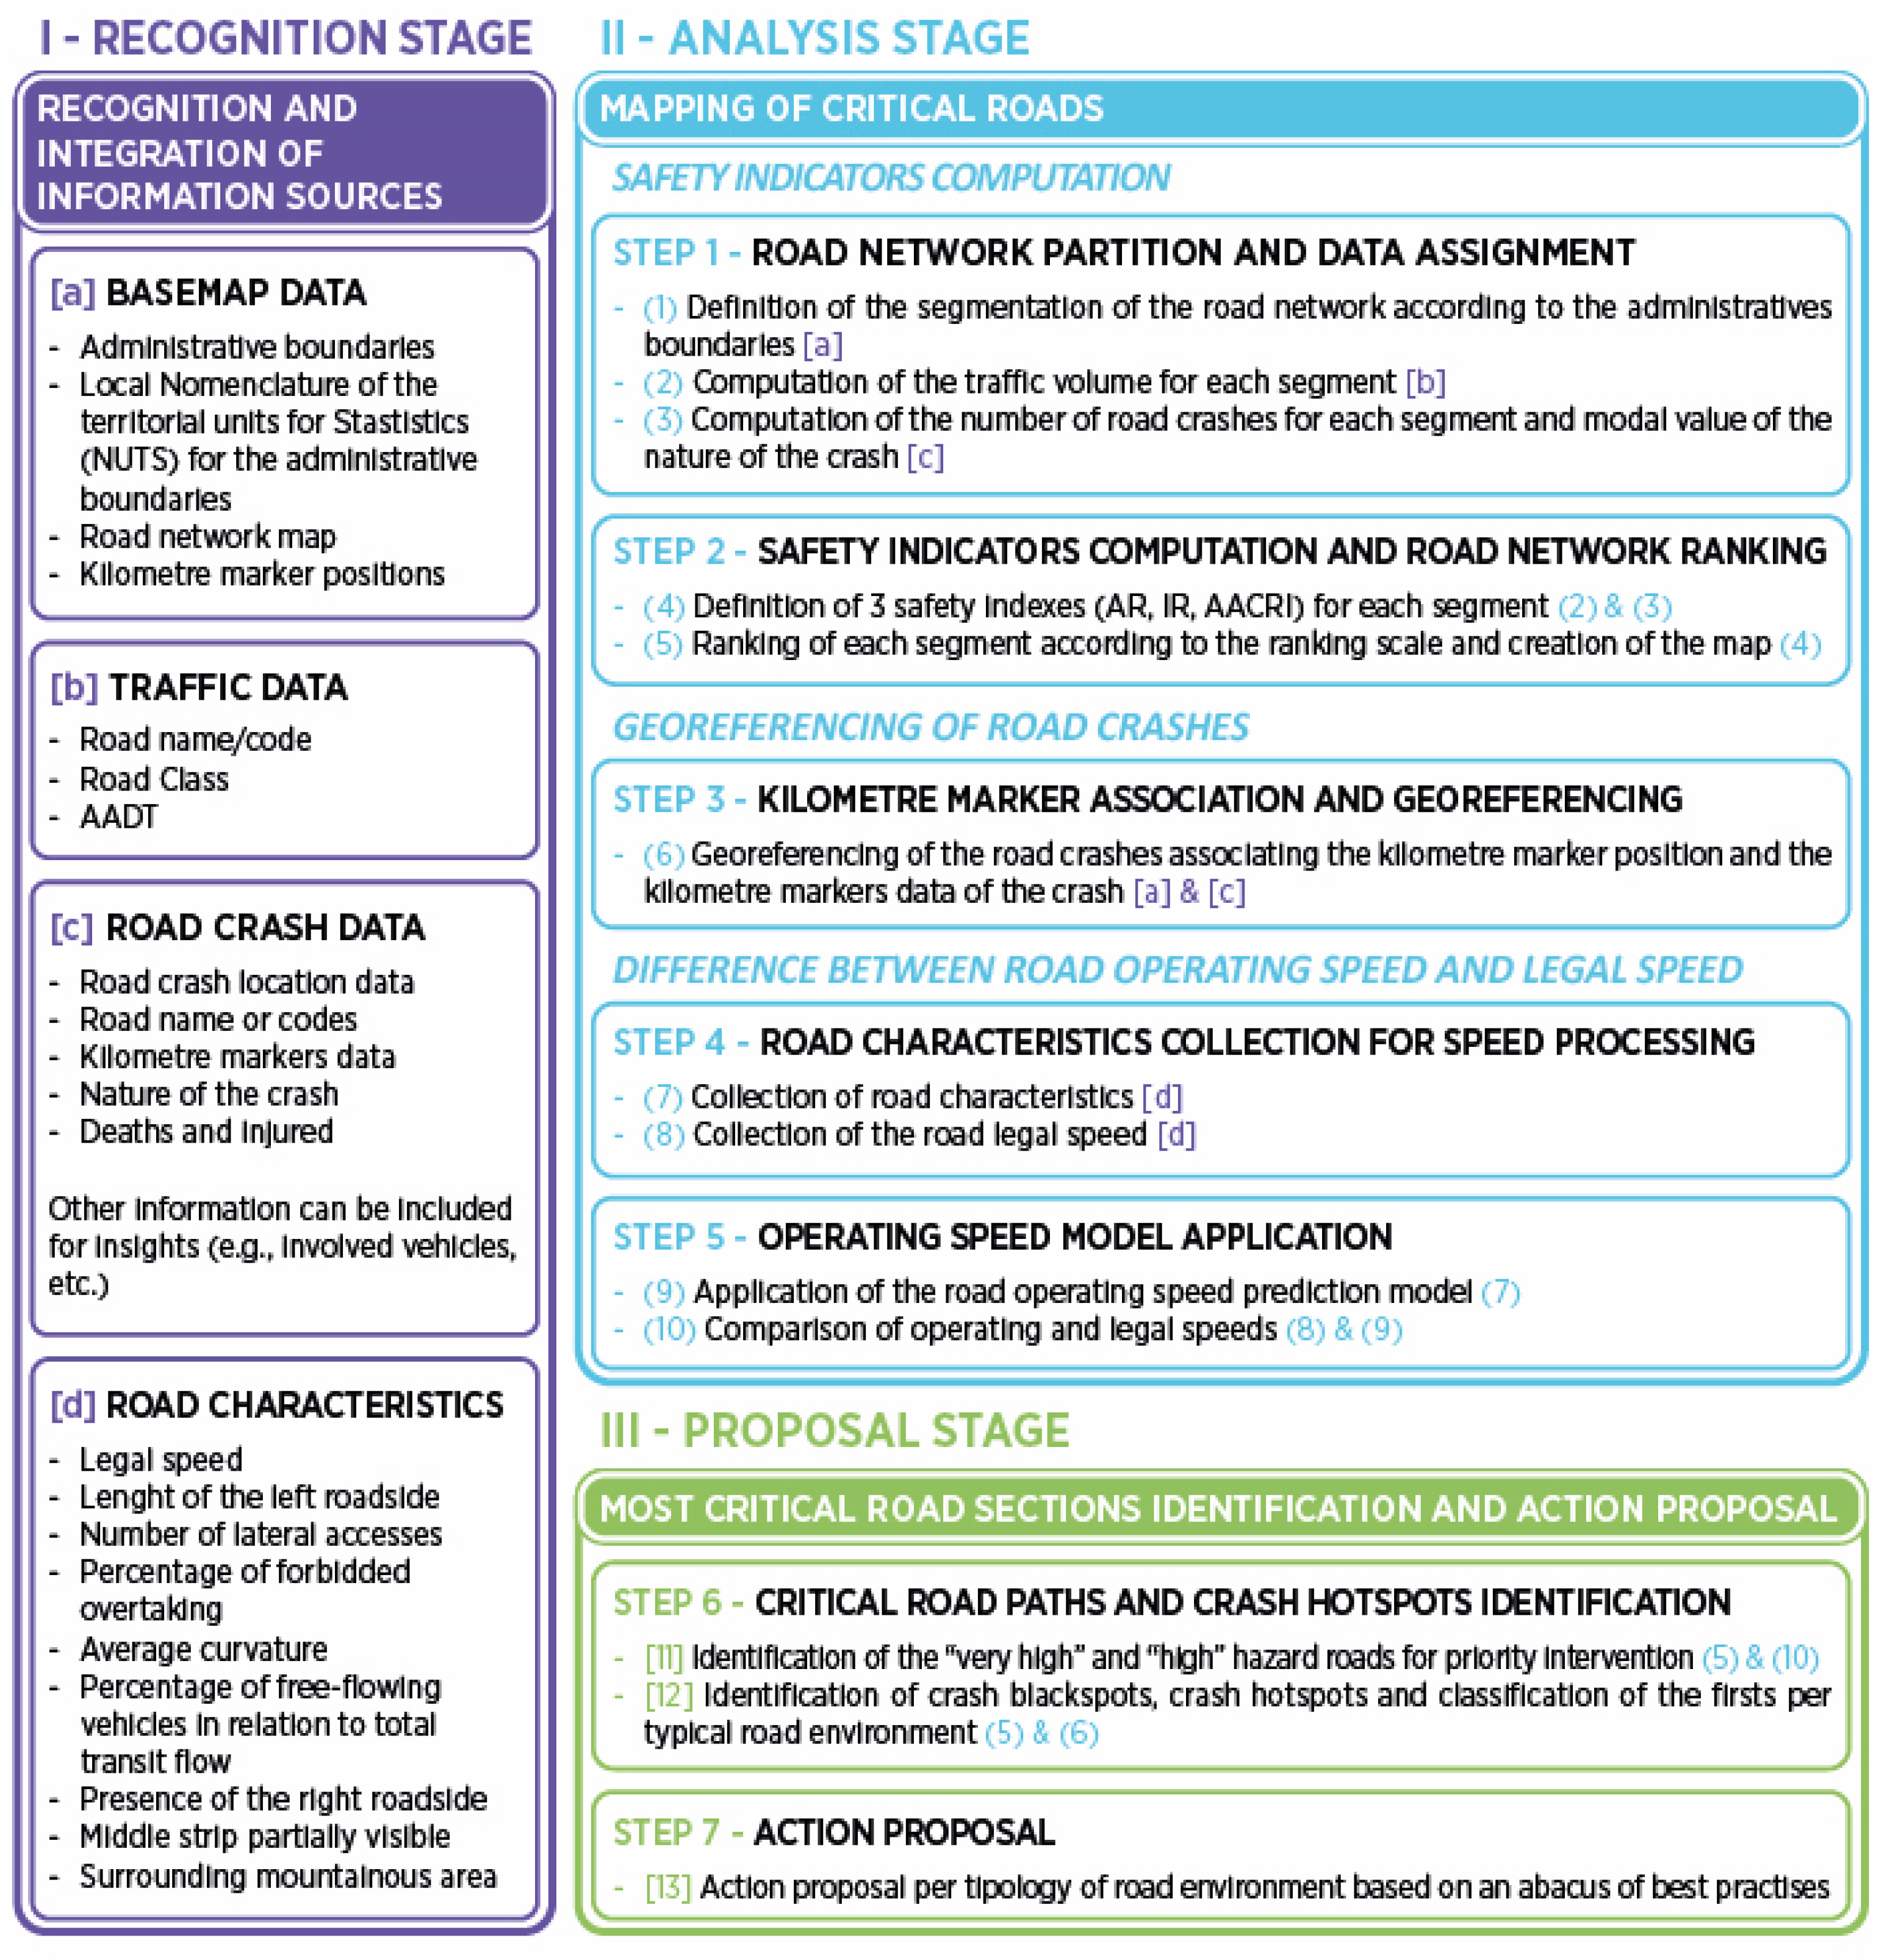
2.1. I—Recognition Stage
2.2. II—Analysis Stage
2.2.1. Step 1—Road Network Partition and Data Assignment
- be the set of territorial jurisdictions in the study area and be a generic jurisdiction.
- be the set of roads crossing the jurisdiction , and be a generic road.
- be the set of the segments of the road r withing , and s be a generic segment.
- be the set of paths formed by all segments s of the road r within , and ∈ a generic path.
- be the length of a generic segment s ∈ .
- be the AADT of a generic segment s ∈ .
- T be the considered temporal period.
- N (r, j) be the set of road crashes that occurred on the route r ∈ R(j) within j ∈ J during T and ∈ be a generic crash.
- M (r, j) be the set of road deaths that occurred on the route r ∈ R(j) within j ∈ J during T, and ∈ be a generic road death.
- I (r, j) be the set of road injuries that occurred on the route r ∈ R(j) within j ∈ J during T and ∈ be a generic injury.
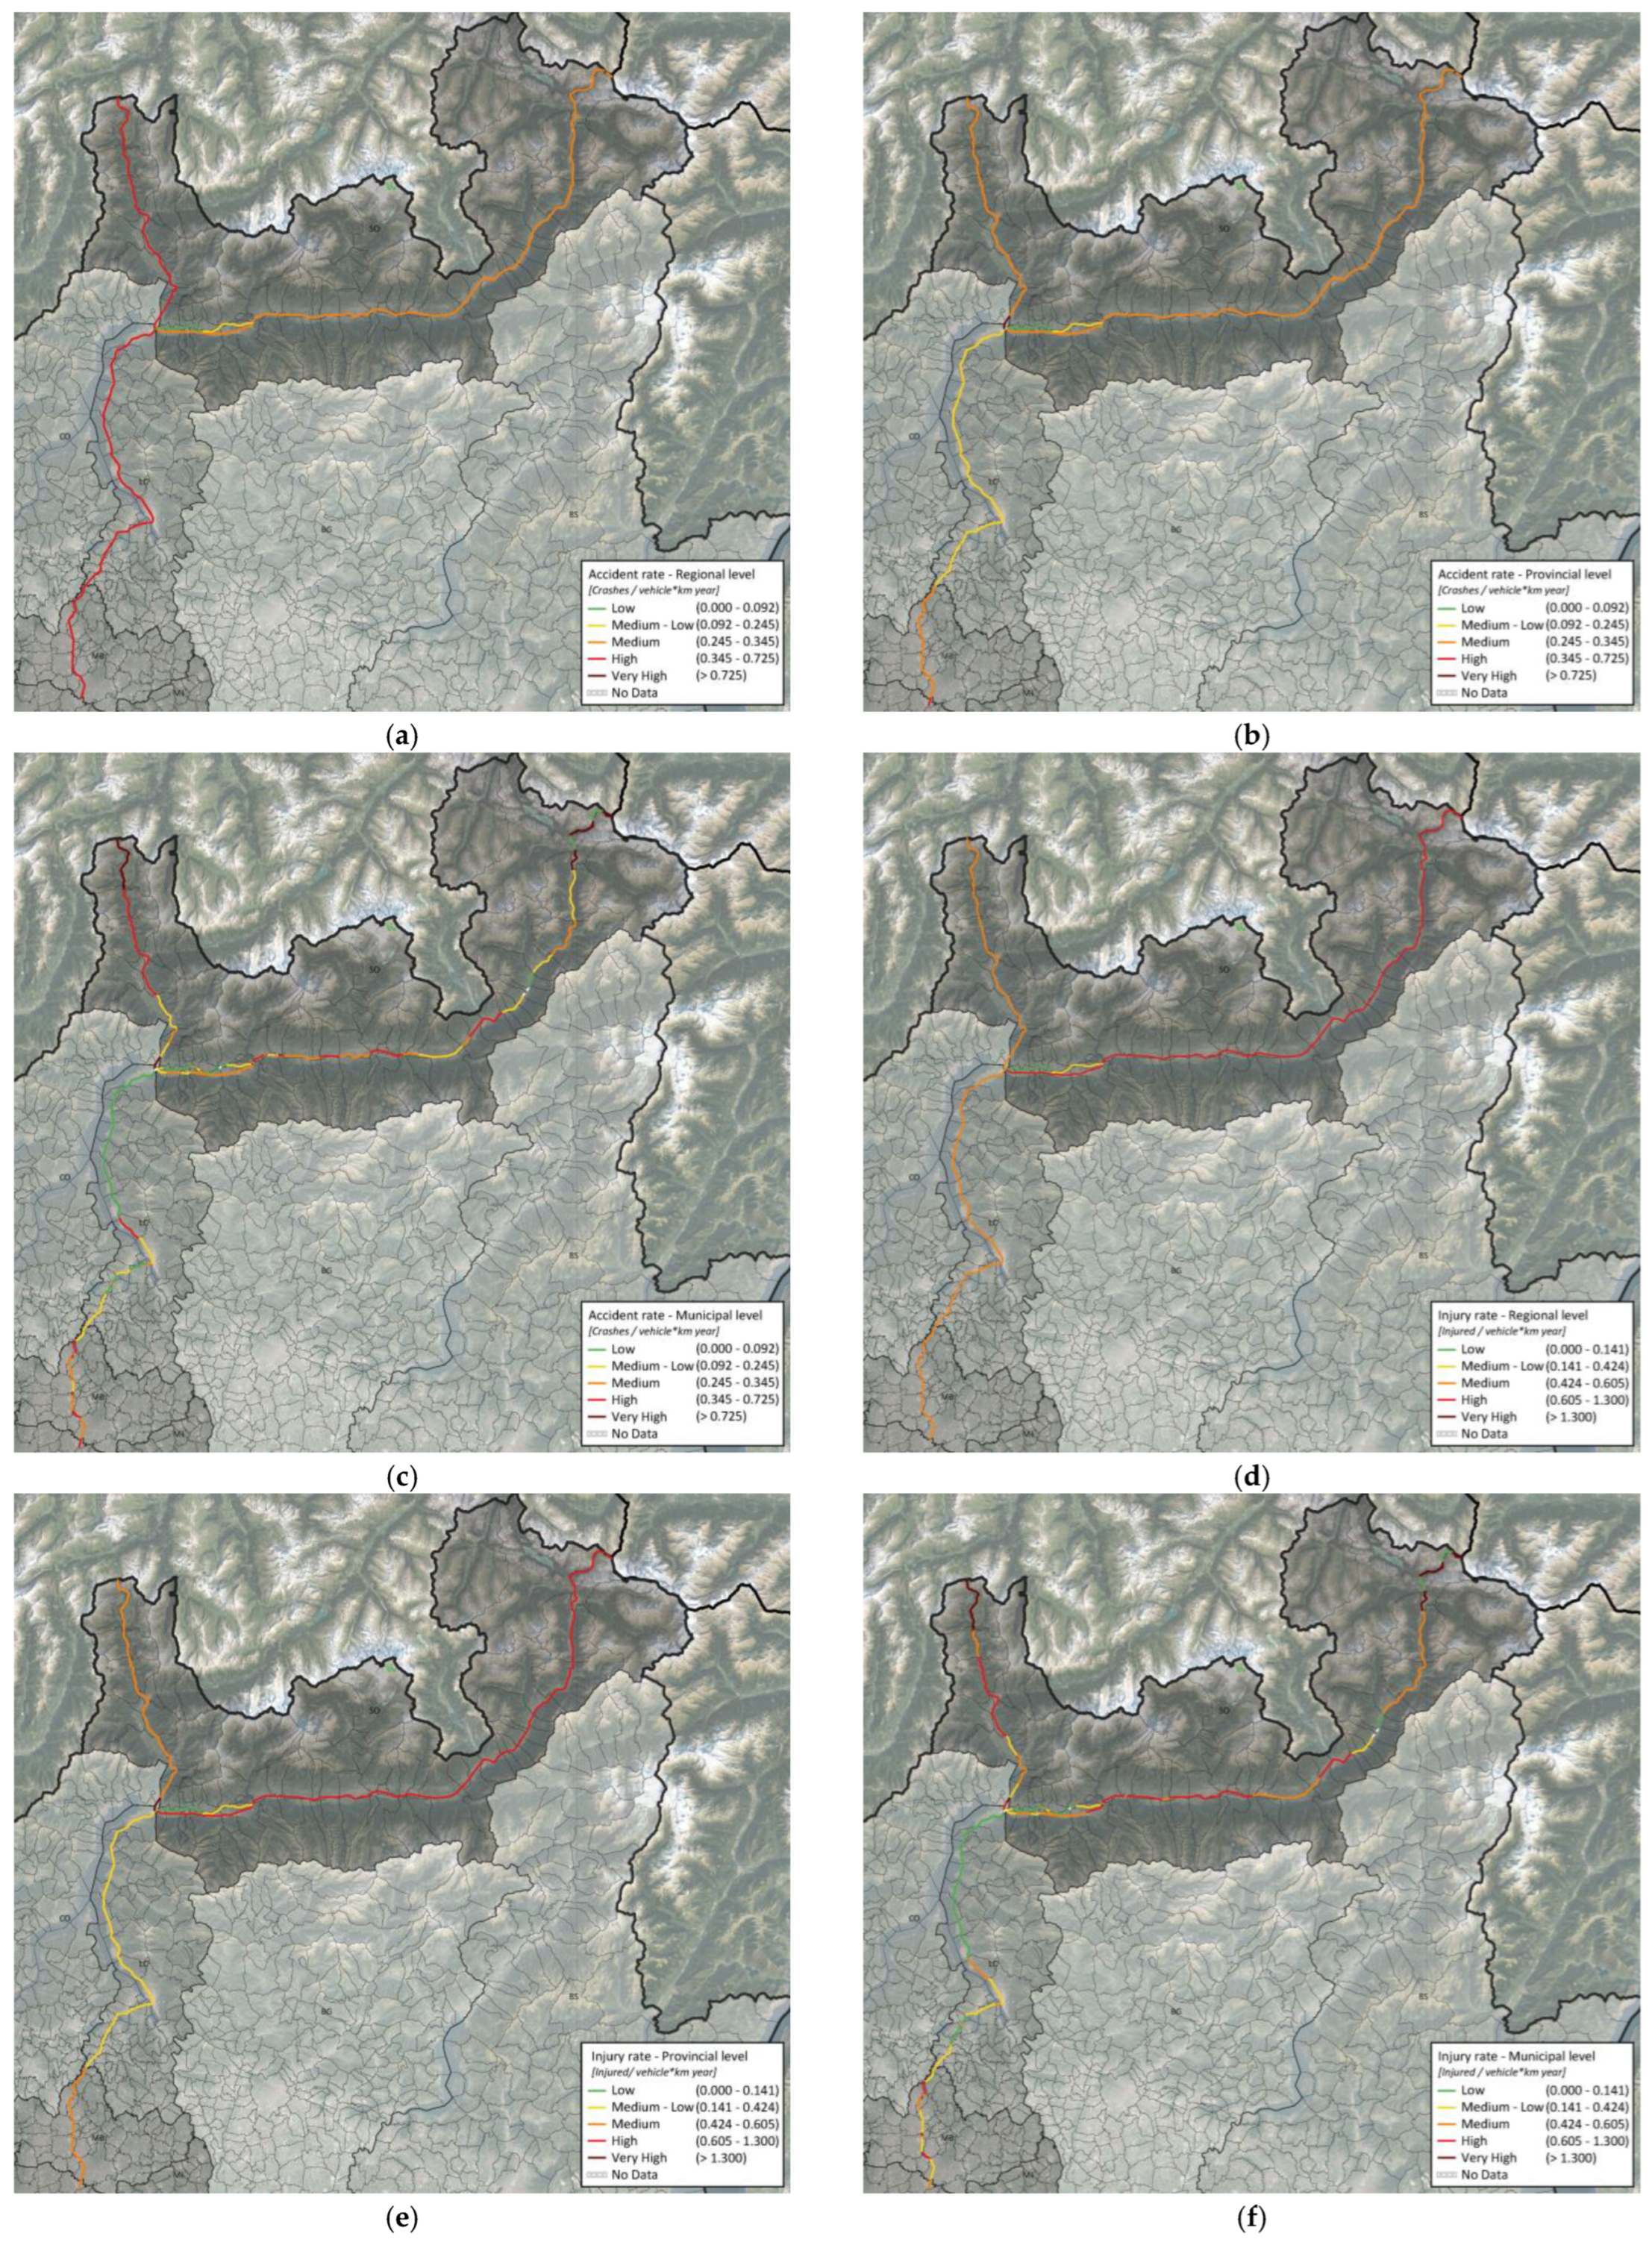
2.2.2. Step 2—Safety Indicators Computation and Road Network Ranking
- α, β and γ be the coefficients for estimating the unitary social costs associated with a road crash, a fatality, and an injury, respectively.
- f be the number of days in the considered temporal period T.
- cr,j be the unitary social cost.
2.2.3. Step 3—Georeferencing of Road Crashes Based on Kilometre Marker
- , be the real kilometre marker path.
- , be the hypothetical kilometre marker path.
- , be the virtual kilometre marker path.
- be the ratio between the real and the virtual step.
- be the fixed spacing to be determined due to each precision need.
2.2.4. Step 4—Road Characteristics Collection for Speed Processing
2.2.5. Step 5—Operating Speed Model Application
- be the width of the left side of the platform.
- be the number of lateral accesses.
- be the percentage of impeded overrun.
- be the mean curvature.
- (A/Q) be the percentage of free-flowing cars about the total capacity handled.
- be the presence of the paved right platform.
- be the visibility of the central strip.
- be the presence of surrounding mountainous terrain.
- be the number of lanes.
- be the visibility of the edge horizontal markings.
2.3. III—Proposal Stage
2.3.1. Step 6—Critical Road Paths and Blackspot Identification
2.3.2. Step 7—Action Proposal
3. Results
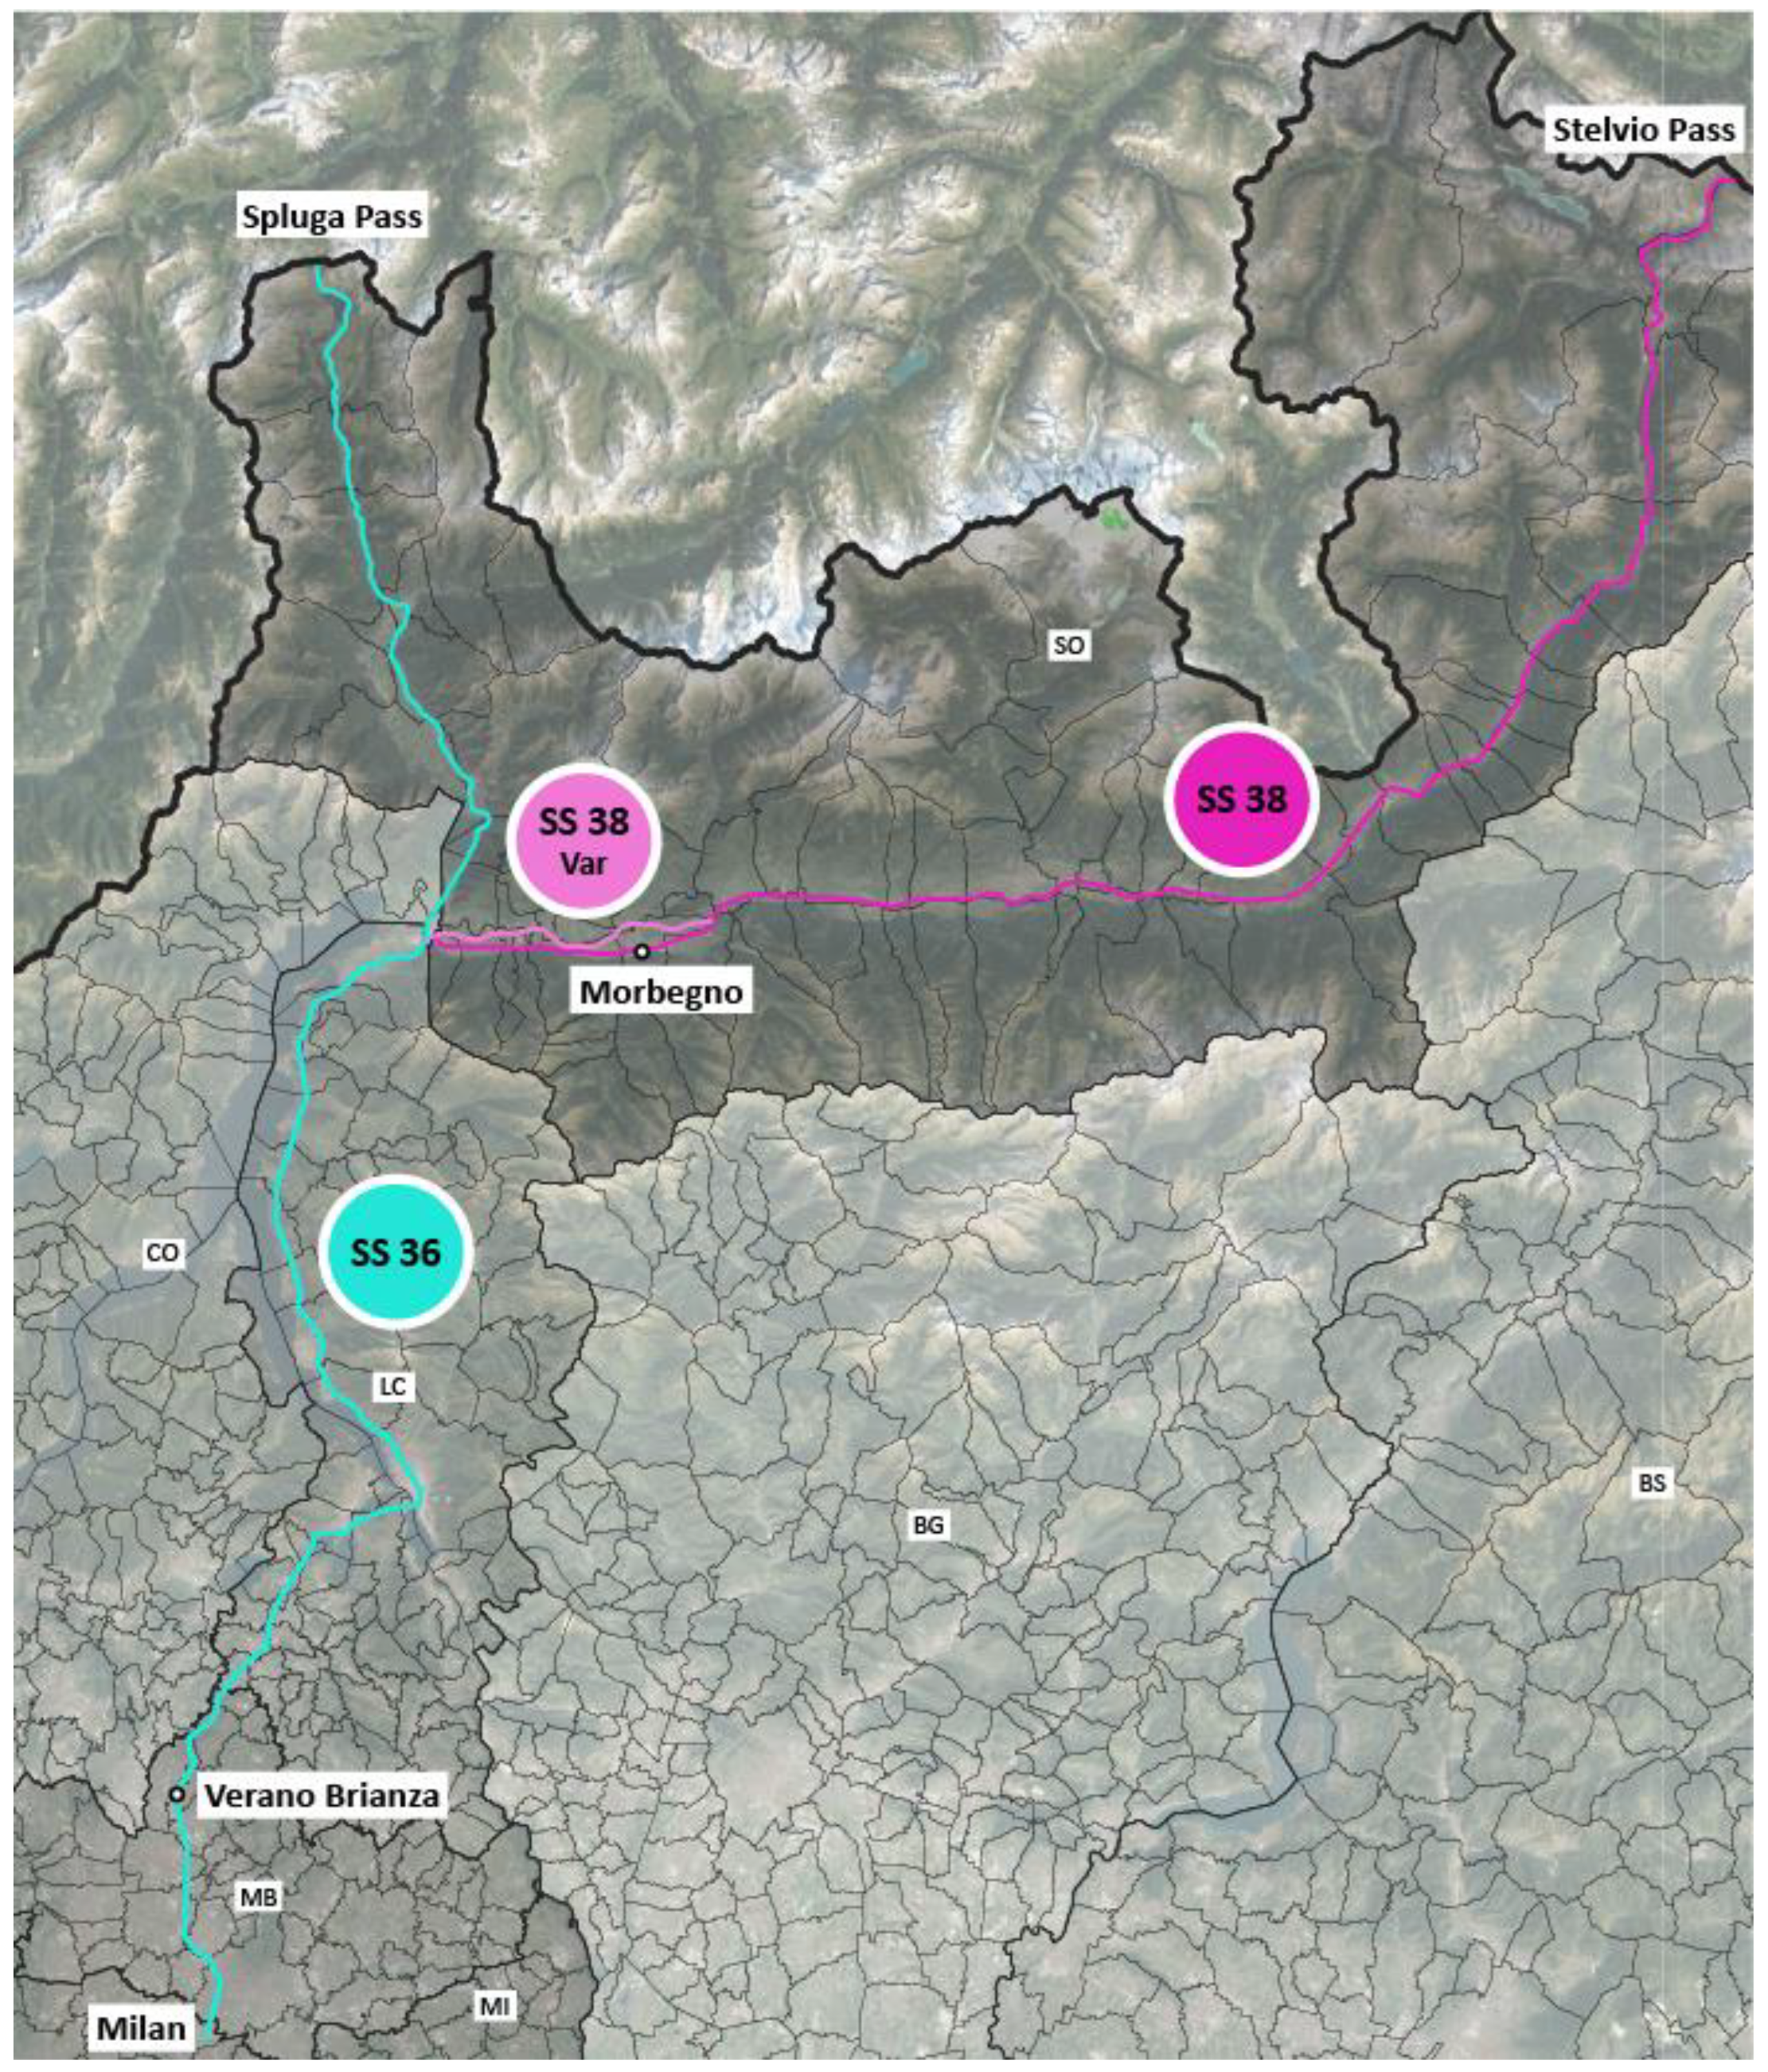
3.1. The Context
3.2. Experimental Setup
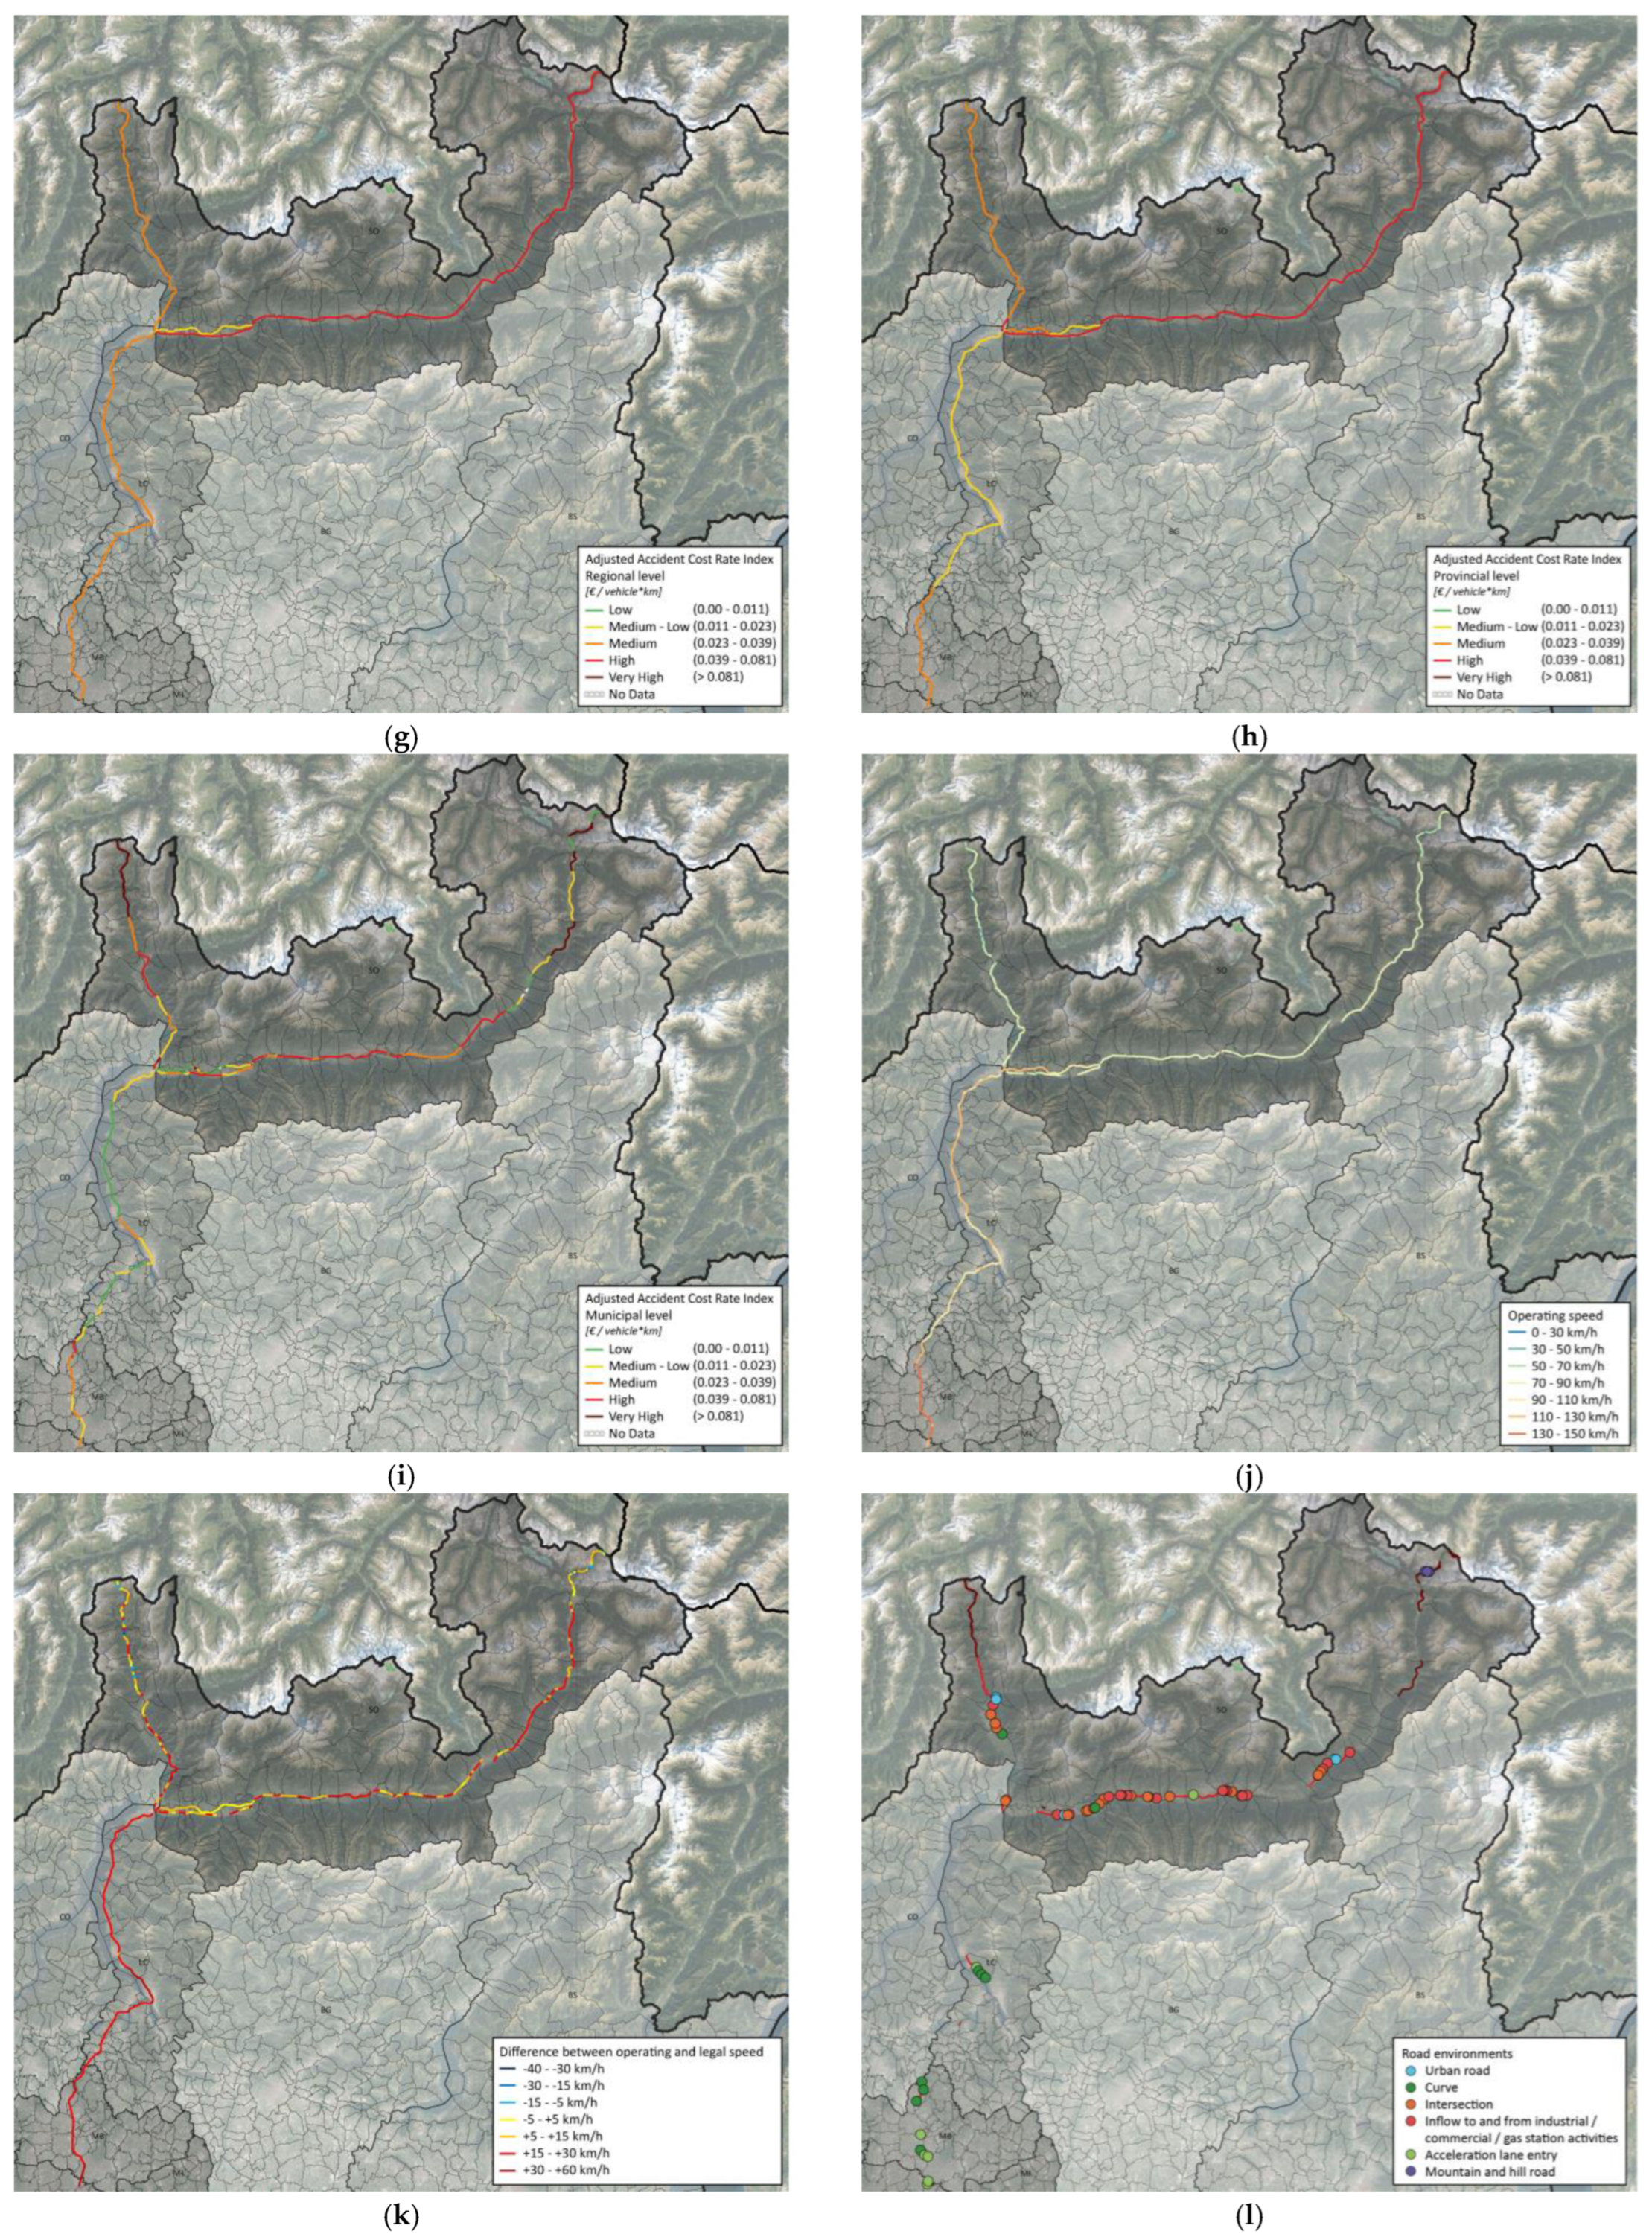
3.3. Framework Development and Results
- (i)
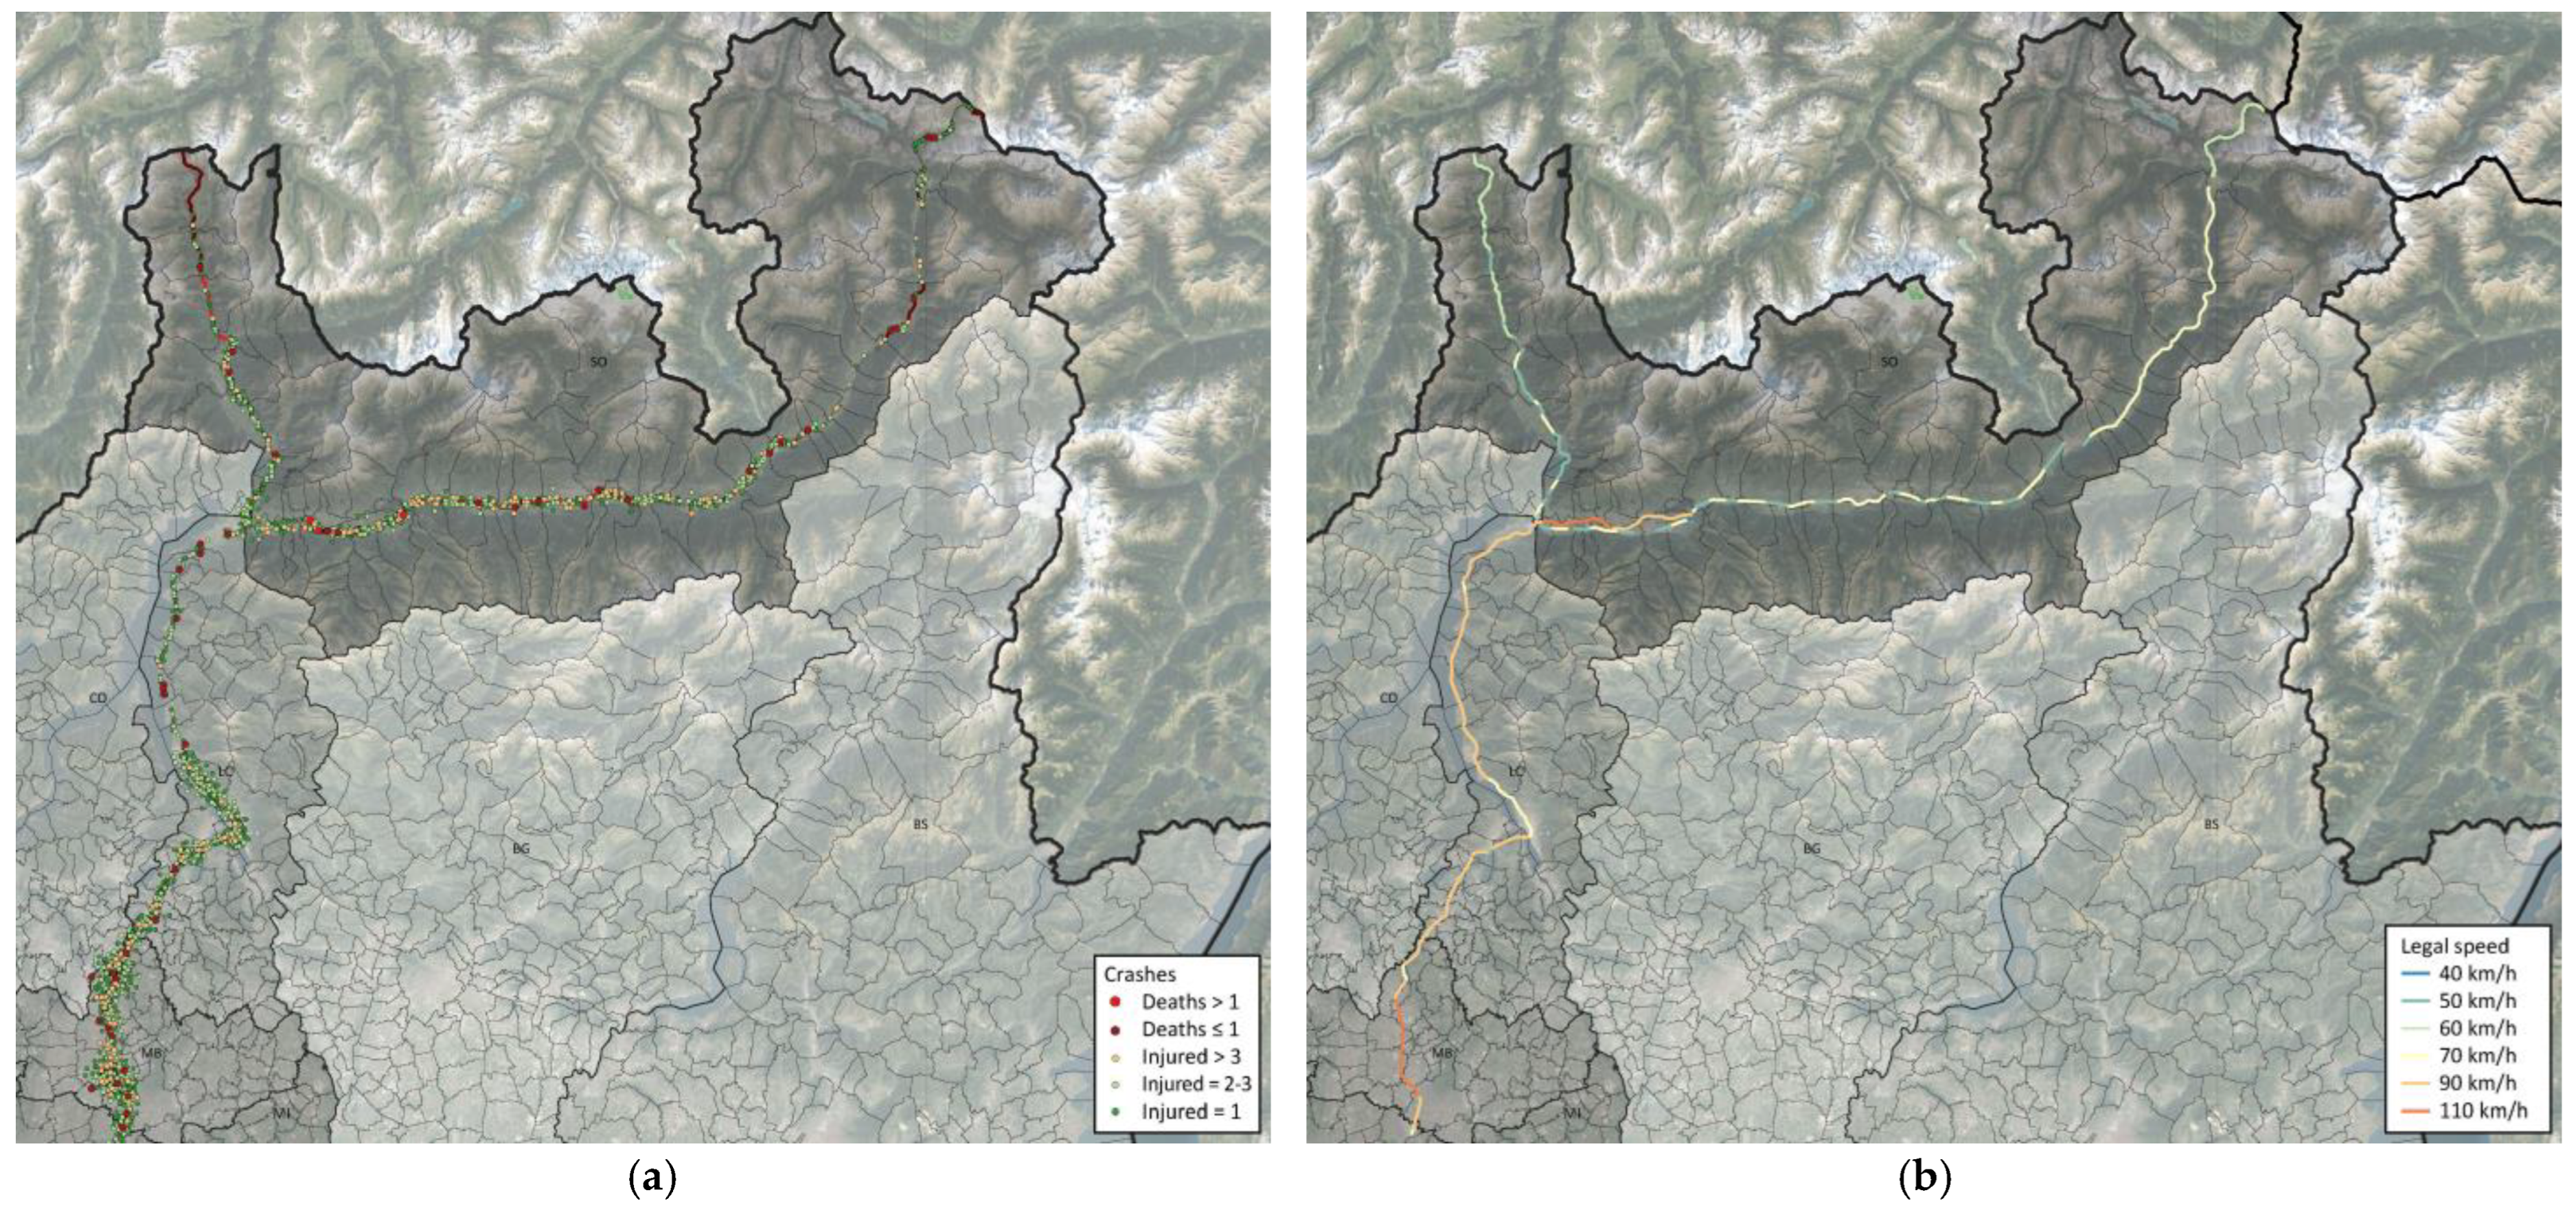
- An analysis of the concentrations of crashes, injuries, and deaths in the critical road sections that lead to the identification of the blackspots.
- (ii)
- An analysis of the data of these crashes together with off-site and/or on-site inspections of all the blackspots.
- (iii)
- The classification of all the blackspots identified in one of the seven different typologies of road environments.
- (i)
- A total of 24% of the road segments need priority intervention (Figure 4a–d,f–i).
- (ii)
- In total, 83.4% of the road segments have a difference between operating speed and legal speed from 5 to more than 60 km/h (Figure 4k).
- (iii)
- In total, 4.3% of the road segments have a difference between operating speed and legal speed from −5 to less than −40 km/h (Figure 4k).
- (iv)
- A total of 60 blackspots were identified (Figure 4l).
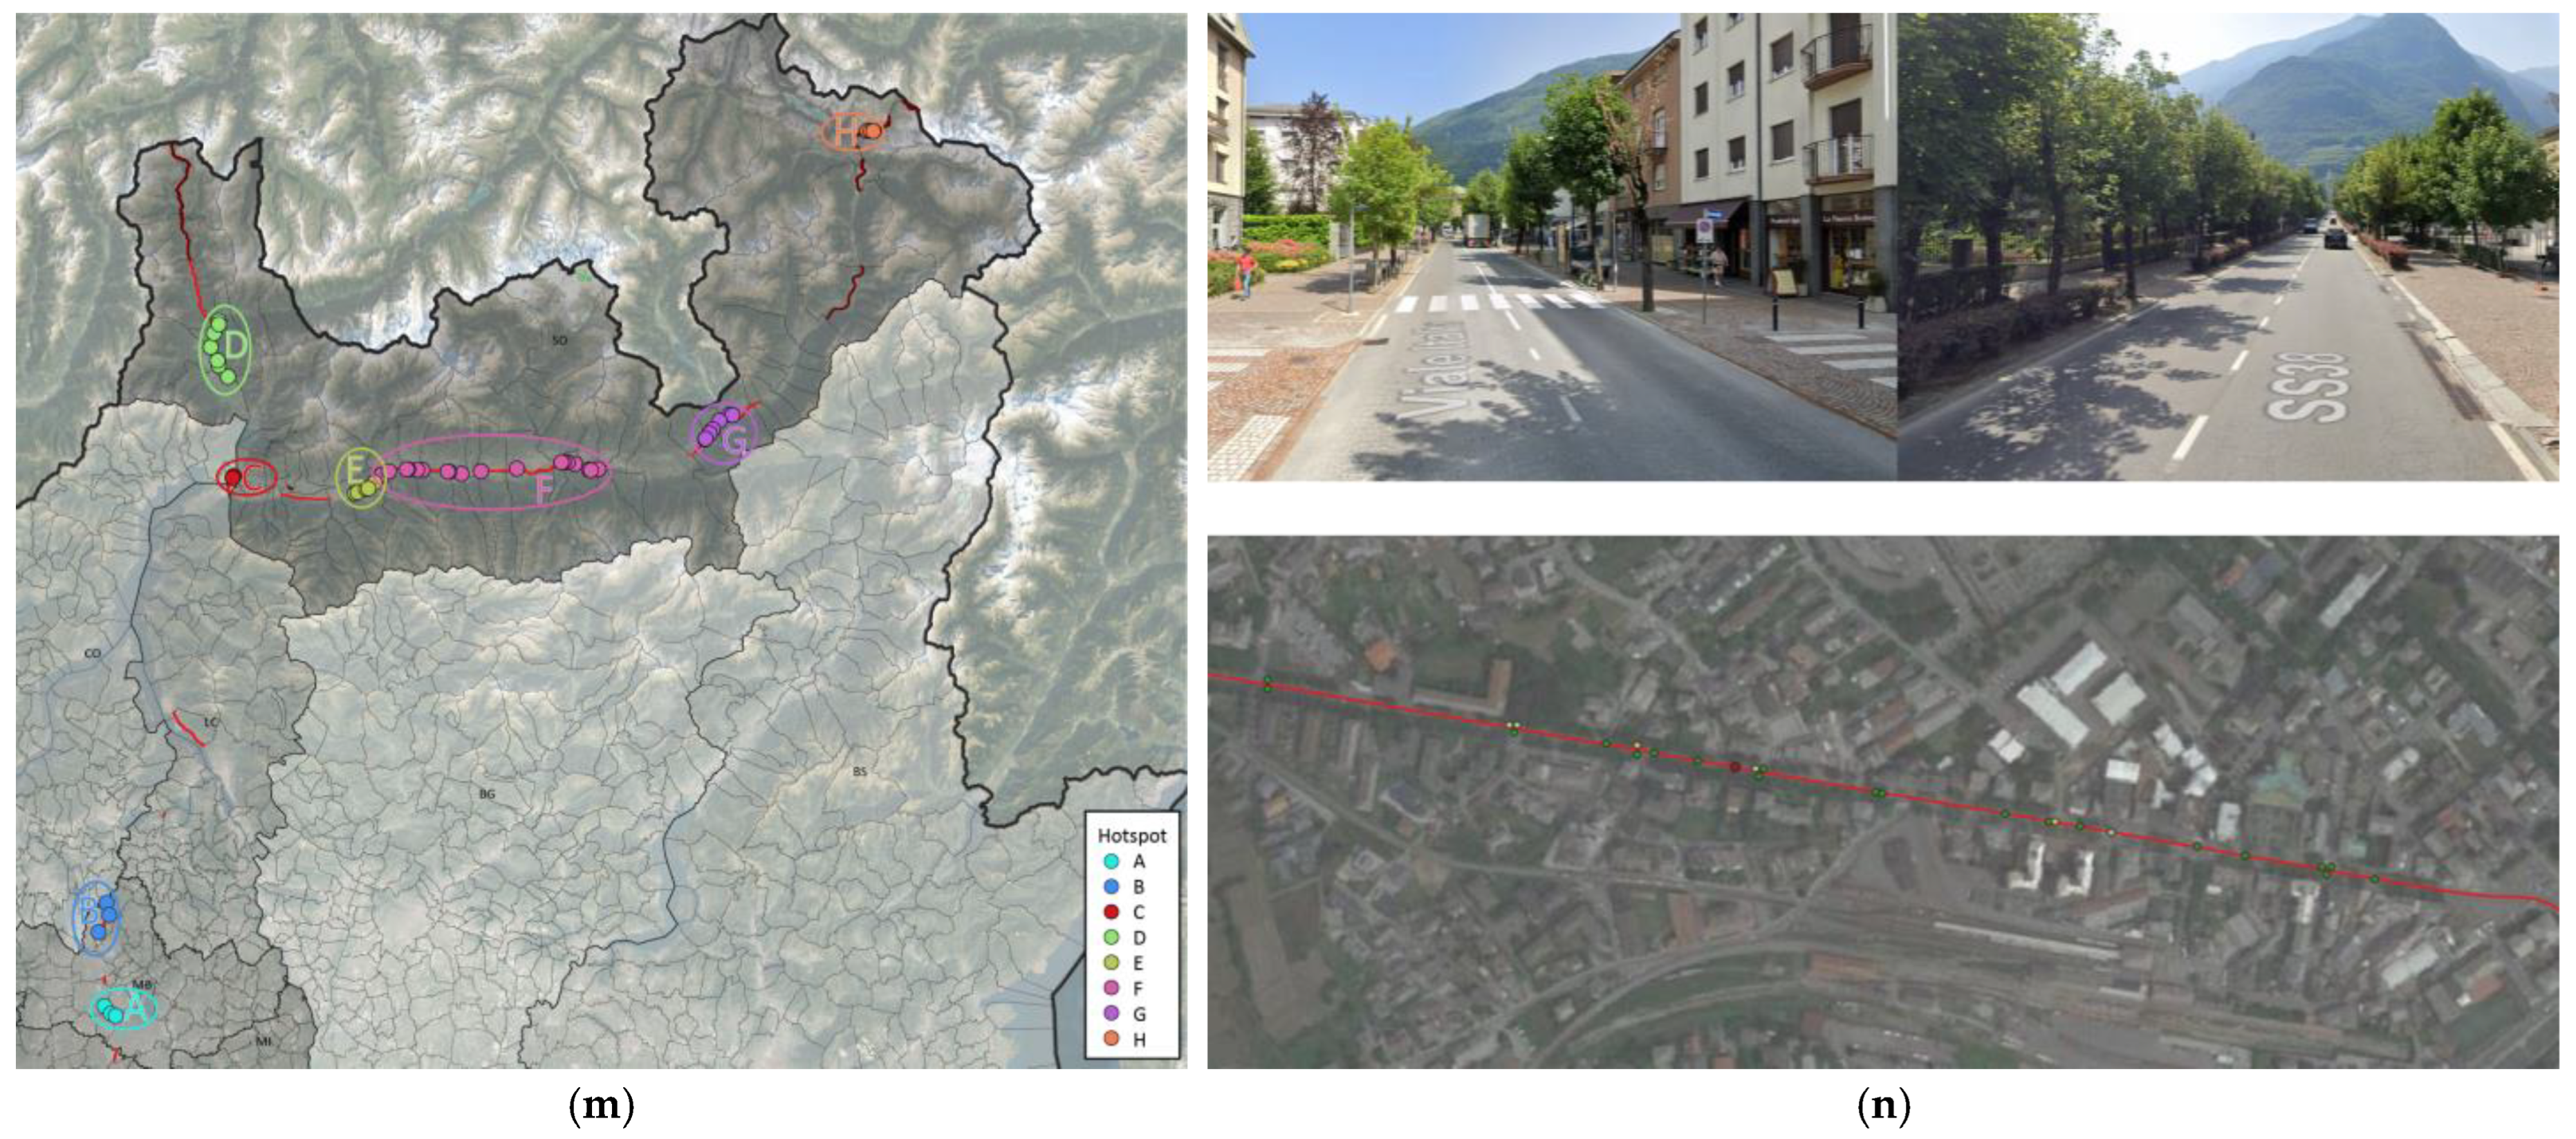
- (v)
- A total of 8 crash hotspots were identified (Figure 4m).

4. Discussion
5. Conclusions
- (i)
- Provides a rapid, precise, integrated, and communicable methodology to assess road safety, identify the blackspots, classify them in road typologies and suggest to decision-makers improvement actions spatially limited and whose implementation is possible with restricted time for implementation.
- (ii)
- Proposes a novel method that uses kilometre marker data to address the need to geo-reference car crashes in a scenario with a limited time frame.
- (iii)
- Proposes the classification of blackspots in road environments together with an abacus of actions with confirmed effectiveness in reducing the number or severity of crashes as a flexible and viable criterion in the identification of actions to improve the level of security of a road.
- (iv)
- Proposes clustering blackspots into hotspots based on their geographic and thematic concentration of crash blackspots that happened in similar road environments over a wide area. This enables network clustering into functional lots for immediate implementation or future design.
- (i)
- Establishing more thoroughly the cause-effect relationship between the hosting of mega-events and the increase in traffic and the number of vehicular crashes to better frame the urgency of these improvement measures.
- (ii)
- Integrating the proposed abacus with the cost parameters.
- (iii)
- Specifying the time and cost of implementation more precisely through an analysis of international case studies.
Author Contributions
Funding
Data Availability Statement
Conflicts of Interest
References
- UN. General Assembly Resolution Adopted by the General Assembly on 25 September 2015—70/1 Transforming Our World: The 2030 Agenda for Sustainable Development; United Nations: New York, USA, 2015; Available online: https://sdgs.un.org/2030agenda (accessed on 13 June 2023).
- World Health Organization. Global Status Report on Road Safety 2018; World Health Organization: Geneva, Switzerland, 2018; ISBN 978-92-4-156568-4. [Google Scholar]
- World Health Organization. Global Status Report on Road Safety 2023; World Health Organization: Geneva, Switzerland, 2023; ISBN 978-92-4-008651-7. [Google Scholar]
- Wijnen, W.; Weijermars, W.; Schoeters, A.; Van Den Berghe, W.; Bauer, R.; Carnis, L.; Elvik, R.; Martensen, H. An Analysis of Official Road Crash Cost Estimates in European Countries. Saf. Sci. 2019, 113, 318–327. [Google Scholar] [CrossRef]
- Wijnen, W.; Weijermars, W.; Vanden Berghe, W.; Schoeters, A.; Bauer, R.; Carnis, L.; Elvik, R.; Theofilatos, A.; Filtness, A.; Reed, S.; et al. Crash Cost Estimates for European Countries, Deliverable 3.2 of the H2020 Project SafetyCube; European Union: Luxembourg, 2017; Available online: https://ec.europa.eu/research/participants/documents/downloadPublic?documentIds=080166e5b1e92ba3&appId=PPGMS (accessed on 12 June 2023).
- Bonera, M.; Barabino, B.; Maternini, G. A Straightforward Framework for Road Network Screening to Lombardy Region (Italy). Sustainability 2022, 14, 12424. [Google Scholar] [CrossRef]
- European Parliament. EU Road Safety Policy Framework 2021–2030—Recommendations on Next Steps towards “Vision Zero”; Publication Office of the European Union: Luxembourg, 2019; Available online: https://www.europarl.europa.eu/doceo/document/TA-9-2021-0407_EN.html (accessed on 12 June 2023).
- Council of the European Union Towards a European Road Safety Area: Policy Orientations on Road Safety 2011–2020; Publication Office of the European Union: Luxembourg, 2010; p. 8.
- European Transport Safety Council. 16th Road Safety Performance Index Report—Ranking EU Progress on Road Safety; European Transport Safety Council: Brussels, Belgium, 2022; Available online: https://etsc.eu/wp-content/uploads/16-PIN-annual-report_FINAL_WEB_1506_2.pdf (accessed on 9 June 2023).
- Tomlinson, A. A Dictionary of Sport Studies; Oxford University Press: Oxford, UK, 2010. [Google Scholar]
- Müller, M. What Makes an Event a Mega-Event? Definitions and Sizes. Leis. Stud. 2015, 34, 627–642. [Google Scholar] [CrossRef]
- Elahi, A.; Gholampour, S.; Askarian, F. The Effects of Sports Mega-Events on Host Communities: A Systematic Review of Studies in Three Recent Decades. Sports Bus. J. 2021, 1, 13–30. [Google Scholar] [CrossRef]
- Mair, J.; Chien, P.M.; Kelly, S.J.; Derrington, S. Social Impacts of Mega-Events: A Systematic Narrative Review and Research Agenda. J. Sustain. Tour. 2023, 31, 538–560. [Google Scholar] [CrossRef]
- Jakar, G.; Gordon, K.; He, Q. The Temporal and Spatial Relationships between Professional Sport Events and Reported Vehicular Crashes: An Analysis of Cleveland, Ohio. Sport Manag. Rev. 2023, 26, 628–648. [Google Scholar] [CrossRef]
- Redelmeier, D.A.; Stewart, C.L. Driving Fatalities on Super Bowl Sunday. N. Engl. J. Med. 2003, 348, 368–369. [Google Scholar] [CrossRef] [PubMed]
- Wood, S.; McInnes, M.M.; Norton, D.A. The Bad Thing about Good Games: The Relationship between Close Sporting Events and Game-Day Traffic Fatalities. J. Consum. Res. 2011, 38, 611–621. [Google Scholar] [CrossRef]
- European Union. Directive 2008/96/EC of the European Parliament and of the Council on Road Infrastructure Safety Management. 2008. Available online: https://eur-lex.europa.eu/legal-content/EN/ALL/?uri=celex%3A32008L0096 (accessed on 20 November 2023).
- Persia, L.; Usami, D.S.; De Simone, F.; Beaumelle, V.F.D.L.; Yannis, G.; Laiou, A.; Han, S.; Machata, K.; Pennisi, L.; Marchesini, P.; et al. Management of Road Infrastructure Safety. Transp. Res. Procedia 2016, 14, 3436–3445. [Google Scholar] [CrossRef]
- European Union. Directive 2019/1936 of the European Parliament and of the Council Amending Directive 2008/96/EC on Road Infrastructure Safety Management; European Union: Luxembourg, 2019; Available online: https://eur-lex.europa.eu/legal-content/EN/TXT/PDF/?uri=CELEX:32019L1936&from=LV (accessed on 13 June 2023).
- Elvik, R. Assessment and Applicability of Road Safety Management Evaluation Tools: Current Practice and State-of-the-Art in Europe; Institute of Transport Economics (TØI): Oslo, Norway, 2010. [Google Scholar]
- Park, P.Y.; Sahaji, R. Safety Network Screening for Municipalities with Incomplete Traffic Volume Data. Accid. Anal. Prev. 2013, 50, 1062–1072. [Google Scholar] [CrossRef]
- Bonera, M.; Carra, M.; Ventura, R.; Barabino, B.; Maternini, G. Measuring Safety Performance in the Extra-Urban Road Network of Lombardy Region (Italy). Transp. Res. Procedia 2023, 69, 155–162. [Google Scholar] [CrossRef]
- Bonera, M.; Barabino, B.; Yannis, G.; Maternini, G. Network-Wide Road Crash Risk Screening: A New Framework. Accid. Anal. Prev. 2024, 199, 107502. [Google Scholar] [CrossRef] [PubMed]
- Mannering, F.L.; Bhat, C.R. Analytic Methods in Accident Research: Methodological Frontier and Future Directions. Anal. Methods Accid. Res. 2014, 1, 1–22. [Google Scholar] [CrossRef]
- Ambros, J.; Jurewicz, C.; Turner, S.; Kieć, M. An International Review of Challenges and Opportunities in Development and Use of Crash Prediction Models. Eur. Transp. Res. Rev. 2018, 10, 1–10. [Google Scholar] [CrossRef]
- Ministero delle Infrastrutture dei Trasporti MIT. Linee Guida per La Gestione Della Sicurezza Delle Infrastrutture Stradali—Art. 8 Del Decreto Legislativo n. 35/2011; 2012. Available online: https://road-safety.transport.ec.europa.eu/document/download/688e7368-f12b-4ec0-8c90-7242686c88cd_en (accessed on 10 June 2023).
- Schlögl, M.; Stütz, R. Methodological Considerations with Data Uncertainty in Road Safety Analysis. Accid. Anal. Prev. 2019, 130, 136–150. [Google Scholar] [CrossRef]
- Montella, A.; Chiaradonna, S.; Criscuolo, G.; De Martino, S. Development and Evaluation of a Web-Based Software for Crash Data Collection, Processing and Analysis. Accid. Anal. Prev. 2019, 130, 108–116. [Google Scholar] [CrossRef] [PubMed]
- Imprialou, M.; Quddus, M. Crash Data Quality for Road Safety Research: Current State and Future Directions. Accid. Anal. Prev. 2019, 130, 84–90. [Google Scholar] [CrossRef] [PubMed]
- Gupta, A.; Bansal, A. Integrating Traffic Datasets for Evaluating Road Networks. In Proceedings of the 2018 IEEE 12th International Conference on Semantic Computing (ICSC), Laguna Hills, CA, USA, 31 January–2 February 2018; pp. 411–416. [Google Scholar]
- dos Santos, S.R.; Clodoveu, A.D., Jr.; Smarzaro, R. Analyzing Traffic Accidents Based on the Integration of Official and Crowdsourced Data. J. Inf. Data Manag. 2017, 8, 67–82. [Google Scholar]
- Fekpe, E. ; National Cooperative Highway Research Program Quality and Accuracy of Positional Data in Transportation; Transportation Research Board: Washington, DC, USA, 1998; ISBN 0-309-08781-3. [Google Scholar]
- Kumar, S.; Toshniwal, D. A Data Mining Approach to Characterize Road Accident Locations. J. Mod. Transp. 2016, 24, 62–72. [Google Scholar] [CrossRef]
- Bigham, J.M.; Rice, T.M.; Pande, S.; Lee, J.; Park, S.H.; Gutierrez, N.; Ragland, D.R. Geocoding Police Collision Report Data from California: A Comprehensive Approach. Int. J. Health Geogr. 2009, 8, 72. [Google Scholar] [CrossRef]
- Loo, B.P.Y. Validating Crash Locations for Quantitative Spatial Analysis: A GIS-Based Approach. Accid. Anal. Prev. 2006, 38, 879–886. [Google Scholar] [CrossRef]
- Humphreys, B.R.; Pyun, H. Professional Sporting Events and Traffic: Evidence from U.S. Cities. J. Reg. Sci. 2018, 58, 869–886. [Google Scholar] [CrossRef]
- Martinelli, V.; Ventura, R.; Bonera, M.; Barabino, B.; Maternini, G. Estimating Operating Speed for County Road Segments—Evidence from Italy. Int. J. Transp. Sci. Technol. 2022, 12, 560–577. [Google Scholar] [CrossRef]
- Martinelli, V.; Ventura, R.; Bonera, M.; Barabino, B.; Maternini, G. Effects of Urban Road Environment on Vehicular Speed. Evidence from Brescia (Italy). Transp. Res. Procedia 2022, 60, 592–599. [Google Scholar] [CrossRef]
- Elvik, R. State-of-the-Art Approaches to Road Accident Black Spot Management and Safety Analysis of Road Networks; Institute of Transport Economics (TØI): Oslo, Norway, 2007; p. 108. [Google Scholar]
- European Commission. Network Wide Road Safety Assessment. Methodology and Implementation Handbook; European Commission: Brussels, Belgium, 2023; Available online: https://road-safety.transport.ec.europa.eu/system/files/2023-11/NWA-Handbook8.pdf (accessed on 14 November 2023).
- Barabino, B.; Bonera, M.; Maternini, G.; Olivo, A.; Porcu, F. Bus Crash Risk Evaluation: An Adjusted Framework and Its Application in a Real Network. Accid. Anal. Prev. 2021, 159, 106258. [Google Scholar] [CrossRef]
- Barabino, B.; Bonera, M.; Maternini, G.; Porcu, F.; Ventura, R. Refining a Crash Risk Framework for Urban Bus Safety Assessment: Evidence from Sardinia (Italy). Reliab. Eng. Syst. Saf. 2024, 245, 110003. [Google Scholar] [CrossRef]
- Barabino, B.; Di Francesco, M.; Ventura, R. Evaluating Fare Evasion Risk in Bus Transit Networks. Transp. Res. Interdiscip. Perspect. 2023, 20, 100854. [Google Scholar] [CrossRef]
- Scarponcini, P. Generalized Model for Linear Referencing in Transportation. GeoInformatica 2002, 6, 35–55. [Google Scholar] [CrossRef]
- Turner, B.; Job, S.; Mitra, S. Guide for Road Safety Interventions: Evidence of What Works and What Does Not Work; World Bank: Washington, DC, USA, 2021. [Google Scholar]
- Elvik, R.; Vaa, T.; Hoye, A.; Sorensen, M. The Handbook of Road Safety Measures, 2nd ed.; Emerald Group Publishing: Burlington, MA, USA, 2009; ISBN 978-1-84855-250-0. [Google Scholar]
- Scott, H.; Hugh, M.; Skye, L.; Yuying, Z. State of the Practice for Shoulder and Center Line Rumble Strip Implementation on Non-Freeway Facilities; Federal Highway Administration: McLean, VA, USA, 2017; p. 129. [Google Scholar]
- European Commission. Road Safety Thematic Report—Speeding; European Road Safety Observatory: Brussels, Belgium, 2021; Available online: https://road-safety.transport.ec.europa.eu/system/files/2021-07/road_safety_thematic_report_speeding.pdf (accessed on 14 November 2023).
- De Ceunynck, T. Installation of Section Control & Speed Cameras; European Road Safety Decision Support System, Developed by the H2020 Project SafetyCube; European Union: Luxembourg, 2017; p. 17. Available online: https://www.roadsafety-dss.eu/assets/data/pdf/synopses/Installation_of_section_control_speed_cameras_23102017.pdf (accessed on 12 June 2023).
- Mitran, E.; Codjoe, J.; Edwards, E. Impact of Crosswalk Lighting Improvements on Pedestrian Safety—A Literature Review; Louisiana Transportation Research Center: Baton Rouge, LA, USA, 2020; p. 32. [Google Scholar]
- Patella, S.M.; Sportiello, S.; Carrese, S.; Bella, F.; Asdrubali, F. The Effect of a LED Lighting Crosswalk on Pedestrian Safety: Some Experimental Results. Safety 2020, 6, 20. [Google Scholar] [CrossRef]
- Campbell, B.J.; Zegeer, C.V.; Huang, H.H.; Cynecki, M.J. A Review of Pedestrian Safety Research in the United States and Abroad; Federal Highway Administration: McLean, VA, USA, 2004; p. 153. [Google Scholar]
- Vieira, C.M.; Almeida, H.A.; Ferreira, I.S.; Vasco, J.O.; Bártolo, P.J.; Ruben, B.; Santos, S.P. Development of an Impact Absorber for Roadside Barriers. In Proceedings of the 7th LS-DYNA Forum, Bamberg, Germany, 30 September–1 October 2008; pp. 25–36. [Google Scholar]
- Domhan, M. Guardrails and Passive Safety for Motorcyclists. SAE Trans. 1987, 96, 944–947. [Google Scholar]
- Silvestri-Dobrovolny, C.; Geary, G.; Dixon, K.; Manser, M.; Chauhan, J. Addressing the Motorcyclist Advisory Council Recommendations: Synthesis on Barrier Design for Motorcyclists Safety; Federal Highway Administration: McLean, VA, USA, 2021; p. 64. [Google Scholar]
- Sala, G.; Astori, P. New Concepts and Materials for Passive Safety of Motorcyclists. In Proceedings of the IRCOBI Conference, Göteborg, Sweden, 16–18 September 1998; pp. 425–436. [Google Scholar]
- Gitelman, V.; Carmel, R.; Pesahov, F.; Chen, S. Changes in Road-User Behaviors Following the Installation of Raised Pedestrian Crosswalks Combined with Preceding Speed Humps, on Urban Arterials. Transp. Res. Part F Traffic Psychol. Behav. 2017, 46, 356–372. [Google Scholar] [CrossRef]
- Monsere, C.; Figliozzi, M.; Kothuri, S.; Razmpa, A.; Hazel, D.R. Safety Effectiveness of Pedestrian Crossing Enhancements; Portland State University, Transportation Research and Education Center (TREC): Portland, OR, USA, 2016. [Google Scholar]
- Lu, J.; Dissanayake, S.; Castillo, N.; Williams, K. Safety Evaluation of Right Turns Followed by U-Turns as an Alternative to Direct Left Turns—Conflict Analysis; Florida Department of Transportation: Tallahassee, FL, USA, 2001; p. 97. [Google Scholar]
- Persaud, B.N.; Retting, R.A.; Garder, P.E.; Lord, D. Crash Reductions Following Installation of Roundabouts in the United States; Insurance Institute for Highway Safety: Arlington, VA, USA, 2000; p. 16. [Google Scholar]
- Ministero delle Infrastrutture e dei Trasporti. Norme Funzionali e Geometriche per La Costruzione Delle Intersezioni Stradali; MIT: Rome, Italy, 2006. Available online: https://www.mit.gov.it/nfsmitgov/files/media/normativa/2016-02/Decreto_Ministeriale_19-04-2006_all_1.pdf (accessed on 12 June 2023).
- Calvi, A.; De Blasiis, M.R. Driver Behavior on Acceleration Lanes: Driving Simulator Study. Transp. Res. Rec. J. Transp. Res. Board 2011, 2248, 96–103. [Google Scholar] [CrossRef]
- Bared, J.; Giering, G.L.; Warren, D.L. Safety Evaluation of Acceleration and Deceleration Lane Lengths. ITE J. 1999, 69, 50–54. [Google Scholar]
- European Commission. Road Safety Thematic Report Railway Level Crossing; European Road Safety Observatory: Brussels, Belgium, 2021; Available online: https://road-safety.transport.ec.europa.eu/system/files/2021-07/road_safety_thematic_report_railway_level_crossings_tc_final.pdf (accessed on 10 June 2023).
- Clapperton, A.; Dwyer, J.; Spittal, M.J.; Roberts, L.; Pirkis, J. Preventing Railway Suicides through Level Crossing Removal: A Multiple-Arm Pre-Post Study Design in Victoria, Australia. Soc. Psychiatry Psychiatr. Epidemiol. 2022, 57, 2261–2266. [Google Scholar] [CrossRef]
- Hallmark, S.L.; McDonald, T.J.; Tian, Y.; Andersen, D.J. Safety Benefits of Paved Shoulders; Center for Transportation Research and Education—Iowa State University: Ames, IA, USA, 2009. [Google Scholar]
- ISTAT. Incidenti Stradali Anni 2015–2021; ISTAT: Rome, Italy, 2022. Available online: http://dati.istat.it/ (accessed on 5 April 2023).
- Pennisi, L.; Daidone, L. Metodologia IRAP/EURORAP: I Risultati Delle Ispezioni Stradali Aci 2022. Da Milano a Bormio per viaggi sempre più sicuri. OndaVerde 2023, 46, 18–23. [Google Scholar]
- International Road Assessment Programme (iRAP). iRAP Methodology Fact Sheet 6—Star Rating Score Equations 2014. Available online: https://irap.org/methodology/ (accessed on 15 May 2023).


| Hazard Level | Ranges Values | ||
|---|---|---|---|
| Lower Limit | Upper Limit | ||
| 5 | Very high | (Q1 − 1.5 IQR) > 0 | Q1 |
| 4 | High | Q1 | Q2 |
| 3 | Medium | Q2 | Q3 |
| 2 | Low | Q3 | (Q3 + 1.5 IQR) > 0 |
| 1 | Very low | (Q3 + 1.5 IQR) > 0 | MAX |
| Measure [Source] | Road Environment Application Suggested | Time of Implementation | Description |
|---|---|---|---|
| Central rumble strip realisation [45,47] | Mountain and hill road/Curve/Long straight and/or monotonous roads | Very fast | Mid-road rumble strips are a safety feature that vibrates the vehicle and emits an audible rumble to warn inattentive drivers of the potential danger of crossing the mid-road strip. |
| Lateral rumble strip realisation [45,47] | Mountain and hill road/Curve/Long straight and/or monotonous roads | Very fast | Roadside rumble strips are a safety feature that vibrates the vehicle and emits an audible rumble to warn inattentive drivers of the potential danger of running off the road. |
| Speed control cameras installation [45,48,49] | Curve/Long straight and/or monotonous roads | Fast | A speed camera is placed on the road to photograph cars travelling faster than the speed limit, aiming to fine offenders and reduce vehicle speed. |
| Pedestrian crossing lighting improvement [35,44,45,46,50,51,52] | Urban road | Fast | Pedestrian crossing lighting is a safety feature that increases the visibility of pedestrian crossings at night. |
| Placing of impact absorber on guard rails posts [53,54,55,56] | Mountain and hill road/Curve | Fast | An impact absorber is a protective device placed on the guardrail posts to minimise injuries with limited implementation costs. |
| Addition of sub-rail on guard rails for motorcycle safety (MPS) [46,54,55,56] | Mountain and hill road/Curve | Medium | An additional subrail is fitted under the guardrail to dampen or prevent direct driver impact with the guardrail post and prevent the driver from slipping under the guardrail. |
| Pedestrian fencing realisation [46,52] | Urban road | Medium | Pedestrian fencing is implemented to prevent pedestrians from crossing the road at unsafe locations and to direct them to safe crossings. |
| Raised pedestrian crossing realisation [45,57,58] | Urban road | Medium | Pedestrian crossings are raised to improve pedestrian visibility and reduce vehicles speed. |
| Left turn reduction [45,59] | Urban road/Intersection/Roads linked to industrial/commercial/gas station activities | Medium | Reducing left turns aims to reduce the number of vehicles crossing the road and redirect them to safer turning points through various measures (signs, barriers, etc.). |
| Traffic calming measures in urban environments [45,46] | Urban road | Medium | Implementing traffic calming measures in the urban environment aims to reduce vehicles average speed and reduce the number and severity of crashes (especially for vulnerable road users). |
| Roundabout realisation [45,46,60] | Intersection/Roads linked to industrial/commercial/gas station activities/Urban road | Slow | Roundabouts are designed to reduce potential conflicts between vehicles while reducing vehicle speed and increasing safety. |
| Adjustment of the extension of the acceleration lane [61,62,63] | Acceleration lane entry | Very slow | Adjusting the length of acceleration lanes is intended to make it easier for vehicles to enter higher-ranked roads from lower-ranked roads, making their entry safer. |
| Subpasses at railway-level crossings realisation [64,65] | Intersection | Very slow | Replacing railway level crossings with subpasses is intended to reduce potential conflicts between rail and vehicle traffic by making railway crossings safer and smoother as a result. |
| Emergency lanes or emergency lay-by realisation [46,66] | Mountain and hill road/Long straight and/or monotonous roads | Very slow | The purpose of lay-bys is to allow damaged or distressed vehicles to stop safely without obstructing normal traffic flow and to facilitate the arrival of emergency vehicles. |
| Grade separation at intersections realisation [45,46] | Intersection | Very slow | The construction of grade separation at intersections is intended to reduce potential vehicular conflicts on highways and primary roads by ensuring greater safety and smoother traffic flow. |
| Hazard Level | Number of Road Segments | Percentage |
|---|---|---|
| 5—Very high | 5 | 3.76% |
| 4—High | 21 | 15.79% |
| 3—Medium | 28 | 21.05% |
| 2—Low | 37 | 27.82% |
| 1—Very low | 42 | 31.58% |
| Hazard Level | Number of Road Segments | Percentage |
|---|---|---|
| 5—Very high | 4 | 3.01% |
| 4—High | 21 | 15.79% |
| 3—Medium | 27 | 20.30% |
| 2—Low | 41 | 30.82% |
| 1—Very low | 40 | 30.07% |
| Hazard Level | Number of Road Segments | Percentage |
|---|---|---|
| 5—Very high | 5 | 3.76% |
| 4—High | 21 | 15.79% |
| 3—Medium | 28 | 21.05% |
| 2—Low | 37 | 27.82% |
| 1—Very low | 42 | 31.58% |
| Difference between Operating And Legal Speed | Number of Road Segments | Percentage |
|---|---|---|
| −40% ÷ −30% | 2 | 0.43% |
| −30% ÷ −15% | 5 | 1.09% |
| −15% ÷ −5% | 13 | 2.84% |
| −5% ÷ +5% | 56 | 12.23% |
| +5% ÷ +15% | 110 | 24.02% |
| +15% ÷ +30% | 224 | 48.91% |
| +30% ÷ +60% | 48 | 10.48% |
| Blackspot Typologies | Number of Blackspots | Percentage |
|---|---|---|
| Urban road | 5 | 8.33% |
| Curve | 9 | 15.00% |
| Intersection | 17 | 28.33% |
| Roads linked to industrial/commercial/gas station activities | 19 | 31.66% |
| Acceleration lane entry | 7 | 11.66% |
| Mountain and hill road | 3 | 5.00% |
| Long straight and/or monotonous roads | 0 | 0.00% |
Disclaimer/Publisher’s Note: The statements, opinions and data contained in all publications are solely those of the individual author(s) and contributor(s) and not of MDPI and/or the editor(s). MDPI and/or the editor(s) disclaim responsibility for any injury to people or property resulting from any ideas, methods, instructions or products referred to in the content. |
© 2024 by the authors. Licensee MDPI, Basel, Switzerland. This article is an open access article distributed under the terms and conditions of the Creative Commons Attribution (CC BY) license (https://creativecommons.org/licenses/by/4.0/).
Share and Cite
Cigognetti, T.; Carra, M.; Ghirardi, A.; Assefa, N.G.; Ferretto, L.; Ventura, R.; Maternini, G.; Barabino, B. Mega-Events: Assessing Road Safety through an Operating Framework. An Application for the Milano–Cortina 2026 Winter Olympic Games. Infrastructures 2024, 9, 51. https://doi.org/10.3390/infrastructures9030051
Cigognetti T, Carra M, Ghirardi A, Assefa NG, Ferretto L, Ventura R, Maternini G, Barabino B. Mega-Events: Assessing Road Safety through an Operating Framework. An Application for the Milano–Cortina 2026 Winter Olympic Games. Infrastructures. 2024; 9(3):51. https://doi.org/10.3390/infrastructures9030051
Chicago/Turabian StyleCigognetti, Tommaso, Martina Carra, Andrea Ghirardi, Nuhamin Gezehagne Assefa, Laura Ferretto, Roberto Ventura, Giulio Maternini, and Benedetto Barabino. 2024. "Mega-Events: Assessing Road Safety through an Operating Framework. An Application for the Milano–Cortina 2026 Winter Olympic Games" Infrastructures 9, no. 3: 51. https://doi.org/10.3390/infrastructures9030051
APA StyleCigognetti, T., Carra, M., Ghirardi, A., Assefa, N. G., Ferretto, L., Ventura, R., Maternini, G., & Barabino, B. (2024). Mega-Events: Assessing Road Safety through an Operating Framework. An Application for the Milano–Cortina 2026 Winter Olympic Games. Infrastructures, 9(3), 51. https://doi.org/10.3390/infrastructures9030051