Abstract
Creating new multimodal infrastructure in an existing transport network of an urban city is a challenging process. The responsible transport authorities have to pay special attention to the details regarding the accessibility and effectiveness of the new development, to avoid travelers’ confusion and network congestion. The subject of this paper is the assessment and optimization of the traffic network in the surroundings of the new multimodal depot of Thessaloniki’s future metro system with the use of the microsimulation software PTV VISSIM (version 2022). Five different scenarios were developed in collaboration with the city’s transport authority and evaluated into two stages, beginning with the whole traffic network, and then continuing with the analyzed intersections separately. The evaluation is based on Key Performance Indicators (KPIs), which were extracted by the software. According to the results of the base case scenario, the network functions satisfactorily, with slight delays. Regarding the future network, the operation of the new hub will strongly increase the traffic demand, while the proposed traffic network adjustments by the local authorities seem to cause significant delay problems. This paper aims to highlight the importance of using modeling tools during the design phase of a new infrastructure to create efficient, accessible, and sustainable infrastructures that enhance the public transport system.
1. Introduction
The constant rise in urbanization and global population, in combination with the intense life pace that defines modern society, has created the need for uninterrupted transportation. More than 75% of the population will live in urban areas by 2050 [1], and it is estimated that traffic flows will reach about 64% of all travel made around the world [2]. Moreover, the emissions from the transportation sector are expected to account for almost 50% of global emissions by 2050, if no key measures are undertaken [3]. Therefore, achieving more efficient and low-carbon mobility is crucial in ensuring urban systems are sustainable [2]. A sustainable transport system is one that considers the needs of all commuters within an area and tries to provide the best possible travel conditions for all travelers without creating external side effects for the rest of society [4]. In other words, a sustainable transport system should be affordable, efficient, accessible, safe, and environmentally friendly [5]. Multimodality is defined as the use of different sustainable means of transport optimally combined to ensure a seamless journey [2] and is considered a key to a more efficient and sustainable urban transport system [6]. Multimodal hubs, due to being the areas where transfers take place, need to be properly designed and successfully integrated into existing transportation systems. When creating a new multimodal hub, local authorities need to prioritize reaching high levels of accessibility along with the successful management of traffic flows near the area of interest. In this way, new users will be attracted and the commitment between the commuters and the local transportation system will be strengthened. As most cities have an existing multimodal network, it can be time- and cost-consuming for governments to create changes in current networks [7], but undoubtedly all these changes contribute to healthier, sustainable living in cities [8].
The subject of this paper is the evaluation and optimization of the existing traffic network around the new multimodal depot in the city of Thessaloniki with the use of the microsimulation software VISSIM (version 2022) by PTV [9]. Five different scenarios were developed: one for the current situation and four examining alternative future scenarios. These scenarios were developed in collaboration with the Thessaloniki Transport Authority. Traffic simulation models are used worldwide by local authorities and offer significant help in evaluating available alternatives and making successful and sustainable decisions. Therefore, this paper highlights the importance of using available traffic modeling tools at preliminary stages to ensure successful transportation projects. This paper starts with a categorization and a short description of the design principles of multimodal hubs (Section 2), continues with the presentation and analysis of the study area (Section 3) and the alternative traffic management scenarios (Section 4), and finishes with the results (Section 5), conclusions and proposals (Section 6), and a discussion (Section 7).
2. Multimodal Hubs: Categorization and Design Principles
The global shift towards smart city planning and sustainable traveling encourages communities to utilize multi-mobility modes and public transport in their everyday commute and aims to reduce CO2 footprint [10,11]. To serve these mobility and environmental needs, physical infrastructure, transport systems, traffic management, operational processes, and information systems should be seamlessly integrated [12]. Properly designed and operated multimodal transport hubs play a significant role in promoting multimodality over the use of private transportation. Also, they can facilitate all user requirements and enable seamless mobility, traveling efficiency, user satisfaction, and performance [13]. Multimodal transport hubs differ vastly from one country or city to another, depending on the structuring modes of transport and the maturity of the urban fabric [14], and their design can be very challenging and complex in bigger cities.
2.1. Categorization of Multimodal Hubs
Multimodal hub categorization can be achieved in several ways. Focusing on the different characteristics of the hub, such as the location, the number and the importance of the served transport means, or the variety of provided services, a different categorization can arise every time. This paper adopts a classification method for multimodal hubs in urban areas that is based on the importance of the involved means of transport [2]. This importance is represented by the covered distances, the catchment areas, the commercial speed, and the daily frequencies of the transport means. The results of this classification method are as follows [2].
2.1.1. Category A
The multimodal hubs of Category A require the highest level of services since they ensure long-distance coverage. The hubs that serve high-speed and intercity train services are included in this category. Usually, they are connected with a bus station, regional and local railway transport, and urban and peri-urban public transport. Taxis, private or shared micromobility modes, and other sharing services (car sharing) are usually present in the surroundings of these hubs to boost the accessibility of the hub.
2.1.2. Category B
The hubs of this category serve intercity and interregional trains or, when railway services are missing, long-distance coaches. They do not differ vastly from the hubs of Category A, but undoubtedly provide fewer services. An example of a multimodal hub that belongs to this category is a capital city’s main railway station.
2.1.3. Category C
Hubs of Category C host means of transport such as the metro or Bus Rapid Transit. They are smaller compared to the hubs of the previous categories and consequently offer limited services. Nevertheless, their presence is fundamental in big cities with high demand, mostly because the transportation means they serve have high capacity and commercial speed.
2.1.4. Category D
In this last category belong the multimodal hubs that are usually located in the outskirts of a city. Except for providing public or shared transportation services, they also provide park and ride facilities or parking lots for commuters or passengers who want to shift from their personal means of transport to public transport. This category offers the lowest level of services among all categories because the transfer and waiting times are very short.
2.2. Design Principles of Multimodal Hubs
In order to offer users a sustainable, seamless, and safe journey, a multimodal hub should respect various design principles. An infrastructure that is accessible to all without discrimination has to be the main objective when designing a multimodal hub. The hub should be constructed on a horizontal level to facilitate pedestrians and people with mobility disabilities. If this is impossible to achieve, the installation of elevators and escalators, instead of stairs, in visible parts of the hub is necessary [15]. High levels of pedestrian accessibility should be present not only within the transport hubs, but also in their urban surroundings, linking the different transport access points together with the city pedestrian network [2]. Also, the existence of cycling paths around the premises of the multimodal hub that are well connected to the rest of the urban cycling network is significant. Finally, the presence of facilities like park and ride, bike and ride, and services like taxis and car sharing boost the accessibility of the multimodal hub.
Travelers’ safety, security, and comfort in the internal and external areas of a hub are also a priority when designing a multimodal hub. The correct circulation of vehicles and pedestrians in the surroundings of the hub and adequate lighting conditions have to be ensured. Concerning personal security, isolated, dark, or segregated areas have to be avoided. Furthermore, the presence of a security management system based on the installation of video surveillance and security supervision significantly increases passengers’ feelings of safety [2]. Personal security helps public transport to become the mode of choice for travelers [16,17]. Moreover, a clean and well-maintained hub with toilets, seats, and covered areas and with a sufficient Wi-Fi connection service boosts the feeling of comfort of the passengers [2]. Passenger perception is essential for evaluating the transport service quality of multimodal hubs because they are the real customers of transport services [18].
Another major factor is the efficiency of the infrastructure. Short pedestrian distances, appropriate signage for all types of drivers, and the availability of proper space for vehicles stopping and passing by can reduce congestion and confusion and minimize time losses. In addition, an integrated ticketing service in combination with an easy fare-payment system and quick ticket-validation procedure promotes multimodality and mobility as a service (MaaS). Smart cards have been widely used to enable fare and ticketing integration, as they allow users to efficiently board and egress any type of service [19]. Finally, it is important that both digital and physical information are available and that different services coordinate to minimize waiting times while allowing enough time for transfers [2].
Urban transportation interchanges are considered an important determinant of public transport with significant impact on land use, society, job creation, housing, and the environment. Therefore, increasing their attractiveness by offering high standards of service and providing accessibility, security, and comfort will promote greener transportation modes and reform city hubs into true green urban interchanges [13,20].
3. Thessaloniki’s Multimodal Hub
Thessaloniki’s multimodal hub is planned to be the depot of the first metro line (red line) of Thessaloniki’s new modern metro system. This major urban multimodal hub is located on the southeastern side of the city and will host several services such as public transportation buses, bicycles, taxi services, and a park-and-ride facility, and after its operation will significantly affect the surrounding traffic network. Based on the categorization of multimodal hubs that took place in Section 2.1, this hub belongs in Category C. Its presence is fundamental for the city since it connects the outskirts with the city center while offering multiple services and low waiting times. The hub has been constructed on a currently partly closed street and is surrounded mostly by residential and commercial buildings. Local authorities have decided to reconstruct the traffic nodes in the eastern and western parts of the hub and apply traffic regulations to avoid traffic congestion at peak hours and offer better services for travelers.
Νodes A and B are located in the western part of the network and are part of a high-importance interchange system that connects the eastern side of the city with a national road. They are cross junctions, and Node A is signalized. After the planned reconstruction, Nodes A and B will be joined into a double roundabout. Node C is located on the eastern side of the network. Node C is currently non-signalized, but after the planned reconstruction works will be transformed into a four-tier signalized junction. The location of the hub and the nodes as well as the future layout of the network are presented in Figure 1, Figure 2 and Figure 3.
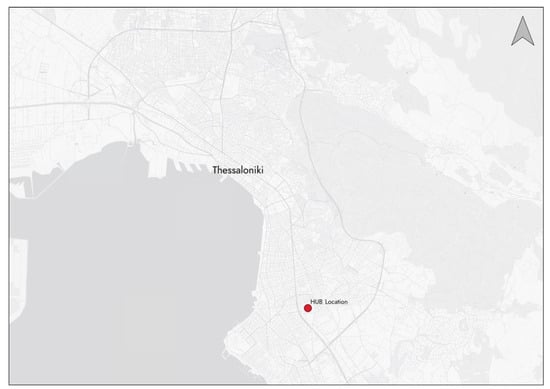
Figure 1.
Hub location in the city of Thessaloniki.
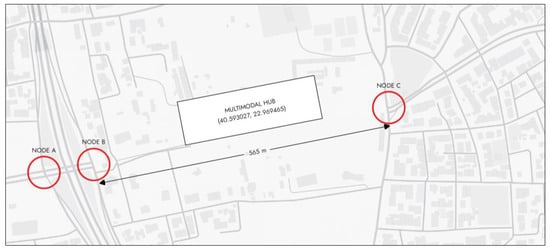
Figure 2.
Study area in the existing situation.
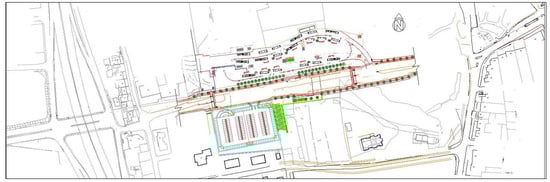
Figure 3.
Network’s future layout (Reproduced with permission from Thessaloniki Transport Authority).
4. Methodological Approach
In this section, the methodology that was implemented in our research and the examined scenarios are described. A diagram with the steps of our methodology is presented in Figure 4.
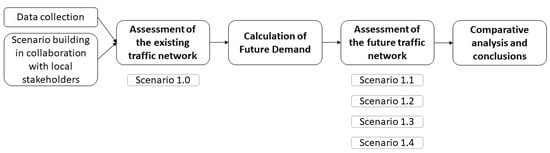
Figure 4.
Methodology diagram.
4.1. Scenario Setup
For the study and evaluation of the current and future traffic network around Thessaloniki’s multimodal depot, the traffic microsimulation software VISSIM (2022) by PTV AG [9] was used. VISSIM software was selected from the others available because it is a user-friendly multimodal traffic flow simulation software used by city planning authorities worldwide. Moreover, numerous transport modes can be simulated (vehicles, public transport, bicycles, pedestrians) to interact with each other, and as a member of the PTV products family it allows seamless data exchange.
The assessment is divided into two stages—beginning with the overall performance of the study area, and then continuing with the performance of Nodes A, B, and C separately—and is mainly based on multiple Key Performance Indicators (KPIs) extracted from the simulation process. The data and the layout of the models are largely owed to a preliminary transportation study conducted by the Thessaloniki Transport Authority (The.T.A.) in April 2021 [21].
The model hour simulated for all the scenarios was the morning peak hour (08:00–09:00) because the observed traffic flows were higher than those of the evening peak hour (17:00–18:00), as seen in Table 1. These time frames were selected because of the high traffic demand they experience due to commuting or other business activities in the area. In addition, the preliminary study used Passenger Car Unit (PCU) as a reference unit, which converts all possible vehicle classes into a comparable unit regarding the road’s traffic capacity.

Table 1.
Traffic flows (PCU/h.) of Nodes A, B, and C for both morning and evening peak hour—current situation.
The models developed for the examined scenarios were run several times (10 iterations for each scenario) to ensure the spread of stochasticity. Also, for the validation of the results and the calibration of the models, the GEH statistic was computed for every link. The GEH formula is computed as follows:
where K is the observed flow and M is the modeled flow on a link j. For a set of links, the GEH index should be less than 5 for more than 85% of the individual links [22]. The aggregated results of the model calibration procedure are presented later in the paper (Section 7). The observed flows that refer to the future alternative scenarios derive from a recalculation of the current flows (Table 1) since the new multimodal depot is not yet operational. The whole area is expected to be affected because of the new development; therefore, a recalculation with some assumptions was definitely required and is further analyzed in Section 4.3.
4.2. Scenario—Current Situation
The purpose of this scenario is to represent the current traffic conditions in the study area with accuracy, evaluate the network’s operation, and provide the basis for the development of future scenarios. Therefore, Nodes A, B, and C were coded in detail in the microsimulation software with the help of the results of the preliminary transportation study by the T.A., as seen in Figure 5. Several KPIs were extracted from the simulation process and were used to assess the current situation and as comparison factors for the alternative future conditions.
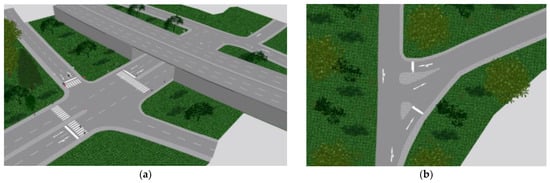
Figure 5.
Existing network—Scenario 0: (a) Nodes A and B; (b) Node C. (Figures extracted from the PTV VISSIM simulation software [9]).
4.3. Scenarios of Development
The planned traffic regulations in the existing network, in combination with the construction and operation of the new multimodal depot, will certainly increase the area’s traffic flow. To accurately model the future network, and therefore extract representative results from the microsimulation software, the future traffic flows had to be calculated. The calculation was mainly accomplished with the use of the macrosimulation software VISUM by PTV AG [23] with some required assumptions. A VISUM macroscopic model of Thessaloniki city was used to reallocate the existing traffic flows to the future network after the reopening of the partially closed street in front of the multimodal station. This macroscopic model was made by the Transport Engineering Laboratory of the Aristotle University of Thessaloniki [24] for numerous projects concerning Thessaloniki city. Following the allocation, the traffic flows were increased by 10% since the new infrastructure is expected to attract more travelers to the area. Furthermore, the calculation process considers, additionally, the thirteen (13) bus lines that will be served by the new infrastructure. The city’s local authority desired to examine how the planned traffic regulations and the new network design would affect the level of service of public transport. These bus lines are currently connecting the outskirts of the city with its center, but after the opening of the hub they will terminate there. Hence, with the guidance of the transport authority, we calculated the usage frequency of these bus lines and the number of vehicles was added into the total traffic flows. The traffic flows that would be generated by the park-and-ride facility were not considered in the calculation process, because the total number of parking slots had not been decided at the period of our analysis. Last but not least, pedestrian and bicycle flows were not considered either, due to lack of data and time limitations. Table 2 presents the calculated traffic flows of the morning peak hour for the future condition.
Table 2.
Traffic flows (PCU/h.) of Nodes A, B, and C—future situation.
4.3.1. Scenario 1.1—Future Network (Demand)
As noted above, the new multimodal depot is expected to significantly change the layout of the traffic network. Nodes A and B will be joined into a double roundabout and Node C will be transformed into a cross intersection, as seen in Figure 6. Regarding Node C, vehicle access is controlled with the help of ‘Stop’ signs at the north and south entrances of the intersection. This traffic measure is proposed because the traffic flows of these two streets were lower than the flows of the west and east entrances during the morning peak hour.
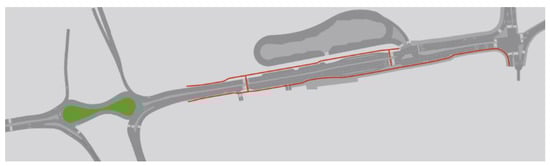
Figure 6.
Future network—Scenario 1.1 (red: bicycle network; dark grey: traffic network; light grey: pavement) (Figure extracted from the PTV VISSIM simulation software [9]).
4.3.2. Scenario 1.2—Future Network (Demand)
In this scenario, the network’s layout is identical to the one in Scenario 1.1 (Figure 6), with the only difference lying in that Node C is signalized. Since the proposed traffic signal program was not provided by the planning authorities, the optimal traffic signal program was calculated with the Webster and Cobbe method [25]. The calculated signal program consists of four phases and has a duration of 71 s.
4.3.3. Scenario 1.3—Future Network (Demand)
In scenario 1.3, Node C is converted from a signalized intersection into a two-lane roundabout. All the entrances are controlled with ‘Give way’ signs, and for all right turns of the roundabout there is a separate bypass lane. The layout of the network can be seen in Figure 7.
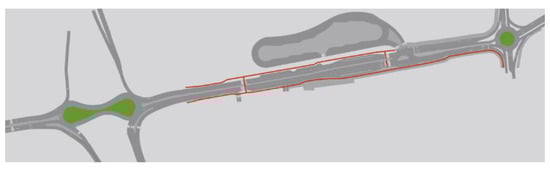
Figure 7.
Future network—Scenario 1.3 (red: bicycle network; dark grey: traffic network; light grey: pavement) (Figure extracted from the PTV VISSIM simulation software [9]).
4.3.4. Scenario 1.4—Future Network (Demand)
In the last examined scenario, there are changes on both sides of the future network. Node C, on the eastern side, is converted into a roundabout (like Scenario 1.3), while on Nodes A and B on the western side, a traffic lane is added at the north entrance. In addition, at the same north entrance, a separate bypass line for right-turning vehicles has been added, as seen in Figure 8.
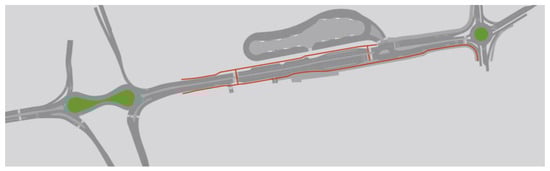
Figure 8.
Future network—Scenario 1.4 (red: bicycle network; dark grey: traffic network; light grey: pavement) (Figure extracted from the PTV VISSIM simulation software [9]).
5. Results
This section summarizes the results of the model calibration process, as well as the results deriving from the use of the VISSIM microsimulation models regarding the performance of the examined scenarios.
5.1. Model Calibration Results
In Table 3, the aggregated results of the calibration process for Nodes A, B, and C are presented. As shown by the data in Table 3, the models are successfully calibrated, since the GEH statistic index does not exceed the value of five (5) in any of the nodes.
Table 3.
Calculation of the GEH statistic of Nodes A, B, and C—Scenario 0.
5.2. Scenario Performance Results
The comparative analysis results are given in network-based and node-based forms and the values that were used for the comparison are the average values extracted from the models. Also, Scenario 1.1 and 1.2 are compared to Scenario 0, while Scenario 1.3 and 1.4 are compared to Scenario 1.2 proposed by the local authorities. The reasoning for this is that both Scenarios 1.3 and 1.4 were examined as alternative solutions to the proposed layout.
Table 4 contains various KPIs for the overall network calculated for all the scenarios as well as their percentage differences from the compared scenarios. It is observed that after the operation of the new multimodal depot commences, the traffic network will be affected substantially. The scenario with the worst performance, compared to Scenario 0, is Scenario 1.2. Both delays and stops show a significant increase, while the average speed is decreased, as seen in Table 4. On the other hand, in Scenario 1.1 the network seems not to face severe problems. Ostensibly, the layout of the traffic network in Scenario 1.1 seems to be the most suitable option, but the proposed traffic measures regarding vehicle access to Node C will cause safety risks, especially during rush hours. Regarding Scenarios 1.3 and 1.4, the network does not experience serious congestion problems compared to Scenario 1.2, mainly due to the reconstruction of Node C into a two-lane roundabout.
Table 4.
Comparative analysis of the KPIs for all scenarios for the overall network.
Table 5 and Table 6 present the level of service (LOS), the vehicle delays, and their percentage differences with the compared scenarios for all possible directions around the multimodal hub. In Node A, both the north and south entrances are congested during the morning peak hour in Scenario 0. After the operation of the new development commenced, the congestion in the south and north entrances of the double roundabout (Nodes A and B) increased significantly. While similar results arise from all the scenarios, in Scenario 1.4, a slight increase in the LOS of both the south and north entrances is observed. As for Node C, considering the results of Scenario 0, the node works fairly satisfactorily. After its reconstruction, in Scenario 1.1, the node still does not face severe congestion problems, except from the S-N and N-S routes. On the contrary, in Scenario 1.2, when the node is signalized, the LOS of Node C decreases dramatically from A to F. Finally, the results of Scenario 1.3 and 1.4 are more encouraging. In both these scenarios, the west entrance is the one that faces the most severe congestion problems. This is reasonable because the west entrance has only one traffic lane, while the other entrances have two.
Table 5.
Comparative analysis of the level of service (LOS) and average delays for all scenarios for Nodes A and B.
Table 6.
Comparative analysis of the level of service (LOS) and average delays for all scenarios for Node C.
Finally, Table 7 presents the CO2 emissions and fuel consumption of Nodes A, B, and C for all the examined scenarios. All the nodes show a significant, but expected, increase both in their CO2 emissions and fuel consumption after the operation of the multimodal hub commenced due to the new demand and traffic regulations. Again, the scenario with the worst performance, compared to Scenario 0, is Scenario 1.2. Also, the reconstruction of Node C into a two-lane roundabout in Scenarios 1.3 and 1.4 leads to positive results, as seen in the table that follows. Compared to Scenario 1.2, both the carbon dioxide emissions and fuel consumption of Node C show a decrease of almost 40%. This is justified because of the replacement of the traffic lights with ‘Give way’ signs, which leads to a big decrease in the total delays of the node.
Table 7.
CO2 emissions and fuel consumption for all scenarios for Nodes A, B and C.
6. Discussion
The construction of the new multimodal depot in combination with the traffic regulations that the local authorities plan to implement will significantly change the area’s traffic image. The proper management of traffic flows and the seamless service of public transportation are therefore challenges that need to be addressed. From the conducted analysis arises the conclusion that the existing traffic network operates satisfactorily with minor delays during peak hours. This is expected to change with the reopening of the currently closed road and the operation of the hub, which will cause a large increase in traffic. In addition, some of the proposed traffic regulations will lead to delays and a very low level of service at key points of the network. The traffic network should operate efficiently, especially during peak hours, and provide a sustainable and comfortable travel experience for users.
The traffic impact analysis conducted in this paper revealed four findings of vital importance. Firstly, transport authorities should use traffic simulation models to assess the impact of their proposed ideas or adjustments on the traffic network before implementation. Secondly, the participation of the academic sector in the design process of new developments can be beneficial since it can help address numerous complex challenges. Moreover, traffic microsimulation models should include all the available transport means in an area to examine how they interact with each other and if the provided level of service can meet users’ expectations. Last but not least, the availability of diverse datasets, such as the composition of traffic demand during peak hours or users’ travel behavior, is crucial. These datasets can significantly help transport planners to understand a system’s complexity and thus reduce the negative impact of the planned regulations. Last but not least, any proposed traffic regulation should be tested prior to implementation to ensure that it respects user and network needs.
This study has potential limitations that should be considered before the adoption of the implemented methodology. Firstly, there is a significant lack of data regarding the traffic flows that are expected to be generated from the provided services of the hub. Traffic flows of the park-and-ride facility and the bicycle network, and also the pedestrian flows, were not available at the time of the research process so they were not considered in the modeling process. The addition of these data in the models is vital in understanding the complexity of the examined traffic network, and will therefore lead to more accurate results. Moreover, the calculation of the signal program in Scenario 1.2 was based on the early layout of the network given by the city’s transport authority, which is likely to change. Finally, one of the biggest limitations in this study is the recalculation method of future traffic demand. This method was based on assumptions which are probably not accurate enough, since there were not available official documents that could prove the distribution or the fluctuation of the network’s traffic demand after the new infrastructure.
Future research could examine the implementation of other, more comprehensive, analyses that will lead to more concrete suggestions and proposals. A cost–benefit analysis, i.e., monetarily quantifying the benefits and the costs both for the users and the community, can help significantly in choosing the best scenario among the proposed ones. Furthermore, an implementation of a multicriteria analysis in parallel with the design process will strengthen the engagement of the local stakeholders with the project and hierarchize the priorities of the hub and network. Also, since the new hub will serve numerous users daily, the planning process should consider their opinions. Therefore, the users could actively participate in the design process through a survey which will address their needs and set new standards. Finally, the implementation of automated data collection methods could be vital for similar projects that lack data. All the methods mentioned above are beneficial in the preliminary design phase of multimodal hubs because they can help transport planners and authorities to make well-founded decisions.
7. Conclusions
The methodology implemented in this paper forms a basic framework that can be adopted by any transport planner or public authority who aims to assess the surrounding traffic network of an existing or new multimodal hub. The methodology starts with the collection of available data on the examined area (i.e., availability of public transport or other shared means, traffic demand, layout of the network). The method then continues with the development and calibration of the models that represent the current and future traffic conditions, and finishes with a comparative analysis between the proposed scenarios and the final conclusions.
The conclusions that arise from the traffic impact analysis are as follows:
- The use of microsimulation models is fundamental for the design process of a new infrastructure. These models provide significant information regarding the traffic, environmental, and economical aspects of a new development and help planners in making better decisions.
- When designing a multimodal hub, transport planners have to ensure that the existing network can absorb the expected changes in traffic demand.
- If further network adjustments are needed, their impact on the efficiency of the network has to be tested. Planners should avoid interventions in the urban fabric that may cause traffic congestion or user inconvenience, and therefore have a negative impact on the operation of the infrastructure and the environment.
- Transport planners should prioritize the seamless circulation of public and micromobility means of transport (bikes, scooters, etc.) in the surroundings of multimodal hubs.
Author Contributions
Conceptualization, G.C. and I.P.; methodology, G.C. and I.P.; writing—original draft preparation, G.C.; writing—review and editing, A.K. and I.P.; supervision, I.P. All authors have read and agreed to the published version of the manuscript.
Funding
This research received no external funding.
Data Availability Statement
The data presented in this article are available on request from the corresponding author.
Acknowledgments
The authors would like to express their gratitude to PTV GmbH for providing for free the license of their software VISSIM and VISUM, and to Thessaloniki’s Transport Authority (the T.A) for providing all the necessary data and for their excellent cooperation.
Conflicts of Interest
The authors declare no conflicts of interest.
References
- Bryniarska, Z.; Zakowska, L. Multi-criteria evaluation of public transport interchanges. Transp. Res. Procedia 2017, 24, 25–32. [Google Scholar] [CrossRef]
- Conticelli, E.; Gobbi, G.; Saavedra Rosas, P.I.; Tondelli, S. Assessing the Performance of Modal Interchange for Ensuring Seamless and Sustainable Mobility in European Cities. Sustainability 2021, 13, 1001. [Google Scholar] [CrossRef]
- Li, H.; Wang, Y. Hierarchical Multimodal Hub Location Problem with Carbon Emissions. Sustainability 2023, 15, 1945. [Google Scholar] [CrossRef]
- Pitsiava-Latinopoulou, M.; Iordanopoulos, P. Intermodal Passengers Terminals: Design Standards for Better Level of Service. Procedia-Soc. Behav. Sci. 2012, 48, 3297–3306. [Google Scholar] [CrossRef]
- Droj, G.; Droj, L.; Badea, A.C.; Dragomir, P.I. GIS-Based Urban Traffic Assessment in a Historical European City under the Influence of Infrastructure Works and COVID-19. Appl. Sci. 2023, 13, 1355. [Google Scholar] [CrossRef]
- Oostendorp, R.; Krajzewicz, D.; Gebhardt, L.; Heinrichs, D. Intermodal mobility in cities and its contribution to accessibility. Appl. Mobilities 2019, 4, 183–199. [Google Scholar] [CrossRef]
- Cai, Y.; Chen, J.; Lei, D.; Jiang, Y. The Integration of Multimodal Networks: The Generalized Modal Split and Collaborative Optimization of Transportation Hubs. J. Adv. Transp. 2022, 2022, 3442921. [Google Scholar] [CrossRef]
- Dacko, S.G.; Spalteholz, C. Upgrading the city: Enabling intermodal travel behaviour. Technol. Forecast. Soc. Chang. 2014, 89, 222–235. [Google Scholar] [CrossRef]
- PTV. VISSIM 2022 User Manual; PTV Planung Transport Verkehr GmbH: Karlsruhe, Germany, 2022.
- Adamos, G.; Nathanail, E. How Attractive are Public Transport Interchanges? A Cross Comparison of Two European Terminals. Trans. Transp. Sci. 2022, 1, 74–83. [Google Scholar] [CrossRef]
- Risimati, B.; Gumbo, T. Exploring the Applicability of Location-Based Services to Delineate the State Public Transport Routes Integratedness within the City of Johannesburg. Infrastructures 2018, 3, 28. [Google Scholar] [CrossRef]
- Bagamanova, M.; Mujica Mota, M.; Di Vito, V. Exploring the Efficiency of Future Multimodal Networks: A Door-to-Door Case in Europe. Sustainability 2022, 14, 13621. [Google Scholar] [CrossRef]
- Nathanail, E.; Adamos, G.; Tsami, M.; Jackiva, I. Green Urban Interchanges: Stakeholder and User Perspectives. Transp. Telecommun. J. 2018, 19, 183–193. [Google Scholar] [CrossRef]
- Carmo, L. Multimodal Transport Hubs. Good Practice Guidelines; Agence Française de Développement: Paris, France, 2020.
- Interchange Best Practice Guidelines. Available online: https://content.tfl.gov.uk/interchange-best-practice-guidance-2021.pdf (accessed on 16 December 2023).
- Hernandez, S.; Monzon, A. Key factors for defining an efficient urban transport interchange: Users’ perceptions. Cities 2016, 50, 158–167. [Google Scholar] [CrossRef]
- Sidorchuk, R.; Skorobogatykh, I.; Lukina, A.; Mkhitaryan, S.; Stukalova, A. Access to the Rail Station as a Customer Value: Simulation of Passenger Flows in Rail Stations with Disinfection Gateway Installations. J. Open Innov. Technol. Mark. Complex. 2020, 6, 122. [Google Scholar] [CrossRef]
- Vivek, C.; Akshay, G.; Manoranjan, P. Demystifying service quality of Multimodal Transportation Hub (MMTH) through measuring users’ satisfaction of public transport. Transp. Policy 2021, 102, 47–60. [Google Scholar] [CrossRef]
- Chowdhury, S.; Hadas, Y.; Gonzalez, V.; Schot, B. Public transport users’ and policy makers’ perceptions of integrated public transport systems. Transp. Policy 2018, 61, 75–83. [Google Scholar] [CrossRef]
- Dell’Olio, L.; Ibeas, A.; Cecín, P.; Dell’Olio, F. Willingness to pay for improving service quality in a multimodal area. Teransportation Res. Part C Emerg. Technol. 2011, 19, 1060–1070. [Google Scholar] [CrossRef]
- Thessaloniki Transport Authority, Traffic study in the area of “Nea Elvetia” for the planning needs of the bus interchange, April 2021.
- Feldman, O. The GEH Measure and Quality of the Highway Assignment Models. In Proceedings of the European Transport Conference, Glasgow, Scotland, 8–10 October 2012. [Google Scholar]
- PTV. VISUM 2022 User Manual; PTV Planung Transport Verkehr GmbH: Karlsruhe, Germany, 2022.
- Transport Engineering Laboratory of the Aristotle University of Thessaloniki. Available online: https://tel.web.auth.gr/ (accessed on 7 February 2024).
- Frantzeskakis, I.; Gkolias, I.; Pitsiava-Latinopoulou, M. Κυκλοφοριακή Τεχνική [Transportation Engineering], 1st ed.; Papasotiriou: Athens, Greece, 2009; pp. 247–274. [Google Scholar]
Disclaimer/Publisher’s Note: The statements, opinions and data contained in all publications are solely those of the individual author(s) and contributor(s) and not of MDPI and/or the editor(s). MDPI and/or the editor(s) disclaim responsibility for any injury to people or property resulting from any ideas, methods, instructions or products referred to in the content. |
© 2024 by the authors. Licensee MDPI, Basel, Switzerland. This article is an open access article distributed under the terms and conditions of the Creative Commons Attribution (CC BY) license (https://creativecommons.org/licenses/by/4.0/).