Article

The Relationship between Urban Functional Structure and Insomnia: An Exploratory Analysis in Beijing, China

1
School of Tourism Management, Hubei University, 368 Youyi Road, Wuhan 430062, China
2
Key Laboratory of Regional Development and Environmental Response, Hubei University, 368 Youyi Road, Wuhan 430062, China
3
Institute of Environment and Development, Guangdong Academy of Social Sciences, Guangzhou 510635, China
4
School of Resource and Environment Science, Wuhan University, 129 Luoyu Road, Wuhan 430079, China
*
Authors to whom correspondence should be addressed.
Urban Sci. 2024, 8(3), 137; https://doi.org/10.3390/urbansci8030137
Submission received: 24 July 2024 / Revised: 8 September 2024 / Accepted: 9 September 2024 / Published: 12 September 2024

Abstract

:
Insomnia is a prevalent sleep disorder that causes serious harm to individuals and society. There is growing evidence that environmental factors may be associated with sleep disorders, but few studies have explored the relationship between insomnia and urban functional structure from a spatial perspective. This study collected multi-source big data (e.g., insomnia posts on Weibo, locations of urban facilities on Baidu) and explored the effects of different urban spatial element configurations on residents’ insomnia. The ordinary least squares (OLS) and geographically weighted regression (GWR) models were used to quantify the global and local effects of urban functional categories on residents’ insomnia. The results showed that the quantity of catering service facilities accounted for the largest proportion, and the consumer function was the most consistent with the distribution of insomnia. There is a domain relationship between the incidence of insomnia and urban functional zones. It has the strongest correlation with employment mixed functional zones and the weakest with residential mixed functional zones. These findings could serve as references for the functional structure and layout of urban space for improving the sleep health of residents and benefit for urban health.

1. Introduction

Sleep, a process essential for life, is an essential part of the body’s recovery and solidifies memory, which is also an integral part of health that must be given high priority. Research led by the WHO showed that approximately 27% of the world’s population suffers from sleep disorders [1]. According to the China Sleep Study Report (2023), the per capita sleep time in 2023 was only 7.4 h. Compared with the 7.61 h per person in the 2018 China Household Tracking Survey, the per capita sleep time is shortened by more than 0.2 h, indicating that the sleep quality of Chinese people is gradually declining. Overall, 47.55% of respondents actually sleep less than 8 h per day [2]. Insomniacs account for more than 15% of the city’s total population in Shanghai, China [3]. The decline in sleep quality and the aggravation of insomnia symptoms in urban residents may cause individual memory loss, premature aging, decreased immunity, and other hazards [4]. Moreover, prolonged and severe insomnia may lead to mental disorders, hypertension, etc., which can seriously damage individuals and society, as well as the resulting harmful social and economic impacts [5]. Therefore, exploring the main factors causing insomnia in urban residents has become a hot research issue in medicine, geography, and psychology.
Sleep has a complex relationship with health, and built and social environments also have an impact on sleep quality. Therefore, an overall assessment of sleep quality should take into account the sleep environment, individual physiological and psychological states, and social factors [6]. A comfortable sleeping environment is key to good sleep quality, involving quietness, optimal temperature, and ventilation, along with suitable bedding [7]. Minimizing light, noise, and electromagnetic interference is also crucial [8]. Social factors like work and school stress, family dynamics, and daily routines can significantly affect sleep [9,10]. Health factors, including sleep quality, are easily influenced by the social environment in which a person lives [11]. The influence of the external environment on sleep is partly derived from the temperature, humidity, light, sound, etc. of the sleeping space, as well as noise, vibration, climate, etc., from the external space [12]. Other factors are social, such as psychology, drugs and food, lifestyle behaviors (including smoking or alcohol consumption), and mental stress [13,14].
In recent studies, exposure to and accessibility of green space and the social environment (i.e., family support, school support, and community support) have become foci of research. A systematic retrospective study found that children’s sleep was affected by their sleeping environment [15]. A study on the connection between the community environment and sleep in young children (0–5 years), school-aged children (6–12 years), and adolescents (13–18 years) revealed the proof that community safety, crime, and violence hinder sleep in school-aged children and adolescents [16]. The significance of noise, habitat environment, air quality, and social cohesiveness is also supported by fresh evidence. This finding seemed to be used to support a national cross-sectional study while Italy was under COVID-19 shutdown [17]. That study examined the relationship between interior and outdoor green elements (such as sunlight, private views and public green space) and pressure and sleep disorders among respondents. The research has found correlations between interior and outdoor green elements and self-reported changes in the most common psychological outcomes associated with COVID-19 restrictions [18,19] (anxiety, anger, fear, confusion, moodiness, inattention, and sleep disturbance, etc.).
However, previous studies have rarely examined insomnia from a spatial perspective (emphasizing the importance of spatial factors in shaping and influencing social structures, behaviors, and processes), whether in public spaces or in the home environment, especially the relationship between insomnia and the functional location of cities from an urban perspective. The studies that have been conducted tend to be from a spatial perspective from small areas of sleeping space or surrounding green space [20,21]. For example, a study in rural China showed that greater residential greenness was significantly correlated with better sleep quality, which also highlighted the significant impact of green space on human health [22]. Similarly, studies of sleep spaces have shown that people living in enclosed spaces without daylight for long periods of time are prone to circadian rhythm desynchronization and sleep disorders [23]. Previous research has found that people’s commuting, work, and urban functional structure of residence have also become potential factors influencing insomnia of urban residents. A recent study discovered that long commutes not only directly affected employees’ anxiety and insomnia but also indirectly affected anxiety and insomnia by inducing WFC [24]. Therefore, it is essential to investigate the relationship between residents’ insomnia and urban space from the perspective of the functional location of urban space that people are in close contact with.
With the advancement of Internet technology, the global usage of social media has increased significantly, and platforms’ continuous and large-scale nature make them unconstrained by time and place [25]. This study used data collected by Sina Weibo, China’s largest social media platform, to obtain posts containing information about users’ location coordinates and insomnia. At the same time, POI (point of interest) data were used to determine the status of urban land use in the study area and the influence of different human activities on insomnia. A previous study in Shenzhen, China, demonstrated the effectiveness of social media check-ins and crowdsourced data in assessing urban vitality, providing new perspectives on resource utilization and community planning from the perspective of spatial and temporal relationships [26]. This study further utilized these multi-source big data to analyze the impact of urban functional structure and distribution on insomnia in Beijing, as well as the temporal and spatial distribution characteristics of insomnia among microblog users in different built environments.
The purpose of this research was to explore the influence of urban functional structure and distribution on insomnia. The realization of the goals above will help to solve the following two problems. (1) what are the global and local effects of the quantity and category of urban functional facilities on residents’ insomnia? (2) what is the spatial relationship between urban functional location and residents’ insomnia? At the same time, the results provide a reference for the study of insomnia in other cities and rational urban planning.
This research focuses on the impact of the urban space and urban functional structure on inhabitants’ sleeplessness, which distinguishes it from prior research on the relationship between insomnia and associated elements. The basic organization of this essay is as follows. After the introduction, the study area, the methodology, and the collection and processing of insomnia data are presented in Section 2. Section 3 analyzes the global and local effects of the number, domain relationships, and types of urban functional facilities on insomnia in the study area. In Section 4, the similarities and differences between our results and previous studies are discussed. The new findings, contributions, implications, and limitations of this study are presented. Section 5 summarizes our findings.

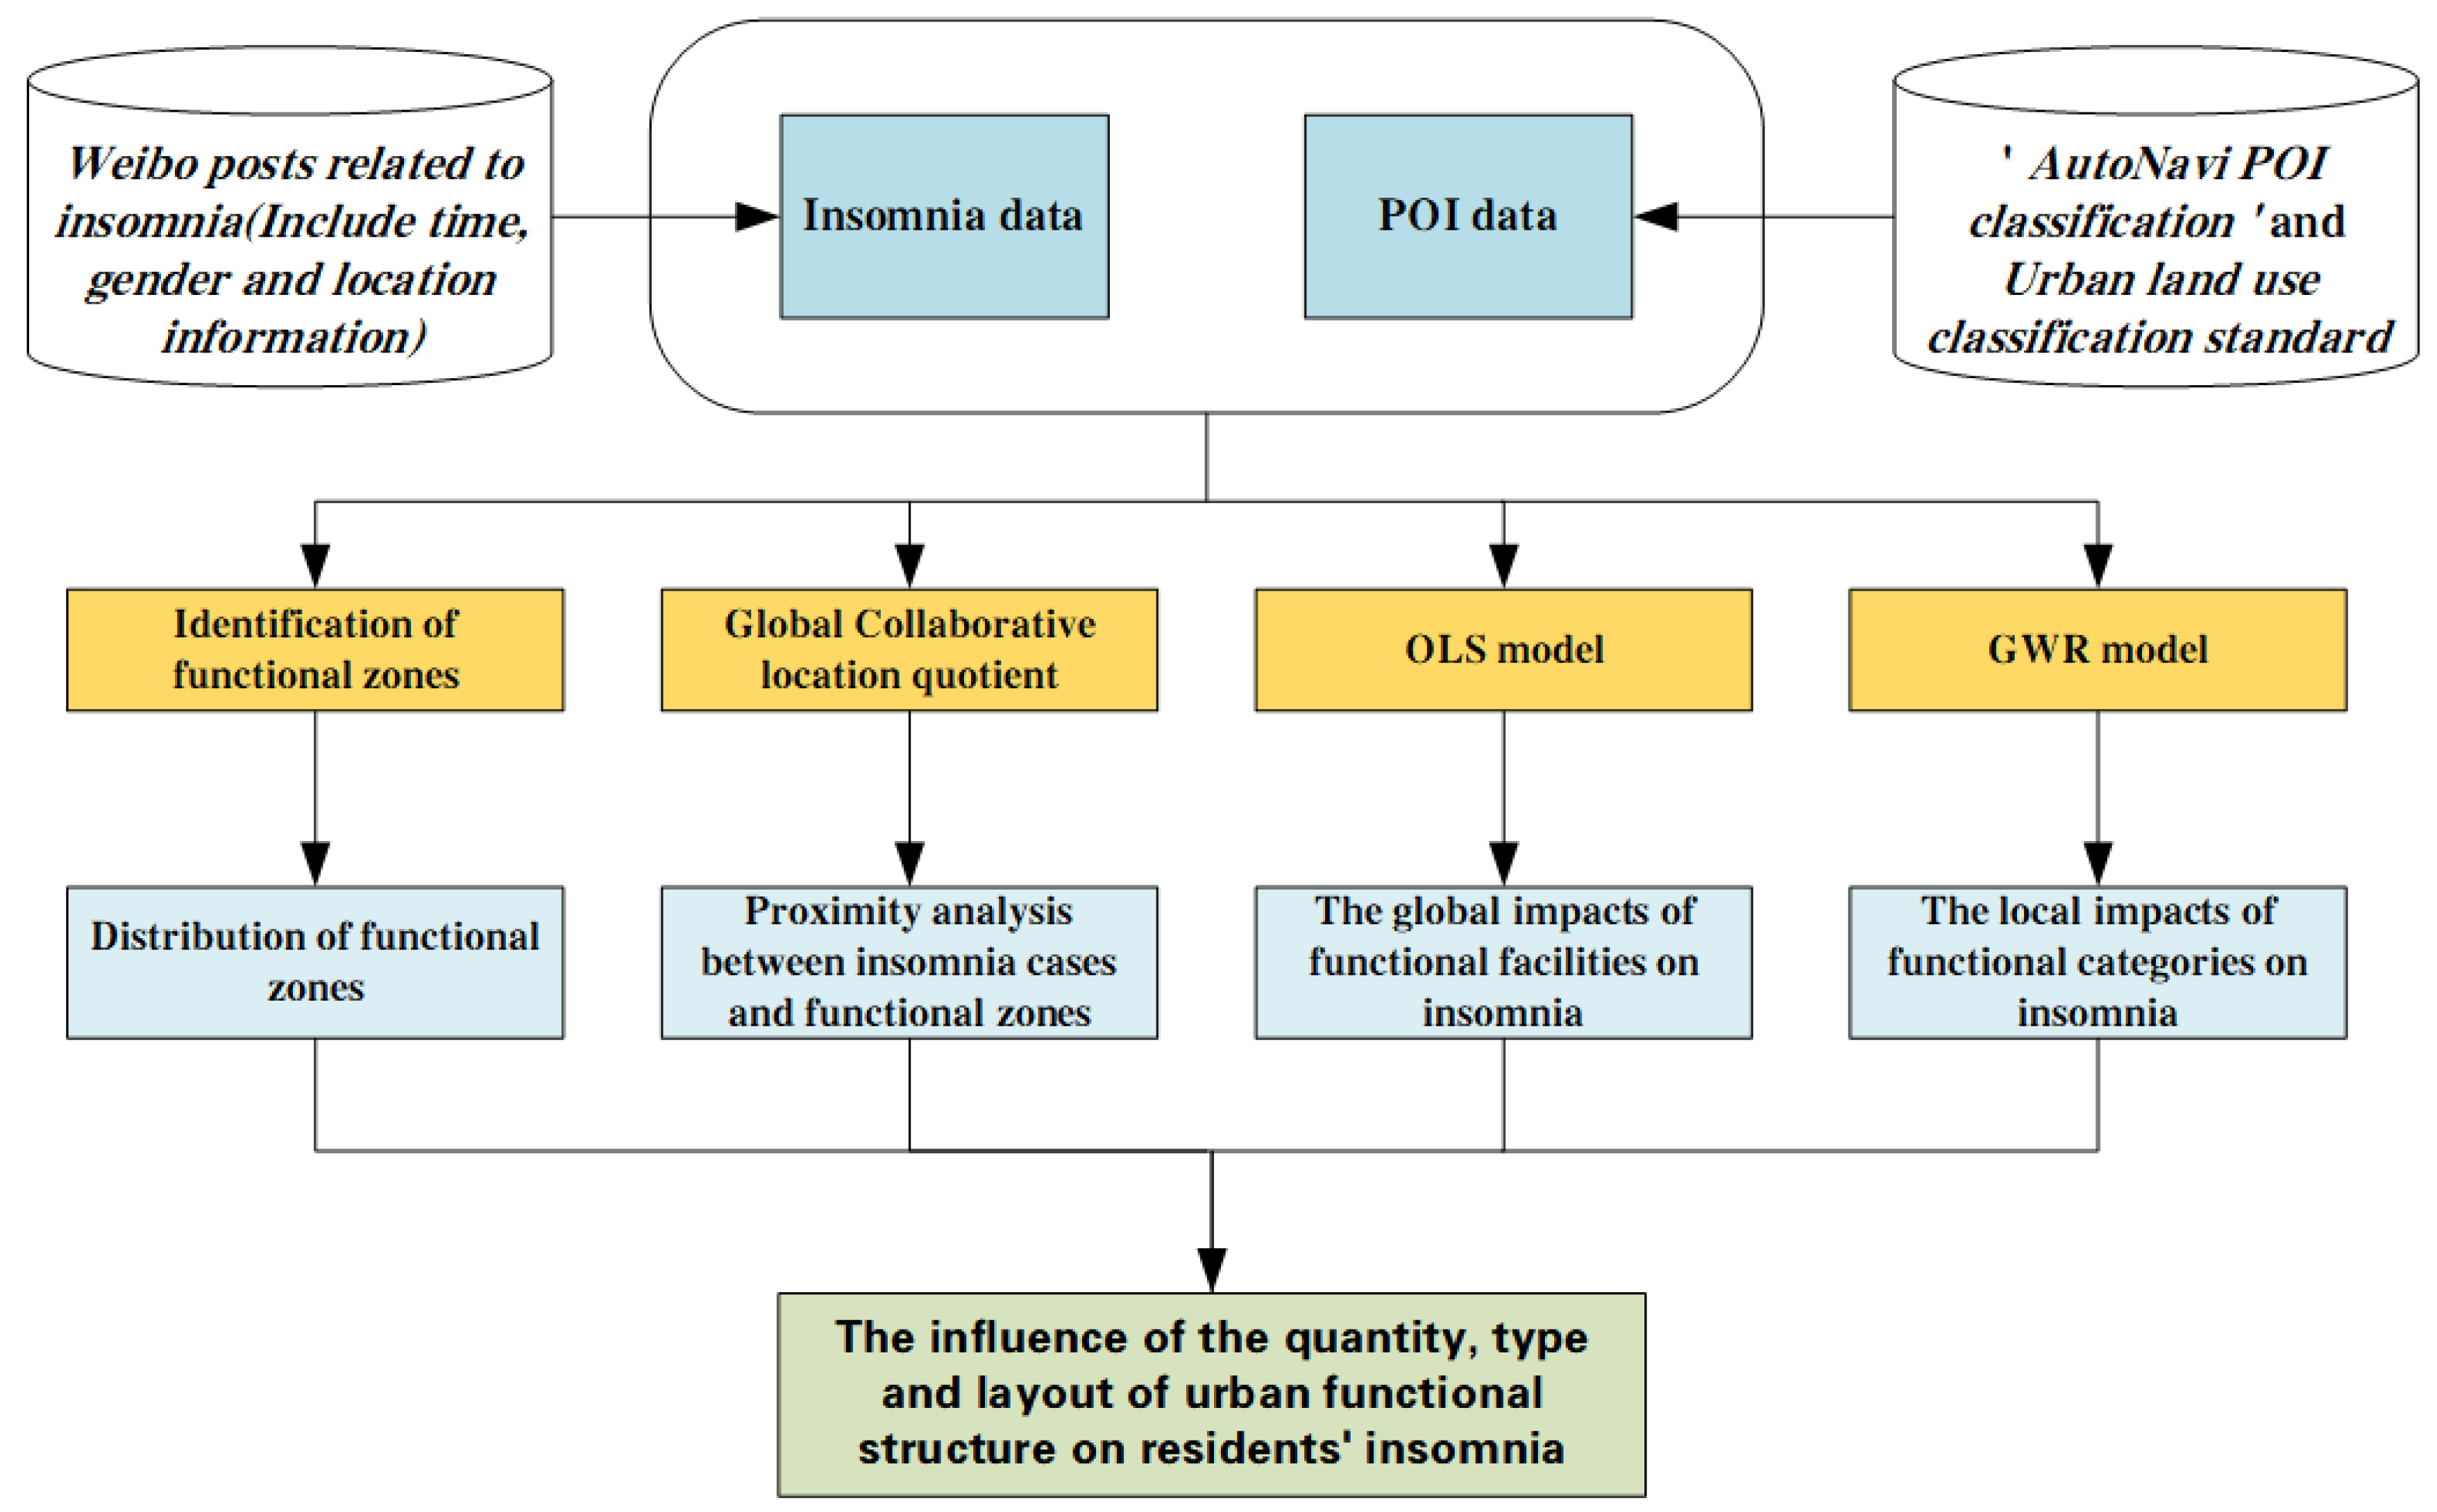
2. Materials and Methods

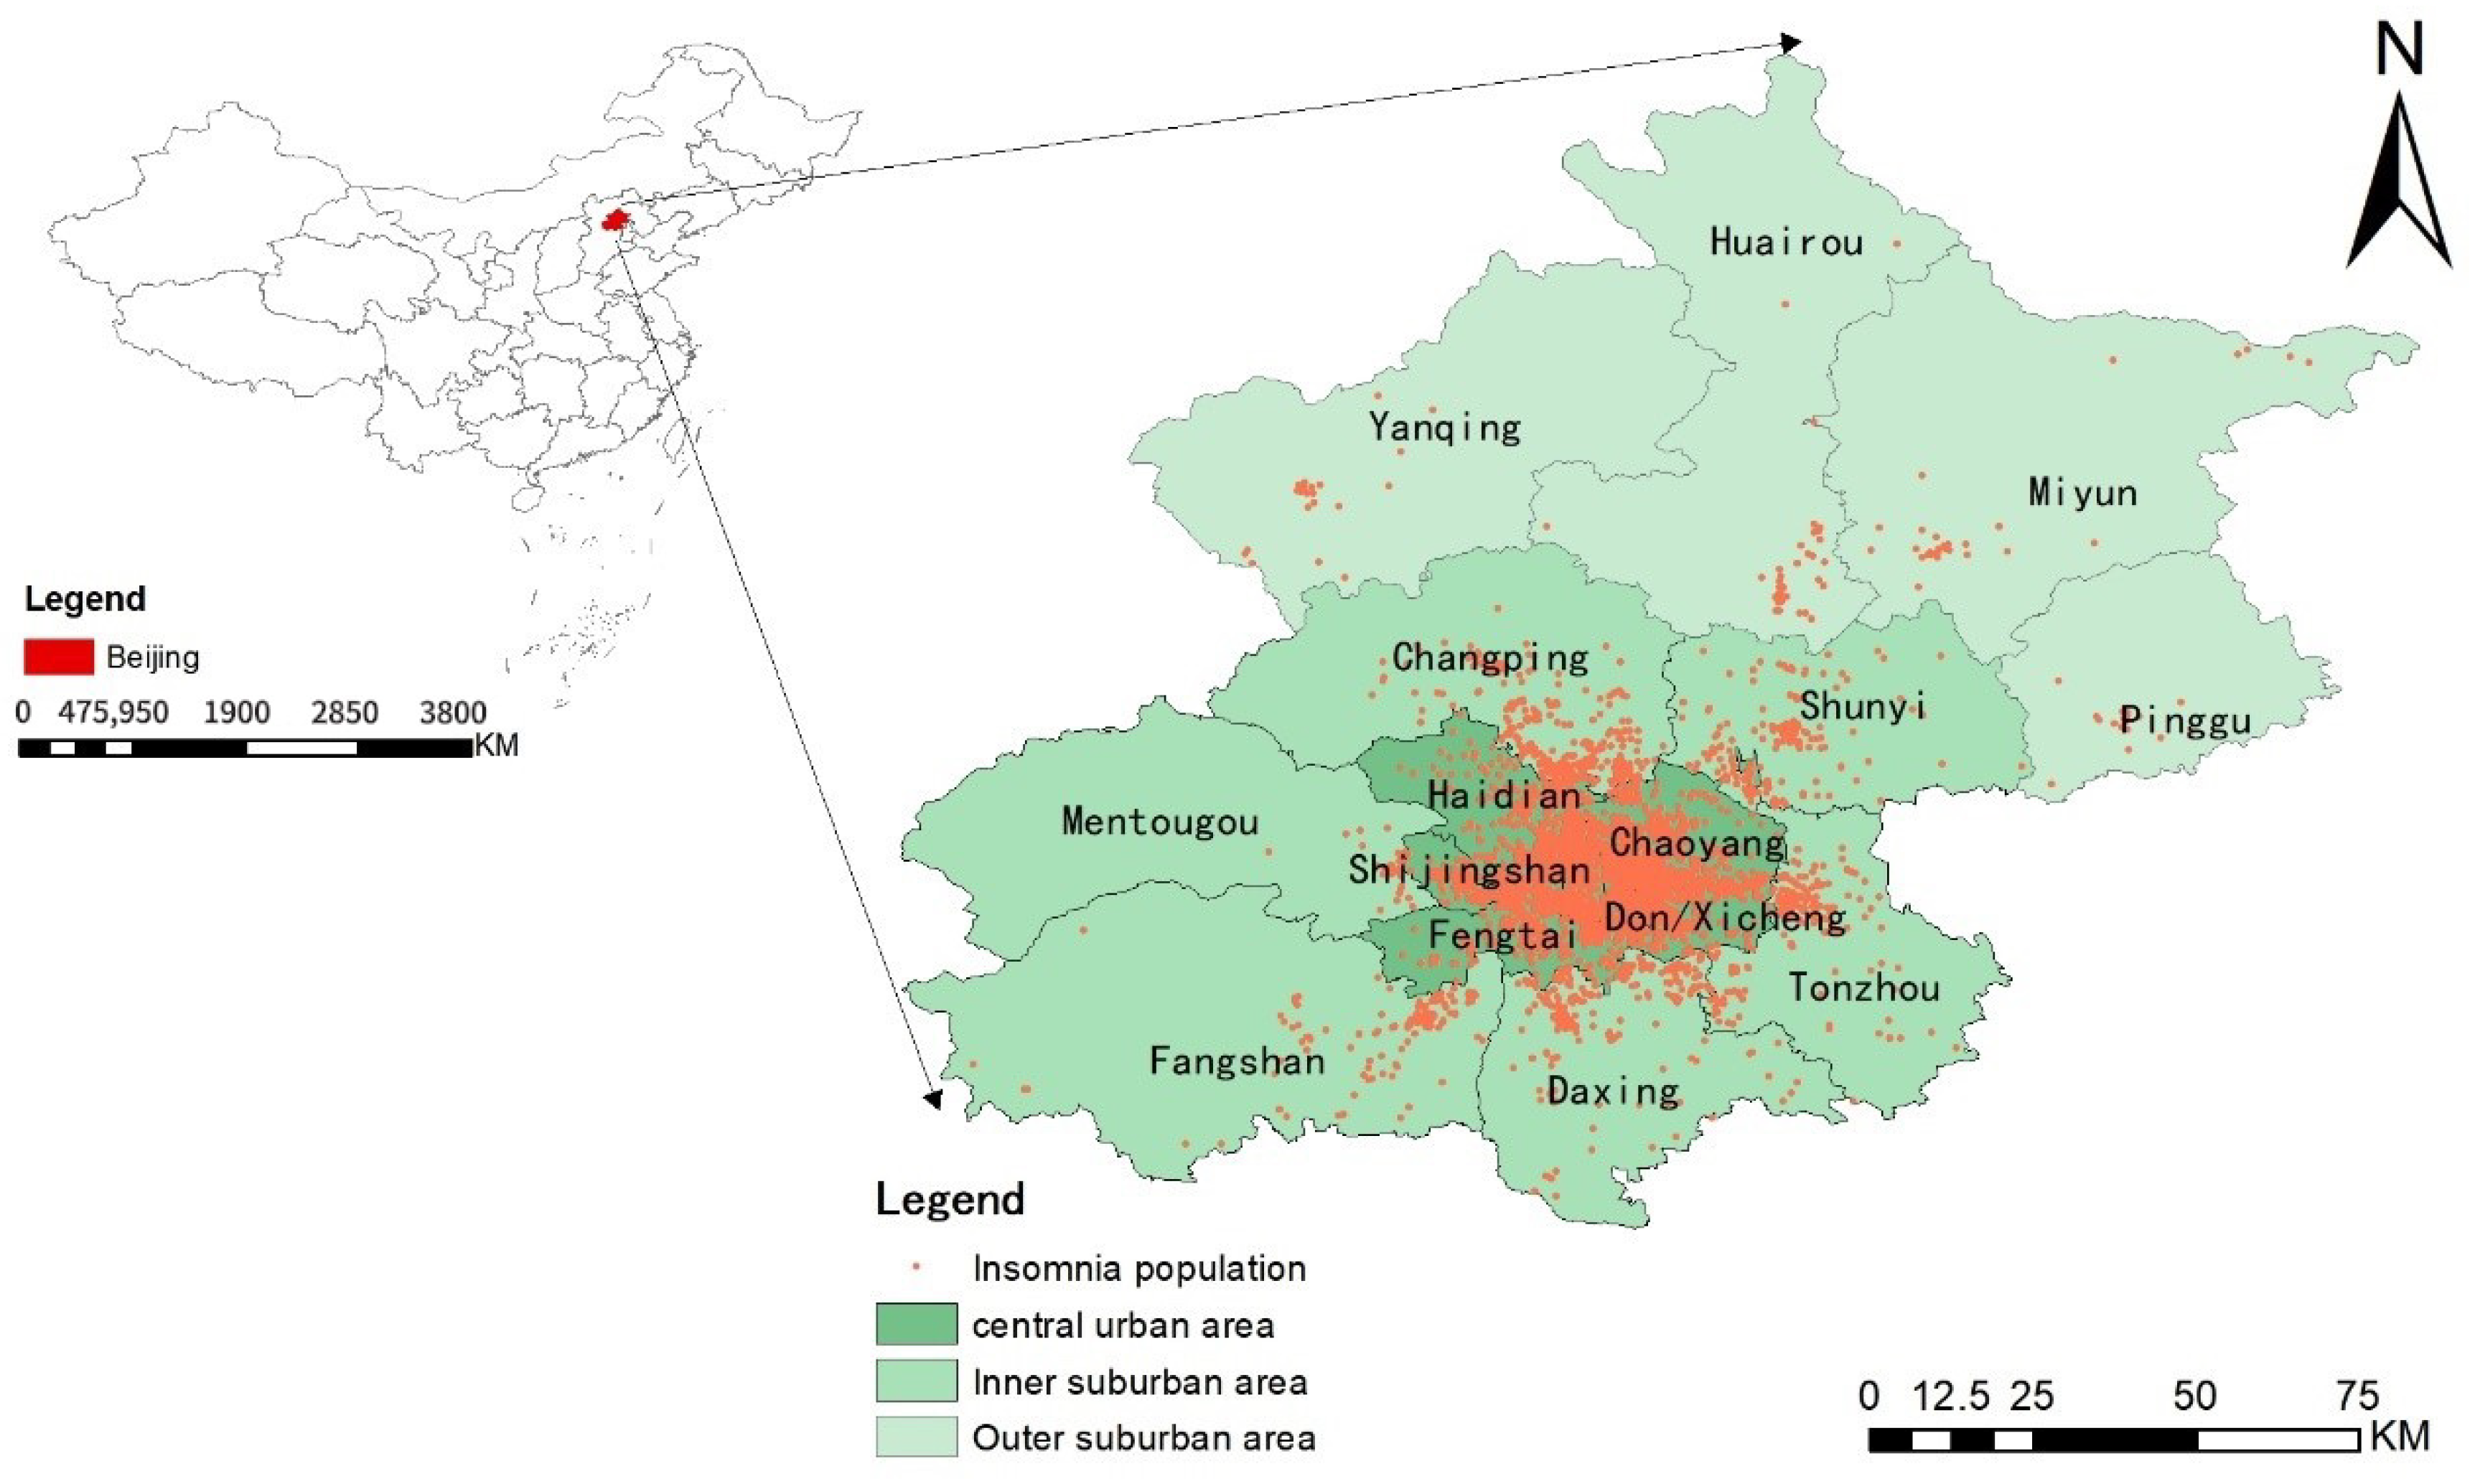
2.1. Study Area and Data

Our study explored the relationship between residents’ insomnia and urban functional structure based on insomnia data and POI data, and proposes a framework to study residents’ insomnia from the perspective of urban space. Figure 1 illustrates the basic framework of this paper.

2.1.1. Study Area

Beijing is the capital of China, with a population of about 21.886 million and an area of 16,410 square kilometers. An important center for politics, economy, education, and culture, it serves as a hub for both domestic and international activities. It gathers the most advanced institutions of learning and high-level talents in many fields as a city of science and education [27]. According to previous surveys, most insomniacs are white-collar workers and elites engaged in mental work such as IT, business management, and journalism [28]. They suffer irreparable harm from persistent insomnia, which has a negative impact not only on their personal health but also on the entire family and society [24]. In this paper, 16 administrative regions of Beijing are divided into three sub-regions according to the data of the insomniac population distribution (see Figure 2). These sub-regions are marked as the central urban area, inner suburban area, and outer suburban area. The central urban area mainly includes the district of Dongcheng, Xicheng, Chaoyang, Fengtai, Shijingshan, and Haidian. The inner suburban area mainly includes the district of Shunyi, Tongzhou, Mentougou, Daxing, Fangshan, and Changping. The outer suburbs mainly include the district of Pinggu, Miyun, Huairou, and Yanqing.

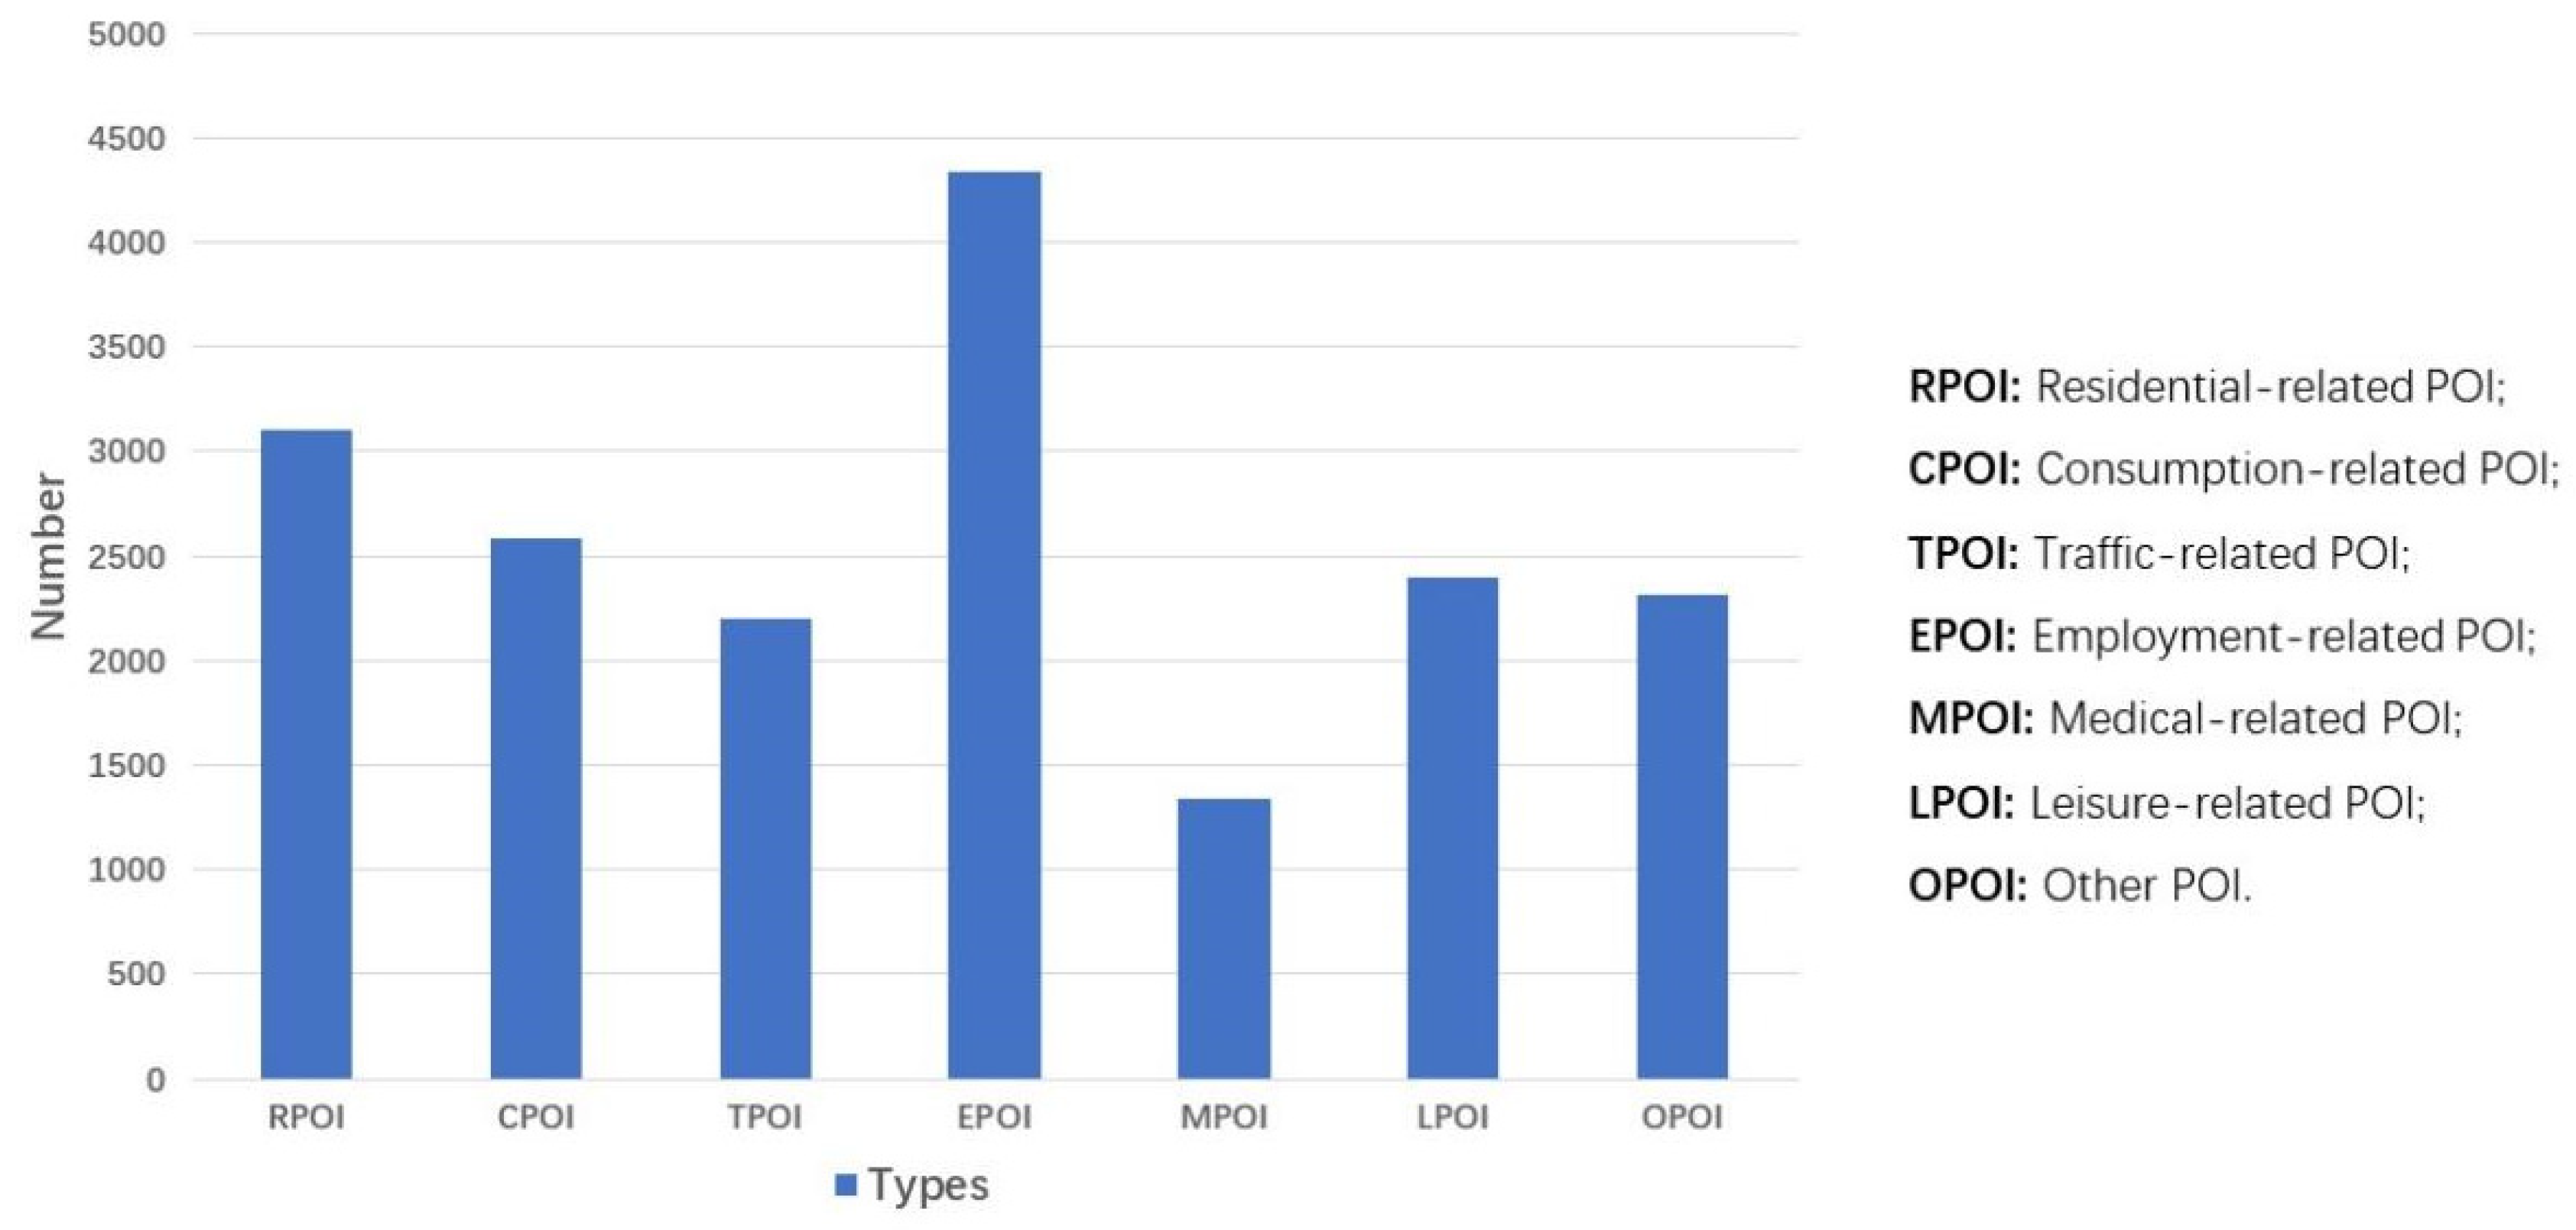
2.1.2. Data Source and Processing

(1) Insomnia data. Weibo is one of the best-known social media sites in China where users can exchange and share information [29]. We obtained Weibo posts that included the user’s location coordinates and information about “insomnia” from 2015 to 2017, including time information and gender information, searching for location information on Weibo using the terms “insomnia” and “insomniac.” Specifically, we captured 4526 data points in each Weibo post, including the content, posting timed and location coordinates. Since this study focused on the spatial location of insomniacs, we filtered out posts without location information because not all postings including keywords were connected to insomnia. The final check-in points with time and gender attributes were 1173 by matching and outlier processing.
(2) POI data. POI classification is consistent with land use classification in China [30]. POI data have the following benefits over land use data: (1) POI data may be transformed to any scale, and are more flexible when used to analyze scale issues; (2) interaction with POIs rather than different land use types might convey people’s preferences and social roles; and (3) POI data have considerably finer statistical granularity. Therefore, POI data are used to reflect land use and replace urban land use data in experiments [31]. POI data are used to identify the effects of different human activities on insomnia in this study. Beijing is divided into 15,854 spatial grid cells, and the quantity distribution of different categories of POIs for each grid cell is discussed. These points are divided into seven categories in this article in accordance with the AutoNavi POIs and classification of urban land use and planning.
These comprised residential POIs (RPOIs), consumer POIs (CPOIs), transportation POIs (TPOIs), employment POIs (EPOIs), medical POIs (MPOIs), leisure POIs (LPOIs), and other POIs (OPOIs) (see Figure 3). RPOIs consist of residential zones and residential amenities like hotels. Catering services, retail services, dwelling services, and sports and recreation services are all included in CPOIs. The TPOI complex includes an airport, train station, subway station, and bus terminal. It is important to note that workplaces are not given their own category, because most inhabitants are unable to choose where their workplaces are located, which prevents the locations from reflecting their preferences [26,32].

2.2. Methods

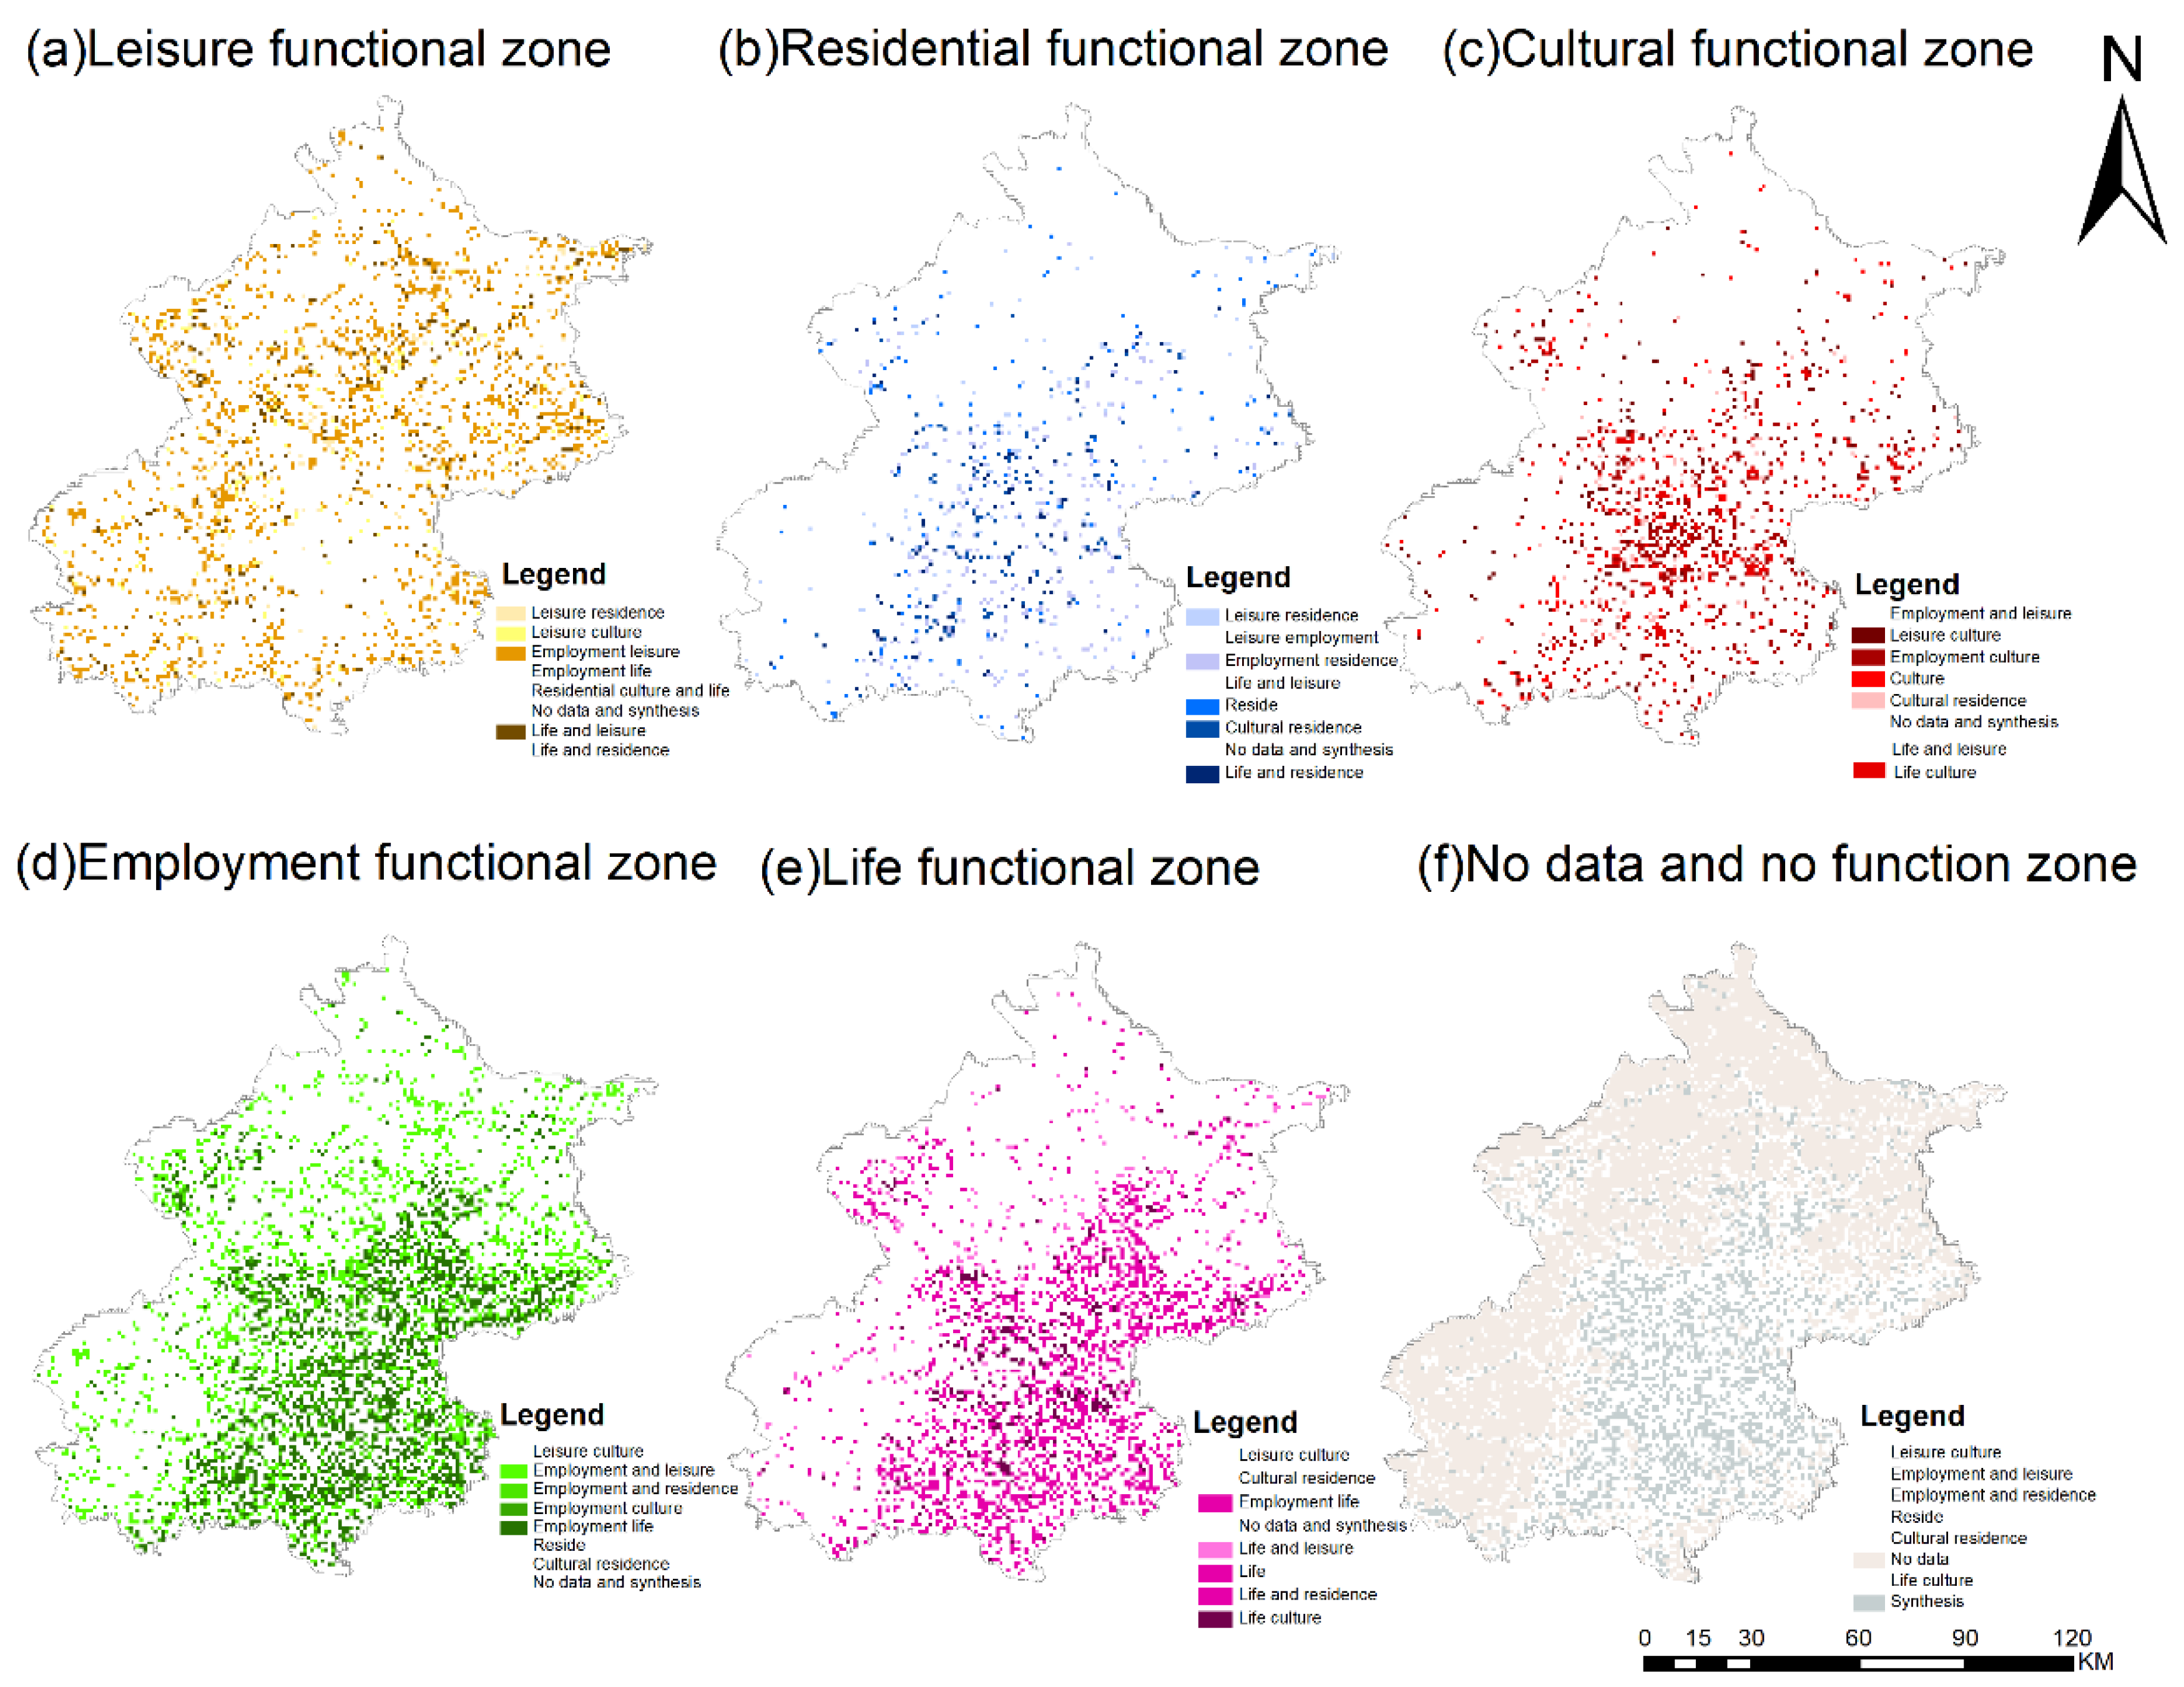
2.2.1. Identification of Urban Functional Zones

An urban functional zone refers to the distribution area of urban functional activities and its corresponding land use differentiation [33], which represent the basic performance and differences in urban land use structure, such as residential, commercial, industrial, and public space [34]. Accurate definition of urban spatial structure is of great significance for strengthening urban planning and coordinating land relations. When defining functional zones, a city is usually divided into a single area and a mixed area, and is judged by whether the density of each category of data point exceeds 50%. According to the weight of each category of POI, its POI frequency density in the land use unit is calculated as the basis for the division of functional zones. The advantage of this method lies in its objectivity and data-driven nature, which can provide an accurate description of urban spatial structure and better reflect the actual urban layout and functional distribution than traditional qualitative division based on expert knowledge. The calculation formula is:
F i = W i × d i / j = 1 6 W j × d j × 100 %
where F i , W i , d i 7 are the frequency density, weight, kernel density, and class of POI in the cell, respectively. Frequency density is a measure of the number of times an event occurs in a particular area. Weight is a numerical value used to represent the importance or influence of each POI. Within cells, different POIs can be assigned different weights to reflect their importance in the analysis. Kernel density is used to estimate spatial data distribution.
There are not only single-use functional zones but also two or more functional mixed zones due to the complexity and diversity of urban functional structure. Therefore, this paper further compares the frequency density of POIs in functional zone units [30]: The unit is considered to be a single functional zone when the frequency density of a certain category of POI ≥ 50%. The unit is determined to be a mixed zone of two categories of POI when the two categories of values with higher POI frequency density in the unit are between 20% and 50%. It is determined to be a data-free area when the frequency density of each category of POI in the unit is 0. The remaining units are comprehensive functional zones [35].

2.2.2. Global Collaborative Location Quotient

The collaborative location quotient is mainly to measure the degree of connection between two different point elements. Some scholars use this method to analyze the correlation characteristics between the employment point and the workplace, mainly to analyze the correlation between the different point sets. The method was originally invented and improved by American scholar Lesile [36]. This paper mainly uses the global collaborative location quotient (GCLQ) to measure the relationship between different urban spatial functional structures and urban residents’ insomnia. As a quantitative tool, GCLQ allows us to assess the spatial association of different urban functional zones with the distribution of insomniac populations. Compared with traditional association measurement methods, GCLQ can reveal deeper spatial agglomeration characteristics and interactions between functional regions. The calculation formula is as follows:
G C L Q A B = ( N A B / N A ) / ( N B / N 1 )
where G C L Q A B represents the collaborative location quotient of the A point set attracted by B point set, C A B represents the quantity of the A functional zone near the insomnia point of B residents, N A and N B represent the quantity of functional zones and the quantity of residents’ insomnia points, respectively, and N represents the total quantity of the two. G C L Q A B > 1 indicates that functional zone A tends to be close to B distribution; when G C L Q A B = 1, there is a random distribution between them; and when G C L Q A B < 1, A tends to be away from B distribution.

2.2.3. Analysis of Impacts on Insomnia by Functional Facilities

(1) Analysis of quantitative impacts. We first searched for single-class facility POIs with distance thresholds of 500 m, 1000 m, 1500 m, and 2000 m, respectively. Then, the quantity of facility POIs within different distance thresholds were counted to characterize the influence of the quantitative distributions on the incidence of insomnia cases.
(2) Global analysis of spatial impacts. Ordinary least squares (OLS) is one of the most fundamental and significant parameter estimate methods for linear regression models, and it is a widely used method for estimating regression coefficients [37]. The model parameter estimator is used as the variable, and it creates the objective function—the sum of residual squares—which establishes the value of the parameter estimator by minimizing the function value. There is a positive correlation and a negative correlation between the explanatory variables and the insomnia cases within the corresponding distance threshold in this study, so it is very likely that there is strong spatial heterogeneity. Some factors have strong collinearity and must be eliminated or merged. Therefore, it is necessary to explore the spatial heterogeneity of the impact of urban functional categories on insomnia cases.
The expression of the regression equation is:
y ^ = b ^ x + a ^  
b = i = 1 n x i x ¯ y i y ¯ i = 1 n x i x ¯ 2 = i = 1 n x i y i n x ¯ y ¯ i = 1 n x i 2 n x ¯ 2
a = y ¯ b x ¯
(3) Local analysis of spatial impacts. A modified spatial linear regression equation is geographic weighted regression (GWR). This model adds geographic location information and permits local rather than global parameter estimation compared to the conventional regression model. The benefit is that it expands on the conventional regression method and can easily change the spatial weight. The coefficients can more accurately capture each factor’s differences and heterogeneity. Therefore, GWR models are superior to measures such as general linear regression when exploring the local effects of different urban functional structures on insomnia among urban residents.
The expression of the GWR model is:
γ i = β 0 μ i ,   v i + j = 1 k β j μ i ,   v i X i j + ε i
where ( μ i ,   v i ) are the coordinates of the sample point, β 0 μ i , v i is the regression constant, β j μ i ,   v i is the j regression value of the i sample point, and ε i is the random error value.

3. Results

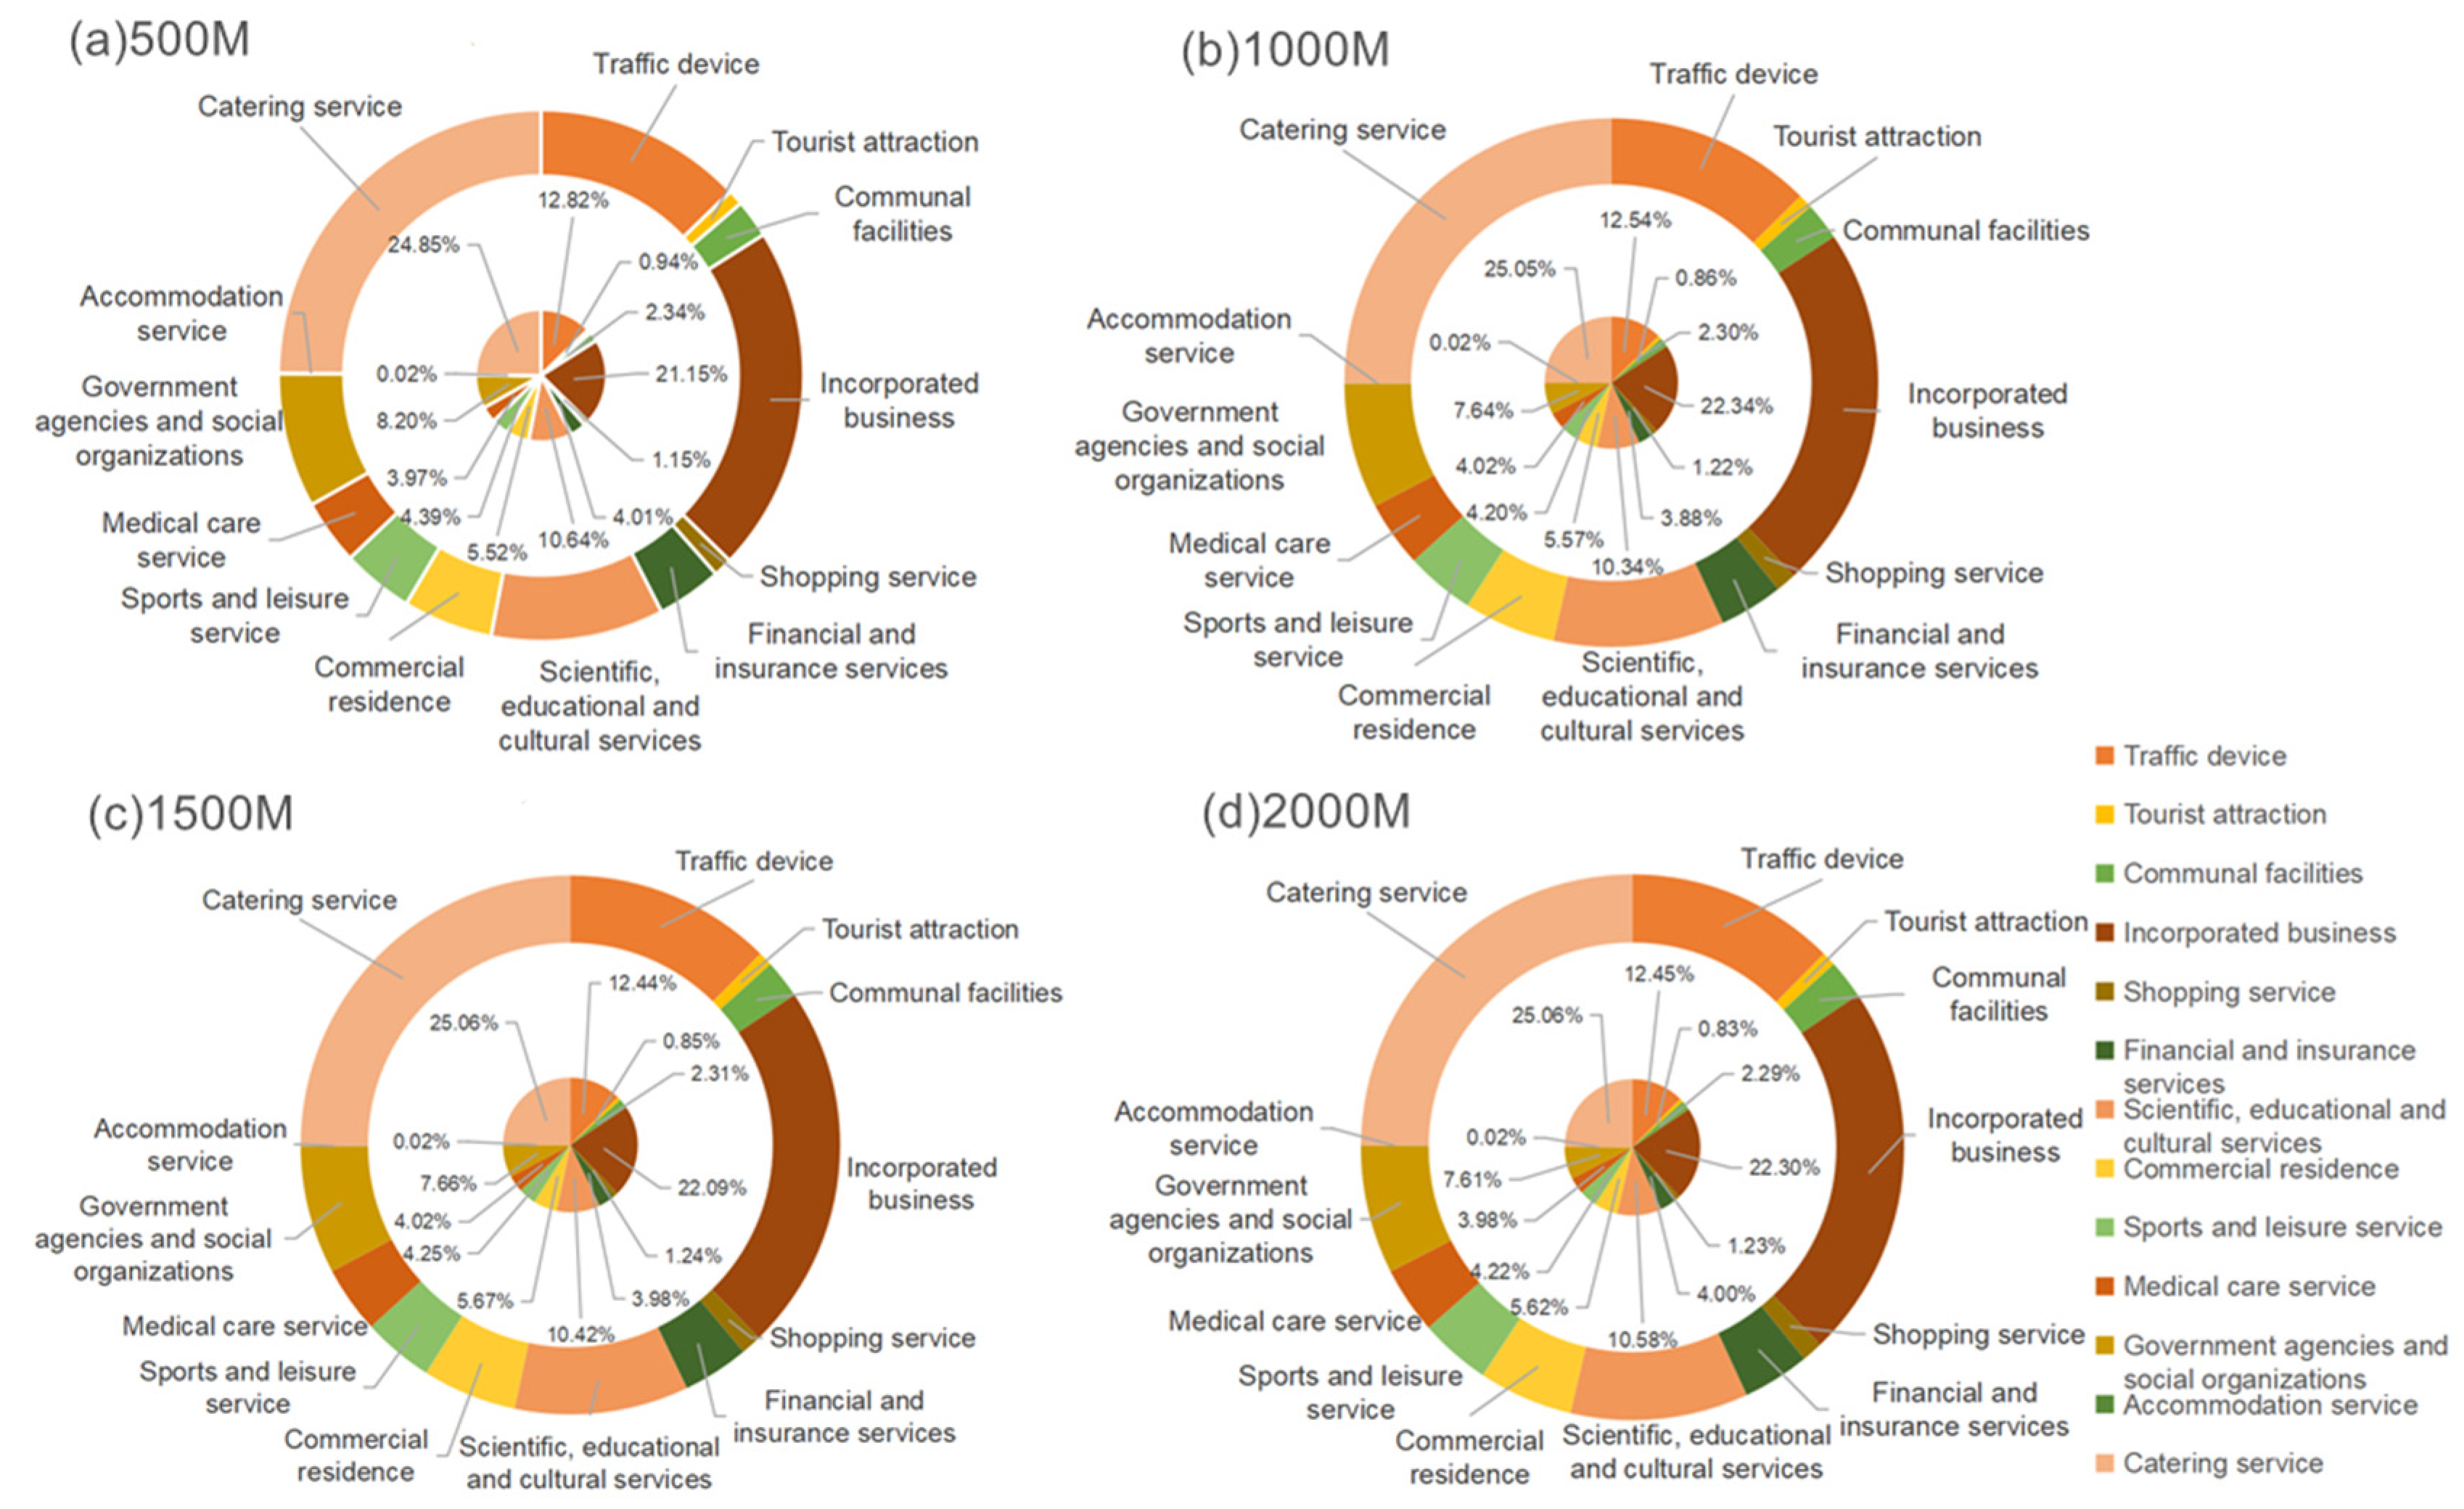
3.1. Distribution of Functional Zones in Beijing

According to the functional zone identification method, the frequency density of POIs in the functional zone unit is further compared, and it is divided into single functional zones, mixed functional zones, no-data zones, and comprehensive functional zones. We found that culture and its adjacent mixed functional zones, including cultural functional zones, employment and cultural mixed functional zones, and cultural and residential mixed functional zones are mostly concentrated in the central city area (see Figure 4). The residential mixed functional zones, employment mixed functional zones, and cultural mixed functional zones all show a pattern of distribution mainly in the central city area, spreading to the inner suburban area and outer suburban area (see Figure 4).
The collaborative location quotient of residential mixed functional zones and residents with insomnia is more than 1, which tends to be close to the distribution of the insomniac population (see Figure 4b). The lowest collaborative location quotient was found between the employment and leisure functional zones and the distribution of the insomniac population. Moreover, the collaborative location quotients between the mixed functional zones adjacent to the leisure category functional zones and insomnia of urban residents were all low (see Figure 4a). This finding may be closely related to geographical location [38]. The residential functional zone and its related mixed functional zone are mainly concentrated in the central city area, which is the political, commercial, and transportation center of the city. It is also the zone with the most concentrated distribution of insomniac populations (see Figure 4b). The mixed functional zone adjacent to the leisure functional zone is mainly distributed in the inner suburban area and the outer suburban area (see Figure 4a). This area is located in the outermost part of the city and has the sparsest distribution of insomniac populations.

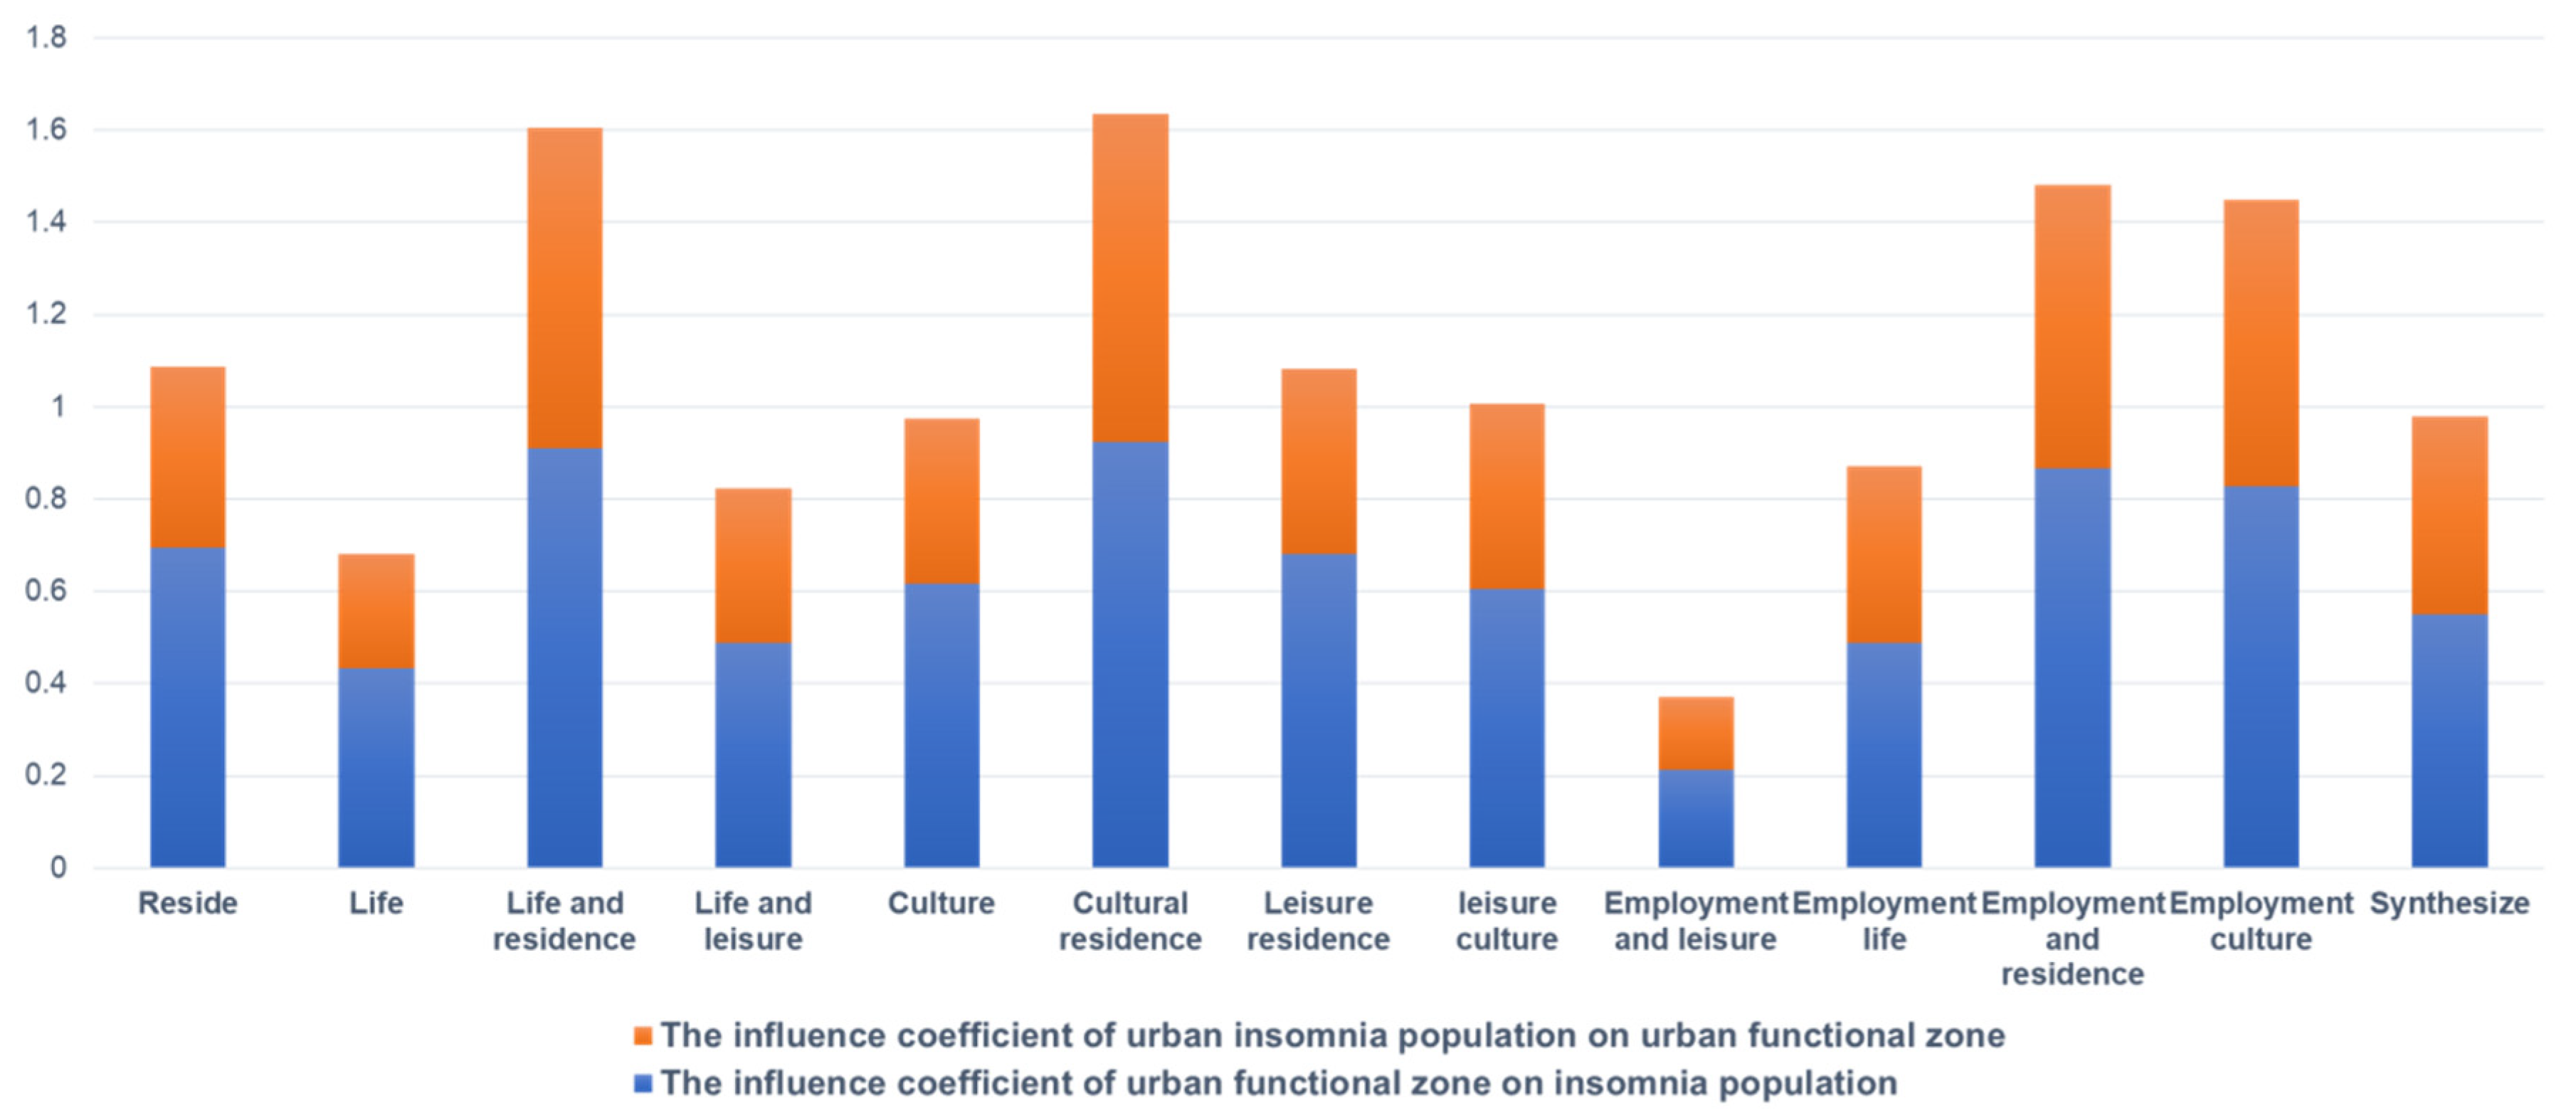
3.2. Proximity Analysis between Insomnia Cases and Functional Zones

We found the highest quantity of insomniacs in the employment mixed functional zone and the living mixed functional zone from the data of insomniac population distribution in Beijing (see Figure 5). The quantity of insomniacs reached more than 3500. The distribution of the insomniac population tends to be consistent with the distribution of these two categories of mixed functional zones, showing a general trend of decreasing from the central city area to the surrounding area. This finding also supports the results of Labaran et al. [39]. A study from the United States examined associations between stress and work hours with sleep duration and insomnia symptoms among U.S.-born and foreign-born Black adults. The results showed that stress and longer working hours were associated with shorter sleep duration and insomnia symptoms. However, the quantity and distribution of insomniac populations in residential mixed functional zones and cultural mixed functional zones were relatively small. The leisure mixed functional zone had the fewest insomniacs. It is mainly located in the inner and outer suburban areas, with a low distribution of insomniac populations. This situation may be related to the fact that leisure category functional facilities are mainly located in the periphery of the city.
The urban functional zones and urban residents’ insomnia showed a domain relationship. When a certain functional zone is closer to the distribution of insomnia, the adjacent mixed functional zones tend to be closer to the distribution of insomnia (see Figure 6). Each entry represents a specific functional zone, such as residential, cultural, leisure, and employment areas, and their relevance to the distribution of people with insomnia. A positive value of a coefficient indicates that the functional zones are positively correlated with the distribution of insomnia, that is, some functional zones may increase the risk of insomnia. A negative value indicates a negative correlation, suggesting that these areas may help reduce insomnia. The “synthesis” entry may represent a mixture of multiple functional zones, with coefficients showing the combined effect of this complexity on insomnia. The employment functional zone has the highest correlation with residents’ insomnia. The functional zones adjacent to the employment function zones include the mixed function zones of employment and culture, the mixed function zones of employment and residence, the mixed function zones of employment and leisure, and the mixed function zones of employment and life. A distinctive feature of these mixed functional zones is that they are geographically adjacent to employment functional zones. The distribution of the insomniac population within the functional zone is also more, and the correlation with residents’ insomnia is also higher. The residential functional zone and leisure functional zone have low correlations with residents’ insomnia. The functional zones adjacent to residential functional zones and leisure functional zones include residential life function zones, residential culture function zones, residential leisure function zones, leisure culture function zones, and leisure life function zone. The distribution of the insomniac population within the functional zone is also less, and the correlation with residents’ insomnia is also lower. This domain relationship also shows that the urban functional zone in the central urban area has a higher degree of overlap with the distribution of the insomniac population. However, the urban functional zones in inner and outer suburbs have a low overlap with the distribution of insomniac populations. Therefore, an important way to improve residents’ sleep health is strengthening the construction and improvement of functional facilities in the central city and exploring the optimal spatial layout.

3.3. The Global Impacts of Functional Facilities on Insomnia

Among the microscopic indicators, CS, IB, TD, SE, CS accounted for the highest proportions at distance thresholds of 2000 m, 1500 m, 1000 m and 500 m, but the quantity of these four functional facilities did not change significantly with the increase in range (see Figure 7). As the distance increases within this distance threshold, the quantity of functional facilities in the SS category increases, while the quantity of functional facilities in the TA category decreases. It is worth noting that AS does not change with the increase in distance within this range threshold, and always maintains the same proportion.
The relationship between urban functional facilities and insomnia at different distance thresholds was estimated by an OLS model based on the percentage of urban functional facilities within 2000 m, 1500 m, 1000 m, and 500 m distance thresholds in the micrometrics (Table 1). Each variable in the table was assessed for its statistical association with resident insomnia, with an asterisk indicating the level of statistical significance: *** p < 0.001, ** p < 0.01, * p < 0.05.
TD: The positive association between transportation facilities and insomnia was significant at all distance thresholds, and the association weakened with increasing distance.
TA: Within 500 m, the positive correlation between administrative facilities and insomnia is significant, but with increased distance, the correlation decreases and even becomes negative.
CF: Commercial facilities were significantly positively associated with insomnia over the 500 m range, but the association faded with increasing distance.
SS: School facilities showed a significant negative association with insomnia, and the association decreased with the increase of distance.
F&IS: The negative association between financial and insurance service facilities and insomnia increased with distance.
SE&CS: The positive association between social services and cultural facilities and insomnia was significant at all distance thresholds, and the association weakened slightly with increasing distance.
CR: The positive correlation between leisure facilities and insomnia decreased with the increase of distance.
S&LS: The positive association between sports and recreation facilities and insomnia was significant in the 500 m and 1000 m ranges, but the association weakened with increasing distance.
MCS: The positive association between medical and community services facilities and insomnia was significant at all distance thresholds.
GA&SO: The negative association between government and social services facilities and insomnia was significant within the 500 m and 1000 m ranges, but the association weakened with increasing distance.
AS: The relationship between agricultural service facilities and insomnia was significantly positive within 500 m, but the correlation became negative or insignificant as the distance increases.
CS: The association between community service facilities and insomnia was not significant at any distance threshold.
These results suggest that there is spatial heterogeneity in the effects of different types of urban functional facilities on residents’ insomnia, and that the effects of some facilities may weaken or change direction with increasing distance. For example, SE&CS were negatively associated with insomnia at all distance thresholds, which may be related to the generally quieter, sleep-conducive environment of school zones. The positive correlation of TD may reflect the interference of traffic noise and activities on sleep quality. The regression coefficients of CS and IB within the 1500 m and 2000 m distance thresholds were equal to or close to zero. This indicated that CS and IB have both positive and negative effects on residents’ insomnia within the corresponding distance thresholds (see Figure 7c,d). Therefore it is highly likely that there is strong spatial heterogeneity [40].
Within the 500 m distance threshold, the greatest impact on residents’ insomnia is TD, CF, SS, SE&CS, CR, and MCS (see Figure 7a); within the 1000 m distance threshold, the greatest impact on residents’ insomnia is TD, SE&CS, CR, MCS, GA&SO, S&LS, and F&IS (see Figure 7b); within the 1500 m distance threshold, the greatest impact on residents’ insomnia is TD, SE&CS, S&LS, F&IS, MCS, and CR (see Figure 7c); and within the 2000 m distance threshold, the greatest impact on residents’ insomnia is TD, SE&CS, S&LS, F&IS, CR, MCS, an TA (see Figure 7d). In summary, TD, SE&CS, CR, and MCS had the greatest effect on residents’ insomnia within the four distance thresholds of 500 m, 1000 m, 1500 m, and 2000 m.

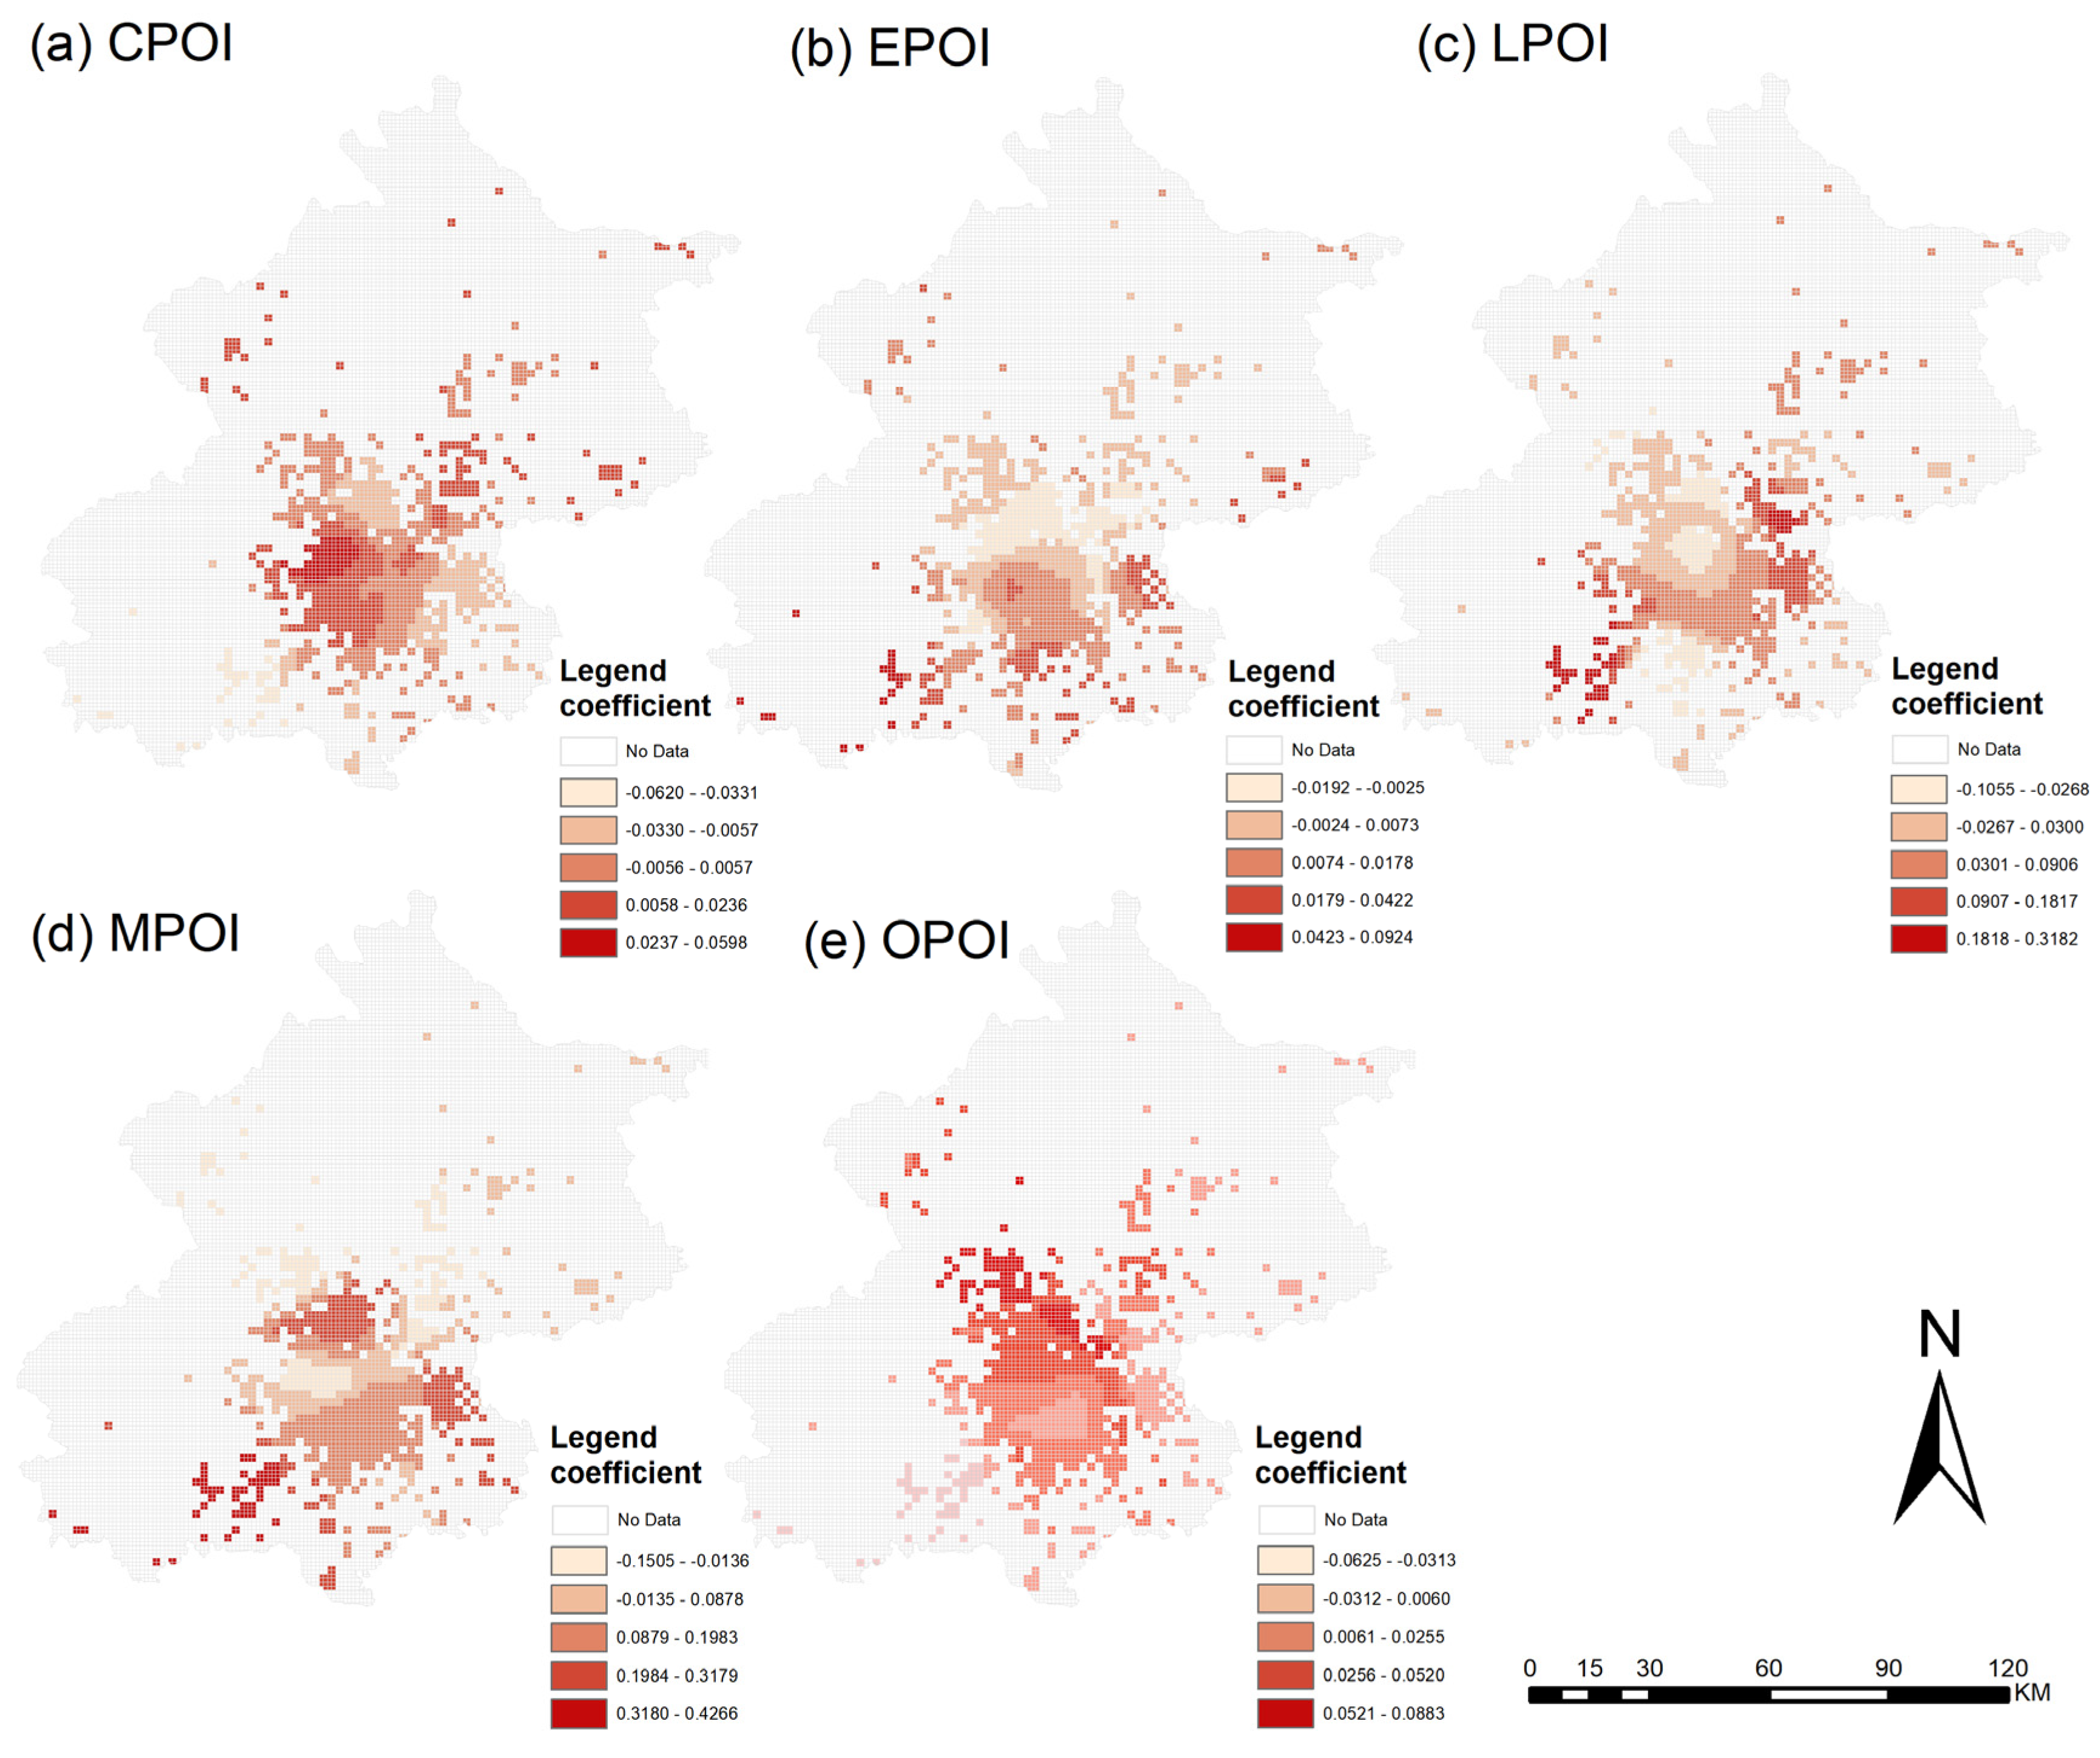
3.4. The Local Impacts of Functional Categories on Insomnia

The OLS model results showed that some of the factors have strong covariance and must be removed or combined to deal with. We combined POIs with similar categories and functions into five categories: consumer city function (CPOIs), employment city function (EPOIs), leisure city function (LPOIs), medical city function (MPOIs), and other categories of city function (OPOIs). Finally, the geographical weighted regression (GWR) model was used to explore the spatial heterogeneity of the effects of urban functional categories on residents’ insomnia.
The urban functions of Beijing are mainly distributed in the central area of the city and spread to the inner suburbs (see Figure 8). This is consistent with the distribution of people with insomnia. However, the specific location of urban functional distribution varied with different categories, and the impact on residents’ insomnia gradually weakened from the center to the periphery. The consumer urban function was mainly distributed in the west side of the central city in the districts of Haidian, Xicheng, Shijingshan, and Fengtai. This is also the area with the densest distribution of insomniac populations, where a large quantity of catering services, companies, transportation facilities, scientific, educational, and cultural facilities are gathered (see Figure 8a). These categories of facilities are also the urban facilities with the highest percentage at the 0–2000 m distance threshold. The results show that the consumer urban function has a higher synergistic locational quotient with the insomniac population and tends to be distributed close to the insomniac population. The employment urban function is mainly concentrated in the southeast of the central urban zone in the districts of Tongzhou, Daxing, and Fangshan (see Figure 8b). These are suburban areas within the city, where the distribution of insomniac populations is relatively scattered. The leisure urban function is mainly concentrated in the northeast and southwest of the central city in the districts of Shunyi, Tongzhou, Fangshan, and Fengtai, where there are many tourist attractions, public facilities, and sports and leisure services (see Figure 8c). The medical urban function is mainly concentrated in the north, east, and southwest of the central urban zone in the districts of Changping, Haidian, Tongzhou, Daxing, and Fangshan (see Figure 8d). The other categories of urban functions are mainly concentrated in the north of the central urban zone, mainly in the districts of Fengtai, Shijingshan, Dongcheng, Xicheng, Haidian, Chaoyang, Changping, and Shunyi (see Figure 8e).
The insomniac population is concentrated in the central city areas from the perspective of administrative regions. The distribution of consumer urban function has the highest coincidence with the insomniac population and tends to be close to the insomniac population distribution (see Figure 8a). We have classified some other categories of urban functional facilities into a separate category due to the complexity and diversity of urban functional facilities.

4. Discussion

4.1. New Findings and Advantages

The purpose of this research was to explore the influences of urban functional structure and distribution on insomnia in Beijing by using multi-source big data. In Section 2, we define urban functional zones and use global co-locators (GCLQS) to measure the degree of association between different urban spatial functional structures and residents’ insomnia. This approach allows us to identify urban functional zones that are closely related to the distribution of people with insomnia. For example, we found that cultural and residential mixed-function areas were highly concentrated in inner-city areas, which is consistent with the distribution pattern of people with insomnia (see Section 3 results). Furthermore, we used ordinary least squares (OLS) and geographical weighted regression (GWR) models to analyze the effects of urban functional facilities on residents’ insomnia. The OLS model provides us with the relationship between urban functional facilities and insomnia at the macrolevel, while the GWR model reveals the local spatial heterogeneity of this relationship. The application of these methods allows us to more precisely identify key urban functional zones that affect residents’ insomnia and understand their spatial distribution characteristics.
The statistical results described in Section 3 show that the positive associations between transportation facilities (TD), commercial facilities (CFs), and social services and cultural facilities (SE&CSs) and resident insomnia were significant across all distance thresholds. This suggests that these functional zones may have a negative impact on residents’ sleep quality by increasing nighttime activity and noise levels. In particular, the impact of transportation facilities decreases with increasing distance, highlighting the direct impact of proximity to urban functional facilities on residents’ insomnia. On the other hand, the negative association between school facilities (SS) and insomnia suggests that educational areas may provide residents with a quieter living environment and help improve sleep quality. The negative association between financial and insurance service facilities (F&IS) and insomnia increased with distance, which may be related to the concentrated distribution of these facilities in downtown areas, which may have an indirect impact on residents’ sleep due to factors such as work stress.
Previous studies have neglected the impact of urban functional structure and layout on sleep, and the current studies mainly focus on small sleeping spaces and living environments [41,42]. A cross-sectional study from South Korea [43] found that more comprehensive exposure to environmental pollution had a worse impact on health outcomes, including sleep quality. This is also consistent with previous studies that found that exposure to a greater area of green environment can protect sleep health from the side effects of air pollutants. Perez-Crespo et al. found that adolescents living in zones with high exposure to outdoor residential noise may have had impaired sleep during childhood [44]. Therefore, it is meaningful to rationally plan the construction of urban functional facilities in the distribution zone of the insomniac population to improve the sleep health status of residents.
This study highlights the relationship between internal urban functional structure and resident insomnia. The influence of the quantity, category, and spatial layout of urban functional facilities on the insomnia of residents is proposed. This provides preliminary insights into urban planning and functional location based on improving the sleep health of urban residents [45]. Our study found that the insomniac population is mainly distributed in the central urban zone, which is also closely related to the distribution of the resident population in Beijing. However, there are differences in the distribution areas of different categories of urban functional facilities and their effects on residents’ insomnia. The proportion of catering services, incorporated business, traffic device and scientific, educational and cultural services within the distance threshold of 0–2000 m is the highest. The quantity of shopping service facilities increases with distance within this distance threshold, while the quantity of scenic beauty facilities decreases. The research shows that consumer city function (CPOI) is mainly distributed on the west side of the central urban zone, mainly in the districts of Haidian, Xicheng, Shijingshan and Fengtai, which is most consistent with the distribution of insomniac population. According to the functional zone identification method, it is divided into different categories of functional zones by the frequency density of POI in the unit. The study found that the residential mixed functional zones have the highest degree of connection with the distribution of insomniac population and tend to be close to the distribution of insomniac populations. The employment mixed functional zones have the lowest degree of connection with the distribution of insomniac populations, and tend to be far away from the distribution of insomniac populations [46]. It is necessary to improve the insomnia condition of Beijing residents by taking the central city area as the main planning area and reasonably planning the spatial layout of different functional zones [47].
Our research is the first to explore the relationship between urban spatial structure and resident insomnia in Beijing. Compared with previous studies, this study has two advantages. On the one hand, point-of-interest (POI) data are more granular than traditional land resource use data and can provide more useful information [48]. Functional zone identification methods and synergistic location quotients measure the relationship between different urban spatial functional structures and urban residents’ insomnia. The OLS and GWR methods are used to explore the spatial heterogeneity of the effects of various urban functional structures on urban residents’ insomnia [49,50]. On the other hand, the study of insomnia-related problems from the spatial perspective provides a new research perspective for the treatment and prevention of insomnia [51,52]. The problem of sleep health is increasing with the continuous migration and spread of human settlements [53] and the emergence of megacities. According to the correlation between the quantity, category, and spatial layout of urban functional facilities and residents’ insomnia, optimal urban spatial functional location can be explored.

4.2. Planning Implications and Limitations

Although previous studies have examined the impact of insomnia on physical health, limited attention has been given to the effect of urban spatial structure on residents’ insomnia. This study has examined the connection between the quantity, category and layout of urban functional facilities and residents’ insomnia in Beijing using multi-source big data. It also has the following implications for exploring the optimal layout of urban spatial functional structure for rational urban planning and management.
According to the research results, the synergistic location quotient between leisure mixed functional zones and residents with insomnia is low, and tends to be far away from the distribution of insomniac populations. Therefore, it can play a role in reducing insomnia by providing accessible health leisure facilities in urban planning and management [46]. Moreover, it is significant to improve the service range of leisure functional zones for residents’ sleep health. At the same time, this study found that the relationship between urban residents’ insomnia and urban functional facilities, the highest percentage of catering services, incorporated business, traffic device and scientific, educational and cultural services were found within the 0–2000 m distance threshold. These facilities are closely related to people’s daily life and economic education factors. It is meaningful to reasonably plan the quantity and layout of these functional facilities to improve the sleep condition of residents.
This study also has some limitations. Firstly, we further compared the frequency density of POI within functional zone units to explore the domain relationship under functional partitioning by functional zone identification method. Some data-free areas exist in the outer suburban areas due to the lowest quantity and density of insomniac population distribution. Secondly, cities are usually divided into single and mixed zones when defining functional zones, and are judged based on whether the density of each category of data points exceeds 50%. However, there is a certain error in the division of functional zones due to the complex and diverse functional structure of the city. Thirdly, the lack of obvious changes in the quantity of certain urban features with increasing distance lacks significant implications for exploring the relationship with insomnia in urban residents.

5. Conclusions

This study analyzes the relationship between the number and type of urban functional structure and layout and residents’ insomnia from the perspective of urban space. We classify different urban functional zones by dividing the study area into multiple spatial grid cells and exploring the number and weight distribution of different classes of POI on each grid cell. The synergistic locational quotient (SLQ) was used to calculate the degree of correlation between different functional zones and insomniac populations. Then, we used ordinary least squares (OLS) and geographically weighted regression (GWR) models to explore the spatial heterogeneity of the effects of the number and type of urban functions on residents’ insomnia.
The statistical results show that consumer urban functions have the most significant impact on residents’ insomnia. In particular, residential functional zones had the strongest association with the incidence of insomnia, while employment and leisure functional zones had the weakest association. The R-squared value of the OLS model is 0.72, which indicates that the model has high explanatory power. The analysis of the GWR model further revealed the spatial variability of the influencing factors, in which the coefficient of consumer urban function was statistically significant, and the impact on insomnia was different in different regions.
Based on these findings, we propose improving the sleep quality of Beijing residents by optimizing the functional layout of urban space. However, we also recognize that there may be differences in the functional structure of cities and impacts at different municipal levels. Therefore, we recommend that more studies be conducted in different regions to precisely determine the specific effects of various functional structures on residents’ insomnia. As the evidence accumulates, we will be able to generalize conclusions from one region to others with greater confidence.

Author Contributions

Conceptualization, L.X. and Y.L.; methodology, S.C.; software, J.X.; validation, L.X. and Y.L.; formal analysis, S.C.; investigation, S.C. and J.X.; resources, L.X.; data curation, Y.L.; writing—original draft preparation, S.C.; writing—review and editing, L.X. and Y.L.; visualization, S.C. and J.X.; supervision, L.X. and Y.L.; project administration, L.X.; funding acquisition, L.X. and Y.L. All authors have read and agreed to the published version of the manuscript.

Funding

This study was supported by the National Natural Science Foundation of China (42301330) and the Guangzhou Philosophy and Social Science Planning Project (2023GZQN60).

Data Availability Statement

The data are available from the corresponding author upon reasonable request.

Acknowledgments

The authors would like to give sincere thanks to all the research participants. The authors also wish to express their appreciation to the editors and reviewers for their insightful comments and suggestions.

Conflicts of Interest

The authors declare no conflicts of interest.

References

  1. Ghose, S.M.; Dzierzewski, J.M.; Dautovich, N.D. Sleep and self-efficacy: The role of domain specificity in predicting sleep health. Sleep Health 2023, 9, 190–195. [Google Scholar] [CrossRef] [PubMed]
  2. Li, C.; Ma, C.; Wu, H.; Zhao, M.; Zhu, D.; Xi, B. Sleep duration change from childhood to adulthood and adult depressive disorders in the Chinese population. Sleep Med. 2022, 100, 128–132. [Google Scholar] [CrossRef] [PubMed]
  3. Zhao, K.; Zhang, J.; Wu, Z.; Shen, X.; Tong, S.; Li, S. The relationship between insomnia symptoms and school performance among 4966 adolescents in Shanghai, China. Sleep Health 2019, 5, 273–279. [Google Scholar] [CrossRef] [PubMed]
  4. Rauchs, G.; Orban, P.; Schmidt, C.; Albouy, G.; Balteau, E.; Degueldre, C.; Schnackers, C.; Sterpenich, V.; Tinguely, G.; Luxen, A.; et al. Sleep modulates the neural substrates of both spatial and contextual memory consolidation. PLoS ONE 2008, 3, e2949. [Google Scholar] [CrossRef] [PubMed]
  5. Hein, M.; Lanquart, J.P.; Loas, G.; Hubain, P.; Linkowski, P. Objective sleep alterations and long-term use of short or intermediate half-life benzodiazepine receptor agonists are risk factors for high blood pressure in individuals with insomnia: A study in 1272 individuals referred for sleep examinations. Sleep Med. 2019, 53, 115–123. [Google Scholar] [CrossRef]
  6. Gilliland, J. Examining the impact of exposure to natural built environments on children’s sleep duration. Sleep Med. 2022, 100, S17. [Google Scholar] [CrossRef]
  7. Xu, X.; Lian, Z. Optimizing bedroom thermal environment: A review of human body temperature, sleeping thermal comfort and sleep quality. Energy Built Environ. 2024, 5, 829–839. [Google Scholar] [CrossRef]
  8. Gabinet, N.M.; Portnov, B.A. Investigating the combined effect of ALAN and noise on sleep by simultaneous real-time monitoring using low-cost smartphone devices. Environ. Res. 2022, 214 Pt 2, 113941. [Google Scholar] [CrossRef]
  9. Falch-Madsen, J.; Wichstrom, L.; Pallesen, S.; Ranum, B.M.; Steinsbekk, S. Child and family predictors of insomnia from early childhood to adolescence. Sleep Med. 2021, 87, 220–226. [Google Scholar] [CrossRef]
  10. Hsieh, Y.P.; Lu, W.H.; Yen, C.F. Psychosocial Determinants of Insomnia in Adolescents: Roles of Mental Health, Behavioral Health, and Social Environment. Front. Neurosci. 2019, 13, 848. [Google Scholar] [CrossRef]
  11. Nam, S.; Whittemore, R.; Jung, S.; Latkin, C.; Kershaw, T.; Redeker, N.S. Physical neighborhood and social environment, beliefs about sleep, sleep hygiene behaviors, and sleep quality among African Americans. Sleep Health 2018, 4, 258–264. [Google Scholar] [CrossRef] [PubMed]
  12. Wogan, R.; Enrique, A.; Adegoke, A.; Earley, C.; Sollesse, S.; Gale, S.; Chellingsworth, M.; Richards, D. Internet-delivered CBT intervention (Space for Sleep) for insomnia in a routine care setting: Results from an open pilot study. Internet Interv. 2021, 26, 100443. [Google Scholar] [CrossRef] [PubMed]
  13. Chaudhary, N.S.; Kampman, K.M.; Kranzler, H.R.; Grandner, M.A.; Debbarma, S.; Chakravorty, S. Insomnia in alcohol dependent subjects is associated with greater psychosocial problem severity. Addict. Behav. 2015, 50, 165–172. [Google Scholar] [CrossRef] [PubMed]
  14. Chaudhary, N.S.; Wong, M.M.; Kolla, B.P.; Kampman, K.M.; Chakravorty, S. The relationship between insomnia and the intensity of drinking in treatment-seeking individuals with alcohol dependence. Drug Alcohol Depend. 2020, 215, 108189. [Google Scholar] [CrossRef] [PubMed]
  15. Mayne, S.L.; Mitchell, J.A.; Virudachalam, S.; Fiks, A.G.; Williamson, A.A. Neighborhood environments and sleep among children and adolescents: A systematic review. Sleep Med. Rev. 2021, 57, 101465. [Google Scholar] [CrossRef]
  16. Sarzetto, A.; Bosia, M.; Pasqualoni, E.; Travaini, G. Eyes wide open: A systematic review of the association between insomnia and aggression in forensic contexts. Int. J. Law Psychiatry 2021, 78, 101734. [Google Scholar] [CrossRef]
  17. Spano, G.; D’Este, M.; Giannico, V.; Elia, M.; Cassibba, R.; Lafortezza, R.; Sanesi, G. Association between indoor-outdoor green features and psychological health during the COVID-19 lockdown in Italy: A cross-sectional nationwide study. Urban For. Urban Green. 2021, 62, 127156. [Google Scholar] [CrossRef]
  18. Bell, I.H.; Nicholas, J.; Broomhall, A.; Bailey, E.; Bendall, S.; Boland, A.; Robinson, J.; Adams, S.; McGorry, P.; Thompson, A. The impact of COVID-19 on youth mental health: A mixed methods survey. Psychiatry Res. 2023, 321, 115082. [Google Scholar] [CrossRef]
  19. Dyer, W.J.; Crandall, A.; Hanson, C.L. COVID-19 Stress, Religious Affiliation, and Mental Health Outcomes Among Adolescents. J. Adolesc. Health 2023, 72, 892–898. [Google Scholar] [CrossRef]
  20. Johnson, B.S.; Malecki, K.M.; Peppard, P.E.; Beyer, K.M. Exposure to neighborhood green space and sleep: Evidence from the Survey of the Health of Wisconsin. Sleep Health 2018, 4, 413–419. [Google Scholar] [CrossRef]
  21. Wang, T.; Li, J.; Wang, Y.; Dai, S.; Shao, R.; Hao, L. Active interventions of dynamic lighting on human circadian rhythm and sleep quality in confined spaces. Build. Environ. 2022, 226, 109766. [Google Scholar] [CrossRef]
  22. Xie, Y.; Xiang, H.; Di, N.; Mao, Z.; Hou, J.; Liu, X.; Huo, W.; Yang, B.; Dong, G.; Wang, C.; et al. Association between residential greenness and sleep quality in Chinese rural population. Environ. Int. 2020, 145, 106100. [Google Scholar] [CrossRef] [PubMed]
  23. Lin, J.; Kong, Y.; Zhong, L. Optimization of environment control system for narrow sleeping space in underground shelters. Energy Build. 2022, 263, 112043. [Google Scholar] [CrossRef]
  24. Baek, S.-U.; Yoon, J.-H.; Won, J.-U. Mediating Effect of Work–Family Conflict on the Relationship Between Long Commuting Time and Workers’ Anxiety and Insomnia. Saf. Health Work 2023, 14, 100–106. [Google Scholar] [CrossRef] [PubMed]
  25. Liu, Y.; Luo, Q.; Shen, H.; Zhuang, S.; Xu, C.; Dong, Y.; Sun, Y.; Wang, S.; Deng, H. Social Media Big Data-Based Research on the Influencing Factors of Insomnia and Spatiotemporal Evolution. IEEE Access 2020, 8, 41516–41529. [Google Scholar] [CrossRef]
  26. Wu, C.; Ye, X.; Ren, F.; Du, Q. Check-in behaviour and spatio-temporal vibrancy: An exploratory analysis in Shenzhen, China. Cities 2018, 77, 104–116. [Google Scholar] [CrossRef]
  27. Wang, C.; Zhan, J.; Wang, H.; Yang, Z.; Chu, X.; Liu, W.; Teng, Y.; Liu, H.; Wang, Y. Multi-group analysis on the mechanism of residents’ low-carbon behaviors in Beijing, China. Technol. Forecast. Social. Chang. 2022, 183, 121956. [Google Scholar] [CrossRef]
  28. Sato, S.; Liu, Y.; Ikeda, A.; Filomeno, R.; Suzuki, Y.; Maruyama, K.; Tomooka, K.; Wada, H.; Koyama, Y.; Tanigawa, T. Work-family conflict and insomnia symptoms among women working in aged care services in Japan. Sleep Med. 2021, 82, 155–158. [Google Scholar] [CrossRef]
  29. Alfred, R.; Chen, Z.; Eboy, O.V.; Luxuan, Z.; Renjie, L. Analyzing trends in the spatial-temporal visitation patterns of mainland Chinese tourists in Sabah, Malaysia based on Weibo social big data. Heliyon 2023, 9, e15526. [Google Scholar] [CrossRef]
  30. Gan, M.; Ma, Y. Mapping user interest into hyper-spherical space: A novel POI recommendation method. Inf. Process. Manag. 2023, 60, 103169. [Google Scholar] [CrossRef]
  31. Ma, C.-X.; Peng, F.-L. Evaluation of spatial performance and supply-demand ratios of urban underground space based on POI data: A case study of Shanghai. Tunn. Undergr. Space Technol. 2023, 131, 104775. [Google Scholar] [CrossRef]
  32. Tian, X.; Yu, G.; He, F. An analysis of sleep complaints on Sina Weibo. Comput. Hum. Behav. 2016, 62, 230–235. [Google Scholar] [CrossRef]
  33. Kumakoshi, Y.; Koizumi, H.; Yoshimura, Y. Diversity and density of urban functions in station areas. Comput. Environ. Urban Syst. 2021, 89, 101679. [Google Scholar] [CrossRef]
  34. Wei, C.; Meng, J.; Zhu, L.; Han, Z. Assessing progress towards sustainable development goals for Chinese urban land use: A new cloud model approach. J. Environ. Manag. 2023, 326 Pt B, 116826. [Google Scholar] [CrossRef] [PubMed]
  35. Zhu, L. Analysis and Research on the Change of Urban functional zone Based on POI Data. Geomat. Spat. Inf. Technol. 2024, 47, 186–189. [Google Scholar] [CrossRef]
  36. Leslie, T.F.; Kronenfeld, B.J. The Colocation Quotient: A New Measure of Spatial Association Between Categorical Subsets of Points. Geogr. Anal. 2011, 43, 306–326. [Google Scholar] [CrossRef]
  37. Carvalho, C.; Nechio, F.; Tristão, T. Taylor rule estimation by OLS. J. Monet. Econ. 2021, 124, 140–154. [Google Scholar] [CrossRef]
  38. He, Q.; Zhang, Y. Residential locations and residential moves between the city centre and suburb in Beijing, China. Habitat Int. 2023, 131, 102711. [Google Scholar] [CrossRef]
  39. Labaran, R.S.; Johnson, S.; Johnson, D.A. The association of stress and work hours with sleep duration and insomnia symptoms among U.S.-born and Foreign-born Black adults. Sleep Health 2023, 9, 56–63. [Google Scholar] [CrossRef]
  40. Dong, Y.-H.; Peng, F.-L.; Li, H.; Men, Y.-Q. Spatial autocorrelation and spatial heterogeneity of underground parking space development in Chinese megacities based on multisource open data. Appl. Geogr. 2023, 153, 102897. [Google Scholar] [CrossRef]
  41. Kayaba, M.; Ihara, T.; Kusaka, H.; Iizuka, S.; Miyamoto, K.; Honda, Y. Association between sleep and residential environments in the summertime in Japan. Sleep Med. 2014, 15, 556–564. [Google Scholar] [CrossRef] [PubMed]
  42. Perez-Crespo, L.; Essers, E.; Foraster, M.; Ambros, A.; Tiemeier, H.; Guxens, M. Outdoor residential noise exposure and sleep in preadolescents from two European birth cohorts. Environ. Res. 2023, 225, 115502. [Google Scholar] [CrossRef] [PubMed]
  43. Ju, Y.J.; Lee, J.E.; Choi, D.W.; Han, K.T.; Lee, S.Y. Association between perceived environmental pollution and poor sleep quality: Results from nationwide general population sample of 162,797 people. Sleep Med. 2021, 80, 236–243. [Google Scholar] [CrossRef] [PubMed]
  44. Liu, F.; Zhou, F.; Zhang, K.; Wu, T.; Pan, M.; Wang, X.; Tong, J.; Chen, Z.; Xiang, H. Effects of air pollution and residential greenness on sleep disorder: A 8-year nationwide cohort study. Environ. Res. 2023, 220, 115177. [Google Scholar] [CrossRef] [PubMed]
  45. Kallawicha, K.; Boonvisut, S.; Chao, H.J.; Nitmetawong, T. Bedroom environment and sleep quality of apartment building residents in urban Bangkok. Build. Environ. 2020, 188, 107474. [Google Scholar] [CrossRef]
  46. Zhou, N. Research on urban spatial structure based on the dual constraints of geographic environment and POI big data. J. King Saud Univ. Sci. 2022, 34, 101887. [Google Scholar] [CrossRef]
  47. Liu, Y.; Wang, X.; Sun, P.; Zhang, Q.; Zhang, C.; Shen, Y.; Wang, S.; Ma, J.; Wang, G. Sleep disturbance and anxiety symptom among public during the second wave of COVID-19 in Beijing: A web-based cross-sectional survey. J. Affect. Disord. 2022, 298 Pt A, 80–85. [Google Scholar] [CrossRef]
  48. Wang, K.; Yuan, Y.; Chen, M.; Wang, D. A POIs based method for determining spatial distribution of urban fire risk. Process Saf. Environ. Prot. 2021, 154, 447–457. [Google Scholar] [CrossRef]
  49. Zhu, C.; Zhang, X.; Zhou, M.; He, S.; Gan, M.; Yang, L.; Wang, K. Impacts of urbanization and landscape pattern on habitat quality using OLS and GWR models in Hangzhou, China. Ecol. Indic. 2020, 117, 106654. [Google Scholar] [CrossRef]
  50. Huang, R.; Wu, W.; Yu, K. Building consistent time series night-time light data from average DMSP/OLS images for indicating human activities in a large-scale oceanic area. Int. J. Appl. Earth Obs. Geoinf. 2022, 114, 103023. [Google Scholar] [CrossRef]
  51. Chan, N.Y.; Li, S.X.; Zhang, J.; Lam, S.P.; Yu, M.M.W.; Kwok, P.L.; Li, A.M.; Morin, C.M.; Wing, Y.K. Can we prevent insomnia?A brief cognitive behavioral therapy in at-risk adolescents. Sleep Med. 2019, 64, S61. [Google Scholar] [CrossRef]
  52. Cronlein, T.; Wetter, T.C.; Rupprecht, R.; Spiegelhalder, K. Cognitive behavioral treatment for insomnia is equally effective in insomnia patients with objective short and normal sleep duration. Sleep Med. 2020, 66, 271–275. [Google Scholar] [CrossRef] [PubMed]
  53. Büttner-Teleaga, A.D. Migration, mental health and sleep. Sleep Med. 2022, 100, S49–S50. [Google Scholar] [CrossRef]
Figure 1. Research framework.
Urbansci 08 00137 g001
Figure 2. Overview of the study area.
Urbansci 08 00137 g002
Figure 3. Total quantity of POIs in each category.
Urbansci 08 00137 g003
Figure 4. Distribution of urban functional zones in Beijing.
Urbansci 08 00137 g004
Figure 5. Quantity of insomniac populations in urban functional zones.
Urbansci 08 00137 g005
Figure 6. Correlation graph between insomniac populations and urban functional zones in Beijing.
Urbansci 08 00137 g006
Figure 7. Quantity of urban facilities within distance thresholds of 500 m, 1000 m, 1500 m, and 2000 m in Beijing.
Urbansci 08 00137 g007
Figure 8. Spatial distributions of the variables in Beijing.
Urbansci 08 00137 g008
Table 1. Relationship between urban functional facilities and residents’ insomnia within different distance thresholds.
500 m1000 m1500 m2000 m
TD0.177 ***0.031 ***0.016 ***0.010 ***
TA0.088 0.010 −0.004 −0.019 *
CF0.206 **−0.004 −0.006 −0.004
IB0.001 0.004 0.001 0.000
SS−0.479 **0.021 0.048 0.035
F&IS−0.019 −0.042 *−0.032 ***−0.024 ***
SE&CS0.071 **0.033 ***0.019 ***0.012 ***
CR0.152 **0.077 ***0.026 **0.015 **
S&LS0.072 0.059 *0.035 ***0.025 ***
MCS0.165 **0.061 **0.048 ***0.026 **
GA&SO−0.007 −0.020 **−0.014−0.006
AS2.617 −0.742 −0.386 0.025
CS−0.018 −0.002 0.000 0.000
R20.575 0.704 0.760 0.767
*** p < 0.001, ** p < 0.01, * p < 0.05.
Disclaimer/Publisher’s Note: The statements, opinions and data contained in all publications are solely those of the individual author(s) and contributor(s) and not of MDPI and/or the editor(s). MDPI and/or the editor(s) disclaim responsibility for any injury to people or property resulting from any ideas, methods, instructions or products referred to in the content.

