Article

Geocoding Applications for Enhancing Urban Water Supply Network Analysis

Faculty of Water Science, University of Public Service, 6500 Baja, Hungary
*
Author to whom correspondence should be addressed.
Urban Sci. 2025, 9(2), 51; https://doi.org/10.3390/urbansci9020051
Submission received: 23 January 2025 / Revised: 8 February 2025 / Accepted: 17 February 2025 / Published: 18 February 2025

Abstract

:
Geospatial tools and geocoding systems play an increasingly significant role in the modernization and operation of municipal water utility networks. This research explored how geocoding systems could improve network management, facilitate leak detection, and enhance hydraulic modeling accuracy. Various geocoding services, including Google, Bing Maps, and OpenStreetMap APIs were analyzed using address data from a small Central European municipality. The analysis was performed in February and March of 2024. The accuracy and efficiency of these systems in handling spatial data for domestic water networks were assessed and results showed that geocoding accuracy depended on the quality of the service provider databases and the formatting of input data. Google proved the most reliable, while Bing and OpenStreetMap were less accurate. Additionally, the Location Database developed by Lechner Knowledge Center was used as a reliable local reference for comparison with global services. Geocoding results were integrated into GIS softwares (Google Earth ver. 7.3.6.9796, QGIS ver. 3.36, ArcGIS ver 10.8.2) to enable spatial analysis and comparison of geographic coordinates. The findings highlight geocoding’s critical role in efficient water network management, particularly for mapping consumer data and rapidly localizing leaks and breaks. Our findings directly support hydraulic modeling tasks, contributing to sustainable operations and cost-effective interventions.

1. Introduction

Effective urban water management is essential for the design and operation of water supply systems [1]. Ensuring the performance and sustainability of these networks is crucial to meet the growing water demand of cities [2,3]. A forward-looking strategy includes water reuse, resource conservation, and the promotion of environmentally sound management. At the forefront of sustainability, urban water management needs to use innovative solutions to create a resilient and environmentally responsible future [4]. The condition of water networks often deteriorates over time due to poor maintenance or neglect [5]. Public water supply systems are critical infrastructure and require increased resilience to natural disasters [6], human interference [7], and the effects of ageing [8]. It is essential to maintain high service standards by ensuring a reliable and continuous supply of water that meets the needs of consumers in terms of quality, quantity, and pressure [9].
Accurate hydraulic modeling of municipal water distribution networks necessitates the precise allocation of consumer demand data to corresponding nodes within the network topology [10]. This process is essential for simulating system behavior under various operational scenarios and for effective decision-making in water resource management. A critical initial step involves determining the most accurate method for processing available data, particularly in associating billing information with the hydraulic model’s topology [11,12].
Traditional approaches often face challenges due to the lack of integration between technical management and billing software used in the water utility sector. This absence of connectivity can hinder the extraction and spatial linking of address data for modelling. For instance, the manual assignment of water demands to a hydraulic model is not only time-consuming but also prone to inaccuracies, especially in large-scale networks [13]. The digital water age could help in overcoming challenges faced by traditional approaches due to the lack of integration between technical management and billing software used in the water utility sector [14].
To address the integration challenges, geocoding—the process of converting address data into geographic coordinates—has become an essential tool in hydraulic modeling and water utility management [15]. By spatially associating billing address data with specific nodes in the hydraulic network topology, utilities could achieve greater precision in demand allocation [16]. However, the integration of geocoded data into hydraulic models remains unexplored, particularly in regions where geospatial tools and databases are inconsistently applied. Several studies have demonstrated the importance of geospatial solutions in water network management, including their role in optimizing leak detection [17], improving operational efficiency [18], and enhancing model calibration [19].
Singh (2017) evaluated the geographical inconsistencies and errors in geocoding when using two freely available tools, Google Sheets and ggmap. A sample of 200 restaurant addresses in California was geocoded, and the results were validated applying QGIS, Google Maps, OpenStreetMap (OSM), and Google Earth. While both tools successfully geocoded all addresses, ggmap exhibited notable errors, including eight cases where locations were incorrectly assigned to a position over 2000 miles away due to the presence of an ampersand character in the address data [20]. Chow et al. (2015) systematically examined geographic disparities in positional errors and matching rates among various geocoding solutions. Applying 1100 residential addresses across Texas, USA, eight geocoding platforms, including Google Maps, Bing, OpenStreetMap, and ArcGIS, were evaluated for their accuracy against GPS and manually digitized reference data. The results revealed significant differences in geocoding accuracy between urban and rural areas, as well as varying performances across platforms, with parcel-based geocoding achieving the highest accuracy [21]. These findings emphasize the importance of selecting appropriate geocoding solutions to minimize errors and inform spatial analyses and decision-making processes.
Geocoding applications in water utility management face several challenges, particularly in regions with fragmented or outdated spatial data infrastructure, where research on feasibility and accuracy is limited [22]. Additionally, the integration of geocoded billing data into hydraulic models presents significant technical and operational hurdles, with few methodologies specifically designed for such networks. While the theoretical advantages of geocoding for demand allocation are well-established, empirical evidence on its impact on network performance and management efficiency remains scarce [23].
Despite the advances in digitalization, significant barriers persist; address data in billing systems are often stored in formats unsuitable for geospatial processing, and discrepancies between technical and administrative datasets further complicate integration efforts [24]. Moreover, geocoding accuracy is influenced by the quality of geospatial databases, which could vary significantly regionally [25,26]. Studies on geocoding in water utility networks have typically focused on developed regions with robust spatial data infrastructure [27] leaving a research gap in understanding its applicability in resource-constrained settings.
Our research aimed to address existing gaps by introducing and evaluating existing approaches for associating billing data with hydraulic model nodes using geocoding techniques, but for a less investigated, Central-European geography. We investigated the challenges and opportunities of leveraging geocoding for water utility management, emphasizing the precision of geocoding services, the integration of geocoded data into GIS-based hydraulic models, and their implications for operational decision-making. Specifically, the research objective was to evaluate the accuracy and success rates of various geocoding services by analyzing address data from the selected study site. The process involved geocoding the address data applying multiple services, analyzing the geographic coordinates to determine hit rates and relative accuracy, and assessing the applicability of each service in reconstructing, hydraulically modeling, and optimizing domestic drinking water networks. Based on the findings, we provide recommendations for the role and usability of geocoding services in enhancing the efficiency of water network operations and improving decision-making in water utility management.

2. Materials and Methods

2.1. Data Preparation

Ladánybene is a small municipality in Hungary, characterized by a dispersed rural settlement pattern. The location is in the Northern Hemisphere, at a latitude of 47°02′05″ N and a longitude of 19°27′26″ E. The local water distribution network serves 384 consumer locations, ensuring a reliable water supply to households and small businesses. The network was designed to meet the needs of a predominantly residential community, with low to moderate water demand. The adequate supply of water is ensured from subsurface water sources, specifically from drilled wells. There is a single feed point to the municipal network. To establish the proper pressure conditions, a water tower has been constructed. Despite its relatively small scale, challenges related to data integration and hydraulic modeling are present, particularly in geocoding consumer addresses for precise mapping to the distribution network. Address-based geospatial data are essential for improving operational efficiency and ensuring equitable water distribution across the network.
The basic data, consisting of an address database, were obtained from the local water utility service for use in geocoding-related water utility network modeling activities. It should be noted that we could have worked with any other address database, as manually provided addresses would have been sufficient for testing geocoding services. However, the authors believed this approach could yield more representative results. For the area under investigation, 384 address records were available. Based on previous experience, several reliability and plausibility checks were performed to ensure data quality and improve geocoding accuracy. These included standardizing address formats by replacing abbreviations such as “St.” with “Street” or “Rd.” with “Road,” correcting common typos like changing “Firrst Avenue” to “First Avenue,” and ensuring uniform capitalization and spacing. Duplicate entries were removed, and missing fields, such as city names or postal codes, were inferred or flagged for review. Special characters and unnecessary punctuation, such as “789@ Maple Street,” were eliminated, while concatenated fields like “123 Oak Street, Springfield” were split into separate components. Verifying the validity of addresses against official databases, ensuring consistent formatting for house numbers, further enhanced data reliability. Finally, geo-validation confirmed that geocoded coordinates matched the expected location, ensuring accurate integration into hydraulic models. These measures collectively improved the precision and usability of geocoded data for water utility management.

2.2. Services Applied

2.2.1. Bing Maps [28]

Bing Maps is Microsoft’s mapping service, supported by Bing’s search engine, TomTom, and OpenStreetMap data. To use the geocoding API, registration and an API key are required, offering 10,000 free queries per month. Geocoding can be tested on Bing Maps’ online platform, but bulk data handling and data export are not possible [29]. The API is widely utilized by developers and businesses for location-based services, such as logistics or real estate solutions.

2.2.2. Google Maps [30]

Google, established in 1998, launched its interactive mapping service, Google Maps, in 2005, revolutionizing web-based mapping. Google provides three platforms for geocoding services: Google Earth Pro, Google My Maps, and Google Cloud Platform. Google Earth Pro is easy to install, My Maps only requires a Gmail account, and Cloud Platform necessitates registration for an API key with customizable settings. The API key allows users to make 2000 free daily queries, with additional queries available for a fee, often accompanied by free credit at the start.

2.2.3. OpenStreetMap (OSM) [31]

OpenStreetMap (OSM) is an open-source, community-driven map editing and display system widely used for geocoding and geospatial applications. OSM’s geocoding tool, Nominatim, supports batch geocoding through an API and website [32]. However, its query speed is limited, making it slow for large-scale data processing. OSM relies on data from Wikipedia and its community database, offering extensive global linguistic and address format support, though coverage gaps and inaccuracies may occur. The tool supports reverse geocoding and integrates well with geospatial systems.

2.2.4. Geoapify Location Platform [33]

Geoapify GmbH, a German company, provides a wide range of geospatial technologies, including digital maps, routing, and geodatabases. Its geocoding API, the Geoapify Location Platform, allows 90,000 free queries per month at a rate of 5 queries per second. For larger needs, three paid plans are available. Geoapify also operates a free-to-use website where users can test the service without registration. The platform supports bulk data uploads and export of geocoded location markers.

2.2.5. ArcGIS World Geocoding Service [34]

ArcGIS, developed and maintained by the American company Esri, is a leading solution for geographic information systems (GIS). The World Geocoding Service is accessible via ArcGIS Desktop ArcMap software version 10.8.2, offering global coverage for geocoding addresses, cities, businesses, or landmarks. Results can be stored in tables, shapefiles, or displayed as points on a map. The service is free for up to 20,000 queries for subscribers, with a cost of USD 0.50 per 1000 additional queries. It also supports bulk reverse geocoding.

2.2.6. Lechner Knowledge Center—Location Database [35]

Based in Budapest, the Lechner Knowledge Center handles geospatial tasks for Hungarian public administration, including maintaining state-owned databases and managing land registries. Its offline geocoding service, the Location Database, identifies spatial positions of properties based on cadastral numbers, providing coordinates for parcel centroids but lacking building-level data. The data are derived from property registry documents and cartographic databases, offering accurate and detailed property information.

2.3. Data Processing Workflow

For geocoding, the database must have been prepared for assigning spatial data to the data obtained from the billing system. The geocoding was done using the Google address database, which has a defined structure for specifying search parameters [30]. When exporting data from the billing system, the correction of characters due to character encoding discrepancies was performed as a first step.
Input parameters could be entered differently across the various platforms. In most cases, this was possible using a predefined CSV-format file. For Bing Maps, bulk address input is not available, as far as we know, so the addresses were entered manually. The resulting location data were also processed manually and marked as point elements in ArcMap software (version 10.8.2).
Google was tested across multiple platforms. The authors began with the geocoding service in the commonly used Google Earth software (version 7.3.6.9796), followed by the tools provided by Google My Maps. Subsequently, the Google Cloud Platform API key with the QGIS geospatial software (version 3.36) was utilized, which was connected to the mmgis module. The OSM service was also accessed through this module. For the Geoapify Location Platform, data uploads and geocoding were conducted directly on the provider’s website. The ArcGIS World Geocoding Service was accessed directly within the ArcMap software (version 10.8.2), with the results exported in shapefile format. As a national reference, geocoded data from the Lechner Knowledge Center for research purposes were requested, where the entire geocoding process was conducted by them.
The results provided by the services were examined in several ways to gain a comprehensive understanding of their accuracy for the indicated region. It should be noted that the reported results reflect the database states available from each service in the spring of 2024. Each service provider strives to improve service quality, so the current usability may differ from what is described. In our study, we analyzed the number of hits for each service, the number of results pointing to the same coordinates, and the deviations compared to each other and the locally used reference service.

3. Results and Discussion

The hit rates and accuracy of the different services described in Section 2.2 were analyzed in relation to each other. It is important to note that Table 1, illustrating the hit rate, shows the match values obtained for the base database. However, Table 1 does not indicate whether these matches corresponded to the actual location. In the database received from the Lechner Knowledge Center, 33 address records were listed as “under review”. It is expected that these address records will be available in the database in the near future. Based on the values in Table 1, it should be pointed out that all services gave almost complete processing results.
Table 1 shows the number and percentage of addresses successfully geocoded by various geocoding services. Notably, services like Google Earth Pro, Google Cloud Platform, ArcGIS World Geocoding Service, and OpenStreetMap/Nominatim achieved near-perfect geocoding rates, with all or most addresses successfully matched to geographic coordinates (100%, or above 97%). On the other hand, the Lechner Knowledge Center had a significantly lower geocoding success rate of 72.92%, indicating that it was less effective in matching addresses compared to the other services. Bing Maps, Google My Maps, and Geoapify Location Platform all performed similarly, with a geocoding success rate of 99.22%, suggesting they are quite reliable but still slightly behind the top-performing services. These results highlight the varying levels of accuracy across different platforms and emphasize the need for careful selection when choosing a geocoding service for specific applications, such as mapping and address validation in water utility management. It should be noted that many geocoding services place location markers based on the recognized portion of the address when they are unable to provide an exact match. Therefore, the match rate of search results presented in this table should be considered as informational only and does not necessarily reflect the overall quality or reliability of the geocoding service.
To test the accuracy of the results, points marked outside the administrative area of the study area, at a distance of more than 10 km, were first filtered out. To ensure comparability, it was checked whether, for each service, any markers pointed to the same coordinate. These usually occurred when an address value below a certain level could not be handled by the service. An example was the “A” and “B” designation for condominiums. In such cases the addresses were assigned the same coordinate value. In the case of hydraulic model tests, this was not a problem, since the condominium also had a connection to the municipal network in general.
The number of cases where each service from the loaded database gave the same address match was examined (see Table 2).
The Bing service was not included in the comparison because its results relied on a manual search and spatial point placement, introducing potential human error that could not be eliminated. Table 2 clearly illustrates why geocoded values provided by Lechner Knowledge Center were chosen as our domestic reference. Based on their processing results, no address mapping was found where two or more addresses were assigned the same coordinates. As an example, if Geoapify geocoded 381 out of 384 addresses, with 313 sharing the same coordinates (81.5% of the geocoded addresses), it suggested that in this region, similar input data would yield the same result regardless of the number of addresses. The reason why other services produced such results was due to the factors mentioned above. However, it is important to emphasize that, in the context of examining municipal water utilities—which was the focus of this study—such distortions in input parameters did not pose a significant issue. For this study, these points were combined to avoid biasing the results. The points corresponding to the study area were compared relative to each other based on the individual address records.
Based on Table 2, the evaluation of the geocoding service providers revealed significant variability in the ability to geocode unique coordinates for given addresses, a critical metric for assessing geocoding accuracy and reliability. The Lechner Knowledge Center performed the best, with no instances of multiple addresses being geocoded to the same location (0%), indicating high precision in identifying unique locations for all addresses. In contrast, the Geoapify Location Platform and OpenStreetMap/Nominatim showed significant deficiencies, with 313 (81.51%) and 288 (75.00%) addresses, respectively, assigned identical coordinates. This likely indicated that these services were unable to resolve specific addresses accurately, defaulting to a single fallback location. Among the Google services, Google My Maps (3.39%) and Google Earth Pro (4.43%) demonstrated relatively low rates of geocoding addresses to identical coordinates, with Google Cloud Platform performing slightly worse (5.47%). This suggested reasonable accuracy but room for improvement in disambiguating closely located or ambiguous addresses. Similarly, the ArcGIS World Geocoding Service exhibited a moderate rate of identical coordinates (8.33%), signaling occasional challenges in resolving unique locations and lower success rates (around 4–5%), implying a higher occurrence of distinct address matches. ArcGIS World Geocoding Service, while better than these, had a modest success rate of 8.33%. The Lechner Knowledge Center, on the other hand, produced no matches of identical coordinates (0%), which, as noted, was consistent with the expected real-world scenario where multiple addresses would not share the same coordinates. This analysis underscores the importance of using a geocoding service that not only ensures high hit rates but also maintains consistency and accuracy in location identification, particularly in applications requiring precise geographic alignment, such as municipal water utility studies.
Figure 1 shows the geocoded location results of the different services used in this study. Lechner Knowledge Center’s hit was accurate based on the administrative address database, whereas the ArcGIS World Geocoding Service and Google platforms were off by two property distances. The selected address was visited in person, where it was found that the above-mentioned services had returned house number 37 as 41. Lechner Knowledge Center, OpenStreetMap, Geoapify Location Platform, and Bing Maps provided accurate property hits. This discrepancy was not a significant problem for the intended use, since the municipality-level network hydraulic models rarely go down to consumer-level resolution.
The descriptive statistical results of the comparative study carried out to test the accuracy of geocoding services is presented in Table 3.
In the first column of the table are the names of the geocoding services, which are abbreviated as follows: Bing Maps = Bing, Google Earth Pro = G-E, Google My Maps = G-M, Google Cloud Platform = G-C, OpenStreetMap/Nomatim = Nom, Geoapify Location Platform = Geo, ArcGIS World Geocoding Service = Gis, and Lechner Knowledge Centre Location Database = LKCLD. The second column shows the pairwise average differences of the EOV Y coordinate values and the pairwise average differences of the EOV X coordinate values of the geocoded address data, and the following columns show the standard deviations of the average differences, respectively the maximum and minimum deviations.
The analysis of geocoding service accuracy revealed varying degrees of precision in the comparison of different platforms. Bing Maps exhibited significant variability, especially when compared with Google Earth Pro and Google My Maps, with maximum deviations reaching up to 873.15 m and 688.85 m, respectively. Lechner’s results served as the reference, as no other measured or verified data were available for comparison. Since Lechner reflected the official cadastral database, it was appropriate to treat its data as the baseline. The results showed that deviations were significantly lower when compared to Lechner rather than other services, further supporting the accuracy of Lechner’s data. Google Earth Pro and Google My Maps generally showed smaller average deviations, although discrepancies could still arise, particularly when compared with OpenStreetMap and Geoapify. OpenStreetMap and Geoapify demonstrated relatively higher consistency and alignment, with average deviations of around 125 m and small maximum errors. This stemmed from what we have already discussed: the extent to which the service was able to accurately locate points versus how often it placed multiple addresses at the same coordinates.
Figure 2 presents a comparison of geocoding services in terms of their precision, with the horizontal axis representing the abbreviated names of the geocoding services and the vertical axis showing the distances (in meters). The horizontal line at 0 m indicates the results from the Lechner Knowledge Center, which served as a reference.
The figure then displays pairwise average differences, standard deviations of those differences, and the minimum and maximum discrepancies between the EOV Y and EOV X coordinate values for each service. The negative values on the vertical axis are used solely to represent the standard deviations of the average discrepancies. These values illustrate the variability and precision of the different geocoding platforms when compared to the Lechner Knowledge Center results.
Comparing our results to the literature referenced in the introduction section, Singh (2017) highlighted notable geocoding errors caused by specific address formatting issues [20], while Chow et al. (2015) identified significant variability in geocoding accuracy between urban and rural settings, as well as among different platforms [21]. These findings aligned with previous research highlighting the challenges of ensuring both automation and accuracy in open-source geocoding solutions—the prior evaluations of R-based geocoding methods, such as those by Pérez and Aybar [36], demonstrated significant variability in performance across providers, with differences in processing time, accuracy, and data completeness. Spatial clustering of missing data was significant across all methods investigated by Kinnee et al. [37], with distinct spatial patterns, highlighting the need for improved geocoding accuracy in exposure assessments. These observations support our findings, particularly regarding the discrepancies observed in geocoding precision across various services. The emphasis on selecting appropriate geocoding solutions to minimize errors and improve spatial analyses, as noted in these studies, reinforces the practical implications of our results for urban water utility management.

4. Conclusions

In this study the performance and accuracy of various geocoding services in mapping water utility networks in a Central European municipality was assessed. Key findings emphasized the critical role of geospatial tools in improving data integration for hydraulic modeling. Services were evaluated for their geocoding hit rates and precision, with results compared to identify the most reliable platforms. Our analysis also addressed the practical implications of geocoding in operational decision-making for water utility management.
  • The frequency of identical coordinates assigned to multiple addresses was notably high in Geoapify Location Platform (81.51%) and OpenStreetMap/Nominatim (75.00%). This indicates that these platforms frequently failed to resolve unique addresses, and instead assigned them the same geocoded location, potentially compromising the precision required for applications such as water network modeling.
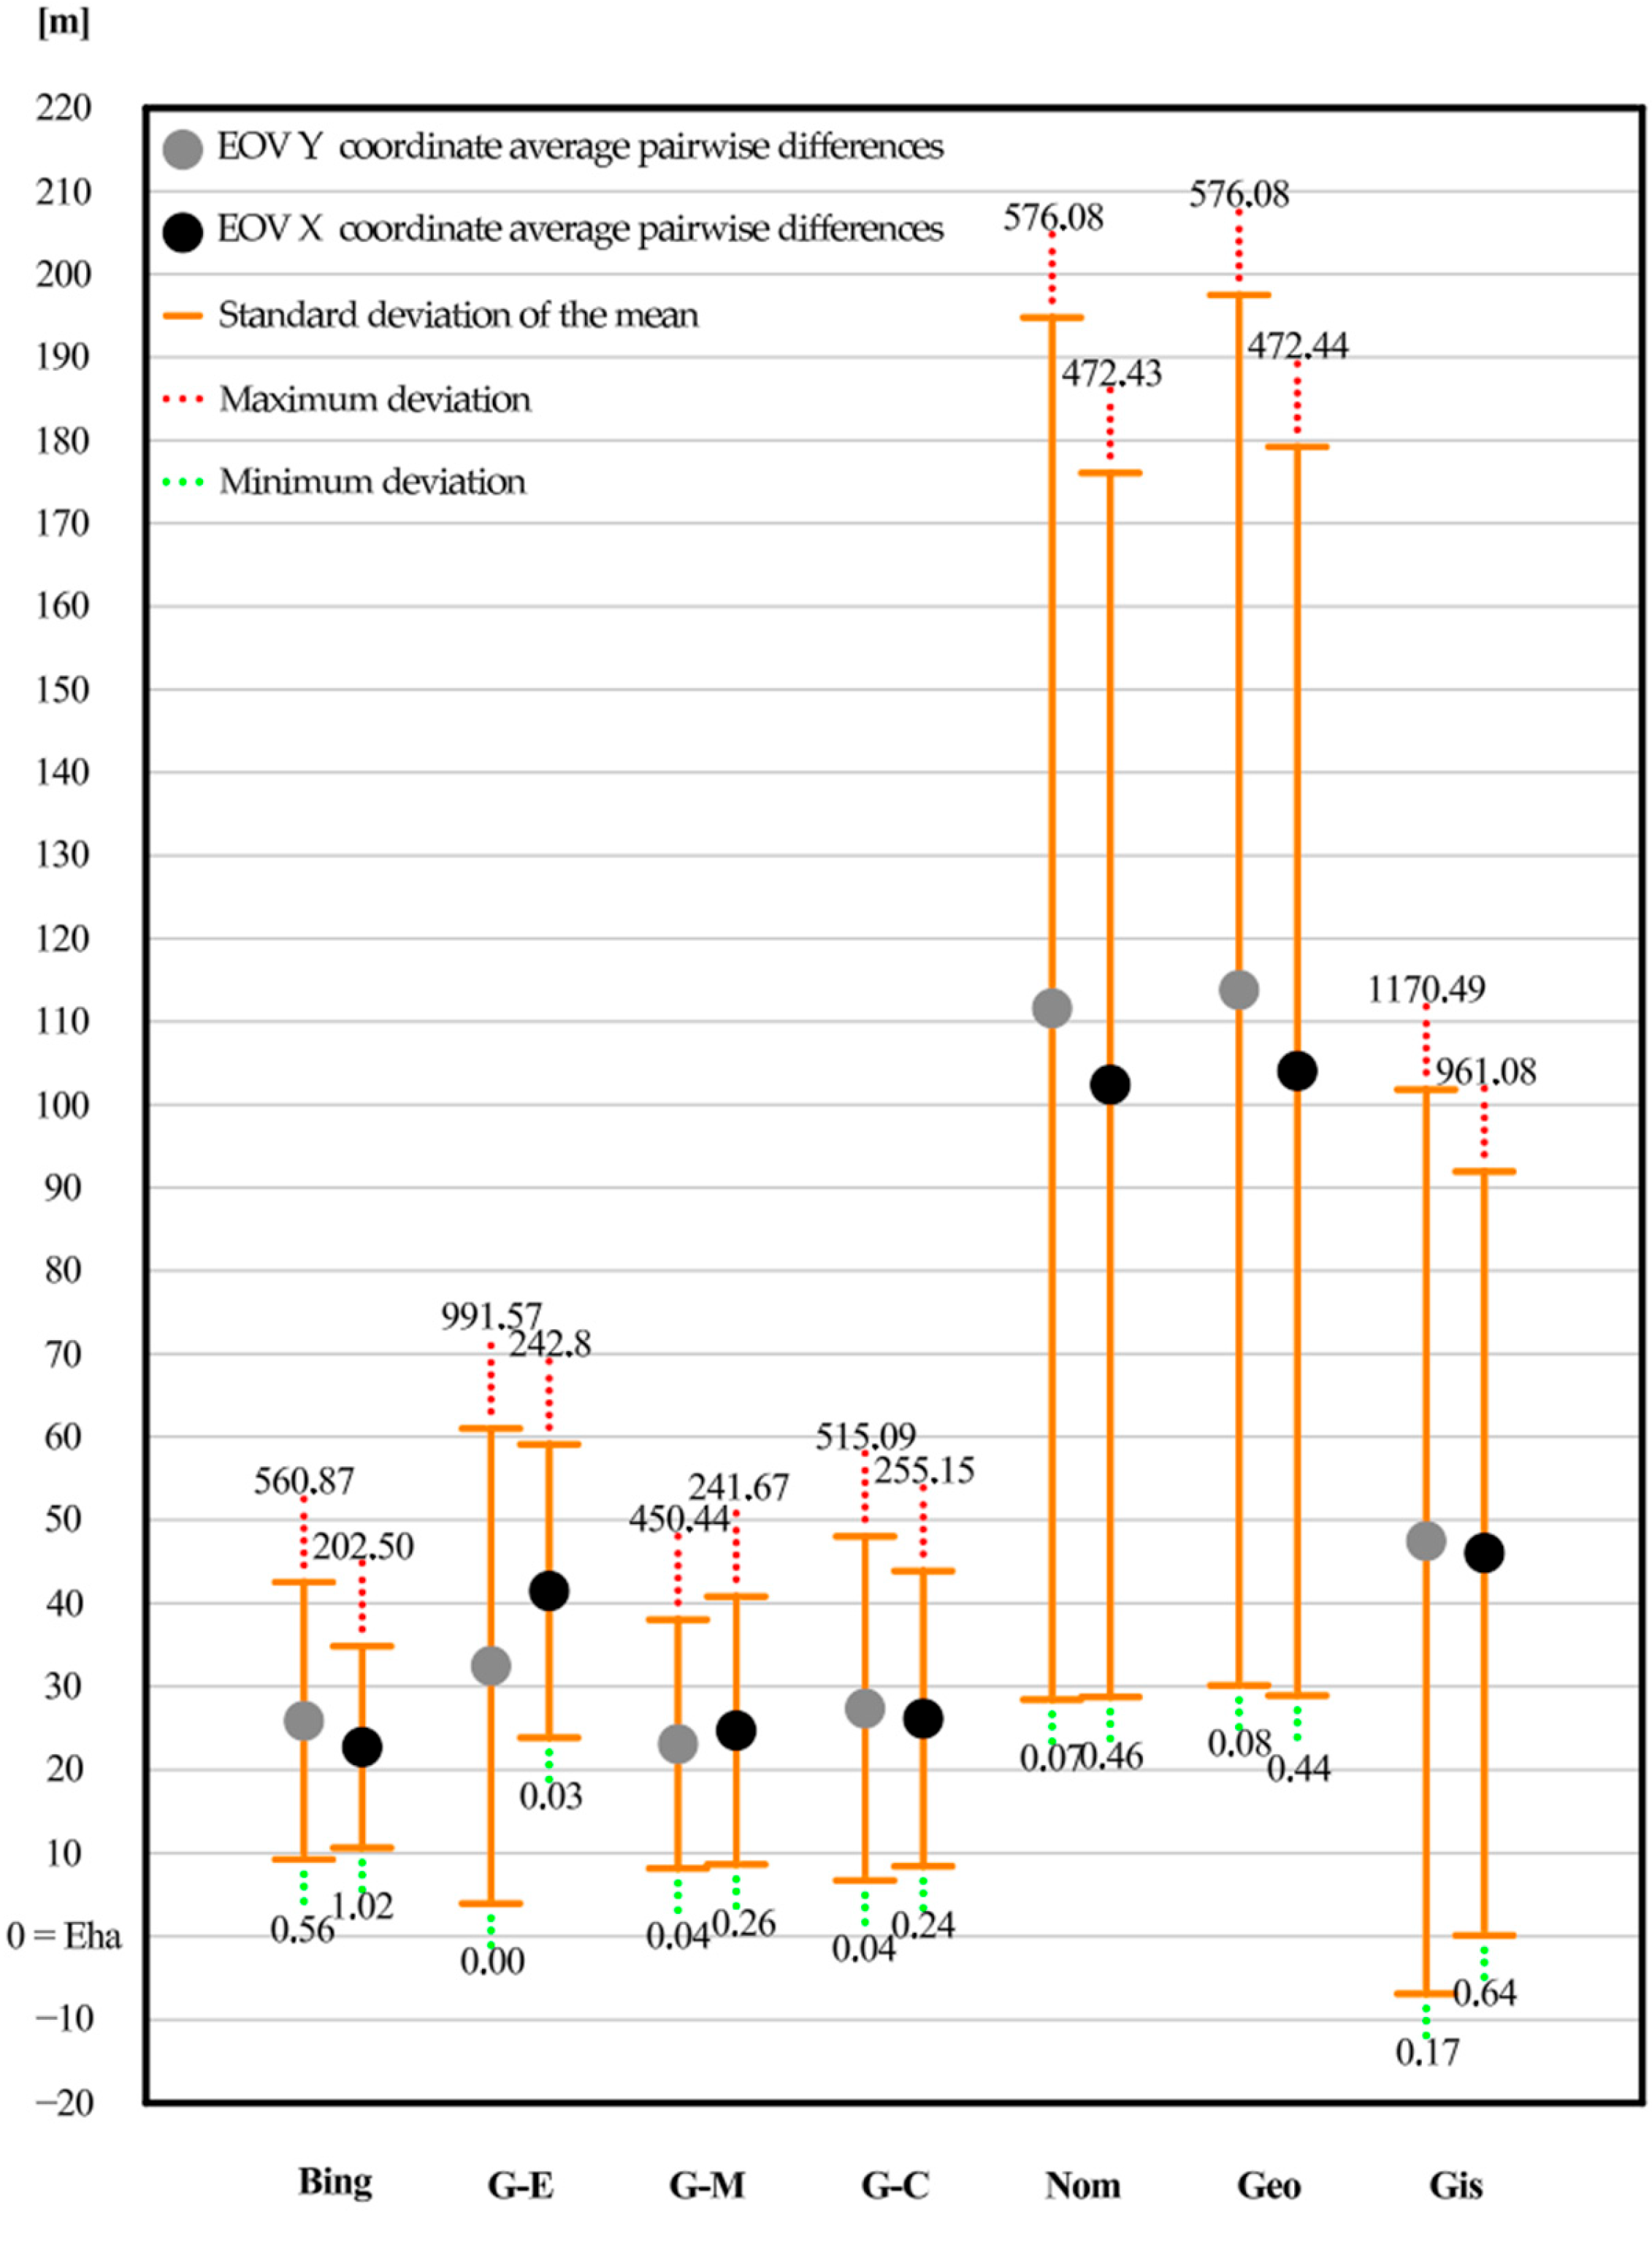
  • Statistical analysis of the geocoding results showed that Lechner Knowledge Center outperformed other services in terms of accuracy and precision. The Lechner Knowledge Center exhibited the smallest average deviations (Y: 25.87 m, X: 22.73 m) and minimal standard deviations, with no instances of multiple addresses geocoded to the same coordinates. In comparison, other services like Geoapify and OpenStreetMap demonstrated larger deviations, highlighting the importance of selecting precise and reliable geocoding tools for urban water supply network applications. It is important to note that this service can only be considered the best among the examined services for addresses in Hungary.
  • Google’s geocoding services successfully demonstrated the level of accuracy required for modeling municipal water utility networks. As alternatives, Bing’s free service and the ESRI ArcGIS-integrated geocoding service are also recommended for use.
The accuracy of address processing, in this case the spatial determination of consumer locations, provides the input data for network hydraulics. Consequently, the quality of this data fundamentally determines the quality of the output data. Future research could focus on refining geocoding techniques to improve accuracy in regions with fragmented spatial data infrastructure. Integrating machine learning algorithms with geospatial tools holds potential for enhancing address validation and error correction. Additionally, expanding the application of geocoding to include predictive modeling and real-time network monitoring could further advance sustainable water utility management practices.

Author Contributions

Conceptualization, P.O., T.H. and T.K.; methodology, P.O., T.H. and T.K.; software, P.O.; data curation, P.O. and T.H.; writing—original draft preparation, T.K.; writing—review and editing, P.O., T.H. and T.K.; visualization, P.O. and T.H.; supervision, T.K. All authors have read and agreed to the published version of the manuscript.

Funding

Project no. TKP2021-NVA-18 was implemented with the support of the Ministry of Culture and Innovation of Hungary from the National Research, Development and Innovation Fund, financed under the TKP2021-NVA funding scheme.

Institutional Review Board Statement

Not applicable.

Informed Consent Statement

Not applicable.

Data Availability Statement

The data are contained within the article.

Conflicts of Interest

The authors declare no conflicts of interest.

References

  1. Sapkota, M.; Arora, M.; Malano, H.; Moglia, M.; Sharma, A.; George, B.; Pamminger, F. An Overview of Hybrid Water Supply Systems in the Context of Urban Water Management: Challenges and Opportunities. Water 2014, 7, 153–174. [Google Scholar] [CrossRef]
  2. Leigh, N.G.; Lee, H. Sustainable and Resilient Urban Water Systems: The Role of Decentralization and Planning. Sustainability 2019, 11, 918. [Google Scholar] [CrossRef]
  3. Rathnayaka, K.; Malano, H.; Arora, M. Assessment of Sustainability of Urban Water Supply and Demand Management Options: A Comprehensive Approach. Water 2016, 8, 595. [Google Scholar] [CrossRef]
  4. Liu, W.; Song, Z. Review of Studies on the Resilience of Urban Critical Infrastructure Networks. Reliab. Eng. Syst. Saf. 2020, 193, 106617. [Google Scholar] [CrossRef]
  5. Iannacone, L.; Sharma, N.; Tabandeh, A.; Gardoni, P. Modeling Time-Varying Reliability and Resilience of Deteriorating Infrastructure. Reliab. Eng. Syst. Saf. 2022, 217, 108074. [Google Scholar] [CrossRef]
  6. Koks, E.; Van Ginkel, K.; Van Marle, M.; Lemnitzer, A. Brief Communication: Critical Infrastructure Impacts of the 2021 Mid-July Western European Flood Event. Nat. Hazards Earth Syst. Sci. Discuss. 2021, 2021, 1–11. [Google Scholar] [CrossRef]
  7. Montalvo, I.; Izquierdo, J.; Schwarze, S.; Pérez-García, R. Multi-objective particle swarm optimization applied to water distribution systems design: An approach with human interaction. Mathematics and Computers in Simulation 2010, 52, 1219–1227. [Google Scholar] [CrossRef]
  8. Osei-Kyei, R.; Tam, V.; Ma, M.; Mashiri, F. Critical review of the threats affecting the building of critical infrastructure resilience. Int. J. Disaster Risk Reduct. 2021, 60, 102316. [Google Scholar] [CrossRef]
  9. Abu-Bakar, H.; Williams, L.; Hallett, S.H. A review of household water demand management and consumption measurement. J. Clean. Prod. 2021, 292, 125872. [Google Scholar] [CrossRef]
  10. Cominola, A.; Giuliani, M.; Piga, D.; Castelletti, A.; Rizzoli, A.E. Benefits and challenges of using smart meters for advancing residential water demand modeling and management: A review. Environ. Model. Softw. 2015, 72, 198–214. [Google Scholar] [CrossRef]
  11. Meng, F.; Fu, G.; Farmani, R.; Sweetapple, C.; Butler, D. Topological attributes of network resilience: A study in water distribution systems. Water Res. 2018, 143, 376–386. [Google Scholar] [CrossRef] [PubMed]
  12. Giudicianni, C.; Di Nardo, A.; Di Natale, M.; Greco, R.; Santonastaso, G.F.; Scala, A. Topological taxonomy of water distribution networks. Water 2018, 10, 444. [Google Scholar] [CrossRef]
  13. Orgoványi, P.; Karches, T. GIS-Based Model Parameter Enhancement for Urban Water Utility Networks. Urban Sci. 2024, 8, 35. [Google Scholar] [CrossRef]
  14. Beal, C.D.; Flynn, J. Toward the digital water age: Survey and case studies of Australian water utility smart-metering programs. Utilities Policy 2015, 32, 29–37. [Google Scholar] [CrossRef]
  15. Kebe, A.M.; Faye, R.M.; Lishou, C. Multi agent-based addresses geocoding for more efficient home delivery service in developing countries. In e-Infrastructure and e-Services for Developing Countries, Proceedings of the 10th EAI International Conference, AFRICOMM 2018, Dakar, Senegal, 29–30 November 2019, Proceedings 10; Springer International Publishing: New York, NY, USA, 2019; pp. 294–304. [Google Scholar] [CrossRef]
  16. von Rhein, J.; Henze, G.P.; Long, N.; Fu, Y. Development of a topology analysis tool for fifth-generation district heating and cooling networks. Energy Convers. Manag. 2019, 196, 705–716. [Google Scholar] [CrossRef]
  17. Bermúdez, J.R.; López-Estrada, F.R.; Besançon, G.; Valencia-Palomo, G.; Torres, L.; Hernández, H.R. Modeling and simulation of a hydraulic network for leak diagnosis. Math. Comput. Appl. 2018, 23, 70. [Google Scholar] [CrossRef]
  18. Alegre, H.; Baptista, J.M.; Cabrera, E., Jr.; Cubillo, F.; Duarte, P.; Hirner, W.; Merkel, W.; Parena, R. Performance Indicators for Water Supply Services; IWA Publishing: London, UK, 2016. [Google Scholar] [CrossRef]
  19. Malczewski, J. GIS-based land-use suitability analysis: A critical overview. Prog. Plann. 2004, 62, 3–65. [Google Scholar] [CrossRef]
  20. Singh, S.K. Evaluating two freely available geocoding tools for geographical inconsistencies and geocoding errors. Open Geospat. Data Softw. Stand. 2017, 2, 1–8. [Google Scholar] [CrossRef]
  21. Chow, T.E.; Dede-Bamfo, N.; Dahal, K.R. Geographic disparity of positional errors and matching rate of residential addresses among geocoding solutions. Ann. GIS 2015, 22, 29–42. [Google Scholar] [CrossRef]
  22. Carriço, N.; Ferreira, B.; Barreira, R.; Antunes, A.; Grueau, C.; Mendes, A.; Brito, I.S. Data integration for infrastructure asset management in small to medium-sized water utilities. Water Sci. Technol. 2020, 82, 2737–2744. [Google Scholar] [CrossRef]
  23. Tiedmann, H.R.; Sela, L.; Stephens, K.K.; Faust, K.M. Leveraging water utility customer reporting for resilient operations and management. Sustain. Cities Soc. 2024, 101, 105087. [Google Scholar] [CrossRef]
  24. Di Mauro, A.; Cominola, A.; Castelletti, A.; Di Nardo, A. Urban water consumption at multiple spatial and temporal scales: A review of existing datasets. Water 2021, 13, 36. [Google Scholar] [CrossRef]
  25. Zandbergen, P.A. Geocoding quality and implications for spatial analysis. Geogr. Compass 2009, 3, 647–680. [Google Scholar] [CrossRef]
  26. Goldberg, D.W.; Wilson, J.P.; Knoblock, C.A. From text to geographic coordinates: The current state of geocoding. URISA J. 2007, 19, 33–46. [Google Scholar]
  27. Sharafat, A.; Khan, M.S.; Latif, K.; Tanoli, W.A.; Park, W.; Seo, J. BIM-GIS-Based Integrated Framework for Underground Utility Management System for Earthwork Operations. Appl. Sci. 2021, 11, 5721. [Google Scholar] [CrossRef]
  28. Bing Maps Documentation. Available online: https://learn.microsoft.com/en-us/bingmaps/ (accessed on 19 January 2025).
  29. Kılıç, B.; Gülgen, F. Accuracy and similarity aspects in online geocoding services: A comparative evaluation for Google and Bing maps. Int. J. Eng. Geosci. 2020, 5, 109–119. [Google Scholar] [CrossRef]
  30. Google Maps Documentation. Available online: https://developers.google.com/maps/documentation (accessed on 19 January 2025).
  31. Open Street Map. Available online: https://www.openstreetmap.org/help (accessed on 19 January 2025).
  32. Adding Basemaps in QGIS. Available online: https://mapscaping.com/adding-basemaps-in-qgis/ (accessed on 19 January 2025).
  33. Geoapify Location Platform. Available online: https://www.geoapify.com/ (accessed on 19 January 2025).
  34. ArcGIS World Geocoding Service. Available online: https://developers.arcgis.com/documentation/mapping-apis-and-services/geocoding/ (accessed on 19 January 2025).
  35. Lechner Knowledge Center. Available online: https://lechnerkozpont.hu/en (accessed on 19 January 2025).
  36. Pérez, V.; Aybar, C. Challenges in Geocoding: An Analysis of R Packages and Web Scraping Approaches. ISPRS Int. J. Geo-Inf. 2024, 13, 170. [Google Scholar] [CrossRef]
  37. Kinnee, E.J.; Tripathy, S.; Schinasi, L.; Shmool, J.L.C.; Sheffield, P.E.; Holguin, F.; Clougherty, J.E. Geocoding Error, Spatial Uncertainty, and Implications for Exposure Assessment and Environmental Epidemiology. Int. J. Environ. Res. Public Health 2020, 17, 5845. [Google Scholar] [CrossRef]
Figure 1. Relative hit rate of geocoding services.
Urbansci 09 00051 g001
Figure 2. Accuracy of geocoding services in relation to the Lechner Knowledge Centre’s Access Point database.
Urbansci 09 00051 g002
Table 1. Geocoding services hit rate.
Geocoding Service ProviderNumber of Addresses Geocoded (pcs)Rate of Geocoded Addresses (%)
Bing Maps38199.22
Google Earth Pro384100.00
Google My Maps38199.22
Google Cloud Platform384100.00
OpenStreetMap/Nominatim37697.92
Geoapify Location Platform38199.22
ArcGIS World Geocoding Service384100.00
Lechner Knowledge Center28072.92
Table 2. Number of addresses geocoded by geocoding services with identical coordinates.
Geocoding Service ProviderNumber of Addresses Geocoded with the Same Coordinates (pcs)Rate of Geocoded Addresses with Identical Coordinates (%)
Bing Maps--
Google Earth Pro174.43
Google My Maps133.39
Google Cloud Platform215.47
OpenStreetMap/Nominatim28875.00
Geoapify Location Platform31381.51
ArcGIS World Geocoding Service328.33
Lechner Knowledge Center00.00
Table 3. Relative accuracy of geocoding services.
Geocoding Service ProviderY|X
Average (m)
Y|X
Standard Deviation (m)
Y|X
Maximum Absolute Deviation (m)
Y|X
Minimum Absolute Deviation (m)
Bing—G-E24.39|21.2822.31|17.29873.15|549.360.09|0.13
Bing—G-M20.25|23.7016.33|21.09688.85|2180.850.05|0.13
Bing—G-C19.63|21.4215.33|17.47396.68|561.720.06|0.12
Bing—Nom123.39|106.7092.07|77.78683.57|483.140.02|0.02
Bing—Geo127.43|110.1993.85|80.55683.58|576.440.03|0.01
Bing—Gis47.46|39.0164.50|51.401092.81|839.600.01|0.01
Bing—LKCLD25.87|22.7316.64|12.10560.87|202.500.56|1.02
G-E—G-M4.14|6.848.14|13.611375.47|1631.490.04|0.00
G-E—G-C8.60|2.7016.87|5.271375.48|974.040.02|0.01
G-E—Nom125.01|108.8688.95|75.83599.43|456.190.07|0.08
G-E—Geo130.97|114.7593.33|81.57599.43|634.000.06|0.06
G-E—Gis44.58|41.4766.31|58.991157.45|975.890.03|0.26
G-E—LKCLD32.47|41.4728.52|17.62991.57|242.800.00|0.03
G-M—G-C0.80|4.281.56|8.48292.17|1619.140.00|0.01
G-M—Nom125.02|108.8688.95|75.83599.38|456.190.07|0.08
G-M—Geo131.98|118.1294.51|85.18973.10|1604.420.08|0.06
G-M—Gis41.46|40.9661.25|58.481157.50|2607.380.08|0.03
G-M—LKCLD23.09|24.7214.93|16.08450.44|241.670.04|0.26
G-C—Nom125.00|108.8788.93|75.85599.39|456.200.08|0.06
G-C—Geo131.20|113.9693.80|80.69973.11|633.990.09|0.05
G-C—Gis47.15|44.1470.99|63.911157.49|1343.000.07|0.01
G-C—LKCLD27.36|26.1420.65|17.72515.09|255.150.04|0.24
Nom—Geo2.86|2.735.37|5.1248.74|46.480.01|0.01
Nom—Gis136.17|116.52108.88|90.06848.99|636.520.19|0.04
Nom—LKCLD111.60|102.4083.18|73.66576.08|472.430.07|0.46
Geo—Gis145.30|127.71117.49|102.04849.00|1002.960.18|0.02
Geo—LKCLD113.81|104.0683.68|75.15576.08|472.440.08|0.44
Gis—LKCLD47.46|46.0354.35|45.911170.49|961.080.17|0.64
Disclaimer/Publisher’s Note: The statements, opinions and data contained in all publications are solely those of the individual author(s) and contributor(s) and not of MDPI and/or the editor(s). MDPI and/or the editor(s) disclaim responsibility for any injury to people or property resulting from any ideas, methods, instructions or products referred to in the content.

