Abstract
Spherical glass beads weaken the influences of particle morphology, surface properties, and microscopic fabric on shear strength, which is significant for revealing the relationship between macroscopic particle friction mechanisms and the particle size distribution of sand. This paper explores the shear mechanical properties of glass beads with different particle size ratios under different confining pressures. It obtains the particle size ratio and fractal dimension D through an optimal mechanical response. Simultaneously, we explore the range of the fractal dimension D under well-graded conditions. The test results show that the strain-softening degree of Rs is more obvious under a highly effective confining pressure, and the strain-softening degree of Rs can reach 0.669 when the average particle size is 0.5 mm. The changes in the normalized modulus ratio Eu/Eu50 indicate that the particle ratio and arrangement are the fundamental reasons for the different macroscopic shear behaviors of particles. The range of the peak effective internal friction angle φ is 23 °~35 °, and it first increases and then decreases with the increase in the effective confining pressure. As the average particle size increases, the peak stress ratio MFL and the peak effective internal friction angle φ first increase and then decrease, and both can be expressed using the Gaussian function. The range of the fractal dimension D for well-graded particles is 1.873 to 2.612, and the corresponding average particle size ranges from 0.433 to 0.598. Under the optimal mechanical properties of glass beads, the particle size ratio of 0.25 mm to 0.75 mm is 23:27, and the fractal dimension D is 2.368. The study results provide a reference for exploring friction mechanics mechanisms and the optimal particle size distributions of isotropic sand.
1. Introduction
Non-cohesive friction materials, such as sand and gravel, are common filling materials for dams [1,2,3], foundations [4,5], and subgrades [6,7], and their mechanical properties are directly related to the stability and safety of engineering structures. Many scholars have extensively studied the shear mechanical behavior and theory of sand. For example, Shen et al. [8] explored the meso-structural characteristics of calcareous sand under undrained shear conditions. It was found that splitting and wear are the main failure modes of calcareous sand particles. Krim et al. [9] studied the effect of fine particle content on the undrained shear strength of a sand–powder mixture and found that the specimens with a lower fine particle content and a higher initial effective confining pressure have a stronger liquefaction resistance. Liang et al. [10] reasonably established a non-orthogonal elastoplastic constitutive model of a sand-containing dilatancy. The performance of this model was evaluated by comparing it with the test data of sand under triaxial stress. Fan et al. [11] established an hypoplastic constitutive model of inherently anisotropic sand. The model has the unified simulation properties of sand. Fan et al. [12] carried out a local bifurcation analysis of sand anisotropy on the basis of their constitutive model. In addition, Lu et al. [13] extended a constitutive sand model and constructed a three-dimensional elastic–plastic constitutive model of concrete considering fractal characteristics. This model was accurate in quantitative prediction and required only nine parameters.
However, in practical engineering, granular soil is influenced by particle size [14,15], surface roughness [16,17], and porosity [18,19], and its stress situation is complex and variable. If glass beads [20,21] with adjustable shapes are introduced to simulate sand, they can effectively analyze the variations in the shear mechanical properties of sand under a single factor. Hazzar et al. [22] conducted triaxial consolidation drainage simulations and tests on glass beads with the same pore ratio and found that there is a nonlinear relationship between elastic parameters at the micro- and macro-scales. Xu et al. [23] conducted consolidated drainage triaxial shear tests on glass beads and found that an effective confining pressure has a relatively small effect on the initial modulus. Xiao et al. [24] conducted a consolidated undrained triaxial shear test on glass sand to evaluate the influence of particle morphology on the static undrained response of particle materials. It was found that the peak stress ratio and steady-state stress ratio increased and that the dilatancy was inhibited with the decrease in the overall regularity. Although some scholars have analyzed the shear behavior of glass beads under a single factor, there are few studies on the undrained shear behavior of glass beads under high-stress conditions. In addition, there are few reports on the mechanical mechanisms of glass microbeads under low and high effective confining pressures, which is also the focus of research.
Particle gradation [25,26,27] is also a key factor affecting the overall stability of soil, and the study of the mechanical behavior of granular soil under different particle sizes has become significant. Many scholars have ignored the effects of particle shape, density, and other factors and conducted experimental studies to simulate the interaction of sand [28,29] with different gradations. Few scholars have conducted mechanical tests on glass beads with different gradations. Ghal et al. [30] carried out cone penetration tests (CPTs) on glass beads and found a positive correlation between the cone penetration resistance at the top and the average particle size. Li et al. [31] applied the conventional triaxial method to achieve a true triaxial path and found that the peak strength of glass beads decreases as the principal stress coefficient increases, with dilatation becoming more obvious. In addition, binary mixtures, that is, mixtures of two particle sizes, can be used to study the shear mechanical properties of soil with equivalent particle gradation. Yilmaz et al. [32] found that fine grain content had a significant effect on the critical state void ratio of the binary mixture. Zuo et al. [33] conducted shear tests of sand–powder mixtures and found that the small-strain shear modulus increases with the increase in fine sand content. Li et al. [34] carried out direct shear tests on the mixture of fine grained soil (kaolin) and glass beads, and found that the porosity first increased and then decreased with the increase of fine particle content, resulting in a significant difference in shear strength. The fractal dimension D can be used to describe the complexity of the distribution of binary particle materials in space, and then the quantitative analysis of the microscopic mechanism of binary particle materials can be carried out. In addition, the particle size ratio and fractal dimension D of the binary granular materials with optimal shear properties may provide parametric support for the optimization design and the simulation of geotechnical engineering, such as sandy soil subgrade. However, up to now, most scholars have only analyzed the shear characteristics of binary granular materials and have not provided a range of the fractal dimension D for well-graded materials. Meanwhile, the particle size ratio and fractal dimension D under the optimal shear mechanical properties of binary particulate materials have not yet been determined.
Therefore, we selected glass beads with different particle size ratios to conduct conventional consolidated undrained tests, exploring the shear mechanical properties of the glass beads under different pressures and analyzing their frictional shear mechanisms. The particle size ratio was converted to the average particle size to facilitate the analysis of the optimal shear properties of glass beads. On this basis, the relationship between the fractal dimension and the average particle size was determined and the range of fractal dimensions under the category of well-graded is given. Meanwhile, the particle size ratio and fractal dimension under optimal shear mechanical properties were determined. The study results reference the friction mechanism and particle size distribution exploration of isotropic, non-viscous granular materials. The study contributes to a deeper understanding of the bearing potential of granular materials in geotechnical engineering, providing a scientific basis for engineering design and a reference for discrete element experimental modeling.
2. Test Preparations
2.1. Test Apparatus and Materials
The triaxial apparatus used in the test was produced by Ningxi Soil Apparatus inNanjing, China, which can be controlled by stress or strain (Figure 1). The test material was spherical glass beads produced by SIGMUND LINDN company in Warmensteinach, Germany. The technical specifications of glass beads were given in the supplier’s data. Compared with gravel materials, glass beads are approximately isotropic granular materials with a smooth surface. The glass beads are comprised of 72.5% SiO2, 4.22% MgO, 13% Na2O, 0.58% Al2O3, and 9.06% CaO. The material density is 2530 kg/m3, and the elastic modulus is 63 GPa. We chose a wider range of particle size ratios, namely the test ratios of 0.25 mm and 0.75 mm were 4:1, 1:1, and 1:4, as shown in Figure 2. On the one hand, this can simulate the actual range of the sand particle size ratio [35,36,37,38]. On the other hand, it is helpful for us to carry out fitting analysis on a wide range of particle size ratios, so as to determine the particle size ratio and fractal dimension under optimal shear properties. Two sizes of glass beads (0.75 mm and 0.25 mm) were purchased according to their respective sizes. For better later data analysis, we quantified the particle ratios using the average particle size, as shown in Equation (1):
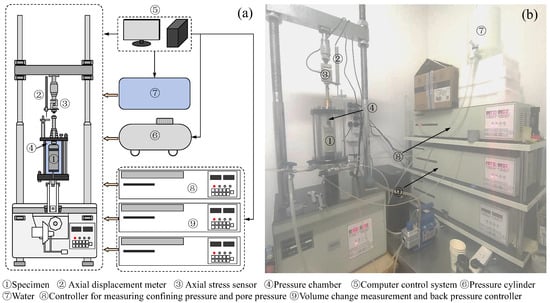
Figure 1.
Test apparatus. (a) Schematic diagram; (b) Physical map.
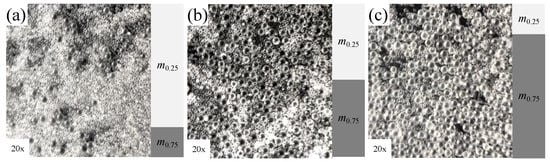
Figure 2.
Glass beads with different size ratios. (a) m0.25: m0.75 = 4:1; (b) m0.25: m0.75 = 1:1; (c) m0.25: m0.75 = 1:4.
Among them, d0.25 and d0.75 are the particle sizes. m0.25 is the mass of a glass bead with a particle size of 0.25 mm, and m0.75 is the mass of a glass bead with a particle size of 0.75 mm. According to Equation (1), when the ratio of 0.25 mm to 0.75 mm is 4:1, 1:1, and 1:4, the average particle sizes are 0.35 mm, 0.50 mm, and 0.65 mm, respectively.
2.2. Test Procedure and Scheme
The specimen size is 80 mm in height and 39.1 mm in diameter. In the process of specimen preparation, the initial relative density Dr was controlled at 0.5. The formula for relative density Dr is as follows:
where ρdmin is the minimum dry density of the specimen; ρdmax is the maximum dry density of the specimen; ρd is the initial dry density of the specimen. The maximum dry density ρdmax and minimum dry density ρdmin of glass beads were measured by the vibration hammer method and the cylinder method, respectively. Each group of measurements was averaged over three trials to minimize errors in the results. We determined that the initial dry densities ρd corresponding to specimens with average particle sizes of 0.35 mm, 0.5 mm, and 0.65 mm are 1.62 g/cm3, 1.69 g/cm3, and 1.68 g/cm3, respectively. Since the initial volume of the specimens was the same, we controlled the initial relative density Dr by adding specimens of corresponding mass. Among them, the initial masses of the specimens with average particle sizes of 0.35 mm, 0.5 mm, and 0.65 mm were 155.6 g, 162.3 g, and 161.4 g, respectively. The mass difference for a single particle size was allowed to be less than 1 g as the specimen preparation standard.
The drained condition of the test was undrained, and the control condition was strain control. The specimen preparation steps are shown in Figure 3a. There were four main steps: (a). Prepare tools; (b). Install latex film; (c). Encapsulate specimen; (d). Complete specimen preparation. Among them, to ensure that the specimen density of each layer was basically consistent, we used the dropping sand method to prepare the specimen in 5 layers (Figure 3b). After each layer was prepared, the specimen was compacted with a compacting instrument. In addition, to reduce the error of manual specimen preparation, the overall height error of the specimen was controlled to be less than 1 mm. After the specimen was prepared, the shape of the specimen was fixed by a vacuum pump with a negative pressure of 20 kPa. Then, the pressure chamber was filled with water, the pre-confining pressure was 30 kPa, and the installation of the specimen was completed.
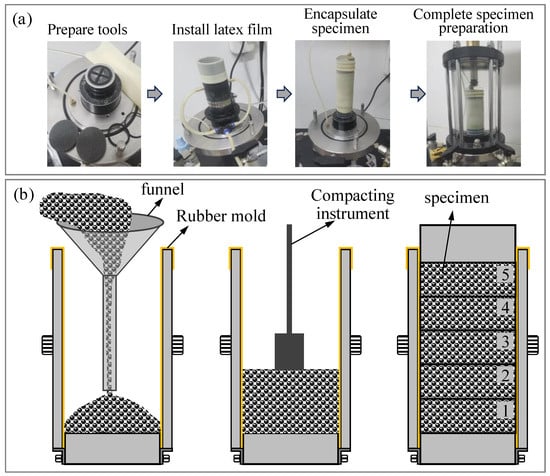
Figure 3.
Processing of specimen preparation. (a) Specimen preparation steps; (b) Specimen installation.
After the specimen preparation was completed, hydrostatic head saturation and back-pressure saturation tests were carried out. The specimen reached a saturation state when the saturation was higher than 98% [39]. Afterward, an isotropic consolidation test was carried out, with the consolidation pressure being the effective confining pressure selected for the test and the consolidation test lasting for 60 min. After the isotropic consolidation stage was completed, the drainage valve on the pressure chamber was closed, and the deformation of the specimen was set to 30% of the original volume as the end condition. The specimen was sheared at a constant strain rate of 0.12 mm/min to measure its ability to resist shear failure. The triaxial test scheme is shown in Table 1. We preprocessed and analyzed the measured test data. If there was a regular deviation in the current data, a new test was conducted to ensure the accuracy of the test data.

Table 1.
Triaxial test scheme.
3. Test Results and Mechanism Analysis
3.1. Analysis of Test Results
3.1.1. The Variety Rule of q, ε3, and u
Figure 4 shows the variation in shear stress q, lateral strain ε3, and pore water pressure u. The stress–strain relationship shows that in the early stage of shear, the shear stress q increases rapidly, then growth gradually slows as the axial strain ε1 increases. The slope of the stress–strain curve gradually decreases until it reaches the peak shear stress qFL. Under low pressure, the stress–strain relationship shows strain-hardening, while increasing the effective confining pressure leads to more pronounced strain-softening and a rise in peak shear stress. This follows the typical undrained behavior, confirming the reliability of the test results. As the effective confining pressure increases, the initial shear stiffness gradually increases. To quantify and describe strain-softening, the strain-softening degree Rs [40] is defined. The schematic diagram is shown in Table 1. The formula is as follows:
where qt is the residual shear stress; qs is the difference between the peak shear stress qFL and the residual shear stress qt. The residual shear stress qt is defined as the shear stress when the specimen reaches the critical state. The strain-softening degree under different factors is calculated by Equation (3), as shown in Table 1. It can be seen that the strain-softening degree Rs is more obvious under a high effective confining pressure, reaching 0.669 when the average particle size is 0.5 mm. Generally, with the increase in the average particle size , the strain-softening degree Rs first increases, then decreases. The strain-softening degree of the 0.5 mm specimen is five times higher than that of the 0.35 mm specimen. Ma et al. [39] conducted undrained shear tests of Tengger Desert sand at 50, 100, 200, 400, and 800 kPa. Given the similar particle size and initial compactness of Tengger Desert sand and glass beads, their peak shear stress qFL and strain-softening degree Rs are compared in Table 2. It can be seen that the peak shear stress of Tengger Desert sand is significantly higher than that of glass beads, while its strain-softening degree is smaller. It may be that the surface of the sand in Tengger Desert is irregular and there is occlusion between the particles, resulting in increased shear resistance and higher peak shear stress. Due to the irregularity of the particle surface, after the specimen reaches failure, the particles re-occlude and rearrange, resulting in a strain-softening phenomenon which is not obvious. The higher the effective confining pressure, the smaller the strain-softening degree Rs, which contrasts with the behavior of glass beads.
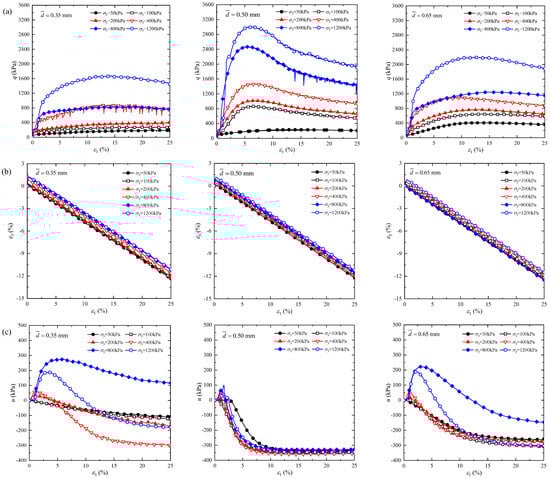
Figure 4.
The variety rule of q, ε3, and u. (a) Relationship q and ε1; (b) Relationship ε3 and ε1; (c) Relationship u and ε1.
Table 2.
Analysis of peak shear stress qFL and strain-softening degree Rs.
For the variation in lateral strain ε3, it can be seen that due to the rubber film being a flexible body, the glass beads are affected by axial strain and move towards both sides of the cylinder during the shearing process, resulting in a large displacement in the middle and presenting a “bulge” shape. The inward movement is considered as a positive value. Consequently, the value of ε3 continuously increases in the opposite direction, and the relationship between ε3 and ε1 shows a linear trend. As the effective confining pressure decreases, the value of ε3 continuously increases. The variation in the pore water pressure u shows an initial increase at the beginning of the shear. After reaching its peak, as the axial strain increases, the pore water pressure u decreases to 0 kPa and finally decreases to a negative value, stabilizing at that state. Overall, as the effective confining pressure increases, the axial strain values corresponding to maximum pore water pressure u initially increase and then decrease. Similarly, the pore water pressure u first increases and then decreases, reaching a maximum at 800 kPa.
The average particle size significantly affects the shear stress q and strain-softening degree Rs of the specimen. The peak shear stress qFL and strain-softening degree Rs of the 0.5 mm specimen are the highest. We conducted an undrained shear test. During the shear process, the volume strain increment is 0; that is, the equation is satisfied. Similarly, conventional triaxial tests use strain control; that is, axial strain is a known condition. Consequently, the average particle size has no significant effect on the radial strain ε3, which is consistent with the conclusion of Ma [39]. The final radial strain ε3 is approximately −12%. The average particle size also significantly affects the pore water pressure u of the specimen. The final pore water pressure u of the 0.5 mm specimen is the smallest, and it is finally close to −340 kPa. In contrast, the final pore water pressure u of the 0.35 mm specimen is the highest, and the final pore water pressure u distribution under different effective confining pressures is relatively dispersed. This is due to the uniform distribution of large particles (0.75 mm) and small particles (0.25 mm) in glass beads with an average particle size of 0.5 mm, and the small particles fill the large particles. For glass beads with average diameters of 0.35 mm and 0.65 mm, the distribution of large (0.75 mm) and small (0.25 mm) particles is uneven. Furthermore, for glass beads with an average diameter of 0.65 mm, the large particles (0.75 mm) exert the main force, and the small particles (0.25 mm) are internally filled, resulting in a higher shear stress q and effective stress than glass beads with an average diameter of 0.35 mm and faster dissipation of the pore water pressure u.
3.1.2. The Relationship between q and p’
Figure 5 shows the relationship between the shear stress q and the effective average stress p’. Due to the strain-softening phenomenon, it can be represented by two fitting lines: the failure line (FL) and the critical state line (CSL). The failure line is the fitting line where the shear stress q reaches its maximum value under different effective confining pressures, expressed in Equation (4). The critical state line is the fitting line where the shear stress q no longer changes under different effective confining pressures and eventually reaches the residual shear state, expressed in Equation (5).
where MFL is the peak stress ratio; MCSL is the stress ratio of critical state; qFL is the peak shear stress; qCSL is the critical shear stress.
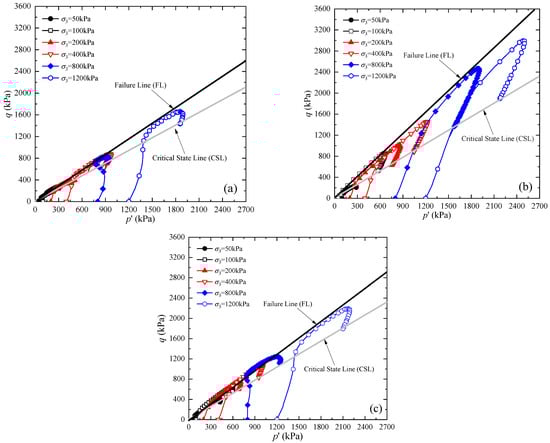
Figure 5.
The relationship between q and p’. (a) ; (b) ; (c) .
We observe that the peak stress ratio MFL first increases and then decreases with the increase in the average particle size . In addition, when the average particle size nears 0.25 mm (minimum) or 0.75 mm (maximum), the peak stress ratio MFL also takes positive values. The above rules all conform to the trend of Gaussian functions. Therefore, we chose the Gaussian function to describe these relationships, as shown in Equation (6).
where, a1, b1, and c1 are fitting parameters. Figure 6 shows the variation in the stress ratio of glass beads under different average particle sizes. Figure 5 and Figure 6 show that the MFL values corresponding to the samples with average particle sizes of 0.35 mm, 0.5 mm, and 0.65 mm are 0.964, 1.368, and 1.074, respectively. As the average particle size increases, the MFL first increases and then decreases. The MCSL at the three average particle sizes is the same, at 0.824, indicating that the average particle size has an insignificant influence on MCSL. Figure 6 shows the glass beads’ maximum strain-softening degree with an average particle size of 0.5 mm. The correlation coefficients, R2, of curve fitting within the range of experimental error bars are all higher than 0.95. We find that the maximum allowable range of experimental error is around the average particle size of 0.5 mm, which is about 1.5 to 2 times larger than the error ranges for the average particle sizes of 0.35 mm and 0.65 mm. Additionally, the corresponding average particle size is 0.52 mm when MFL is at its maximum.
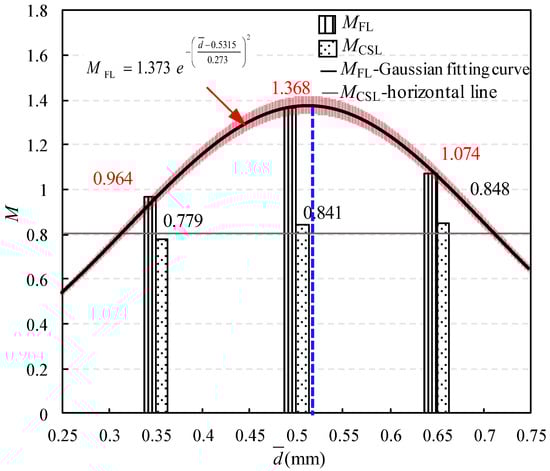
Figure 6.
The variation in the stress ratio of glass beads under different average particle sizes. Note: The red line represents the fitting error, and the blue line represents the average particle size corresponding to the maximum peak stress ratio.
3.1.3. Nonlinear Analysis of the Secant Modulus Eu
The initial shear stiffness and the degree of variation in shear stress before specimen failure are significant for studying the deformation behavior of soil [41,42]. Therefore, the secant modulus Eu50 is a parameter used to measure the deformation of soil samples, representing the secant modulus at 50% of the failure strength [43]. The schematic diagram is shown in Figure 7. The nonlinear stress analysis before peak shear stress is particularly crucial. The secant modulus Eu50 is expressed as follows:
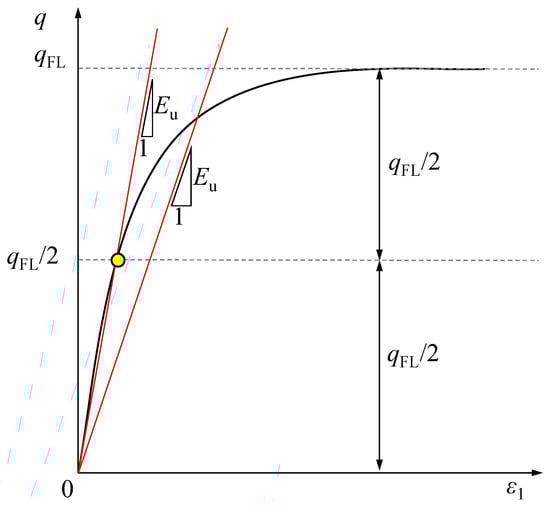
Figure 7.
Diagram of the determination of Eu50. Note: The red line represents the secant modulus, and the yellow dot represents 1/2 of the peak shear stress.
The secant modulus Eu is analyzed to study the deformation characteristics of the specimen. The secant modulus Eu of soil refers to the slope of the secant line between the origin and a specific point in the stress–strain curve, which can reflect the nonlinearity of a specimen’s deformation. Its expression is as follows:
Using Eu/Eu50 as an evaluation index effectively expresses the deformation behaviors of soil under different conditions. For example, a higher Eu/Eu50 indicates greater soil deformation, further suggesting lower soil compactness. Eu/Eu50 provides data support for the mechanism analysis of glass beads. Relevant studies [44] show that the normalized modulus Eu/Eu50 curve is nearly identical for both undisturbed and remodeled soil specimens. Using Eu50 as the normalization factor, the Eu-ε1 relationship is normalized to obtain the Eu-ε1 and Eu/Eu50-ε1 relationships in semi-logarithmic coordinates, as shown in Figure 8. As the average particle size increases, Eu first increases and then decreases, while Eu/Eu50 exhibits the opposite trend. The stress nonlinearity of the specimen with an average particle size of 0.5 mm is minimal. As the axial strain increases, both Eu and Eu/Eu50 show a “first rapid decrease and then slow decrease” trend. Both Eu and Eu/Eu50 increase with rising effective confining pressure.
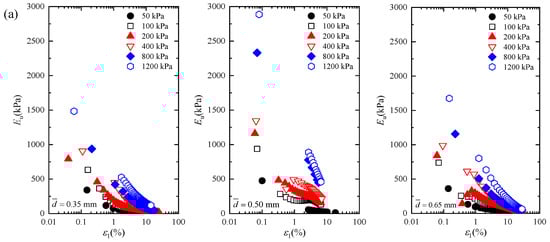
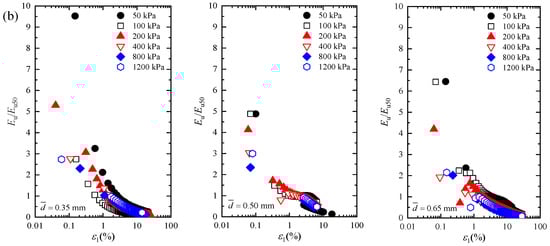
Figure 8.
Nonlinear analysis results of the secant modulus Eu and normalized modulus Eu/Eu50. (a) Secant modulus Eu; (b) Normalized modulus Eu/Eu50.
3.2. Mechanism Analysis
The research found that the strain-softening phenomenon is not apparent under low confining pressure, while the strain-softening phenomenon is apparent under a high confining pressure. Under a high confining pressure, the peak shear stress is highest at an average particle size of 0.52 mm. As the effective confining pressure increases, the initial shear stiffness gradually increases. To analyze these reasons, this paper conducted a mechanism analysis. Figure 9 shows the schematic diagram of the shear mechanism under different confining pressures and average particle sizes. It can be seen that the particles are initially in a relatively dense state under a low confining pressure. During the shearing process, the particle pores continuously decrease, resulting in a dense state. For an average particle size of 0.35 mm, during the shearing process, the particles gradually change from a parallel distribution to a filled distribution, and the particles expand towards the middle and two sides without evident shear bands until reaching a critical state. The particle porosity remains stable in a dense state, and there is no strain-softening phenomenon. Under a high confining pressure, particles are initially in a dense state and distributed in a filled distribution. The initial shear stiffness is relatively high during the early shearing phase, and the elastic shear state is apparent. After reaching the peak shear stress, obvious local cracks appear between particles, and the particles transition from a dense state (filled distribution) to a denser state (parallel distribution). At this point, the porosity continues to increase, and phenomena such as translation and rolling occur along the fracture surface until reaching a residual stable state. Afterward, the particle porosity no longer changes, and strain-softening becomes apparent. Notably, a slight strain-softening phenomenon also occurs under a low effective confining pressure. When shear failure occurs, the shear motion patterns of both particles of an effective confining pressure (a high confining pressure and a low effective confining pressure) are roughly the same, and both slide along the local cracks between particles. However, as the effective confining pressure increases and the glass beads are smoother than the surface, the local sliding of the particles is intensified, and the strain-softening phenomenon under a high effective confining pressure is more obvious.
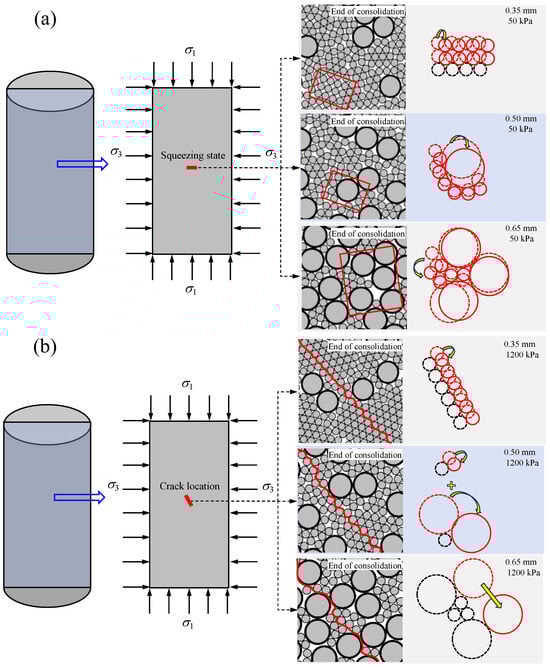
Figure 9.
Mechanism analysis. (a) Low effective confining pressure; (b) High effective confining pressure.
Under the same confining pressure, at a low confining pressure (50 kPa), particles continuously compact during the shearing process. At this point, the porosity continuously decreases until it stabilizes, with small particles filling the gaps between large particles, and no shear failure surface occurs, resulting in approximately the same peak shear stress for the particles. Under a high confining pressure (1200 kPa), local cracks occur after reaching the peak shear stress. The particle shear motion patterns differ under various average particle sizes: ① For an average size of 0.35 mm, particles move along the fracture surface, transitioning from a filling distribution to a parallel distribution. ② For an average size of 0.5 mm, the motion patterns involve large and small particles rolling over one another. ③ For an average size of 0.65 mm, large particles move and roll along the fracture surface. For particles with an average particle size of 0.5 mm, the tiny particles fill the gaps between the large particles, and the porosity is higher than the other two types of particles. This explains the maximum peak shear stress with an average particle size of 0.52 mm under a high confining pressure.
4. Parameters of Shear Strength
Most scholars [45,46,47] have used the Mohr–Coulomb strength criterion to calculate the peak effective internal friction angle φ, the formula of which is . However, the peak effective internal friction angle φ is determined when reaches a certain limit point, which may lead to errors in the calculation results. Therefore, the peak stress ratio MFLi is determined by fitting multiple stress ratios in the p’ and q space. Then, the peak effective internal friction angle φ is determined by the formula conversion of the peak stress ratio MFLi. In the p’ and q space, the slope formula of the failure line under a single effective confining pressure is q = MFLip. For a conventional triaxial compression test, the expression for the peak stress ratio MFLi is as follows:
By converting Equation (9), the expression of the peak effective internal friction angle φ is as follows [34]:
The peak effective internal friction angle φ first increases and then decreases with the increase in the average particle size , which conforms to the trend of Gaussian function variation. Therefore, we choose the peak effective internal friction angle φ as the dependent variable and the average particle size as the independent variable for Gaussian function fitting. The formula is as follows:
where a2, b2, and c2 are fitting parameters.
Figure 10 shows the variation in the peak effective internal friction angle φ. It is found that the range of the peak effective internal friction angle φ from 23° to 35° and it first increases and then decreases with the increase in effective confining pressure. It is largest under an effective confining pressure of 100 kPa and smallest under a high confining pressure of 1200 kPa. The peak effective internal friction angle φ of samples with an average particle size of 0.5 mm is higher than 30°, while the peak effective internal friction angle φ of samples with an average particle size of 0.35 mm is less than 27°. As the average particle size increases, the peak effective internal friction angle φ first increases and then decreases, which can also be expressed using the Gaussian function (see Equation (11)), as shown in Figure 11. We added error bars for correlation coefficients R2 higher than 95%. It is also found that the maximum allowable range of experimental error is around the average particle size of 0.5 mm, which is about 1.5 to 2 times larger than the average particle sizes of 0.35 mm and 0.65 mm. By fitting the Gaussian function, the average particle sizes corresponding to the maximum peak effective internal friction angle φ under the effective confining pressure of 50 kPa, 100 kPa, 200 kPa, 400 kPa, 800 kPa, and 1200 kPa are determined to be 0.518 mm, 0.533 mm, 0.529 mm, 0.531 mm, 0.524 mm, and 0.517 mm, respectively, which is consistent with the maximum shear stress determined in Figure 7 at an average particle size of 0.52 mm.
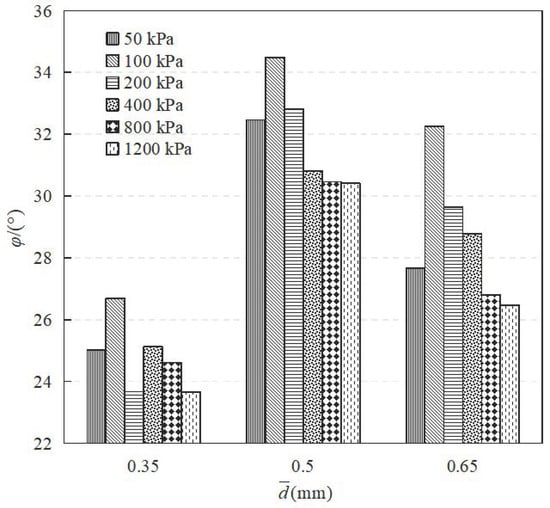
Figure 10.
The variation in the peak effective internal friction angle φ.
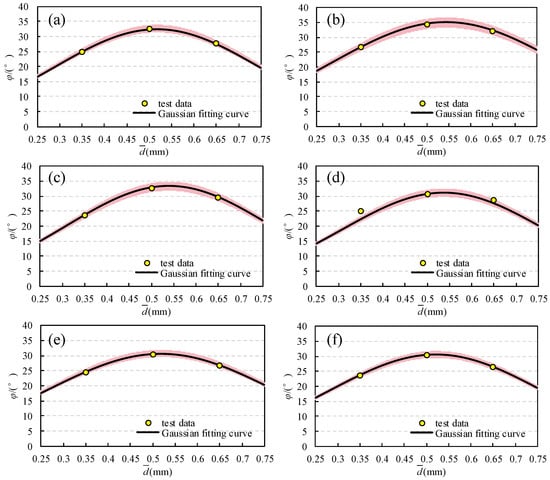
Figure 11.
Determination of maximum value of peak effective internal friction angle. (a) 50 kPa; (b) 100 kPa; (c) 200 kPa; (d) 400 kPa; (e) 800 kPa; and (f) 1200 kPa.
We obtain an average particle size of 0.52 mm at the optimal effective internal friction angle. Due to the same density of glass beads with two different particle sizes (0.25 mm and 0.75 mm), the mass relationship between glass beads with particle sizes of 0.75 mm and 0.25 mm is as follows:
Therefore, the average particle size of the optimal shear behavior of glass beads is determined to be 0.52 mm. Combined with Equations (1) and (12), the ratio of 0.25 mm to 0.75 mm is 23:27.
5. Discussion of Fractal Dimension D
The fractal dimension D can describe the complexity of the particle distribution in space. By analyzing the fractal dimension D of particles, we can understand their relationships and arrangements, and subsequently study the frictional mechanical behavior of the particles. As mentioned in the introduction, we focus on how the ratio of glass beads affects the shear mechanical properties. Therefore, in this section, we will establish the relationship between the fractal dimension D and average particle size , then quantitatively evaluate the changes in the internal friction angle under different fractal dimensions D, and finally obtain the range of fractal dimension D under well-graded conditions.
We use the fractal model grading equation proposed by Talbot et al. [48,49,50,51] to calculate the fractal dimension D, as follows:
where Pi is the accumulative mass percentage less than the particle size di (%); dmax is the maximum particle size. di is the particle size. Since we used two particle sizes of glass beads, 0.25 mm and 0.75 mm, the value of Pi is determined by the accumulative fraction of the small particle size (0.25 mm). Combined with Equation (10), the nonlinear functional relationship between the average particle size and the fractal dimension D is established as follows, as shown in Figure 12a. The correlation coefficient R2 of the fitting formula is 0.9986.
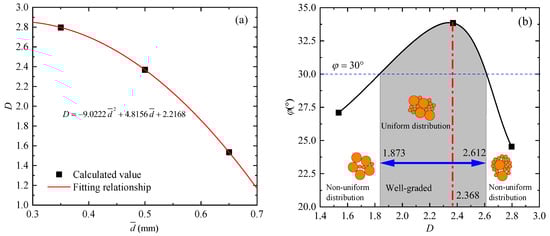
Figure 12.
Discussion of fractal dimension D. (a) The relationship between D and ; (b) The relationship between φ and D. Note: The dotted red line is the fractal dimension D corresponding to the maximum value of the peak effective internal friction angle φ.
In Section 4, we analyze the variation in the peak internal friction angle φ under a single effective confining pressure and provide the optimal ratio. In this section, the MFL in Figure 5 and Equation (10) are combined to calculate the peak internal friction angle φ under the overall effective confining pressure. Meanwhile, we plot the relationship between the peak internal friction angle φ and fractal dimension D, as shown in Figure 12b. In addition, binary granular materials can effectively describe the mechanical properties of particles with different gradations [52], but the range of fractal dimension D under well-graded conditions is not analyzed. Under well-graded conditions, small particles fill the spaces between large particles, resulting in a higher density of particles in the initial state and a higher peak internal friction angle φ.
In addition, the range for well-graded sand is defined by the non-uniformity coefficient Cu > 5 and the curvature coefficient 1 < Cc < 3 [53]. We conducted a literature review on sand with particle sizes ranging from 0.1 mm to 1 mm. The Cu and Cc values for the sand used by Yu [54] are 1.65 and 0.38, respectively, and the peak effective internal friction angle φ is 21.2°(poorly graded, undrained test); The Cu and Cc values for the sand used by Liu et al. [55] are 2.29 and 1.34, respectively, and the peak effective internal friction angle φ is 26.5°(poorly graded, undrained test, Dr = 12.6%); The Cu and Cc values for the sand used by Fu et al. [56] are 6 and 2.7, respectively, and the peak effective internal friction angle φ is 42° (well-graded, undrained test, Dr = 32%). However, due to various factors such as sand particle size, surface roughness, initial relative density, and drained conditions, the peak effective internal friction angle φ varies significantly. Therefore, we take the peak effective internal friction angle φ of 30° as the standard line for well-graded according to the data of literature investigation. Then, the modified Bezier curve is used to connect the peak effective internal friction angle φ with the fractal dimension, and the fractal dimension D range of well-graded particles is determined to be 1.873 to 2.612, and the corresponding average particle size ranges from 0.433 to 0.598. This is basically consistent with the fractal dimension D of coal gangue calculated by Zhang [57], which ranges from 1.8867 to 2.6309. We believe that the shear strength is related to the uniformity of the particle distribution of the glass beads, as shown in Figure 5b. In a well-graded range, the ratio of particle size 0.25 mm to 0.75 mm glass beads is close. The small particles fill the spaces between the large particles, resulting in a uniform distribution and, consequently, higher shear strength. However, within the range of poor grading, the particle distribution exhibits non-uniformity. This leads to a low density of the specimen, which further results in low shear strength. Meanwhile, we obtain that the fractal dimension of the glass beads is 2.368 under optimal mechanical properties. Our focus is on studying the influence of the particle ratio on the shear characteristics of glass beads. In future research, the influence of external factors (humidity and temperature), poor grading, and particle shape on the shear characteristics and long-term stability of glass beads will still be a hot topic. Meanwhile, utilizing the shear mechanical parameters of glass beads to simulate actual sand engineering has certain reference significance. In addition, it is essential to consider the potential commercial and economic impact of using glass beads as alternative building materials.
6. Conclusions
We conducted consolidation undrained triaxial tests on glass beads with different ratios and analyzed their shear mechanical properties and mechanisms. Additionally, we determined the particle size ratio and fractal dimension D under optimal shear behavior, as well as the range of fractal dimensions D under well-graded conditions. The main conclusions are as follows:
- (1)
- Strain-softening under a high confining pressure is more pronounced than under a low confining pressure. Under a high confining pressure, the peak shear stress first increases and then decreases as the average particle size increases.
- (2)
- As the effective confining pressure increases, the secant modulus Eu gradually increases, while the pore water pressure first increases and then decreases. Before the specimen reaches the peak shear stress, the normalized modulus ratio Eu/Eu50 first decreases and then increases as the average particle size increases. The particle ratio and arrangement are fundamental reasons for the different macroscopic shear behaviors of particles.
- (3)
- The peak effective internal friction angle φ ranges from 23° to 35° and first increases and then decreases with the increase in effective confining pressure. With the increase in average particle size, the peak shear stress and peak effective internal friction angle φ first increase and then decrease, both of which can be expressed by a Gaussian function.
- (4)
- The range of the fractal dimension D for well-graded particles is 1.873 to 2.612, and the corresponding average particle size ranges from 0.433 to 0.598. Under the optimal mechanical properties of glass beads, the particle size ratio of 0.25 mm to 0.75 mm is 23:27, and the fractal dimension D is 2.368.
- (5)
- In this paper, the average particle size and fractal dimension D of glass beads with optimal shear properties are determined, aiming to provide parameter support for geotechnical engineering design and simulation, such as sandy soil subgrade, while considering the influence of grading factors. Meanwhile, it is of great significance to reveal the relationship between the macroscopic particle friction mechanism and sand particle size distribution.
Author Contributions
Conceptualization, X.L. and R.W.; methodology, X.L. and R.W.; validation, R.W.; formal analysis, R.W.; investigation, R.W.; resources, X.L.; data curation, R.W; writing—original draft preparation, X.L. and R.W.; writing—review and editing, X.L. and R.W.; visualization, R.W.; supervision, X.L.; project administration, X.L.; funding acquisition, X.L. All authors have read and agreed to the published version of the manuscript.
Funding
This work was financially supported by the National Natural Science Foundation of China (Grant No. 12162028), the Projects for Leading Talents of Science and Technology Innovation of Ningxia (Grant No. KJT2019001), and The Innovation Team for Multi-Scale Mechanics and Its Engineering Applications of Ningxia Hui Autonomous Region (2021), and these supports are gratefully acknowledged.
Data Availability Statement
The data used to support the findings of this study are available from the corresponding author upon request.
Conflicts of Interest
The authors declare no conflicts of interest.
References
- Li, Y.; Tian, C.; Wen, L.; Chen, A.; Wang, L.; Qiu, W.; Zhou, H. A study of the overtopping breach of a sand-gravel embankment dam using experimental models. Eng. Fail. Anal. 2021, 124, 105360. [Google Scholar] [CrossRef]
- Chen, J.; Cai, X.; Lale, E.; Yang, J.; Cusatis, G. Centrifuge modeling testing and multiscale analysis of cemented sand and gravel (csg) dams. Constr. Build. Mater. 2019, 223, 605–615. [Google Scholar] [CrossRef]
- Shen, D.; Shi, Z.; Zheng, H.; Yang, J.; Hanley, K.J. Effects of grain composition on the stability, breach process, and breach parameters of landslide dams. Geomorphology 2022, 413, 108362. [Google Scholar] [CrossRef]
- Jafarian, Y.; Mehrzad, B.; Lee, C.; Haddad, A. Centrifuge modeling of seismic foundation-soil-foundation interaction on liquefiable sand. Soil Dyn. Earthq. Eng. 2017, 97, 184–204. [Google Scholar] [CrossRef]
- Yan, Z.; Liu, R.; Lv, P.; Zhang, H. Model tests on jacking installation and lateral loading performance of a new skirted foundation in sand. Ocean Eng. 2020, 197, 106914. [Google Scholar] [CrossRef]
- Ding, Y.; Zhang, J.; Chen, X.; Wang, X.; Jia, Y. Experimental investigation on static and dynamic characteristics of granulated rubber-sand mixtures as a new railway subgrade filler. Constr. Build. Mater. 2021, 273, 121955. [Google Scholar] [CrossRef]
- Arulrajah, A.; Yaghoubi, E.; Imteaz, M.; Horpibulsuk, S. Recycled waste foundry sand as a sustainable subgrade fill and pipe-bedding construction material: Engineering and environmental evaluation. Sustain. Cities Soc. 2017, 28, 343–349. [Google Scholar] [CrossRef]
- Shen, J.; Wang, X.; Shan, Y.; Cui, J.; Chen, X.; Wang, X.; Zhu, C. Particle breakage and shape analysis of calcareous sand under consolidated—Undrained triaxial shear. Bull. Eng. Geol. Environ. 2022, 81, 232. [Google Scholar] [CrossRef]
- Abdallah, K.; Abdelkader, B.; Djamel Eddine, B.; Benali, N.; Basma, L.; Ahmed, A. Effect of Non-plastic Fines Content and Gradation on the Liquefaction Response of Chlef Sand. Transp. Infrastruct. Geotechnol. 2024, 11, 2638–2670. [Google Scholar] [CrossRef]
- Liang, J.; Lu, D.; Du, X.; Wu, W.; Ma, C. Non-orthogonal elastoplastic model for sand with dilatancy. Comput. Geotech. 2020, 117, 103329. [Google Scholar] [CrossRef]
- Fan, G.-W.; Li, X.-F. Hypoplastic constitutive model of inherently anisotropic sand. Comput. Geotech. 2024, 175, 106645. [Google Scholar] [CrossRef]
- Fan, G.W.; Li, X.F. On anisotropic local bifurcation based on hypoplastic model. Int. J. Mech. Sci. 2024, 284, 109733. [Google Scholar] [CrossRef]
- Lu, D.; Zhou, X.; Du, X.; Wang, G. A 3D fractional elastoplastic constitutive model for concrete material. Int. J. Solids Struct. 2019, 165, 160–175. [Google Scholar] [CrossRef]
- Abduljabbar, A.; Mohyaldinn, M.; Younis, O.; Alghurabi, A. A numerical cfd investigation of sand screen erosion in gas wells: Effect of fine content and particle size distribution. J. Nat. Gas Sci. Eng. 2021, 95, 104228. [Google Scholar] [CrossRef]
- Lv, Y.; Wang, Y.; Zuo, D. Effects of particle size on dynamic constitutive relation and energy absorption of calcareous sand. Powder Technol. Int. J. Sci. Technol. Wet Dry Part. Syst. 2019, 356, 21–30. [Google Scholar] [CrossRef]
- Adegbule, A.O.; Yan, S.; Papelis, C.; Kibbey, T.C. The effect of sand grain roughness on the grain-scale spatial distribution of grain-surface precipitates formed by evaporation. Colloids Surf. A Physicochem. Eng. Asp. 2018, 548, 134–141. [Google Scholar] [CrossRef]
- Yang, H.; Baudet, B.A. Characterisation of the roughness of sand particles. Procedia Eng. 2016, 158, 98–103. [Google Scholar] [CrossRef][Green Version]
- Kimura, S.; Kaneko, H.; Ito, T.; Minagawa, H. The effect of effective normal stress on particle breakage, porosity and permeability of sand: Evaluation of faults around methane hydrate reservoirs. Tectonophysics 2014, 630, 285–299. [Google Scholar] [CrossRef]
- Molaikbasi, H.; Saberian, M.; Li, J. Prediction of compressive and tensile strengths of zeolite-cemented sand using porosity and composition. Constr. Build. Mater. 2019, 202, 784–795. [Google Scholar] [CrossRef]
- Jena, H.; Sahoo, B.; Roy, G.; Meikap, B. Characterization of hydrodynamic properties of a gas–liquid–solid three-phase fluidized bed with regular shape spherical glass bead particles. Chem. Eng. J. 2008, 145, 50–56. [Google Scholar] [CrossRef]
- Enferad, S.; Pillitteri, S.; Lumay, G.; Gaiani, C.; De Richter, S.K.; Marck, M.; Umbetov, S.; Vandewalle, N.; Jenny, M. Powder flow behavior governed by the surface properties of glass beads. Powder Technol. 2021, 388, 425–433. [Google Scholar] [CrossRef]
- Hazzar, L.; Nuth, M.; Chekired, M. Dem simulation of drained triaxial tests for glass-beads. Powder Technol. 2019, 364, 123–134. [Google Scholar] [CrossRef]
- Xu, W.; Li, X.; Yang, W.; Jia, H. Triaxial test on glass beads simulating coarse-grained soil. Res. Cold Arid Reg. 2022, 14, 274–280. [Google Scholar] [CrossRef]
- Xiao, Y.; Hu, J.; Shi, J.; Liang, F. Static and cyclic liquefaction of granular materials considering grain morphology. Transp. Geotech. 2023, 42, 101107. [Google Scholar] [CrossRef]
- Gong, J.; Pang, X.; Tang, Y.; Liu, M.; Jiang, J.; Ou, X. Effects of particle shape, physical properties and particle size distribution on the small-strain stiffness of granular materials: A DEM study. Comput. Geotech. 2024, 165, 105903. [Google Scholar] [CrossRef]
- Manmatharajan, M.V.; Ingabire, E.-P.; Sy, A.; Ghafghazi, M. Effect of particle size and particle size distribution on the post-liquefaction strength of granular soils. Soils Found. 2023, 63, 101336. [Google Scholar] [CrossRef]
- Wang, J.; Lin, G.; Tang, R.; Zhang, Y.; Yao, Z.; Feng, K.; Tian, N.; Chen, Z.; He, C. A particle-scale insight into the face stability of shallow EPB shield tunnels in dry cobble-rich soil. Tunn. Undergr. Space Technol. 2024, 144, 105516. [Google Scholar] [CrossRef]
- Andrianatrehina, N.L.; Souli, H.; Rech, J.; Fry, J.-J.; Fleureau, J.-M.; Taibi, S. Influence of the percentage of sand on the behavior of gap-graded cohesionless soils. Comptes Rendus. Mec. 2016, 344, 536–546. [Google Scholar] [CrossRef]
- Dutta, T.; Otsubo, M.; Kuwano, R. Stress wave transmission and frequency-domain responses of gap-graded cohesionless soils. Soils Found. 2021, 61, 857–873. [Google Scholar] [CrossRef]
- Ghali, M.; Chekired, M.; Karray, M. A laboratory-based study correlating cone penetration test resistance to the physical parameters of uncemented sand mixtures and granular soils. Eng. Geol. 2019, 255, 11–25. [Google Scholar] [CrossRef]
- Li, X.; Ma, J.; Lv, L. Glass Beads Test with True Triaxial Stress Path Achieved by Conventional Triaxial Apparatus. Fractal Fract. 2024, 8, 193. [Google Scholar] [CrossRef]
- Yilmaz, Y.; Deng, Y.; Chang, C.S.; Gokce, A. Strength–dilatancy and critical state behaviours of binary mixtures of graded sands influenced by particle size ratio and fines content. Géotechnique 2021, 73, 202–217. [Google Scholar] [CrossRef]
- Zuo, K.; Gu, X.; Hu, C.; Hu, J.; Gao, G. Shear stiffness of sand-fines binary mixtures: Effects of sand gradation and fines content. Constr. Build. Mater. 2023, 383, 131364. [Google Scholar] [CrossRef]
- Li, Y.; Aydin, A.; Xu, Q.; Chen, J. Constitutive behavior of binary mixtures of kaolin and glass beads in direct shear. Ksce J. Civ. Eng. 2012, 16, 1152–1159. [Google Scholar] [CrossRef]
- Fedakar, H.I.; Cetin, B.; Rutherford, C.J. Deformation characteristics of medium-dense sand-clay mixtures under a principal stress rotation. Transp. Geotech. 2021, 30, 100616. [Google Scholar] [CrossRef]
- Shen, Y.; Rui, X.; Ma, Y.; Shen, J.; Xu, J. Anisotropic behaviors of calcareous sand dependent on loading direction and initial shear stress. Appl. Ocean. Res. 2023, 141, 103775. [Google Scholar] [CrossRef]
- Chitravel, S.; Otsubo, M.; Kuwano, R. Effects of seepage flow on liquefaction resistance of uniform sand and gap-graded soil under undrained cyclic torsional shear. Soils Found. 2023, 63, 101363. [Google Scholar] [CrossRef]
- Umar, M.; Kiyota, T.; Chiaro, G.; Duttine, A. Post-liquefaction deformation and strength characteristics of sand in torsional shear tests. Soils Found. 2021, 61, 1207–1222. [Google Scholar] [CrossRef]
- Ma, Z.; Li, X. Experiments on the State Boundary Surface of Aeolian Sand for Road Building in the Tengger Desert. Appl. Sci. 2023, 13, 879. [Google Scholar] [CrossRef]
- Wang, R.; Guo, J.; Lei, S.; Wang, X.; Rong, W.; Yu, Z. A study on the cyclic shear and particle breakage characteristics of the interface between steel and calcareous sand. Mar. Georesources Geotechnol. 2022, 41, 1426–1439. [Google Scholar] [CrossRef]
- Mohamad, H.M.; Zainorabidin, A.; Mohamad, M.I. Maximum strain effect and secant modulus variation of hemic peat soil at large deformation due to cyclic loading. Civil Eng. J. 2022, 8, 2243–2260. [Google Scholar] [CrossRef]
- Koseki, J.; Kawakami, S.; Nagayama, H.; Sato, T. Chance of Small Strain Quasi-elastic Deformation Properties During Undrained Cyclic Torsional Shear and Triaxial Tests of Toyoura Sand. J. Jpn. Geotech. Soc. 2008, 40, 101–110. [Google Scholar] [CrossRef]
- Kantesaria, N.; Sachan, A. Small Strain Shear Modulus and Yielding Characteristics of Compacted High Plasticity Clay. Géotechnique 2021, 72, 424–437. [Google Scholar] [CrossRef]
- Gao, Y.; Luo, W.; Luo, J.; Qian, J.; Zhang, H. Nonlinear characteristics and comparison of triaxial undrained shear moduli of soft soils under two consolidation states. Chin. J. Geotech. Eng. 2021, 43, 64–67. (In Chinese) [Google Scholar]
- Vikash, G.; Prashant, A. Calibration of 3-d failure criteria for soils using plane strain shear strength data. Geotech. Spec. Publ. 2010, 200, 86–91. [Google Scholar] [CrossRef]
- Li, X.F.; Fan, G.W. On strain localization of aeolian sand in true triaxial apparatus. Acta Geotech. 2024, 19, 3115–3128. [Google Scholar] [CrossRef]
- Xu, P.; Sun, Z.; Shao, S.; Fang, L. Comparative analysis of common strength criteria of soil materials. Materials 2021, 14, 4302. [Google Scholar] [CrossRef]
- Lan, G.; Sun, W.; Zhang, X.; Chen, Y.; Tan, W.; Li, X. A three-dimensional fractal model of the normal contact characteristics of two contacting rough surfaces. AIP Adv. 2021, 11, 055023. [Google Scholar] [CrossRef]
- Al-Raeei, M. Morse potential specific bond volume: A simple formula with applications to dimers and soft-hard slab slider. J. Phys. Condens. Matter. 2022, 34, 284001. [Google Scholar] [CrossRef]
- Kumar, A. Dynamic behaviour and semi-analytical solution of nonlinear fractional-order Kuramoto–Sivashinsky equation. Pramana 2024, 98, 48. [Google Scholar] [CrossRef]
- Talbot, A.N.; Richart, F.E. The strength of concrete-its relation to the cement, aggregates and water. Ill. Univ Eng Exp Sta Bull. 1923, 137, 117–118. [Google Scholar]
- Yang, D.; Chu, X. The Effects of the Particle Size Ratio on the Behaviors of Binary Granular Materials. CMES Comput. Model. Eng. Sci. 2023, 136, 63–85. [Google Scholar] [CrossRef]
- Li, G.X. Advanced Soil Mechanics; Tsinghua University Press: Beijing, China, 2016. (In Chinese) [Google Scholar]
- Yu, F. Characteristics of particle breakage of sand in triaxial shear. Powder Technol. 2017, 320, 656–667. [Google Scholar] [CrossRef]
- Liu, J.; Wang, G.; Kamai, T.; Zhang, F.; Yang, J.; Shi, B. Static liquefaction behavior of saturated fiber-reinforced sand in undrained ring-shear tests. Geotext. Geomembr. 2011, 29, 462–471. [Google Scholar] [CrossRef]
- Fu, X.-J.; Zhao, Z.-H. Laboratory study of the instability of saturated silty sand. Rock Soil Mech. 2008, 29, 381–385. (In Chinese) [Google Scholar]
- Zhang, Z.-T. Dynamic Behaviors and the Evolution of Particle Breakage for Coal Gangue Subgrade Filler under Cyclic Loading; University of Science and Technology of Hunan: Xiangtan, China, 2021. [Google Scholar]


Disclaimer/Publisher’s Note: The statements, opinions and data contained in all publications are solely those of the individual author(s) and contributor(s) and not of MDPI and/or the editor(s). MDPI and/or the editor(s) disclaim responsibility for any injury to people or property resulting from any ideas, methods, instructions or products referred to in the content. |
© 2024 by the authors. Licensee MDPI, Basel, Switzerland. This article is an open access article distributed under the terms and conditions of the Creative Commons Attribution (CC BY) license (https://creativecommons.org/licenses/by/4.0/).