Abstract
Modern power systems are confronted with widespread concern on the frequency stability issue due to the widespread integration of randomly fluctuating renewable resources. To address the above concern, this work introduces a load-frequency-control (LFC) scheme based on a parameter tuning strategy for fractional-order proportional–integral–derivative (FOPID) controller. Firstly, a two-area interconnected power system (IPS) model, including thermal, hydro, solar, wind, and gas power generator and a hydrogen-based energy-storage unit, is established. Then, a FOPID controller is designed for this IPS model, and an improved gradient-based optimizer (IGBO) is developed to adaptively regulate the parameters of the FOPID controllers. Finally, the effectiveness of the offered LFC scheme is tested through load disturbance and renewable energy fluctuations test scenarios and provides a comparison and robustness analysis among different schemes. The test results validated that the offered LFC scheme can effectively suppress the frequency fluctuations of the IPS and has excellent robustness.
1. Introduction
Development and application of renewable energy generation technology could be one critical enabler of the global transition to low-carbon emissions economies [1]. Nevertheless, solar energy, wind energy, tidal energy, and other renewable energies have random and fluctuating characteristics, and renewable energy generators have almost no inertia contribution to power grids since these generators are isolated to the grids by power electronic converters [2,3]. As a result, the IPSs with a substantial integration of renewable energy generators always face a frequency stability issue, and a suitable design of the LFC method is commonly required for these power systems.
Over the past few years, various intelligent control technologies such as model predictive control [4], sliding mode control [5], reinforcement learning [6], active disturbance rejection control [7], and fuzzy logic control [8] have been utilized in the design of load frequency control (LFC). The LFC scheme developed by the above technologies are usually effective in different test scenarios, but the major challenge of employing these methods is their heavy reliance on model accuracy and engineering feasibility, while the traditional proportional–integral–derivative (PID) controller-based LFC design, in fact, remains the most extensively used approach in practice due to its advantages of simple structure and low engineering implementation difficulty [9,10]. However, the interconnected structure and complicated module expressions of modern IPSs make the empirical parameter tuning methods time consuming and ineffective when using a PID controller-based LFC scheme. In addition, by using traditional PID controller-based LFC design and empirical parameter tuning methods, the robustness and dynamic properties of the system may also become worse in highly volatile, renewable-energy power generation facilities and highly flexible loads.
To address the above concerns, various parameter tuning and optimization techniques were developed for optimizing the PID controller-based LFC. These techniques include the whale optimization algorithm (WOA) [11], fuzzy rule (FL) [12], artificial neural network (ANN) [13], and gray wolf optimizer (GWO) [14]. According to these works, one can find that by introducing optimization strategies to regulate the parameters, the frequency stability of IPSs can be improved significantly. Nonetheless, traditional PID controllers only have three adjustable parameters, their parameter settings are limited, and their performance deteriorate with system nonlinearities and uncertainties. Therefore, the FOPID controller is proposed. The FOPID controller introduces fractional-order calculus operations to the traditional PID controller, which not only retains the simple structure of the traditional PID controller but also increases the adjustable dimensions of the controller parameters, thereby improving the disturbance rejection capability and robustness of the system in response to variations in the controlled system parameters [15,16,17]. Recently, such controllers have also been used for the LFC design. For example, in [18,19], a FOPID controller is utilized to mitigate the frequency fluctuations in multi-area IPSs. Moreover, the gases Brownian motion optimization (GBMO) and chaos game optimization (CGO) are exploited to tune the parameters of the controller, yielding satisfactory results. However, the investigated multi-area IPSs only involved conventional generating units, without taking into account renewable energy generation facilities. Studies [20,21] used a FOPID controller-based LFC scheme to enhance frequency regulation performance of the IPS with renewable energy power plants, and the controller parameters are tuned using Jellyfish Search Optimizer (JSO) and movable damped wave algorithm (MDWA), while renewable energy units were taken into account in their IPSs, the stochastic characteristics of the renewable energy sources were not considered. Study [22] proposed an LFC scheme based on improved particle swarm optimization (IPSO) to tune the parameters of a FOPID controller for a distributed generation system considering the randomness of renewable energy sources. The results of these studies confirm that in the application of LFC in IPSs, FOPID controllers exhibit superior dynamic performance compared to traditional PID controllers. However, previous studies have rarely considered the randomness of the renewable energy output when designing multi-area IPSs.
In addition, with the continuous construction of large-scale renewable energy generation facilities for various types of power sources, the integration of energy storage facilities has emerged as a prevalent supplementary method to enhance the frequency characteristics of IPSs with renewable resources [23,24]. Among various energy storage technologies such as pumped storage, flywheel energy storage, and electrochemical energy storage, hydrogen energy storage exhibits significant advantages in energy storage capacity and economic feasibility [25,26,27]. Over the last decade, various research groups have explored the utilization of hydrogen energy storage units in contributing to the frequency regulation of conventional power systems primarily powered by thermal power plants [28,29]. Building upon existing research, this study enhances the frequency response capability of an IPS considering the stochasticity of renewable energy sources by integrating hydrogen-based energy storage units.
In recent years, the gradient-based optimizer (GBO) has emerged as a promising solution for addressing optimization problems across diverse fields, primarily due to its simple yet powerful structure, ease of implementation, robust exploration capability, and ability to effectively evade local optima [30]. However, the GBO has some limitations when tackling large-scale and complex engineering problems, such as slow convergence speed and low precision in the later stages of the algorithm [31]. To address these challenges, this study proposes an improved GBO (IGBO) for obtaining optimal parameters for the FOPID controller in LFC issues within a two-area IPS integrated with hydrogen energy storage. Firstly, this study proposes a two-area IPS that considers the randomness of renewable resource, incorporating hydro, thermal, wind, photovoltaic, and gas turbine units, and hydrogen energy storage units. Subsequently, an improved Oustaloup approximation algorithm is employed to design FOPID controllers for the LFC system in the two-area IPS. Furthermore, an IGBO algorithm was developed to adaptively adjust the parameters of the FOPID controllers. Finally, a series of test scenarios is conducted to assess the effectiveness and superiority of the provided LFC scheme, and the robustness of the system was analyzed.
2. LFC Model of a Two-Area IPS
In general, modern power systems are formed by multiple interconnecting areas, with each area consisting of a variety of different types of power sources and load units. In this study, we focus on an IPS model consisting of two areas, which is depicted in Figure 1.
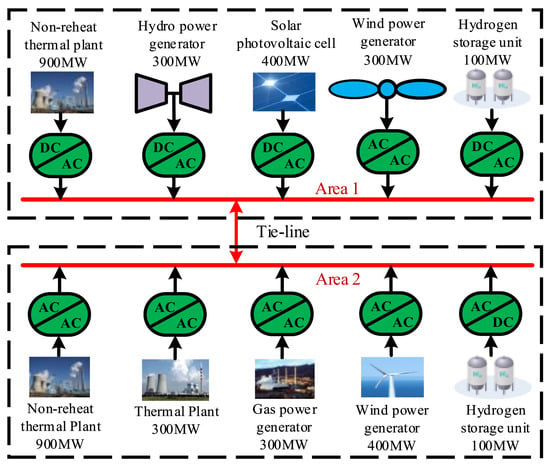
Figure 1.
Structure of a two-area IPS.
In the two-area IPS, the nominal frequency is 50 Hz, and the rated power of both area 1 and area 2 is 2000 MW. Area 1 comprises a non-reheat thermal plant, hydro power generator, solar photovoltaic cell, and wind power generator, while Area 2 consists of a thermal plant, non-reheat thermal plant, gas power generator, and wind power generator. Furthermore, hydrogen storage units are incorporated in both areas to enhance system performance. The mathematical models for each unit can be described as follows.
2.1. Mathematical Model of Thermal Power Plant
In a thermal power plant, the primary components are a speed governor and a steam turbine. The transfer function for the governor and steam turbine can be governed as
where and denote the time constants of the governor and turbine, respectively.
The transfer function of a reheater can be governed by
where and are the gain and time constants of the reheater, respectively.
2.2. Mathematical Model of Hydro Power Generator
The hydro power generator comprises a hydraulic turbine and a hydraulic governor, with its transfer function represented as
where and represent the time constants of the turbine and the governor, respectively. represents the reset time constant, R denotes the adjustment coefficient of hydro power generator, and is the transient fall rate.
2.3. Mathematical Model of Solar Photovoltaic Cell
The power output of a solar photovoltaic cell is [22]
where the coefficient represents the conversion efficiency of the photovoltaic unit. The coefficient S represents the surface area of the photovoltaic array, denotes the working temperature, and denotes the solar radiation on the photovoltaic array, which can be expressed as
where represents the step response, simulating sudden fluctuations, falls within the range [−0.015, 0.015], utilized to simulate stochastic aberrations. The mathematical model of photovoltaic system is
where and are the gain and time constants of the photovoltaic unit, respectively.
2.4. Mathematical Model of Wind Power Generator
The modeling of wind power generators consists of two parts: a nonlinear model and a transfer function model. The former, as described in [22], does not contribute to frequency regulation. The power output of a wind power generator is
where the coefficient refers to air density, and represents the swept area of blades. The coefficient denotes the power coefficient and denotes wind speed, which can be expressed as
where is the base fluctuation to simulate the base wind component. is small stochastic component, utilized to simulate noise wind component. represents the variance of the noise component, and represents the spectral density function. represents the frequency step, and belongs to the range . The dynamic model of the wind power generator is
where and represent the gain and time constants of the wind power generator, respectively.
The transfer function model focuses on the active standby of wind turbines and takes wind power as an active resource for frequency modulation [5], which can be mathematically expressed as
where , , , and denote the time and gain constants of the wind power governor, respectively.
2.5. Mathematical Model of Gas Power Generator
The mathematical model of gas power generator can be stated as [32]
where and represent the gain and time constants of the gas turbine, respectively. and are complex parameters that reflect the impact of the gas turbine on the phase and amplitude of the input signal, , , and are the time constants of the cooling system, fuel injection and entire gas power generator, respectively.
2.6. Mathematical Model of Hydrogen Storage Unit
The hydrogen storage system comprises an electrolyzer, a storage tank, and a hydrogen fuel cell. When surplus power is generated by the new energy generators within the system, the electrolyzer produces hydrogen, which is subsequently compressed and stored in the hydrogen storage tanks. During periods of heightened load demand and electricity scarcity, the hydrogen fuel cell converts the chemical energy into electrical power to meet the system’s load requirements. The mathematical model of the electrolyzer and the hydrogen fuel cell in the system can be represented as [28]
where and are the gain constants of the electrolyzer and the hydrogen fuel cell, respectively. and represent the time constants of the electrolyzer and the hydrogen fuel cell, respectively.
Based on the mathematical models of each unit, as well as the hydrogen storage unit, an LFC model is constructed for the IPS consisting of two areas, as depicted in Figure 2. In Figure 2, the term B is the frequency offset coefficient, , and represent the area control errors (ACE) for area 1 and area 2, respectively, and and represent the governor constants of the thermal plants and the hydro power generator, respectively. and represent the governor parameters of the gas power generator and wind power generator, respectively. , , , and represent the power distribution ratio of gas, thermal, non-reheat thermal, wind power, and hydro power generators, respectively, and represent load disturbances in area 1 and area 2, respectively. and denote the gain and time constants of the IPS, respectively. denotes the synchronization coefficient of the tie line, and and represent the frequency deviation of the area 1 and area 2, respectively. denotes the power flow of the tie line.
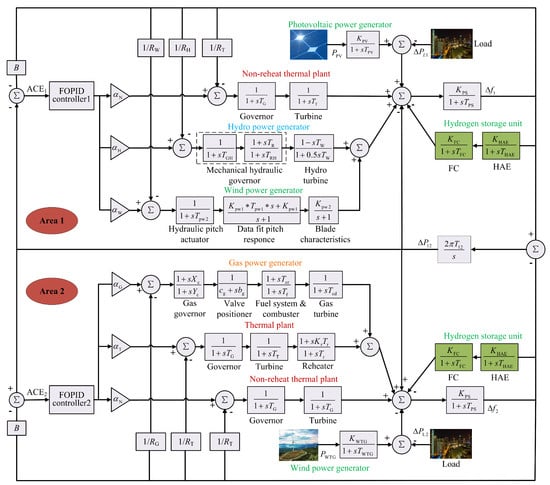
Figure 2.
LFC model of a two-area IPS.
3. Design of FOPID Controller-Based LFC
The LFC scheme in this study is based on a FOPID controller, which is two more parameters compared to the traditional PID controller. Basically, the transfer function of FOPID controller can be expressed by
where , and represent the proportional coefficient, integral coefficient and differential coefficient, respectively. Additionally, and denote the fractional integral operator and fractional differential operator, respectively. These ideal fractional-order operators cannot be implemented directly by integer-order rational fractions. Thus, French scholar Professor Oustaloup proposed a piecewise approximation method based on the Oustaloup filter, where all segments are composed of integer-order zeros and poles, resulting in the asymptotic magnitude-frequency response alternating between 0 and −20 dB/dec. The standard form of the Oustaloup filter is as follows:
where represents the order of the fractional-order operator, and represents the order of the filter. and represent the lower and upper limits of the predetermined frequency range. and represent the constructed zeros and poles of the transfer function, respectively. However, the approximation performance of the Oustaloup filter is unsatisfactory at the boundary points of the selected frequency range, and the order of the numerator is the same as that of the denominator. Therefore, this study has improved the above filter, and the mathematical model of the improved Oustaloup filter is as follows [33]:
where the coefficients b and d are preset coefficients with values of 9 and 10, respectively. The predetermined frequency band is set to [0.001 Hz, 1000 Hz], and is set to 5. The comparison between the ideal fractional-order operators and approximate fractional-order operators is shown in Figure 3.
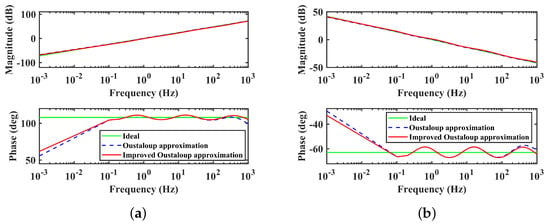
Figure 3.
Comparison of ideal fractional-order operators and approximate fractional-order operators: (a) Derivative of order 1.2. (b) Integral of order 0.7.
As depicted in Figure 3, it can be observed that within the predetermined frequency range, the amplitude–frequency characteristic curves of the approximate fractional-order operator and the ideal fractional-order operator coincide with each other. Additionally, the phase-frequency characteristic curves of both operators fall within the preset phase error range throughout the predetermined frequency range. Obviously, the fitting effect of the improved Oustaloup-based approximation method at the boundary points of the predetermined frequency band is better than that of the original Oustaloup-based approximation method. The results of the comparison confirm that the approximate fractional-order operators can be applied.
4. Parameter Tuning Process Based on IGBO
To ensure that the two-area IPS in Figure 2 can swiftly recover frequency stability under load or renewable resources fluctuations, this paper proposes a parameter tuning strategy by an IGBO algorithm, and the objective fitness function is formulated using the integral of time multiplied absolute error (ITAE) criterion based on the ACE, which can be written as
where is the total duration of the optimization process. With the objective of minimizing , the IGBO algorithm is utilized to tune the parameters of the FOPID controller in the IPS, and the LFC controller structure based on IGBO optimizer is shown in Figure 4.
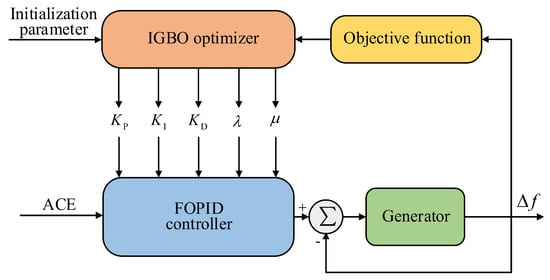
Figure 4.
LFC controller structure based on IGBO optimizer.
The proposed IGBO algorithm integrates the gradient search mechanism (GSM) based on the sorting algorithm and the improved local escape operator (ILEO) based on chaotic mapping during the optimization process [34]. The specific updating method of IGBO is as follows.
4.1. Initialization
The IGBO algorithm initializes the parameters of the FOPID controller based on
where , N corresponds to the total number of IGBO vectors. and denote the lower and upper bounds of the parameter space. denotes a randomly generated number within the range of 0 to 1.
4.2. Parameter Update Method Based on GSM
GSM is used for the global search in the parameter space, and its definition is given as
where represents a random number that follows a normal distribution, and represents a small number in the range of 0 to 0.1. is a crucial parameter that determines the global exploration ability of the IGBO algorithm. To obtain a better solution for the FOPID controller parameters, a sorting algorithm is proposed to update the parameter , which can be represented as
where is an integer randomly selected from 1 to N. Furthermore, the GSM definition is represented by Equation (29) for , and and are represented by Equation (32) and Equation (33), respectively.
where is a D-dimensional random vector, and D corresponds to the number of parameters of the FOPID controller to be optimized. is determined by the optimal solution () and the random selection vector () in the iterations. is the current number of iterations within the range 1 to , and represents the maximum number of iterations. The variables , , and represent distinct integers that are randomly selected from 1 to N.
where represents the worst vector during the iterations. is the direction of movement, guiding the individual vector towards a more optimal solution. The update method for parameter is the same as .
According to GSM, the IGBO generates two solutions with different capabilities using Equation (36) and Equation (37), respectively.
where Equation (36) is beneficial for the global search, and Equation (37) is beneficial for the local exploitation. Therefore, based on the solutions and , the IGBO generates the next solution () which is defined as
where and are two different random numbers, is the crossover probability, and its update method is the same as .
4.3. ILEO
The ILEO is used in IGBO to avoid algorithms falling into local optimality. The generation method of the ILEO vector solution can be expressed as
where is the second best solution. represents a solution that is randomly selected from 1 to N. Therefore, the next generation solutions generated by the IGBO can be represented as
where the term denotes a chaotic logistic map, and its update method is , and the initial LC is 0.67. The IGBO optimizes the parameters of two FOPID controllers in the following parameter space.
where indicates area 1 and area 2, respectively. The parameter tuning process based on IGBO is depicted in Figure 5.
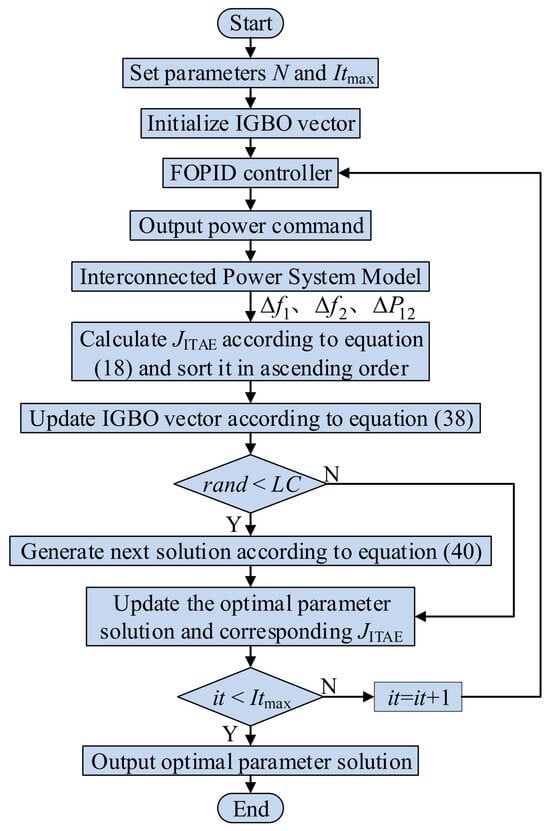
Figure 5.
Parameter tuning process based on IGBO algorithm.
5. Validation and Comparison
5.1. Performance Testing of IGBO
To validate the search capability of the proposed IGBO algorithm, PSO, WOA, MDWA, CGO, JSO, GBO, and IGBO were employed to minimize three congresses on evolutionary computation (CEC) benchmark functions (, , and ), separately. The simulations run on 64-bit Windows, which has 4 GB of memory. Set the number of iterations for all algorithms to 500. The test results are presented in Table 1. The convergence curves of the three benchmark functions under different algorithms are provided in Figure 6.
where is a unimodal standard function used to measure the exploitability of an algorithm. is a multimodal function used to test exploration performance. is a fixed-dimensional function used to demonstrate the ability to explore in low dimensions.

Table 1.
Benchmark test function values for different algorithms.
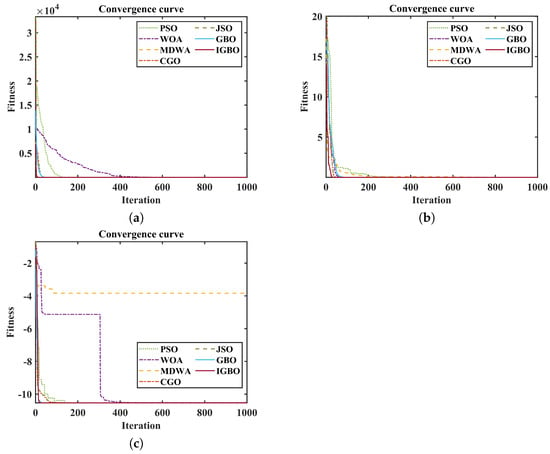
Figure 6.
Convergence curves of the three benchmark functions under different algorithms: (a) , (b) , (c) .
Based on Table 1 and Figure 6, it can be observed that for the unimodal function , the IGBO algorithm achieves a better minimum value compared to other algorithms. For multimodal function , both IGBO and GBO obtain the same minimum value, but the convergence speed of IGBO is faster than that of GBO. For fixed-dimensional function , IGBO converges to the minimum value of the benchmark function earliest. The test results indicate that the IGBO algorithm possesses high optimization capability and speed.
To test the effectiveness of the offered IGBO-FOPID-based LFC scheme in this study, a two-area IPS LFC model is constructed according to Figure 2 in this section, and the system parameter settings are depicted in Appendix A. The control performance of the IGBO-FOPID-based LFC scheme is compared with existing LFC methods, including the FOPID controller regulated through WOA (WOA-FOPID), MDWA (MDWA-FOPID), PSO (PSO-FOPID), CGO (CGO-FOPID), JSO(JSO-FOPID), and GBO tuned PID/FOPID controllers (GBO-PID/FOPID). The maximum number of iterations, , for each control scheme algorithm is set to 30, and N is set to 50. Table 2 lists the controller parameters obtained by different LFC schemes.

Table 2.
Parameters of two FOPID controllers obtained by different LFC schemes.
Based on the execution times of each optimization algorithm presented in Table 2, it is evident that the convergence speed of the IGBO has been enhanced. The LFC scheme in Table 2 is initially tested using step load-disturbance scenarios. Subsequently, its performance is validated under scenarios involving random fluctuations of photovoltaic and wind power. Furthermore, the robustness of the IPS is evaluated by varying the inertia constant.
5.2. Step Load-Disturbance Test Scenarios
In this scenario, the output of renewable energy units is not considered. At 0 s, 20 MW step load disturbances, i.e., 0.01 puMW are introduced to area 1 and area 2 at the same time. In simulation, the performances of eight different LFC schemes are compared, in which the GBO-PID, PSO-FOPID, MDWA-FOPID, WOA-FOPID, CGO-FOPID, JSO-FOPID, GBO-FOPID, and IGBO-FOPID-based LFC scheme are used. The response of the IPS under step load disturbance with different LFC schemes are depicted in Figure 7.
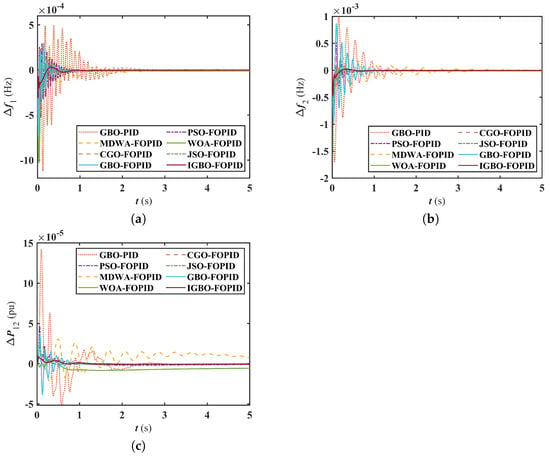
Figure 7.
Response curves of the IPS under step load-disturbance scenarios: (a) frequency deviation in area 1, (b) frequency deviation in area 2, (c) tie line power.
The results presented in Figure 7 demonstrate the superiority of the FOPID controller-based LFC scheme over the PID controller-based LFC scheme. Implementation of the FOPID controller leads to a considerable enhancement in system frequency modulation performance. Specifically, the FOPID controller-based LFC scheme effectively reduces the frequency deviation overshoot and minimizes the frequency fluctuation range within the system. Furthermore, the proposed IGBO-FOPID-based LFC scheme outperforms FOPID controllers optimized using PSO, MDWA, WOA, CGO, JSO, and GBO algorithms. Notably, the IGBO-FOPID-based LFC scheme yields lower overshoot, as well as shorter settling time to achieve system stability. These outcomes affirm that the IGBO-FOPID-based LFC scheme significantly enhances the frequency response capability of the IPS under step load-disturbance scenarios.
To further evaluate the superiority of the proposed LFC scheme, Table 3 lists some key performance indicators of the IPS with different LFC schemes, such as the maximum undershoot (US), maximum overshoot (OS), integral-squared error (ISE), integral time-multiplied squared error (ITSE), integral absolute error (IAE), and ITAE of //.

Table 3.
Maximum US/Maximum OS/ ISE/ITSE/IAE/ITAE of system response under step load-disturbance scenarios.
The comparison in Table 3 showcases that the IGBO-FOPID-based LFC scheme achieves superior values of maximum US, maximum OS, ISE, ITSE, IAE, and ITAE compared to other optimization strategy. This further illustrate that the offered IGBO-FOPID LFC scheme outperforms GBO-PID/PSO-FOPID/MDWA-FOPID/WOA-FOPID/CGO-FOPID/JSO-FOPID/GBO-FOPID-based LFC schemes.
5.3. Photovoltaic and Wind Power Random Fluctuation Test Scenarios
The effectiveness of the IGBO-FOPID-based LFC scheme is verified under the scenario of random power output from renewable energy sources. The output fluctuations of photovoltaic power and wind power, as described in Section 2.3 and Section 2.4, are utilized in this section. The fluctuations are visualized in Figure 8.
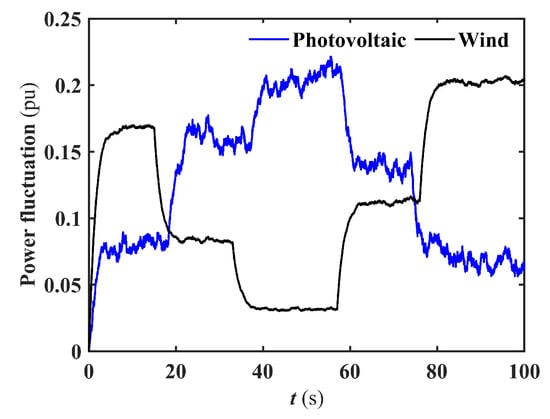
Figure 8.
Photovoltaic and wind power fluctuation curves.
We keep the control parameters in Table 2 unchanged and use different LFC schemes for simulation. The response of IPS under random fluctuations in photovoltaic and wind power using different LFC schemes are shown in Figure 9. The maximum US/maximum OS/ISE/ITSE/IAE/ITAE of // results are displayed in Table 4.
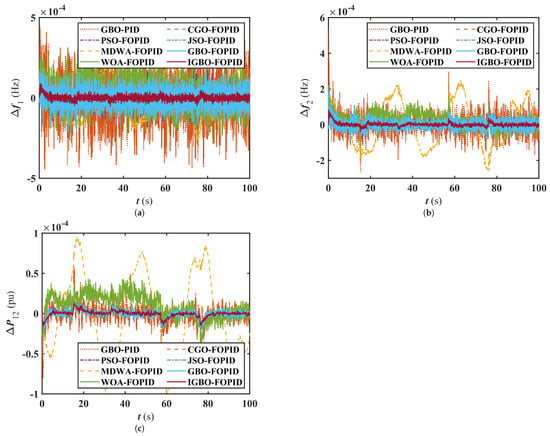
Figure 9.
Response curves of the IPS under photovoltaic and wind power random fluctuation scenarios: (a) frequency deviation in area 1, (b) frequency deviation in area 2, (c) tie line power.

Table 4.
Maximum US/Maximum OS/ ISE/ITSE/IAE/ITAE of system response under photovoltaic and wind power random fluctuation scenarios.
In Figure 9, one can find that the effectiveness of the offered IGBO-FOPID-based LFC scheme in regulating the IPS under scenarios involving random fluctuations in photovoltaic and wind power. Notably, the system incorporating the IGBO-FOPID-based LFC scheme exhibits smaller frequency fluctuations in two areas when compared to GBO-PID/PSO-FOPID/MDWA-FOPID/WOA-FOPID/CGO-FOPID/JSO-FOPID/GBO-FOPID-based LFC schemes. Additionally, the comparison presented in Table 4 reveals that the IPS performance with the IGBO-FOPID-based LFC scheme outperforms that of GBO-PID/PSO-FOPID/MDWA-FOPID/WOA-FOPID/CGO-FOPID/JSO-FOPID/GBO-FOPID-based LFC schemes in terms of maximum US, maximum OS, and various performance indicators. These findings highlight the superior anti-jamming capabilities of the proposed IGBO-FOPID-based LFC scheme compared to other LFC methods. Thus, the proposed LFC scheme is highly suitable for multi-source IPS applications incorporating renewable energy sources.
5.4. Robustness Analysis
Robustness refers to the system’s ability to withstand disturbances such as uncertainties and parameter variations. In engineering control, robustness is utilized to evaluate the control method’s capability to maintain stability in the face of various uncertainties. To evaluate the robustness of the proposed IGBO-FOPID-based LFC scheme in this study, the inertia constant of the IPS model was reduced by 25% and 50% from its nominal value. The parameters of the system after the change in inertia are provided in Appendix B. The controller parameters in Table 2 remained unchanged, and GBO-PID, GBO-FOPID, and IGBO-FOPID-based LFC schemes were tested, with the results presented in Figure 10, Figure 11, and Figure 12, respectively.
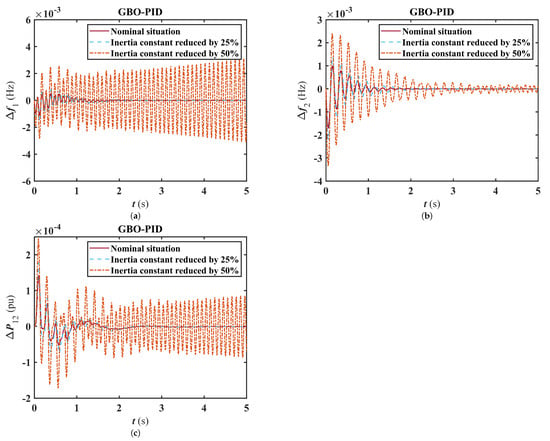
Figure 10.
Response curves of the IPS for different inertia constants when using GBO-PID-based LFC scheme: (a) frequency deviation in area 1, (b) frequency deviation in area 2, (c) tie line power.
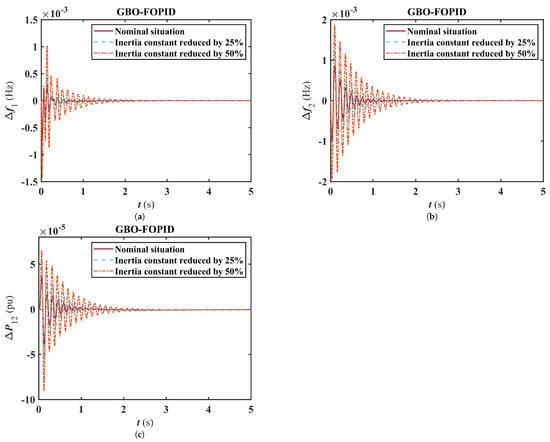
Figure 11.
Response curves of the IPS for different inertia constants when using GBO-FOPID-based LFC scheme: (a) frequency deviation in area 1, (b) frequency deviation in area 2, (c) tie line power.
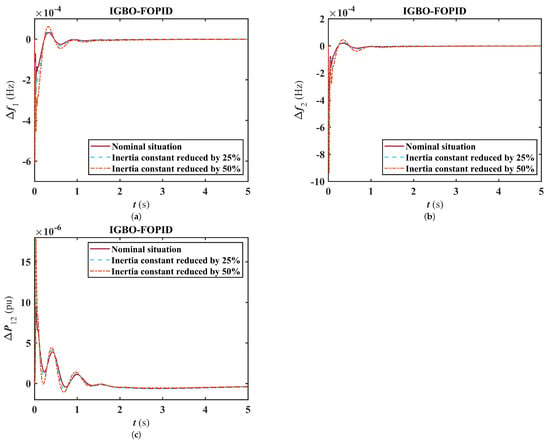
Figure 12.
Response curves of the IPS for different inertia constants when using IGBO-FOPID-based LFC scheme: (a) frequency deviation in area 1, (b) frequency deviation in area 2, (c) tie line power.
From Figure 10, it can be observed that when the inertia constant of the IPS is reduced by 25%, the system response obtained from the LFC scheme based on the traditional PID controller can still maintain stability, albeit barely. However, when the inertia constant is reduced by 50%, the system response obtained from the GBO-PID-based LFC scheme becomes unstable. This indicates that the traditional PID controller-based LFC scheme is not robust when faced with significant changes in the parameters of the IPS.
From Figure 11 and Figure 12, one can see that the system response obtained from the LFC scheme based on the FOPID controller remains consistent before and after the change in inertia constant. This illustrated that the FOPID controller-based LFC scheme has excellent robustness when facing significant changes in the parameters of the IPS. Additionally, the proposed IGBO-FOPID-based LFC scheme exhibits better frequency stability compared to the GBO-FOPID-based LFC scheme, further demonstrating that the proposed IGBO-FOPID-based LFC scheme can enhance the system’s robustness.
6. Conclusions
This study presents a novel LFC scheme based on the IGBO-FOPID controller to address frequency fluctuation issues in an IPS involving renewable energy generation units. The LFC scheme is tested under two scenarios: step load-disturbance test scenarios and renewable energy sources random fluctuation test scenarios. The test results indicate that the IPS response obtained by the proposed LFC scheme outperforms the existing literature’s PSO/WOA/MDWA/CGO/JSO-optimized FOPID and GBO-optimized PID/FOPID controllers. Compared to the aforementioned LFC scheme, the IGBO-FOPID-based LFC scheme demonstrated significant advantages in achieving the minimum values of US/OS/ISE/ITSE/IAE/ITAE. Finally, the robustness of the proposed LFC scheme is analyzed by evaluating its performance with a 25% and 50% decrease in the inertia constant of the IPS. The evaluation results demonstrate that the proposed IGBO-FOPID-based LFC scheme maintains robust performance under nominal conditions, as well as with varying IPS inertia constants. In the future, this study may consider the latency of the system and adopt updated optimization techniques to design LFC schemes suitable for more complex modern interconnected power systems.
Author Contributions
Data curation, writing—original draft preparation, validation, P.W.; conceptualization, writing—review and editing, X.C.; formal analysis, Y.Z.; supervision, L.Z.; project administration, Y.H. All authors have read and agreed to the published version of the manuscript.
Funding
This research was funded by by Hubei Provincial Natural Science Foundation, China, grant number 2020CFB248.
Data Availability Statement
No new data were created or analyzed in this study. Data sharing is not applicable to this article.
Conflicts of Interest
The authors declare no conflicts of interest.
Appendix A. Data of the Two-Area IPS
Thermal power plant: = 0.08 (s), = 0.3 (s), = 2 (Hz/pu), = 10 (s), = 0.5.
Photovoltaic power generator: = 1 (Hz/pu), = 1.8 (s).
Hydro power generator: = 5 (s), = 0.513 (s), = 48.7 (s), = 0.5 (s), = 2.4 (Hz/pu).
Wind power generator: = 1 (Hz/pu), = 1.5 (s). = 0.041 (s), = 6 (s), = 1 (Hz/pu), = 1.75 (Hz/pu), = 2 (Hz/pu).
Gas power generator: = 1 (s), = 0.049 (s), = 0.6 (s), = 1.1 (s), = 2.4 (Hz/pu), = 0.01 (s), = 0.239 (s), = 0.2 (s).
Hydrogen storage unit: = 0.002 (Hz/pu), = 0.5 (s), = 0.01 (Hz/pu), = 4 (s).
IPS: B = 0.425 (pu/Hz), = 0.087 (pu/rad), = 20 (s), = 100 (Hz/pu).
Appendix B. Data of the Two-Area IPS when the Inertia Changes
Inertia reduced by 25%: B = 0.319 (pu/Hz), = 16 (s), = 2.5 (Hz/pu), = 2.5 (Hz/pu), = 2.5 (Hz/pu), = 2.5 (Hz/pu), = 3 (Hz/pu).
Inertia reduced by 50%: B = 0.213 (pu/Hz), = 10 (s), = 3 (Hz/pu), = 3 (Hz/pu), = 3 (Hz/pu), = 3 (Hz/pu), = 3.6 (Hz/pu).
References
- Dar, A.A.; Hameed, J.; Huo, C.; Sarfraz, M.; Albasher, G.; Wang, C.Y.; Nawaz, A. Recent optimization and panelizing measures for green energy projects; insights into CO2 emission influencing to circular economy. Fuel J. Fuel Sci. 2022, 314, 123094. [Google Scholar] [CrossRef]
- Kim, Y.S.; Kim, E.S.; Moon, S.I. Frequency and Voltage Control Strategy of Standalone Microgrids With High Penetration of Intermittent Renewable Generation Systems. IEEE Trans. Power Syst. 2015, 31, 718–728. [Google Scholar] [CrossRef]
- Ye, Y.D.; Qiao, Y.; Lu, Z.X. Revolution of frequency regulation in the converter-dominated power system. Renew. Sustain. Energy Rev. 2019, 111, 145–156. [Google Scholar] [CrossRef]
- Ersdal, A.M.; Imsland, L.; Uhlen, K. Model Predictive Load-Frequency Control. IEEE Trans. Power Syst. 2016, 31, 777–785. [Google Scholar] [CrossRef]
- Yang, F.; Shao, X.; Muyeen, S.M.; Li, D.D.; Lin, S.F.; Fang, C. Disturbance Observer Based Fractional-Order Integral Sliding Mode Frequency Control Strategy for Interconnected Power System. Trans. Power Syst. 2021, 36, 5922–5932. [Google Scholar] [CrossRef]
- Xi, L.; Yu, L.; Xu, Y.C.; Wang, S.X.; Chen, X. A Novel Multi-Agent DDQN-AD Method-Based Distributed Strategy for Automatic Generation Control of Integrated Energy Systems. IEEE Trans. Sustain. Energy 2020, 11, 2417–2426. [Google Scholar] [CrossRef]
- Liu, F.; Li, Y.; Cao, Y.J.; She, J.H.; Wu, M. A Two-Layer Active Disturbance Rejection Controller Design for Load Frequency Control of Interconnected Power System. IEEE Trans. Power Syst. 2016, 31, 3320–3321. [Google Scholar] [CrossRef]
- Shangguan, X.C.; He, Y.; Zhang, C.K.; Jiang, L.; Wu, M. Adjustable Event-Triggered Load Frequency Control of Power Systems Using Control-Performance-Standard-Based Fuzzy Logic. IEEE Trans. Fuzzy Syst. 2022, 30, 3297–3311. [Google Scholar] [CrossRef]
- Zuo, J.; Xie, P.P.; Li, Y.H.; Duan, X.Z. Intelligent Optimization Algorithm Based Load Frequency Controller Design and Its Control Performance Assessment in Interconnected Power Grids. Trans. China Electrotech. Soc. 2018, 33, 478–489. [Google Scholar] [CrossRef]
- Chen, Z.H.; Yuan, Y.B.; Yuan, X.H.; Huang, Y.H.; Li, X.S.; Li, W.W. Application of multi-objective controller to optimal tuning of PID gains for a hydraulic turbine regulating system using adaptive grid particle swam optimization. ISA Trans. 2015, 56, 173–187. [Google Scholar] [CrossRef]
- Kumar, R.; Sharma, V.K. Whale Optimization Controller for Load Frequency Control of a Two-Area Multi-source Deregulated Power System. Int. J. Fuzzy Syst. 2019, 22, 122–137. [Google Scholar] [CrossRef]
- Fathy, A.; Kassem, A.M.; Abdelaziz, A.Y. Optimal design of fuzzy PID controller for deregulated LFC of multi-area power system via mine blast algorithm. Neural Comput. Appl. 2020, 32, 4531–4551. [Google Scholar] [CrossRef]
- Debnath, M.K.; Agrawal, R.; Tripathy, S.R.; Choudhury, S. Artificial neural network tuned PID controller for LFC investigation including distributed generation. Int. J. Numer. -Model. -Electron. Netw. Devices Fields 2020, 33, e2740. [Google Scholar] [CrossRef]
- Guha, D.; Roy, P.K.; Banerjee, S. Load frequency control of interconnected power system using grey wolf optimization. Swarm Evol. Comput. 2016, 27, 97–115. [Google Scholar] [CrossRef]
- Shah, P.; Agashe, S. Review of fractional PID controller. Mechatronics 2016, 38, 29–41. [Google Scholar] [CrossRef]
- Monje, C.A.; Vinagre, B.M.; Feliu, V.; Chen, Y.Q. Tuning and auto-tuning of fractional order controllers for industry applications. Control. Eng. Pract. 2008, 16, 798–812. [Google Scholar] [CrossRef]
- Sondhi, S.; Hote, Y.V. Fractional order PID controller for load frequency control. Energy Convers. Manag. 2014, 85, 343–353. [Google Scholar] [CrossRef]
- Zamani, A.; Barakati, S.M.; Yousofi-Darmian, S. Design of a fractional order PID controller using GBMO algorithm for load-frequency control with governor saturation consideration. ISA Trans. 2016, 64, 56–66. [Google Scholar] [CrossRef]
- Barakat, M. Novel chaos game optimization tuned-fractional-order PID fractional-order PI controller for load-frequency control of interconnected power systems. Prot. Control. Mod. Power Syst. 2022, 7, 16. [Google Scholar] [CrossRef]
- Daraz, A.; Malik, S.A.; Basit, A.; Aslam, S.; Zhang, G.Q. Modified FOPID Controller for Frequency Regulation of a Hybrid Interconnected System of Conventional and Renewable Energy Sources. Fractal. Fract. 2023, 7, 89. [Google Scholar] [CrossRef]
- Fathy, A.; Alharbi, A.G. Recent Approach Based Movable Damped Wave Algorithm for Designing Fractional-Order PID Load Frequency Control Installed in Multi-Interconnected Plants With Renewable Energy. IEEE Access 2021, 9, 71072–71089. [Google Scholar] [CrossRef]
- Pan, I.; Das, S. Fractional Order AGC for Distributed Energy Resources Using Robust Optimization. IEEE Trans. Smart Grid 2016, 7, 2175–2186. [Google Scholar] [CrossRef]
- Joshi, A.; Suresh, A.; Kamalasadan, S. Grid Frequency Regulation Based on Point of Common Coupling Angle Deviation Control of Distributed Energy Resources With Fully Active Hybrid Energy Storage System. IEEE Trans. Ind. Appl. 2021, 57, 4473–4485. [Google Scholar] [CrossRef]
- Fang, J.C.; Wang, Y.F.; Lei, Z.; Xu, Q.S. Control Strategy and Performance Analysis of Electrochemical Energy Storage Station Participating in Power System Frequency Regulation: A Case Study of the Jiangsu Power Grid. Sustainability 2022, 14, 9189. [Google Scholar] [CrossRef]
- Calero, F.; Cañizares, C.A.; Bhattacharya, K. A Review of Modeling and Applications of Energy Storage Systems in Power Grids. Proc. IEEE 2023, 111, 806–831. [Google Scholar] [CrossRef]
- Dong, W.J.; Shao, C.C.; Feng, C.J.; Zhou, Q.; Bie, Z.H.; Wang, X.F. Cooperative Operation of Power and Hydrogen Energy Systems With HFCV Demand Response. IEEE Trans. Ind. Appl. 2022, 58, 2630–2639. [Google Scholar] [CrossRef]
- Tan, K.M.; Babu, T.S.; Ramachandaramurthy, V.K.; Kasinathan, P.; Solanki, S.G.; Raveendran, S.K. Empowering Smart Grid: A Comprehensive Review of Energy Storage Technology and Application With Renewable Energy Integration. J. Energy Storage 2021, 39, 102591. [Google Scholar] [CrossRef]
- Arya, Y. Impact of Hydrogen Aqua Electrolyzer-Fuel Cell Units on Automatic Generation Control of Power Systems With a New Optimal Fuzzy TIDF-II Controller. Renew. Energy 2019, 139, 468–482. [Google Scholar] [CrossRef]
- Yildiz, S.; Gunduz, H.; Yildirim, B.; Özdemir, M.T. An Islanded Microgrid Energy System With an Innovative Frequency Controller Integrating Hydrogen-Fuel Cell. Fuel 2022, 326, 125005. [Google Scholar] [CrossRef]
- Ahmadianfar, I.; Bozorg-Haddad, O.; Chu, X. Gradient-Based Optimizer: A New Metaheuristic Optimization Algorithm. Inf. Sci. 2020, 540, 131–159. [Google Scholar] [CrossRef]
- Daoud, M.S.; Shehab, M.; Al-Mimi, H.M.; Abualigah, L.; Zitar, R.A.; Shambour, M.K.Y. Gradient-Based Optimizer (GBO): A Review, Theory, Variants, and Applications. Arch. Comput. Methods Eng. 2023, 30, 2431–2449. [Google Scholar] [CrossRef] [PubMed]
- Arya, Y.; Dahiya, P.; Çelik, E.; Sharma, G.; Gözde, H.; Nasiruddin, I. AGC performance amelioration in multi-area interconnected thermal and thermal-hydro-gas power systems using a novel controller. Eng. Sci. Technol. Int. J. 2021, 24, 384–396. [Google Scholar] [CrossRef]
- Xiang, L.J.; Chen, H.; Guo, X.H.; Yang, Y.F. Secondary Frequency Control of Multi-Energy Microgrid With Electric Vehicles Based on Fuzzy Fractional-Order PID. Electr. Power Autom. Equip. 2021, 41, 74–80. [Google Scholar] [CrossRef]
- Ahmadianfar, I.; Gong, W.Y.; Heidari, A.A.; Golilarz, N.A.; Samadi-Koucheksaraee, A.; Chen, H.L. Gradient-based optimization with ranking mechanisms for parameter identification of photovoltaic systems. Energy Rep. 2021, 7, 3979–3997. [Google Scholar] [CrossRef]
Disclaimer/Publisher’s Note: The statements, opinions and data contained in all publications are solely those of the individual author(s) and contributor(s) and not of MDPI and/or the editor(s). MDPI and/or the editor(s) disclaim responsibility for any injury to people or property resulting from any ideas, methods, instructions or products referred to in the content. |
© 2024 by the authors. Licensee MDPI, Basel, Switzerland. This article is an open access article distributed under the terms and conditions of the Creative Commons Attribution (CC BY) license (https://creativecommons.org/licenses/by/4.0/).