Article

A Fractal-Based Quantitative Method for the Study of Fracture Evolution of Coal under Different Confining Pressures

State Key Laboratory of Mining Response and Disaster Prevention and Control in Deep Coal Mines, Anhui University of Science and Technology, Huainan 232001, China
*
Author to whom correspondence should be addressed.
Fractal Fract. 2024, 8(3), 159; https://doi.org/10.3390/fractalfract8030159
Submission received: 28 November 2023 / Revised: 25 January 2024 / Accepted: 28 February 2024 / Published: 11 March 2024
(This article belongs to the Special Issue Fractal and Fractional in Geotechnical Engineering)

Abstract

:
To study the dynamic crack evolution process of loaded coal from the perspective of fractals, we carried out in situ industrial CT scanning tests of loaded coal under different confining pressures, visualizing loaded coal fracturing. Combined with fractal theory, the temporal and spatial evolution law of coal cracks is described quantitatively. The results provide two findings: (1) from the perspective of two-dimensional images and three-dimensional space, the evolution characteristics of cracks in coal under different confining pressures were basically the same in each loading stage. During the loading stages, the cracks exhibited a change rule of a slow reduction, initiation/development, rapid increase, expansion, and penetration. (2) The fractal dimension of coal was calculated by introducing fractal theory, and its change law was in good agreement with the dynamic changes of the cracks, which can explain the influence of the confining pressure on the loaded coal. The fractal dimension showed three stages: a slight decrease, a stable increase, and then a significant increase. The larger the confining pressure, the more obvious the limiting effect. Thus, our approach provides a more accurate method for evaluating the spatial and temporal evolution of cracks in loaded coal. This study can be used to predict the instability failure of loaded coal samples.

1. Introduction

Coal is a heterogeneous natural porous medium and geological material, which is mainly composed of a coal matrix, a large number of randomly distributed natural fissures and defects, and other minerals. The random distribution of these components determines the structural characteristics of the coal. The analysis of the dynamic evolution process of internal crack initiation, development, and expansion to the penetration of coal under external triaxial loads can help us better understand the failure process of coal fracturing [1,2,3], which is of great practical significance for the safe production of coal mines.
In the actual excavation process of projects, the confining pressure is constantly changing [4]. By setting different confining pressure levels in the analysis, rock stress conditions at different occurrence depths can be simulated. In recent years, scholars have conducted significant research on the mechanical properties of coal rock mass under different confining pressure conditions. For example, Jiang has shown, through triaxial compression tests, that the confining pressure and buried depth have a significant effect on the physical and mechanical properties and failure modes of shale [5]. Alejano conducted a triaxial compression test on granite and studied the influence of confining pressure on the peak strength and deformation modulus of massive granite [6]. The above research focused on the macroscopic mechanical properties of coal rock mass. Furthermore, the macroscopic fracturing of rock is closely related to the spatial and temporal evolution of its microstructure.
Rock fracture is a process of crack initiation, propagation, and evolution until penetration. Studying the crack propagation process and instability failure mechanism of cracked coal rock mass is helpful for understanding the stress variation law of the surrounding rock in coal roadways and working faces. Scanning electron microscopy, nuclear magnetic resonance, and computed tomography (CT) scanning are the primary methods used to describe the microscopic pore structure of coal rock mass [7,8,9,10,11,12]. CT scanning technology (also known as computer tomography recognition technology) can enable the non-destructive scanning of a test sample, and allow for the obtaining of a CT image sequence of the sample for display in the form of high-resolution digital three-dimensional images after three-dimensional reconstruction. With the steady advancement of industrial CT, its application in coal rock mass is becoming more extensive. Using CT technology to study the fracture structure of coal rock mass failure has unique advantages [13,14,15] and can facilitate the visualization of coal rock mass during loading. For example, Wang used CT data combined with three-dimensional visualization software for the quantitative characterization of the pore and fracture structure of coal and established a three-dimensional model as well as a simplified model of the pore network and its topological structure, effectively describing the pore size, pore volume, porosity, and other properties of coal [16]. Kumari carried out CT scanning tests on granite during loading and studied the propagation path of granite cracks; their results show that the crack propagation path is mainly controlled by the stress state and the heterogeneity of the rock matrix [17].
The evolution process of cracks in rock masses under loading is dynamic and involves the initiation, propagation, evolution, and penetration of cracks. Using CT scanning technology, we can observe the spatial distribution of cracks in rock masses during loading but cannot quantitatively study the rock mass fracture structure at different stages of loading. There is a lack of digital indicators reflecting the differences in the rock mass structure. The emergence of fractal theory helps solve this problem.
Fractal theory is often used to study the laws behind various complex, disorderly, and chaotic phenomena in nature, and fractal dimensions are the most important concept within fractal theory. Because the fracture distribution in coal rock mass shows good self-similar fractal characteristics, fractal dimensions can be used to quantitatively describe the degree of fracture evolution, which could facilitate the application of fractal theory in the field of rock mechanics. By extracting the fractal information from the scanning results, we can describe the development and distribution of fractures in the loaded rock mass effectively, evaluate the complexity of the overall fracture structure inside the rock mass accurately, strengthen our understanding of the evolution of rock mass pores and fracture structures, and visualize and finely and quantitatively characterize the loaded coal rock mass.
Xie [18], Zhao [19], and others have studied the fractal characteristics of cracks in coal rock mass. Zhang used industrial CT to observe and scan the rock fracture process in different stages and constructed a three-dimensional fracture model of rock with which to study the dynamic propagation and evolution process of internal cracks when the loaded rock is deformed and destroyed. The author found that the fracture propagation process can be effectively quantified using characteristic parameters, such as fracture volume, surface area, and fractal dimension [20]. To further verify the reliability of the fractal dimension in three dimensions, Wang used CT to scan six coal samples with different pore structures and reconstruct them three-dimensionally. The fractal dimension Df of the total pore structure was calculated using the three-dimensional box-counting method. The results show that the three-dimensional fractal dimension can accurately describe the fractal characteristics of coal. The larger the Df, the greater the porosity of the coal samples [21]. However, previous CT scanning experiments have not used real-time scanning during the loading process. Therefore, to study the temporal and spatial evolution laws of internal cracks in coal, one must capture the dynamic damage and failure process of loaded coal samples in real time. More importantly, a method for accurately describing the evolution of internal cracks in coal is required.
This study assesses the whole process of the in situ failure of coal samples under four confining pressure states using an industrial CT scanning system. We analyze the evolution law of internal cracks within coal samples from loading to failure and propose a new method with which to describe the quantitative crack evolution of coal samples during the loading process based on fractal theory. As a result, the fractal characteristics of cracks in loaded coal samples are detailed.

2. Test Scheme and System

2.1. Sample Introduction

The coal samples used in the test were core drilling samples taken from the same area (Huainan mining area), having the same internal structure, a uniform texture, no obvious joints, cracks, etc., and very similar mechanical properties. After cutting and coring, the coal samples were processed into a standard cylinder of Ø25 × 50 mm. To achieve evenly stressed coal samples during the test and high accuracy of the test results, the upper and lower surfaces of each sample were polished to obtain flatness within 0.05 mm. The non-parallelism of the two ends was less than 0.02 mm, thus meeting the requirements of the International Society of Rock Mechanics test [22]. In addition, basic physical indicators, such as quality, were measured, and the samples with basic physical indicators exceeding the average value of 10% were removed. The processed coal samples are shown in Figure 1.

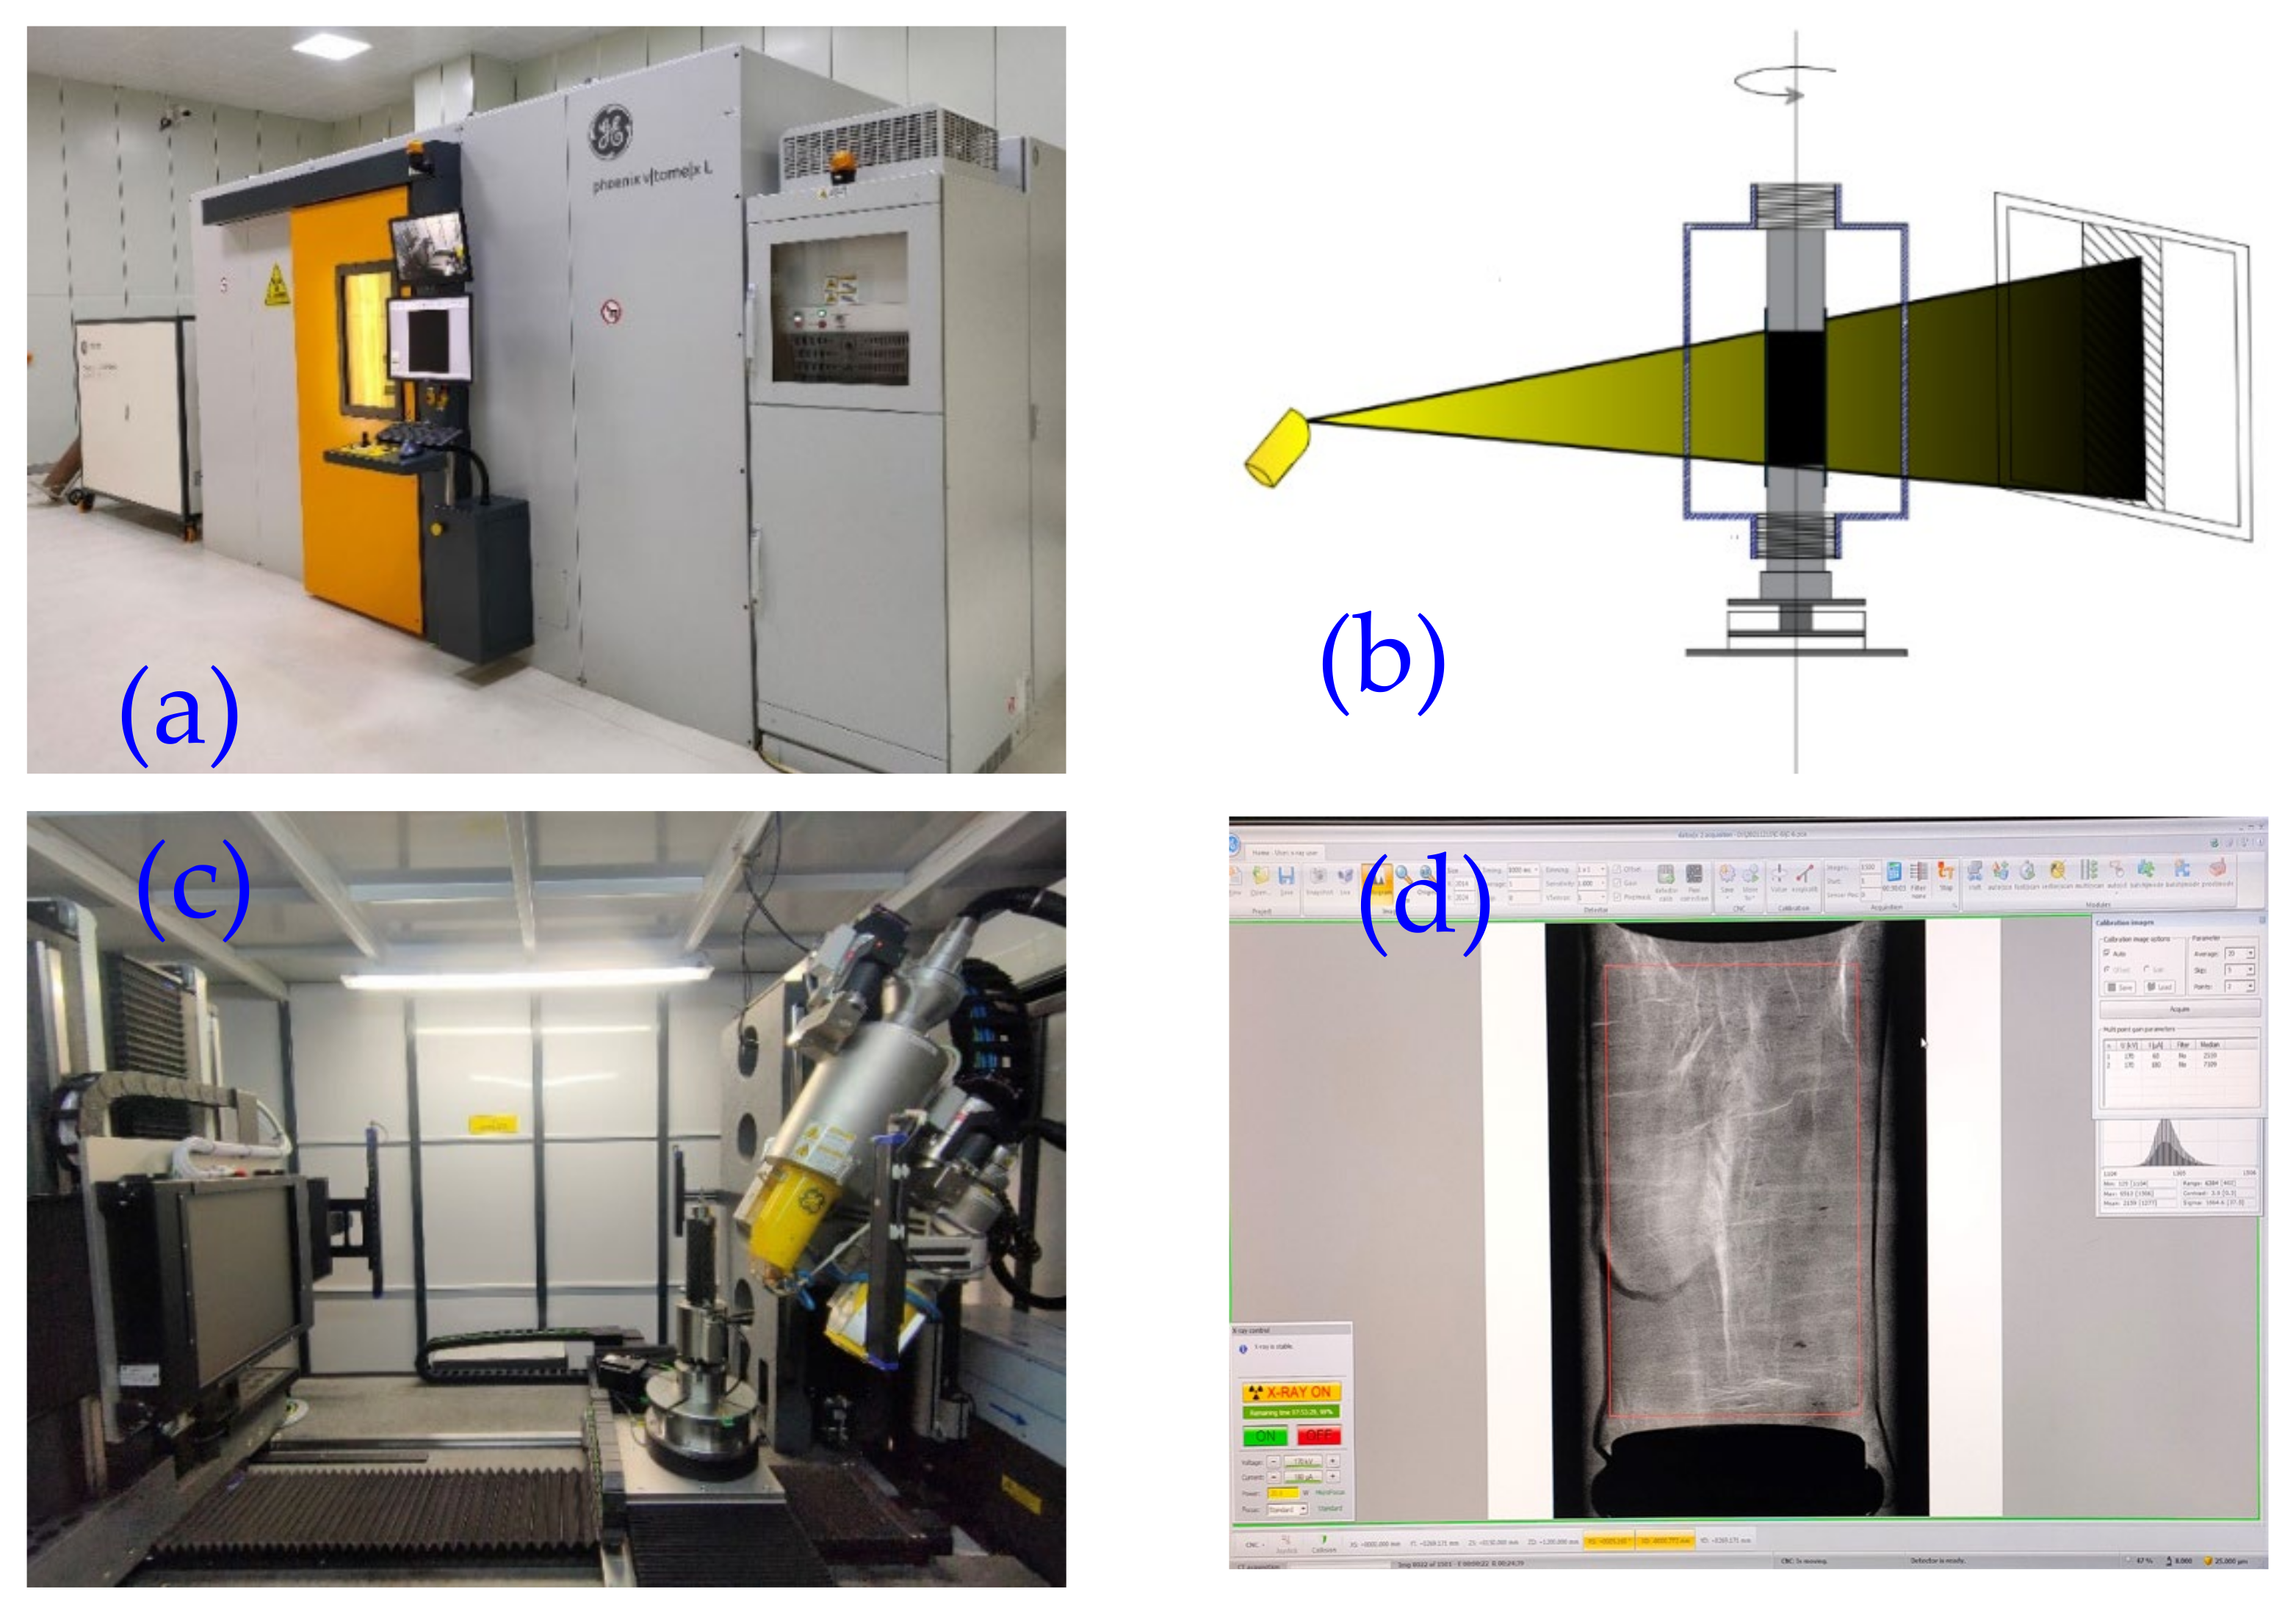
2.2. Testing Equipment

This research used the V|tome|x L300 high-precision CT triaxial loading test system to carry out triaxial and scanning testing, as shown in Figure 2a. This comprised an industrial CT scanning system and a triaxial loading system that could facilitate the uniaxial and triaxial loading of the sample, with a maximum axial pressure of 100 kN and a maximum confining pressure of 30 MPa.
The industrial CT scanning system can display the internal structure and defect status of the measured object clearly, accurately, and intuitively in the form of two- and three-dimensional images without damage to the object. The scanning principle involves use of the high penetration capacity of X-rays to irradiate the different layers of the sample. Because some photons are absorbed by the sample, the light intensity is attenuated, and this information is received by the detector. After the data are converted by the computer, a digital image of the coal sample can be reconstructed. The micro-focus CT scanning system is equipped with two X-ray tubes—a high-power micron-scale ray tube and a high-resolution nano-scale ray tube. Its unique micro-focus ray source scanning system can effectively reduce ghosting and achieve a good display. The specific parameters are listed in Table 1.
The principle of industrial CT scanning is shown in Figure 2b. Figure 2c shows the internal structure of the industrial CT scanning system. Here, the sample was installed and fixed on the base holder for X-ray detection and scanning. The CT scan data to be reconstructed were opened using the CT data setting software Phoenix Datos|x2 (version 2.6.1-RTM) (Figure 2d). Firstly, we determined the region of interest for digital reconstruction. Next, to achieve the best compensation effect and derive the clearest three-dimensional digital image of the coal core, we performed the following series of processes on the scanned image: geometric correction, beam hardening correction, and reverse color processing.

2.3. Test Scheme

The triaxial compression testing of coal samples under different confining pressures was carried out. According to the natural state of coal as found at the considered depths in the mining area, as well as data from previous research [23,24], the confining pressures used in the triaxial compression test were 5.0, 10.0, 15.0, and 20.0 MPa. The loaded coal sample was wrapped with a special leather sleeve and placed in the loading device. An initial axial load of 2500 N was applied to fix the coal sample. Then, different confining pressures were applied (5, 10, 15, 20 MPa). After the confining pressure had stabilized, the axial pressure was controlled by displacement, and the loading rate was 0.3 mm/min. During the test, a constant confining pressure was maintained, and the axial pressure was gradually increased until the coal sample was destroyed.
We determined the scanning point in the CT scanning test stage based on the full stress–strain curve of the whole process of deformation of the raw coal under compressive loading. The deformation process is divided into the in situ stage I, initial pore compaction stage II, stable development of elastic deformation fracture III, unstable fracture development stage IV, post-fracture stage V, and residual stage VI. Internal failure of the coal sample was assessed via scanning at six points. The experimental conditions were as follows: a voltage of 170 kV, current of 180 μA, resolution of 25 μm, exposure time of 1000 ms, projection number of 1500, and scanning time of 94 min. In addition, the same scanning conditions were maintained for six repetitions (the first scan to the sixth scan corresponded to A–F). The specific test steps are as follows:
(1)
CT system initialization. The system is heated, and the ray tube is vacuumized. Then, the mechanical shaft is reset. The specimen is fixed to the specimen holder with an electronic jack, and then the holder is placed in the axial pressure loading cylinder. The assembly is installed and fixed to the CT mechanical turntable, and the pipeline is connected for exhaust extraction.
(2)
The CT scanning and triaxial loading parameters are set, with those such as voltage, current, exposure time, and the number of pictures set according to the imaging effect, resolution, and gray value. The triaxial loading equipment is set up with the loading parameters required for this experiment. Multiple scans can be performed before the coal sample breaks. During the scanning process, the pressure remains unchanged, and the number of scans is associated with the stress–strain curve for adjustment.
(3)
At the end of the experiment, the data are processed. Firstly, the mechanical parameters are exported from the three-axis software database for analysis. Secondly, the original image is corrected using the CT data reconstruction software Phoenix Datos|x2 (version 2.6.1-RTM). Finally, the image is reconstructed in three dimensions using the image processing software.
(4)
The above steps are repeated, carrying out triaxial tests with confining pressures of 10, 15, and 20 MPa.

3. Analysis of Fracture Evolution Law

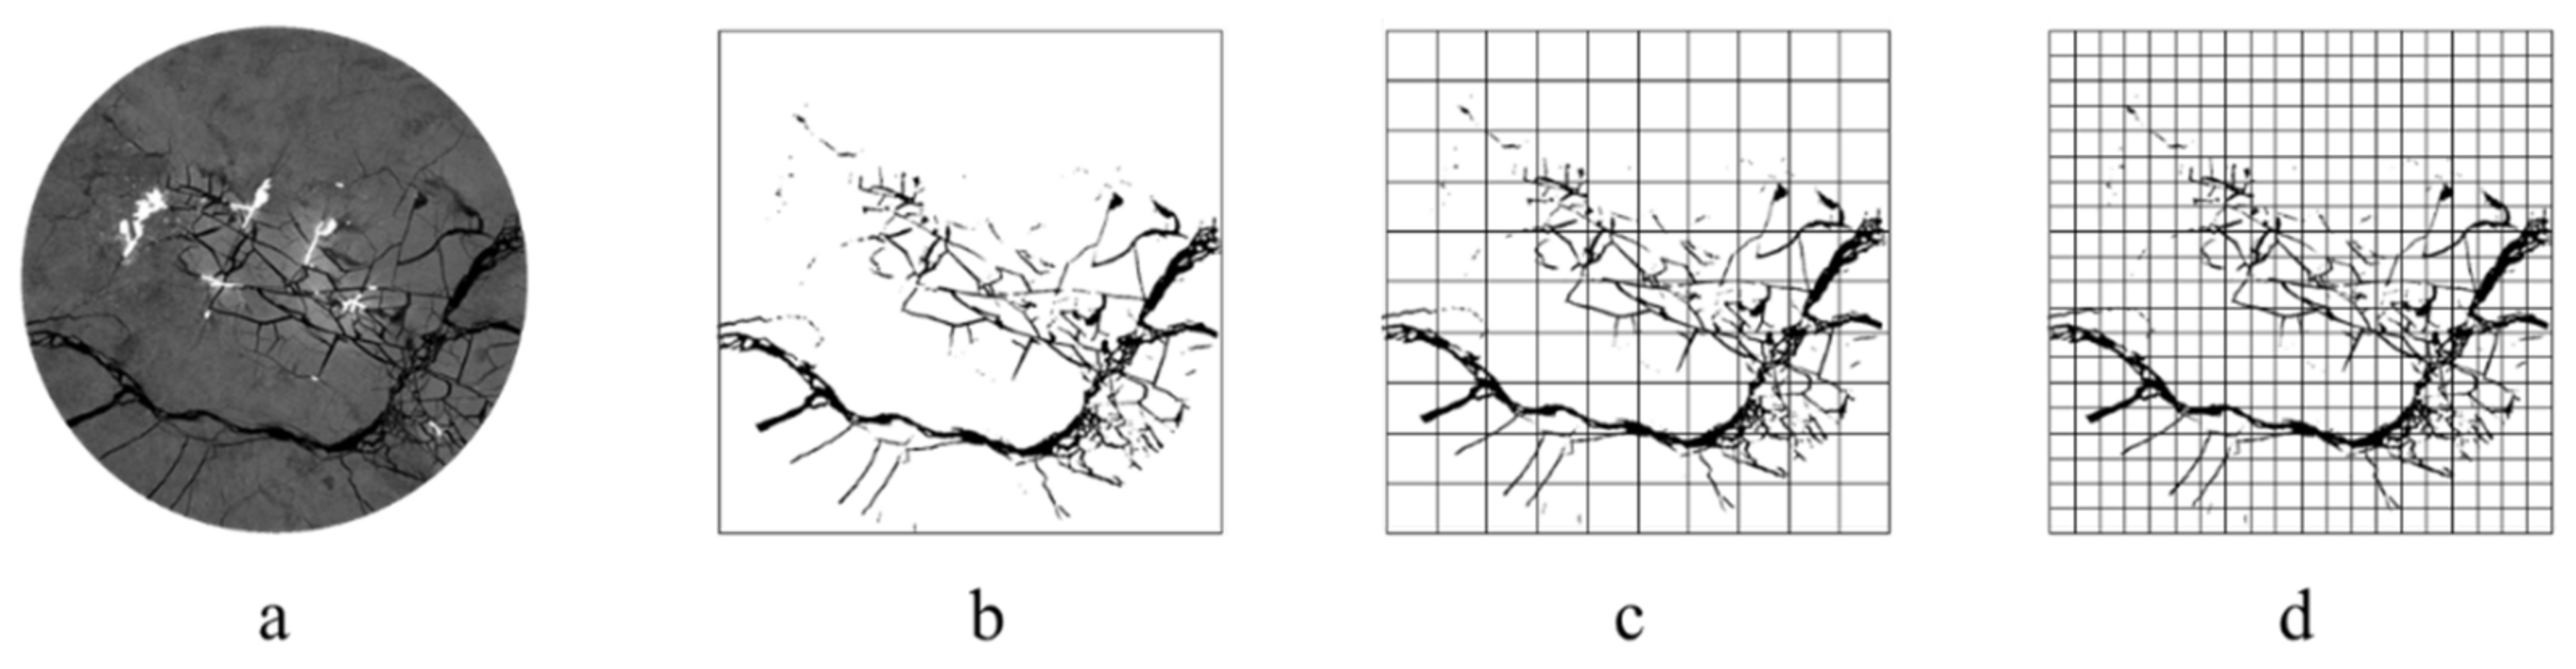
3.1. Qualitative Analysis of Two-Dimensional Fracture Evolution Characteristics

The CT scanning system can collect real-time scanning information of each section layer of the coal sample, from top to bottom. In determining the fracture propagation characteristics of coal under different confining pressures, we applied CT scanning technology to reveal the spatial fracture morphological characteristics of the coal samples under different loading conditions and the influence of intermediate principal stress on their failure. Figure 3 shows the stress–strain curve of the raw coal under different confining pressures and the two-dimensional CT images of different deformation stages, in which the gray represents the coal matrix and white and black indicate the presence of minerals and pores/fissures, respectively.
In the triaxial compression experiment, under different confining pressures, the internal crack trends in the coal sample are roughly the same—slowly decreasing at first and then gradually increasing. In the initial state, the fracture distribution of the sample under different confining pressures is anisotropic. As the confining pressure is applied, some of the original fractures are closed; furthermore, when a greater confining pressure is set, the closure effect is more obvious. When the axial stress begins to increase, internal cracks develop in the coal sample. As the axial stress continues to increase, the main crack propagation process is accompanied by the initiation of new cracks. The cracks are gradually connected with those surrounding them, and coal ruptures gradually develop from a state of diffuse and disorderly damage to local and orderly damage. Under the confining pressure of 5 MPa, the final damage degree of the sample is the greatest. The main crack is an oblique bending crack that runs through the sample. This is located in the lower part of the slice section, oriented from left to right. In summary, the greater the confining pressure, the greater the limitation of fracture development.

3.2. Quantitative Analysis of Two-Dimensional Fracture Evolution Characteristics

The term “fractal” was first proposed and used by Mandelbrot in the 1970s. The fractal dimension is the most important concept in fractal geometry. “Fractal” is a mathematical term, and its theory has fractal characteristics as its main research focus. It uses the fractal dimension to describe irregular and regular patterns in nature and reveals the laws of self-similarity, which nature follows at deep levels. Many scholars have developed different formulae for calculating the fractal dimension according to the basic theory [25,26]. Among these, the most widely used is the box-counting dimension, also known as the box dimension, which is a calculation method used for measuring the fractal dimension over distance. The principle of the box-counting dimension is to imagine the fractal S on a uniformly divided grid and calculate the minimum number of squares required to cover the fractal S completely. By continuously refining the grid size, the number of squares required at different scales can be reviewed. The fractal dimension of coal samples is assessed via the box-counting dimension. The approximate calculation of the box-counting dimension Db is
D b = lim s 0 lg N ( s ) lg ( s ) = lg N ( s ) lg ( 1 / s ) ,
where, in R2 space, N(s) is the minimum number of squares of length s required to cover this non-empty subset. The slope of the linear regression equation formed by plotting lgN(s) with lg(1/s) is the fractal dimension, which obeys the following linear equation:
lg N ( s ) = lg ( c 1 ) + D b lg ( 1 / s )
where, c1 is a constant.
Figure 4 shows a two-dimensional fracture network diagram, which can be used in a box-counting method for determining the fractal dimension. To obtain the fractal dimension of the fracture distribution inside the coal sample, we binarized the CT scan image. After binarizing using the ImageJ (version 1.53c) software program—because of the instability of the CT detector when collecting photons, the negative working conditions of the transmission cable, or the extreme aging of the bulb tube—concentric ring artifacts that do not belong to the coal itself might arise in some scan images. Replacing the adjacent gray values and removing the ring artifacts from the image better visualizes the fracture structure that developed during the loading process of the selected coal sample section. The processed CT image strongly retains the fracture distribution characteristics inside the coal sample. After binarization and artifact removal, only black and white remain on the CT image, where black represents the fracture and all other features are white.
ImageJ (version 1.53c) software was used to calculate the data of two-dimensional CT cross-section images taken for different stages of the coal sample. According to their specific sizes (2 × 2, 4 × 4, 8 × 8, 16 × 16, 32 × 32, and 64 × 64 mm), the processed slice images were divided into several small grids, that is, the grid was semi-divided and refined into a denser square grid. The number of grids that the cracks pass through at different scales was counted, and the box-counting dimension Db of the internal cracks of the coal sample were obtained by fitting the linear relationship between the double logarithmic coordinates.
In the coal, the fractal dimension of the two-dimensional section is between 1 and 2. The closer the fractal dimension is to 1, the fewer pores and fissures on the coal slice surface, the smaller the area, and the simpler the distribution of pores and fissures in the section. The closer the fractal dimension is to 2, the greater the number of pores and fissures on the coal slice surface, the larger the area, and the more complex the distribution of pores and fissures on the section. The calculation results regarding the fractal dimension of the coal sample section cracks that develop during the loading process are shown in Table 2. With the increase in fracture development, the fractal dimension becomes larger. During this time, in the case of the same fracture area, the fractal dimension of the fracture structure differs. The more complex the fracture structure, the larger the fractal dimension. Therefore, the fractal dimension can better describe the characteristics of the fracture structures of coal samples [27]. Moreover, the fractal dimension can be used to effectively characterize the complexity of different fracture structures in surrounding fracture areas. In two dimensions, the larger the fractal dimension, the more sufficient the fracture development and the more complex the distribution, and vice versa.
The results show that the overall development processes of cracks in the coal samples under different confining pressures were roughly the same, with obvious stage characteristics, as shown in Figure 5. Taking the analysis of all layers subjected to 5 MPa confining pressure as an example, this process can be divided into four stages:
Stage I—Initially, several primary cracks of different sizes and lengths are present in the coal samples (as shown in Figure 5a). At this time, the two-dimensional fractal dimension is 1.3631. With the increase in confining pressure, some primary cracks gradually close (as shown in Figure 5b), and the cracks decrease. At this time, the fractal dimension decreases to 1.3188.
Stage II—The primary cracks gradually close until the confining pressure reaches its specified value, and then, with the increase in axial pressure, the coal sample begins to fail. The primary crack shows a trend of expanding with the increase in axial pressure (as shown in Figure 5c,d). The fractal dimension increases to 1.3531, as shown in Figure 5c, and the crack develops slightly further. With the increase in axial pressure, obvious penetrating cracks develop, as shown in Figure 5d. At this time, the fractal dimension begins to increase from 1.4104 because of the gradual expansion of cracks.
Stage III—Under the external force, the cracks continue to evolve and extend and intersect with each other to form larger penetrating cracks. New cracks appear at the edge of the coal sample. At the same time, because of the distribution of pores and microcracks, the direction of crack propagation deviates temporarily. The main crack gradually expands along the edge and at the center of the coal sample. The coal sample deforms macroscopically, and its internal cracks begin to constitute a complex network. As the axial pressure increases, the crack expands and evolves (as shown in Figure 5e). At this time, the fractal dimension becomes larger because of the crack penetration, reaching 1.5237.
Stage IV—At this time, the post-peak residual stress stage commences, and the loaded coal sample undergoes complete deformation and failure. The internal macro-cracks converge and eventually form a complex crack network (Figure 5f). At this time, the fractal dimension maximizes at 1.5869.
Throughout the fracture process, the two-dimensional fractal dimension of the coal sample shows an overall trend of a small decrease to a large surge, which effectively reflects the overall fracture expansion process of the coal sample under confining pressure.
Figure 5. Coal sample slice binary graphics at 5 MPa from (a,b) Stage I, (c,d) Stage II, (e) Stage III, and (f) IV.
Fractalfract 08 00159 g005
The internal fracture structures of each coal sample in the in situ state are different. In the initial compaction stage, cracks are almost invisible in the binary images under higher confining pressures, and the cracks become almost completely closed under high confining pressures. With the increase in axial pressure, isolated pores and micro-cracks are gradually generated inside the coal, and the spatial distribution of cracks and pores intensifies the inhomogeneity of stress distribution inside the coal rock mass, which, in turn, significantly influences the crack development in the coal rock until penetration and complete deformation and failure. The fractal dimension is calculated from the compaction stage to the final failure. Under the confining pressure of 5 MPa (Figure 5), the sixth scan’s fractal dimension is 1.20 times that of the compaction stage, and the sixth scanning fractal dimension under the confining pressure of 10 MPa (Figure 6a) is 1.22 times that of the second scan’s fractal dimension. The sixth scan’s fractal dimension under a confining pressure of 15 MPa (Figure 6b) is 1.28 times that measured in the second scan, and the sixth scan’s fractal dimension under a confining pressure of 20 MPa (Figure 6c) is 1.29 times that derived in the second scan. The increase in confining pressure is beneficial to the improvement in the ability of the sample to resist external loads. The internal crack structure network in coal under the application of low confining pressure is more complex; that is, the damage is more serious.

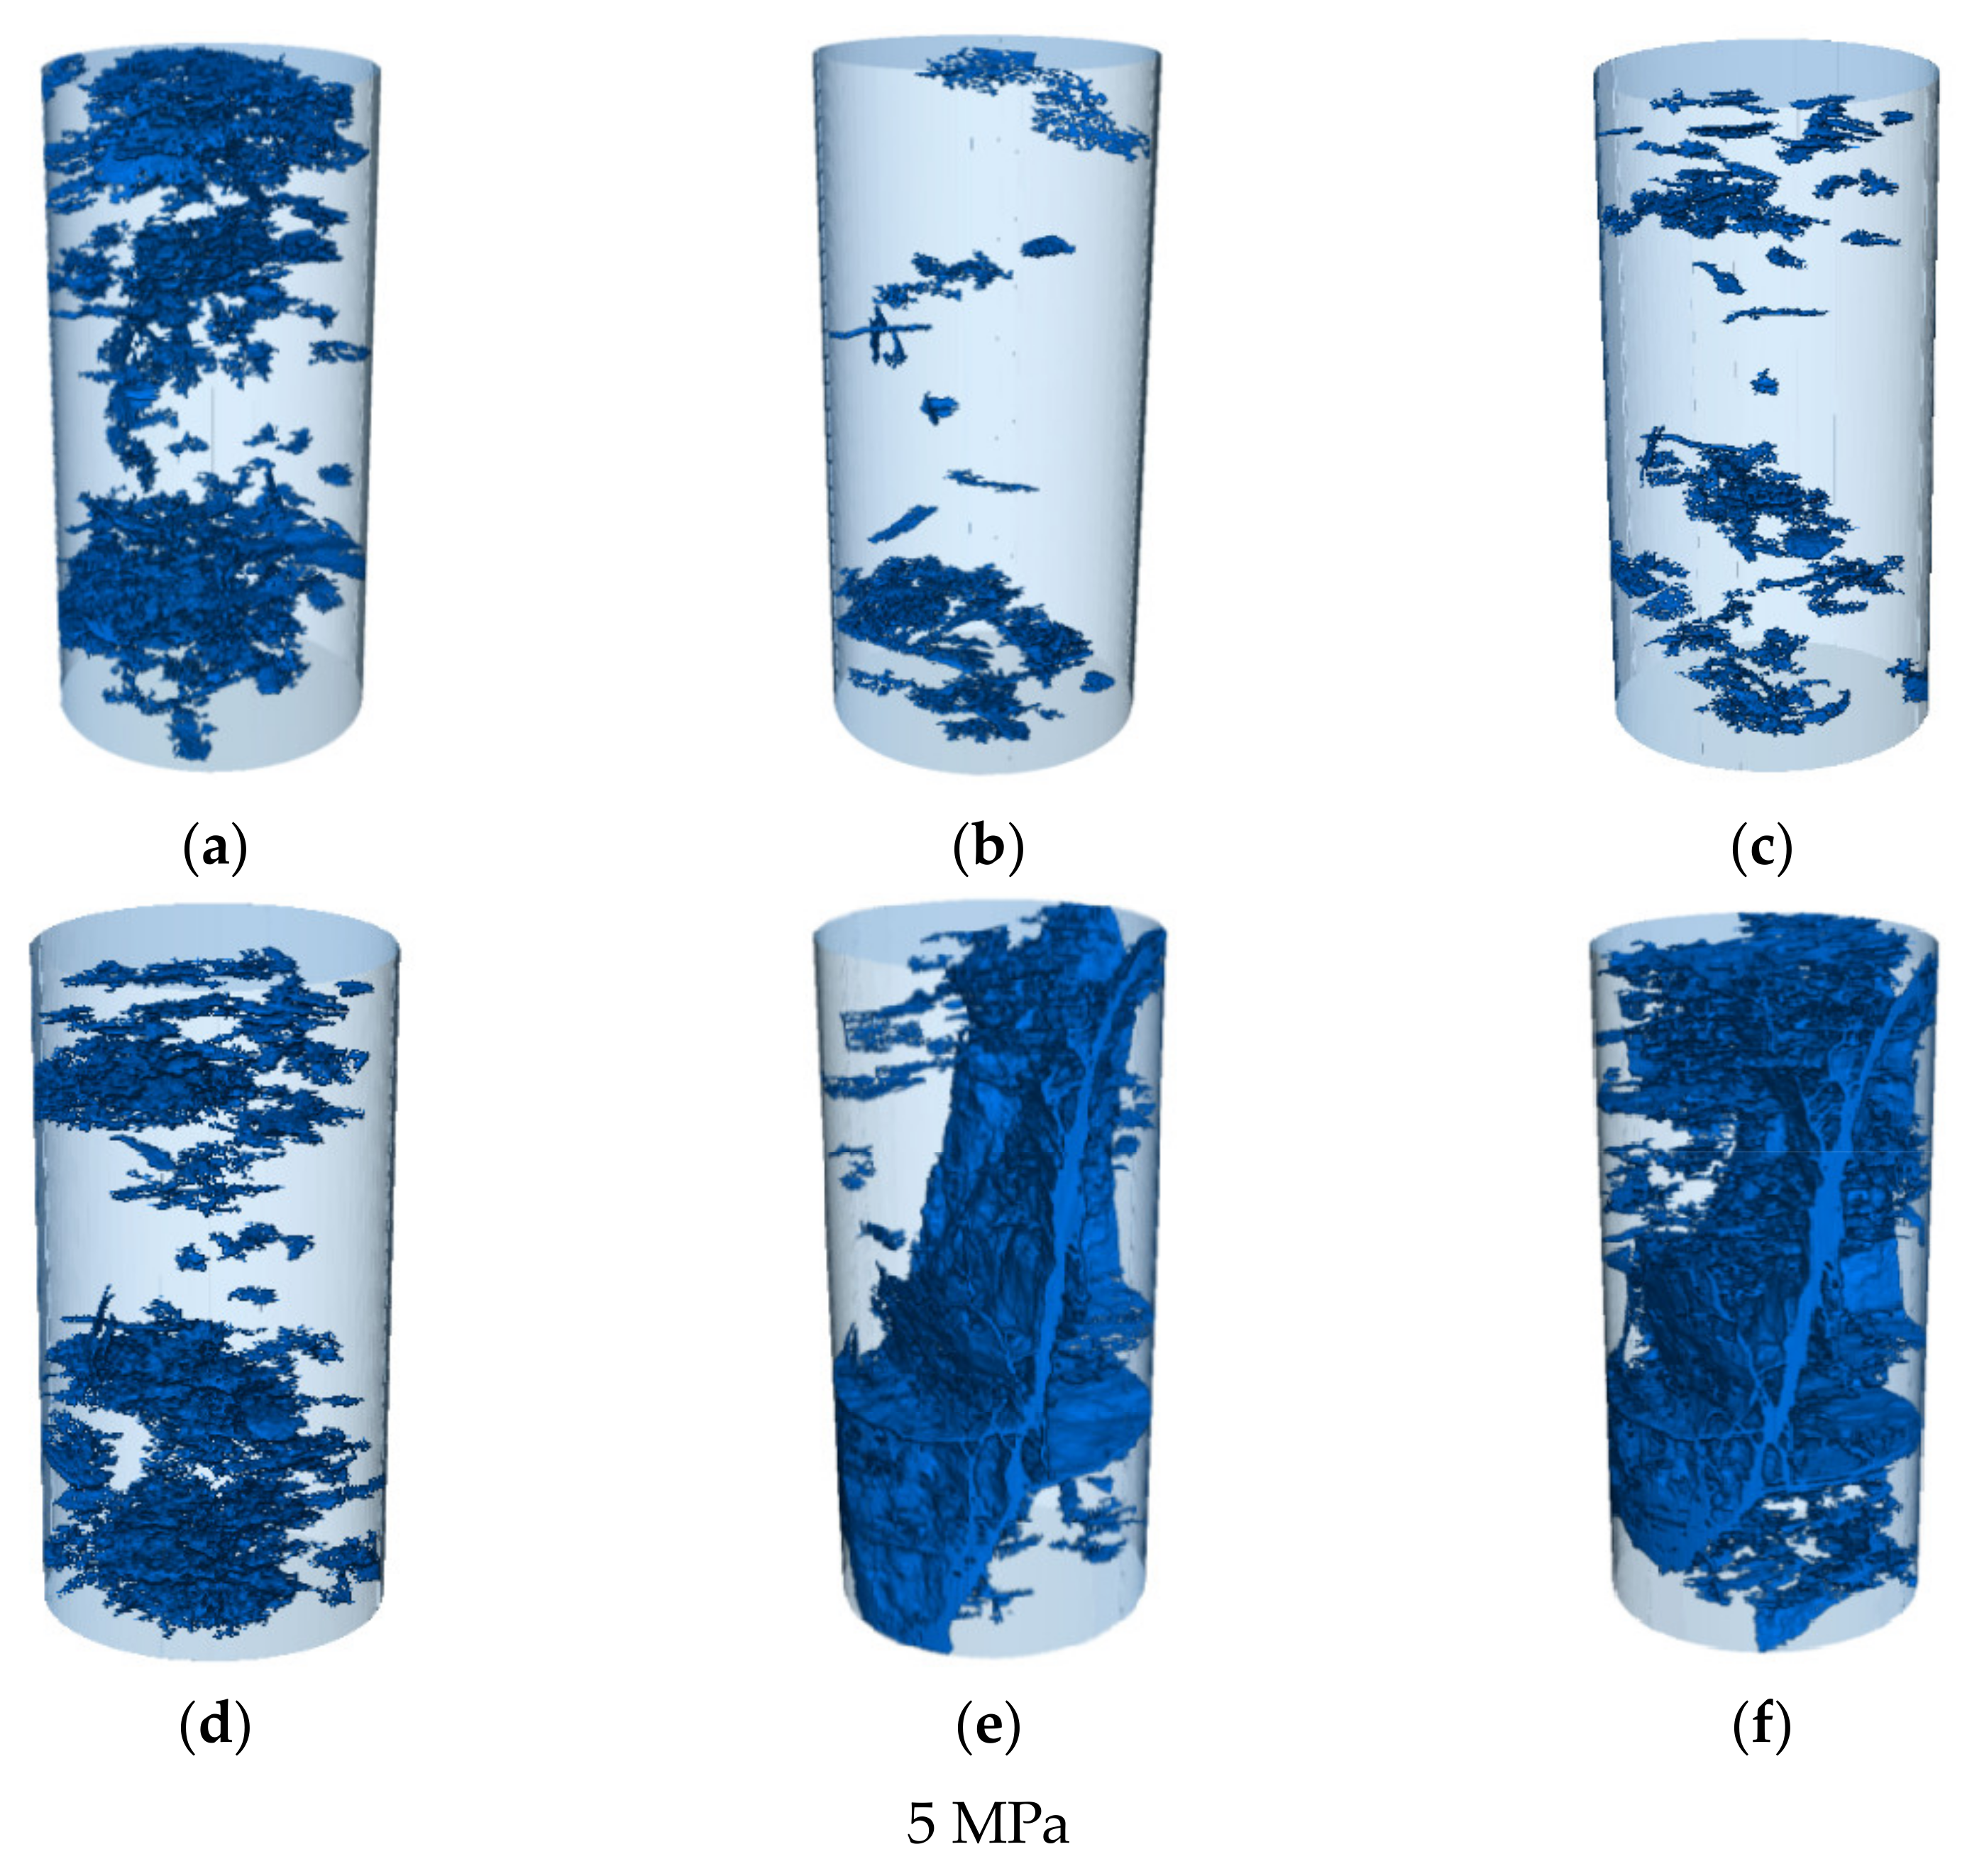
3.3. Three-Dimensional Fracture Evolution Characteristics

The CT image of a coal sample reflects the two-dimensional development of cracks to a certain extent, but only local information regarding the cracks inside the coal. To identify the complete distribution of cracks in space more clearly, study the crack evolution process in the coal sample, and characterize the three-dimensional morphology of cracks, the original two-dimensional slice must be reconstructed in three dimensions, and the cracks need to be extracted and analyzed using image analysis and processing software.
Figure 7 shows the results regarding the evolution and distribution of three-dimensional cracks in the coal samples from the first to the sixth scan under different confining pressures, where the blue area represents the cracks. The image obtained via scanning was processed, including selecting the region of interest (ROI) and filtering out the noise [28]. Using the professional CT image software VG Studio Max (version 3.3.0.165821), the noise level in each original CT image could be reduced, along with its adverse effects on image quality and the subsequent quantitative analysis. In addition, the original CT image was imported into the image processing software for rapid data acquisition, three-dimensional model reconstruction, and data processing analysis.
As shown in Figure 7, the structural diagram of coal samples obtained via three-dimensional reconstruction reflects the development of the fracture network clearly and effectively. Under triaxial compression, the coal shows obvious characteristics in five stages—fracture closure, the initial formation of fracture, the stable growth of fracture and local penetration, the accelerated growth of fracture, and comprehensive penetration and failure—which are consistent with the findings of the two-dimensional analysis of the fracture.
Before reaching peak stress, energy gradually accumulates inside the coal. When the stress concentration reaches the critical value for crack initiation, the crack expands rapidly, the fracture scale and the energy released by the fracture increase, and the fracture volume increases sharply. After the peak stress is reached, brittle failure quickly occurs as a result of the overall instability of the coal, and the volume of the stress fracture shows no obvious change. The stage characteristics of each coal sample under different confining pressures are basically the same. From the in situ state to the compaction stage, the fracture volume of the coal sample is obviously reduced. From the initial formation of the fracture to the complete destruction of the sample, the fracture volume of the coal sample increases gradually but significantly, and the growth trend changes from slow to rapid. A three-dimensional assessment thus more effectively characterizes the evolution of the overall fracture network in coal samples under different confining pressures.

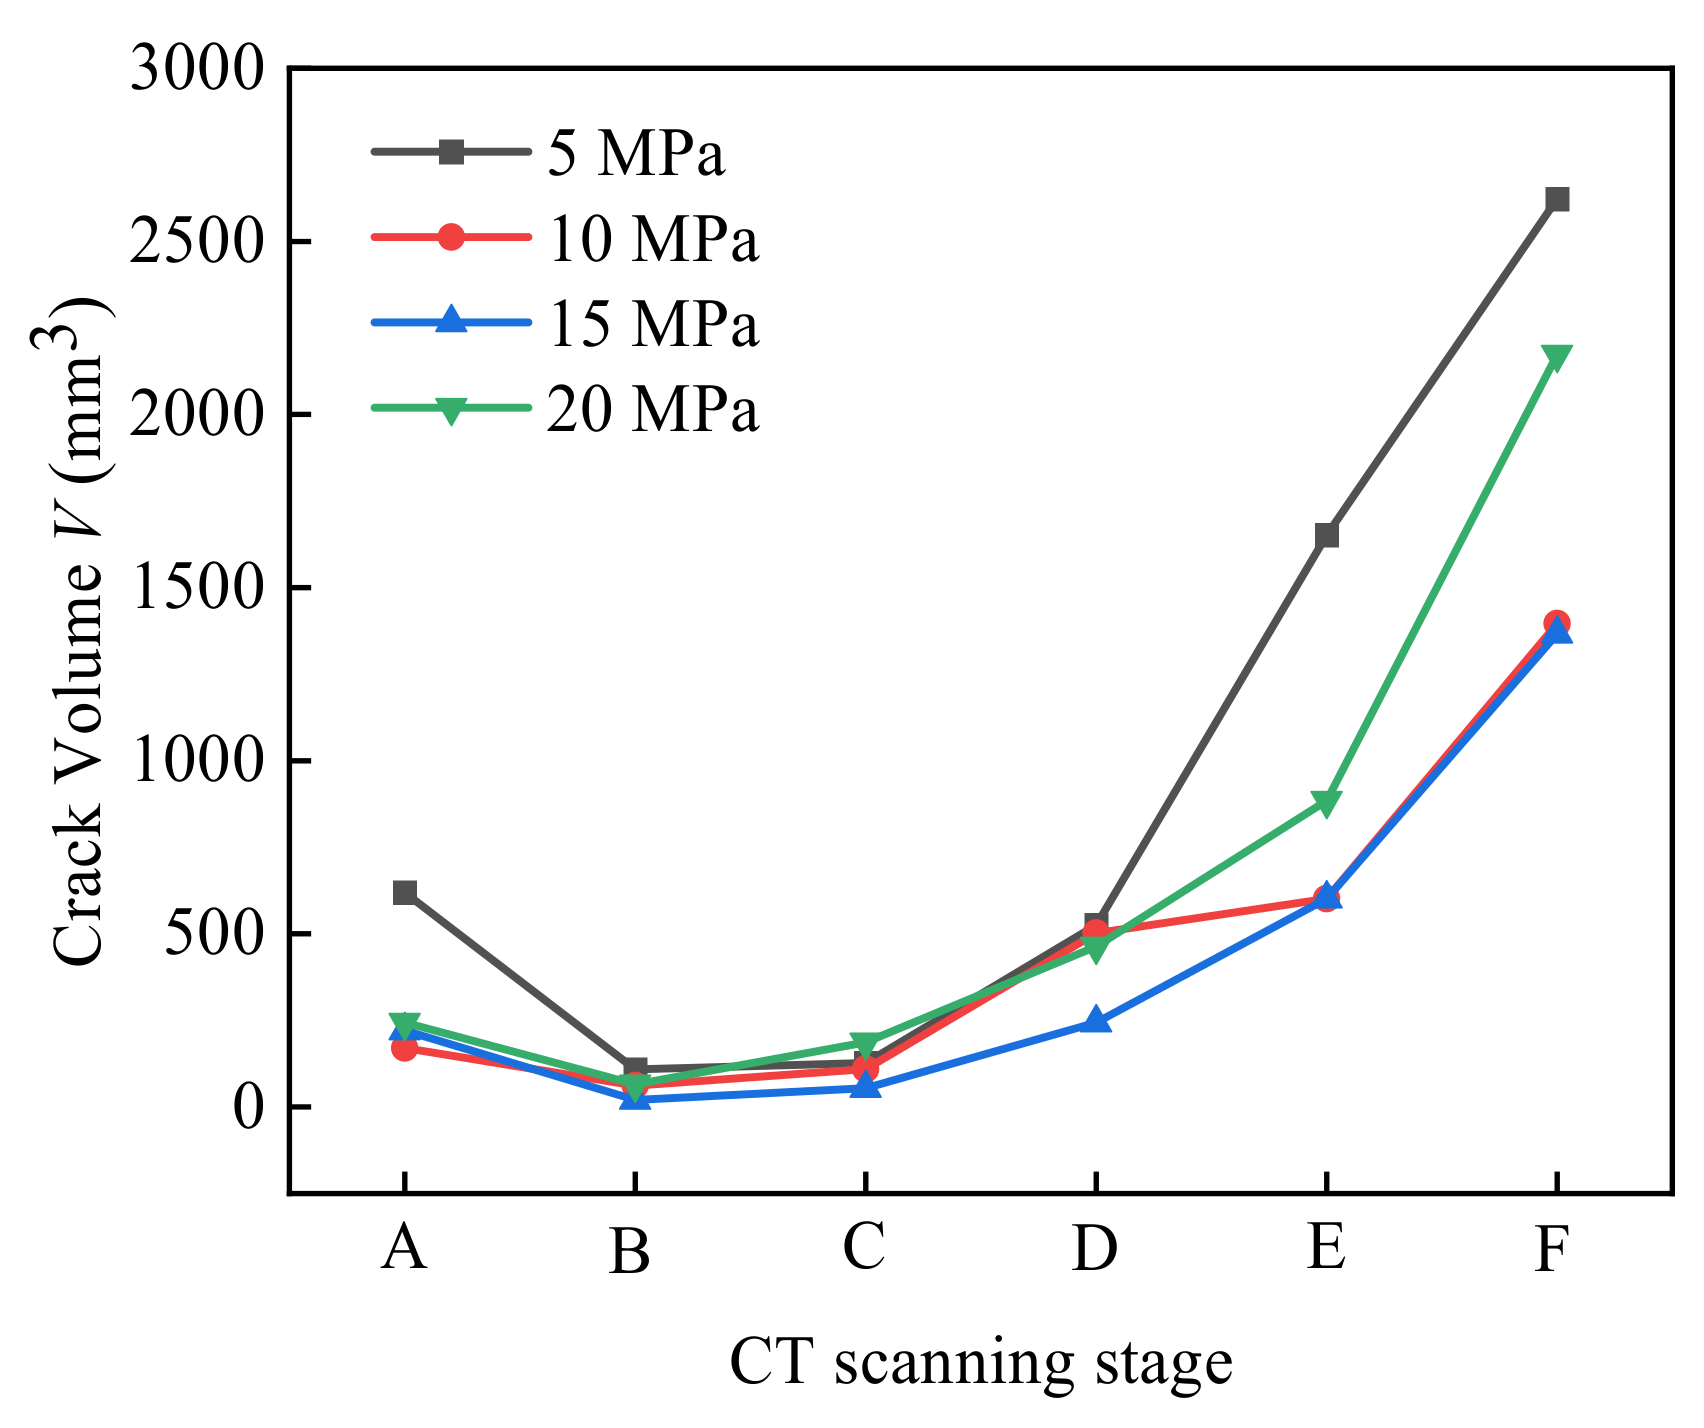
3.4. Quantitative Analysis of Three-Dimensional Fracture Evolution Characteristics

Under loading, with differences in stress, the internal pore cracks within coal samples undergo a process of continuous change. The relationship between the internal crack volume in coal and the stress offers the most intuitive reflection of the dynamic evolution process of the cracks in loaded coal. The in-depth quantitative study of the general digital indicators extracted from the three-dimensional crack images can effectively strengthen our intuitive understanding of the evolution of pore crack structures in coal and rock. To further characterize the law of crack propagation in coal, the parameters of crack volume were calculated and extracted, as shown in Figure 8.
The research shows that the fractal dimension method of calculating the three-dimensional fracture structure in a material is similar to that of the two-dimensional fracture structure. Each three-dimensional image is covered with a series of grids of decreasing size. The three-dimensional fracture network is covered with a cube, which is constructed to cover the point set. By changing the side length ε of the small cube box, several small cube boxes can be formed, and the corresponding box number N(ε) containing the point set can be calculated [29]. After multiple scale changes, a series of data for ε and N(ε) can be obtained. The least-squares method is used to fit the scatter plot of the relationship between lg(1/ε) and lg N(ε), and the slope of the fitted line gives the three-dimensional fractal dimension. The box-counting dimension D is defined as
D = lim ε 0 lg N ( ε ) lg ( ε ) = lim ε 0 lg N ( ε ) lg ( 1 / ε )
The three-dimensional fractal dimensions of the fracture, when the specimens were destroyed under four confining pressures, were calculated. Table 3 shows that the compaction effect in the initial stage becomes more significant with the increase in confining pressure, and that the fractal dimension of the fracture structure in the coal specimen decreases gradually with the closure of the fracture. The reason for this is that the confining pressure reduces the internal fracture surface of coal–rock specimens; that is, the degree of damage is weakened and the corresponding fractal dimension Dt is reduced, indicating that an increase in confining pressure additionally and effectively inhibits the development of internal cracks in coal–rock.
Coal is a natural, heterogeneous, porous material containing a large number of naturally occurring micropores. Particularly when the coal is forced into a stress state, its pores and fissures expand and extend with the external force and the accumulation of energy, a process that is complex and random. The three-dimensional fractal dimensions of the samples at each scanning stage under different confining pressures are shown in Figure 9.
In the above study, triaxial compression experiments of coal under different confining pressures were performed, with six scans taken at different stages, and the results are shown in Figure 9. Under the same confining pressure, the three-dimensional fractal dimension shows a trend of decreasing first and then increasing; however, with the increase in confining pressure, the fractal dimension values at the same stage are different, though they are all between 2 and 3. The closer the fractal dimension is to 2, the fewer the pores and fissures inside the coal, the smaller their volume, and the simpler their distribution. The closer the fractal dimension is to 3, the greater the number of pores and fissures inside the coal, the larger their volume, and the more complex their distribution.
The damage deformation processes of loaded coal under different confining pressures are similar in each stage. The damage process can be roughly divided into the following stages: compaction, elastic deformation, plastic yield, post-peak failure, and residual. In this study, the range of fracture surfaces inside the coal samples in their initial states is not large. Different numbers and scales of micro-cracks and pores inside the coal exhibited a point-like discrete distribution, and the degree of pore fracture development was low. The total crack volumes in the samples before being subjected to 5, 10, 15, and 20 MPa were 618.83 (Figure 7a), 169.87 (Figure 7g), 220.75 (Figure 7m), and 244.19 (Figure 7s) mm3, respectively.
During the compaction stage, under the continuous application of confining and axial pressure, the initial cracks in the coal gradually closed, and the volume of the coal decreased continuously. At this stage, the fracture volume and fractal dimension of the coal took their lowest values in the whole compression process. The fracture volumes were 108.30 (Figure 7b), 61.40 (Figure 7h), 20.42 (Figure 7n), and 65.51 (Figure 7t) mm3, and the fractal dimensions were 2.1056, 2.0714, 2.0221, and 2.0016 for the samples before being subjected to 5, 10, 15, and 20 MPa, respectively. The deformation generated at this stage is plastic and cannot be restored after axial compression unloading. After the second scan, the compaction stage ended, the elastic deformation stage began, and the fracture volume and fractal dimension of the coal increased.
In the third scan, the change in the three-dimensional fractal dimension was smaller than that in the compaction stage, and the degree of damage was lower. The main reason for this was that the third scan focused on the elastic deformation stage of coal. In this stage, the stress–strain curve presents a mostly linear relationship under the action of axial compression, and the mechanical properties are relatively stable. We see a minor initiation of internal pores and cracks, with almost no damage. In the fourth scan, the elastic deformation stage basically ended, and the plastic yield stage was about to begin. Compared with the third scan, the increase in fractal dimension was still not large. The damage in this stage is still elastic. A small number of pores and cracks were generated, and the coal was less damaged.
The fifth scanning point was located after the stress peak point, which entailed the reaching of the compressive strength of the coal. A large number of the micropores in the coal began to expand and interconnect, and macroscopic cracks appeared. The crack volumes in the coal samples increased rapidly, reaching 1651.89 (Figure 7e), 601.37 (Figure 7k), 601.69 (Figure 7q), and 884.88 (Figure 7w) mm3 for the samples before being subjected to 5, 10, 15, and 20 MPa, respectively. The growth rates of the three-dimensional fractal dimension were also large, rising to 2.3277, 2.3004, 2.2578, and 2.2041, respectively. At this time, the coal gradually lost its bearing capacity and became damaged; however, because of the interaction between internal friction within the coal and confining pressure, the coal retained some strength after reaching the peak of the stress–strain curve.
With the further development of deformation, in the sixth scan, the fracture volume and fractal dimension of the coal under different confining pressures were maximized. At this time, the coal samples were almost completely destroyed, and their bearing capacities were basically lost. The macroscopic fractures expanded across a large range, and some fractures began to penetrate the fracture surface. Soon after this, the fracture surfaces began to slip. With the accumulation of energy inside the coal, this slippage of the fracture surface was accompanied by a large release of energy, resulting in a small-scale rock burst phenomenon, scattering broken coal blocks around.
In summary, the evolution characteristics of loaded coal under different confining pressures are consistent. They can be separated into three stages of development—slight decrease, stable increase, and significant increase—determined by the confining pressure. The ranges of variation in each are different. The fractal dimension can be used to elucidate the differences in fracture structure in the loaded coal under different confining pressures, i.e., changing the confining pressure can reduce the damage suffered by the coal.

4. Discussion

In this paper, to explore the damage- and failure-related mechanical properties of coal under different confining pressures, triaxial compression tests under confining pressures of 5, 10, 15, and 20 MPa were performed. The stress–strain curve is shown in Figure 10. The mechanical parameters were also extracted, as shown in Table 4. The peak strain, peak stress, and elastic modulus of the coal are proportional to the confining pressure produced under loading. The increase in confining pressure improves the compressive strength of coal.
The conventional triaxial compression test is an essential experimental method used to verify the mechanical parameters of coal and rock. Using different strength theories, we can obtain different strength parameters of coal and rock failure. At present, four strength theories are widely used in underground engineering. In this paper, the main failure mode of coal studied under different confining pressures is shear. The Mohr–Coulomb yield criterion is valuable in the maximum shear stress theory.
Figure 11 shows a Mohr stress circle diagram. According to the Mohr–Coulomb strength criterion [30], in this study, setting different initial confining pressures of σ2 (the intermediate principal stress) = σ3 (the minor principal stress) during the loading process of coal destroys coal rock mass when the shear stress in a certain section reaches the failure value. At this time, if the size and direction of the minimum principal stress are known, then the size and direction of the maximum principal stress in the coal rock mass can be inferred accordingly. The functional relationship of the Coulomb strength curve is
τ = c + σ tan α
where c is the cohesion between the internal materials of the coal, α is the internal friction angle of the coal, the radius of the Mohr circle is (σ1 − σ3)/2, and the coordinate of the center of the Mohr circle is [(σ1 + σ3)/2, 0]. When a certain section of the coal sample reaches a critical value, the Mohr circle is tangential to the Coulomb strength curve; that is, the distance from the center of the Mohr circle to the Coulomb strength curve is equal to the radius of the Mohr circle. At this time, according to the formula for the distance d from the point to the straight line
d = k x 0 y 0 + c k 2 + 1
where, k is the slope of the slash, and the circle center coordinates are (x0, y0). Additionally, we can infer that σ1 and σ3 have the following relationship:
σ 1 = 1 + sin α 1 sin α σ 3 + 2 c cos α 1 sin α
Thus, with the increase in confining pressure, σ1 and σ3 become linear, and the slope of the curve increases. Additionally, a certain proportional relationship exists between the elastic modulus of coal and the confining pressure. The development of confining pressure also helps to improve coal’s mechanical parameters and ability to resist damage [31]. The lateral application of confining pressure closes the primary cracks in the coal sample to a certain extent and strengthens the structure within the coal.

5. Conclusions

(1)
The coal samples tested under different confining pressures all showed stage characteristics. The five stages are as follows: compaction, elastic, plastic, post-peak failure, and residual. The internal pores and fissures of coal underwent closure in the initial compaction stage under loading, followed by a gradual increase in the elastic stage and a sudden increase in the failure stage. Under the confining pressure, the coal’s ability to resist failure was enhanced, and the development of fractures in coal samples was limited. The greater the confining pressure, the greater the limitation to fracture development.
(2)
Via two-dimensional images and three-dimensional analyses, the dynamic changes in cracks emerging in loaded coal under different confining pressures can be quantitatively analyzed. The method for accurately quantifying the evolution of internal cracks within coal samples via fractal theory has good reliability. Based on the changes in the fractal dimension and fracture volume, the two- and three-dimensional fracture evolution characteristics shown within the scanning results are consistent. For coal under different confining pressures, the fracture evolution law is highly consistent, showing a small decrease first and then a large increase. The application of confining pressure can reduce damage in coal.
(3)
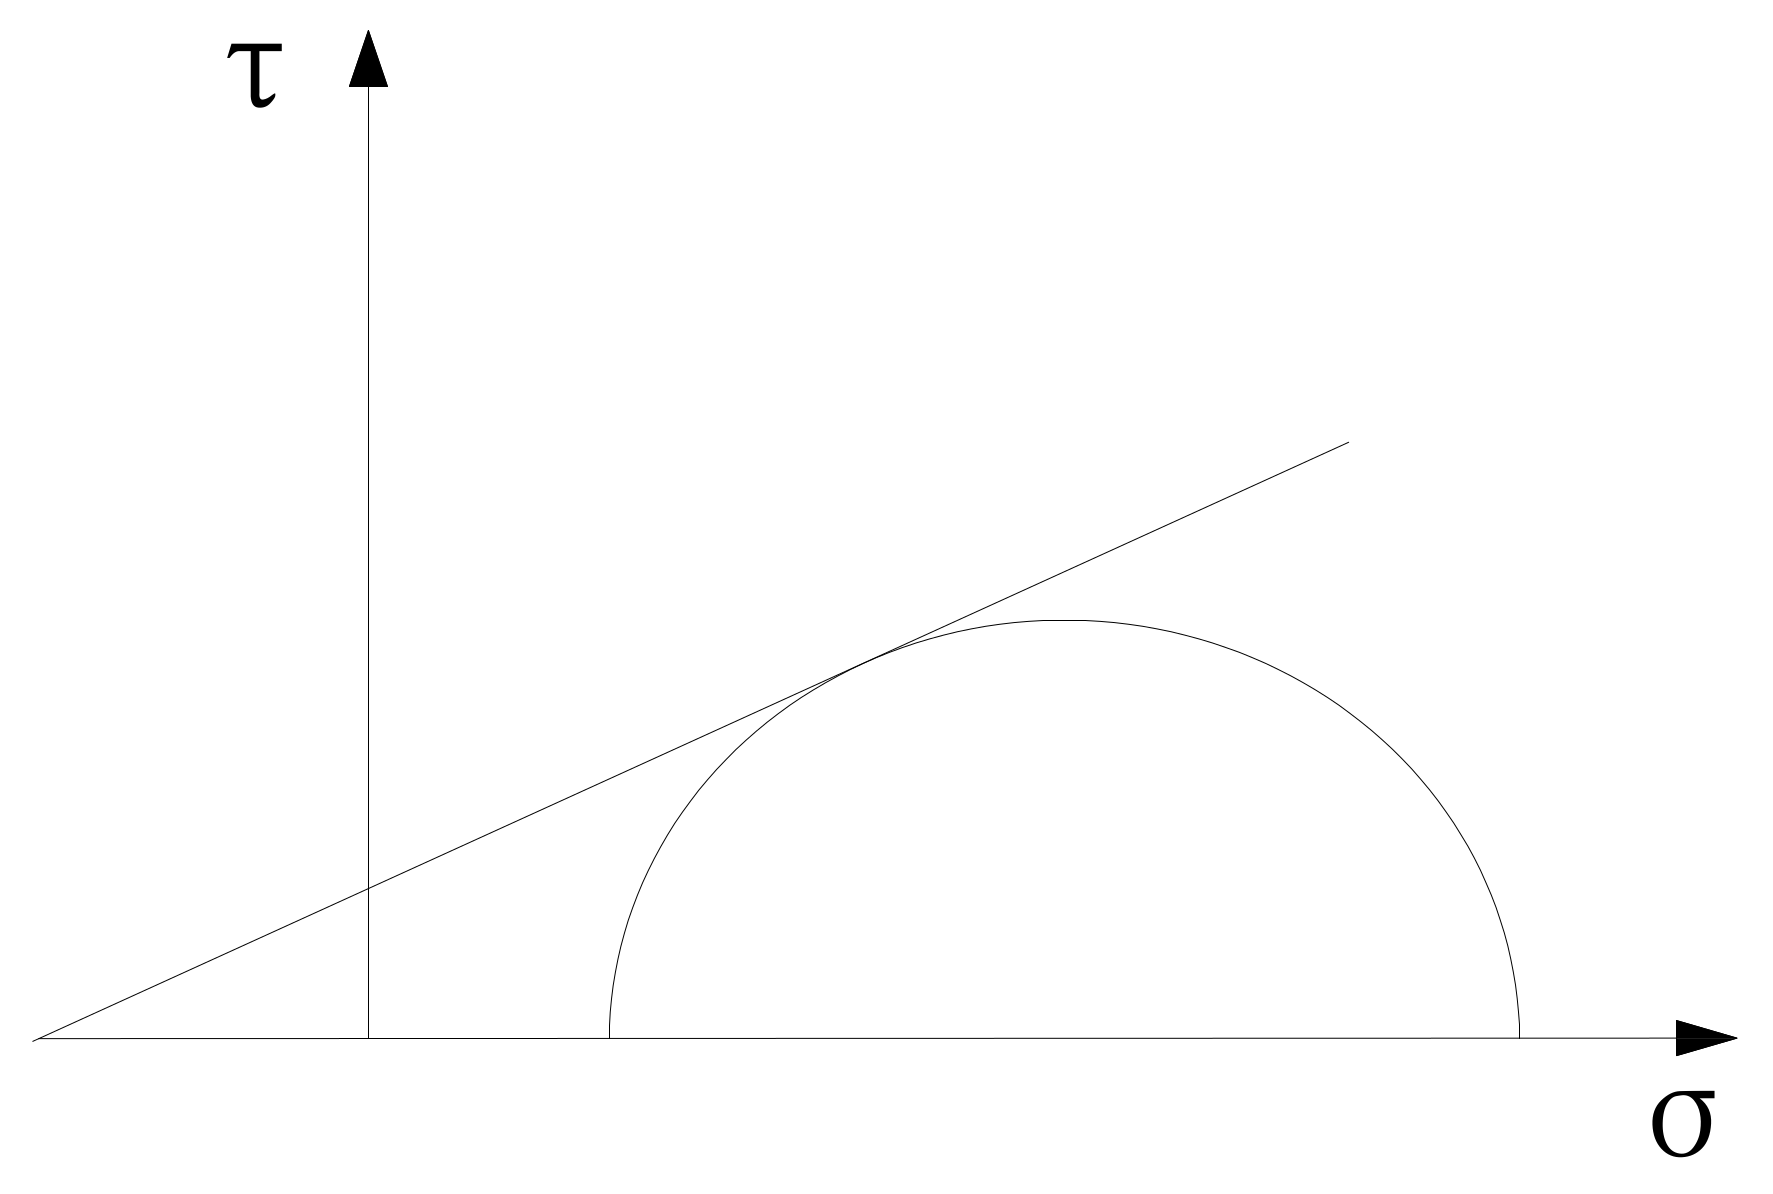
In the triaxial compression tests, the main failure mode of the coal samples was shear failure. Using the Mohr–Coulomb yield criterion, the relationship between mechanical parameters and confining pressure can be obtained. The results of the experiment verify the theory, confirming that the confining pressure improves the mechanical properties of the coal to a large extent. In addition, greater confining pressures result in an increased compressive strength and elastic modulus of the coal.
In this paper, the whole process of coal mass failure is elucidated through laboratory tests. Based on fractal theory, we propose a method for quantifying the fracture structure of coal. Furthermore, when this method is extended to catastrophic circumstances at an engineering site, it can be effectively used to evaluate the failure state of the coal mass and facilitate the prediction of the possible extent of the disaster. In addition, confining pressure refers to the pressure exerted by the rock mass surrounding deep coal; it is intrinsic to the stress environment of coal rock mass. At different depths of coal, the confining pressure differs, increasing with depth. This paper aims to provide a theoretical basis for projecting instability disasters in coal rock mass at different depths or in different environments; this substantiates the engineering application value of this method.

Author Contributions

Conceptualization, A.W.; writing—original draft preparation, A.W.; funding acquisition, L.W.; supervision, L.W.; writing—review and editing, L.W. All authors have read and agreed to the published version of the manuscript.

Funding

This study is supported by the Anhui Province Science and Technology Major special projects (No. 202203a07020010).

Data Availability Statement

The data presented in this study are available upon request from the corresponding author.

Conflicts of Interest

The authors declare that they have no known competing financial interests or personal relationships that could have appeared to influence the work reported in this paper.

References

  1. Ghamgosar, M.; Erarslan, N.; Williams, D.J. Experimental Investigation of Fracture Process Zone in Rocks Damaged Under Cyclic Loadings. Exp. Mech. 2017, 57, 97–113. [Google Scholar] [CrossRef]
  2. Jing, Y.; Armstrong, R.T.; Ramandi, H.L.; Mostaghimi, P. Coal cleat reconstruction using micro-computed tomography imaging. Fuel 2016, 181, 286–299. [Google Scholar] [CrossRef]
  3. Zhao, Y.; Sun, Y.; Liu, S.; Chen, Z.; Yuan, L. Pore structure characterization of coal by synchrotron radiation nano-CT. Fuel 2018, 215, 102–110. [Google Scholar] [CrossRef]
  4. Brzovic, A.; Villaescusa, E. Rock mass characterization and assessment of block-forming geological discontinuities during caving of primary copper ore at the El Teniente mine, Chile. Int. J. Rock Mech. Min. 2007, 44, 565–583. [Google Scholar] [CrossRef]
  5. Jiang, G.; Zuo, J.; Li, Y.; Wei, X. Experimental investigation on mechanical and acoustic parameters of different depth shale under the effect of confining pressure. Rock Mech. Rock Eng. 2019, 52, 4273–4286. [Google Scholar] [CrossRef]
  6. Alejano, L.R.; Arzúa, J.; Bozorgzadeh, N.; Harrison, J.P. Triaxial strength and deformability of intact and increasingly jointed granite samples. Int. J. Rock Mech. Min. 2017, 95, 87–103. [Google Scholar] [CrossRef]
  7. Van Stappen, J.F.; McBeck, J.A.; Cordonnier, B.; Pijnenburg, R.P.; Renard, F.; Spiers, C.J.; Hangx, S.J. 4D Synchrotron X-ray Imaging of Grain Scale Deformation Mechanisms in a Seismogenic Gas Reservoir Sandstone During Axial Compaction. Rock Mech. Rock Eng. 2022, 55, 4697–4715. [Google Scholar] [CrossRef]
  8. Liu, H.; Wang, L.; Zhao, H.; Li, S. Dynamic characteristics and deterioration mechanism of coal under distinct initial gas pressure. Geomech. Geophys. Geo-Energy Geo-Resour. 2023, 9, 111. [Google Scholar] [CrossRef]
  9. Roslin, A.; Pokrajac, D.; Zhou, Y. Cleat structure analysis and permeability simulation of coal samples based on micro-computed tomography (micro-CT) and scan electron microscopy (SEM) technology. Fuel 2019, 254, 115579. [Google Scholar] [CrossRef]
  10. Yu, X.; Kemeny, J.; Li, J.; Song, W.; Tan, Y. 3D Observations of Fracturing in Rock-Backfill Composite Specimens Under Triaxial Loading. Rock Mech. Rock Eng. 2021, 54, 6009–6022. [Google Scholar] [CrossRef]
  11. Zaidi, M.; Ahfir, N.; Alem, A.; Taibi, S.; El Mansouri, B.; Zhang, Y.; Wang, H. Use of X-ray computed tomography for studying the desiccation cracking and self-healing of fine soil during drying–wetting paths. Eng. Geol. 2021, 292, 106255. [Google Scholar] [CrossRef]
  12. Huang, J.G.; Xu, K.M.; Guo, S.B.; Guo, H.-W. Comprehensive Study on Pore Structures of Shale Reservoirs Based on SEM, NMR and X-CT. Geoscience 2015, 29, 198–205. [Google Scholar]
  13. Ju, Y.; Zhang, Q.; Zheng, J.; Wang, J.; Chang, C.; Gao, F. Experimental study on CH4 permeability and its dependence on interior fracture networks of fractured coal under different excavation stress paths. Fuel 2017, 202, 483–493. [Google Scholar] [CrossRef]
  14. Wildenschild, D.; Sheppard, A.P. X-ray imaging and analysis techniques for quantifying pore-scale structure and processes in subsurface porous medium systems. Adv. Water Resour. 2013, 51, 217–246. [Google Scholar] [CrossRef]
  15. Shang, R.; Wang, L.; Liu, H.; Zhu, C.; Li, S.; Chen, L. The Influence of Dip Angle of Rock Bridge on Mechanical Properties and Fracture Characteristics of Fractured Coal Body at Three-Dimensional Scale. Rock Mech. Rock Eng. 2023, 56, 8927–8946. [Google Scholar] [CrossRef]
  16. Wang, G.; Shen, J.; Liu, S.; Jiang, C.; Qin, X. Three-dimensional modeling and analysis of macro-pore structure of coal using combined X-ray CT imaging and fractal theory. Int. J. Rock Mech. Min. 2019, 123, 104082. [Google Scholar] [CrossRef]
  17. Kumari, W.G.P.; Ranjith, P.G.; Perera, M.S.A.; Li, X.; Li, L.H.; Chen, B.K.; Isaka, B.A.; De Silva, V.R. Hydraulic fracturing under high temperature and pressure conditions with micro CT applications: Geothermal energy from hot dry rocks. Fuel 2018, 230, 138–154. [Google Scholar] [CrossRef]
  18. Xie, H.P. Theory to Fractal and Rock Mechanics; Science Press: Beijing, China, 2005. [Google Scholar]
  19. Zhao, Y.S. Mine Rock Fluid Mechanics; China Coal Industry Publishing House: Beijing, China, 1994. [Google Scholar]
  20. Zhang, Y.B.; Xu, Y.D.; Liu, X.X.; Yao, X.L.; Wang, S.; Liang, P.; Sun, L.; Tian, B.Z. Quantitative characterization and mesoscopic study of propagation and evolution of three-dimensional rock fractures based on CT. Rock Soil. Mech. 2021, 42, 2659–2671. [Google Scholar]
  21. Wang, G.; Qin, X.; Shen, J.; Zhang, Z.; Han, D.; Jiang, C. Quantitative analysis of microscopic structure and gas seepage characteristics of low-rank coal based on CT three-dimensional reconstruction of CT images and fractal theory. Fuel 2019, 256, 115900. [Google Scholar] [CrossRef]
  22. Zhou, Y.X.; Xia, K.; Li, X.B.; Li, H.B.; Ma, G.W.; Zhao, J.; Zhou, Z.L.; Dai, F. Suggested methods for determining the dynamic strength parameters and mode-I fracture toughness of rock materials. Int. J. Rock Mech. Min. 2012, 49, 105–112. [Google Scholar] [CrossRef]
  23. Li, Y.; Yang, S.; Liu, Z.; Sun, B.W.; Yang, J.; Xu, J. Study on mechanical properties and deformation of coal specimens under different confining pressure and strain rate. Theor. Appl. Fract. Mech. 2022, 118, 103287. [Google Scholar] [CrossRef]
  24. Sun, Y.H. Modeling and Numerical Simulation of Fractured Low Permeability Sandstone Reservoir; Tianjin Science and Technology Press: Tianjin, China, 2010. [Google Scholar]
  25. Zhang, R.; Ai, T.; Li, H.; Zhang, Z.; Liu, J. 3D reconstruction method and connectivity rules of fracture networks generated under different mining layouts. Int. J. Min. Sci. Technol. 2013, 23, 863–871. [Google Scholar] [CrossRef]
  26. Peng, R.D.; Xie, H.P.; Ju, Y. Computation method of fractal dimension for 2-D digital image. J. China Univ. Min. Technol. 2004, 33, 19–24. [Google Scholar]
  27. Fu, X.; Qin, Y.; Xue, X.; Li, G.; Wang, W. Research on Fractals of Pore and Fracture-Structure of Coal Reservoirs. J. China Univ. Min. Technol. 2001, 30, 225–228. [Google Scholar]
  28. Li, G.; Zhang, R.; Xu, X.L.; Zhang, Y.F. CT image reconstruction of coal rock three-dimensional fractures and body fractal dimension under triaxial compression test. Rock Soil. Mech. 2015, 36, 1633–1642. [Google Scholar]
  29. Yang, Y.C.; Peng, R.D.; Zhou, H.W. Computation of Fractal Dimension for Digital Image in a 3-D Space. J. China Univ. Min. Technol. 2009, 38, 251–258. [Google Scholar]
  30. Cai, M.F. Rock Mechanics and Engineering; Science Press: Beijing, China, 2013. [Google Scholar]
  31. Wang, L.; Liu, H.Q.; Li, S.B.; Chen, L.P.; Liu, H.Q. Fracture evolution characteristics of prefabricated crack coal under different confining pressures. J. Min. Saf. Eng. 2023, 40, 786–797. [Google Scholar]
Figure 1. Coal samples.
Fractalfract 08 00159 g001
Figure 2. High-precision CT three-axis loading experimental system. (a) Industrial CT system, (b) CT scanning principle, (c) internal structure of the CT system, and (d) Phoenix Datos|x2 interface.
Fractalfract 08 00159 g002
Figure 3. Two-dimensional CT images of stress–strain curves at different deformation stages under different confining pressures. (a) 5 MPa; (b) 10 MPa; (c) 15 MPa; (d) 20 MPa.
Fractalfract 08 00159 g003
Figure 4. Schematic diagram of the two-dimensional fracture network and the box-counting method used for assessing the fractal dimension. (a) Coal sample original slice, (bd) Refinement process of grids.
Fractalfract 08 00159 g004
Figure 6. Binarized graph of coal sample slices at confining pressures of (a) 10, (b) 15, and (c) 20 MPa.
Fractalfract 08 00159 g006
Figure 7. Fracture morphology and distribution during coal sample loading for confining pressures of (af) 5 MPa, (gl) 10 MPa, (mr) 15 MPa, and (sx) 20 MPa.
Fractalfract 08 00159 g007aFractalfract 08 00159 g007bFractalfract 08 00159 g007c
Figure 8. Relationship between fracture volume and confining pressure.
Fractalfract 08 00159 g008
Figure 9. Relationship between three-dimensional fractal dimension and confining pressure.
Fractalfract 08 00159 g009
Figure 10. Stress–strain curves under different confining pressures.
Fractalfract 08 00159 g010
Figure 11. Mohr’s stress circle.
Fractalfract 08 00159 g011
Table 1. CT system parameters.
Ray Tube ModelSystem ParameterMaximum PowerMaximum Tube VoltageDetail Resolution
Micron-sized ray
tube
Value500 W300 kV≤2 μm
Nano-scale ray
tube
15 W180 kV≤0.5 μm
Table 2. Calculation results of two-dimensional fractal dimension of coal sample.
Confining Pressure (MPa)5101520
Fractal dimensionFirst scan1.36311.28171.18651.1148
Second scan1.31881.21131.04751.0217
Third scan1.35311.22171.08681.0275
Fourth scan1.41041.27091.13911.0807
Fifth scan1.52371.37281.24681.1541
Sixth scan1.58691.48421.34911.3258
Table 3. Calculation results of the three-dimensional fractal dimension of coal samples.
Confining Pressure (MPa)5101520
Three-
dimensional fractal
dimension
First scan2.20462. 17702.13122.1058
Second scan2.10562.07142.02212.0016
Third scan2.14292.12522.10932.0672
Fourth scan2.20462.17852.16332.1162
Fifth scan2.32772.30042.25782.2041
Sixth scan2.41412.39822.33272.2984
Table 4. Triaxial compression test results.
Confining Pressure (MPa)Peak Strength (MPa)Peak StrainElastic Modulus (MPa)
530.790.4764.13
1038.990.5176.59
1552.930.6082.08
2080.240.7892.06
Disclaimer/Publisher’s Note: The statements, opinions and data contained in all publications are solely those of the individual author(s) and contributor(s) and not of MDPI and/or the editor(s). MDPI and/or the editor(s) disclaim responsibility for any injury to people or property resulting from any ideas, methods, instructions or products referred to in the content.

