Article

The Classification and Evaluation of an Interlayer Shale Oil Reservoir Based on the Fractal Characteristics of Pore Systems: A Case Study in the HSN Area, China

1
Cooperative Innovation Center of Unconventional Oil and Gas, Yangtze University (Ministry of Education & Hubei Province), Wuhan 430100, China
2
School of Geosciences, Yangtze University, Wuhan 430100, China
3
Exploration and Development Research Institute, PetroChina Changqing Oilfield, Xi’an 710018, China
*
Author to whom correspondence should be addressed.
Fractal Fract. 2024, 8(3), 167; https://doi.org/10.3390/fractalfract8030167
Submission received: 9 February 2024 / Revised: 6 March 2024 / Accepted: 12 March 2024 / Published: 14 March 2024
(This article belongs to the Special Issue Flow and Transport in Fractal Models of Rock Mechanics)

Abstract

:
The evaluation of shale reservoir quality is of great significance for the exploration and development of shale oil. To more effectively study the distribution characteristics of shale reservoir quality, thin-section observation, scanning electron microscopy and pressure-controlled porosimetry were used to obtain the pore structure characteristics of shale in Chang 7, including pore types, pore size distribution, etc. In addition, the fractal dimensions of the shale samples were calculated based on pressure-controlled porosimetry data. The results show that residual interparticle pores, dissolution pores and clay-dominated pores were the main pore types. The overall pore size was mainly distributed between 3 nm and 50 μm. The pore system was divided into four types using fractal features, and the shale reservoir was divided into four types based on the proportion of different types of pore system. In different types of reservoirs, the production capacity of exploration wells varies significantly, as does the production capacity of horizontal wells. The classification of shale reservoirs using mercury intrusion fractal analysis proved to be suited for the efficient development of Chang 7 shale oil reservoirs.

1. Introduction

As the global demand for oil and natural gas continues to rise, shale oil and gas have emerged as viable alternatives to conventional resources, establishing themselves as pivotal energy sources for humanity in the 21st century [1]. And shale oil resources are increasingly receiving attention from petroleum researchers [2]. Shale oil is the main target of China’s onshore “source exploration”. Since the 1960s, shale oil and gas reservoirs have been discovered in almost all onshore oil and gas basins in China, including Songliao, Bohai Bay, Sichuan, Ordos and Qaidam [3].
The success and economic viability of shale oil extraction hinge on the quality of shale oil reservoirs. High-quality shale reservoirs can accommodate more shale oil and facilitate effective extraction [4,5]. Hence, an increasing number of petroleum geologists are directing their focus toward researching the quality of shale oil reservoirs. This encompasses the examination of storage capacity, seepage characteristics, mechanical properties and other pertinent aspects of shale oil reservoirs. Shale oil reservoirs can be categorized into different levels based on their quality, providing valuable insights into their potential and guiding the direction of exploration and development. Numerous scholars have conducted extensive research on reservoir classification and evaluation, yielding substantial results in this field. Wang (2021) studied the lithology, lithofacies, electrical properties, physical properties, oil-bearing properties, source rock characteristics, brittleness and in situ stress anisotropy of shale oil and further evaluated the types of Gulong shale oil reservoirs in China [6]. Lei applied scanning electron microscopy (SEM) and mercury intrusion testing data to analyze the lithology, pore types and reservoir performance of shale oil from the Permian Fengcheng Formation in Mahu Sag [7]. Zou studied the classification and main controlling factors of sweet spots of alkaline-lake-type shale oil, taking the Fengcheng Formation in the Junggar Basin as an example [8]. However, due to the particularity of sedimentary and diagenetic processes of continental interlayer-type shale reservoirs, there no suitable reservoir classification and evaluation method has been found.
Fractal theory is an effective means of evaluating the pore structure of rocks and analyzing the complexity of pore systems [9,10]. Many scholars apply fractal theory to study the fractal characteristics of shale [11,12]. This study focuses on Chang 7 interbedded shale oil in the HSN area of the Ordos Basin. Various testing methods, including reservoir performance, permeability and pore structure characteristics, are applied to assess the reservoir quality. The pore throat system is classified using fractal dimensions calculated by high-pressure mercury intrusion porosimetry (HMIP). The reservoir is categorized into different types based on the proportion of various pore types. The results demonstrate the suitability of this classification method for evaluating interlayer-type shale reservoirs.

2. Materials and Methods

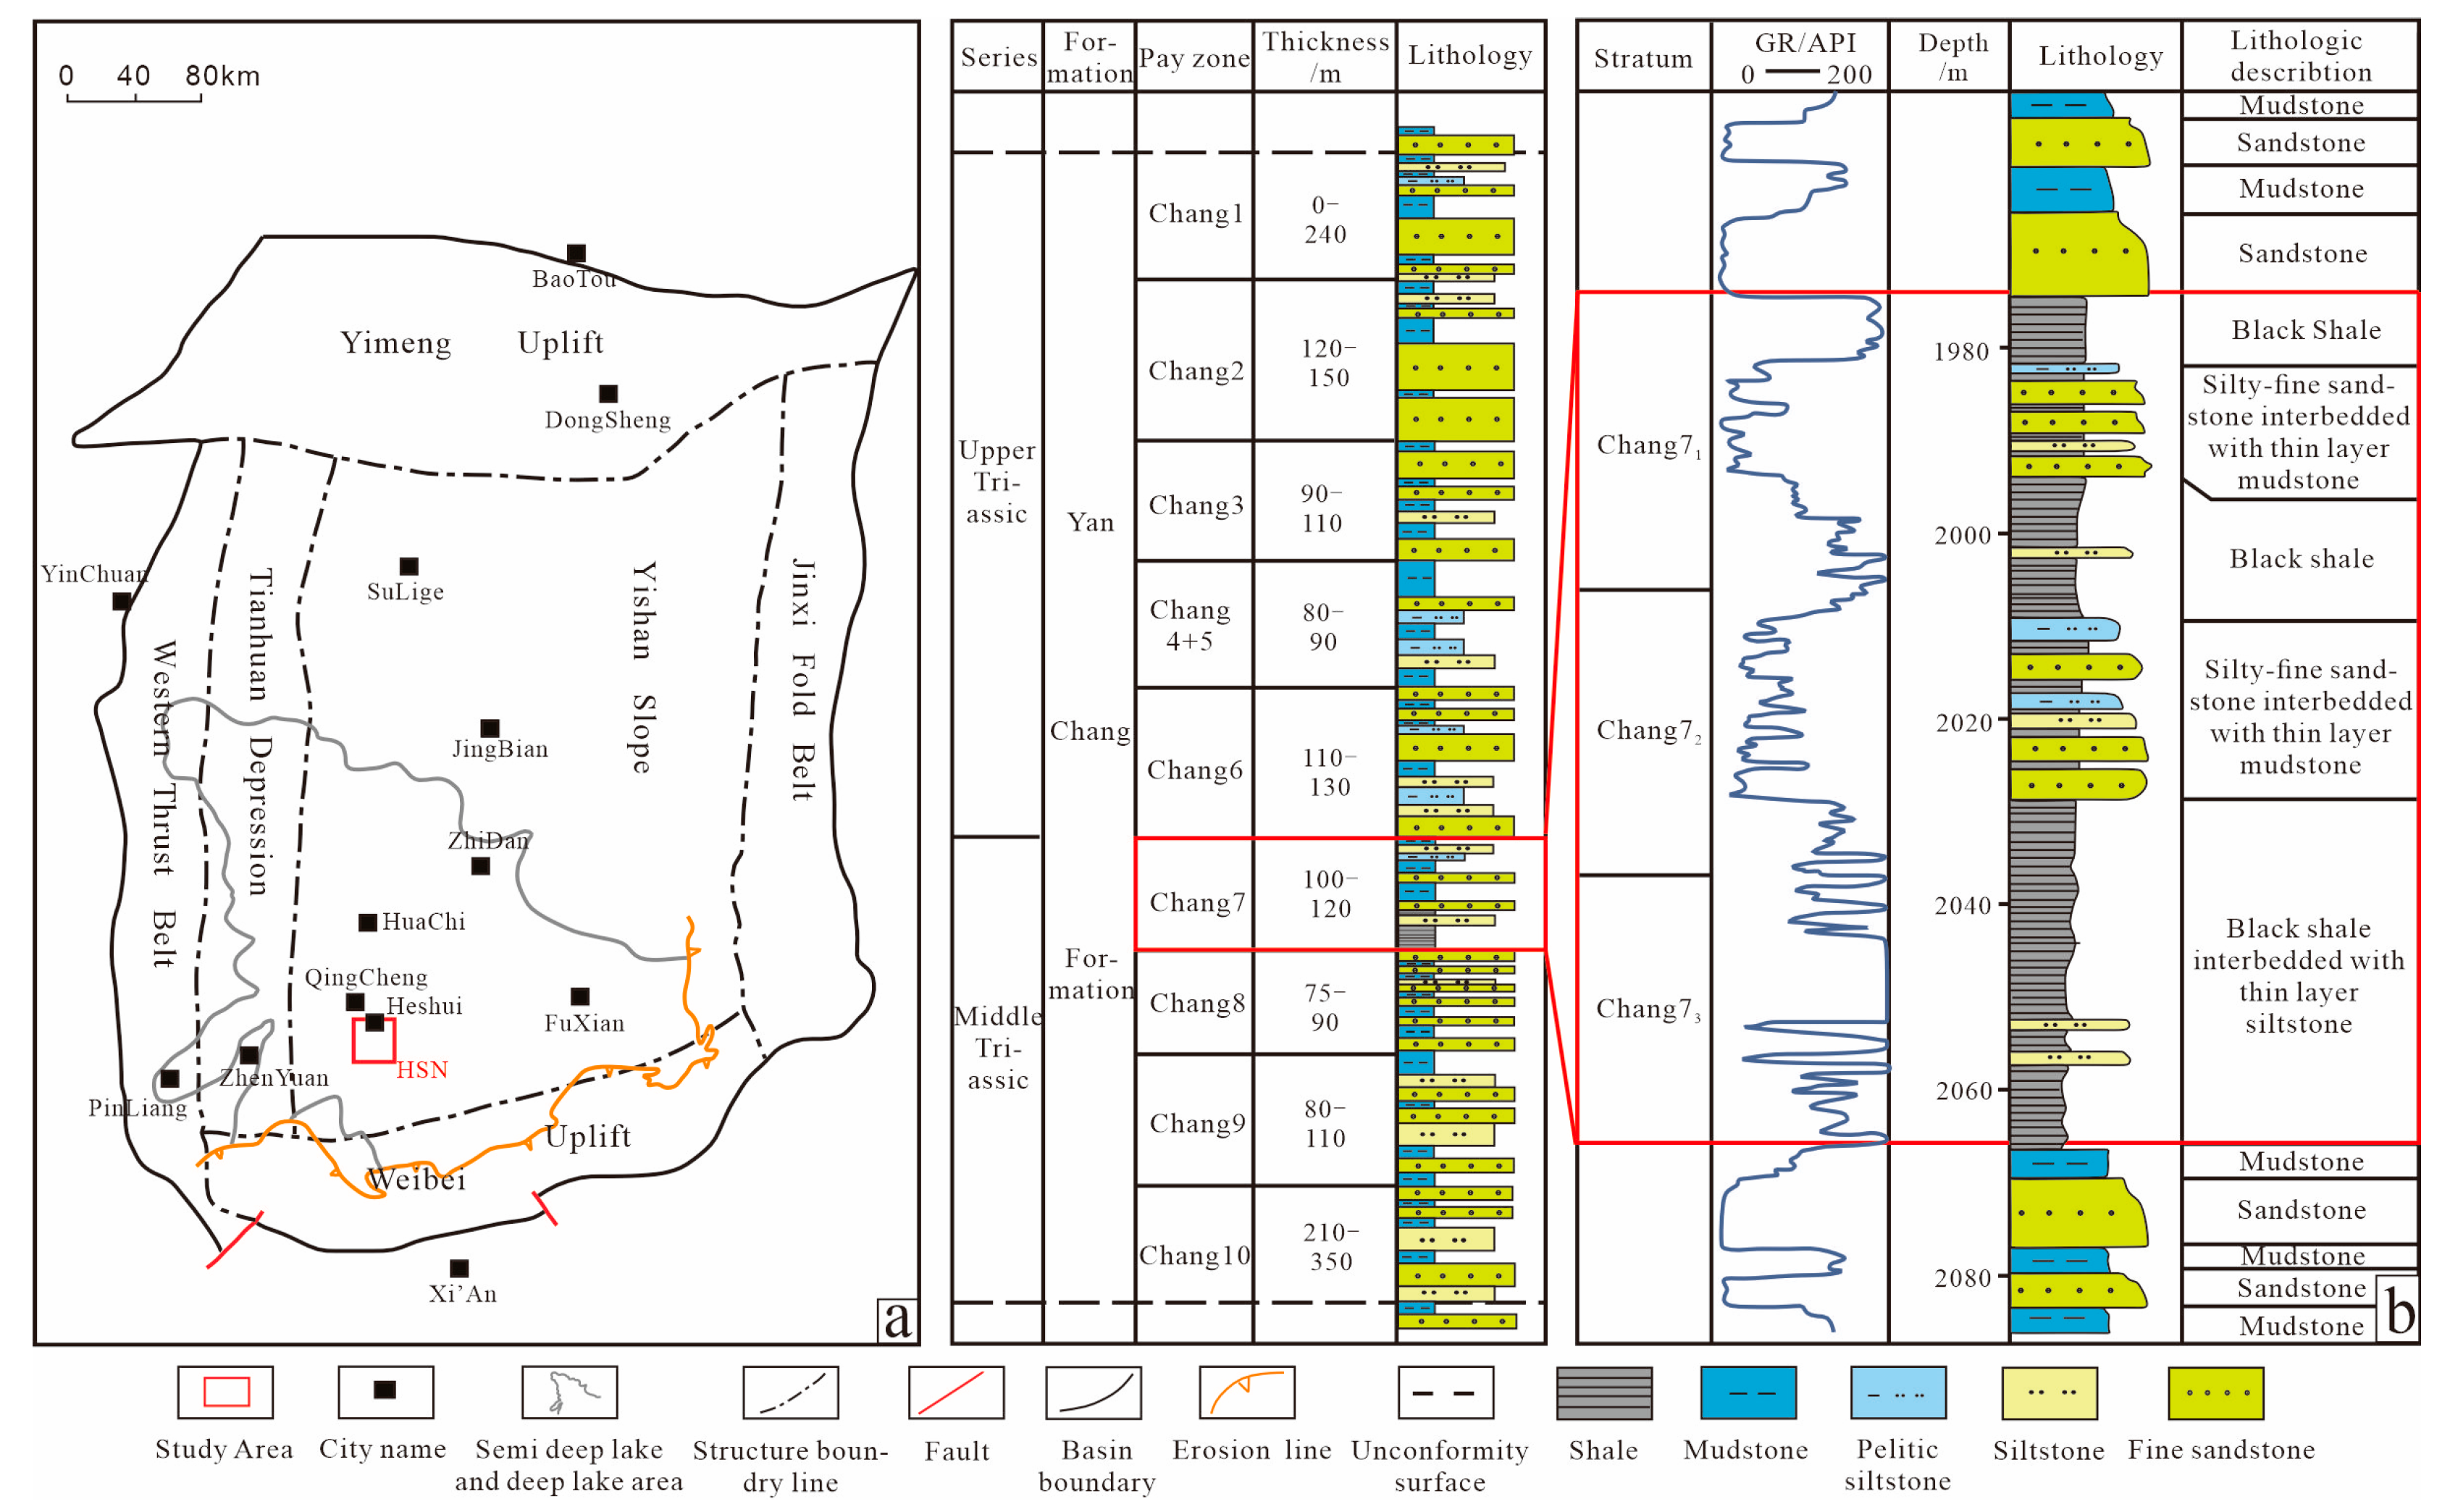
2.1. Geological Setting

The Ordos Basin is a large, multi-cycle sedimentary craton basin located on the North China Plate, and it is the second largest sedimentary basin in China, with a total area of 37 × 104 km2 [13]. The HSN area stands out as a crucial shale oil exploration target, situated in the southwest region of the Yishan slope within the Ordos Basin (Figure 1a). The HSN oilfield is one part of the Qingcheng Oilfield. The geological development in this region is characterized by gravity flow sedimentation processes under the predominant influence of material sources from the southwest direction [14].
The Yanchang Formation, one of most important shale oil exploration and development layers in China, contains a set of clastic rocks with 1000 m depth formed during the Triassic period. According to the distinctive sedimentary cycles, the Yanchang Formation was divided into 10 members, which began from Chang 10 to Chang 1 (Figure 1b). The Chang 7 period marks the peak of lake flooding in the Mesozoic period, characterized by the extensive presence of algae and plankton. This abundant aquatic life during this period laid the groundwork for the formation of organic-rich shale [15,16]. The Chang 7 member can be divided into 3 sections: Chang 73, Chang 72 and Chang 71 (Figure 1b). Within these sections, the Chang 73 section is characterized by the deposition of a suite of black oil shale, interspersed with dark mudstone and thin layers of argillaceous siltstone. This particular stratum serves as the primary focus of shale oil exploration. The average thickness of shale in Chang 7 is 16.4 meters, and the average burial depth of the shale reservoir is 2050 meters. Notably, the average oil saturation within this reservoir is measured at 68.5%.

2.2. Methodology

Microphotographs of samples were acquired using a Hitachi S4800 microscope (Science company, Suzhou, China). Scanning electron microscopy (SEM) was conducted with a resolution and accelerating voltage of 1.2 nm and 30 kV, respectively. To ensure accurate imaging, the sample surfaces underwent meticulous cleaning to eliminate dust, grease and other impurities, utilizing silicon carbide papers. For SEM analysis, samples were prepared to be less than 10 mm in thickness and underwent surface conductive treatment using platinum in this study.
HMIP tests were conducted on six samples using Corelab CMS300 (Petrolabs Tech Limited, Beijing, China) and an AutoPore IV 9500 mercury porosimeter (McMurray (Shanghai) Instrument Co., Ltd., Shanghai, China). The samples, shaped as cubes with dimensions not exceeding 16 × 16 × 16 mm, underwent drying at 105 °C for 48 h before testing. The mercury injection experiment involved pressurized mercury injection and depressurization mercury removal, reaching a maximum experimental pressure of 200 MPa. The analysis covered pores with a radius exceeding 3.11 nm, allowing for the measurement of pore size distribution [17].
CT scanning is becoming a powerful detection tool in characterizing the microscopic pore structure of rock [18]. It utilizes conical X-rays to penetrate an object, magnifies the image through different magnification lenses and reconstructs the three-dimensional structural features of the pore throat from a large number of X-ray attenuation images obtained through 360-degree rotation. The Phoenix Nanoom S Core Scanner (Aixite Technology Co., Ltd., Dongguan, China) was used to obtain 3D structure diagrams of samples. The voltage and the power of the X-ray sources were 110 kv and 14.85 W, and the voxel size was 500 nm. Block samples required an area of less than 20 mm × 20 mm, with a thickness of 1 cm.
The Nuclear Magnetic Resonance (NMR) of the core samples was employed to study pore size, fluid distribution and fracture direction [19,20]. The MesoMR23 NMR instrument (Shanghai Eletronic Technology CO., Ltd. Shanghai, China), operating at a frequency of 23 MHz and a field strength of 0.5 T, was utilized to measure pore information. The instrument’s probe size was 30 mm, allowing the measurement of core samples with a minimum diameter of 1 inch. Prior to analysis, the samples were placed in a drying oven at 60 °C for 24 h, cooled to room temperature and weighed. The initial T2 spectra of the samples were then recorded. Subsequently, under a pressure of 17 MPa, all samples underwent a 24-h kerosene saturation treatment and were weighed again. The T2 spectra of the samples were measured for the second time. Comparing the T2 spectra from the two measurements allowed for the determination of the pore size distribution of the samples.

3. Results

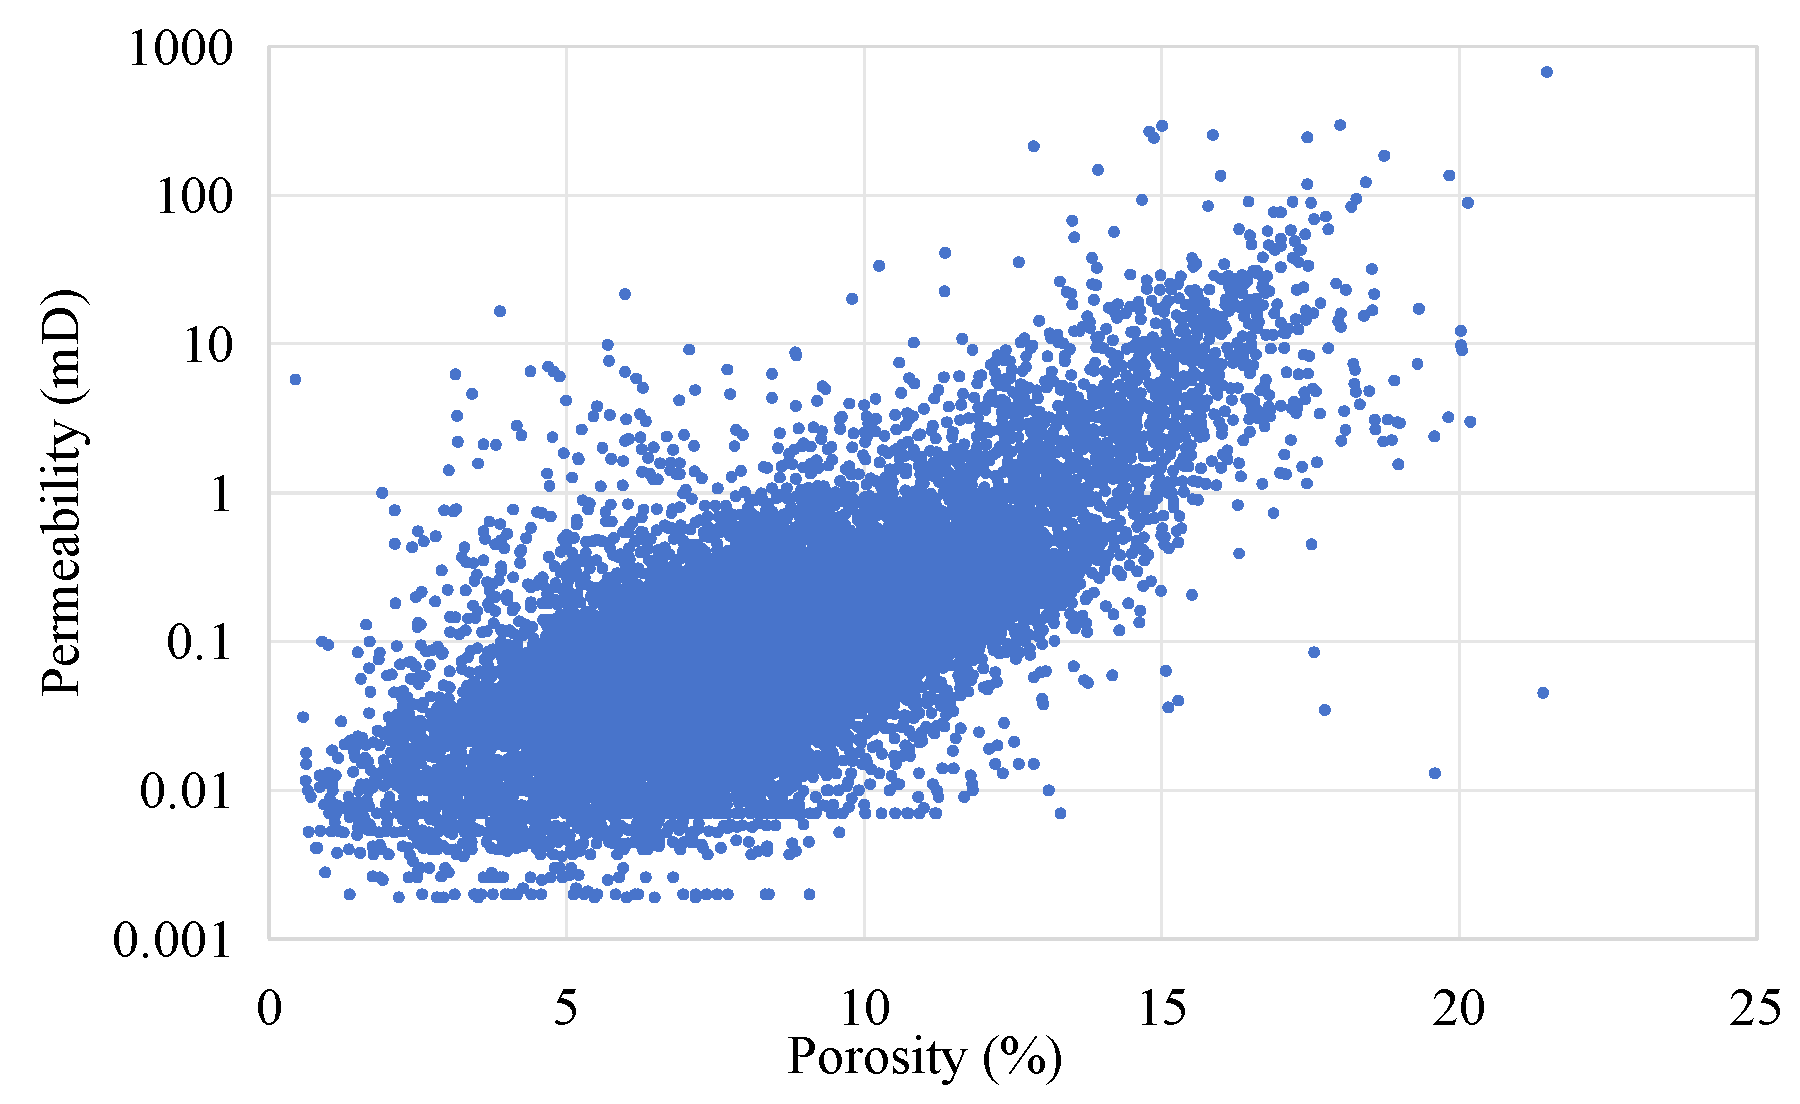
3.1. Porosity and Permeability of Shale Samples in Chang 7

The analysis of 2160 samples from Chang 7 reveals a clear and significant positive correlation between porosity and permeability, as indicated by a correlation coefficient of 0.42 (Figure 2). The porosity of these samples in the Chang 7 exhibits a wide range, spanning from 0.70% to 22.16%, with an average porosity of 9.15%. In terms of permeability, the majority of values fall within the range of 0.005 mD to 9.86 mD, with a mean permeability of 0.103 mD. Notably, 82% of the samples demonstrate permeability values below 1 mD.

3.2. Pore Types of Shale Samples in Chang 7

Thin-section casting and SEM of Chang 7 reveal the presence of four predominant pore types in the HSN area. These include residual intergranular pores (Figure 3a), dissolution pores (Figure 3b–f), intercrystalline pores associated with clay minerals (Figure 3g,h) and microfractures (Figure 3i). During compaction, there is a notable reduction in the volume of intergranular pores in the Chang 7 reservoir, leading to a significant decrease. Currently, intergranular pores predominantly exhibit regular shapes, such as triangles and quadrilaterals. Additionally, dissolution pores are prevalent in the Chang 7 reservoir. Moreover, dissolution pores are widespread in the Chang 7 reservoir. When subjected to a sufficiently acidic fluid, entire rock particles undergo dissolution, leading to the formation of mold pores (Figure 3). Additionally, tectonic forces induce the rupture of rock particles, creating microcracks that contribute to enhanced permeability along the direction of these fractures.

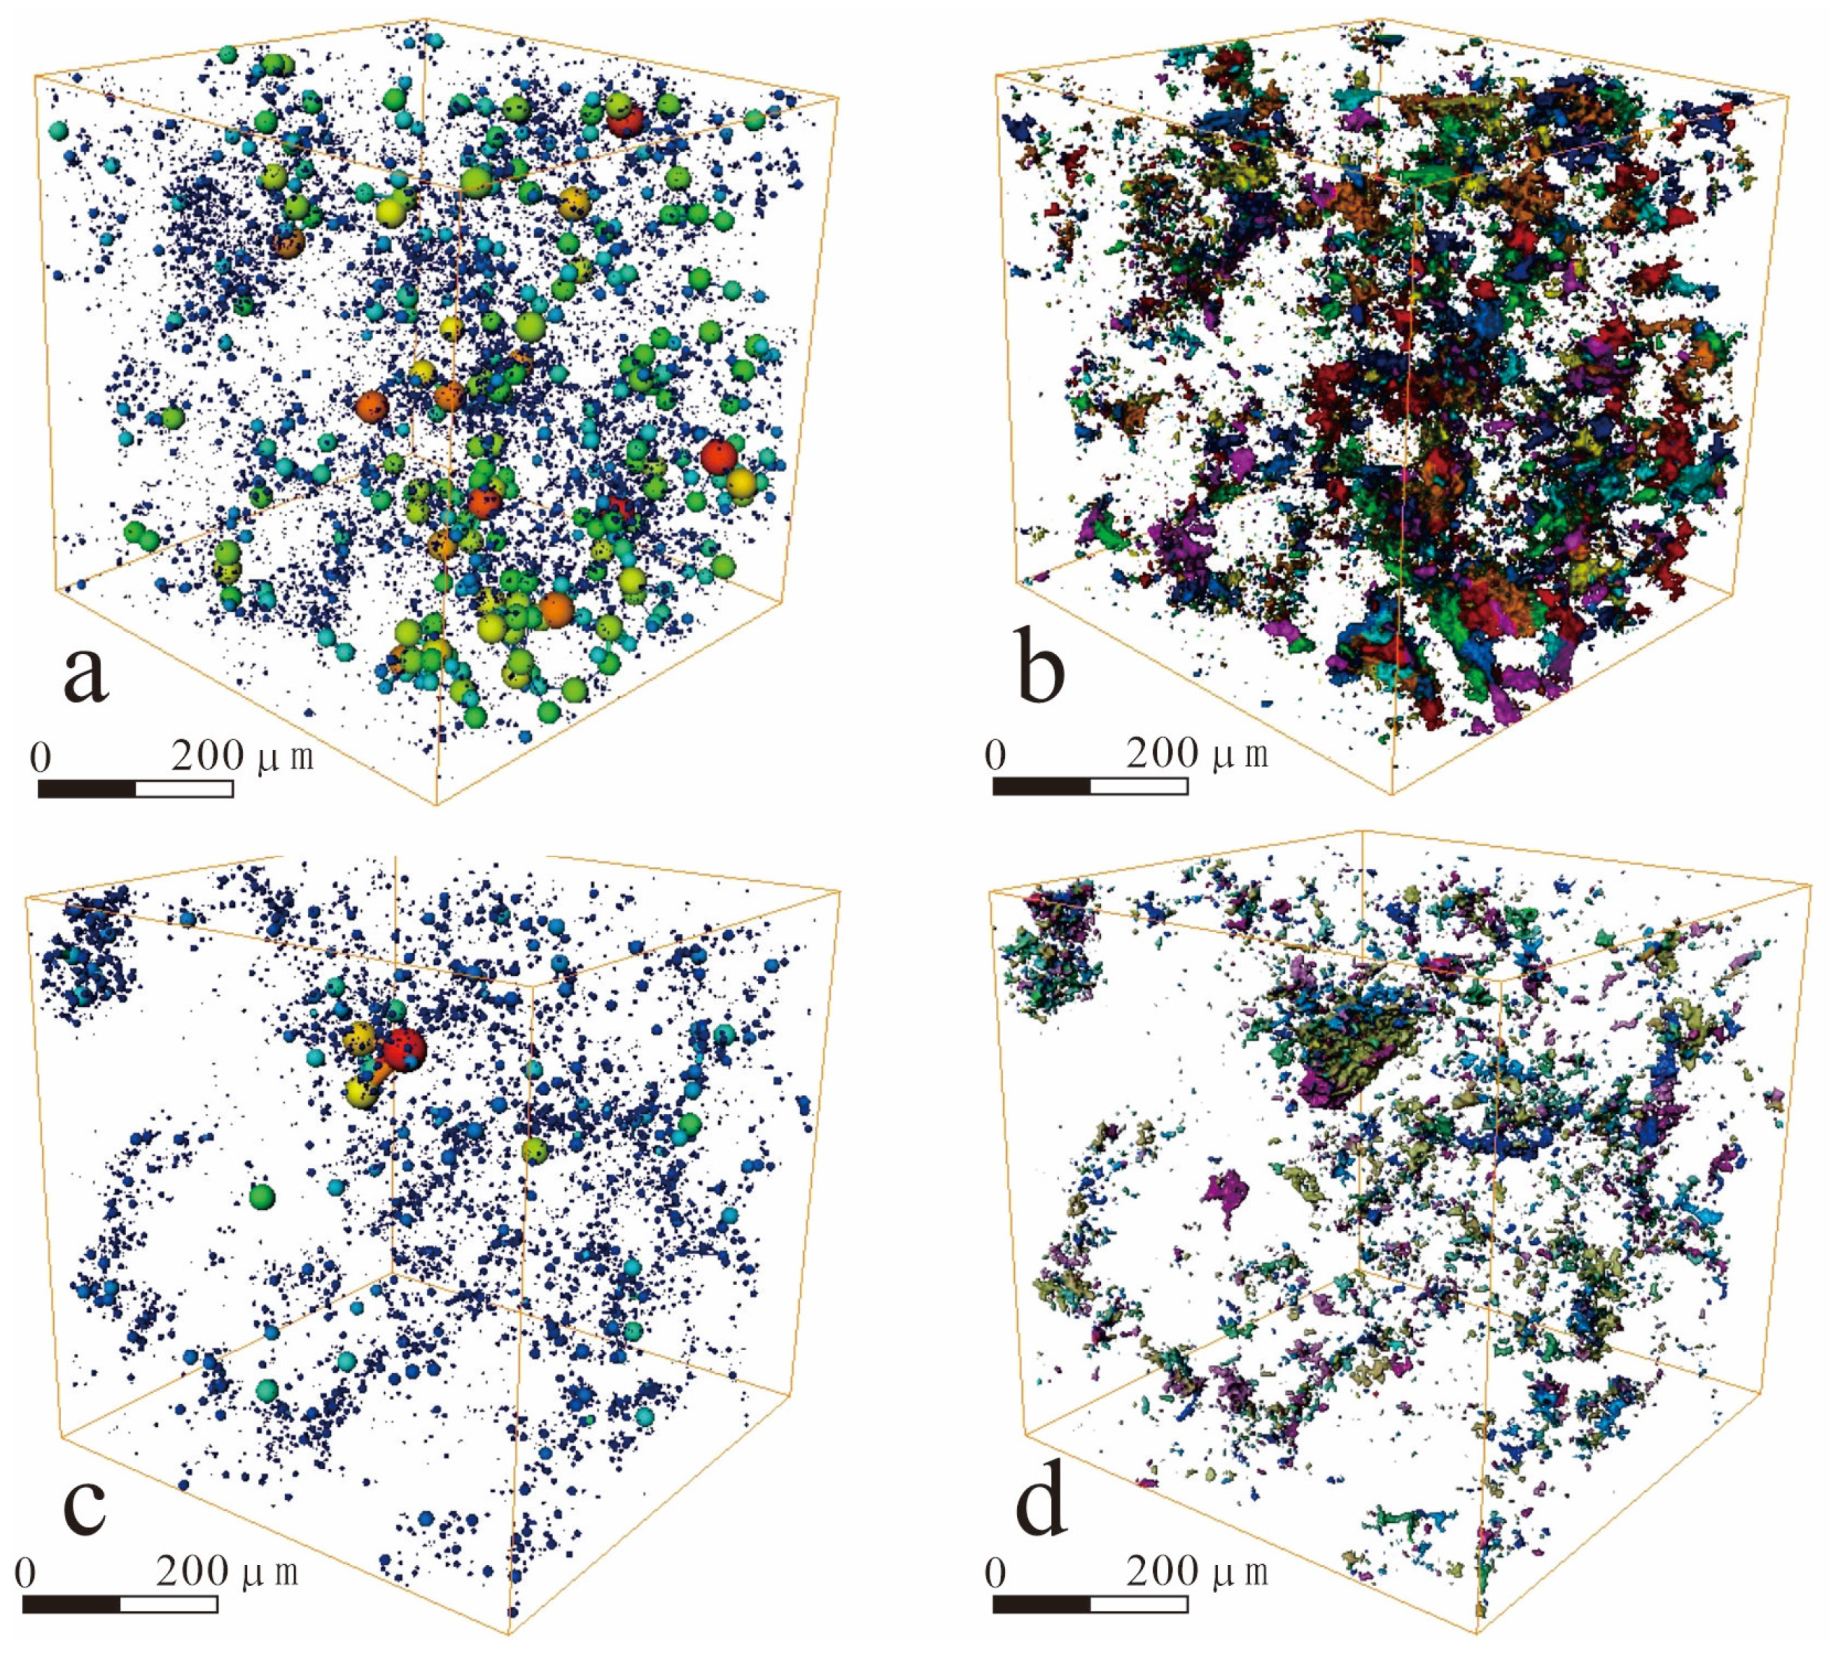
3.3. Pore Network of Shale Samples in Chang 7

The intrusion and extrusion curves of HMIP can reflect the heterogeneity of the pore structures of samples. The mercury intrusion curves of shale samples of Chang 7 in the HSN area can be divided into two categories (Figure 4). The mercury intrusion curves of samples N23 and N115 show relatively high breakthrough pressures, exceeding 2 MPa, and lower maximum mercury saturation, around 72.5%. The maximum mercury saturation of the other samples is greater than 80%. In the initial stage of mercury intrusion, the curves show a distinct plateau, indicating that these samples have good pore throat sorting. In addition, the efficiency of mercury extrusion for these samples is higher than that of the first type of samples.
The CT scan results of shale samples reveal pronounced heterogeneity in pore throat distribution within the interlayer shale. Specifically, Figure 5a,b depict the sample extracted from well N143 at a depth of 1648.4 m, showcasing porosity and permeability values of 9.9% and 0.1 mD, respectively. Meanwhile, Figure 5c,d illustrate the sample from well LY18 at a depth of 1682.5 m, with porosity and permeability recorded at 7.1% and 0.04 mD, respectively. In Figure 5a,c, the representation of macropores and mesopores is depicted. The prevalence of red and yellow spheres indicates varying pore sizes, with Figure 5a exhibiting a notably higher abundance of these spheres compared to Figure 5c. This discrepancy suggests that the content of macropores and mesopores significantly influences the overall porosity of the sample. Figure 5b,d focus on illustrating the connectivity of the samples. A more uniform coloration in these figures signifies stronger connectivity within the sample, corresponding to higher permeability. Therefore, the comparative analysis of these figures provides insights into the pore size, connectivity and the controlling factors of both porosity and permeability in the shale samples.

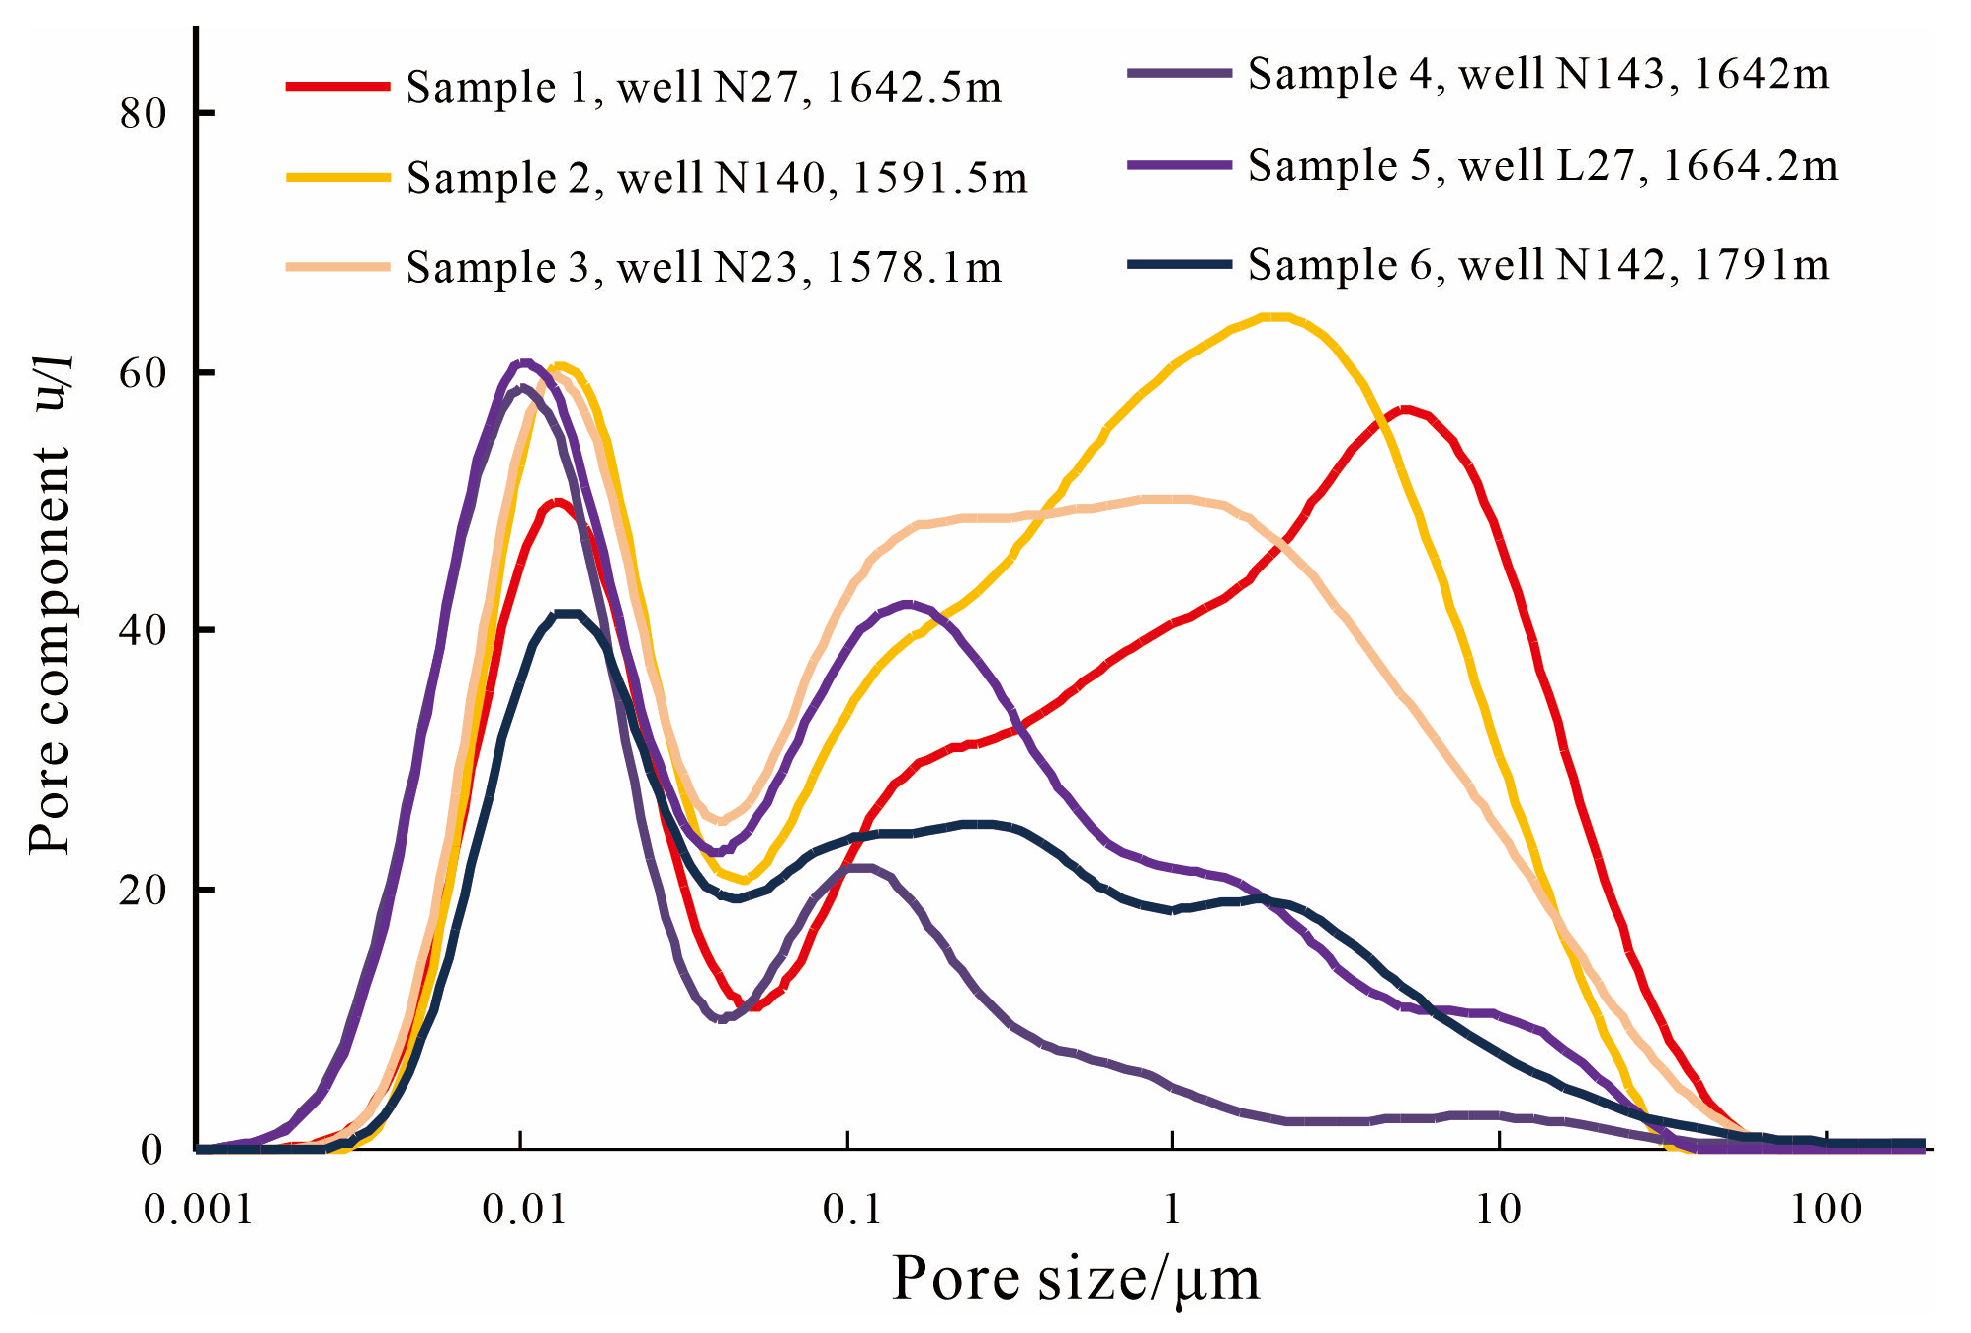
3.4. Overall Pore Size Distribution of Shale Samples in Chang 7

In this study, multiple test methods were used to obtain the pore size of samples. Each experiment has its own advantages in detecting micropore size [21,22]. CT scanning can accurately obtain the pore size and connectivity of various sizes, but the unit price of this experiment is very expensive [23]. HMIP can obtain the pore size with a radius of 5 nm to 10 μm due to the strong injection pressure [24]. Figure 6 shows that the pore size of shale samples in Chang 7 is mainly distributed between 3 nm and 2 μm. The pore size of sample well N23 is significantly smaller than those of other samples. NMR can almost obtain the overall pore size distribution when the sample is filled with kerosene. The overall pore size of shale samples in Chang 7 predominantly falls within the range of 3 nm to 50 μm (Figure 7). Although the distribution range of pore sizes shows minimal variation, there is a notable difference in the distribution characteristics among different samples. Specifically, for samples 1, 2 and 3, the pore size is concentrated primarily between 1 μm and 20 μm, while for samples 4, 5 and 6, the pore size is distributed mainly between 8 nm and 30 nm (Figure 7). This observation suggests that shale samples in Chang 7 encompass both macropores and mesopores, aligning with the pore sizes obtained from SEM.

4. Discussion

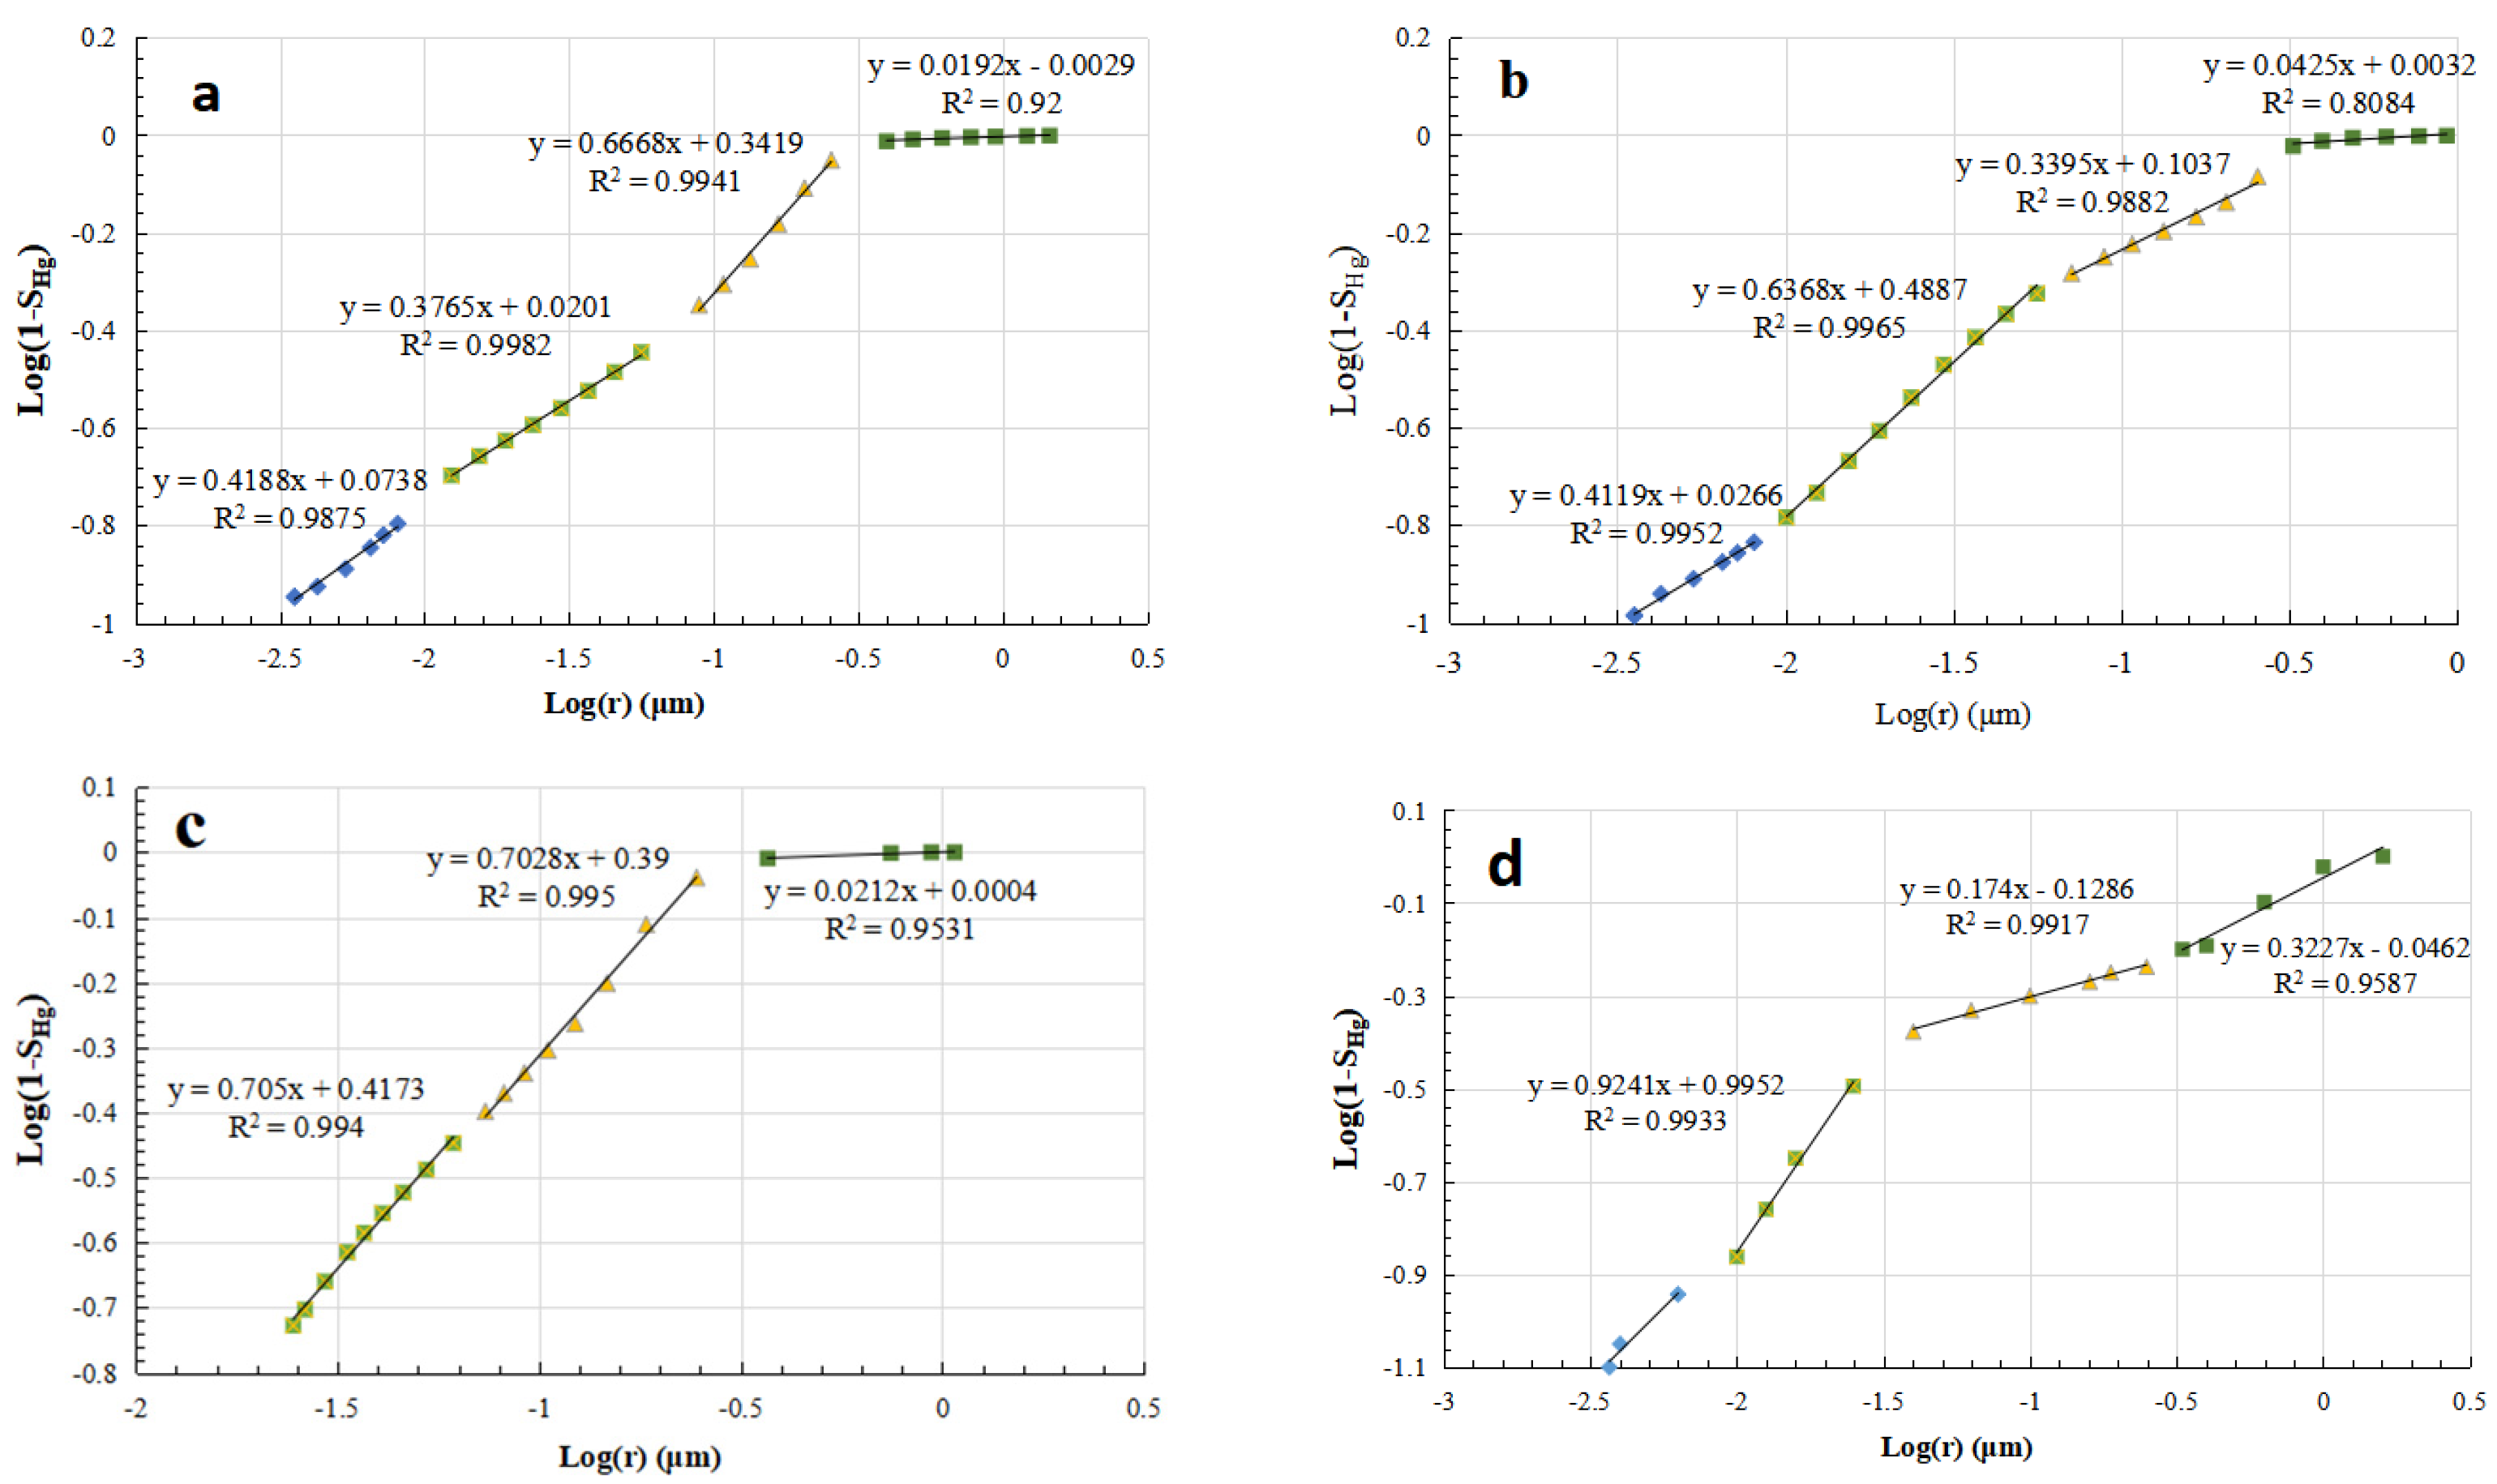
4.1. Fractal Dimensions Calculated from HMIP

In this study, HMIP was used to calculate the fractal dimensions of samples in Chang 7. The number of pores (radius > r) can be expressed by Equation (1) on the basis of the fractal principle [25].
N r + = r r max f ( r ) d r = a r D
where Nr+ is the number of pores (radius > r); rmax is the maximum pore radius; r is the pore radius; α is the fractal factor; f(r) is density function of pore radius; D is the fractal dimension. The derivation of Equation (1) can be expressed by Equation (2).
f ( r ) = d N r + d r = D a r D 1
When the pore radius is calculated, pores are regarded as ideal spheres, the fractal formula in Equation (3) can be obtained after a series of mathematical transformations; the detailed process was described in [26].
log ( 1 S H g   r + ) = ( 3 D ) log ( r ) ( 3 D ) log ( r max )
where D is fractal dimension, SHgr+ is the accumulative mercury saturation in pores with radii larger than r and rmax is far larger than rmin in the samples. Scatter plots can be generated by applying logarithmic transformations to log(1 − SHg) and log(r). Equation (3) can be used to calculate D based on HMIP data. The fractal scatter plots for all 26 shale samples in Chang 7 reveal a distinctive four-segment pattern, marked by three inflection points, as illustrated in Figure 8. This observation suggests that the pore structure of shale samples in Chang 7 possesses multifractal characteristics.

4.2. Classification of Pore Systems Based on Fractal Pore System

The fractal scatter plots of various samples display a distinctive four-segment feature, marked by three inflection points (Figure 8). The three inflection points in the fractal scatter plots correspond to pore radii of 0.01 μm, 0.08 μm and 0.3 μm, respectively. Pores within distinct size zones exhibit diverse fractal characteristics, corresponding to different types and combinations of pore throats [27,28]. Hence, the pore system can be classified into four combinations based on the three inflection points (Figure 8); these combinations are defined as macropore, mesopore, micropore and ultramicropore in this study (Table 1). A comparative analysis of thin-section casting and SEM results reveals that macropores primarily consist of residual intergranular and intergranular dissolution pores. Mesopores mainly correspond to intergranular and intragranular dissolution pores. Micropores are predominantly composed of intragranular dissolution pores and intercrystalline pores of clay minerals, while ultramicropores are identified as intercrystalline pores of clay minerals (Figure 3).
There are significant positive correlations between the proportions of macropores and mesopores and permeability (Figure 9a,b). The correlation between the proportion of micropores and permeability is weak (Figure 9c). These findings indicate that the classification of pore systems is suitable for evaluating the pore structure of the Chang 7 shale reservoir in the HSN area.

4.3. Shale Reservoir Classification Based on Pore System Classification

On the basis of classifying the shale pore system, applying the proportions of various pore types allows for the categorization of shale reservoirs into four classes (Figure 10). The average proportions of macropores, mesopores, micropores and ultramicropores in Class I reservoirs are 39.3%, 27.9%, 29.2% and 6.7%, respectively. These reservoirs exhibit relatively high porosity and permeability, with porosity levels distributed primarily between 10.1% and 15.6%, averaging at 12.5%. Additionally, the permeability generally exceeds 0.1 mD. In Class II reservoirs, the average proportions are 9.9%, 51.9%, 31.1% and 5.2%. For Class III reservoirs, the average proportions are 1.7%, 42.2%, 41.6% and 6.6%, and in Class IV reservoirs, the average proportions are 0.3%, 21.9%, 51.8% and 10.8% for macropores, mesopores, micropores and ultramicropores, respectively (Figure 10). The average values for porosity and permeability in Class II reservoirs are 9.1% and 0.08 mD, respectively. On the other hand, Class III reservoirs show slightly lower average values, with porosity at 6.9% and permeability at 0.04 mD.
In order to achieve a planar distribution of various reservoir types, it is crucial to establish specific porosity and permeability limits for each reservoir type, taking into consideration the limited number of experimental samples. Utilizing information on pore structure, fractal characteristics and the corresponding porosity and permeability of diverse samples, standards for reservoir classification can be defined, as illustrated in Figure 11. Class I reservoirs are characterized by porosity exceeding 10%, coupled with permeability greater than 0.1 mD. Class II reservoirs exhibit porosity ranging between 8 and 10% and permeability falling within the range of 0.05–0.1. For Class III reservoirs, porosity ranges between 5 and 8%, with permeability between 0.02 and 0.5. Class IV reservoirs encompass all other cases that do not fit into the aforementioned criteria. This systematic approach ensures a comprehensive understanding of the distribution and characteristics of different reservoir types. Subsequently, by adhering to the established porosity and permeability limits for each reservoir type, we can attain a comprehensive planar distribution of the various reservoir types (Figure 12).
The distribution of reservoir types on the plane aligns consistently with the sediment source [29]. In the central region of the research area, Class I reservoirs display a distinctive north–south-oriented strip-shaped feature. Within the Class I reservoir, there are three Class II reservoirs, comprising 10 wells. Class III reservoirs are distributed on both sides of the Class II reservoirs, while Class IV reservoirs are exclusively found in the northeast of the study area, encompassing four wells.
The relationship between the reservoir thickness of Class I and Class II and daily oil production is positively correlated (Figure 13). The appearance of the two abnormally high data values is because of stronger pressure and a higher sand injection volume during the fracturing process. The thicker the advantageous reservoir, the higher the daily oil production in the oil testing data. This also indicates that reservoir quality classification based on the fractal characteristics of pores is reasonable. In addition, in the past two years, two horizontal wells, N14H and N11H, have been drilled and have been in continuous oil production for over 20 months. The two horizontal wells are drilled in Class I and Class II reservoirs, respectively (Figure 12). We have organized the production data of these two horizontal wells and fitted the production curve graphs (Figure 14). Well N11H, located in Class I, has shown a good production effect. The daily water production remained at approximately 50% during the first ten months, subsequently dropping sharply to below 40% in the eleventh month. The average daily oil production in the past 22 months was 12.5 t. The production performance of well N14H in Class II is significantly poorer than that of well N11H, evident in both daily water and oil production. This emphasizes the importance of using the fractal characteristics of a pore system for reservoir classification, guiding the strategic deployment of horizontal wells.

5. Conclusions

(1)
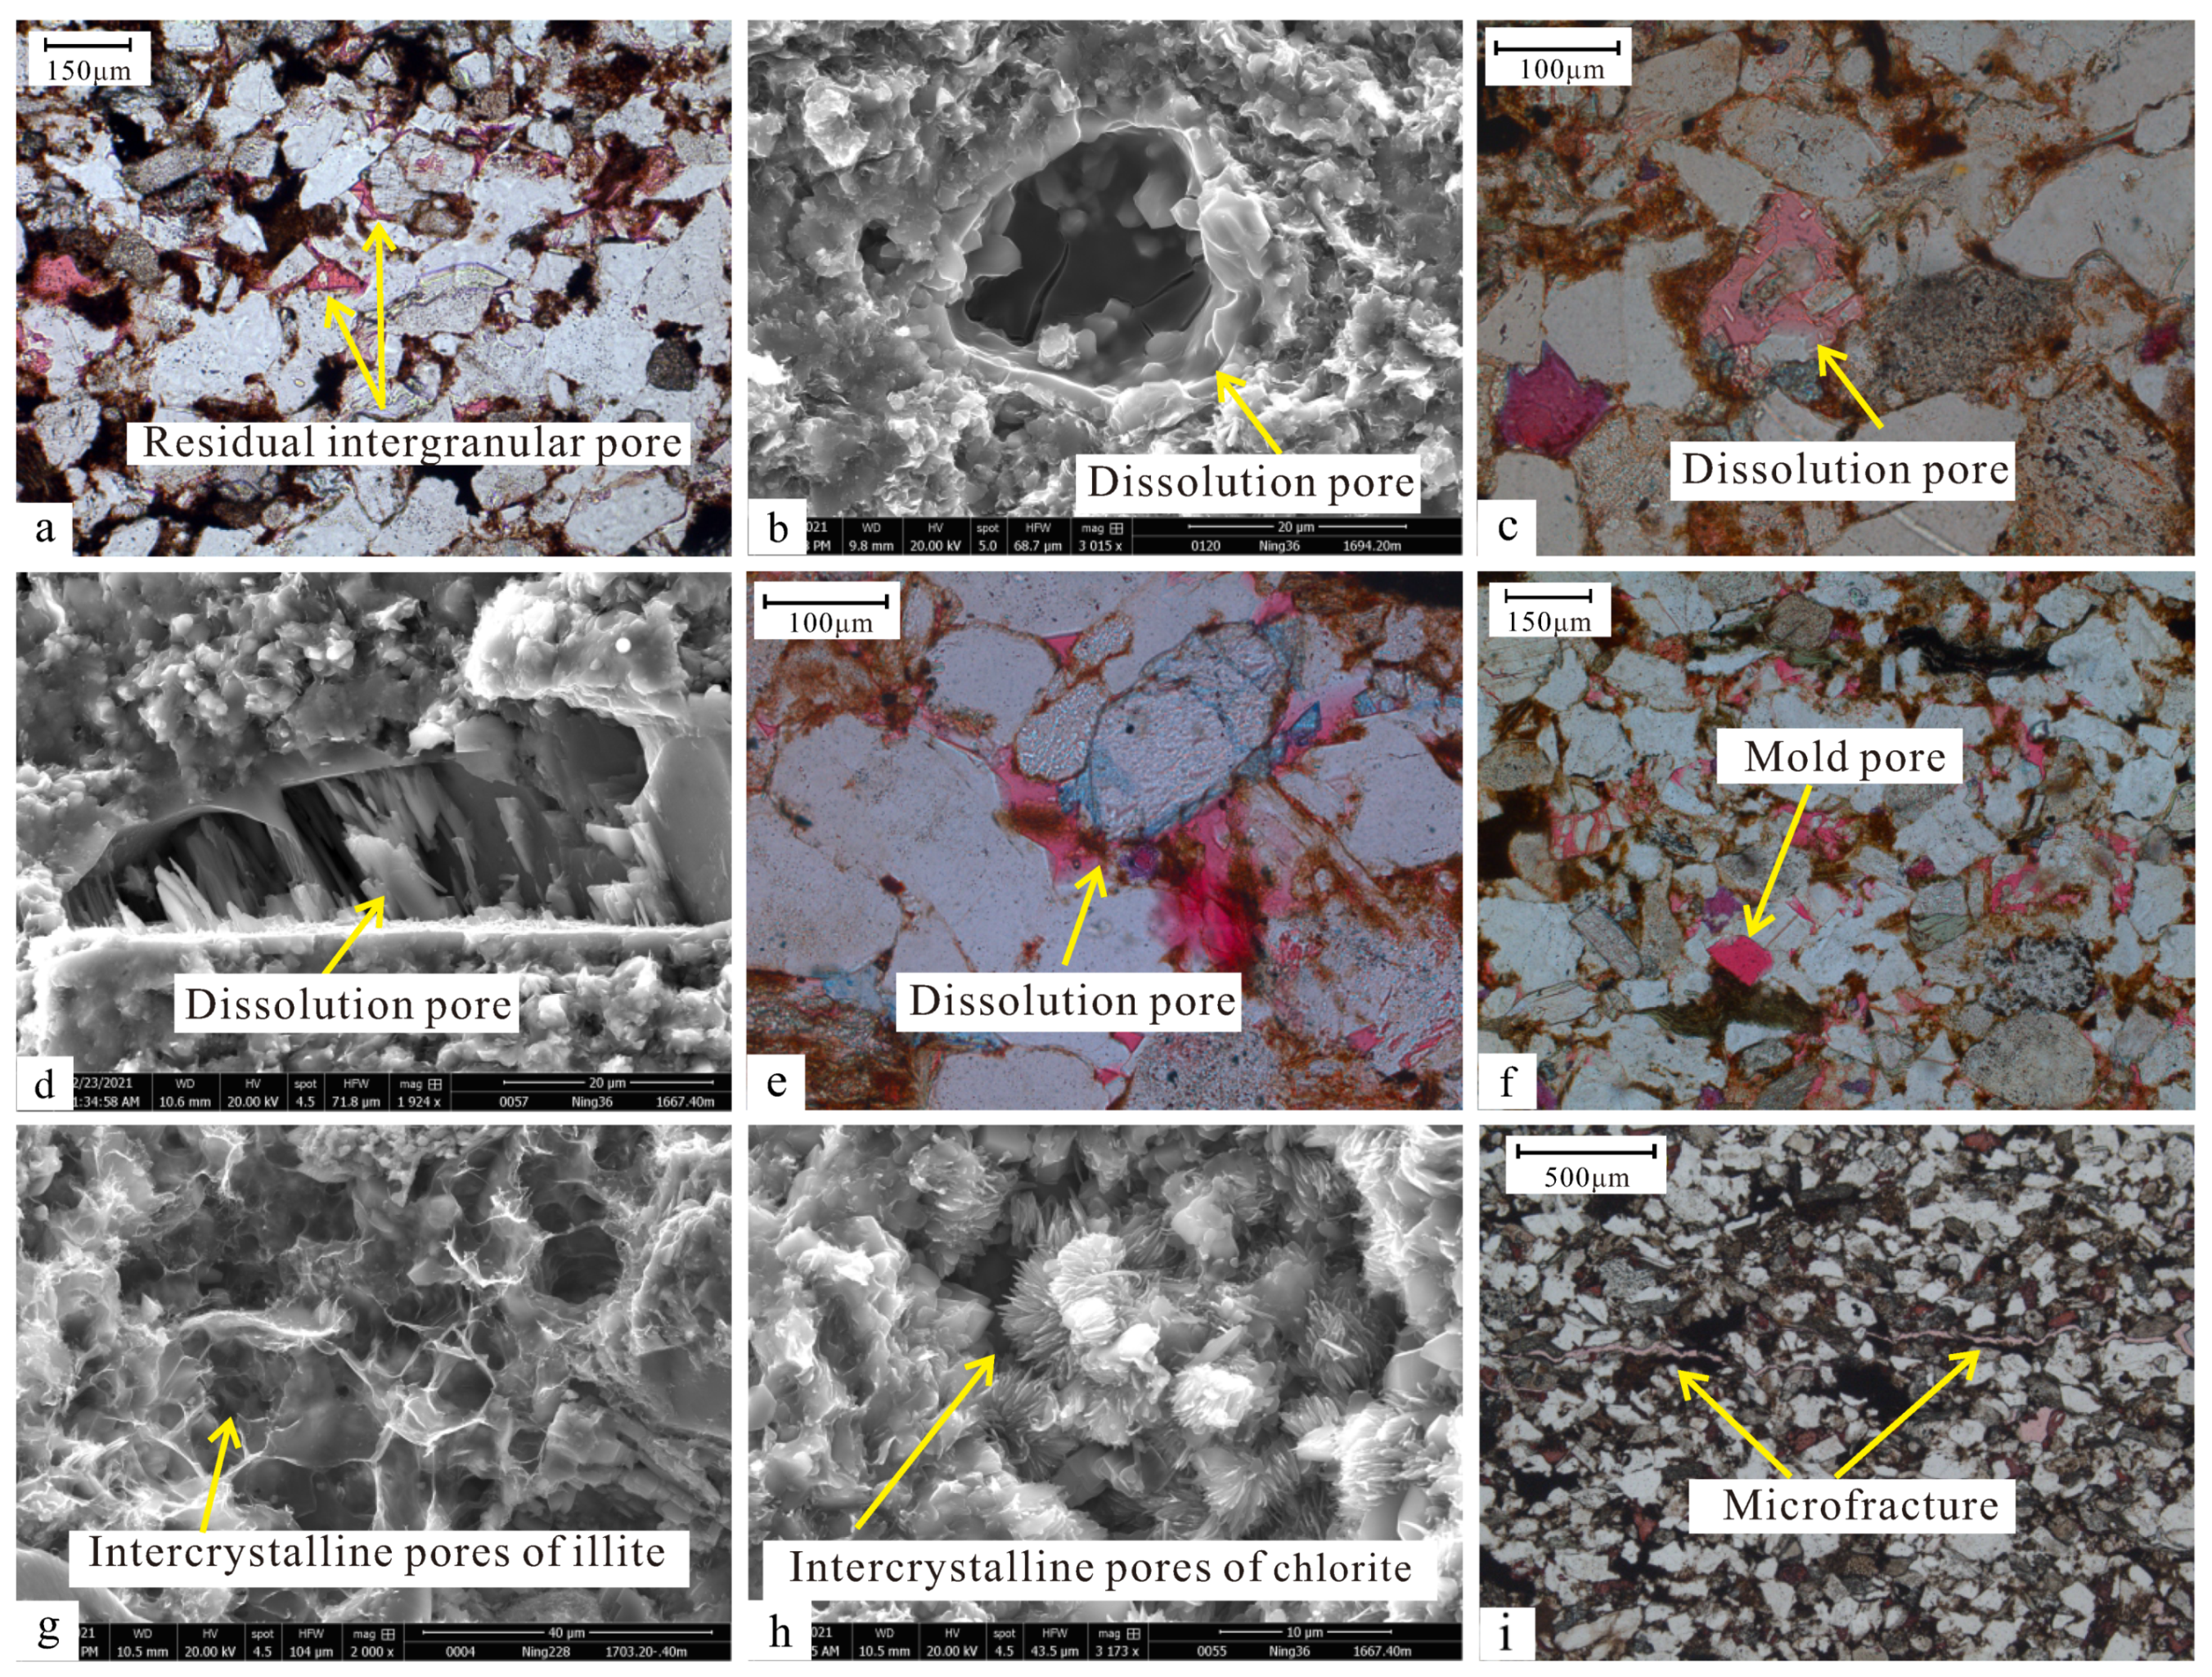
Four main types of pores are identified in shale samples from Chang 7 in the HSN area. These include residual intergranular pores, dissolution pores, intercrystalline pores of clay minerals and microfractures. The overall pore size distribution of shale samples predominantly falls within the range of 3 nm to 50 μm.
(2)
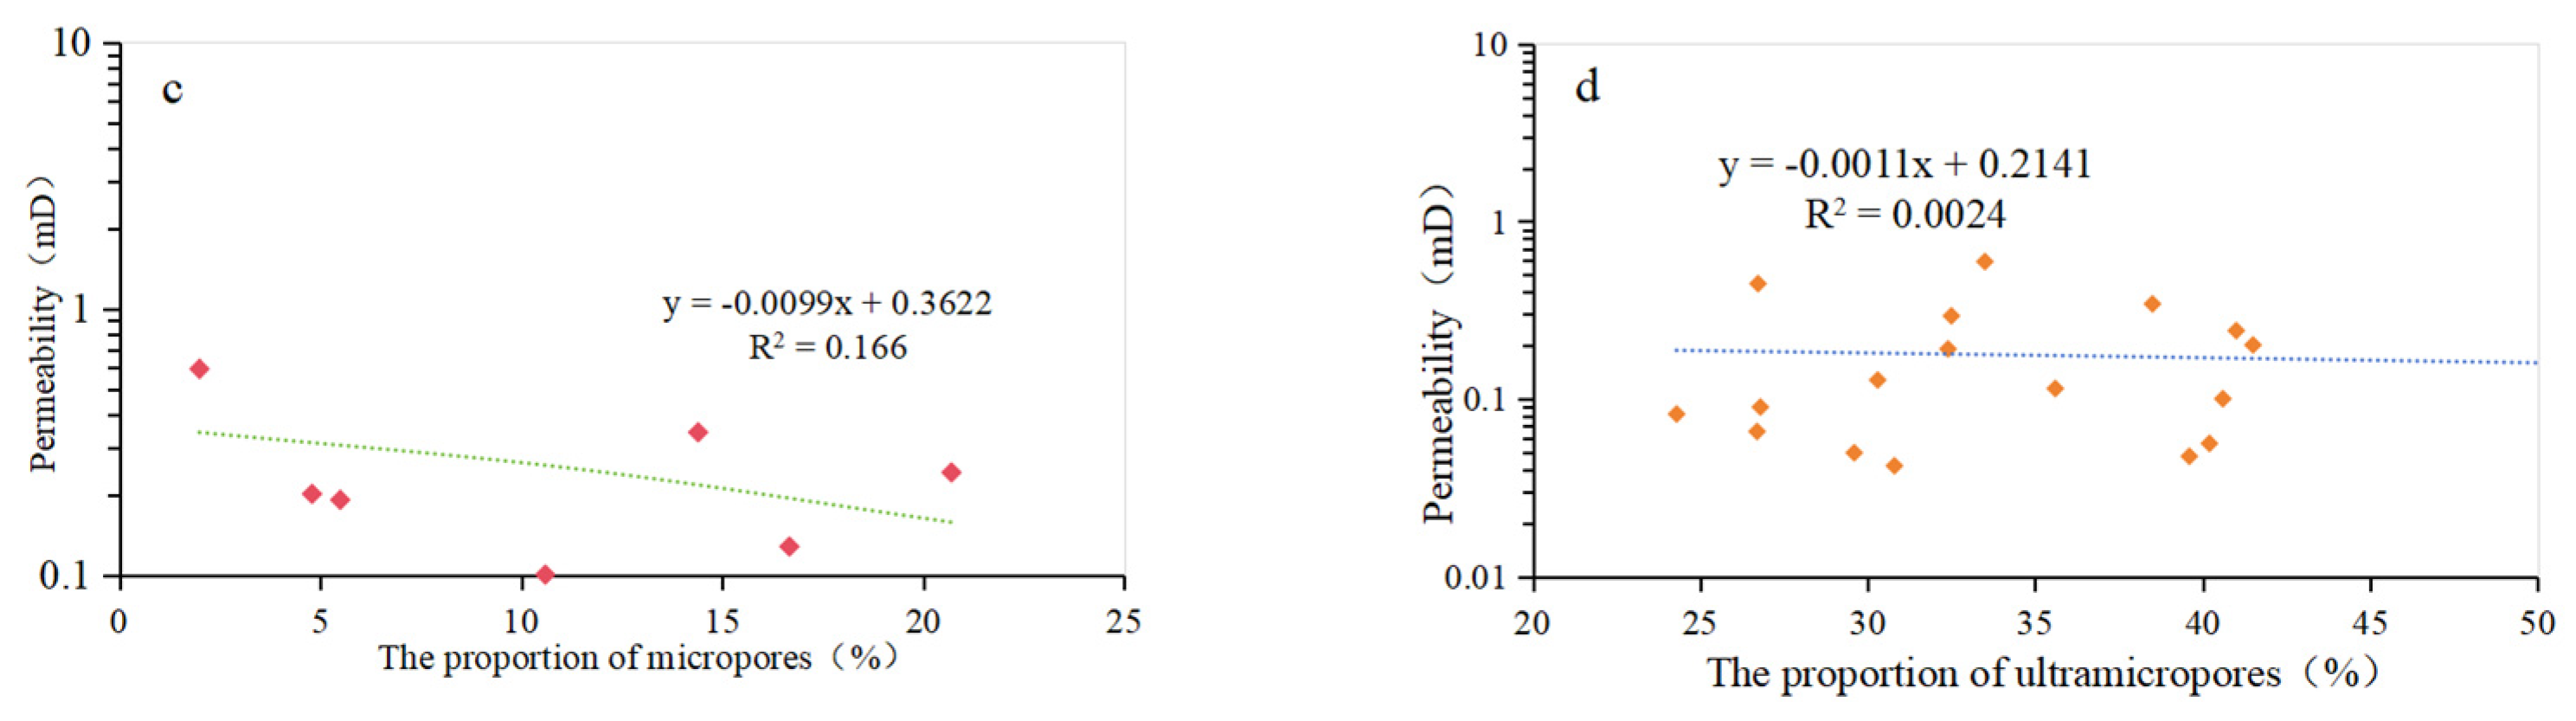
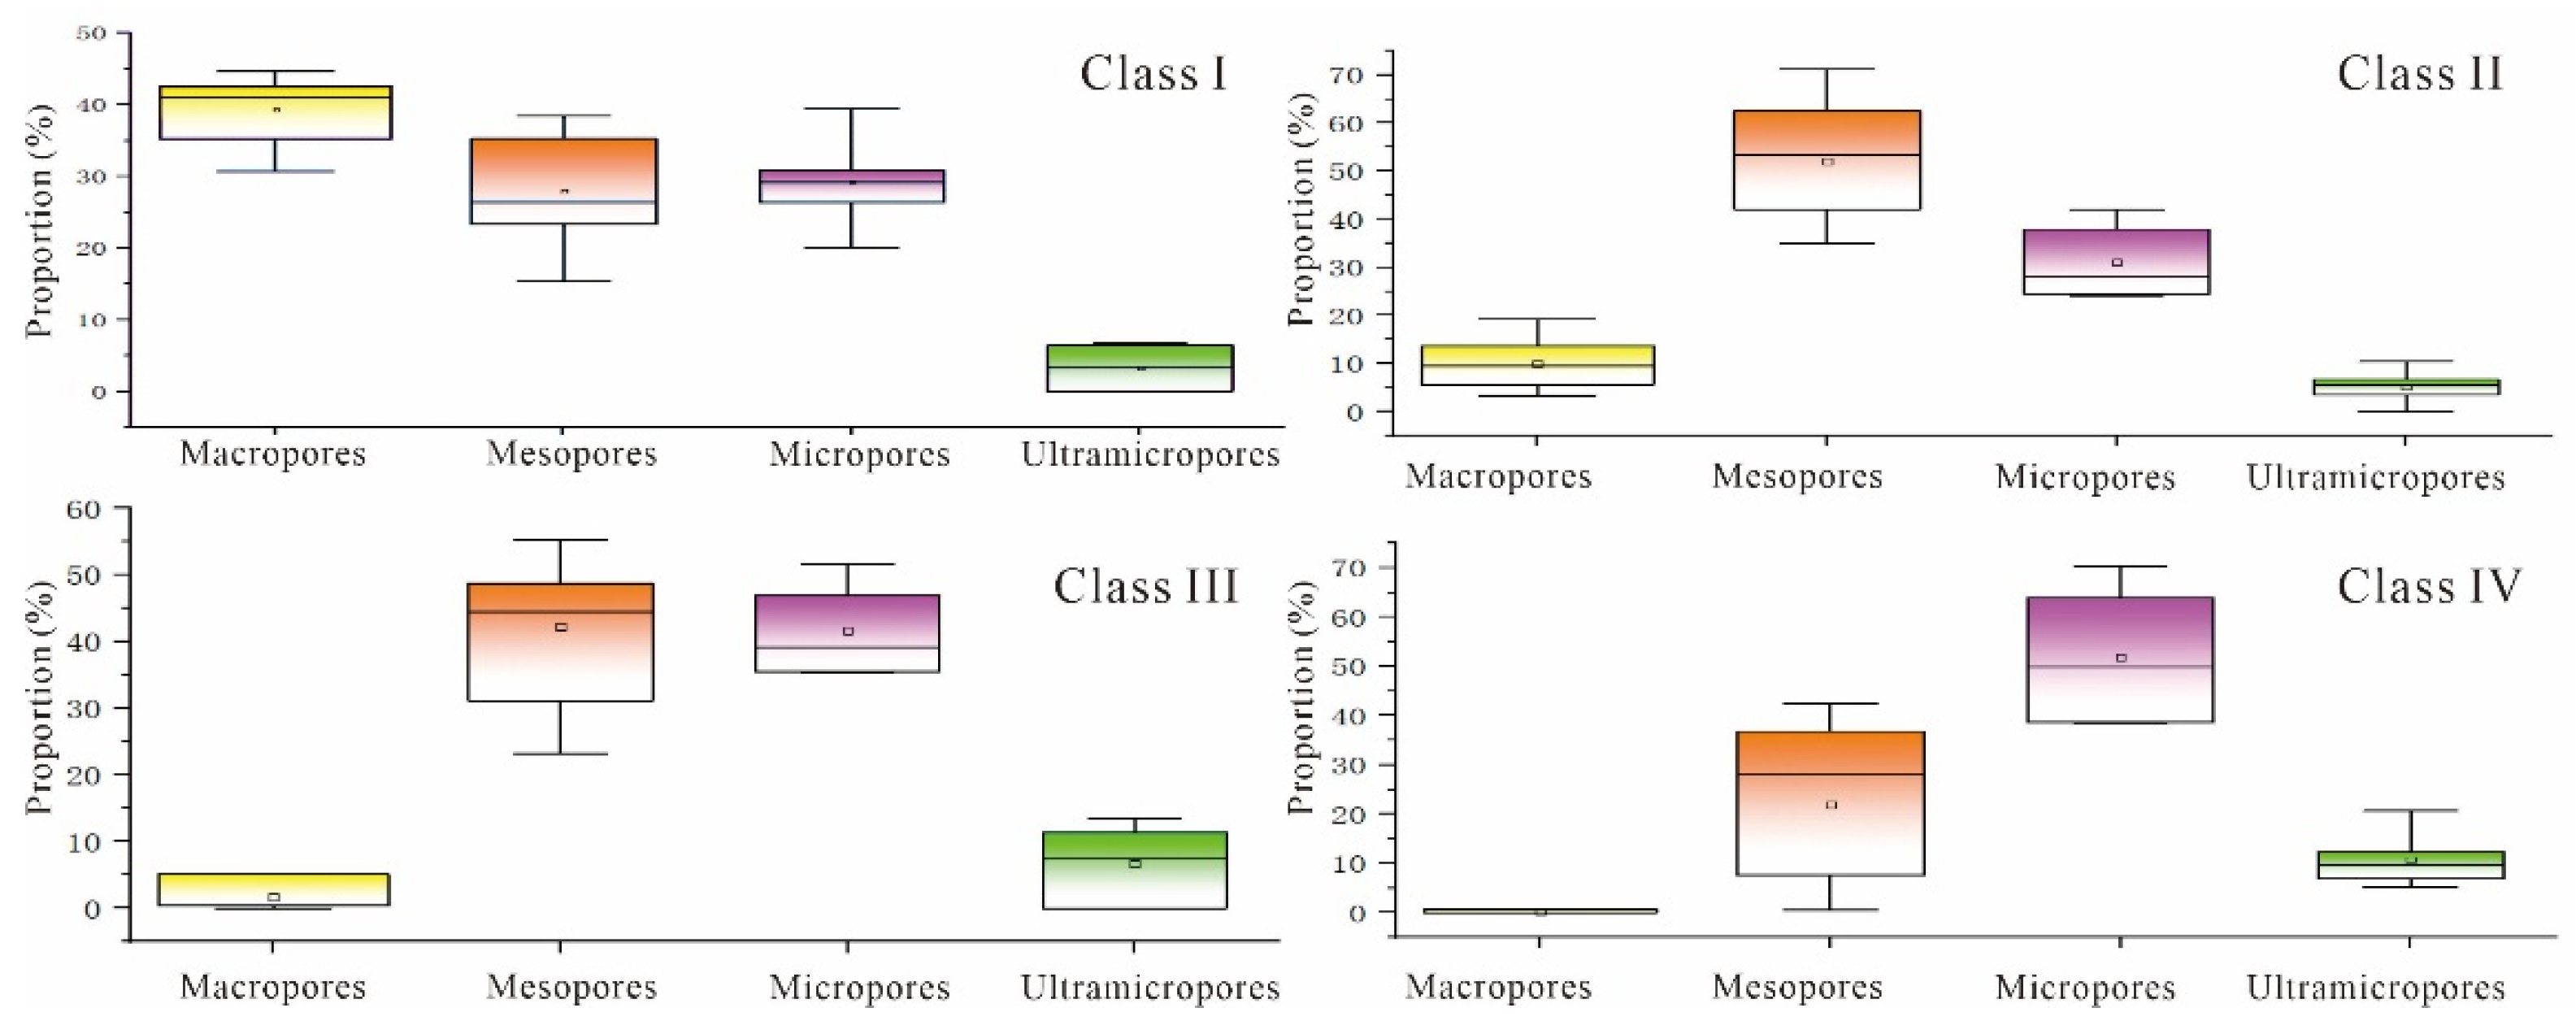
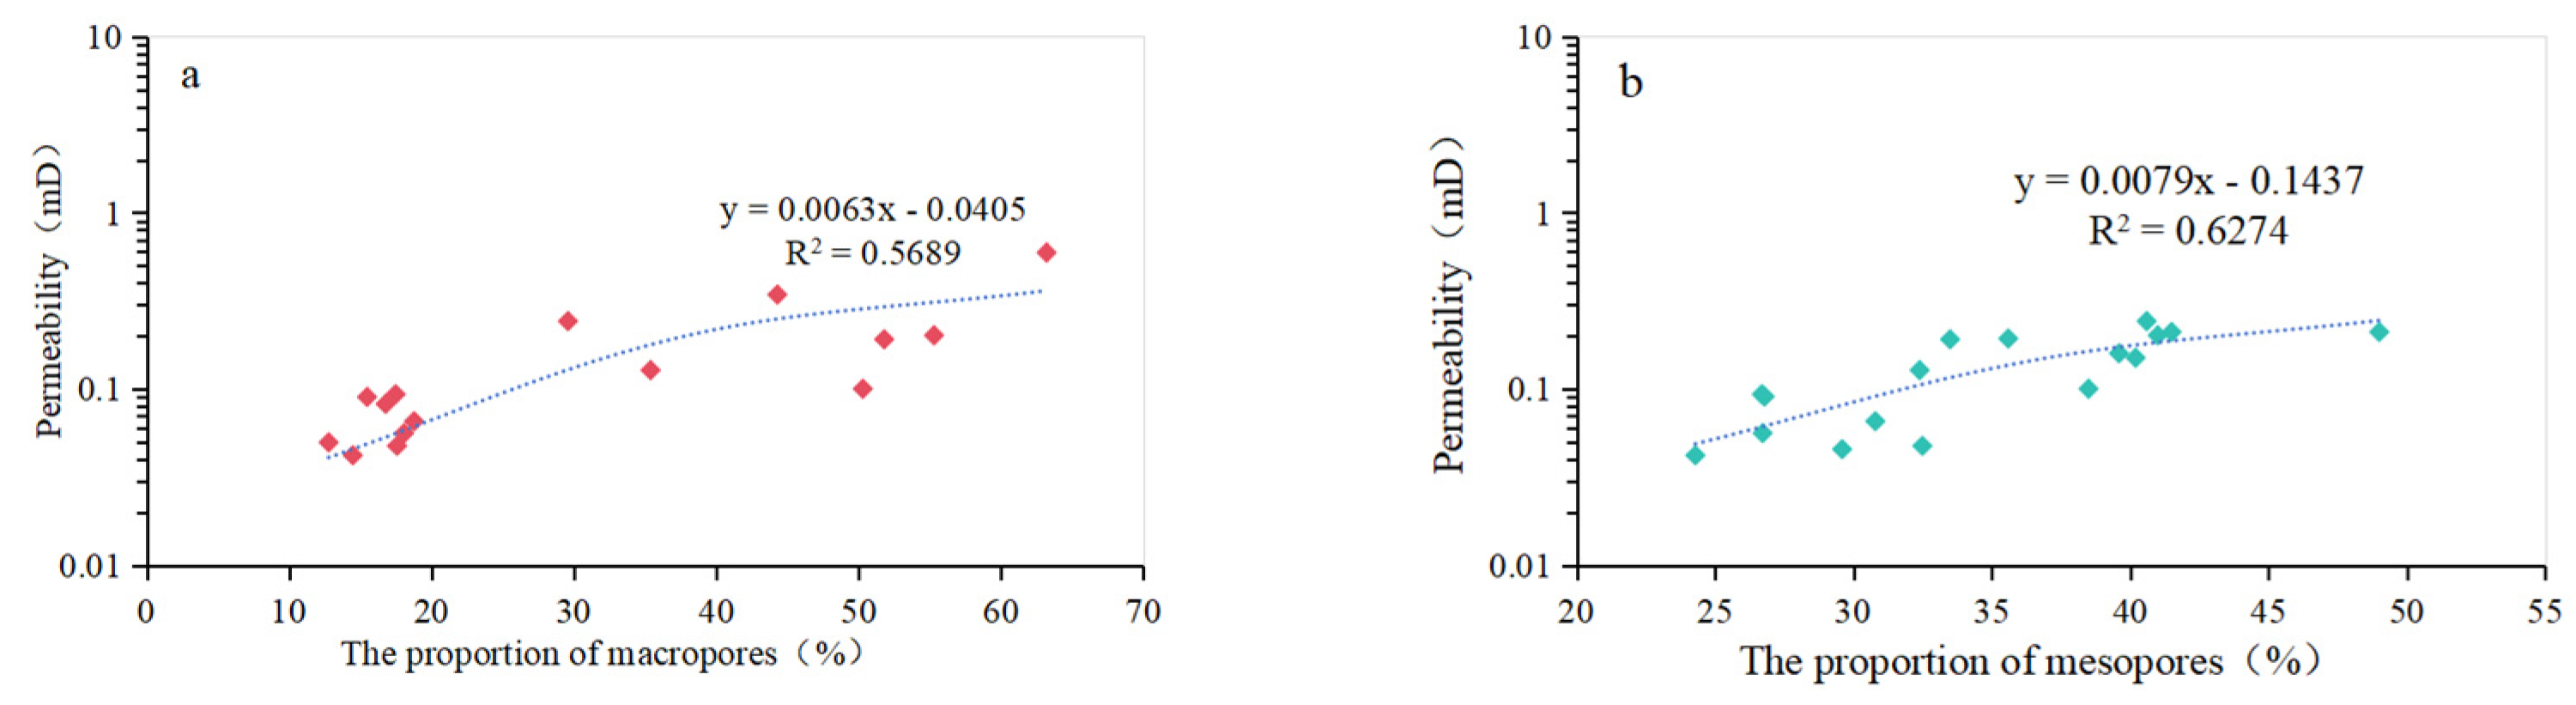
In the Chang 7 interlayer shale in the HSN area, the pore system exhibits multiple fractal characteristics. A scatter plot with three inflection points divides the pore system into four regions, each corresponding to specific pore radii. Based on this, a classification of pores is conducted, distinguishing them into macropores, mesopores, micropores and ultramicropores. Using the proportions of these different pores within the samples, the samples are categorized into four classes. Standards for porosity and permeability are established for these four reservoir classes.
(3)
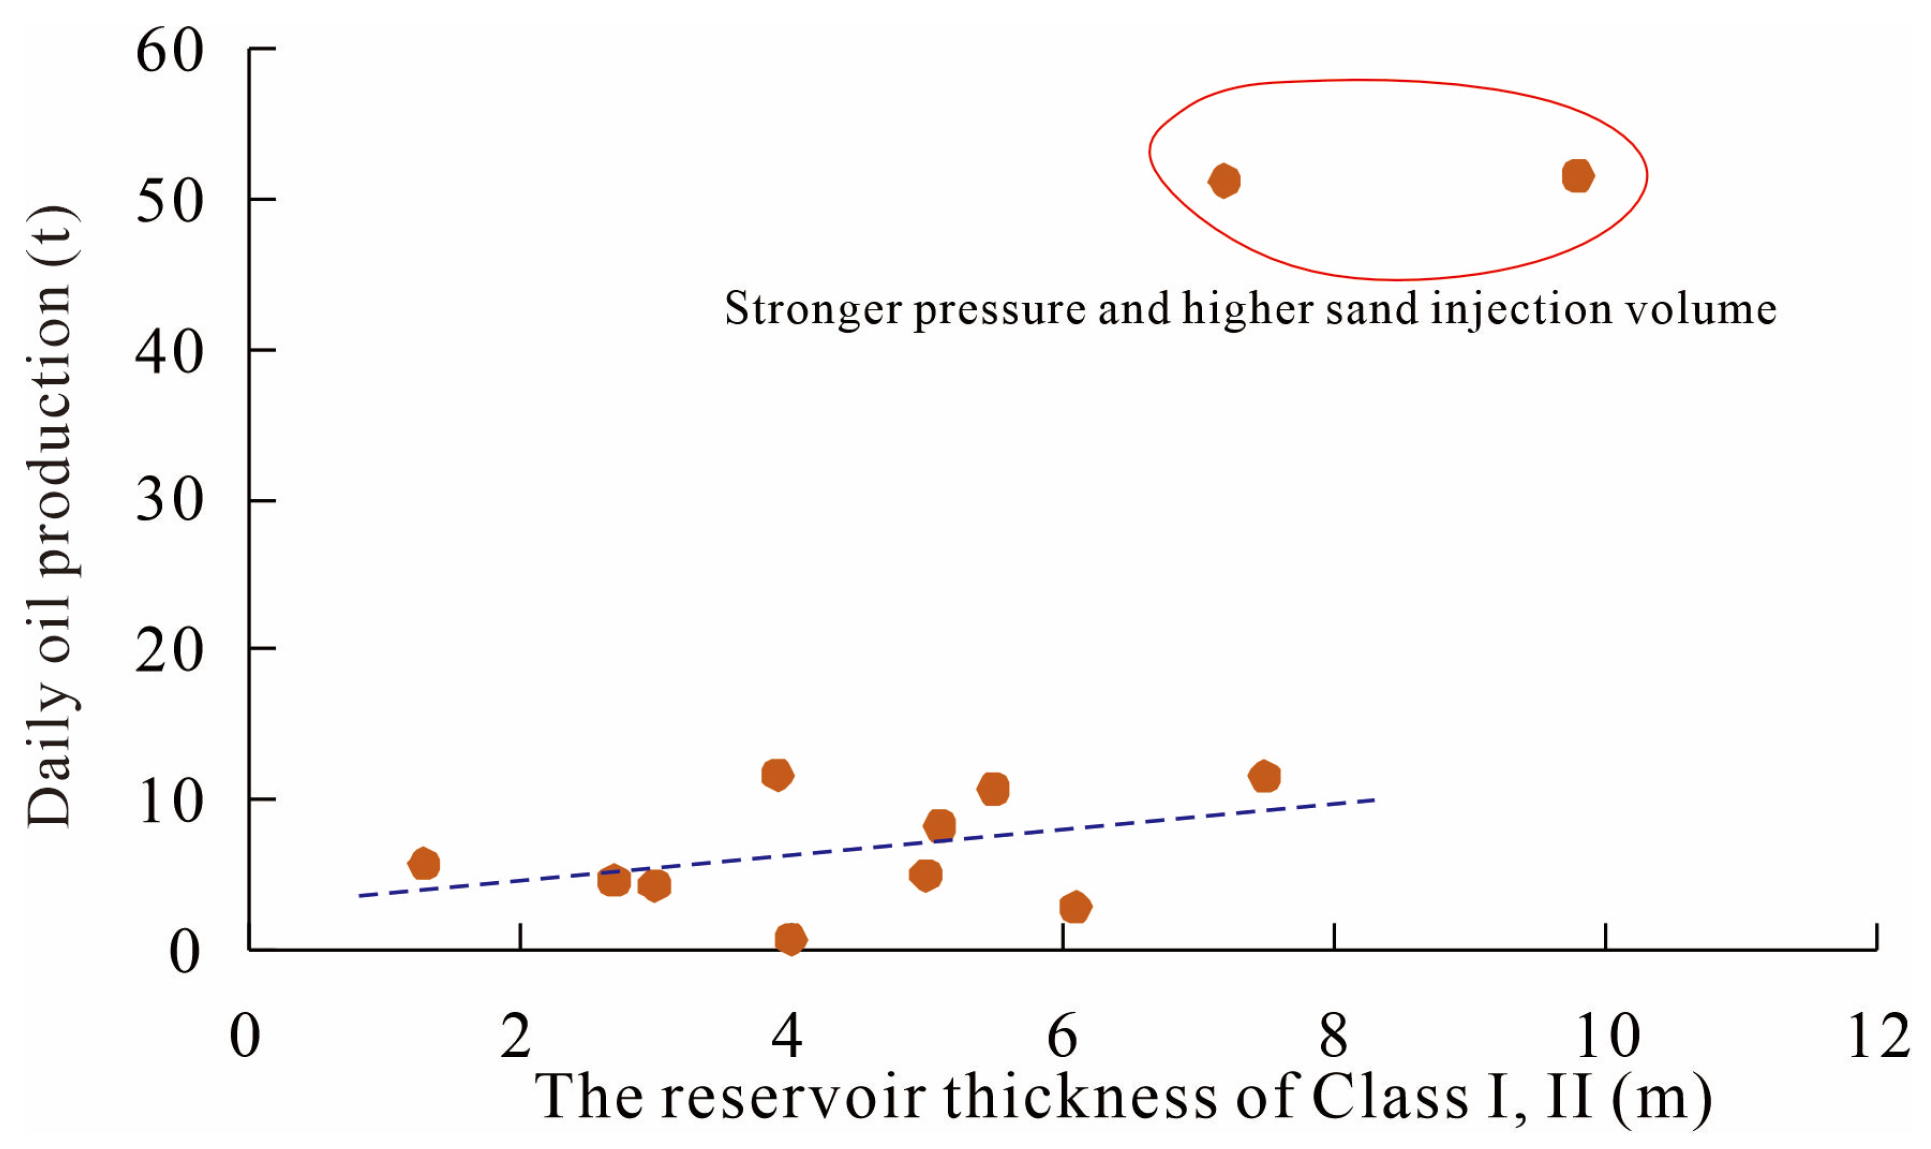
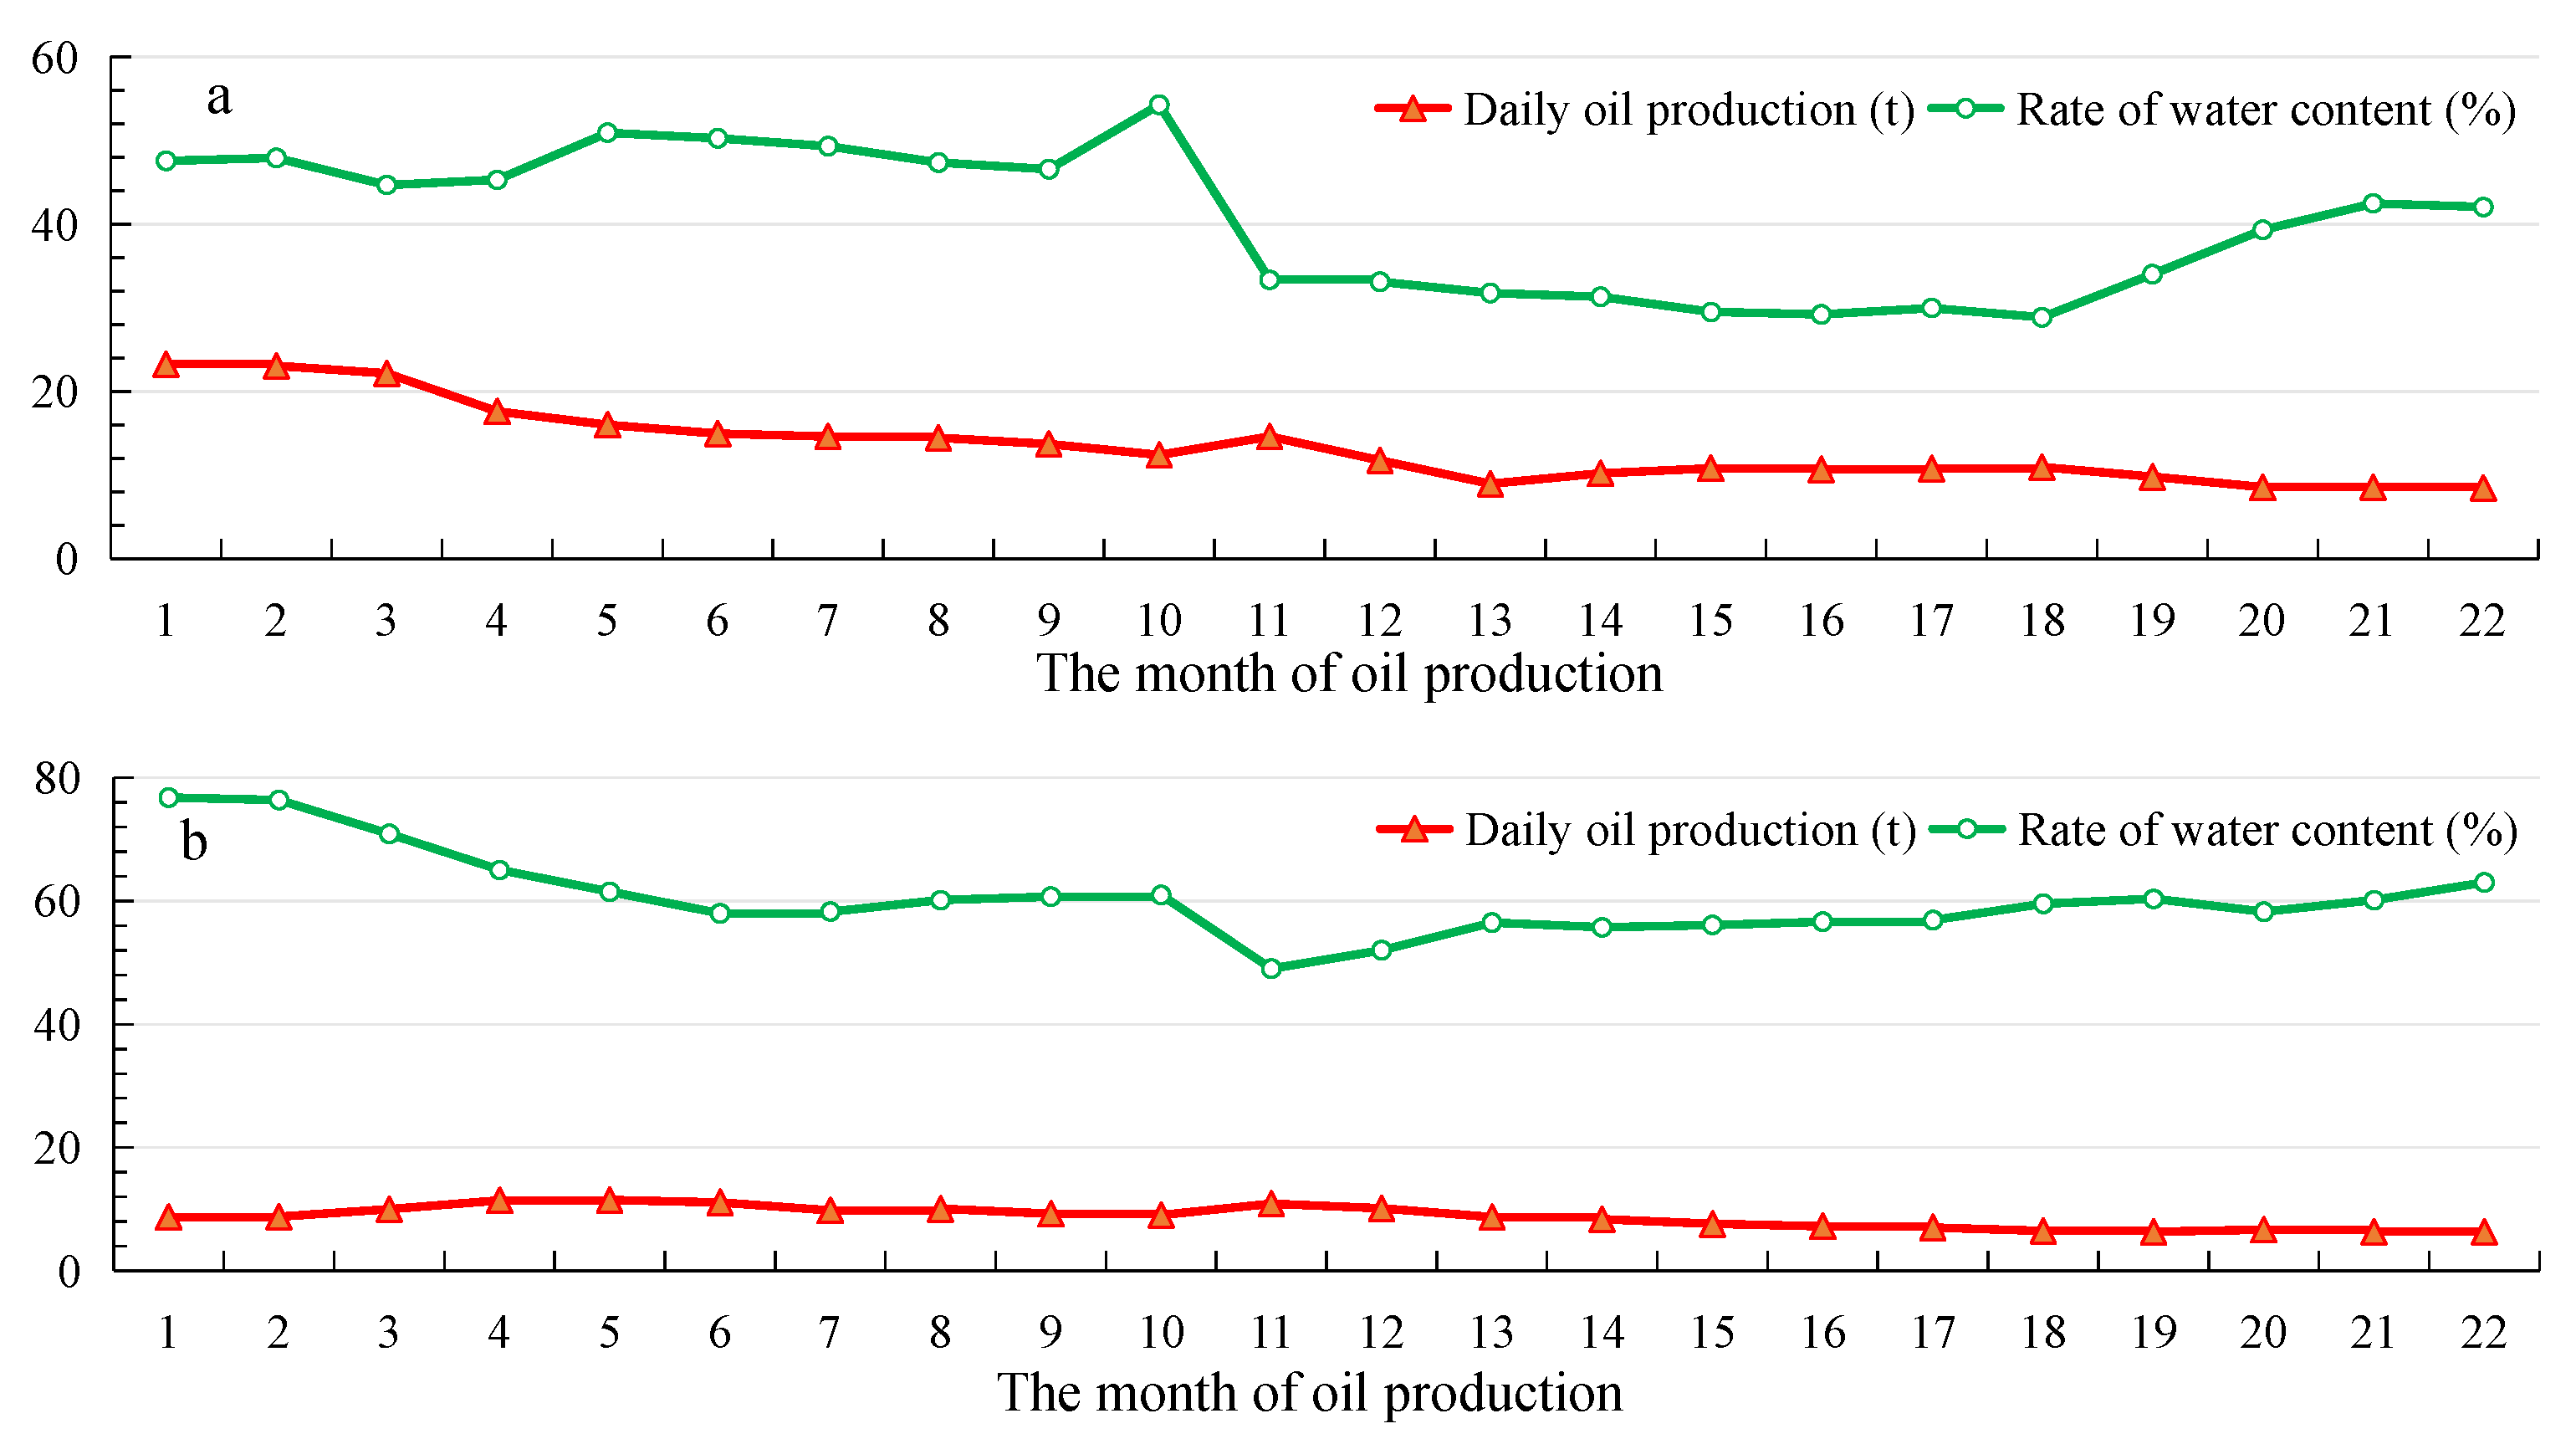
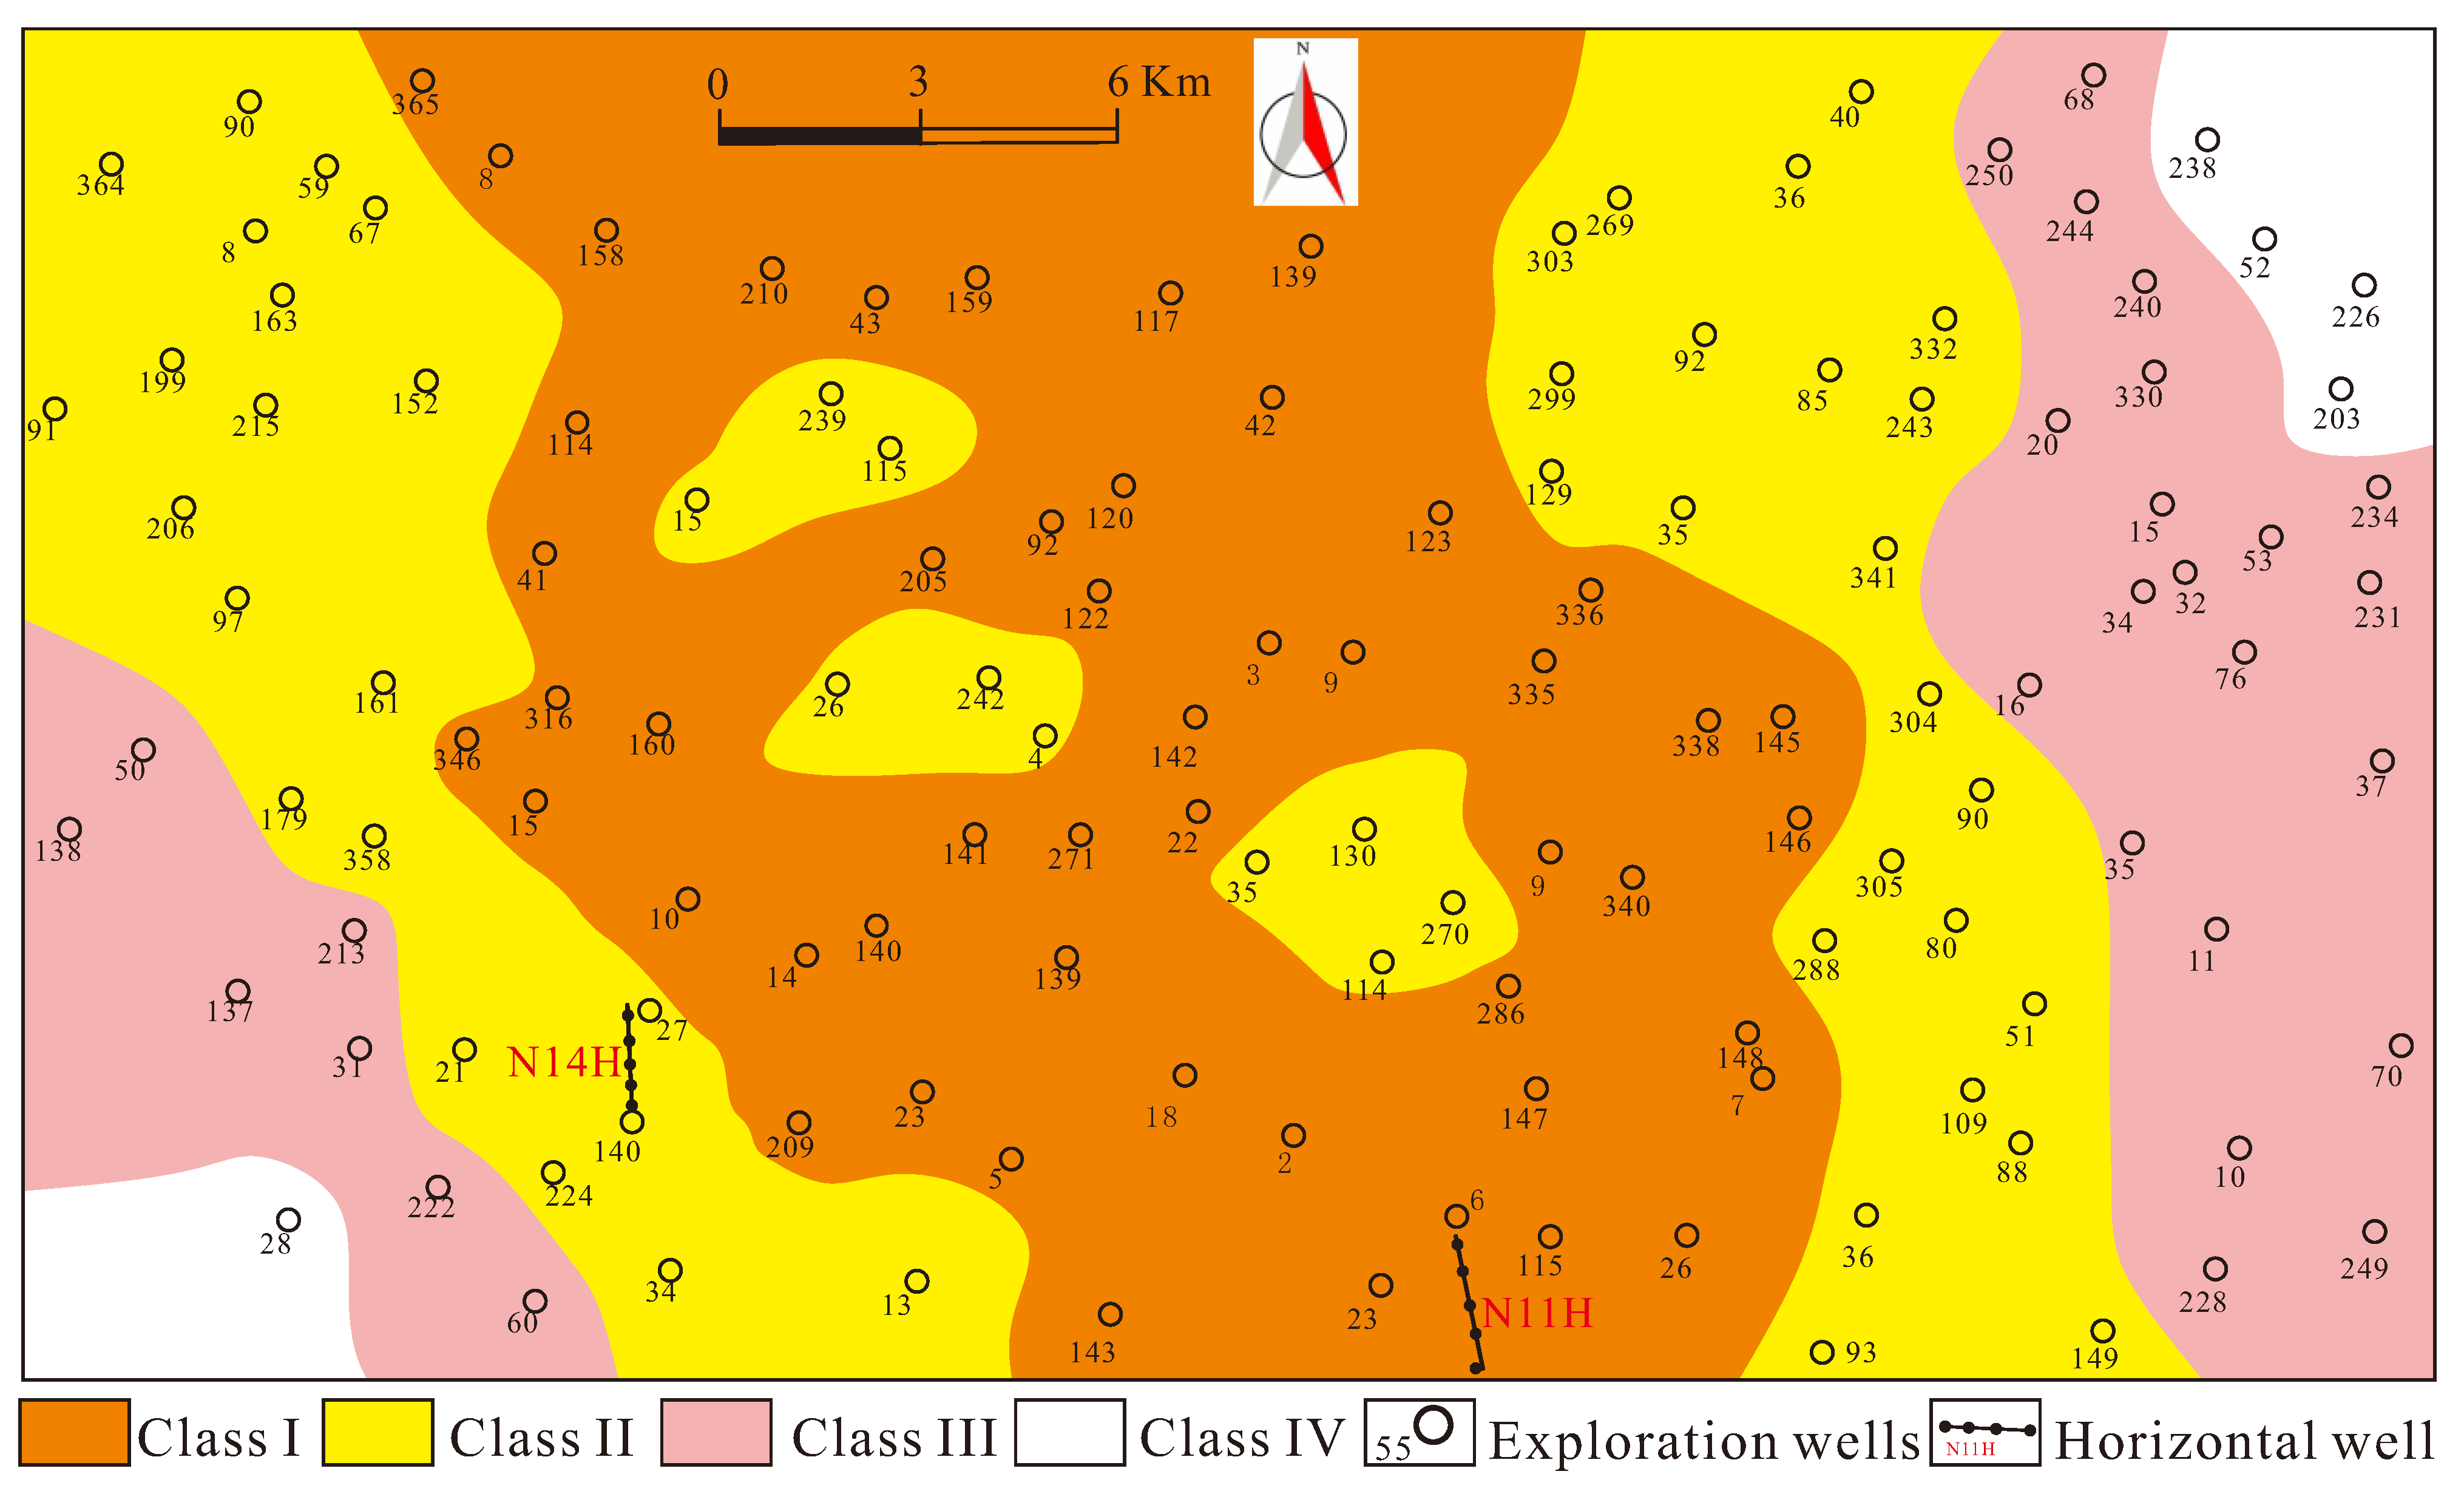
Based on the established standards for porosity and permeability in reservoir classification, the planar distribution of different reservoir types becomes clearly defined. There is a notable difference in the daily oil production from wells across different types of reservoirs. Class I reservoirs exhibit higher daily oil production as the reservoir thickness increases.

Author Contributions

Conceptualization, C.L. and X.W.; methodology, X.W.; Resources, T.X. and S.M.; formal analysis, C.L., T.X. and S.M.; investigation, X.W. and T.X.; writing—original draft preparation, C.L. and Q.L.; writing—review and editing, X.W. and S.L.; funding acquisition, S.L. All authors have read and agreed to the published version of the manuscript.

Funding

This work was supported by the Open Fund of Cooperative Innovation Center of Unconventional Oil and Gas, Yangtze University (Ministry of Education & Hubei Province) (UOG2024-17) and CNPC Innovation Found (2021DQ02-0106), National Natural Science Foundation of China (42172172).

Data Availability Statement

All data can be obtained from the corresponding author.

Conflicts of Interest

Authors Shuwei Ma and Ting Xue were employed by the company Exploration and Development Research Institute, PetroChina Changqing Oilfield. The remaining authors declare that the research was conducted in the absence of any commercial or financial relationships that could be construed as a potential conflict of interest.

References

  1. Taheri-Shakib, J.; Kantzas, A. A comprehensive review of microwave application on the oil shale: Prospects for shale oil production. Fuel 2021, 305, 121519. [Google Scholar] [CrossRef]
  2. Feng, Q.; Xu, S.; Xing, X.; Zhang, W.; Wang, S. Advances and challenges in shale oil development: A critical review. Adv. Geo-Energy Res. 2020, 4, 406–418. [Google Scholar] [CrossRef]
  3. Zhang, L.; He, X.; Li, X.; Li, K.; He, J.; Zhang, Z.; Guo, J.; Chen, Y.; Liu, W. Shale gas exploration and development in the Sichuan Basin: Progress, challenge and countermeasures. Nat. Gas Ind. B 2022, 9, 176–186. [Google Scholar] [CrossRef]
  4. Fakher, S.; Imqam, A. Application of carbon dioxide injection in shale oil reservoirs for increasing oil recovery and carbon dioxide storage. Fuel 2020, 265, 116944. [Google Scholar] [CrossRef]
  5. Jin, Z.; Zhu, R.; Liang, X.; Shen, Y. Several issues worthy of attention in current lacustrine shale oil exploration and development. Pet. Explor. Dev. 2021, 48, 1471–1484. [Google Scholar] [CrossRef]
  6. Wang, F.; Fu, Z.; Wang, J.; Tang, Z.G.; Jiang, R.G. Characteristics and classification evaluation of Gulong shale oil reservoir in Songliao Basin. Pet. Geol. Oilfield Dev. Daqing 2021, 40, 144–156. [Google Scholar]
  7. Lei, H.; Guo, P.; Meng, Y.; Qi, J.; Liu, J.; Zhang, J.; Liu, M.; Zheng, Y. Pore structure and classification evaluation of shale oil reservoirs of Permian Fengcheng Formation in Mahu Sag. Lithol. Reserv. 2022, 34, 142–153. [Google Scholar]
  8. Zou, Y.; Wei, P.; Cao, Y.; Wang, J.; Zhao, X.; He, W.; Zhao, Y.; Jiang, Y.; Sun, S. Classification and main controlling factors of sweet spots of alkaline lake type shale oil: A case study of Fengcheng Formation in Junggar Basin. Acta Pet. Sin. 2023, 44, 458–470. [Google Scholar]
  9. Huang, W.; Lu, S.; Hersi, O.S.; Wang, M.; Deng, S.; Lu, R. Reservoir spaces in tight sandstones: Classification, fractal characters, and heterogeneity. J. Nat. Gas Sci. Eng. 2017, 46, 80–92. [Google Scholar] [CrossRef]
  10. Gao, H.; Zhou, X.; Wen, Z.; Guo, W.; Tian, W.; Li, S.; Fan, Y.; Luo, Y. Classification and Evaluation of Shale Oil Reservoirs of the Chang 71-2 Sub-Member in the Longdong Area. Energies 2022, 15, 5364. [Google Scholar] [CrossRef]
  11. Song, W.; Wang, D.; Yao, J.; Li, Y.; Sun, H.; Yang, Y.; Zhang, L. Multiscale image-based fractal characteristic of shale pore structure with implication to accurate prediction of gas permeability. Fuel 2019, 241, 522–532. [Google Scholar] [CrossRef]
  12. Liu, K.; Ostadhassan, M.; Kong, L. Fractal and multifractal characteristics of pore throats in the Bakken Shale. Transp. Porous Media 2019, 126, 579–598. [Google Scholar] [CrossRef]
  13. Wang, L.; Lv, D.; Hower, J.C.; Zhang, Z.; Raji, M.; Tang, J.; Liu, Y.; Gao, J. Geochemical characteristics and paleoclimate implication of Middle Jurassic coal in the Ordos Basin, China. Ore Geol. Rev. 2022, 144, 104848. [Google Scholar] [CrossRef]
  14. Hou, L.; Pang, Z.; Luo, X.; Lin, S. Sedimentary features of the gravity flow influenced shale deposit: A case study of Chang 7 member in the Ordos Basin, China. Mar. Pet. Geol. 2023, 153, 106277. [Google Scholar] [CrossRef]
  15. Chen, G.; Gang, W.; Chang, X.; Wang, N.; Zhang, P.; Cao, Q.; Xu, J. Paleoproductivity of the Chang 7 unit in the Ordos Basin (North China) and its controlling factors. Palaeogeogr. Palaeoclimatol. Palaeoecol. 2020, 551, 109741. [Google Scholar]
  16. Pan, S.; Liao, Y.; Jiang, B. Impact of natural weathering on source rocks: ESI FT-ICR MS evidence from Triassic Chang 7 outcrop profile in Tongchuan City, Southern Ordos Basin (China). Mar. Pet. Geol. 2023, 155, 106410. [Google Scholar] [CrossRef]
  17. Wang, X.; Hou, J.; Song, S.; Wang, D.; Gong, L.; Ma, K.; Liu, Y.; Li, Y.; Yan, L. Combining pressure-controlled porosimetry and rate-controlled porosimetry to investigate the fractal characteristics of full-range pores in tight oil reservoirs. J. Pet. Sci. Eng. 2018, 171, 353–361. [Google Scholar] [CrossRef]
  18. House, A.; Dennis, M.; Warlow, C.; Hawton, K.; Molyneux, A. Mood disorders after stroke and their relation to lesion location. CT scan study. Brain 1990, 113, 1113–1129. [Google Scholar] [CrossRef]
  19. Zhang, P.; Lu, S.; Li, J.; Chang, X. 1D and 2D Nuclear magnetic resonance (NMR) relaxation behaviors of protons in clay, kerogen and oil-bearing shale rocks. Mar. Pet. Geol. 2020, 114, 104210. [Google Scholar] [CrossRef]
  20. Liu, T.; Cui, M.; Zhang, C.; Zhou, K.; Shi, W.; Cao, P. Nuclear magnetic resonance analysis of the failure and damage model of rock masses during freeze–thaw cycles. Bull. Eng. Geol. Environ. 2022, 81, 445. [Google Scholar] [CrossRef]
  21. Nimmo, J.R. Porosity and pore size distribution. Encycl. Soils Environ. 2004, 3, 295–303. [Google Scholar]
  22. Wang, X.; Hou, J.; Li, S.; Dou, L.; Song, S.; Kang, Q.; Wang, D. Insight into the nanoscale pore structure of organic-rich shales in the Bakken Formation, USA. J. Pet. Sci. Eng. 2020, 191, 107182. [Google Scholar] [CrossRef]
  23. Nasseri, M.H.B.; Rezanezhad, F.; Young, R.P. Analysis of fracture damage zone in anisotropic granitic rock using 3D X-ray CT scanning techniques. Int. J. Fract. 2011, 168, 1–13. [Google Scholar] [CrossRef]
  24. Zhao, H.; Ning, Z.; Wang, Q.; Zhang, R.; Zhao, T.; Niu, T.; Zeng, Y. Petrophysical characterization of tight oil reservoirs using pressure-controlled porosimetry combined with rate-controlled porosimetry. Fuel 2015, 154, 233–242. [Google Scholar] [CrossRef]
  25. Mandelbrot, B. Objects Fractals: Forme, Hasard et Dimension; Flammarion: Paris, France, 1975. [Google Scholar]
  26. Wang, X.; Hou, J.; Liu, Y.; Zhao, P.; Ma, K.; Wang, D.; Ren, X.; Yan, L. Overall PSD and fractal characteristics of tight oil reservoirs: A case study of Lucaogou Formation in Junggar Basin, China. Fractals 2019, 27, 1940005. [Google Scholar] [CrossRef]
  27. Liu, D.; Gu, Z.; Liang, R.; Su, J.; Ren, D.; Chen, B.; Huang, C.; Yang, C. Impacts of pore-throat system on fractal characterization of tight sandstones. Geofluids 2020, 2020, 4941501. [Google Scholar] [CrossRef]
  28. Qu, Y.; Sun, W.; Tao, R.; Luo, B.; Chen, L.; Ren, D. Pore–throat structure and fractal characteristics of tight sandstones in Yanchang Formation, Ordos Basin. Mar. Pet. Geol. 2020, 120, 104573. [Google Scholar] [CrossRef]
  29. Cao, Y.; Zhu, N.; Zhang, S.; Xi, K.L.; Xue, X.J. Diagenesis and reserving space characteristics of tight oil reservoirs of Permian Lucaogou Formation in Jimusar Sag of Junggar Basin, China. J. Earth Sci. Environ. 2019, 41, 253–266. [Google Scholar]
Figure 1. (a) Structural location of HSN area in Ordos Basin; (b) stratigraphic column of Triassic Chang 7 member.
Fractalfract 08 00167 g001
Figure 2. Porosity and permeability of samples of Chang 7 in HSN area.
Fractalfract 08 00167 g002
Figure 3. Main pore types of shale samples of Chang 7 in HSN area. (a) Residual intergranular pores; (b) dissolution pores; (c) dissolution pores with irregular geometry; (d) dissolution pores in the interior of particles; (e) dissolution pores in matrix; (f) mold pore; (g) clay-dominated pores of illite; (h) clay-dominated pores of chlorite; (i) microfractures.
Fractalfract 08 00167 g003
Figure 4. The intrusion and extrusion curves of HMIP.
Fractalfract 08 00167 g004
Figure 5. Pore network and pore connectivity model obtained from CT scan. (a,b): Pore size and pore connectivity model of sample N143, 1648 m; (c,d): Pore size and pore connectivity model of sample LY18, 1682.5 m.
Fractalfract 08 00167 g005
Figure 6. Pore size obtained from HMIP.
Fractalfract 08 00167 g006
Figure 7. Pore size obtained from NMR.
Fractalfract 08 00167 g007
Figure 8. Fractal dimension (D) curves calculated from HMIP. (a) Well L23, 1688.16 m; (b) well L24, 1679.95 m; (c) well Z351, 1638.26 m; (d) well L26, 1651.98 m.
Fractalfract 08 00167 g008
Figure 9. The relationship between the proportion of different types of pores and permeability. (a) The proportion of macropores and Permeability; (b) The proportion of mesopores and Permeability; (c) The proportion of micropores and Permeability; (d) The proportion of ultramicropores and Permeability.
Fractalfract 08 00167 g009aFractalfract 08 00167 g009b
Figure 10. The proportions of various pores in different types of reservoirs.
Fractalfract 08 00167 g010
Figure 11. Reservoir classification chart board of porosity and permeability.
Fractalfract 08 00167 g011
Figure 12. Distribution of different types of reservoir in plane of Chang 7 in HSN area.
Fractalfract 08 00167 g012
Figure 13. The relationship between the reservoir thickness and daily oil production.
Fractalfract 08 00167 g013
Figure 14. Production data of horizontal wells. (a) Well N11H; (b) well N14H.
Fractalfract 08 00167 g014
Table 1. Classification of pore system of Chang 7 reservoir based on the fractal characteristics.
Pore SystemsMacroporeMesoporeMicroporeUltramicropore
Pore radius (μm)>0.20.2–0.080.08–0.03<0.03
Disclaimer/Publisher’s Note: The statements, opinions and data contained in all publications are solely those of the individual author(s) and contributor(s) and not of MDPI and/or the editor(s). MDPI and/or the editor(s) disclaim responsibility for any injury to people or property resulting from any ideas, methods, instructions or products referred to in the content.

