Abstract
To investigate the mechanical properties and energy evolution laws of rocks under true triaxial unloading conditions, a study was conducted using a true triaxial rock testing system on three different types of rocks: coal, sandy mudstone, and siltstone. The study examined the mechanical behavior, failure patterns, and fractal dimensions of these rocks under true triaxial unloading conditions. The tests revealed significant variations in stress–strain curves and failure patterns among the different rock types. Observation indicated that rocks with lower peak strength exhibited higher fractal dimensions and increased fragmentation upon failure. Subsequently, based on the experimental data of siltstone, the impact of the unloading rate and particle size distribution on the energy evolution under true triaxial single-sided unloading paths was further investigated using the three-dimensional particle flow software PFC3D 6.0, revealing the micro-mechanisms of rock energy evolution. The study revealed that when the initial stress unloading level was low, the total energy and strain energy at the peak strength exhibited a strong linear relationship with the unloading rate. Before the stress peak, the dissipative energy was mainly composed of frictional energy. After the stress peak, the dissipative energy consisted of frictional energy, damping energy, and kinetic energy. The heterogeneity of rock significantly affected the distribution of dissipative energy, with an increase in rock heterogeneity leading to a decrease in frictional energy and an increase in kinetic energy.
1. Introduction
Before the excavation of underground engineering, the original rock mass is in a triaxial stress state (). The activities of engineering excavation will disrupt the original stress equilibrium of the rock mass, leading to the redistribution of the stress field in the rock mass. Specifically, unloading during underground engineering excavation can cause the rock mass to experience uni-directional or bi-directional stress unloading, changing the stress state of the surrounding rock mass from triaxial compression to uni- or bi-directional compression [1,2]. In high-stress environments, stress unloading of the surrounding rock mass may induce geological disasters, such as rockbursts, collapses, and roof falls, which seriously threaten the safety of the engineering project [3]. Hence, it is essential to investigate the mechanical properties, energy transformation, and fracture mechanisms of rocks in true triaxial unloading scenarios to accurately assess and forecast the stability of deep rock projects and ensure the security of deep underground constructions.
In order to study the mechanical behavior and failure characteristics of rock masses under three-dimensional unloading stress paths, numerous scholars have conducted extensive indoor triaxial tests. However, early rock loading and unloading tests primarily focused on conventional triaxial confined compression tests. Conventional triaxial tests can only apply axial and lateral stresses to cylindrical rock samples (), placing the rock in a stress state that is axisymmetric and cannot reflect the actual general stress state experienced by the rock (). This is inconsistent with the stress evolution characteristics of rock masses caused by actual excavation disturbances.
In recent years, some researchers have begun conducting true triaxial loading and unloading tests to gain a better understanding of rock unloading failure mechanisms. For instance, He et al. [4] used a true triaxial unloading rockburst test system to replicate the stress path changes caused by excavation by unilaterally unloading the minimum principal stress to induce instantaneous rockburst failure. Feng et al. [5] studied marble and highlighted the important role of stress paths in brittle rock failure. Li et al. [6] discovered that the height-to-width ratio and intermediate principal stress influence the failure modes, peak strength, and damage extent in hard rocks through true triaxial unloading tests. Zhao et al. [7] investigated the effect of the unloading rate on granite rock failure processes, while Du et al. [8] conducted tests on different rock types under different excavation unloading paths, emphasizing that rock failure in true triaxial unloading tests is primarily influenced by rock type. Si et al. [9] investigated the strength reduction effect of rockbursts under triaxial unloading conditions and found that higher confining pressures led to a more significant strength reduction effect in rocks, resulting in a change from shear-tension composite failure to tensile failure.
Fractal geometry is used to describe irregular and chaotic phenomena and behaviors in nature. Since its establishment by B.B. Mandelbrot in 1977, fractal geometry has become an effective tool for studying the irregular, fragmented, and statistically self-similar properties of objects in nature. It was rapidly introduced into the field of rock fragmentation studies [10,11,12]. In other words, the fractal dimension of fragments reflects the fracture characteristics of rock formations, which are in response to the specific structure of the rocks themselves and loading and unloading conditions. Therefore, the fractal dimension not only directly reflects the fracture pattern of rocks, but also indirectly reflects the stress state and loading/unloading path of rocks. To date, there has been a considerable amount of research conducted on the fractal characteristics of rock fracturing under uniaxial or triaxial compression [13,14,15,16]. Nevertheless, there is a lack of extensive research on the fractal properties of rock fracture under true triaxial unloading conditions. For instance, Li et al. [13] investigated how the fractal characteristics of rock surfaces relate to the probability of rock failure. Their findings indicated that rocks with a significant increase in the fractal dimension during uniaxial compression exhibited a strong tendency for rockbursts. Zhou et al. [14] studied the evolution of energy and fractal properties of granite samples with different length-to-diameter ratios during dynamic compression and established a relationship between dynamic loading parameters and the fractal dimension. In addition, Zhang et al. [15] conducted experiments on the localization of acoustic emission events in sandstone samples under uniaxial compression and discovered that a significant reduction in the fractal dimension could act as a precursor to buckling failure of rocks under such conditions.
According to the laws of thermodynamics, energy conversion is a critical aspect of material physical processes, while material destruction is a state of instability fueled by energy. The process of rock deformation and failure involves the dissipation and release of energy [17,18,19,20]. For instance, Li et al. [19] investigated the energy evolution behavior of granite specimens under conventional triaxial loading and unloading paths. They found that the total energy, strain energy, and dissipated energy of the granite specimens exhibited different phase characteristics over time. Zhang et al. [20] conducted tests on marble specimens using different loading paths and established a nonlinear energy evolution model for rocks based on the interaction mechanism of energy accumulation and dissipation. Meng et al. [21] performed conventional triaxial compression tests at different initial unloading levels and showed that an increase in the initial unloading level resulted in linear increases in the total energy, strain energy, dissipated energy, and energy dissipation rate at the peak stress location. Currently, ongoing research is mainly focused on investigating the true triaxial energy evolution laws in the context of rockburst phenomena. For example, Su et al. [22] conducted rockburst simulation tests on granite and found that the kinetic energy associated with rockburst expulsion accounted for less than 1% of the total releasable elastic strain energy before peak confinement was reached. Using 3DEC, Sun et al. [23] performed rockburst simulations on granite under true triaxial single-sided unloading conditions. The research results suggest that the key factors contributing to rockburst projectile failure are the accumulation of sufficient elastic strain energy and the achievement of a high loading rate.
Previous studies have identified various factors that influence rock unloading, such as the stress path, unloading rate, intermediate principal stress, and rock type. However, existing studies have primarily focused on the mechanical behavior and failure characteristics of rocks under true triaxial unloading conditions, with little attention paid to the fractal characteristics and energy evolution of rocks. The objective of this study is to conduct a true triaxial unloading test on three representative rocks: coal, sandy mudstone, and siltstone. By analyzing the fractal characteristics and energy conversion rules of rock fracture under true triaxial loading and unloading conditions, we aim to gain a deeper understanding of the damage evolution and energy transformation within the rock. This will facilitate a more comprehensive understanding of the rupture mechanism.
2. Experimental Materials and Program
2.1. Experimental Samples and Equipment
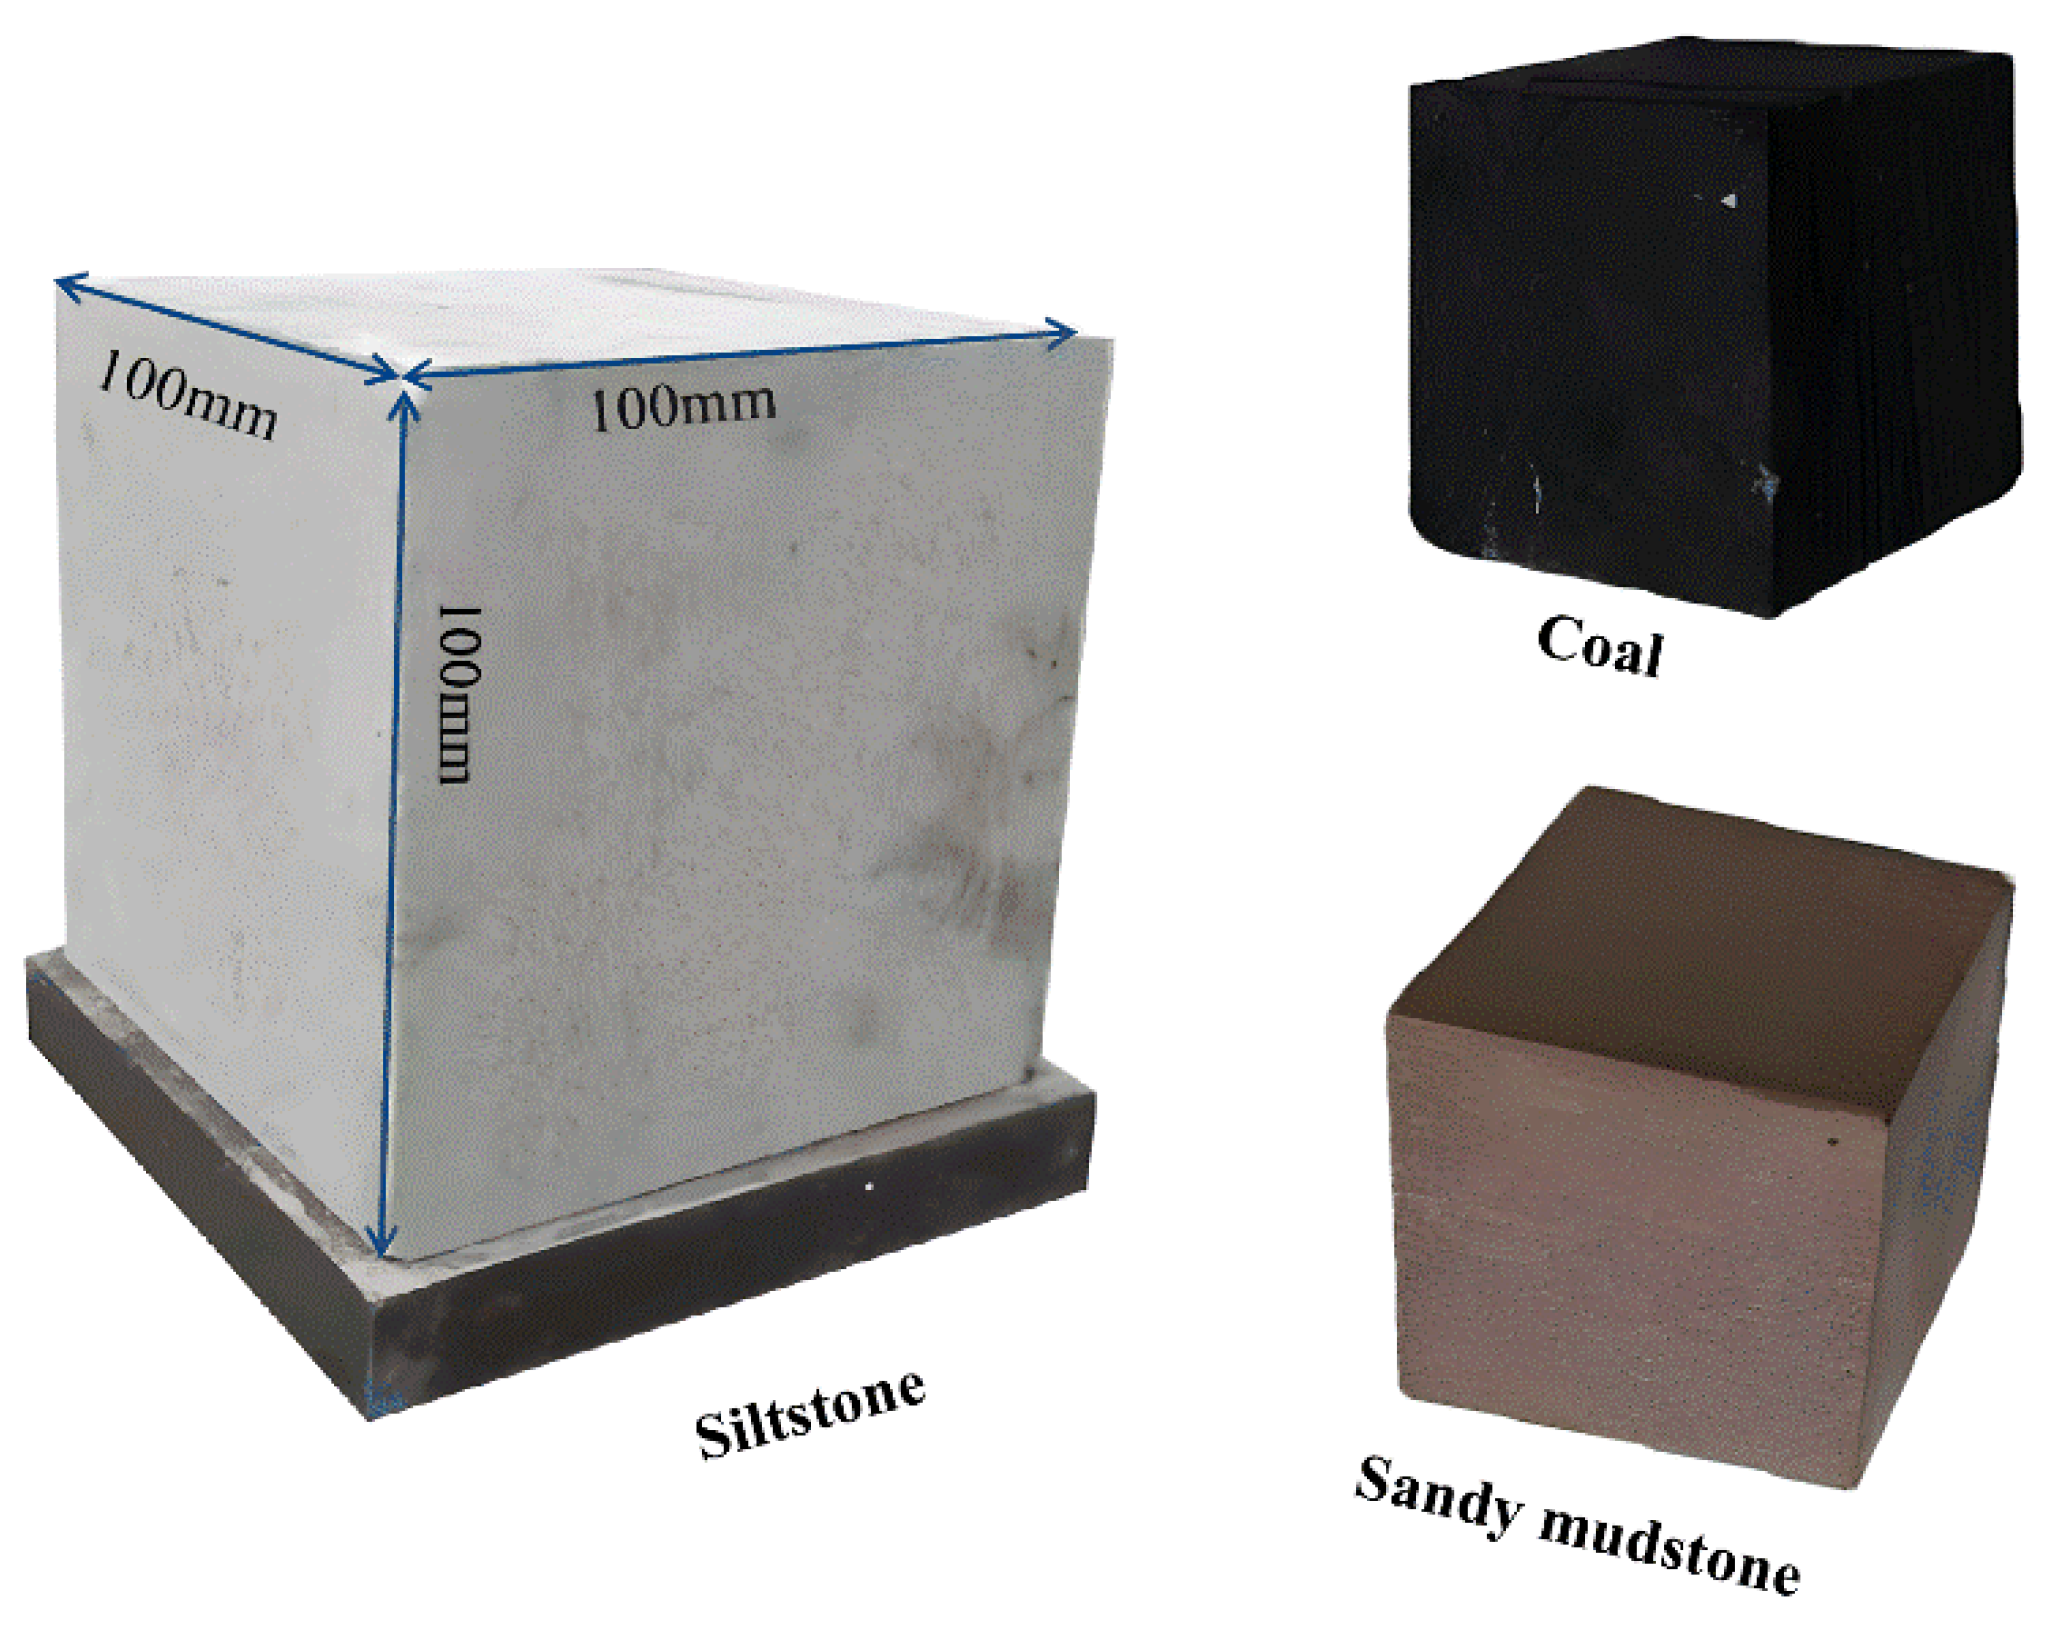
As stated by Du et al. [8], the failure mode of rock under true triaxial unloading conditions is dependent on the rock type. Therefore, this study selected coal, sandy mudstone, and siltstone, three common rock types in underground tunnel engineering, to conduct indoor single-sided unloading tests. As illustrated in Figure 1, the specimen dimensions were 100 mm in length, width, and height, with a flatness error of ±0.05 mm on the end face and a verticality error of ±0.25°.
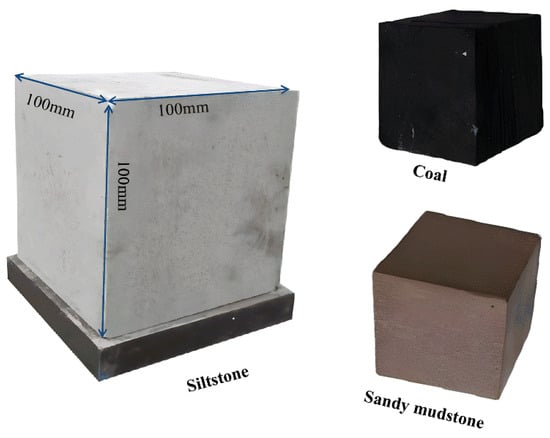
Figure 1.
Schematic diagram of the specimens.
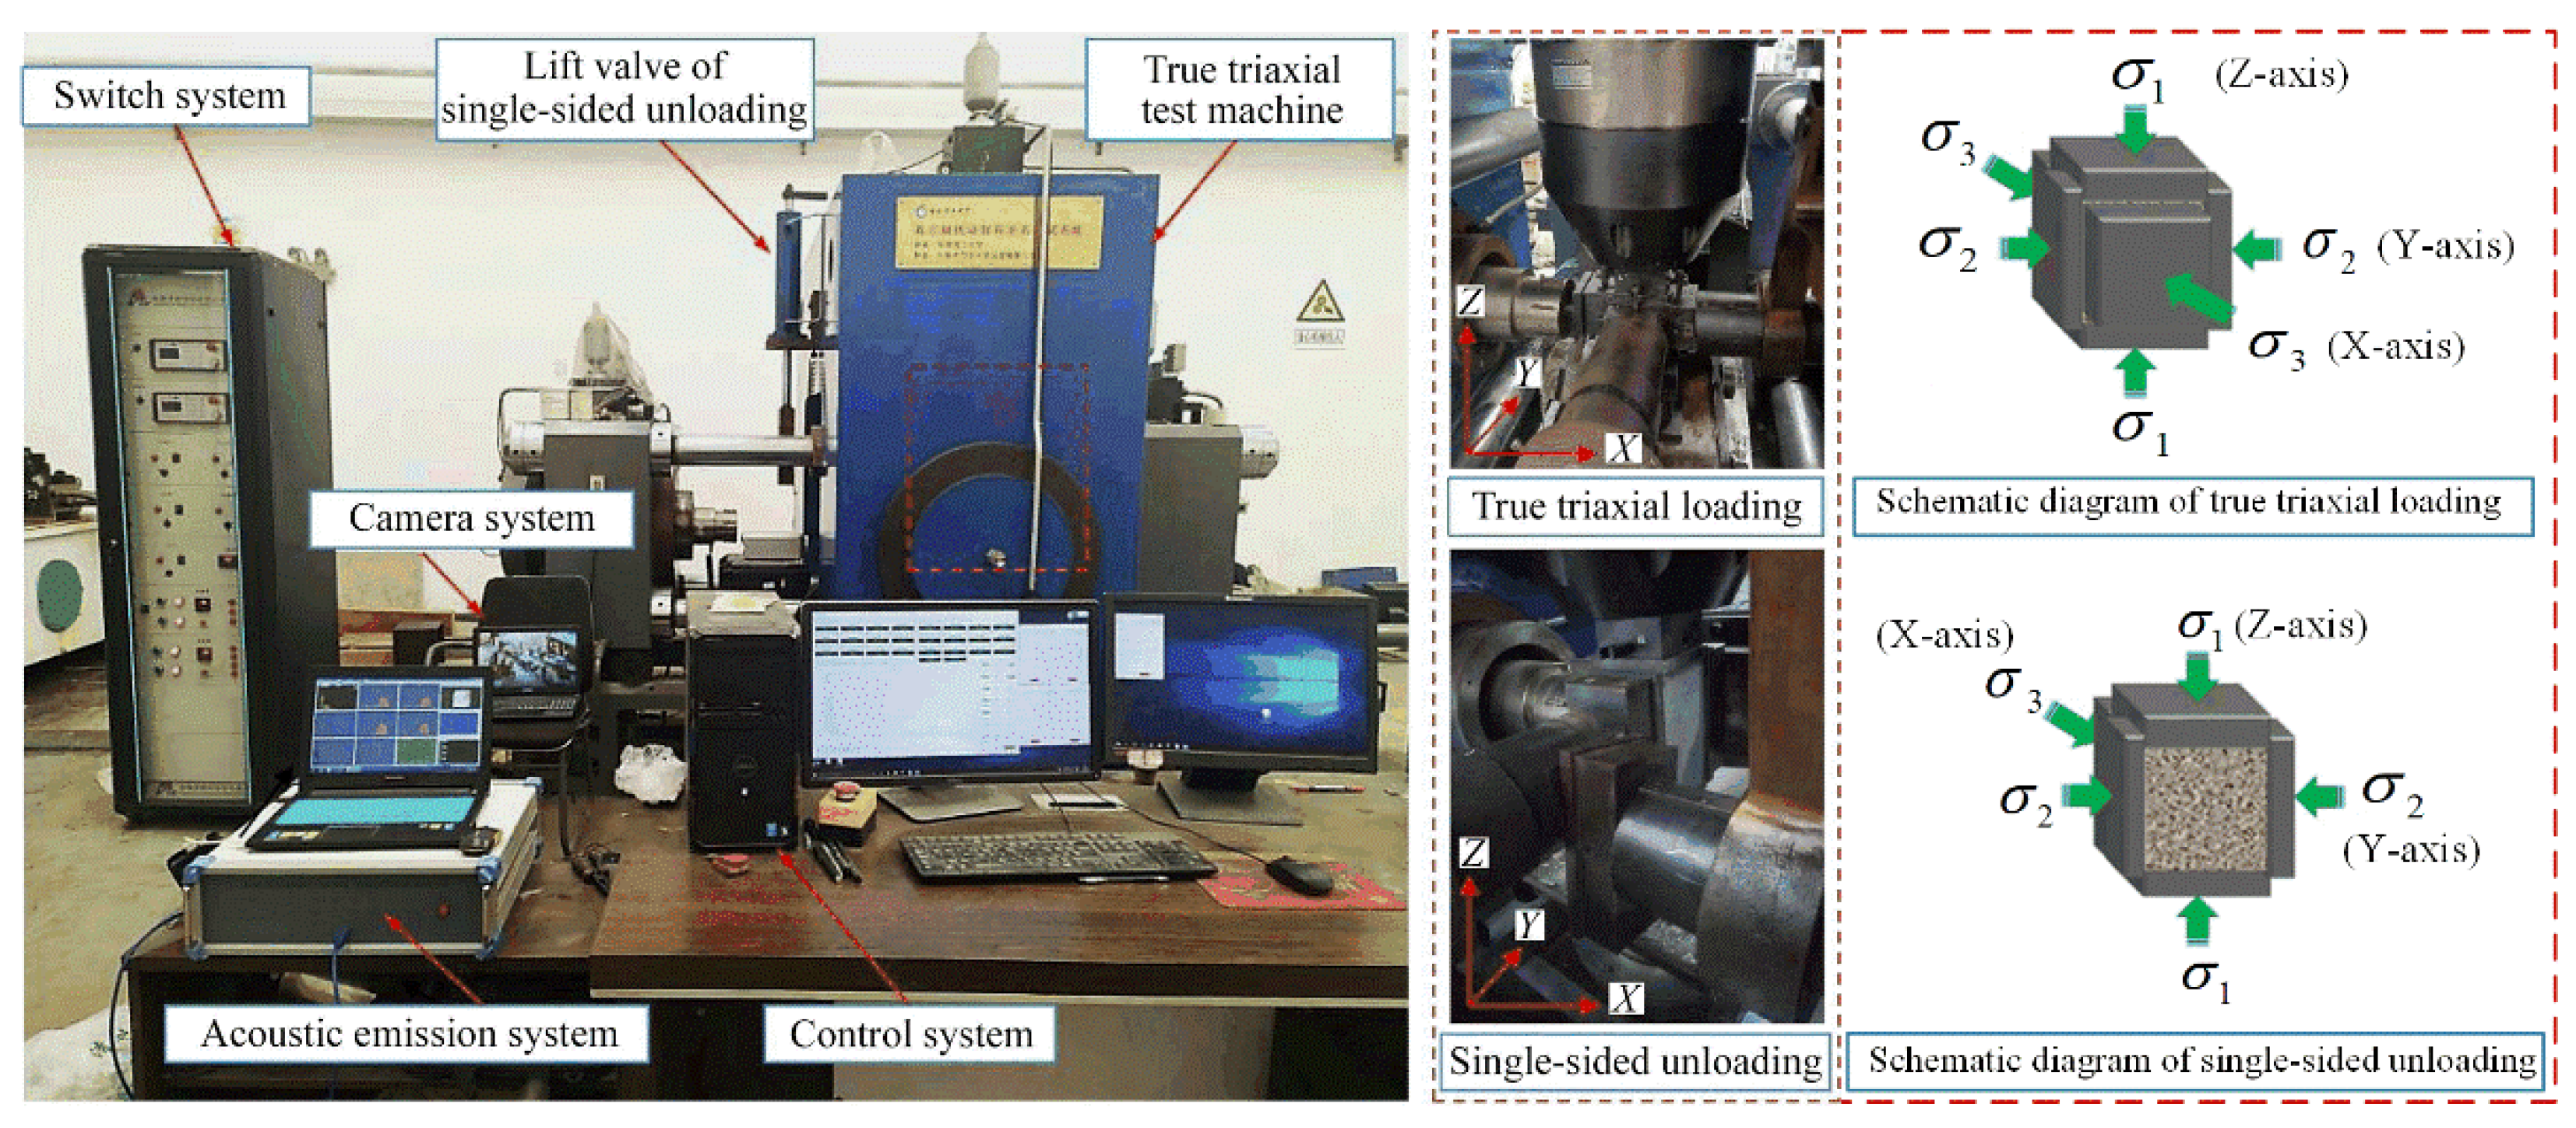
In this study, we employed the true triaxial disturbance unloading rock testing system, independently developed by Anhui University of Science and Technology, China, as depicted in Figure 2. The testing system allows for three-axis independent loading and unloading experiments, with a maximum load of 3000 kN in the X direction and 5000 kN in the Y and Z directions. The system is equipped with mutually independent control systems, which allow for independent loading and unloading of different displacements and stress rates in the three directions of X, Y, and Z. This enables the simulation of the stress changes of a real rock mass during different loading and unloading processes. Furthermore, the test system is also equipped with DS5 acoustic emission monitoring equipment, which allows for the microscopic damage characteristics of rock materials to be monitored during the test process.
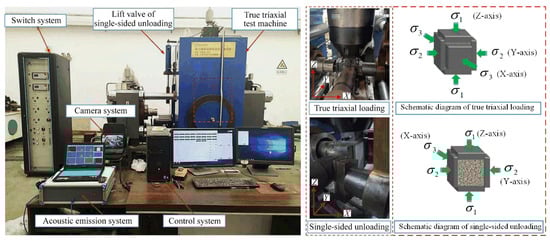
Figure 2.
True triaxial disturbance unloading rock testing system.
2.2. Experimental Program
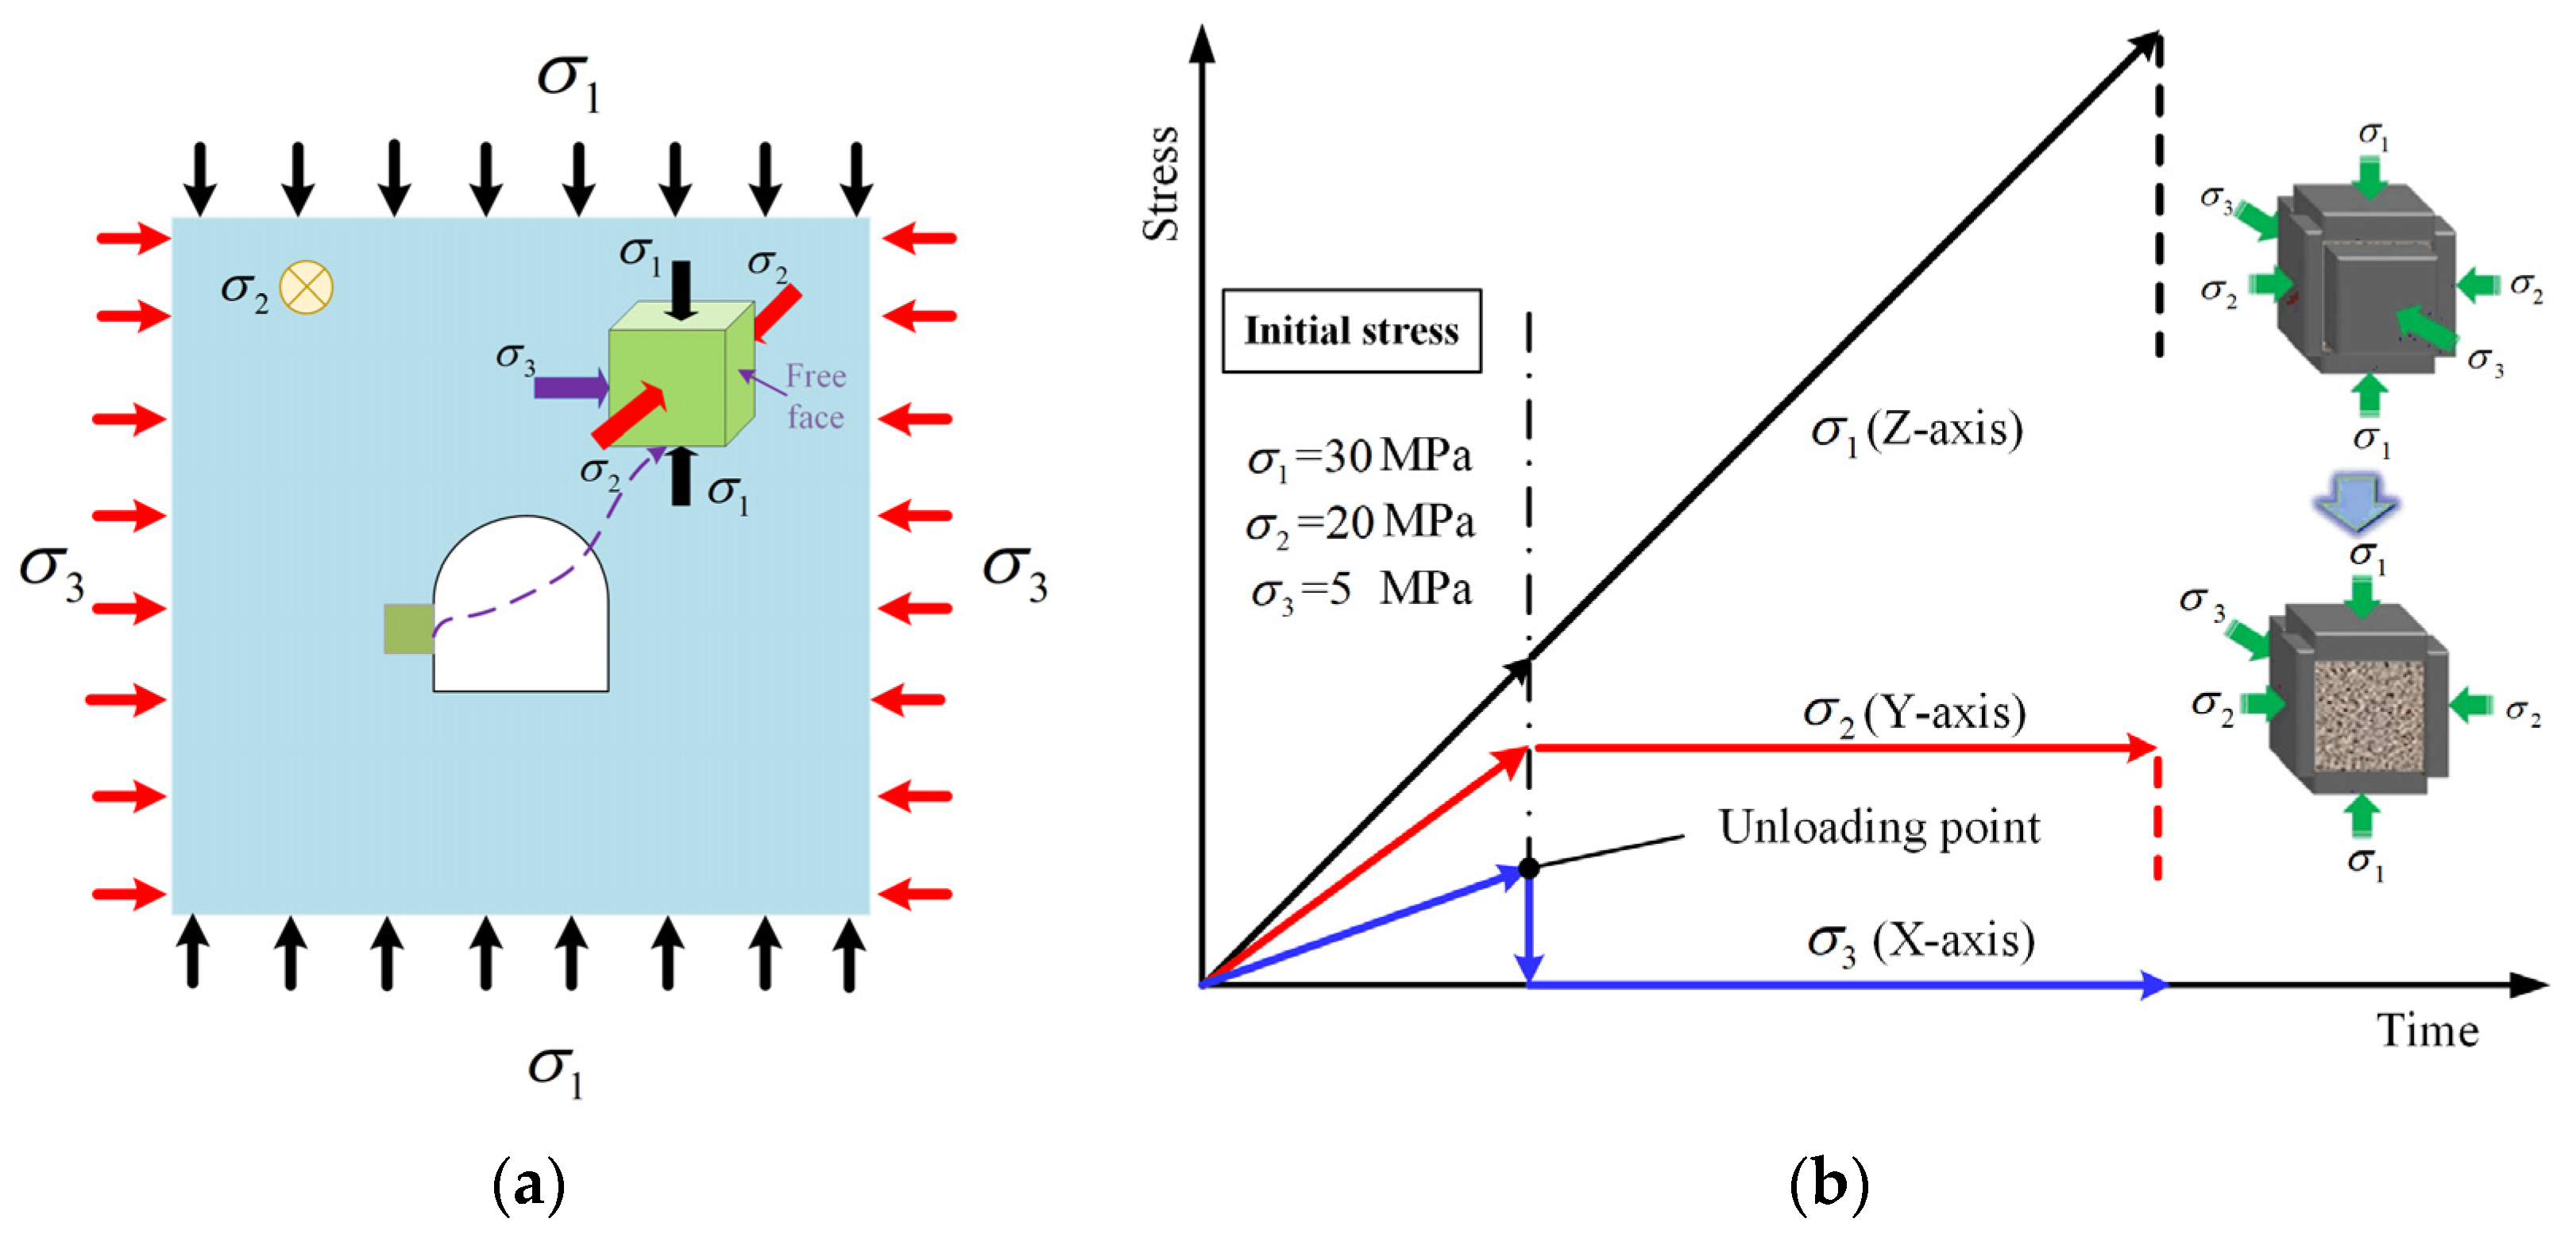
Figure 3a illustrates the stress state diagram of the surrounding rocks before and after excavation in the deeply buried tunnel. Before excavation, the surrounding rocks are subjected to three-dimensional stress. Following excavation, the stress in the surrounding rocks redistributes, with an increase in the tangential stress on the free face of the tunnel rocks and an instantaneous change to zero in the radial stress [24]. It should be pointed out that , , and represent the minimum principal stress, intermediate principal stress, and maximum principal stress, respectively. The maximum principal stress, , was set along the Z direction, the intermediate principal stress, , was set along the Y direction, and the minimum principal stress, , was set along the X direction. In order to simulate the change process of surrounding rock stress after tunnel excavation, this study adopted the experimental method of “true triaxial loading–horizontal single-sided unloading–vertical loading”, and the loading path is shown in Figure 3b. First, the force loading control method was employed to load , , and to their respective initial confining pressures at loading rates of 60 kN/min, 40 kN/min, and 10 kN/min, respectively. Since coal is the rock type with the lowest triaxial strength among the three types, it was assumed that before the excavation of the coal tunnel, the coal rock structure was intact and in the elastic stage. Therefore, the unloading stress point for this test was set not to exceed 50% of the coal rock’s triaxial strength. Here, = 30 MPa, = 20 MPa, and = 5 MPa. Subsequently, the direction was unloaded on one side to simulate the rapid unloading of excavation. Finally, remained unchanged and continued to be loaded until the rock reached failure to simulate stress concentration after excavation.
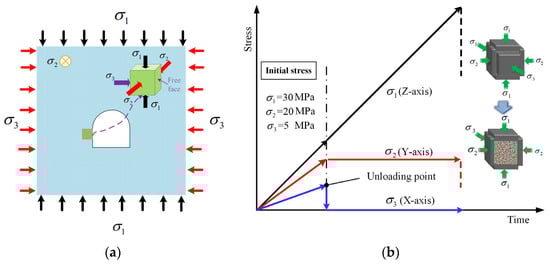
Figure 3.
True triaxial simulation method: (a) Schematic diagram of roadway surrounding rock loading character. (b) Paths of stress loading and unloading.
3. Experimental Results and Analysis
3.1. Stress–Strain Curve Analysis
The stress–strain curves of various types of rocks under loading and unloading stages are depicted in Figure 4, with the initial strain at unloading serving as the baseline for measurement. The deformation process of different types of rocks under loading and unloading conditions was generally consistent, including three stages: elastic, yielding, and softening.
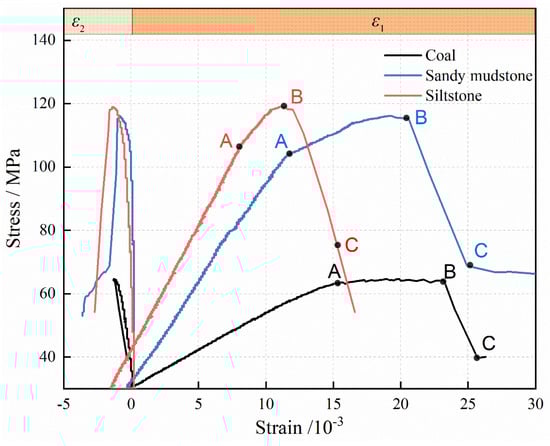
Figure 4.
Unloading stress–strain curves for various types of rocks.
- Elastic stage (OA): In this stage, as the maximum principal stress increased, the relationship between stress and strain showed linear growth. In triaxial compression tests, the rock sample was initially loaded to a predetermined initial stress state. Due to the presence of initial confining pressure, the internal pore and fracture structures of the rock sample were compacted, and the development of new fractures during subsequent loading was not significant. Therefore, after reaching the initial stress and unloading, the rock sample was basically in the elastic stage.
- Yielding stage (AB): As the maximum principal stress continued to be loaded, the slope of the curve gradually decreased in a convex shape to peak stress, and the rock underwent plastic deformation. In this stage, there was a qualitative change in the development of microcracks within the rock sample, manifested by the initiation and expansion of new fractures. As stress continued to increase, the intensity and length of new fractures increased, while the overall stiffness of the rock sample gradually decreased. This resulted in a gradual decrease in the slope of the stress–strain curve.
- Softening stage (BC): After reaching peak strength, the internal structure of the specimen was damaged, causing stress to gradually decrease as strain continued to rise, resulting in a negative slope of the curve. Stress decreased to residual stress levels and then remained constant, while strain continued to increase until the specimen underwent noticeable breakdown, and the curve tended to develop along a horizontal path. Due to the low initial unloading level in this study, the single-sided transient unloading in the X direction did not directly cause rock failure. In contrast, constant loading was maintained in the Y direction, and continued loading in the Z direction resulted in rock failure. Therefore, under certain confining pressure, frictional forces were formed between the fractured rock blocks, providing residual bearing capacity.
From Figure 4, it is evident that there were significant differences in the stress–strain curves of different types of rocks. These differences can be attributed to inherent differences in their mineral composition, grain size, and structural characteristics. In the context of single-sided unloading conditions, the peak strengths observed in coal, sandy mudstone, and siltstone were 64.68 MPa, 116.13 MPa, and 119.00 MPa, respectively, showing an increasing trend. The peak strains at instability for different types of rocks varied, but the overall trend was that as the axial stress increased, the maximum principal strain, , continued to increase, while the intermediate principal strain, , showed a decreasing trend, indicating dilation. This phenomenon can be attributed to the constant intermediate principal stress during the loading and unloading process, and the Z-direction compression led to X- and Y-direction expansion due to the Poisson effect. In addition, the X-direction unloading surface acted as the primary expansion surface, resulting in the expansion in the Y direction being less than that in the X direction.
3.2. Failure Pattern Analysis
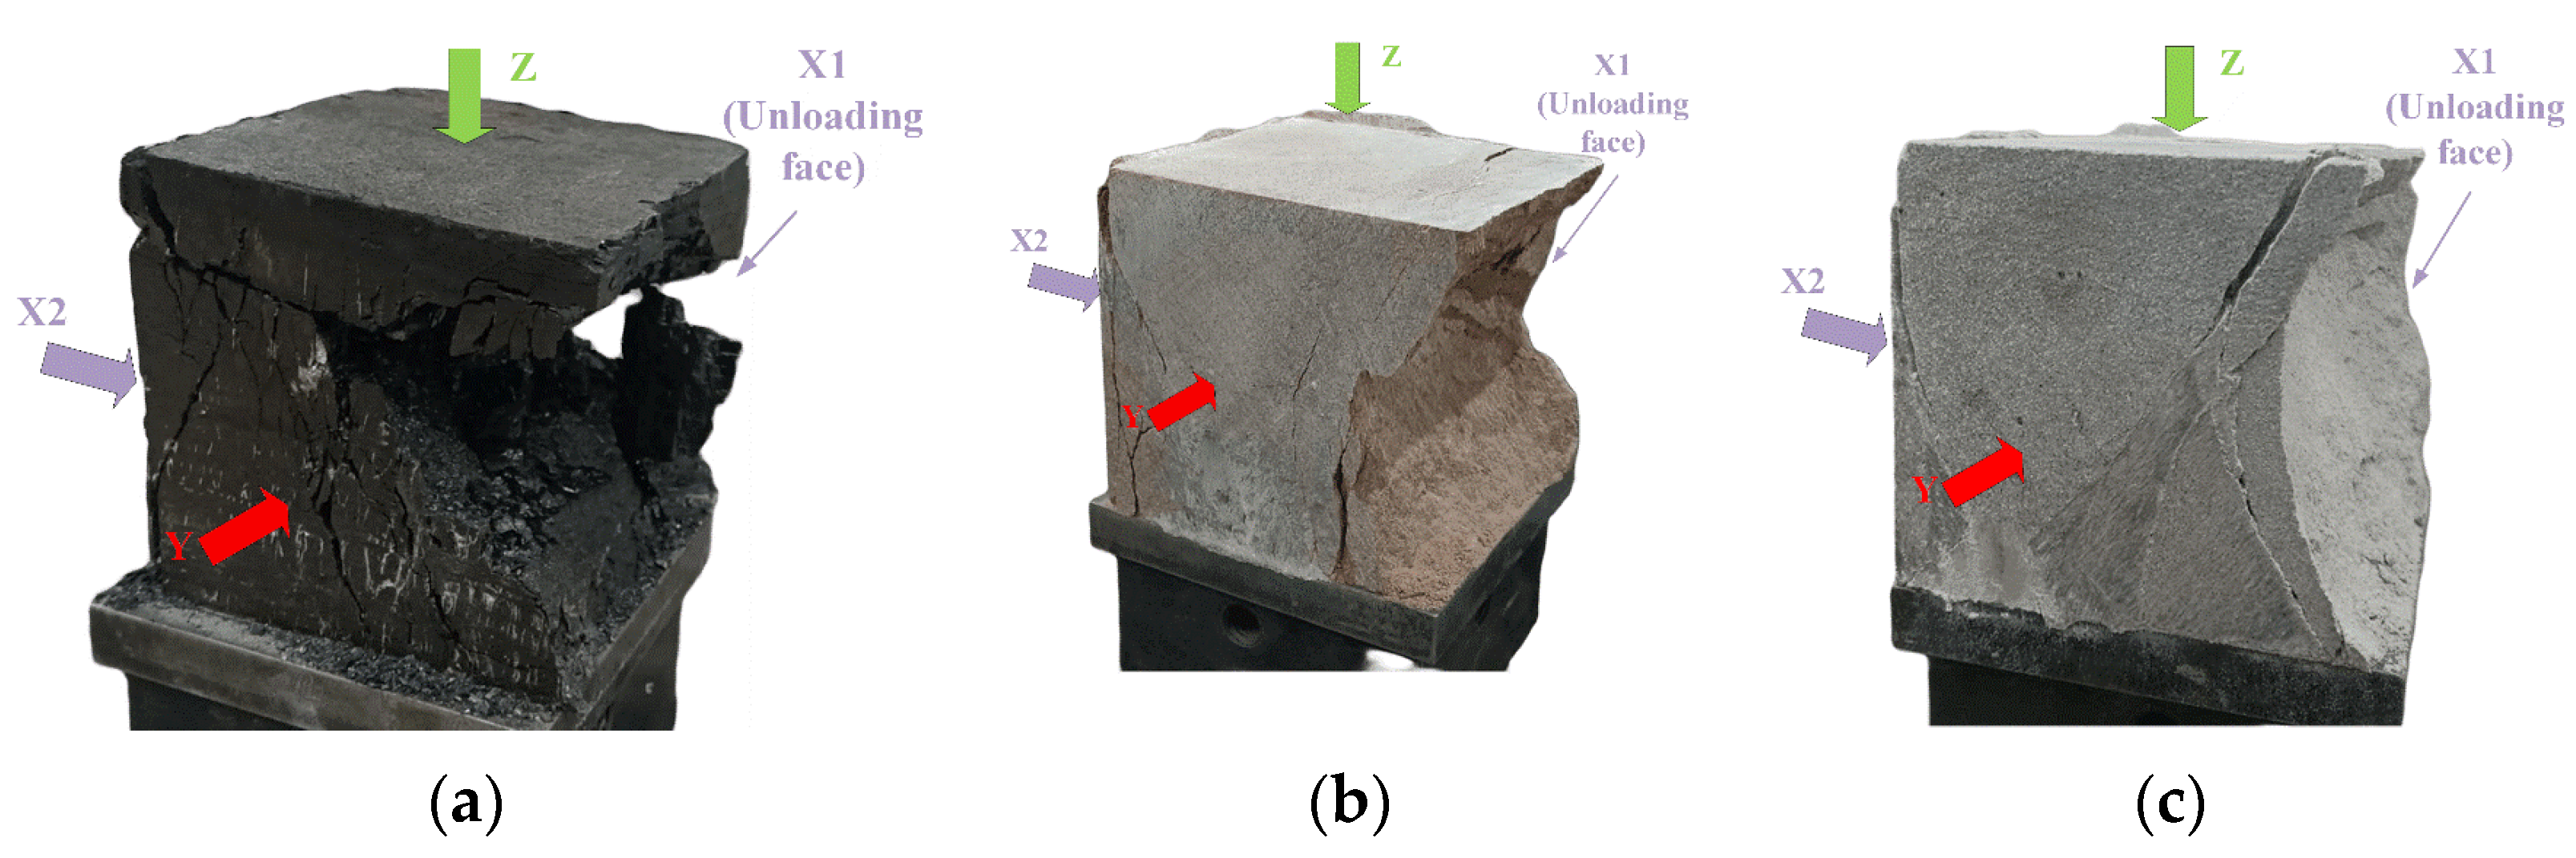
Figure 5 illustrates the variation in macroscopic failure patterns of different rock types under true triaxial unloading conditions. In a single-sided unloading stress state, it was observed that all types of surrounding rock mainly deformed along the direction of the minimum principal stress, X1, while the fracture surface was parallel to the intermediate principal stress Y direction. Rock failure was mainly concentrated near the unloading free surface X1, forming distinct V-shaped failure pits accompanied by a large number of rock fragments and debris. Small V-shaped cracks were also observed near the X2 surface, but no rock detachment was observed. In the middle of the X-direction loading surfaces, mainly shear cracks were present, with fewer fine cracks.

Figure 5.
Macroscopic failure patterns of different rock types under unloading conditions: (a) coal, (b) sandy mudstone, and (c) siltstone.
Under single-sided unloading conditions, the coal was most severely damaged. Due to the presence of numerous original cracks in the coal body and its high heterogeneity, the internal damage was deepest during failure, resulting in deep V-shaped pits with rough fracture surfaces and a large amount of small fragments. The overall failure patterns of sandy mudstone and siltstone were similar, with the interior of the V-shaped pits being smoother and containing more powder and debris. However, the fractured rock fragments inside the V-shaped failure pits of siltstone were larger, indicating overall tensile failure characteristics, while the failure of sandy mudstone was more fragmentary, with rougher fracture surfaces compared to siltstone.
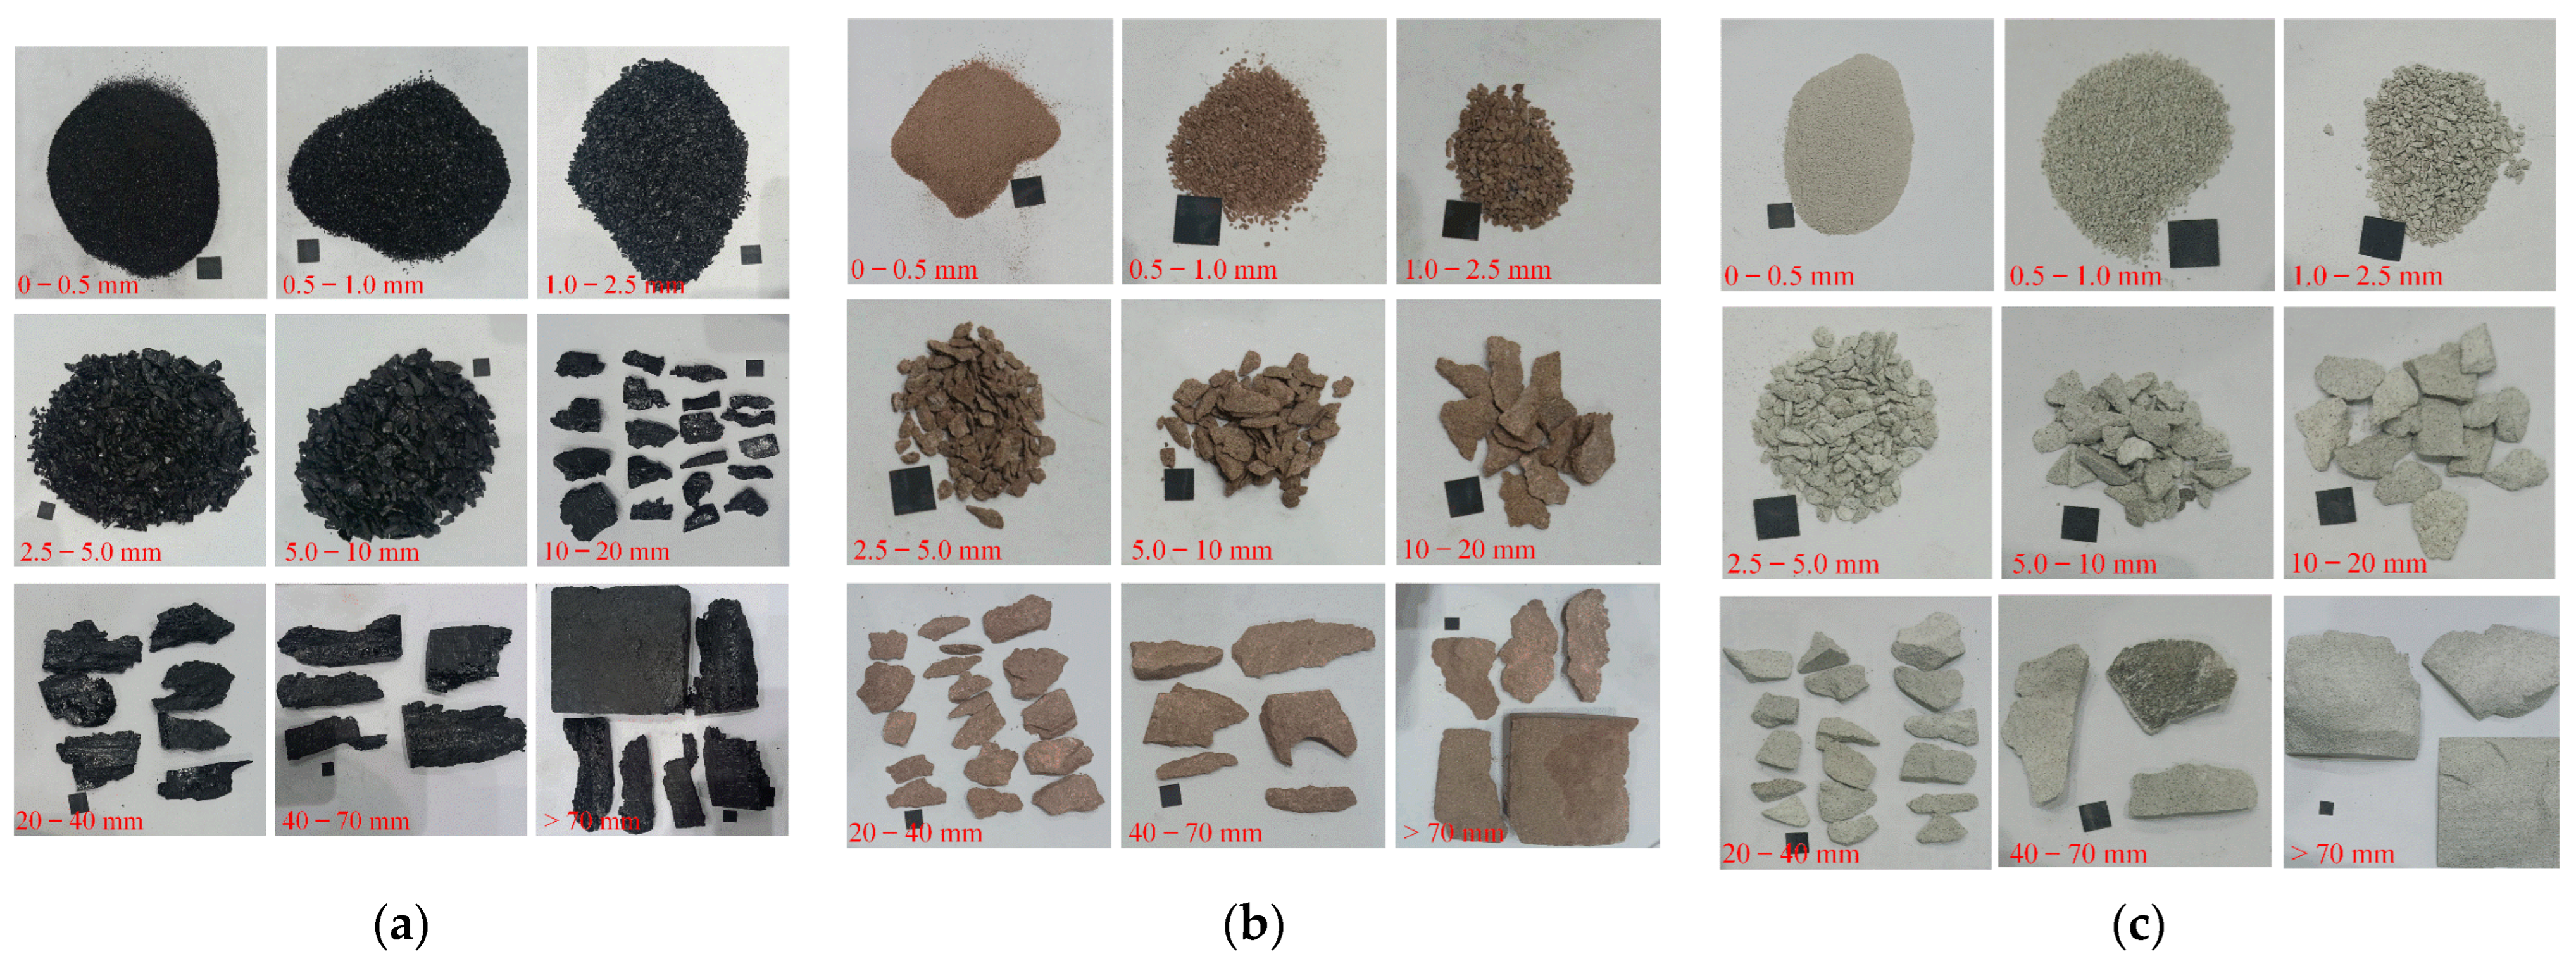
To quantitatively analyze the degree of rock damage for different rock types, fractal dimensions were used for analysis in this study. The advantage of fractal theory lies in its ability to discover potential patterns in disordered geometric bodies, achieving a combination of disorder and order. To assess the effect of unloading on the fracture behavior of different rock types, a sieving tool was used to collect and classify the debris generated in the experiments into nine particle sizes. The specific grades and sieving results are shown in Figure 6. After weighing the debris for each particle size, different fractal dimensions of rock fragments were calculated by using the mass data of debris of different particle sizes with the reference standard of placing a 10 mm black square.
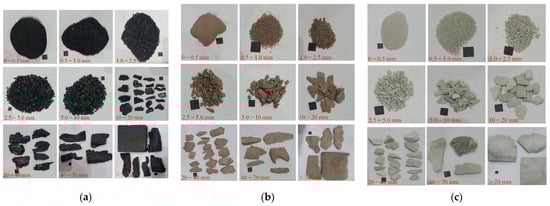
Figure 6.
Debris distribution of different types of rocks under true triaxial unloading conditions: (a) coal, (b) sandy mudstone, and (c) siltstone.
We calculated the fractal dimension of the rock using Equation (1) [25]:
where,
where α is the slope of —R in a double logarithmic coordinate system, is the mass of the debris when the equivalent side length is R, and M is the total mass of the debris in the computational scale.
D = 3 − α
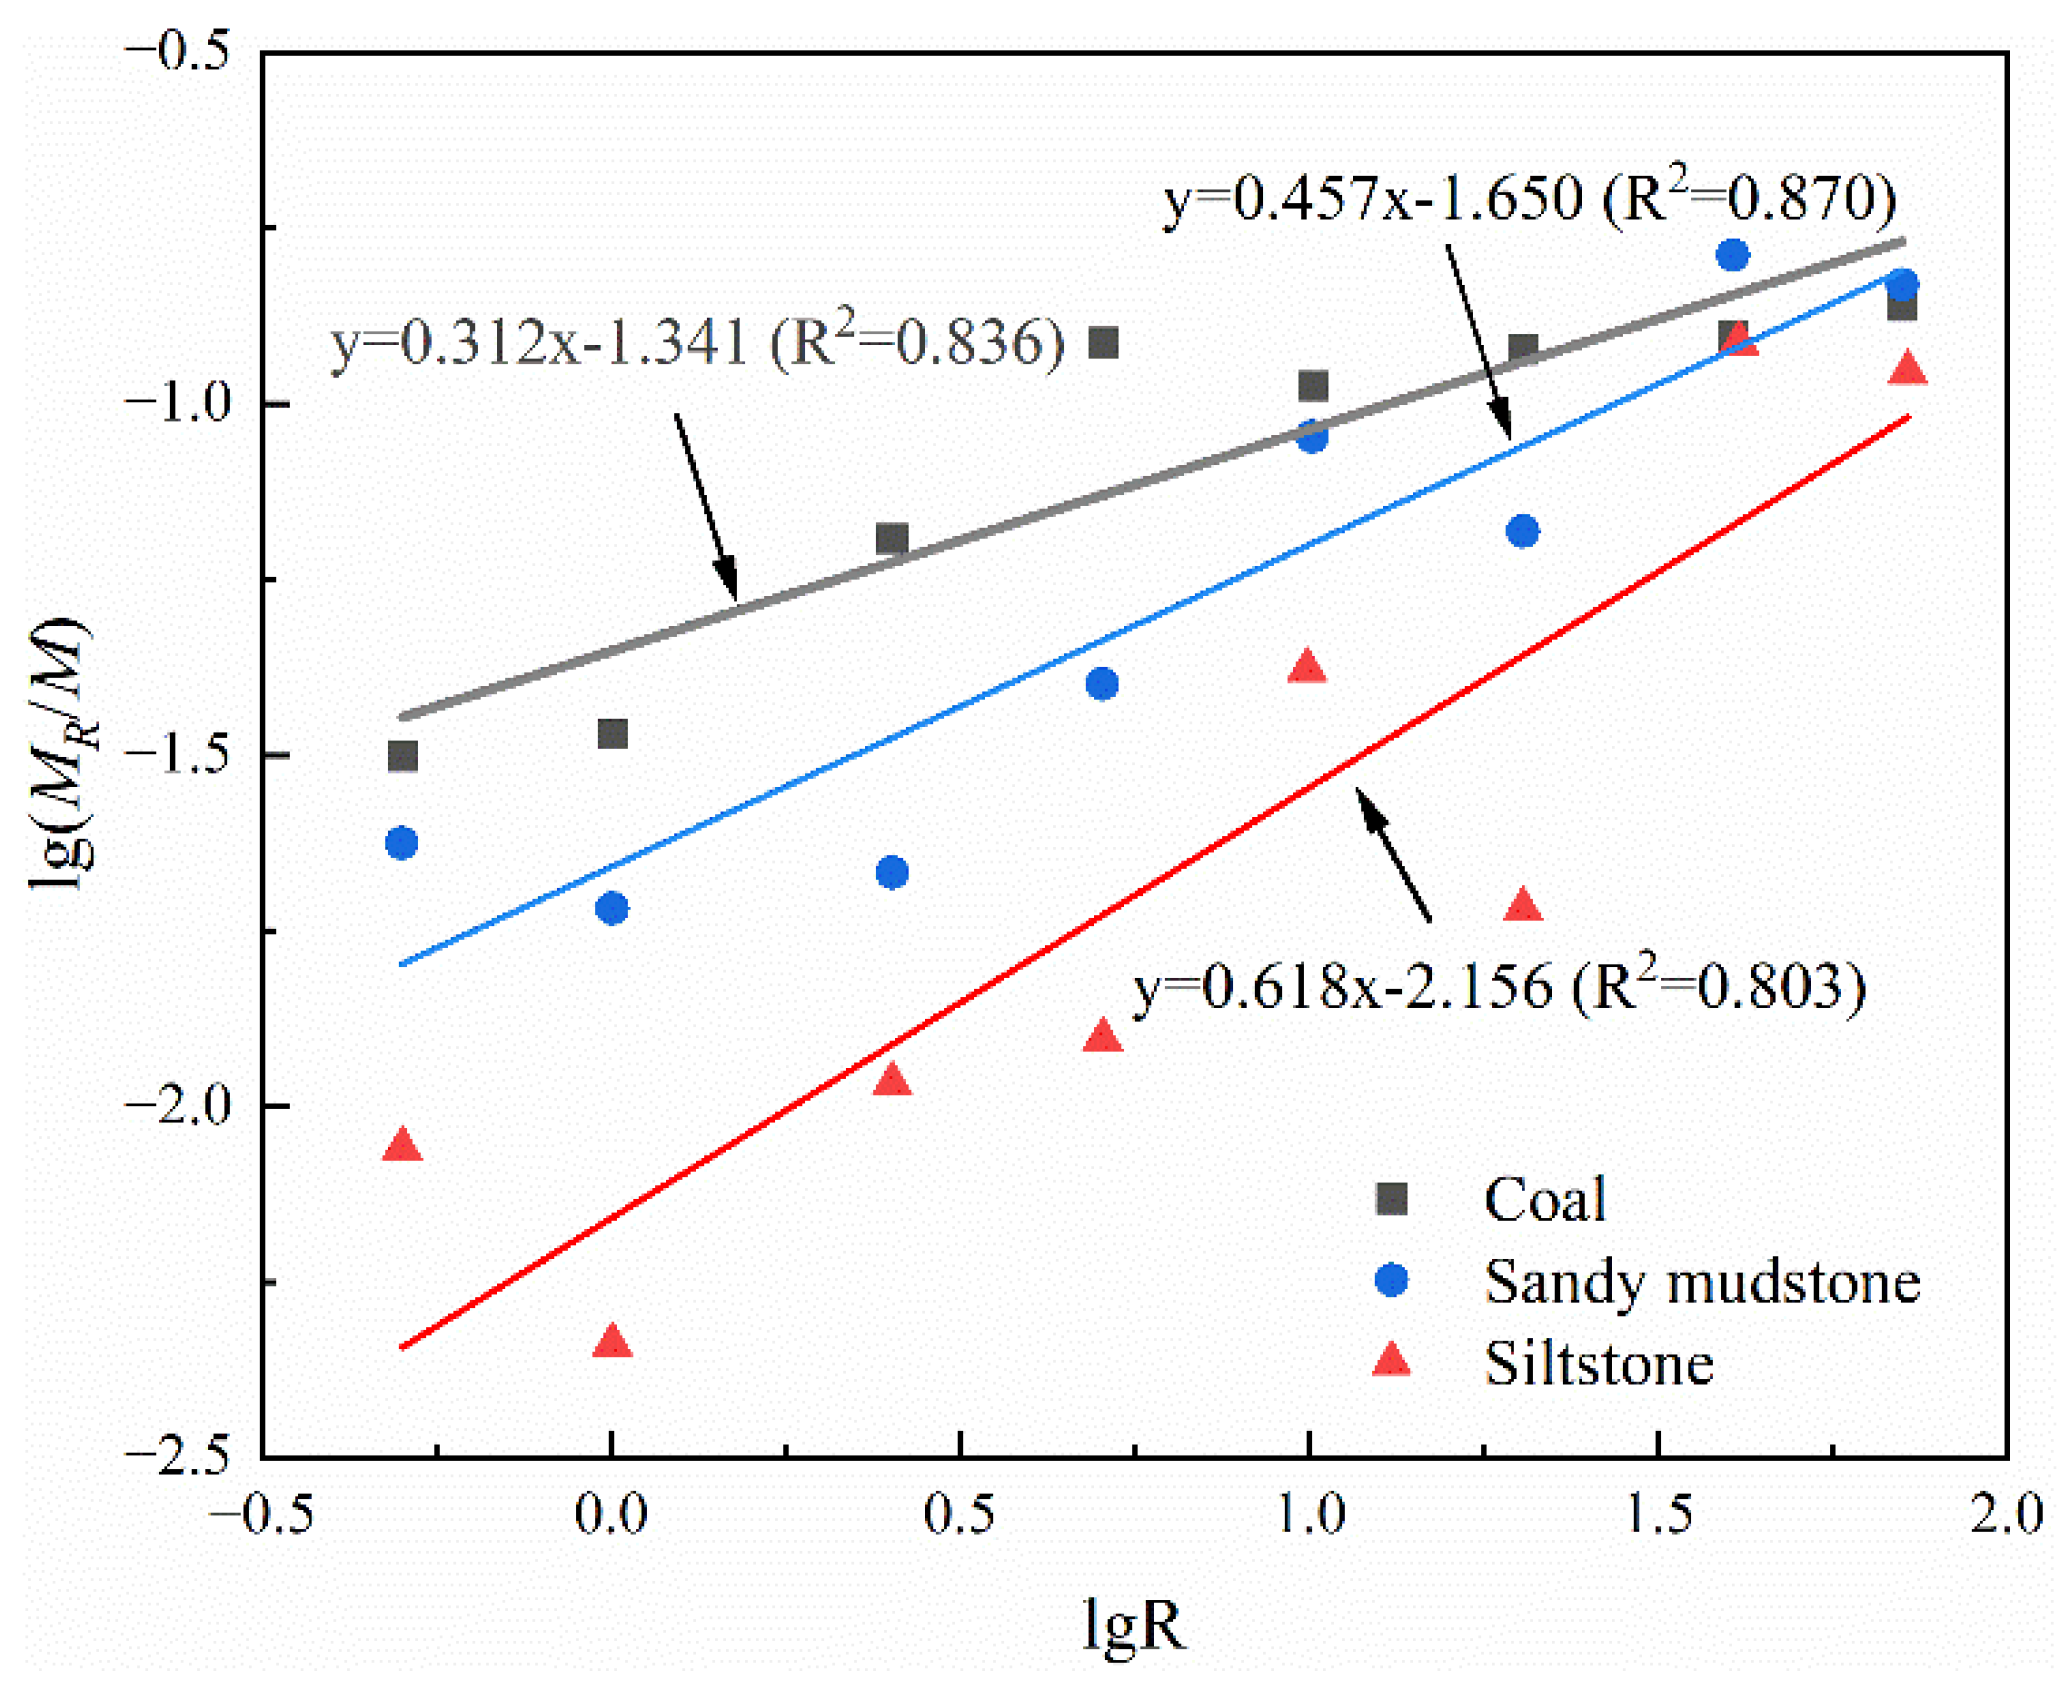
Research has shown that the self-similarity of fragments may only exist in a specific local area [25,26]. When statistical analysis was performed on fragments within a range of 70 mm, the results showed good consistency. Figure 7 shows the relationship between the lg(MR/M) and lgR of fragments after different rock unloading experiments, as well as the linear fitting, as shown in Equation (3):
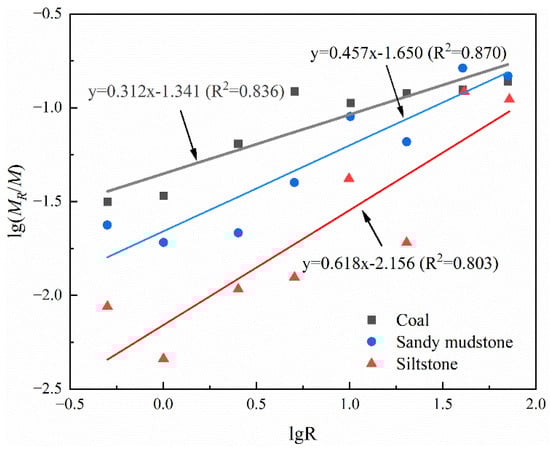
Figure 7.
Relationship between unloading rock masses of different lg(MR/M) and lgR.
As the statistical diameter of the fragments increased, the relationship between lg(MR/M) and lgR exhibited a good linear correlation, with R2 values all above 0.8. The fractal dimension, D, ranking of rocks was as follows: coal > sandy mudstone > siltstone. Studies indicated that the larger the fractal dimension, the higher the degree of fragment crushing, indicating a narrower range of quality distribution for each grade, with fewer large fragments and more small fragments. The fractal dimension of coal was the largest, indicating that the quality variation range of larger fragments at different particle sizes was smaller, and the cracks were more fully developed. Therefore, the degree of fragmentation of unloading rocks was inversely related to their hardness, i.e., the smaller the peak strength of the rock, the larger the fractal dimension of the final fragmented material, the higher the fragmentation degree, and the more fully developed the crack in the failure zone. These experimental results provide a certain reference base for underground construction in different types of rock.
4. Numerical Simulation
At present, the methods of laboratory tests and numerical simulation methods have been widely applied in research on rock energy. However, it is important to note that indoor testing can often only determine a single or limited energy parameters, such as elastic strain energy and dissipation energy, which are not sufficient to fully describe the dynamic changes in rock energy during true triaxial loading and unloading processes. This process involves the conversion between multiple forms of energy (including elastic strain energy, dissipation energy, kinetic energy, frictional energy, and other related energies), as well as the proportional relationships between these energy components relative to the total system energy, details that are critical to a deeper understanding of rock failure mechanisms. Fortunately, advanced numerical simulation techniques, such as Discrete Element Method (DEM) [27], Finite Element Method (FEM) [28], and Finite Discrete Element Method (FDEM) [29], have proven effective in complementing the limitations of experimental methods. In particular, DEM can not only effectively visualize the process of rock fracturing but can also accurately quantify the conversion and distribution of different energy components. Numerous studies have confirmed the effectiveness of DEM in analyzing the energy evolution characteristics during rock deformation and failure processes [30].
4.1. Numerical Models and Schemes
Under the same loading (unloading) conditions, the differences in mechanical properties exhibited by coal, sandy mudstone, and siltstone used in the test are mainly attributed to their inherent heterogeneity. From a microscopic perspective, rock heterogeneity is mainly due to geometric heterogeneity caused by grain shape and size, mechanical property heterogeneity caused by elastic properties at grain contacts, and initial microcrack heterogeneity caused by features such as microcracks or grain boundary voids [31,32]. Extensive research indicates that during loading, the geometric structural heterogeneity of rocks at the mineral grain scale can induce significant non-uniform stress distribution within the material, and particularly when microcracks begin to interact, the geometric structural heterogeneity can influence the internal stress state of the rock and potentially lead to material yield [33]. In addition, mineral grains, as the basic units of which rocks are composed, are the physical basis of rock heterogeneity and a primary factor inducing micro-scale heterogeneity in rocks. Therefore, in this study, we constructed numerical models considering different grain size distributions, focusing on analyzing the effect of geometric heterogeneity on the mechanical behavior and energy properties of different rock types under true triaxial unloading conditions.
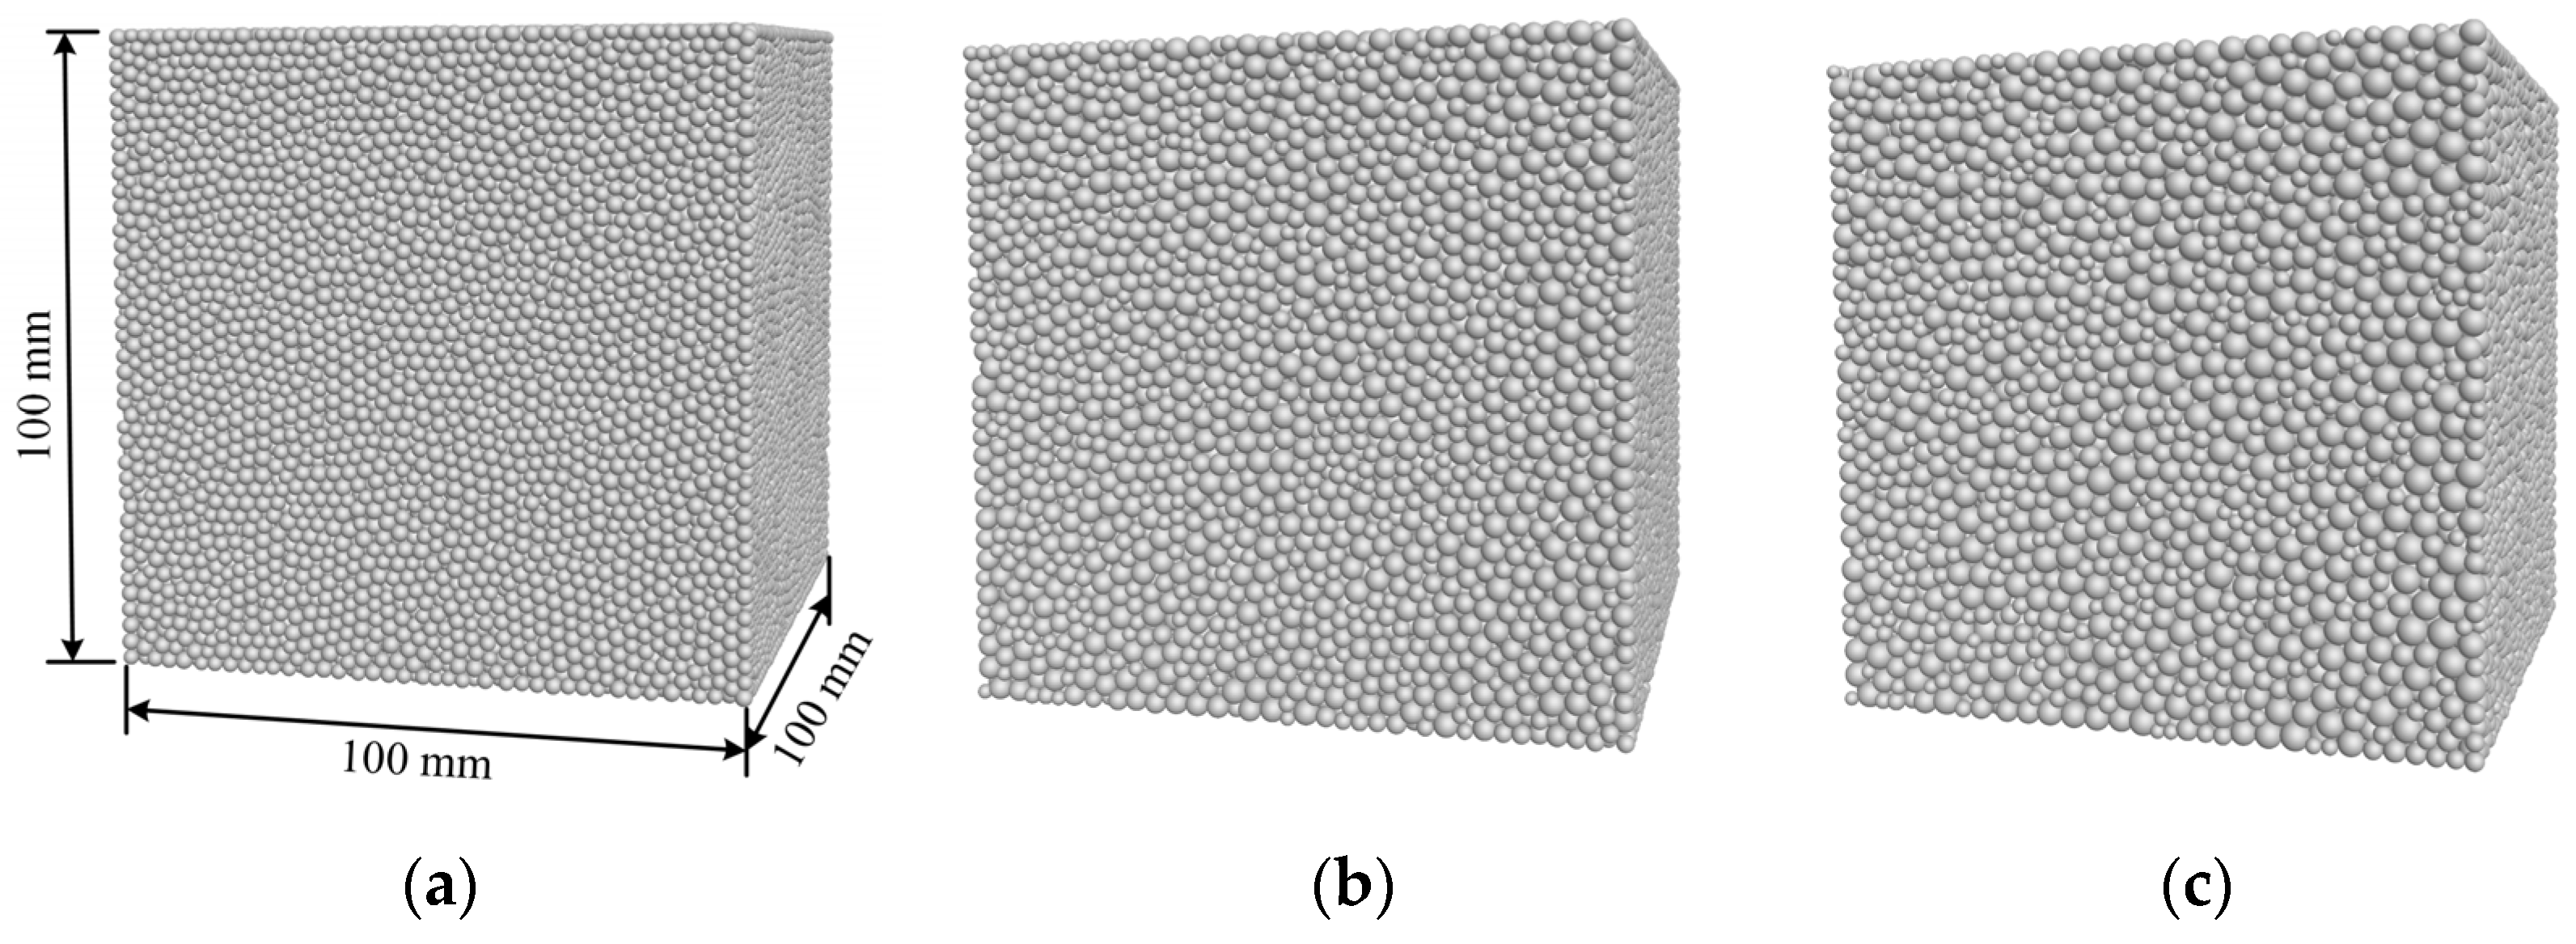
A series of numerical simulations were conducted utilizing the Particle Flow Code software PFC3D, developed by Cundall [34]. Based on the Discrete Element Method, PFC3D is capable of more accurately simulating the microscopic structure and particle interactions of rock and similar granular materials. In PFC3D, a range of contact models are provided, with the linear parallel bond model being widely adopted for effectively reproducing the behavior of rock-like materials during tension or shear fracture simulations [35]. Consequently, this study employed the linear parallel bond model to characterize the bonding between rock particles. The numerical computational model will maintain consistency with the dimensions of laboratory test specimens, specifically a cubic model measuring 100 mm × 100 mm × 100 mm. Figure 8 illustrates schematic diagrams of the different PFC3D models utilized in this study. Three different particle size distributions were considered: dmax/dmin = 1.3, 1.7, and 2.0. The minimum particle size, dmin, was fixed at 1.1 mm. It should be noted that the larger the value of dmax/dmin, the stronger the geometric heterogeneity of the rock.
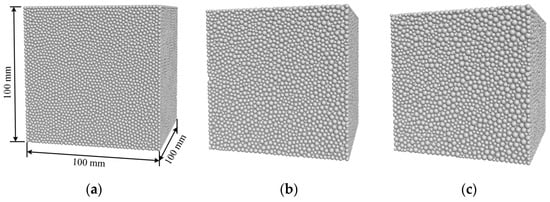
Figure 8.
Schematic diagrams of different particle size distributions: (a) Case I, dmax/dmin = 1.3, (b) Case II, dmax/dmin = 1.7, and (c) Case III, dmax/dmin = 2.0.
In this experiment, the single-sided transient unloading of rock mass excavation was investigated. It is well established that the unloading rates resulting from different methods of cave excavation vary, which in turn affects the distribution and dynamic response characteristics of the surrounding rock. In order to observe the influence of the unloading rate on the energy conversion law during the unloading and damage process of rock excavation, five different unloading rates were set in the numerical simulation: 5 kN/min, 10 kN/min, 25 kN/min, 100 kN/min, and instantaneous unloading.
4.2. Calibration of Micro-Parameters
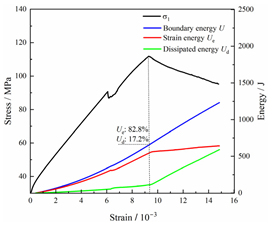
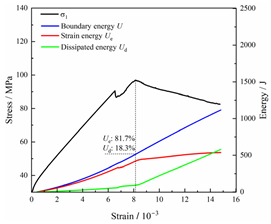
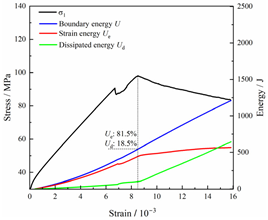
In this study, the triaxial unloading stress–strain curves obtained from laboratory experiments on siltstone were used as a basis for adjusting the micro-parameters. The numerical model used for calibration was a 100 mm cube containing a total of 383,310 particles and 190,168 contact surfaces, with particle radii ranging from 1.1 to 1.9 mm. The micro-parameters were adjusted continuously using a “trial-and-error” method until the macroscopic mechanical parameters produced by the numerical simulation matched those obtained from laboratory experiments. The parameters of the calibrated model are shown in Table 1. Figure 9 compares the stress–strain curves and failure modes obtained from numerical simulations and laboratory experiments. The blue lines indicate shear cracks, while the red portion represents tensile cracks in the numerical model. Figure 9 illustrates that the stress–strain curve of the numerical simulation aligned closely with the experimental curve, and the failure modes were also comparable, indicating that the calibrated micro-parameters in this study effectively reflected the macroscopic mechanical behavior of rock materials in the laboratory. It is noteworthy that during the true triaxial loading–unloading simulation process, the loading was conducted using the force control mechanism built into PFC to align with the experimental setup.

Table 1.
Micro-parameters of the numerical model.
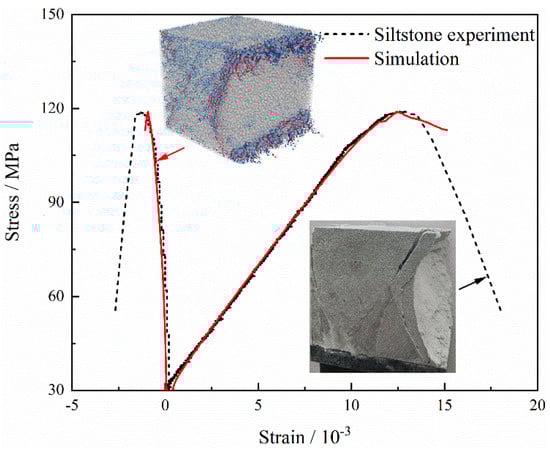
Figure 9.
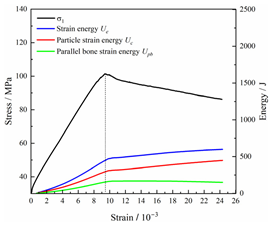
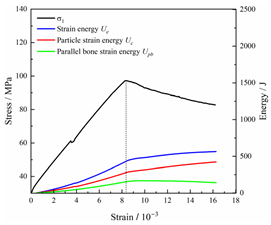
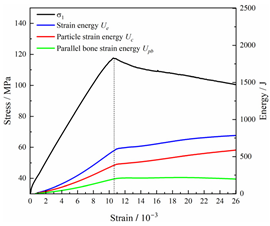
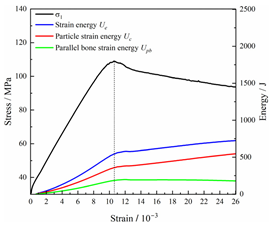
Comparison of stress–strain curve and macro-failure modes between experiment and simulation.
4.3. Energy Mechanism in PFC
The discrete element software PFC enables the tracking of changes in energy storage and release during the simulation process, facilitating a more direct analysis of test results from an energy perspective. The laws of thermodynamics posit that energy conversion is the intrinsic essence of changes in the physical characteristics of matter, and rock damage can be regarded as state instability driven by energy. In the absence of heat exchange with the external environment, the total input strain energy generated by the external force can be absorbed by the rock, resulting in a total absorbed energy, U, as follows:
where represents releasable elastic strain energy, and is the dissipated energy, which is dissipated in the initiation, expansion, and penetration of cracks.
In the PFC program, the boundary energy, U, is defined as the total work performed by the loading plate and wall surface on the specimen. The dissipated energy is comprised of particle kinetic energy, sliding friction energy, and damping energy. The strain energy is further divided into parallel adhesion strain energy, , and particle strain energy, ; that is,
where and represent the number of particle contacts and parallel bonds, respectively. The variable i represents the i-th contact or parallel bond, and are the normal forces of contact and parallel bond, respectively, while and are the tangential forces of contact and parallel bond, respectively. Here, and are the normal stiffnesses of contact and parallel bond, respectively, while and are the tangential stiffnesses of contact and parallel bond, respectively. and are the parallel bond bending moment and torque, A is the cross-sectional area of the parallel bond, and I and J are the moment of inertia and extreme moment of inertia of the parallel bond cross-section, respectively.
4.4. Energy Evolution Analysis
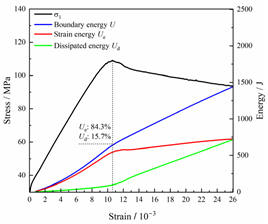
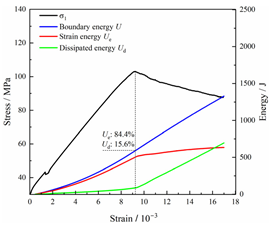
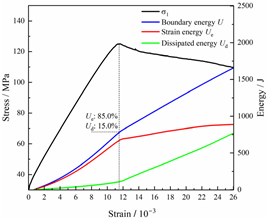
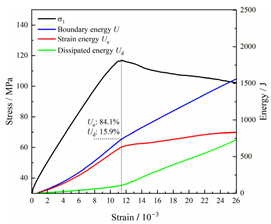
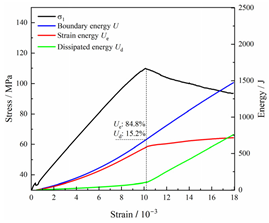
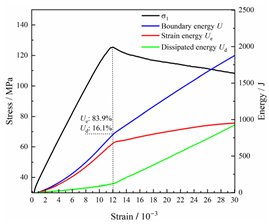
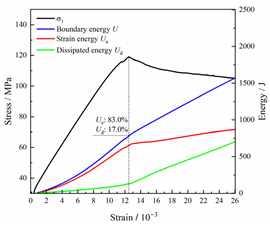
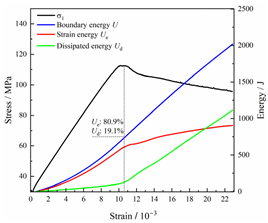
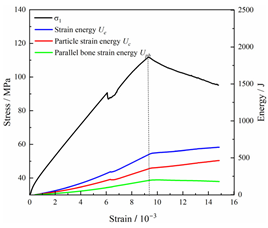
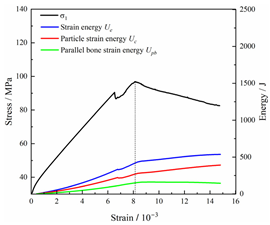
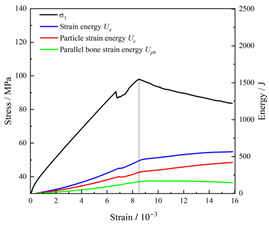
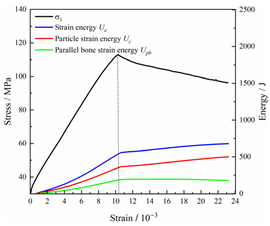
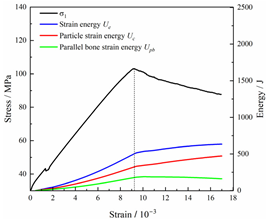
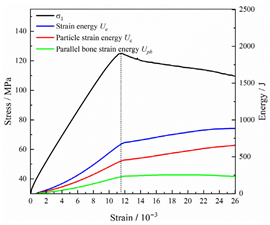
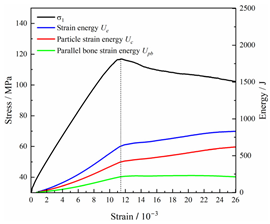
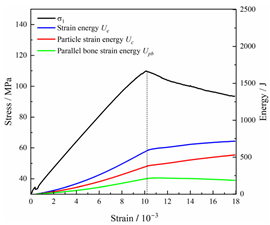
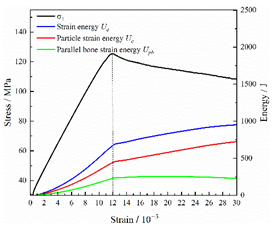
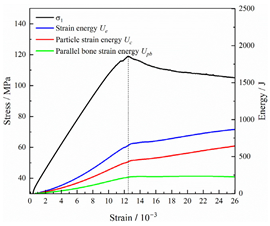
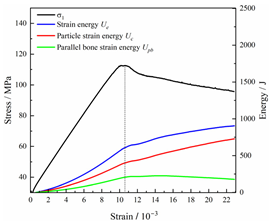
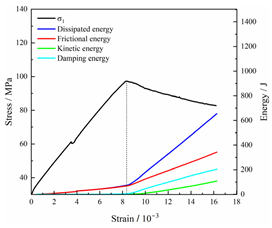
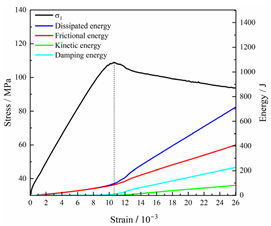
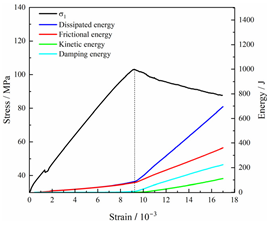
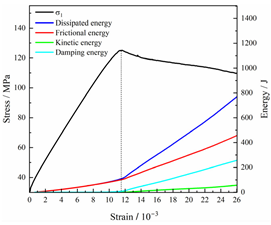
Table 2 depicts the correlation between total energy and stress–strain. From the table, it can be observed that as the unloading rate increased, the stress–strain curve tended to become smoother, indicating a more stable crack development during the failure process. When the unloading rate was low, the stress–strain curve exhibited fluctuations, which may be attributed to frequent local stress fluctuations caused by long-term single-sided unloading and stress concentration, resulting in the degradation of unstable areas and crack propagation. Furthermore, it can be observed from the table that under identical particle size distribution coefficient conditions, the peak strength increased with an increase in the unloading rate. Conversely, under identical unloading rate conditions, peak strength was observed to decline with an increase in the particle size distribution coefficient. For instance, with a particle size distribution coefficient of 1.3, the peak strengths of specimens unloaded at rates of 5 kN/min, 10 kN/min, 25 kN/min, 100 kN/min, and instantaneous unloading were 111.86 MPa, 113.02 MPa, 117.60 MPa, 125.04 MPa, and 125.47 MPa, respectively. When the unloading rate was fixed at 10 kN/min, the peak strengths of specimens with particle size coefficients of 1.3, 1.7, and 2.0 were 113.02 MPa, 101.42 MPa, and 97.29 MPa, respectively.
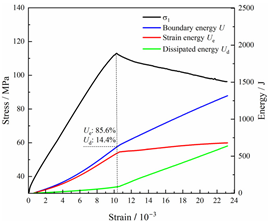
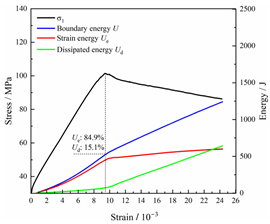
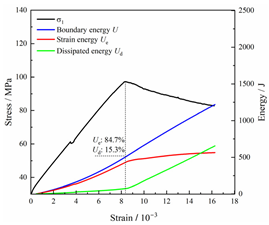
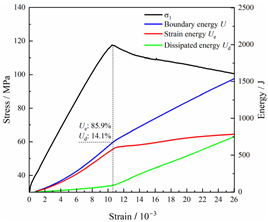
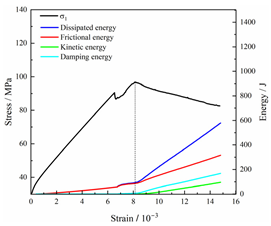
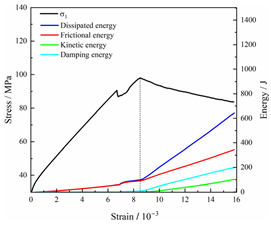
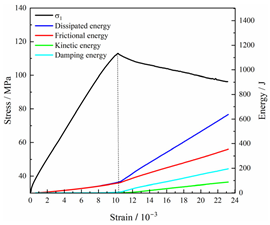
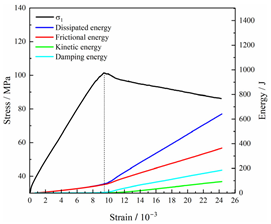
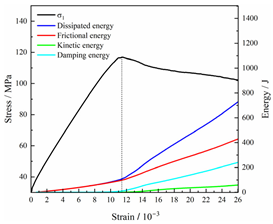
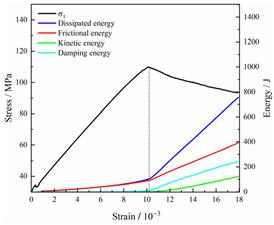
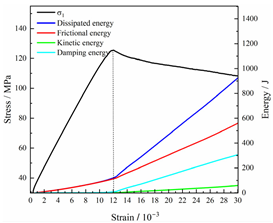
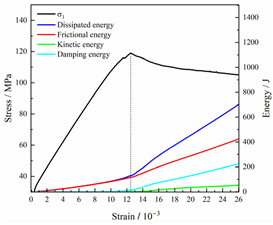
Table 2.
Total energy evolution curves at different unloading rates.
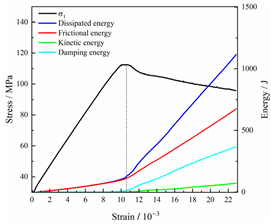
In terms of the real-time evolution curve of total energy, the changes in energy can be classified into two stages: accumulation and release. Prior to reaching the peak strengths of specimens, boundary energy mainly converted into strain energy. Using models with a particle size distribution coefficient of 2.0 as an example, it can be observed that both boundary energy and strain energy showed a nonlinear increasing trend. In the initial loading stage of unloaded rock, the energy accumulation rate was slow, with most of the absorbed energy stored elastically in the rock. Consequently, the growth rate of dissipation energy was lower than that of elastic strain energy, used for microcrack compression and frictional loss. As the loading process continued, the rock entered the stage of elastic deformation, and the slope of the energy change curve gradually increased before stabilizing at a certain level, indicating a stable transitional period of energy in the rock. Approaching the failure stage, numerous microcracks began to form and develop in the rock, with the friction between these new microcracks leading to the release of a significant amount of energy. Consequently, there was a noticeable increase in the growth rate of dissipation energy, and the accumulation rate of elastic strain energy began to slow down. Upon reaching the peak strength load, the specimen began to undergo damage, resulting in a decrease in the rate of elastic strain energy accumulation. In the post-peak stage, there was a rapid increase in dissipation energy, surpassing the growth of strain energy, indicating that the material was undergoing macroscopic structural changes and rapid energy release.
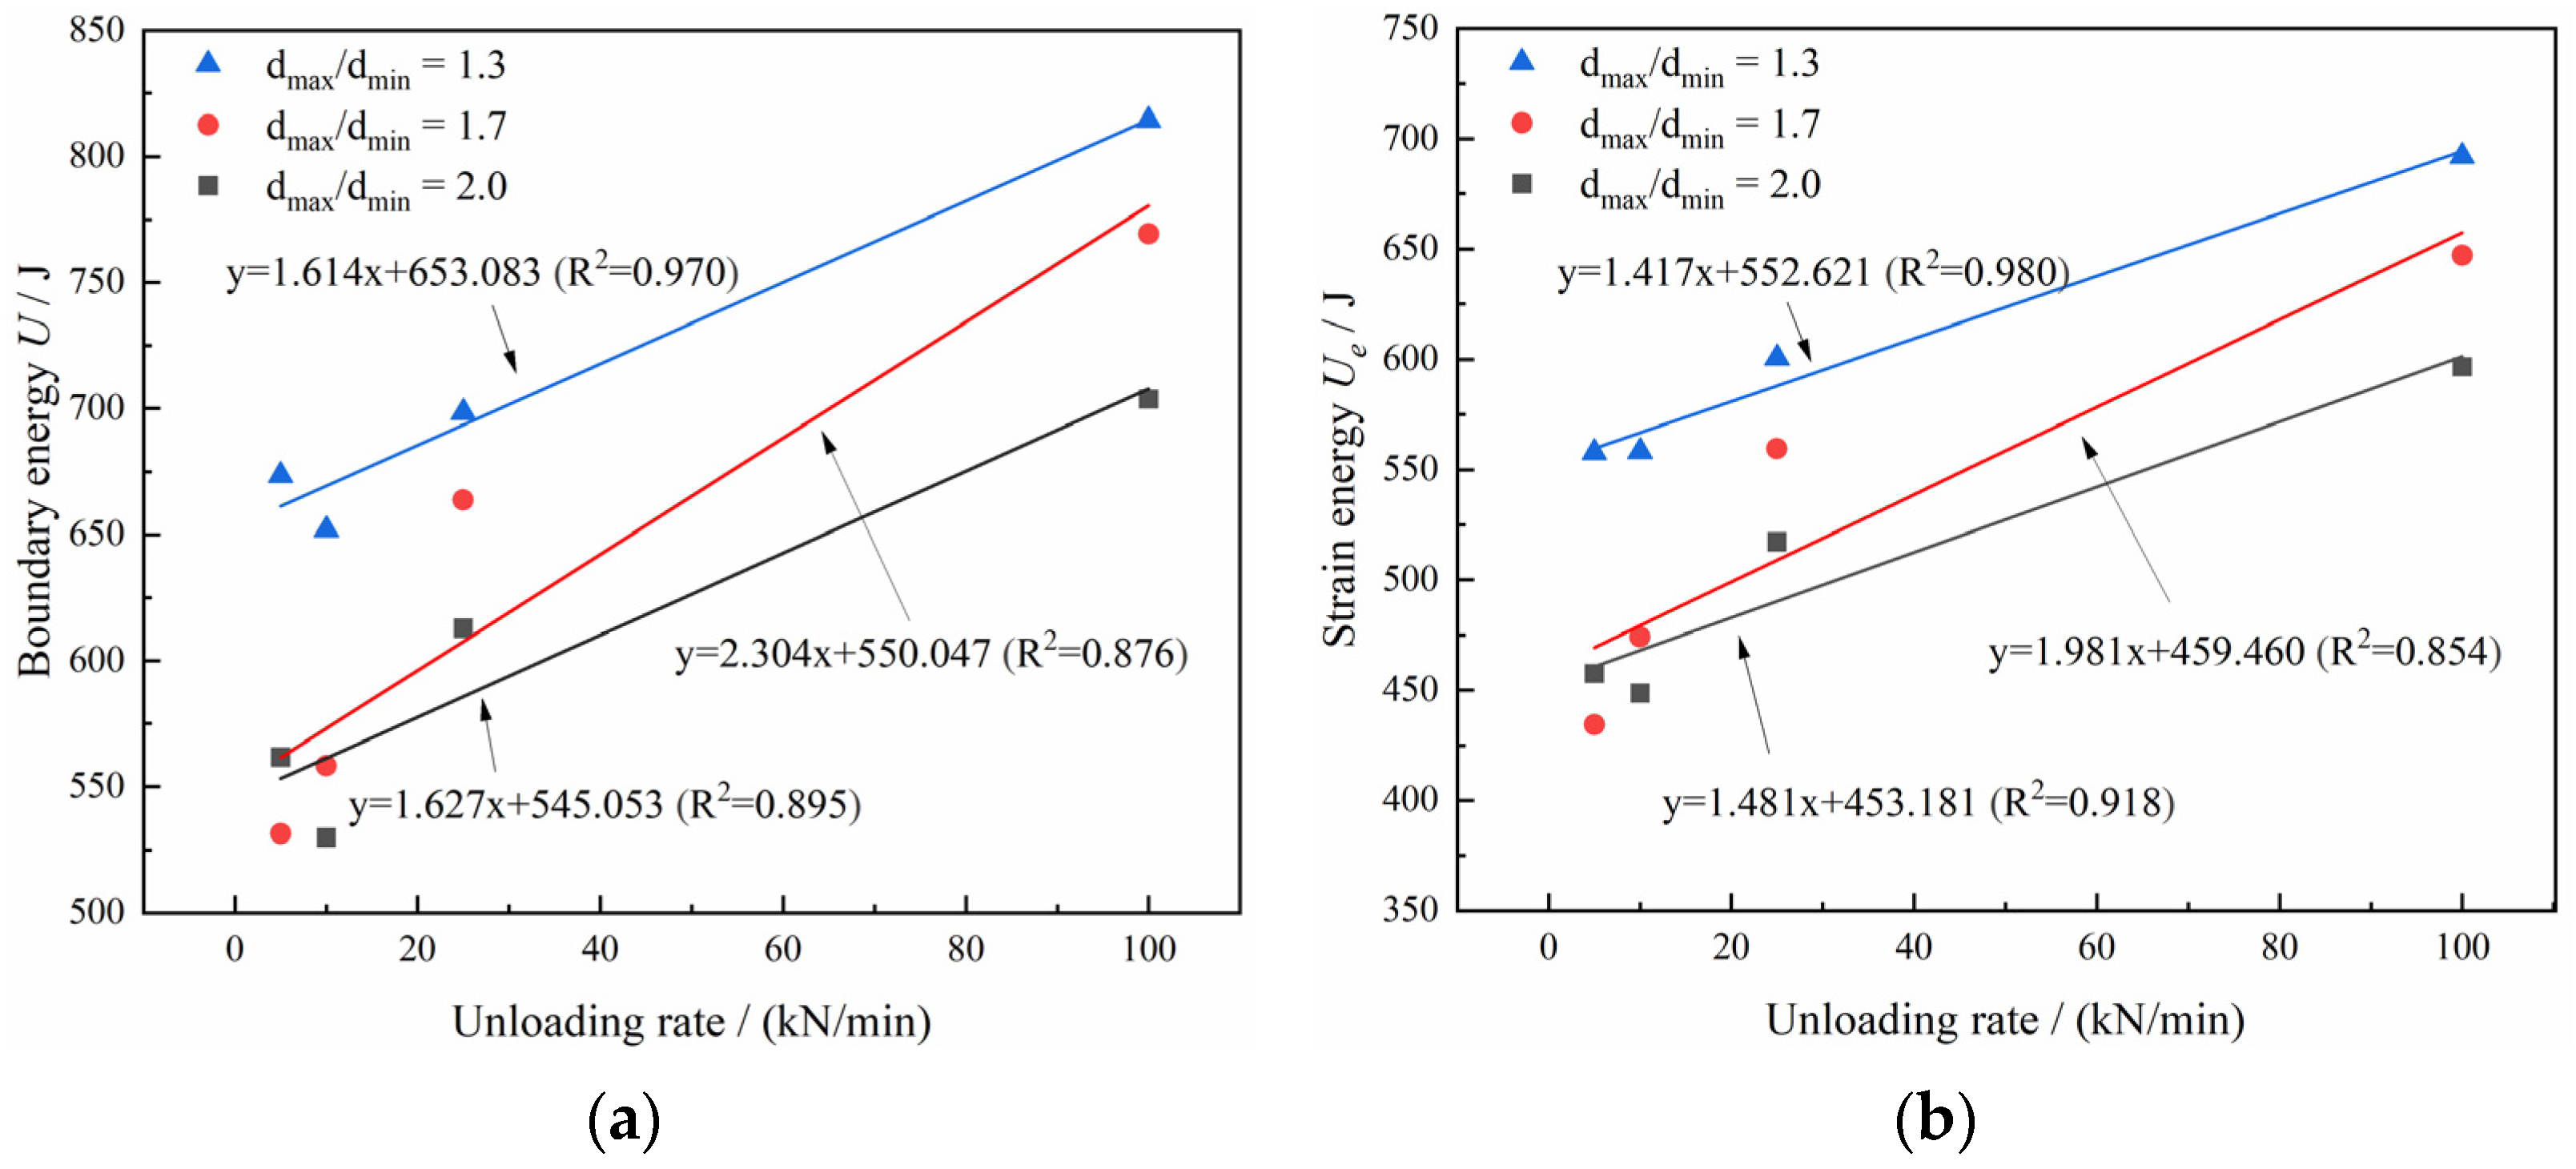
For models with the same grain size coefficient, there was a slight fluctuation in the strain energy proportion at the peak strength point with an increase in unloading rate, showing an overall trend of first increasing and then decreasing. With a fixed unloading rate, an increase in the grain size distribution coefficient of the model resulted in a gradual decrease in strain energy proportion at the peak strength point. While there was little variation in the strain energy proportion at the peak strength among different models, significant changes occurred in the total strain energy, elastic strain energy, and dissipated energy at peak stress. Figure 10 illustrates the relationship between total energy, elastic strain energy, and unloading rate for various grain size distribution coefficient models under peak stress. Under the same grain size distribution coefficient conditions, the total energy and strain energy increased approximately linearly with the increase in unloading rate. This phenomenon is primarily due to rocks experiencing long-term unloading disturbances at low unloading rates, leading to uneven stress changes during unloading, as evidenced by the stress–strain curve. At high unloading rates, the influence of unloading disturbances on the loading process diminished, resulting in more uniform stress adjustment and reduced sudden unstable expansion, leading to less damage to the rocks. Additionally, it can be observed from the graph that, under fixed unloading rates, the grain size distribution coefficient of the model affected the energy evolution characteristics of rock samples. As the heterogeneity of the samples increased, there was a decrease in the total energy and strain energy stored at peak stress.
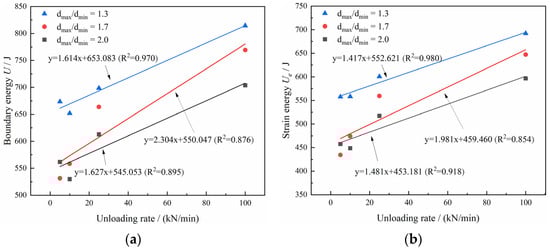
Figure 10.
Variation in energy values with an increasing unloading rate at peak stress for different particle size distribution models: (a) boundary energy and (b) strain energy.
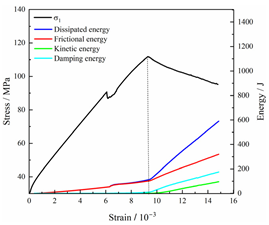
Table 3 and Table 4 exhibit the evolution curves of strain energy and dissipation energy at various unloading rates. It is noticeable from the tables that strain energy was predominantly stored and accumulated in the form of particle contact strain energy and parallel bond strain energy. Once the peak strength was reached, the parallel bond strain energy was released before the particle contact strain energy, indicating that the parallel bond strain energy between particles must be overcome before microcracks develop. Subsequently, microcracks expanded under the influence of particle contact strain energy. The frictional energy increased with the degree of frictional slip of the microcracks and increased steeply at the peak stress point due to macroscopic crack penetration. Prior to the peak stress point, dissipation energy consisted mainly of frictional energy, with damping energy and kinetic energy being negligible. After peak stress, the dominance of frictional energy in dissipation energy persisted owing to the significant increase in the number of microcracks and their propagation and penetration. Moreover, both damping energy and kinetic energy showed a rapid growth trend. Furthermore, for different particle size distribution coefficient models, it was observed that the dissipated energy increased with the increase of the unloading rate. Specifically, frictional energy was positively correlated with the unloading rate, while kinetic energy was negatively correlated with it. For instance, in a model with a coefficient of 1.4, at 85% of the peak strength in the post-peak stage, the corresponding frictional energies for unloading rates of 5 kN/min, 10 kN/min, 25 kN/min, 100 kN/min, and instantaneous unloading were 319.9 J, 355.1 J, 455.1 J, 540.4 J, and 609.1 J, respectively, and the corresponding kinetic energies were 95.2 J, 87.2 J, 80.9 J, 76.6 J, and 67.2 J. This indicates that the more kinetic energy was converted into particles and rock block ejection, the less fully developed the cracks in the specimen were. Under a fixed unloading rate, frictional energy decreased with an increase in the rock particle size distribution coefficient, while kinetic energy increased with it. This suggests that the heterogeneity of rocks had a significant impact on the distribution of dissipative energy.
Table 3.
Strain energy evolution curves at different unloading rates.
Table 4.
Dissipated energy evolution curves at different unloading rates.
5. Discussion
- Rocks are formed by the mutual adhesion of internal mineral particles, and the geometric and mechanical characteristics of mineral particles and adhesion, including particle size, shape, arrangement, adhesion contact relationships, adhesion fracture criteria, etc., determine the macro-mechanical properties of rock media, such as fracture characteristics. This study examined how micro-factors influence the mechanical properties and energy evolution of rocks under true triaxial unloading paths, with a focus on particle size distribution. Due to the complexity of micro-factors, further discussion is needed on spatial factors, such as mineral composition, adhesion contact relationships, and adhesion fracture criteria, not covered in this paper, as these variations in micro-factors have a significant impact on macro-mechanical properties.
- The mechanical properties and failure process of rock samples can be affected by several factors, including intermediate principal stress, unloading stress level, and unloading rate. Previous studies have indicated that as the unloading rate decreases, the peak strength of rocks and particle ejection kinetic energy decrease. This study reached a conclusion that is entirely at odds with previous findings. The discrepancy can be attributed to the unloading level. The unloading level selected for this study was below the rock’s damage stress, and single-sided unloading did not result in rock failure. The failure of the rocks occurred when the axial pressure continued to increase after unloading. Consequently, the impact of the unloading level will be the focus of the next stage of research.
6. Conclusions
This research primarily investigated the mechanical characteristics and energy evolution laws of rocks under true triaxial unloading conditions. Coal, sandstone, and siltstone were chosen as representative rock types for the true triaxial single-sided unloading tests conducted along the vertical loading–horizontal constant load–radial unloading path using a true triaxial disturbance unloading rock testing system. Furthermore, the influence of rock particle size distribution and the unloading rate on energy evolution under true triaxial single-sided unloading was investigated using PFC3D. The findings of this study led to the following conclusions:
- The stress–strain curves and failure modes of different types of rocks varied significantly under true triaxial unloading conditions. In this study, coal had the lowest peak strength and suffered the most severe damage, while sandstone had the highest peak strength and a more intact failure mode. The peak strength of rocks was negatively correlated with fractal dimension, meaning that rocks with lower peak strength exhibited larger final fractal dimensions of fragments and higher degrees of fragmentation.
- The unloading rate had a significant impact on the mechanical behavior and energy evolution of rocks. As the unloading rate increased, the peak strength, total energy, strain energy, and dissipation energy of rocks all showed an upward trend. It was noted that frictional energy played a key role in dissipation energy, with frictional energy positively correlated with the unloading rate, while kinetic energy was negatively correlated with the unloading rate. Additionally, under the same particle size distribution coefficient conditions, the total energy and strain energy of rocks approximately increased linearly with the increasing unloading rate.
- The heterogeneity of rocks played a crucial role in influencing the energy evolution characteristics of rock samples. As the heterogeneity of the sample increased, the total energy and strain energy stored at peak stress decreased. Additionally, the heterogeneity of rocks had a considerable influence on the distribution of dissipated energy. The frictional energy of a rock sample decreased as the grain size distribution coefficient increased, while the kinetic energy of the same sample increased as the grain size distribution coefficient increased.
Author Contributions
C.P., conceptualization, methodology, formal analysis, writing—original draft preparation; C.L., investigation, data curation, formal analysis, writing—review and editing; G.Z., resources, writing—review and editing, project administration, funding acquisition; W.Y., software, validation, formal analysis; X.W., resources, writing—review and editing; X.M., supervision. All authors have read and agreed to the published version of the manuscript.
Funding
This research was funded by the Natural Science Research Project of Anhui Educational Committee (2023AH051227), the National Natural Science Foundation of China (52304075 and 51974009), the Scientific Research Foundation for High-level Talents of Anhui University of Science and Technology (2022yjrc80), the University Synergy Innovation Program of Anhui Province (GXXT-2021-075), the Anhui Provincial Major Science and Technology Project (202203a07020011), the China Postdoctoral Science Foundation (2023M742141), and the State Key Laboratory of Strata Intelligent Control and Green Mining, Co-founded by Shandong Province and the Ministry of Science and Technology, Shandong University of Science and Technology (SICGM202402).
Data Availability Statement
The data produced and/or evaluated in this study can be obtained from the corresponding author upon request.
Conflicts of Interest
The authors declare no conflicts of interest.
References
- Liu, C.; Zhao, G.; Xu, W.; Meng, X.; Liu, Z.; Cheng, X.; Lin, G. Experimental Study on Failure Characteristics of Single-Sided Unloading Rock under Different Intermediate Principal Stress Conditions. Int. J. Min. Sci. Technol. 2023, 33, 275–287. [Google Scholar] [CrossRef]
- Akdag, S.; Karakus, M.; Taheri, A.; Nguyen, G.; He, M.C. Effects of Thermal Damage on Strain Burst Mechanism for Brittle Rocks Under True-Triaxial Loading Conditions. Rock Mech. Rock Eng. 2018, 51, 1657–1682. [Google Scholar] [CrossRef]
- Faradonbeh, R.S.; Taheri, A.; Sousa, L.R.; Karakus, M. Rockburst assessment in deep geotechnical conditions using true-triaxial tests and data-driven approaches. Int. J. Rock Mech. Min. 2020, 128, 104279. [Google Scholar] [CrossRef]
- He, M.C.; Zhao, F.; Cai, M.; Du, S. A Novel Experimental Technique to Simulate Pillar Burst in Laboratory. Rock Mech. Rock Eng. 2015, 48, 1833–1848. [Google Scholar] [CrossRef]
- Feng, X.T.; Xu, H.; Yang, C.; Zhang, X.; Gao, Y. Influence of Loading and Unloading Stress Paths on the Deformation and Failure Features of Jinping Marble Under True Triaxial Compression. Rock Mech. Rock Eng. 2020, 53, 3287–3301. [Google Scholar] [CrossRef]
- Li, X.; Feng, F.; Li, D.; Du, K.; Ranjith, P.G.; Rostami, J. Failure Characteristics of Granite Influenced by Sample Height-to-Width Ratios and Intermediate Principal Stress Under True-Triaxial Unloading Conditions. Rock Mech. Rock Eng. 2018, 51, 1321–1345. [Google Scholar] [CrossRef]
- Zhao, X.G.; Wang, J.; Cai, M.; Cheng, C.; Ma, L.K.; Su, R.; Zhao, F.; Li, D.J. Influence of Unloading Rate on the Strainburst Characteristics of Beishan Granite under True-Triaxial Unloading Conditions. Rock Mech. Rock Eng. 2014, 47, 467–483. [Google Scholar] [CrossRef]
- Du, K.; Tao, M.; Li, X.B.; Zhou, J. Experimental Study of Slabbing and Rockburst Induced by True-Triaxial Unloading and Local Dynamic Disturbance. Rock Mech. Rock Eng. 2016, 49, 3437–3453. [Google Scholar] [CrossRef]
- Si, X.; Gong, F. Strength-Weakening Effect and Shear-Tension Failure Mode Transformation Mechanism of Rockburst for Fine-Grained Granite under Triaxial Unloading Compression. Int. J. Rock Mech. Min. 2020, 131, 104347. [Google Scholar] [CrossRef]
- Tang, L.; Tu, S.; Tu, H.; Miao, K.; Li, W.; Zhao, H.; Ma, J.; Zhang, L. Compressive Failure Characteristics of a Coal–Rock Combination at Different Angles: Experimental Study and Fractal Analysis. Fractal Fract. 2024, 8, 240. [Google Scholar] [CrossRef]
- Ruiz-Carulla, R.; Corominas, J. Analysis of Rockfalls by Means of a Fractal Fragmentation Model. Rock Mech. Rock Eng. 2020, 53, 1433–1455. [Google Scholar] [CrossRef]
- Kruhl, J.H. Fractal-Geometry Techniques in the Quantification of Complex Rock Structures: A Special View on Scaling Regimes, Inhomogeneity and Anisotropy. J. Struct. Geol. 2013, 46, 2–21. [Google Scholar] [CrossRef]
- Zhang, Z.; Wang, E.; Li, N. Fractal Characteristics of Acoustic Emission Events Based on Single-Link Cluster Method during Uniaxial Loading of Rock. Chaos Solitons Fractals 2017, 104, 298–306. [Google Scholar] [CrossRef]
- Zhou, J.; Xu, W.; Zhao, G.; Meng, X.; Li, Y.; Wu, X.; Li, Y.; Cheng, X. Energy Evolution Law and Fractal Characteristics of Different Rock Specimen Sizes on Dynamic Compression. Geofluids 2022, 2022, 5339603. [Google Scholar] [CrossRef]
- Li, M.X.; Song, Y.H.; Zhang, G. Study on the Fractal Characteristics of Rock in the Prediction of Rockburst. RSC Adv. 2017, 7, 43073–43082. [Google Scholar] [CrossRef]
- Kong, X.; Wang, E.; Hu, S.; Shen, R.; Li, X.; Zhan, T. Fractal Characteristics and Acoustic Emission of Coal Containing Methane in Triaxial Compression Failure. J. Appl. Geophys. 2016, 124, 139–147. [Google Scholar] [CrossRef]
- Li, J.C.; Li, H.B.; Zhao, J. An Improved Equivalent Viscoelastic Medium Method for Wave Propagation across Layered Rock Masses. Int. J. Rock Mech. Min. 2015, 73, 62–69. [Google Scholar] [CrossRef]
- Xie, H.; Li, L.; Peng, R.; Ju, Y. Energy Analysis and Criteria for Structural Failure of Rocks. J. Rock Mech. Geotech. 2009, 1, 11–20. [Google Scholar] [CrossRef]
- Li, D.; Sun, Z.; Xie, T.; Li, X.; Ranjith, P.G. Energy Evolution Characteristics of Hard Rock during Triaxial Failure with Different Loading and Unloading Paths. Eng. Geol. 2017, 228, 270–281. [Google Scholar] [CrossRef]
- Zhang, L.; Cong, Y.; Meng, F.; Wang, Z.; Zhang, P.; Gao, S. Energy Evolution Analysis and Failure Criteria for Rock under Different Stress Paths. Acta Geotech. 2021, 16, 569–580. [Google Scholar] [CrossRef]
- Meng, Y.; Jing, H.; Liu, X.; Yin, Q. Effects of Initial Unloading Level on the Mechanical, Micro Failure and Energy Evolution Characteristics of Stratified Rock Mass under Triaxial Unloading Confining Pressure. Theor. Appl. Fract. Mech. 2023, 128, 104161. [Google Scholar] [CrossRef]
- Su, G.; Jiang, J.; Zhai, S.; Zhang, G. Influence of Tunnel Axis Stress on Strainburst: An Experimental Study. Rock Mech. Rock Eng. 2017, 50, 1551–1567. [Google Scholar] [CrossRef]
- Sun, F.; Guo, J.; Liu, X.; Zhang, H. Strain Rockburst Evolution Process under True Triaxial Condition with Single Face Unloading Due to Tunnel Excavation. Comput. Geotech. 2023, 159, 105465. [Google Scholar] [CrossRef]
- Gu, L.; Feng, X.T.; Kong, R.; Yang, C.; Han, Q.; Xia, Y. Excavation Stress Path Induced Fracturing Mechanism of Hard Rock in Deep Tunnel. Rock Mech. Rock Eng. 2023, 56, 1779–1806. [Google Scholar] [CrossRef]
- Li, Y.; Zhang, S.; Zhang, X. Classification and Fractal Characteristics of Coal Rock Fragments under Uniaxial Cyclic Loading Conditions. Arab. J. Geosci. 2018, 11, 201. [Google Scholar] [CrossRef]
- Li, R.; Zhu, P.; Li, S.; Ding, C.; Lu, W.; Liu, Y. Fractal Behavior of Size Distribution and Specific Surface Area of Blasting Fragments. Appl. Sci. 2023, 13, 11832. [Google Scholar] [CrossRef]
- Pan, C.; Li, X.; Li, J.; Zhao, J. Numerical Investigation of Blast-Induced Fractures in Granite: Insights from a Hybrid LS-DYNA and UDEC Grain-Based Discrete Element Method. Geomech. Geophys. Geo-Energy Geo-Resour. 2021, 7, 49. [Google Scholar] [CrossRef]
- Wang, X.; Li, J.; Zhao, X.; Liang, Y. Propagation Characteristics and Prediction of Blast-Induced Vibration on Closely Spaced Rock Tunnels. Tunn. Undergr. Space Technol. 2022, 123, 104416. [Google Scholar] [CrossRef]
- Yan, Y.; Li, J.; Fukuda, D.; Liu, H. Experimental and Numerical Studies on Dynamic Fracturing Behavior of Roughly Jointed Rock. In Computational Particle Mechanics; Springer: Berlin/Heidelberg, Germany, 2024. [Google Scholar] [CrossRef]
- Ao, Y.; Jia, B.; Sun, C.; Liu, F. Fracture Characteristics and Energy Evolution Analysis of Pre-Cracked Granite under Uniaxial Compression Based on a 3D-Clump Model. Theor. Appl. Fract. Mech. 2023, 124, 103756. [Google Scholar] [CrossRef]
- Pan, C.; Li, X.; He, L.; Li, J. Study on the Effect of Micro-Geometric Heterogeneity on Mechanical Properties of Brittle Rock Using a Grain-Based Discrete Element Method Coupling with the Cohesive Zone Model. Int. J. Rock Mech. Min. 2021, 140, 104680. [Google Scholar] [CrossRef]
- Pan, C.; Zhao, G.; Meng, X.; Dong, C.; Gao, P. Numerical Investigation of the Influence of Mineral Mesostructure on Quasi-Static Compressive Behaviors of Granite Using a Breakable Grain-Based Model. Front. Ecol. Evol. 2023, 11, 1288870. [Google Scholar] [CrossRef]
- Blair, S.C.; Cook, N.G.W. Analysis of Compressive Fracture in Rock Using Statistical Techniques: Part II. Effect of Microscale Heterogeneity on Macroscopic Deformation. Int. J. Rock Mech. Min. 1998, 35, 849–861. [Google Scholar] [CrossRef]
- Cundall, P.A.; Strack, O.D.L. A Discrete Numerical Model for Granular Assemblies. Geotechnique 1979, 29, 47–65. [Google Scholar] [CrossRef]
- Yuan, W.; Cheng, Y.; Min, M.; Wang, X. Study on Acoustic Emission Characteristics during Shear Deformation of Rock Structural Planes Based on Particle Flow Code. Comput. Part. Mech. 2024, 11, 105–118. [Google Scholar] [CrossRef]


Disclaimer/Publisher’s Note: The statements, opinions and data contained in all publications are solely those of the individual author(s) and contributor(s) and not of MDPI and/or the editor(s). MDPI and/or the editor(s) disclaim responsibility for any injury to people or property resulting from any ideas, methods, instructions or products referred to in the content. |
© 2024 by the authors. Licensee MDPI, Basel, Switzerland. This article is an open access article distributed under the terms and conditions of the Creative Commons Attribution (CC BY) license (https://creativecommons.org/licenses/by/4.0/).