Abstract
In regions with sandy soft soil strata, the subway foundation commonly undergoes freeze–thaw cycles during construction. This study focuses on analyzing the microstructural and fractal characteristics of frozen–thawed sandy soft soil to improve our understanding of its strength behavior and stability. Pore size distribution curves before and after freeze–thaw cycles were examined using nuclear magnetic resonance technology. Additionally, fractal theory was applied to illustrate the soil’s fractal properties. The strength properties of frozen remolded clay under varying freezing temperatures and sand contents were investigated through uniaxial compression tests, indicating that soil strength is significantly influenced by fractal dimensions. The findings suggest that lower freezing temperatures lead to a more dispersed soil skeleton, resulting in a higher fractal dimension for the frozen–thawed soil. Likewise, an increase in sand content enlarges the soil pores and the fractal dimension of the frozen–thawed soil. Furthermore, an increase in fractal dimension caused by freezing temperatures results in increased soil strength, while an increase in fractal dimension due to changes in sand content leads to a decrease in soil strength.
1. Introduction
It is essential to investigate the microstructural characteristics of sandy soft soil for several reasons [1]. The Yangtze River Delta region in China is characterized by extensive soft soil strata that have developed into sand interlayers due to repeated wave activity. The artificial ground freezing method is commonly used in subway construction through these sandy soft soil layers [2,3,4,5,6], as it minimizes construction disturbance, effectively isolates groundwater, and prevents sand and water ingress. However, the freeze–thaw process damages the soil’s microstructure, leading to significant settlement that can affect subway operation safety. To clarify the effects of freeze–thaw action, Zhou et al. [7,8] investigated the freeze–thaw properties of soft clay under seepage conditions in composite strata. Kong et al. [9] examined the pore structures of marine soft soils under various freezing conditions. Yao et al. [10] conducted uniaxial compressive strength tests on artificially frozen soft soil, clarifying the impact of freezing temperatures on uniaxial compressive strength. The results show that freezing damage rearranges the soil’s internal microstructure, resulting in diminished strength and stability, consequently leading to uneven foundation settlements [11,12,13,14,15,16].
The concept of fractals was introduced in 1975 by the American scholar Mandelbrot, who focused on the study of irregular geometric shapes characterized by their self-similarity [17,18]. Prior research has confirmed that pore distributions exhibit self-similarity, and the pore structures of porous media manifest fractal characteristics, making them amenable to analysis through fractal theory [19,20,21,22,23,24]. Currently, the characterization of pore structures and fractal dimensions is primarily conducted using techniques such as scanning electron microscopy (SEM) [25], mercury intrusion porosimetry (MIP) [26], transmission electron microscopy (TEM) [27], X-ray microtomography [28], nitrogen adsorption [29], and nuclear magnetic resonance (NMR) [30]. Zhu et al. [31] investigated the pore structure of modified sandy soil using SEM, demonstrating that multiple fractal parameters can effectively describe the variations in pore characteristics and quantify the features of the pore structure in modified sandy soils. Kong et al. [32] acquired the pore size distribution (PSD) of freeze–thaw soft soil using NMR and SEM, and subsequently employed fractal theory to clarify the fractal characteristics of the PSD. He et al. [33] performed NMR tests to examine the influence of grain size on the microstructural pore characteristics and fractal features of carbonate-based and silicate-based sands, discovering that larger grain sizes correspond to increased maximum pore sizes and fractal dimensions. Ferreiro et al. [34] used MIP and nitrogen adsorption to investigate PSD across various equivalent pore size ranges, proposing that multifractal methods are suitable for characterizing the heterogeneity of the soil pore system. The integration of multiple methods by researchers not only facilitates a comprehensive understanding of the soil’s microstructure from diverse perspectives but also significantly enhances the accuracy and depth of the studies [35,36]. These studies mainly focus on the fractal characteristics of pure soft soil, providing theoretical support for subway construction using artificial ground freezing (AGF) in soft soil.
In view of the lack of research on the micro-pore structure of sandy soft soil, this study focuses on examining sandy soft soil using NMR technology to analyze the pore size distribution curves and their variations before and after freeze–thaw cycles. Fractal theory is also applied to characterize the soil’s fractal properties. Additionally, unconfined compressive strength tests are conducted to determine the impact of fractal dimensions on the strength properties of frozen remolded clay under different freezing temperatures and sand contents. The research results can serve as a reliable basis for predicting the structural damage of frozen and thawed soil under freezing method construction conditions, which can help to investigate the law of the inhomogeneous settlement of metro lines in the Yangtze River Delta region.
2. Materials and Methods
2.1. Experimental Materials
Soft clay samples taken from Zijingang Campus of Zhejiang University, located in Hangzhou City, Zhejiang Province, China. The basic physical properties of the soft soil and the incorporated sand were determined through indoor geotechnical testing, as shown in Table 1 and Table 2.

Table 1.
Basic physical indices of soft soil.
Table 2.
Basic physical indices of sand.
2.2. Experimental Design and Sample Preparation
This study examines the impacts of freezing temperature and sand content on the micro-mechanisms and mechanical properties through a single-factor experimental design, where all other parameters remain constant, while one variable is changed to assess its influence. Samples were prepared with varying sand content configurations, as detailed in Table 3. Reflecting real-world construction conditions, a freezing temperature gradient of 5 °C was established, with soil samples subjected to freezing at −5 °C, −10 °C, −15 °C, and −20 °C, to investigate the varying impacts of freezing temperatures on soil performance, as specified in Table 4. In the table, sample identifiers such as S0 and T-5 correspond to 0% sand content and a temperature of −5 °C, respectively, with other identifiers following a similar notation.
Table 3.
Sand content variation experimental plan.
Table 4.
Temperature variation experimental plan.
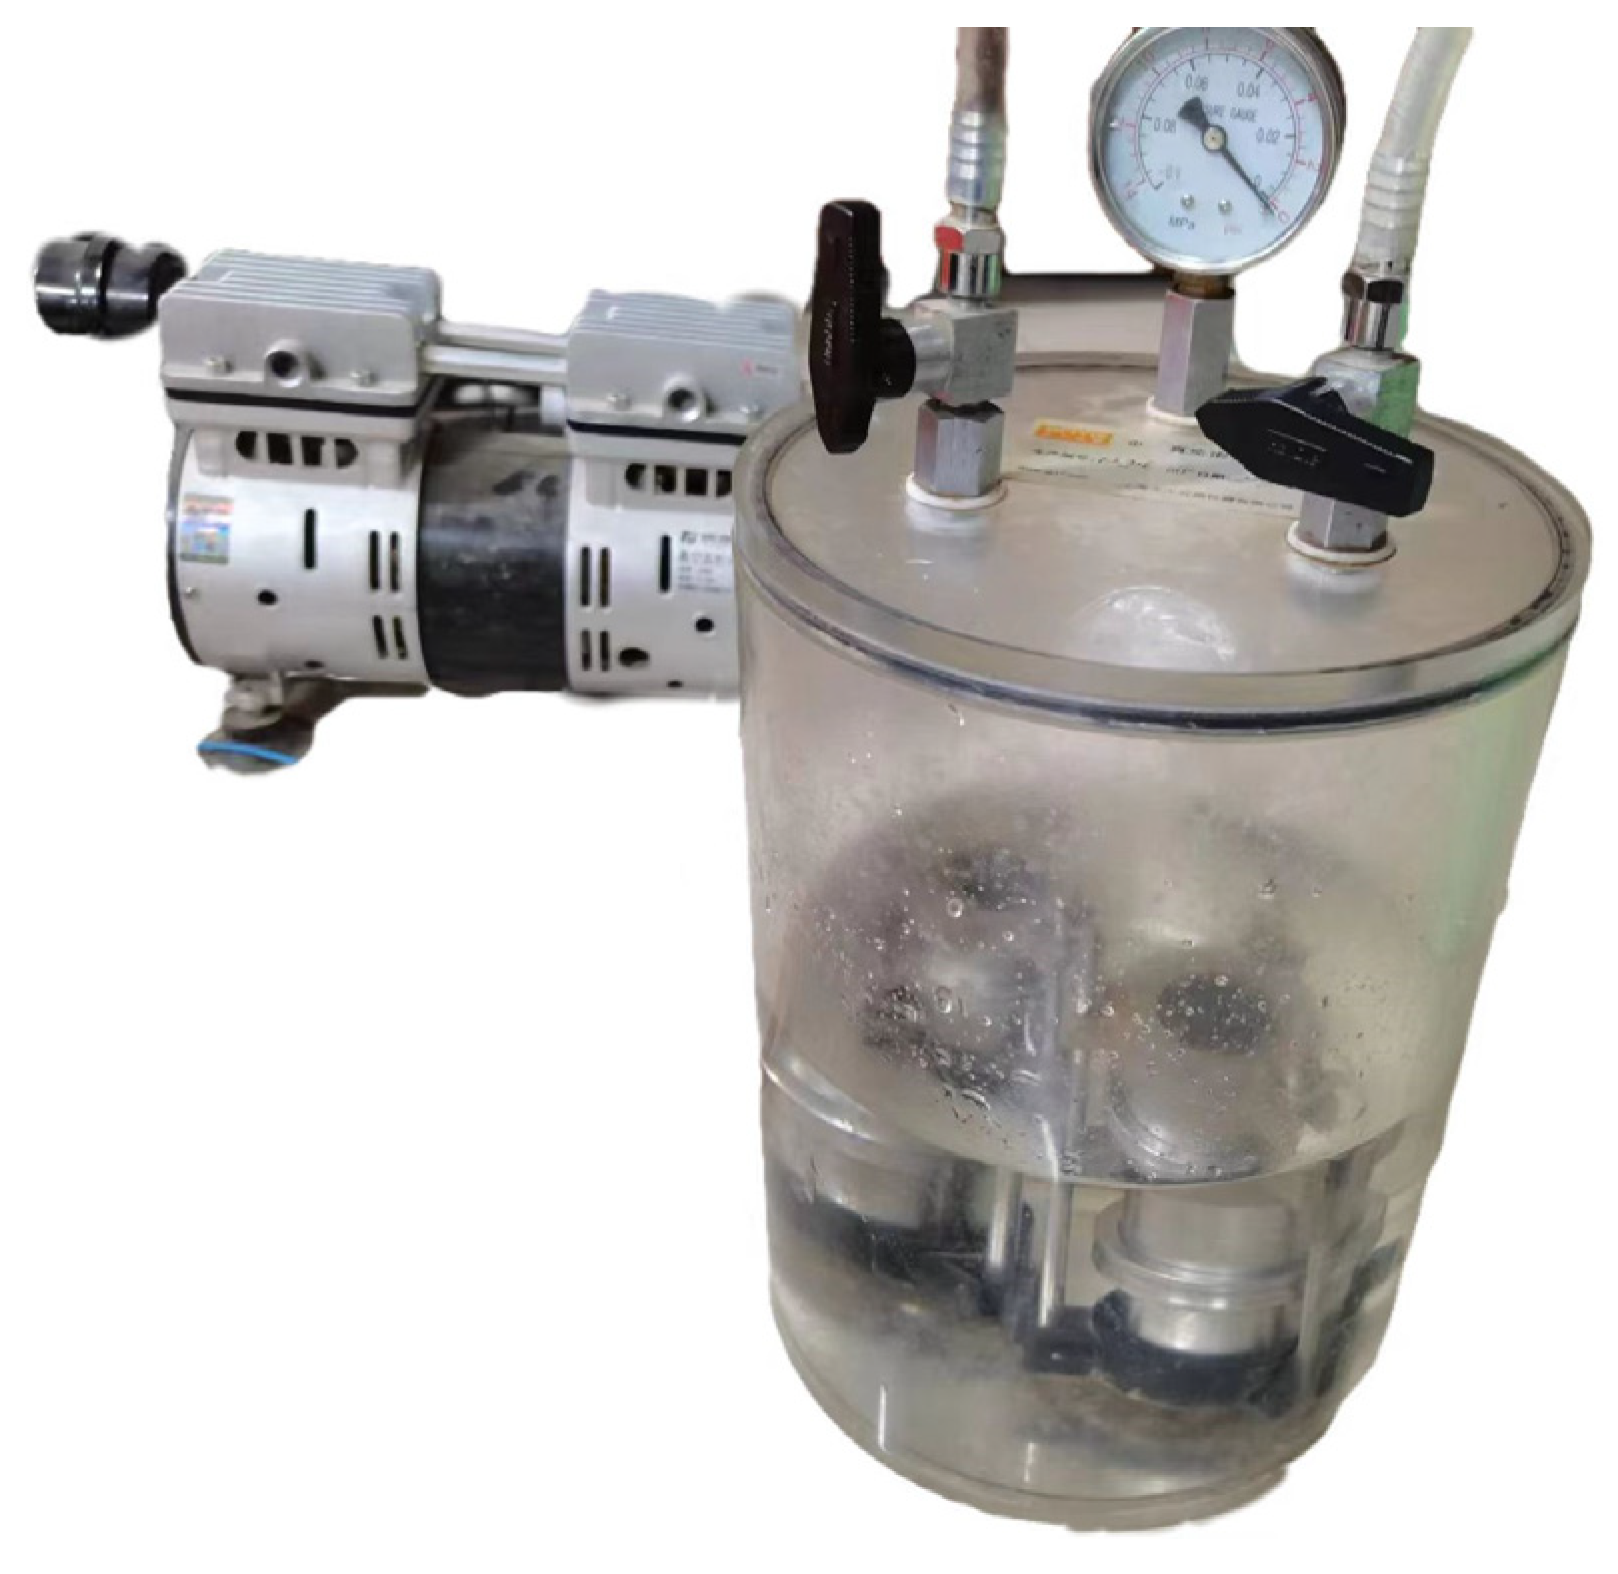
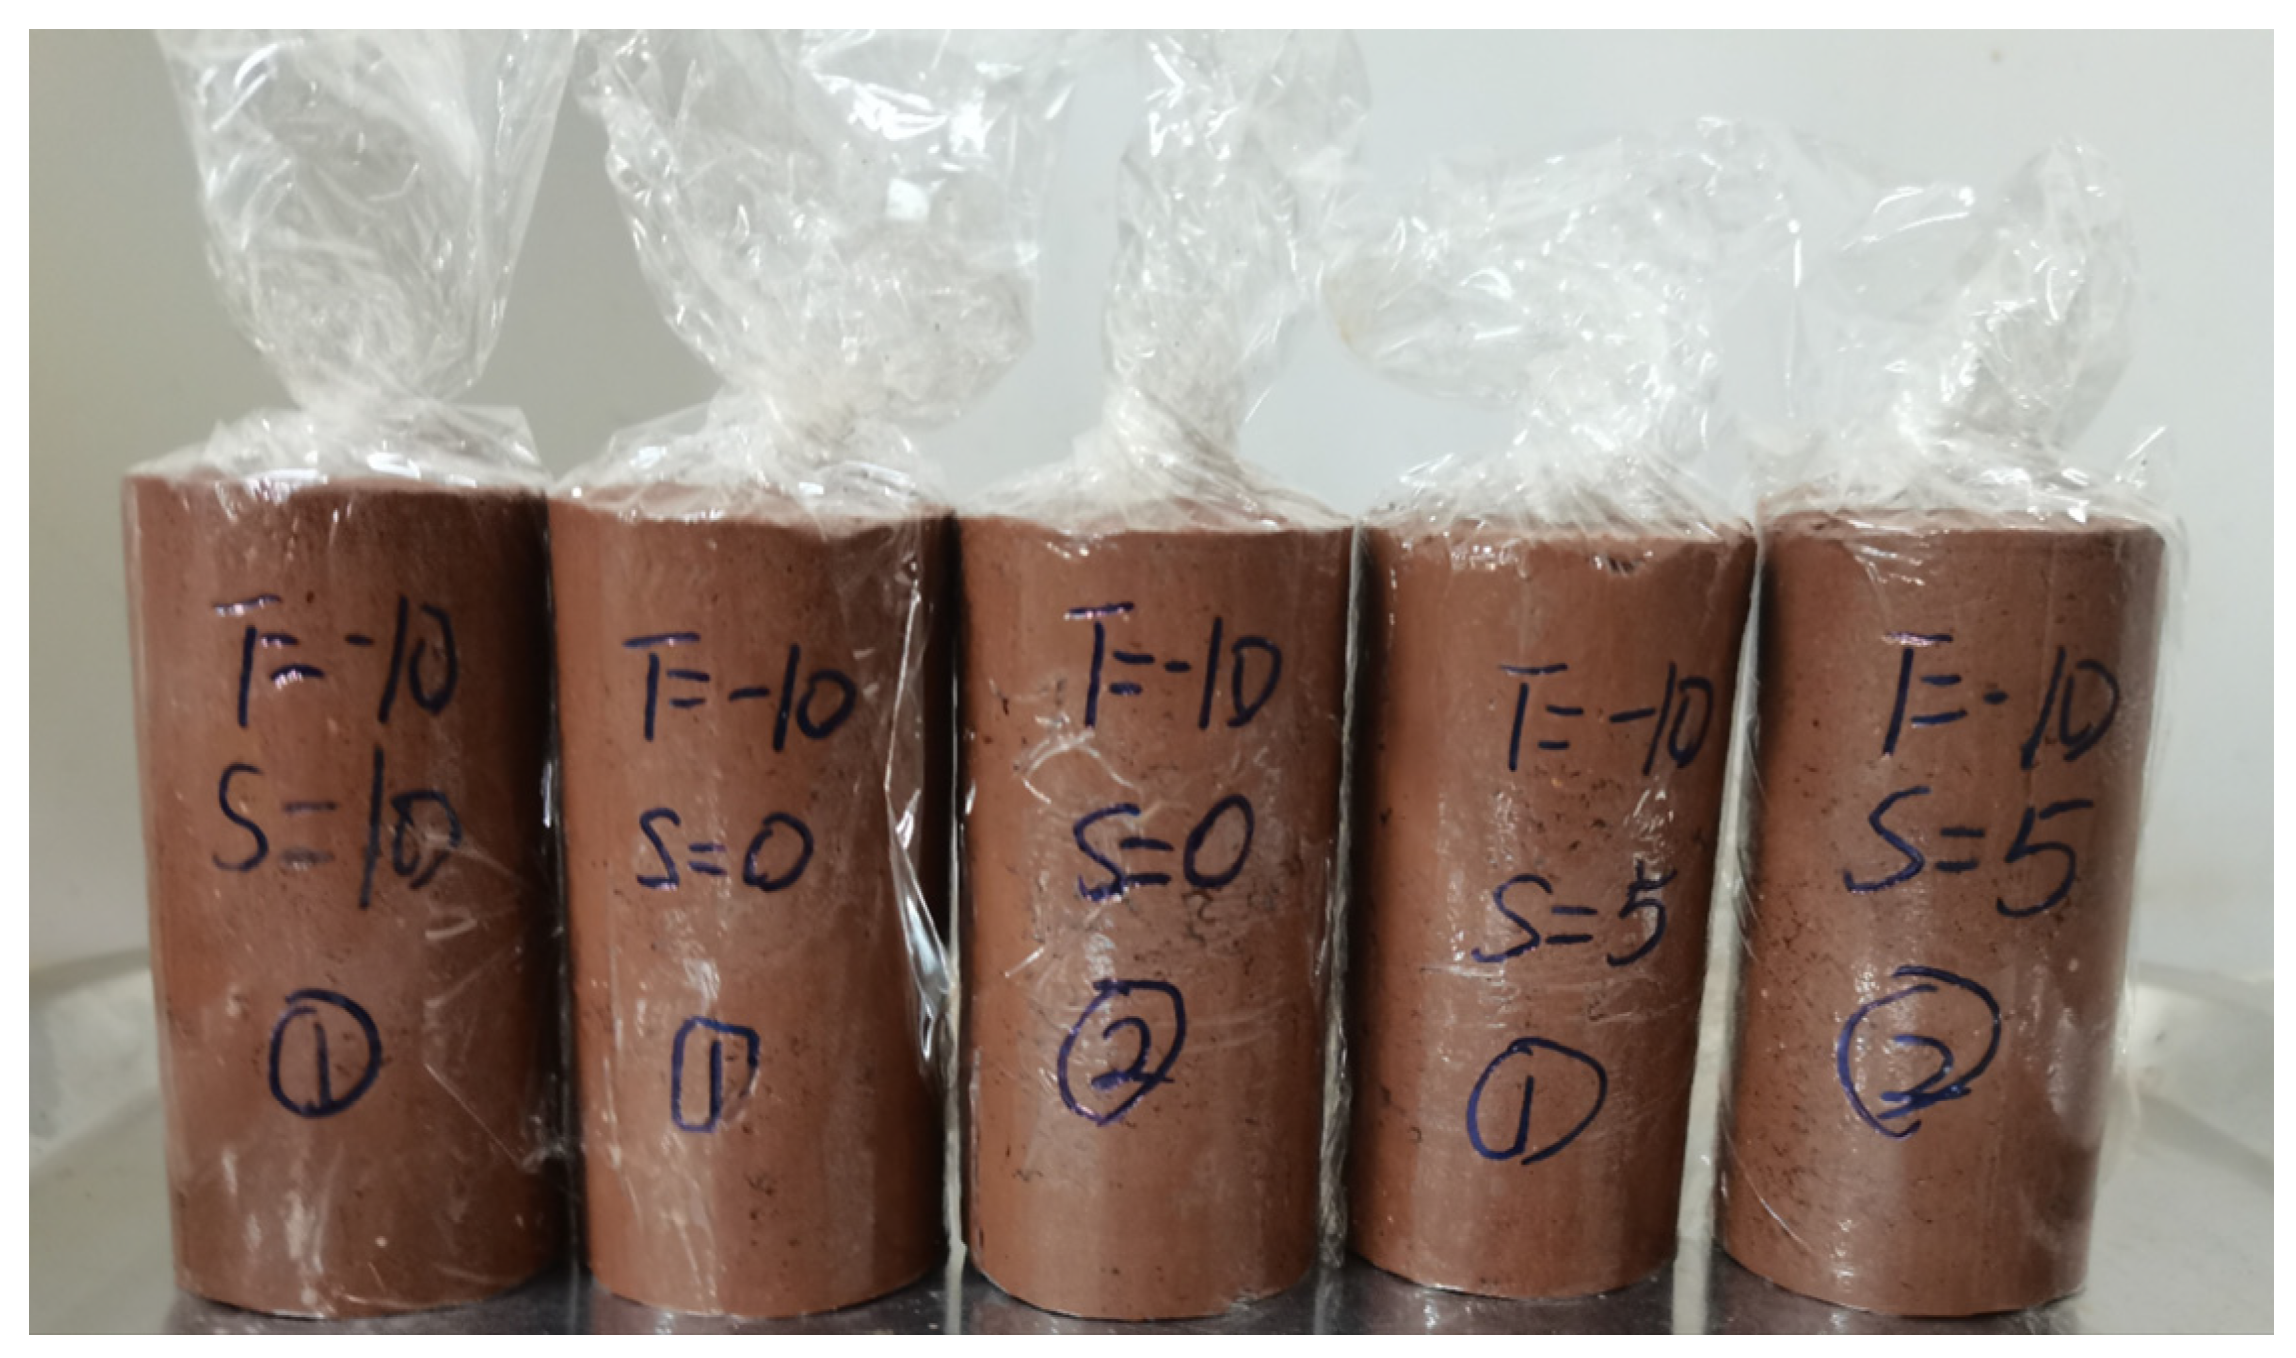
Soft sandy soils with varying sand content were prepared according to the test program and sealed for one day to ensure thorough mixing and stabilization. Vaseline was uniformly applied to the inner wall of the three-valve membrane fixture, and the prepared soil samples were placed into the mold in layers to ensure consistent density and homogeneity, as shown in Figure 1. The specimen diameter and height were set to 38 mm and 76 mm, respectively. As shown in Figure 2, the three-valve membrane specimen was placed into the vacuum saturator. The cover seam was coated with petroleum jelly to prevent air leakage. The instrument was started, pumped for 2 h, then filled with water until the specimen was completely submerged, and then turned off to stand for 10 h. To ensure sample saturation, the triaxial instrument was used for re-saturation. The sample was considered saturated when the B-value exceeded 97 and was maintained for 15 min. We removed the specimen and the film apparatus to ensure the specimen’s integrity. We wrapped the demolded specimen (Figure 3) with plastic film and placed it into the air freezing and thawing box to freeze for 24 h. The frozen specimen is shown in Figure 4.
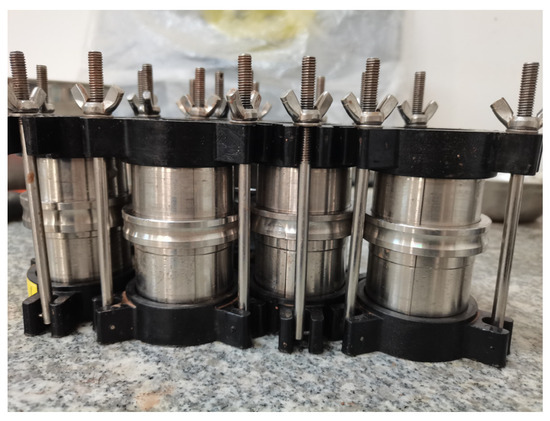
Figure 1.
Sample preparation.
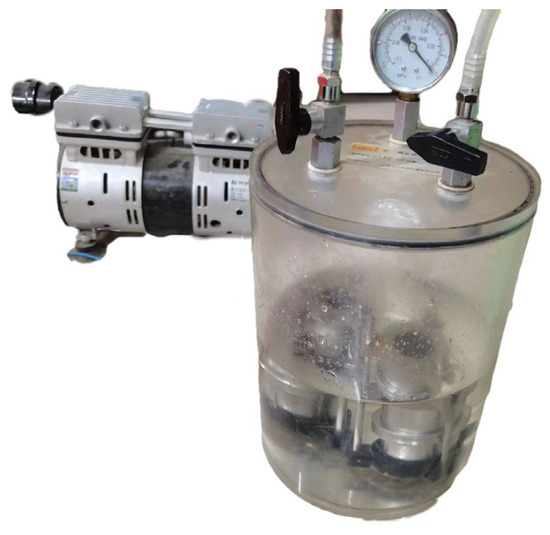
Figure 2.
Vacuum saturation.
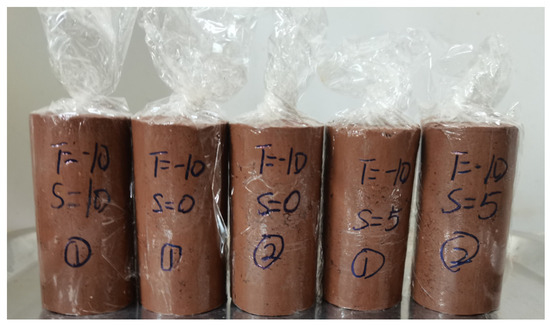
Figure 3.
Demolded sample.
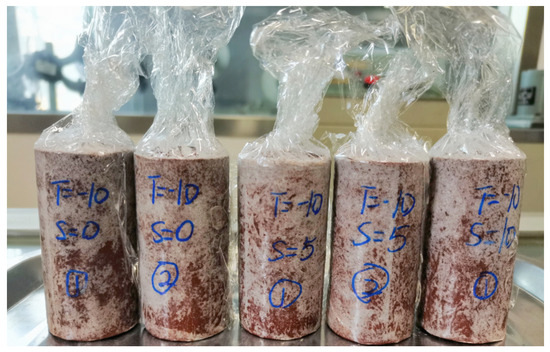
Figure 4.
Frozen sample.
As shown in Figure 5 and Figure 6, before freezing and thawing, the SEM images of sandy soft soil demonstrate large continuous flocculent structures and typical honeycomb structures. The soil structure is dense with few pores. After freezing and thawing, the breaking of large particles and the aggregation of small particles occur simultaneously, resulting in a lamellar interlocking particle aggregate structure. The framework becomes looser, the proportion of pores increases, and the connectivity rate also rises, adding complexity to the soil structure.
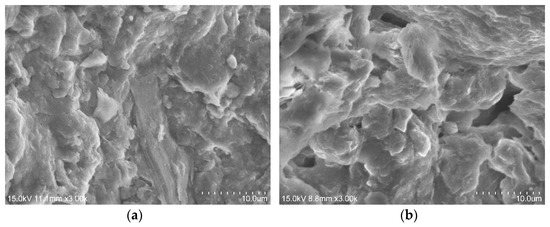
Figure 5.
Scanning electron microscope (SEM) images of soft soil at a magnification of 3000×: (a) unfrozen soil, (b) frozen–thawed soil.
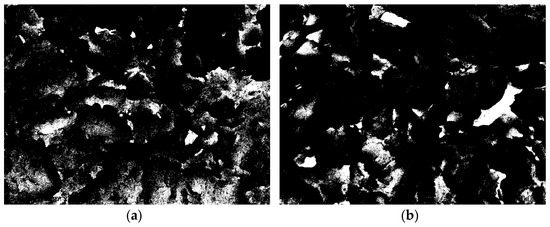
Figure 6.
Pore morphology of soft soil at 3000× magnification, with images processed through binarization: (a) unfrozen soil, (b) frozen–thawed soil.
2.3. Test Methods
2.3.1. Basic Principles of Nuclear Magnetic Resonance
The experimental apparatus used in this study is the MesoMR23-060H-I model low-field NMR instrument developed by Shanghai Niumag Corporation (Shanghai, China). This instrument autonomously maintains the magnetic field temperature at 35 ± 0.01 °C, with the maximum homogeneity in magnetic field dimensions being 60 × 60 mm. NMR clarifies the microstructural characteristics of substances by observing the changes in the spin states of atomic nuclei, which possess spin magnetic moments, as they absorb electromagnetic waves at specific frequencies in the presence of an external magnetic field [37].
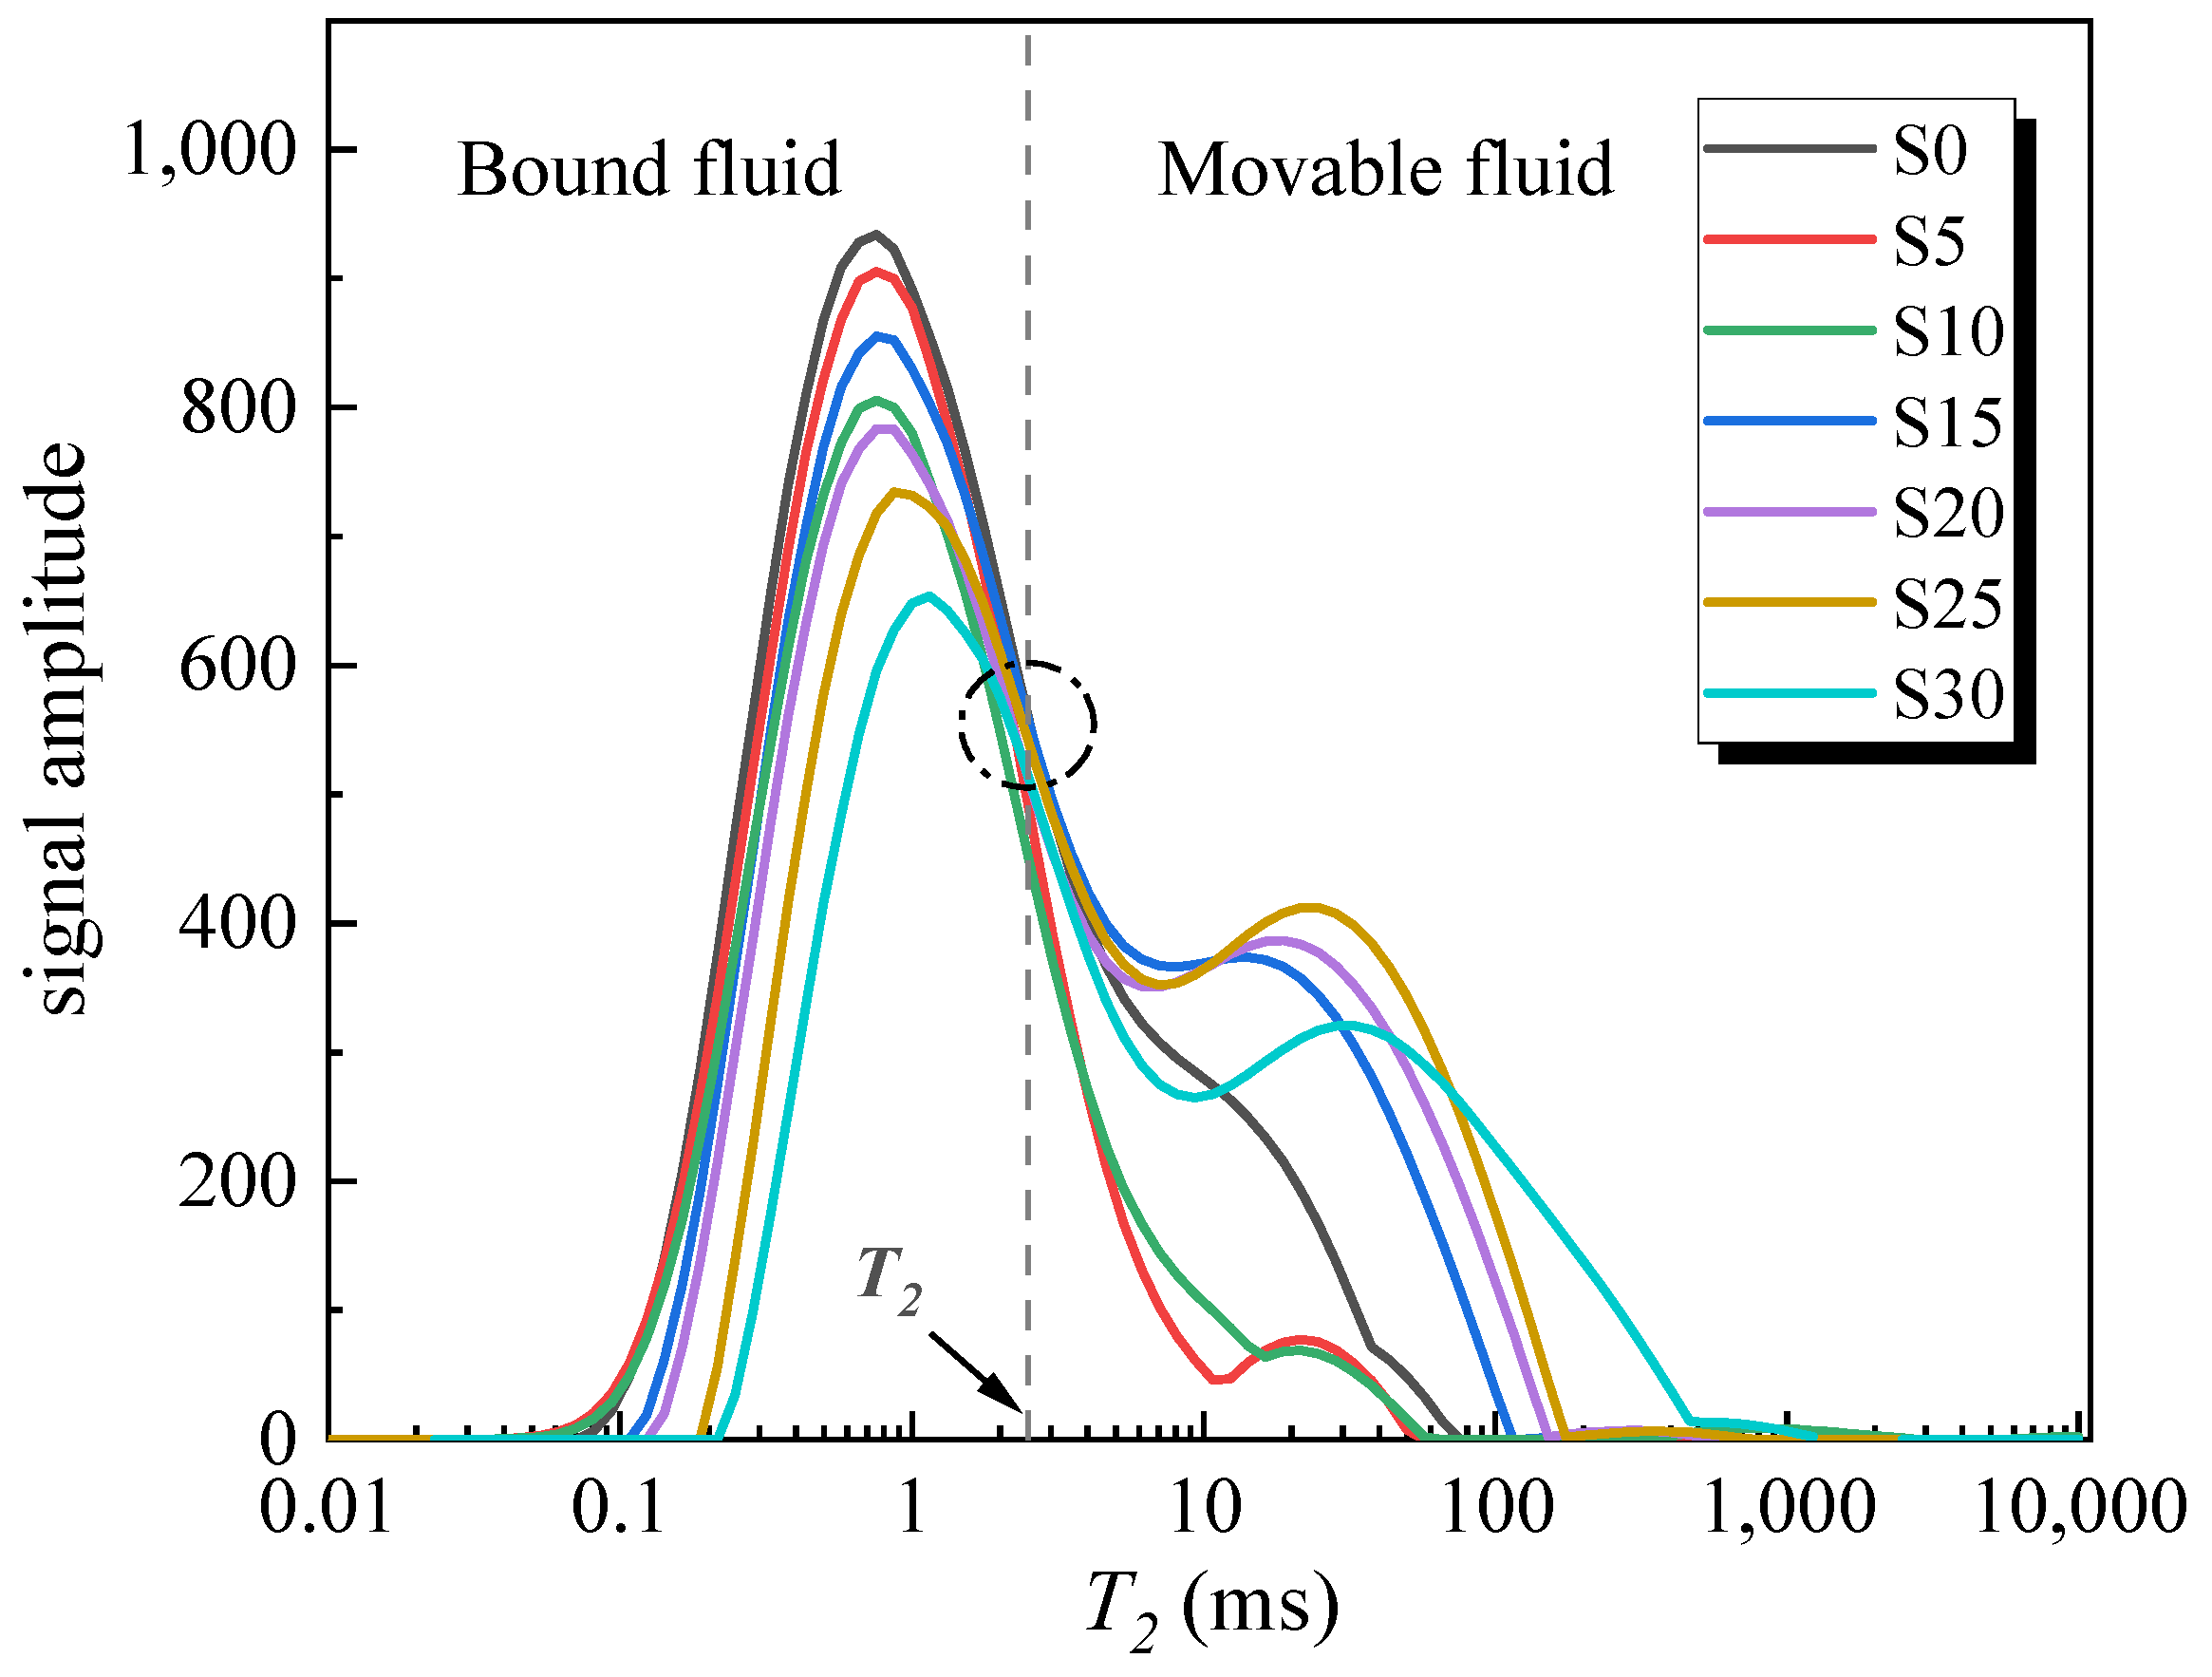
This study primarily utilizes transverse relaxation time (T2) values measured by nuclear magnetic resonance to estimate water content by quantifying the number of hydrogen atoms in the sample. The cutoff values in the T2 relaxation spectra facilitate the differentiation between movable and bound fluid types in the soil [38]. For the frozen–thawed sandy soft soil discussed in this paper, the relaxation spectrum is dominated by a single peak, with the main peak occurring at less than 10 ms. Therefore, an empirical method was adopted, using the midpoint of the right half of the main peak as the T2 cutoff value. As shown in Figure 7, the T2 cutoff value was determined to be 2.31 ms. Fluids in pores with T2 values greater than 2.31 ms were considered movable fluids, whereas fluids with T2 values less than 2.31 ms were regarded as bound. The formula for T2 relaxation is as follows:
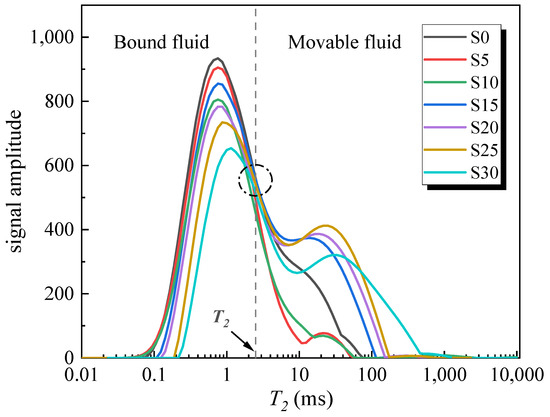
Figure 7.
Determination of cutoff values for T2 relaxation spectra (T2 cutoff value is 2.31 ms, S0 to S30 represent sand contents of 0% to 30%).
In the equation, denotes the surface relaxation rate (μm/ms), which is associated with the properties of the sample’s pore surfaces and binders. For the soft soil discussed here, is approximated at 27 μm/ms. α signifies the pore shape factor, with assigned values of 1, 2, and 3, corresponding to flat, cylindrical, and spherical pores, respectively. R denotes the equivalent pore radius, and S/V represents the pore-specific surface area.
2.3.2. Fractal Dimension Principle
Fractal dimension is a quantitative parameter used to characterize fractal features, reflecting the complexity and irregularity of fractals. Previous studies have confirmed that pore distributions exhibit self-similarity, and the pore structures of porous media demonstrate fractal features, which can be analyzed using fractal theory [39]. Currently, fractal theory is widely applied in quantifying and analyzing the geometric properties of PSD [33]. Below is the distribution of smaller pore sizes, calculated as a mass percentage:
In the equation, R represents the aperture, while Rmax denotes the aperture that constitutes the largest percentage. M represents the mass of pores larger than the measured size Ra. Cm is a constant associated with the shape and size of pores, and represents the density of pores under assumed conditions. Due to the fractal characteristics of soil pore distribution, the fractal dimension D is strictly confined to the range 0 < D < 3 [40]. The fractal dimension D can be derived when the percentage of cumulative pore volume falls below a specified threshold. Given the linear relationship between the T2 value and pore size R, and using the fractal dimension calculation formula for movable fluid space developed by Zhou et al. [39], the corresponding fractal geometric approximation for pore size R is expressed as follows:
In the equation, SV (%) represents the percentage of the total pore volume composed of pores smaller than the aperture R. D denotes the fractal dimension, and Rmax represents the maximum aperture size. Upon a logarithmic transformation of the formula, the nuclear magnetic resonance-derived fractal dimension D model corresponding to the PSD for aperture R is as follows:
In the equation, Db represents the fractal dimension of the bound fluid, while Dm denotes the fractal dimension of the movable fluid.
3. Analysis of Experimental Results
3.1. Quantitative Analysis of the Microstructure of Frozen–Thawed Sandy Soft Soil
3.1.1. Impact of Freezing Temperature on Pore Distribution
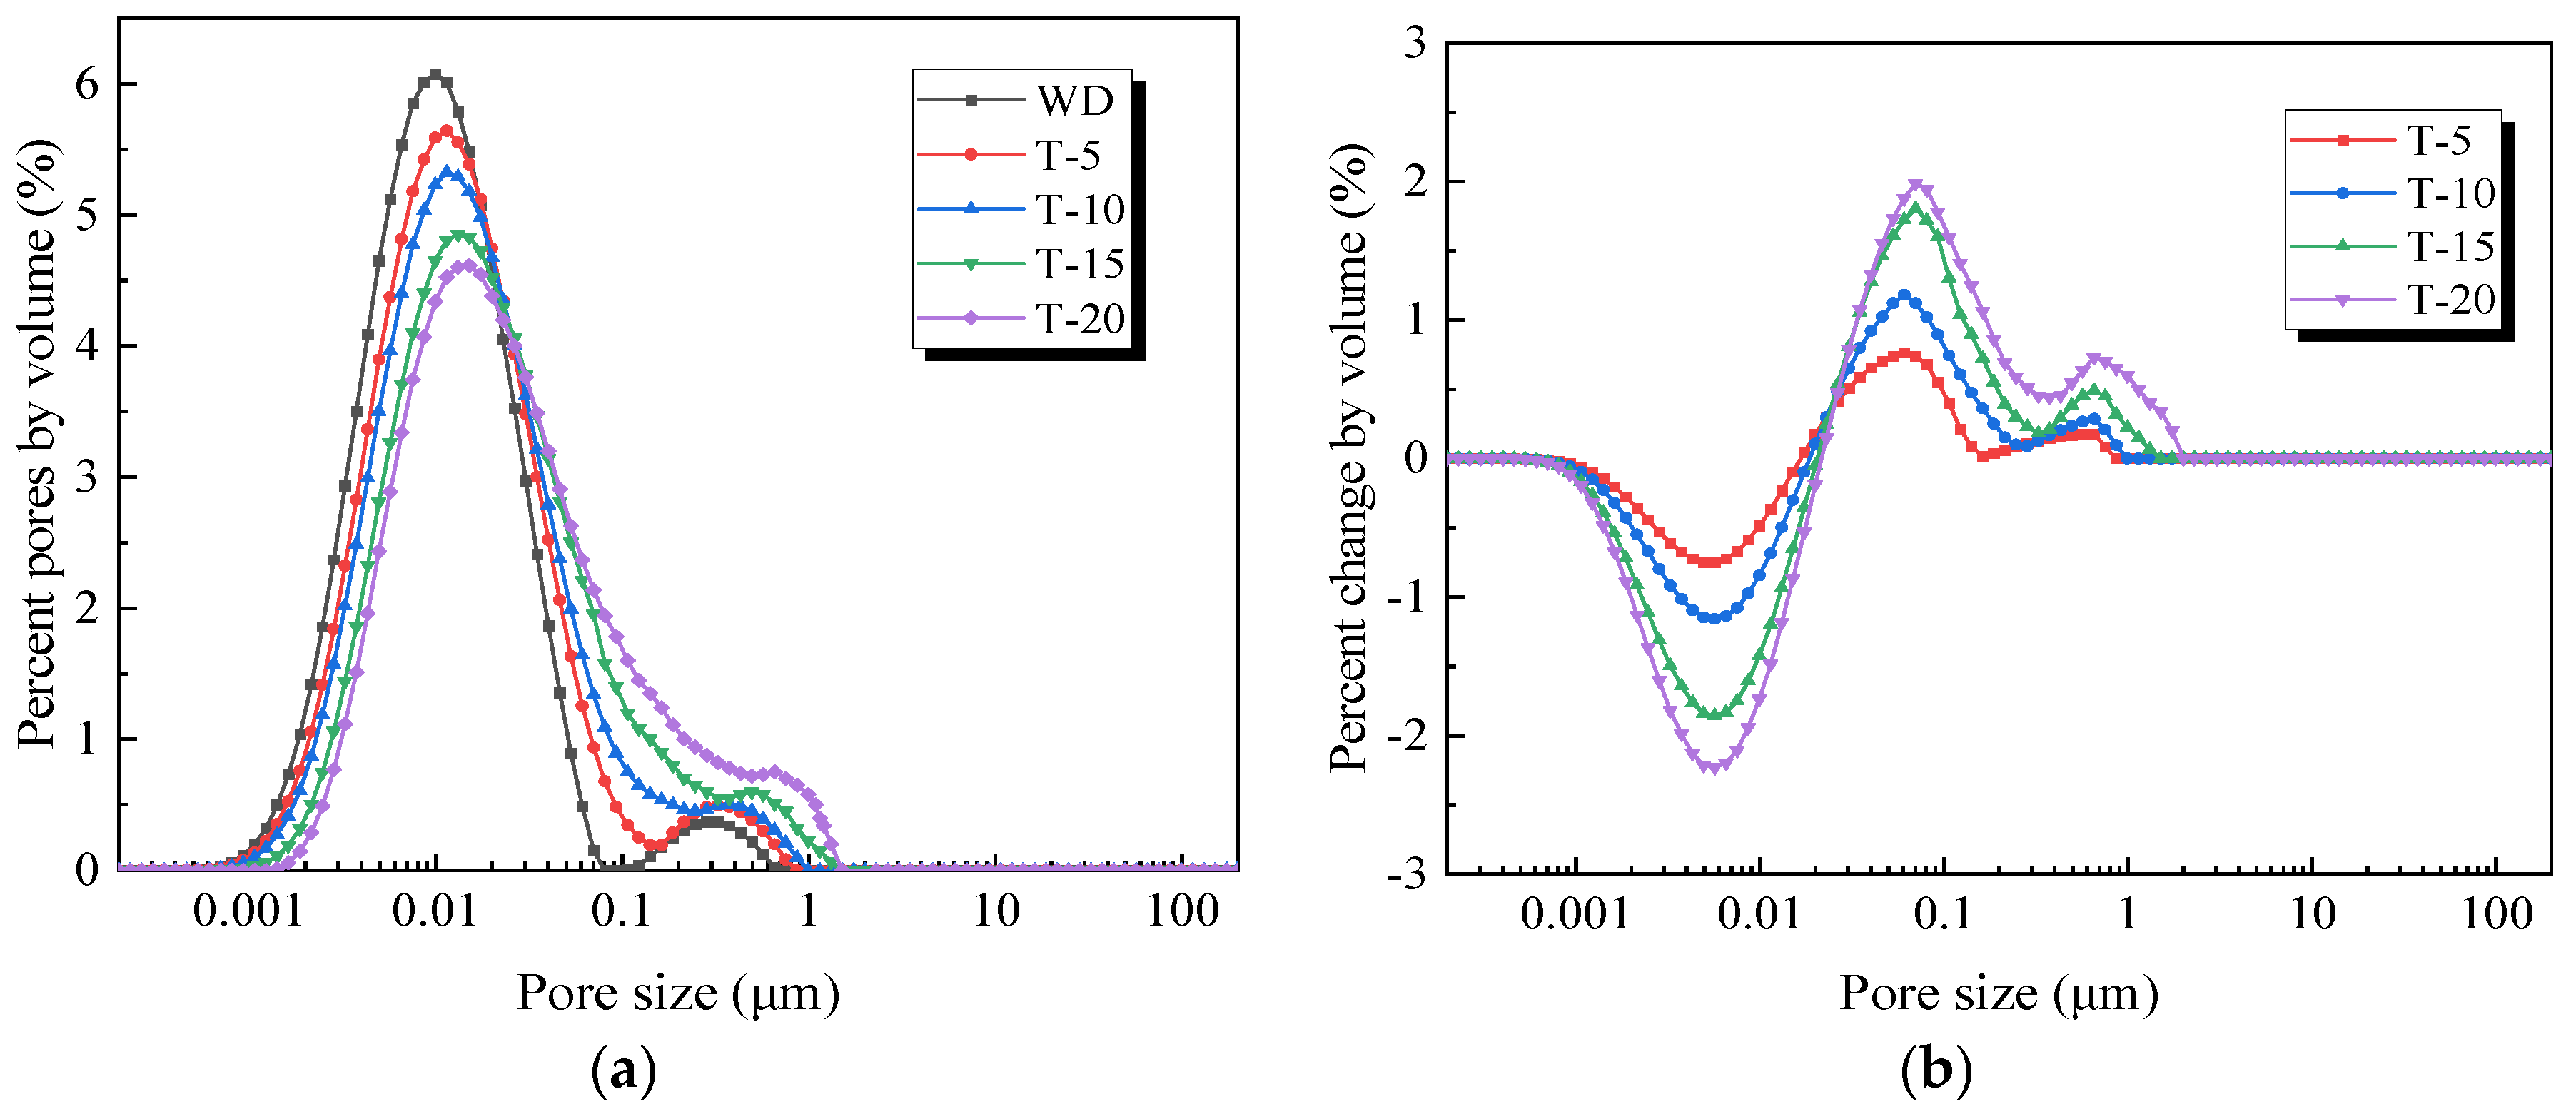
As shown in Figure 8a, as the temperature decreases, the freezing effect on pore expansion becomes more pronounced, leading to an overall increase in pore size. Concurrently, the peak value of the main peak shows a decreasing trend as the temperature lowers. Particularly in the −10 °C to −15 °C range, the peak value of the main peak after freezing drops more significantly, decreasing by approximately 20%. However, the peak value of the secondary peak exhibits an upward trend as the temperature decreases; this indicates that some small pores in the soil structure connect with nearby pores to form larger ones due to the freezing and expansion of pore water, thereby leading to a decrease in the main peak value and an increase in the secondary peak value.
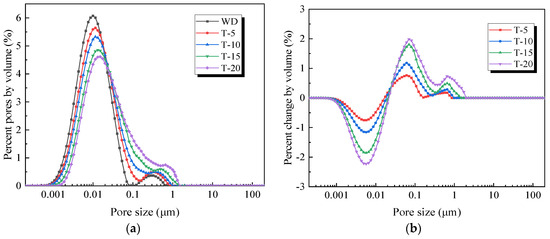
Figure 8.
Effect of freezing temperature on pore distribution. (a) Pore distribution at different freezing temperatures. (b) Change in pore distribution at different freezing temperatures. (“WD” denotes samples not subjected to freezing. T-5 to T-20 represent freezing temperatures of −5 °C to −20 °C).
Considering the change in pore percentage, within the 0.001–0.025 μm range, the number of pores decreases as the temperature decreases, forming a distinct “concave area”. These pores, originally in the “concave zone”, shift to a larger aperture zone after freezing. Concurrently, the number of pores in the 0.025–0.4 μm range gradually increases, forming the “main convex area”. According to the principle of the ice expansion of pore water, small pores expand upon freezing to form slightly larger pores. The diagram clearly shows that the “main convex area”, which has increased in proportion, originates from the “concave area” which has decreased. Additionally, between 0.4 and 2 μm, a “secondary convex area” forms, potentially due to some pores from the “main convex area” further expanding during freezing or medium-sized pores merging under the effect of freezing, thereby increasing the number of pores in this larger pore size range. In conclusion, after freezing, the sandy soft soil shows a general tendency to expand. The small pore size increases by about 10 times and the percentage of larger pores grows dramatically.
3.1.2. Impact of Sand Content on Pore Distribution
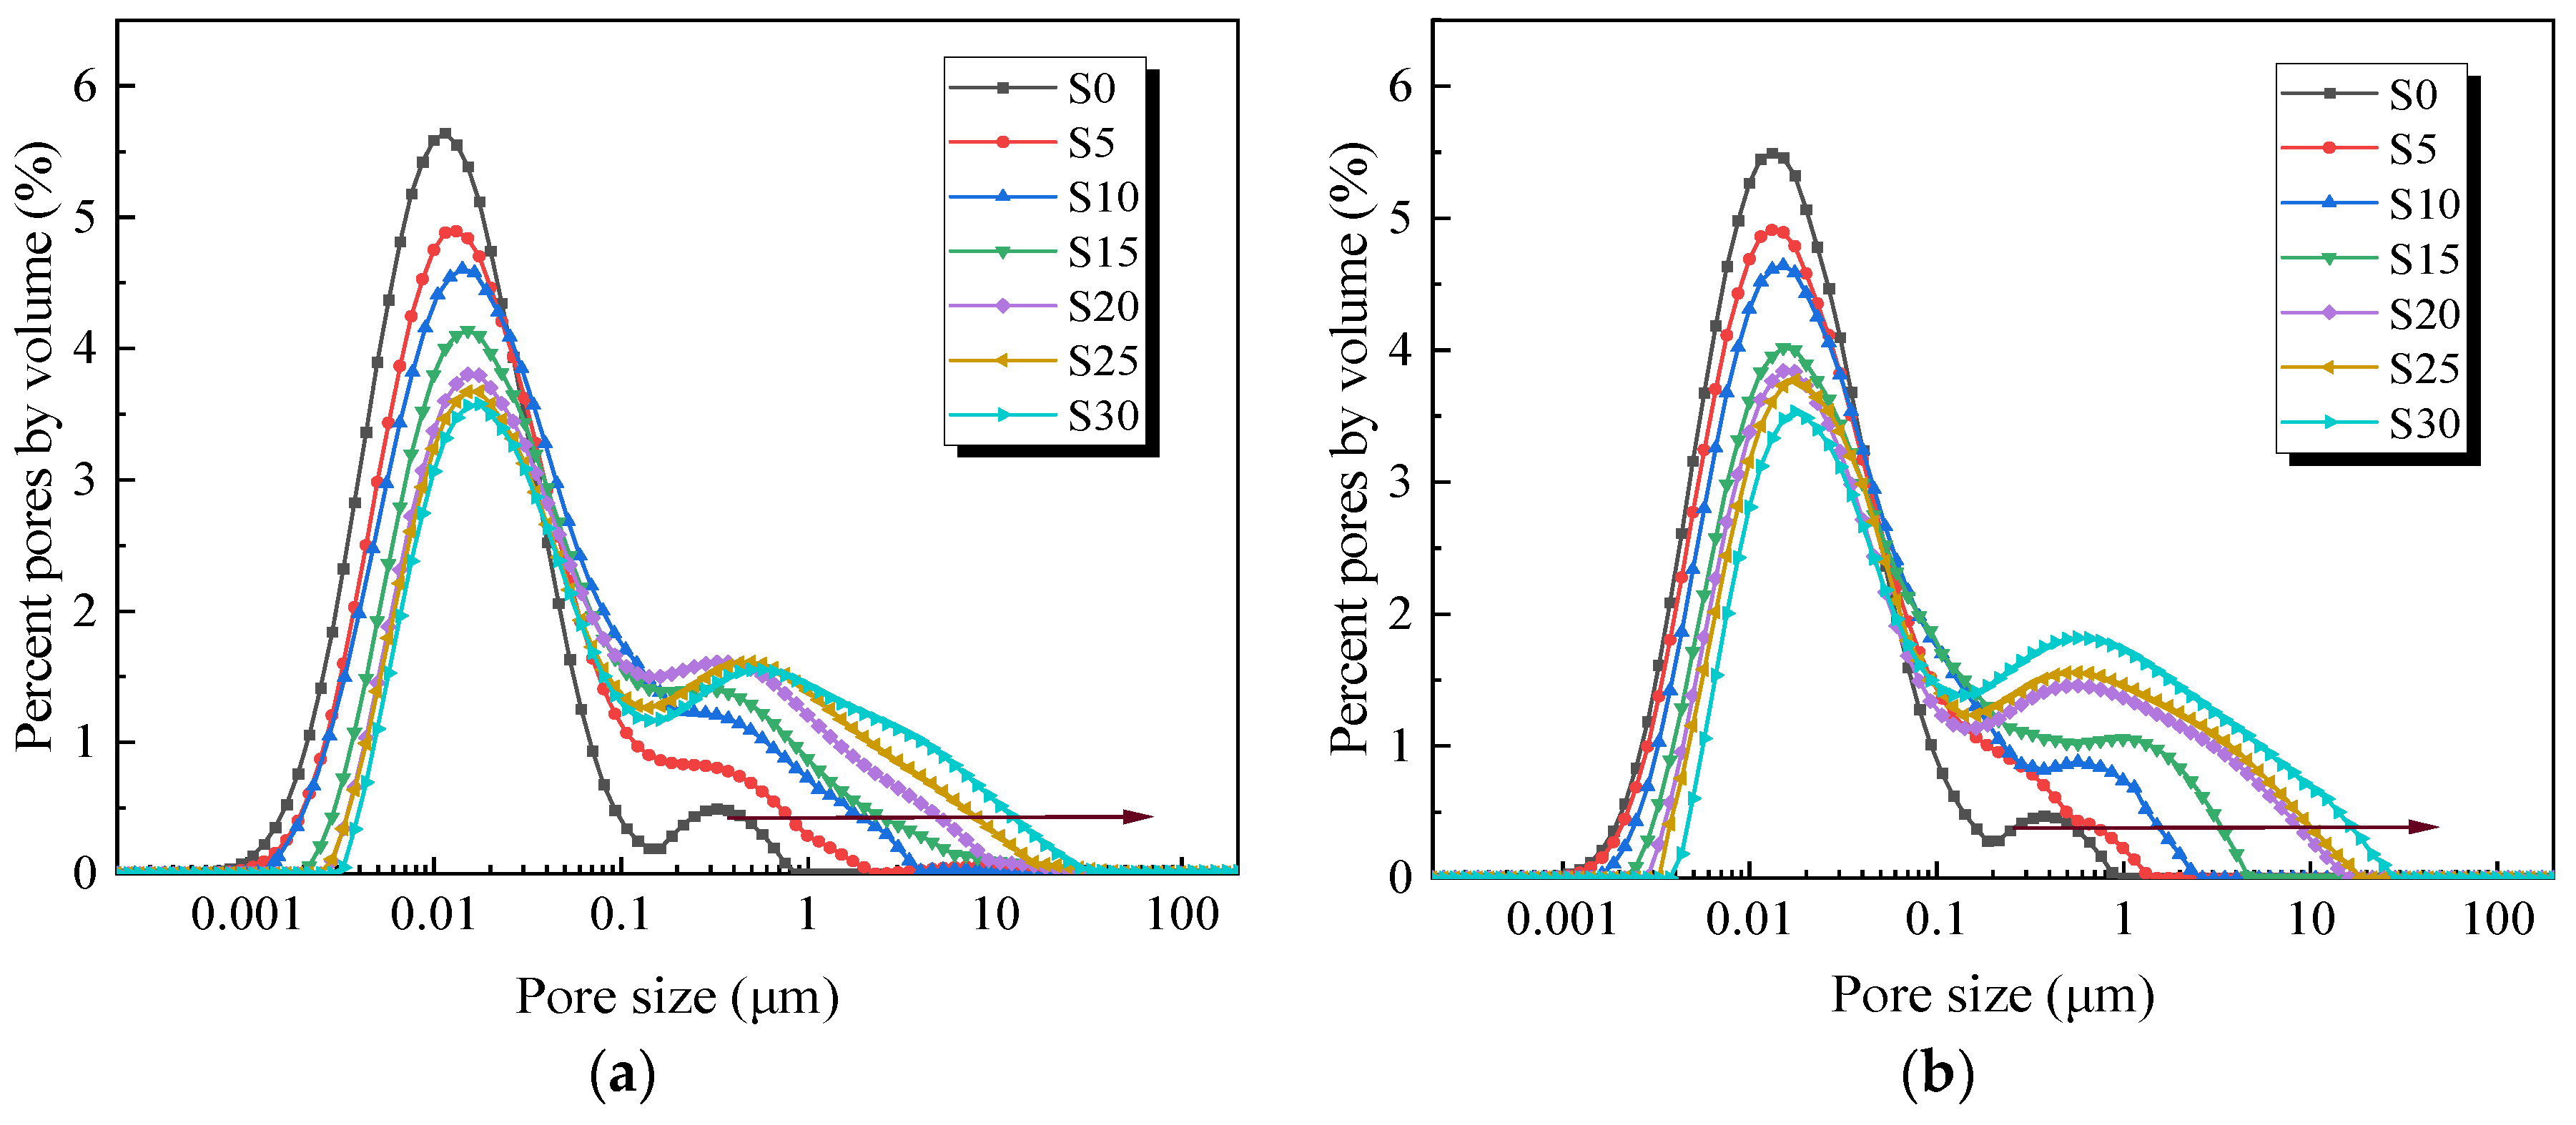
According to the pore distribution curves for soft soils with varying sand contents shown in Figure 9, it is evident that the proportion of the main peak pores is negatively correlated with the sand content. At a constant temperature, the peak value of the main peak diminishes with increasing sand content, while the peak value of the secondary peak rises. This suggests that a higher sand content correlates with fewer small-sized pores and more large-sized pores, primarily due to the formation of more irregular large pore structures.
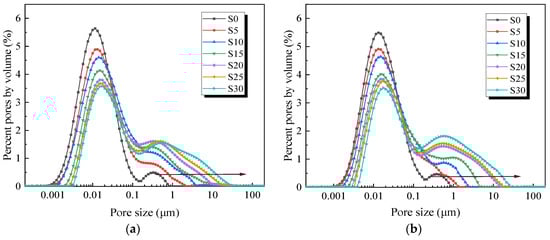
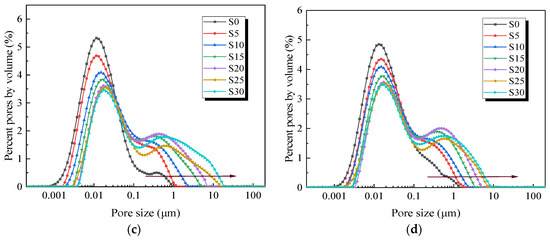
Figure 9.
Changes in pore distribution of sandy soft soil at different sand contents: (a–d) represent temperatures of −5 °C, −10 °C, −15 °C, −20 °C, respectively. (S0 to S30 represent sand contents of 0% to 30%).
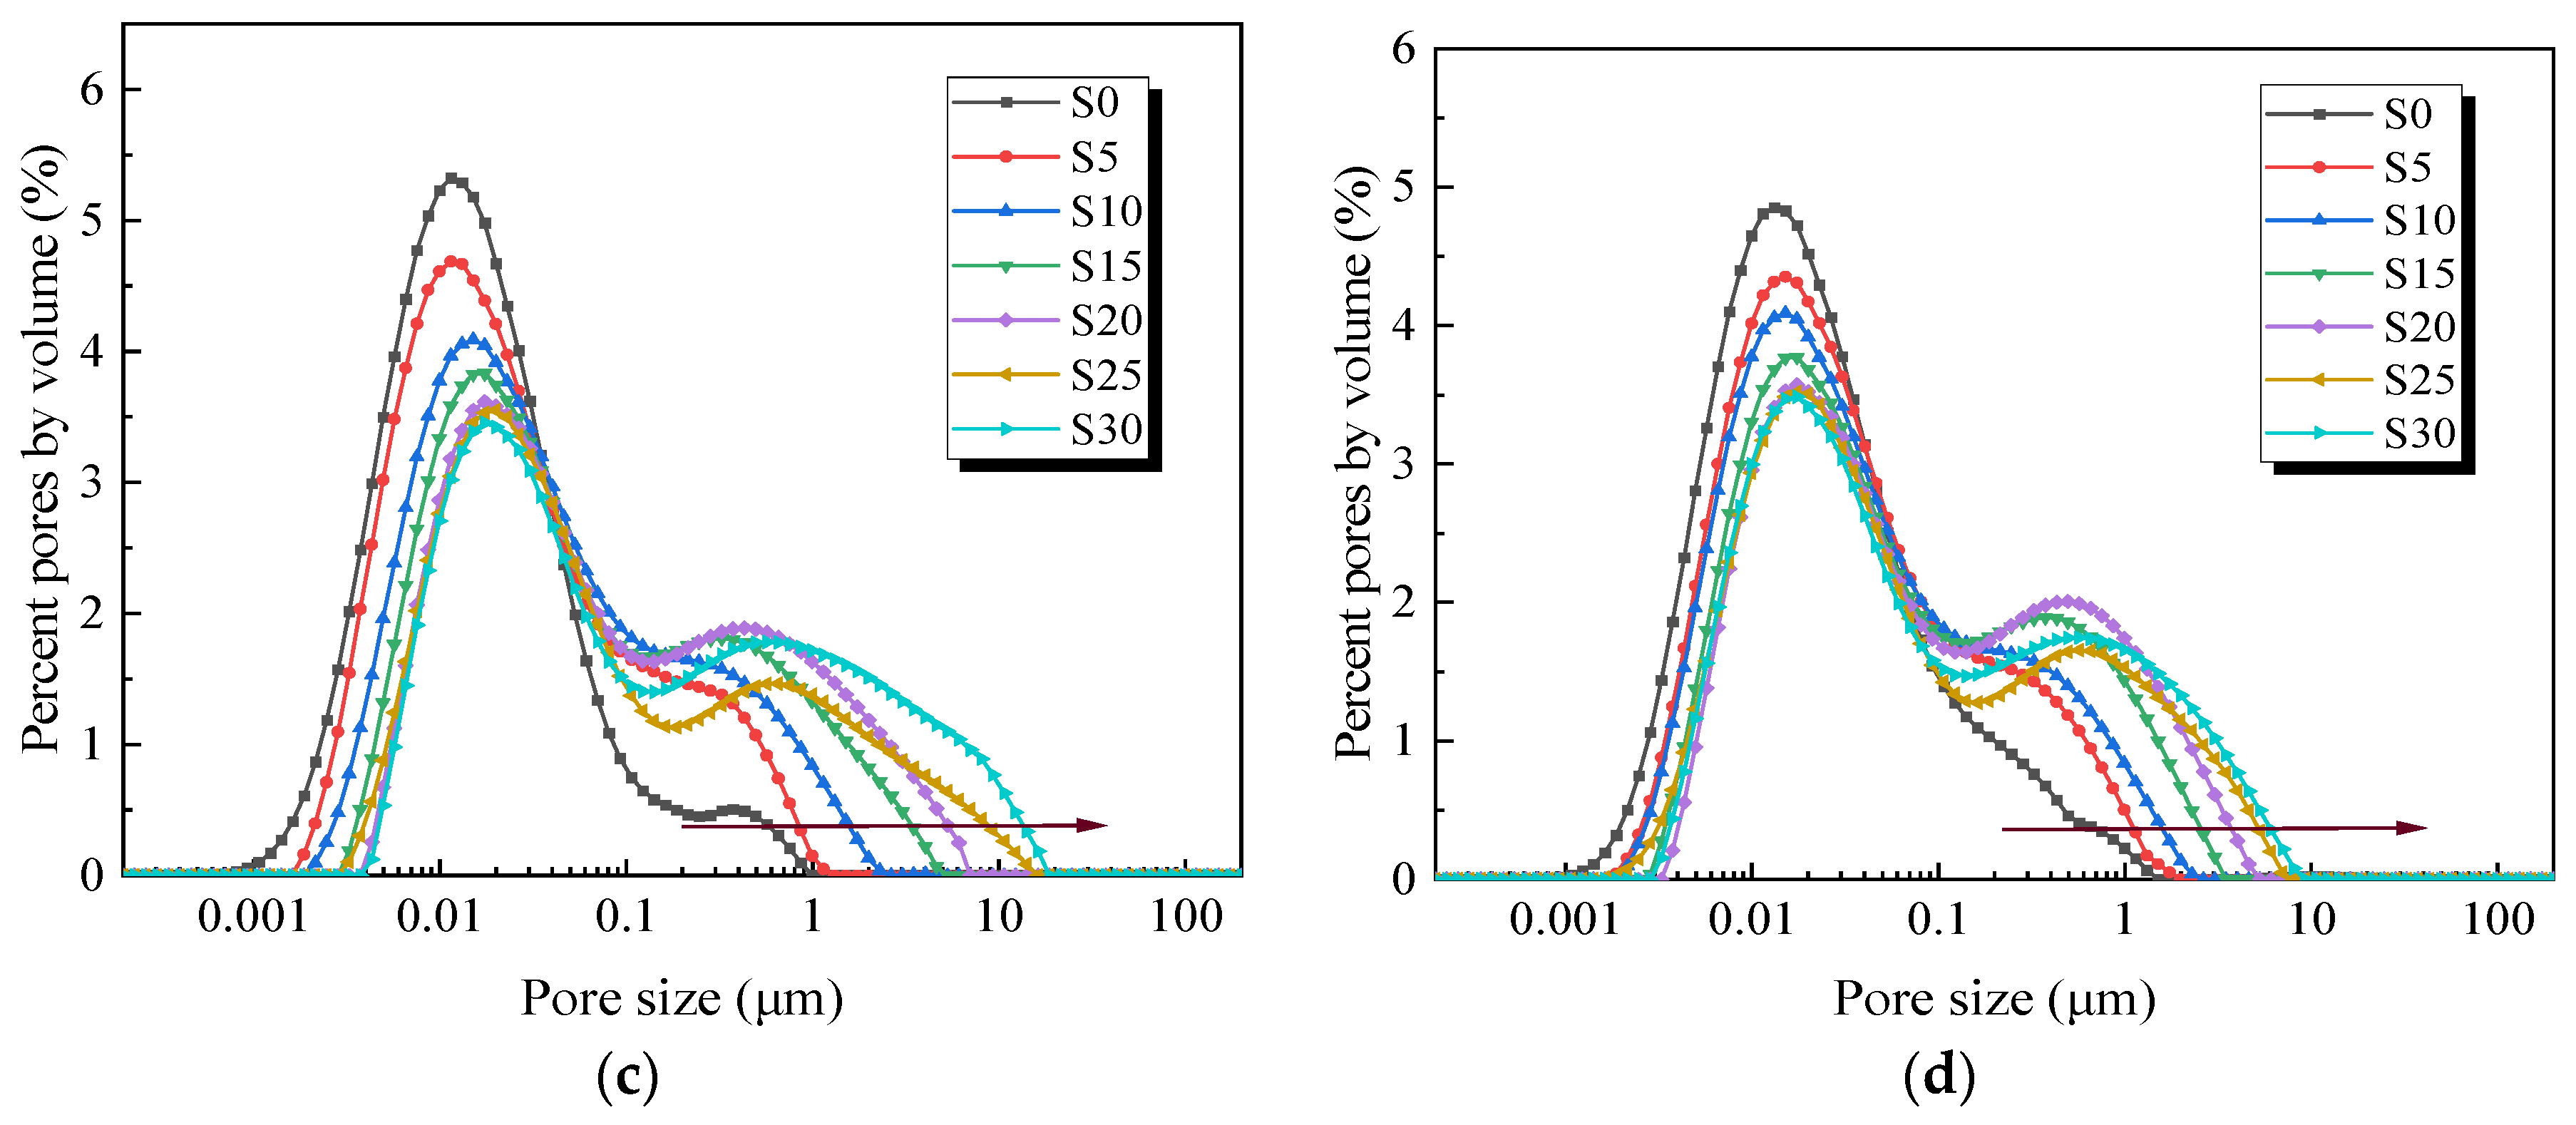
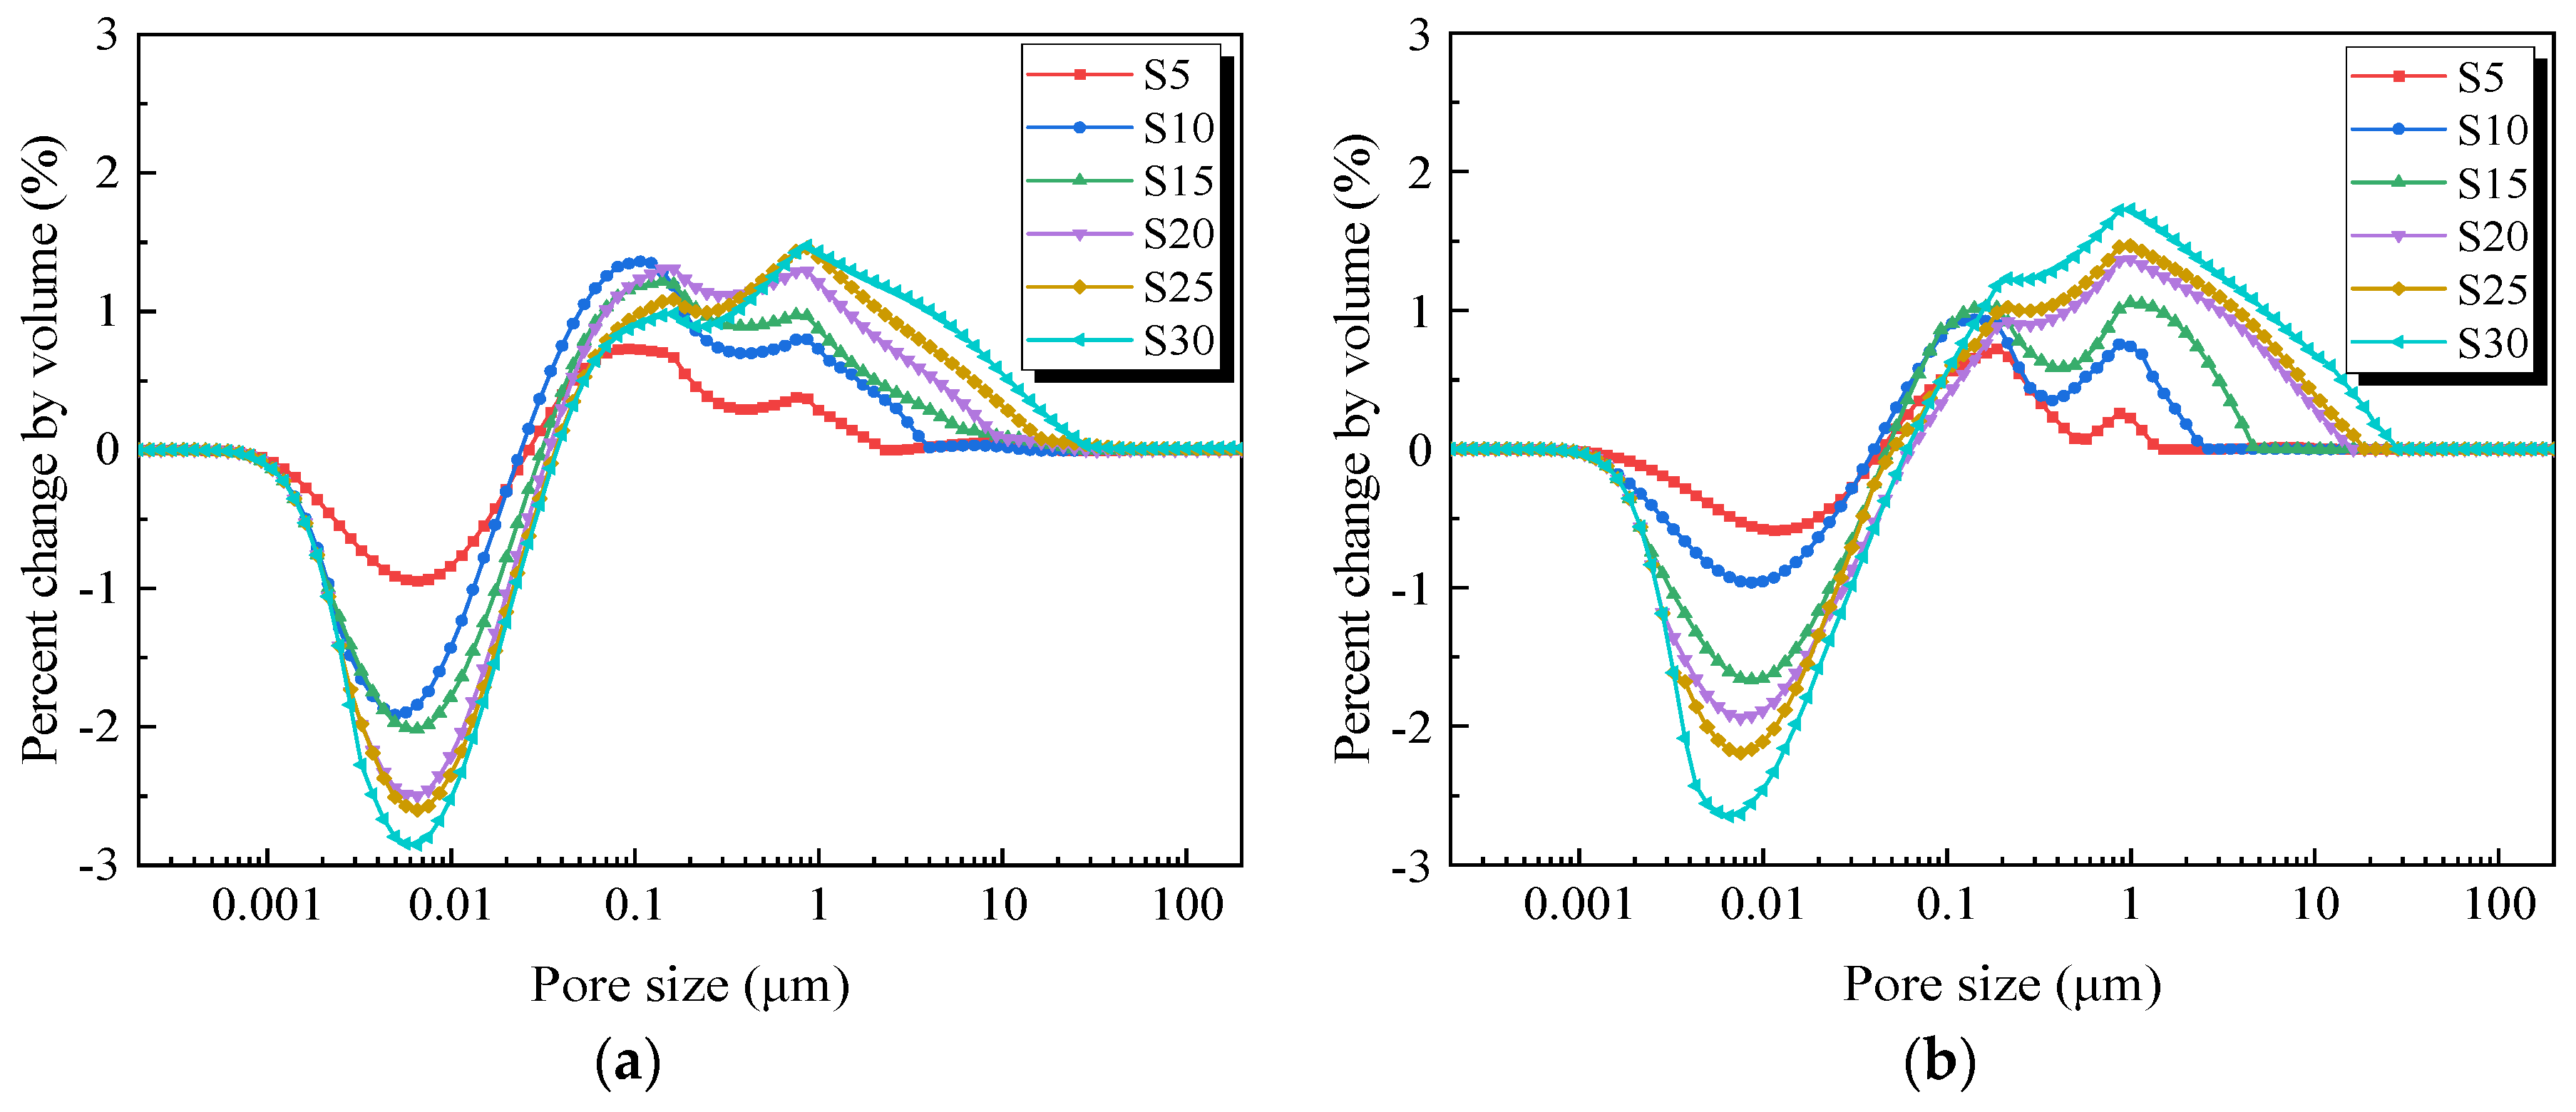
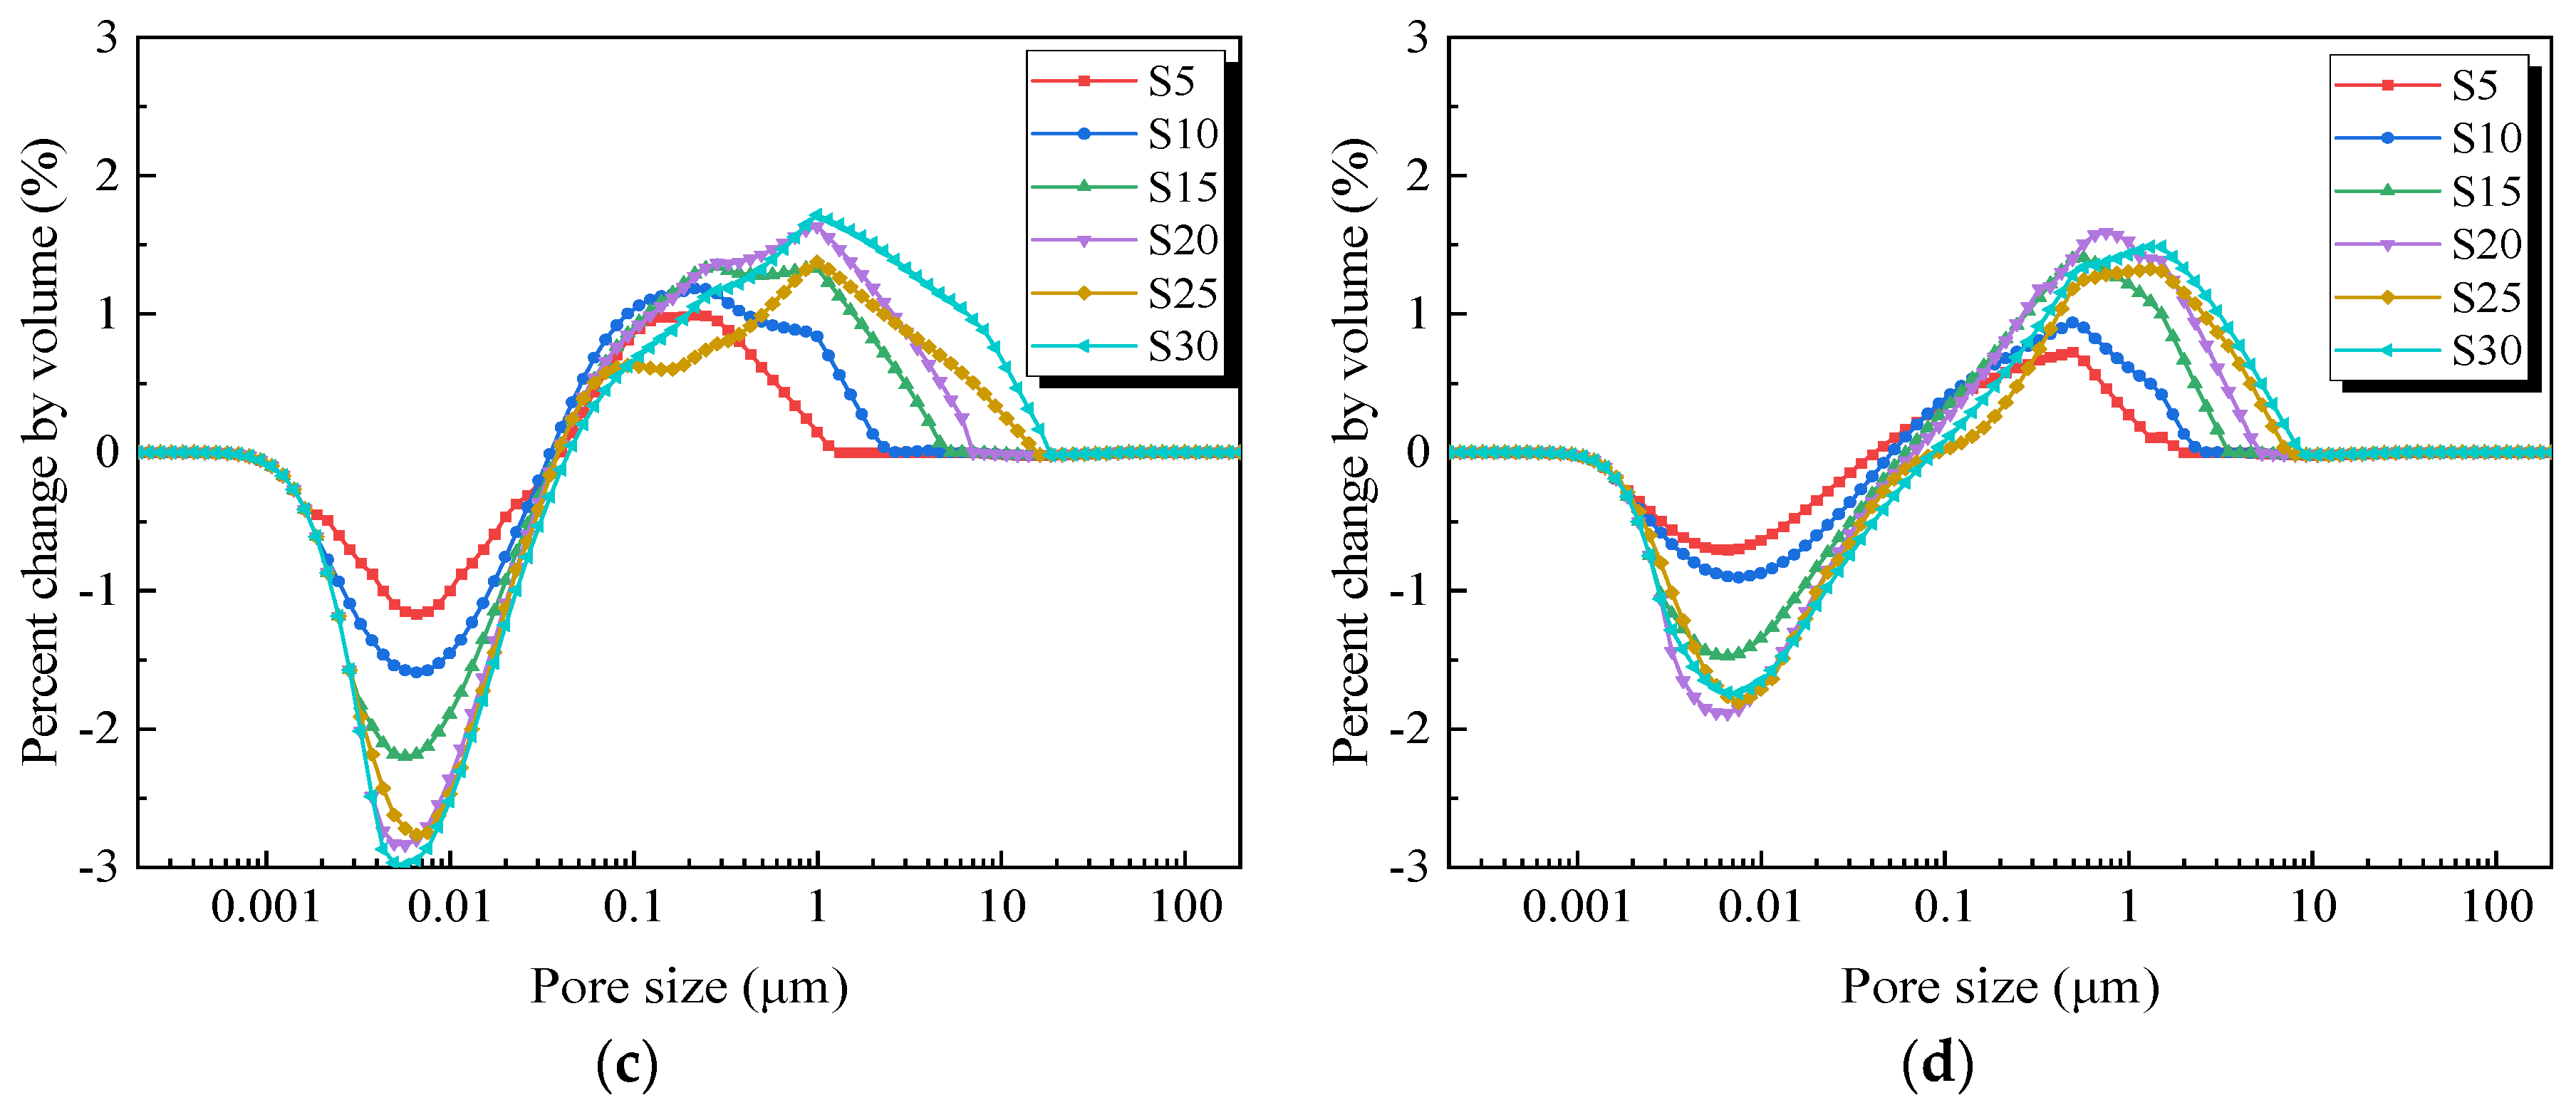
According to Figure 10, observing the changes in pore size percentage, when the temperature ranges from −5 °C to −15 °C, the curve displays a “concave area” and two “convex areas”. Within the 0.001 μm to 0.05 μm “concave area”, the number of pores decreases with an increase in sand content, showing a significant percentage change. Concurrently, the number of pores in the 0.05 μm to 0.4 μm range gradually increases, forming the first “convex area”, and a second “convex area” emerges above 0.4 μm. At a temperature of −20 °C, the pore distribution curve exhibits distinct characteristics. Within the 0.001 μm to 0.1 μm range, a wider “concave area” forms compared to the “concave area” at −5 °C to −15 °C, suggesting that at lower temperatures, more small pores are reduced due to frost heave effects. Additionally, only one “convex area” forms above 0.1 μm, as the more intense freezing at lower temperatures results in the more pronounced expansion and merging of larger pores.
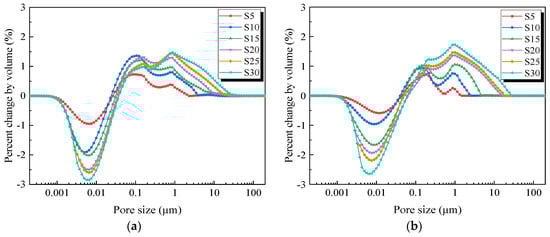
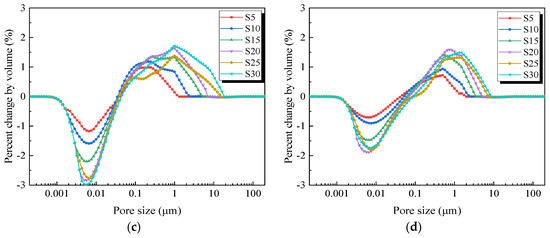
Figure 10.
Changes in soft soil pore distribution relative to the initial distribution at different sand contents: (a–d) represent temperatures of −5 °C, −10 °C, −15 °C, −20 °C, respectively. (S0 to S30 represent sand contents of 0% to 30%).
3.2. Analysis of Fractal Characteristics in Frozen–Thawed Sandy Soft Soil
3.2.1. Analysis of Fractal Dimensions of Sandy Soft Soil at Various Freezing Temperatures
Freezing influences the distribution of soil pores, consequently altering the fractal dimensions of these pores. Based on Equations (5) and (6), fractal dimensions across various freezing temperatures are calculated, as summarized in Table 5. Figure 9 displays the study results on the relationship between freezing temperatures and fractal dimensions in sandy soft soil.
Table 5.
Fractal dimension statistics for sandy soft soil at various freezing temperatures.
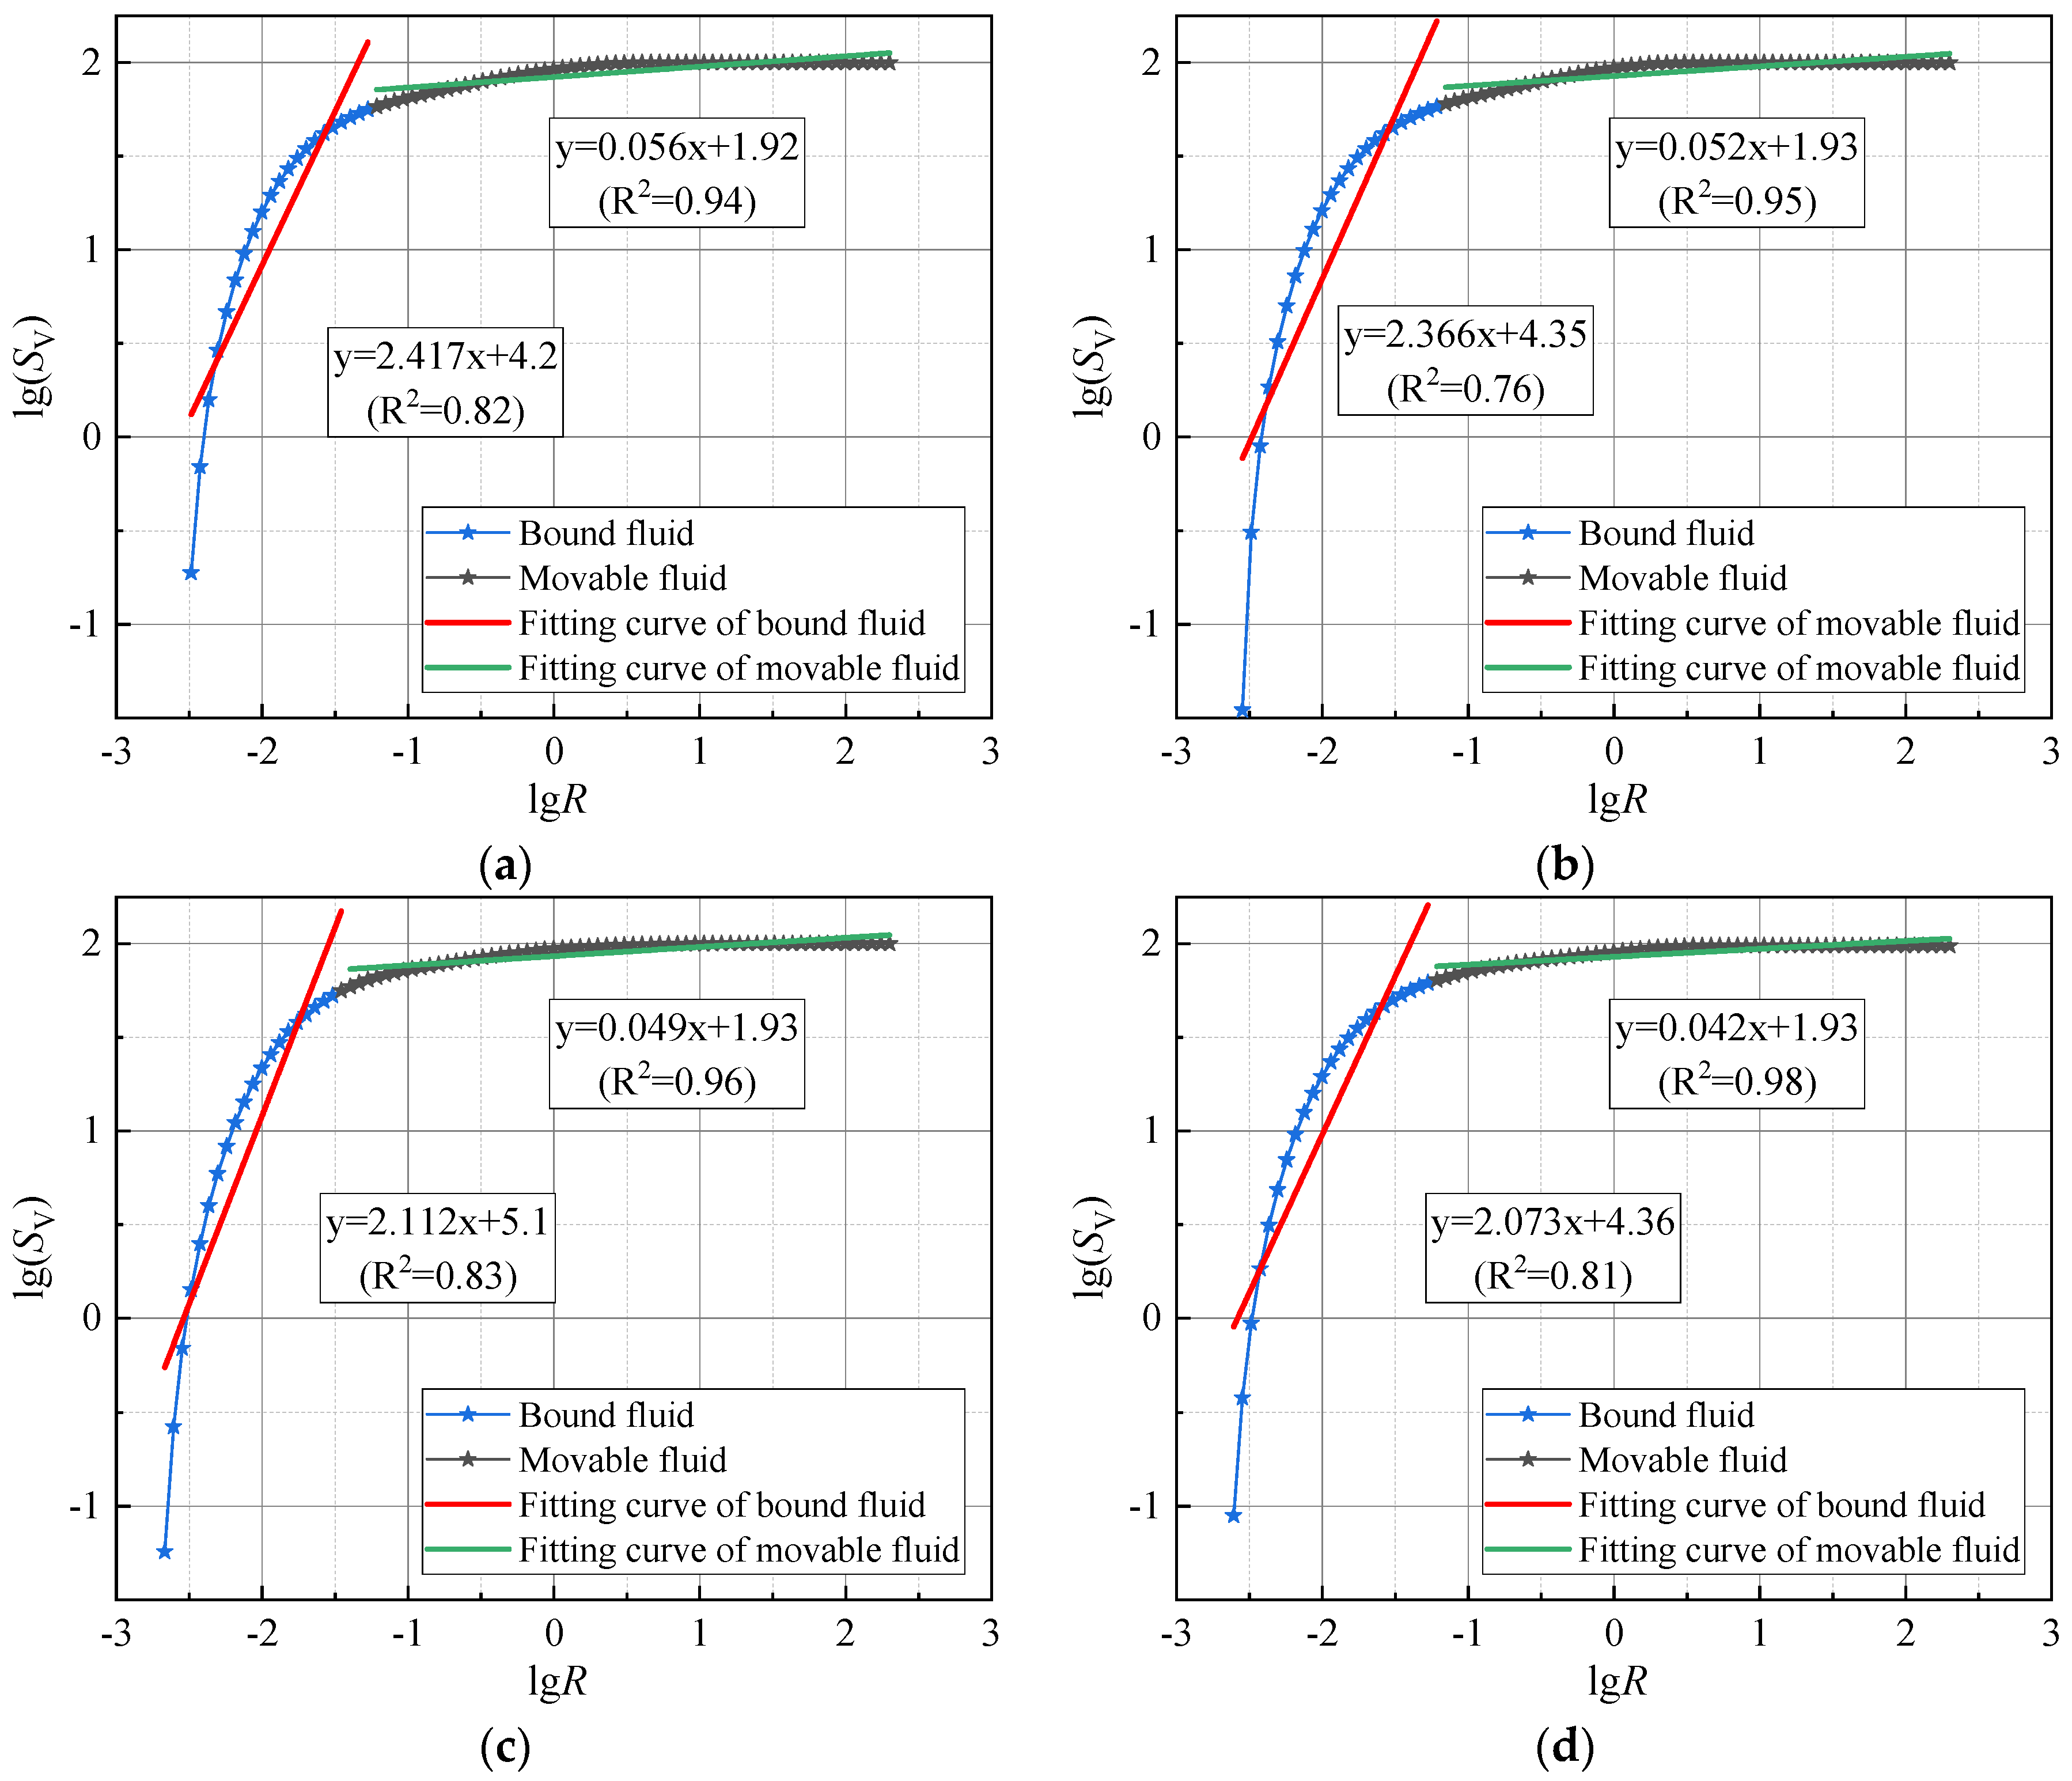
According to Figure 11 and Table 5, sandy soft soil displays distinct regular changes in the fractal dimensions of pore structures as revealed by nuclear magnetic resonance after undergoing various freezing temperatures. As temperatures decrease from −5 °C to −20 °C, the fractal dimensions of both bound and movable fluids gradually increase, exhibiting an upward trend. This suggests that the soil’s pore structure becomes increasingly complex during the freezing process. Further comparisons reveal that the fractal dimensions of movable fluids are more significantly correlated with temperature changes, with correlation coefficients ranging from 0.94 to 0.98. Conversely, the fractal dimensions of bound fluids exhibit weaker correlations with temperature, with correlation coefficients between 0.76 and 0.83, indicating that freeze-up and thaw-sinking mainly affect the sample’s larger pore structures.
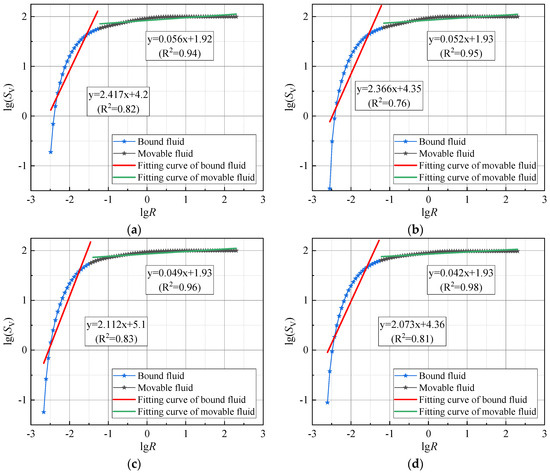
Figure 11.
Pre-freezing lg(SV)-lgR curves of soft soil at different freezing temperatures: (a–d) represent temperatures of −5 °C, −10 °C, −15 °C, −20 °C, respectively.
3.2.2. Analysis of Pre-Freezing Fractal Dimensions of Soft Soil at Various Sand Contents
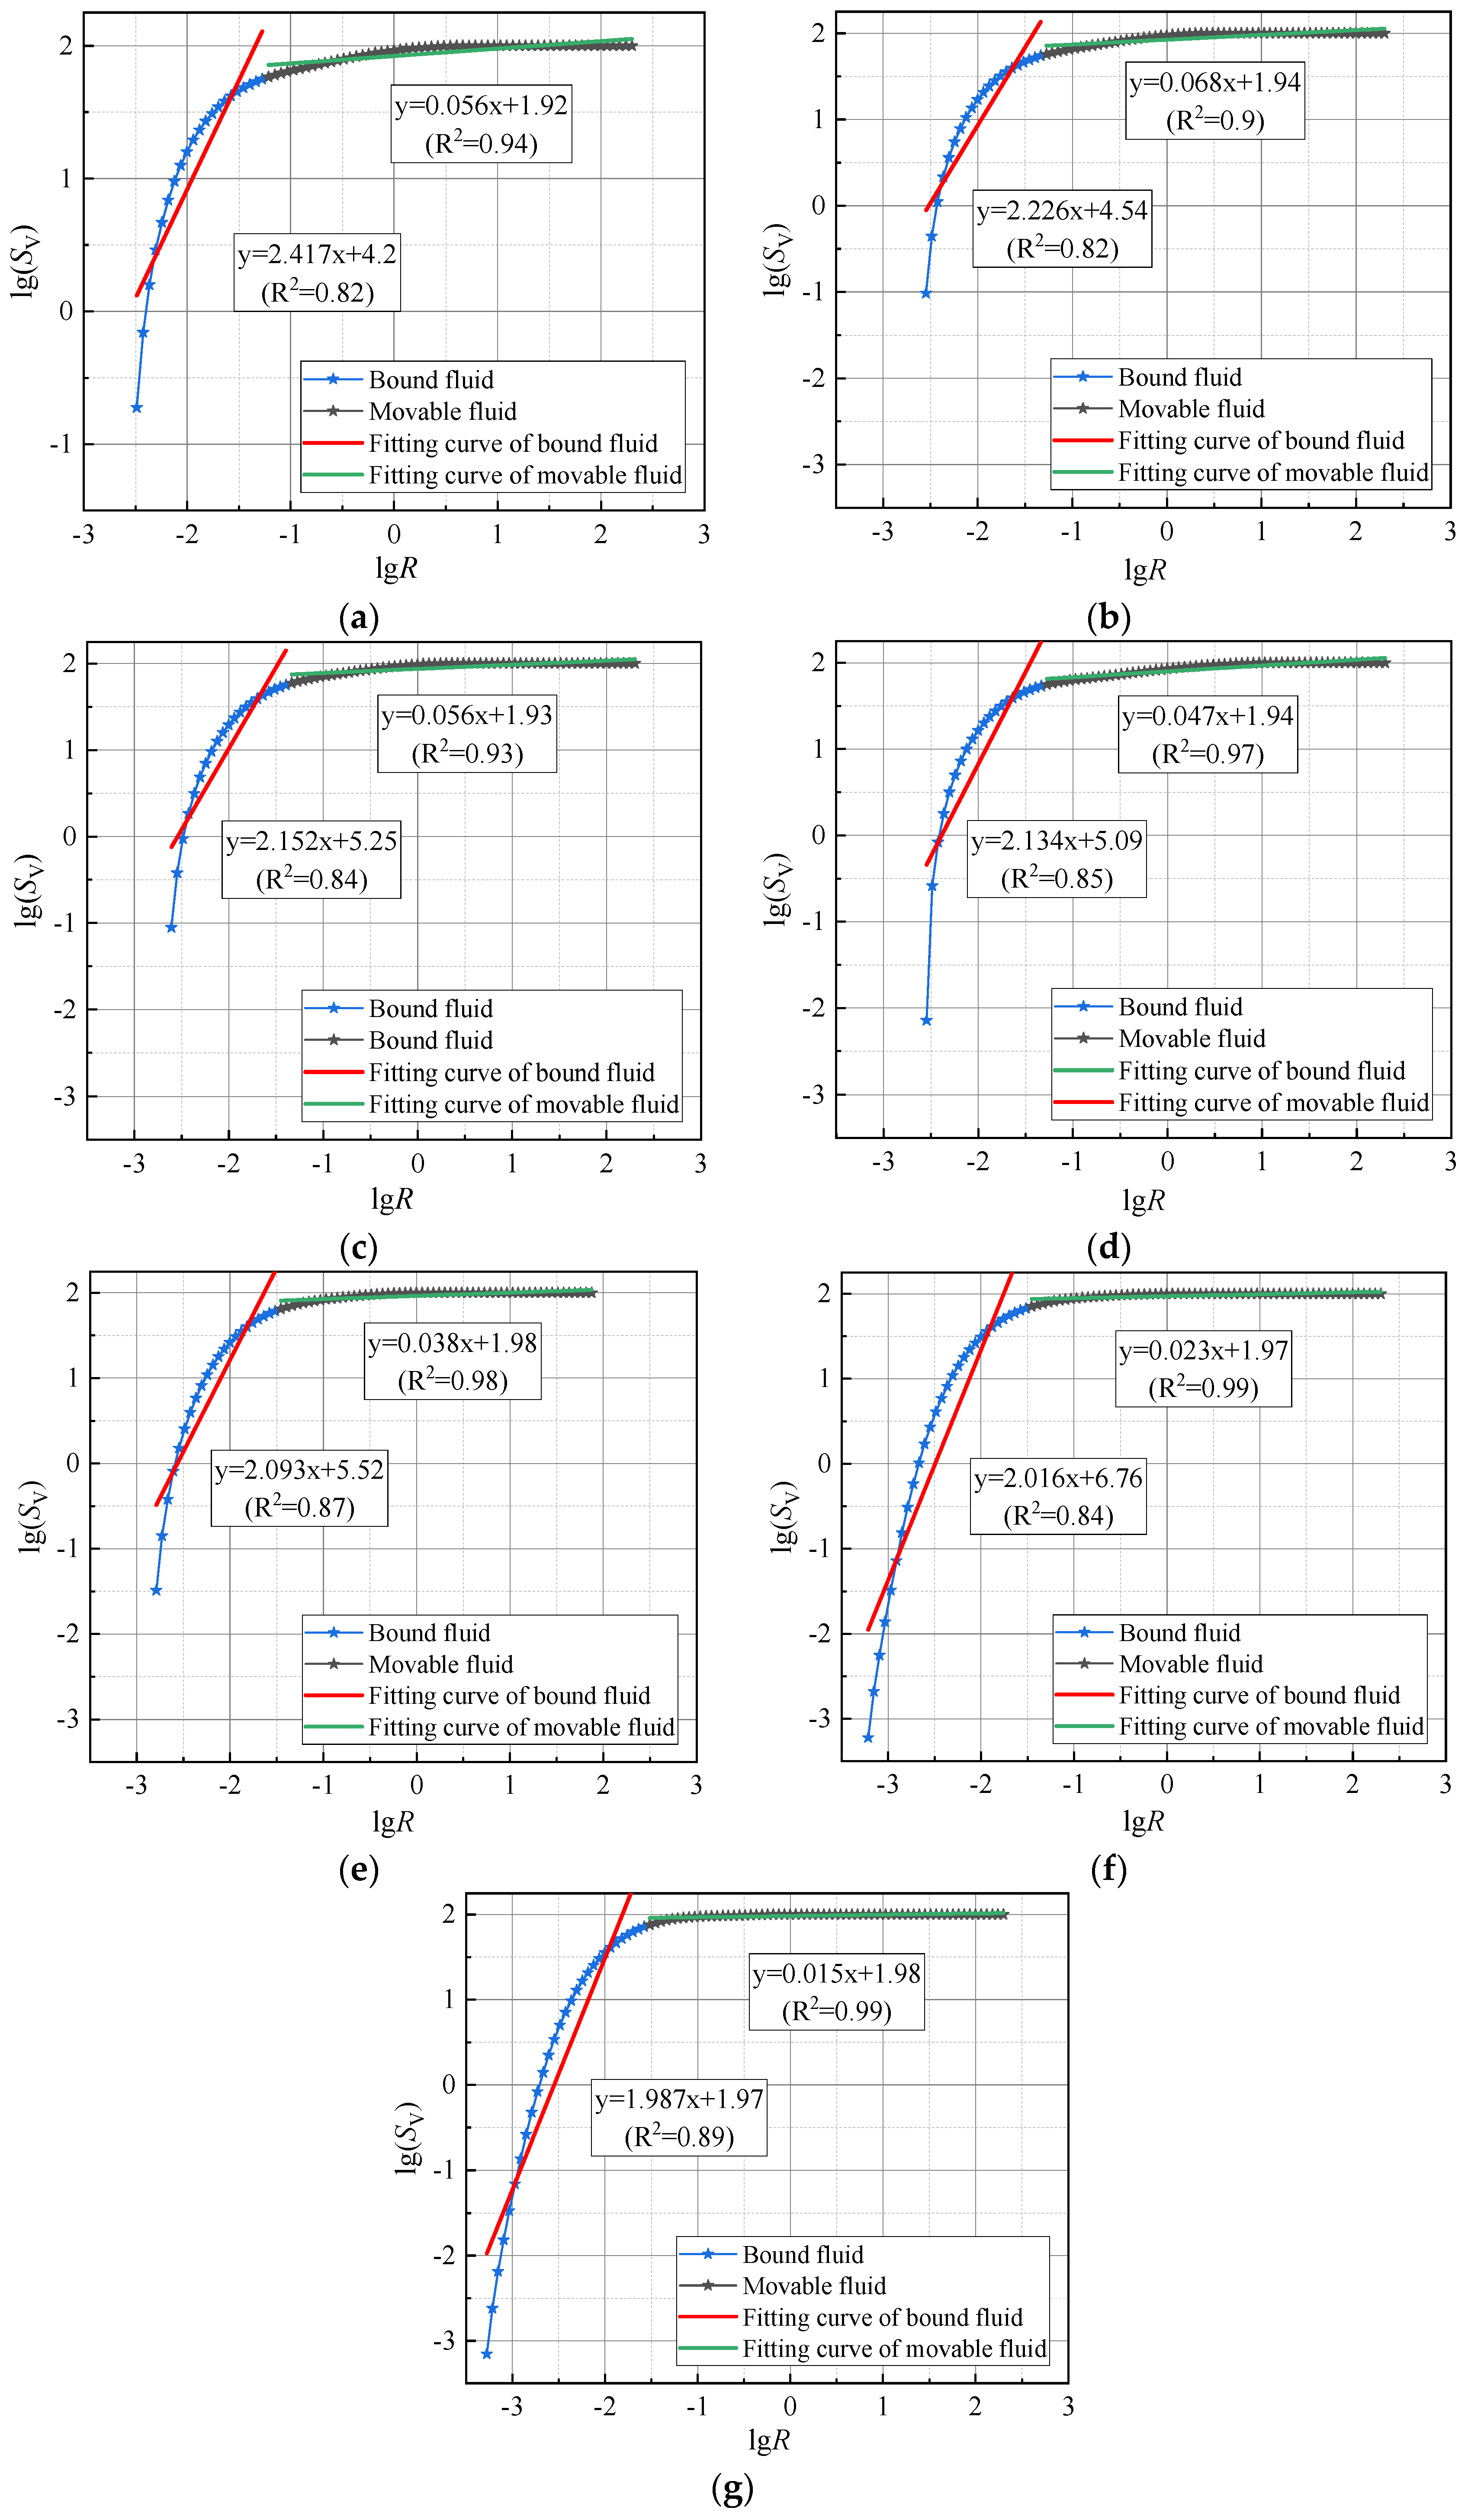
According to Figure 12 and Table 6, the variations in fractal dimensions of soft soils with different sand contents before freezing adhere to fractal laws. Specifically, with increasing sand content, the fractal dimensions of both bound and free fluids exhibit a consistent upward trend. This observation indicates that an increase in sand content results in the enhanced complexity of pore distribution. Comparing the fractal dimensions of bound fluid (Db 0.82–0.89) and free fluid (Dm 0.89–0.99), it is clear that the fractal features of the free fluid are more pronounced than those of the bound fluid, primarily due to the irregular sands forming more branched and complex large void structures.
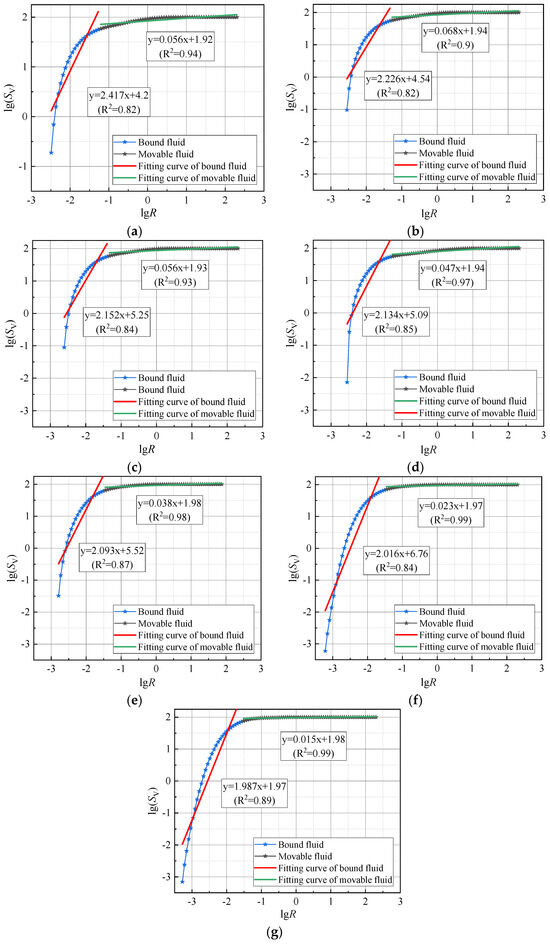
Figure 12.
Pre-freezing lg(SV)-lgR curves of soft soil at different sand contents: (a–g) represent sand contents of 0%, 5%, 10%, 15%, 20%, 25%, 30%, respectively.
Table 6.
Pre-freezing fractal dimension statistics for soft soil at various sand contents.
3.2.3. Analysis of Post-Freeze–Thaw Fractal Dimensions of Soft Soil at Various Sand Contents
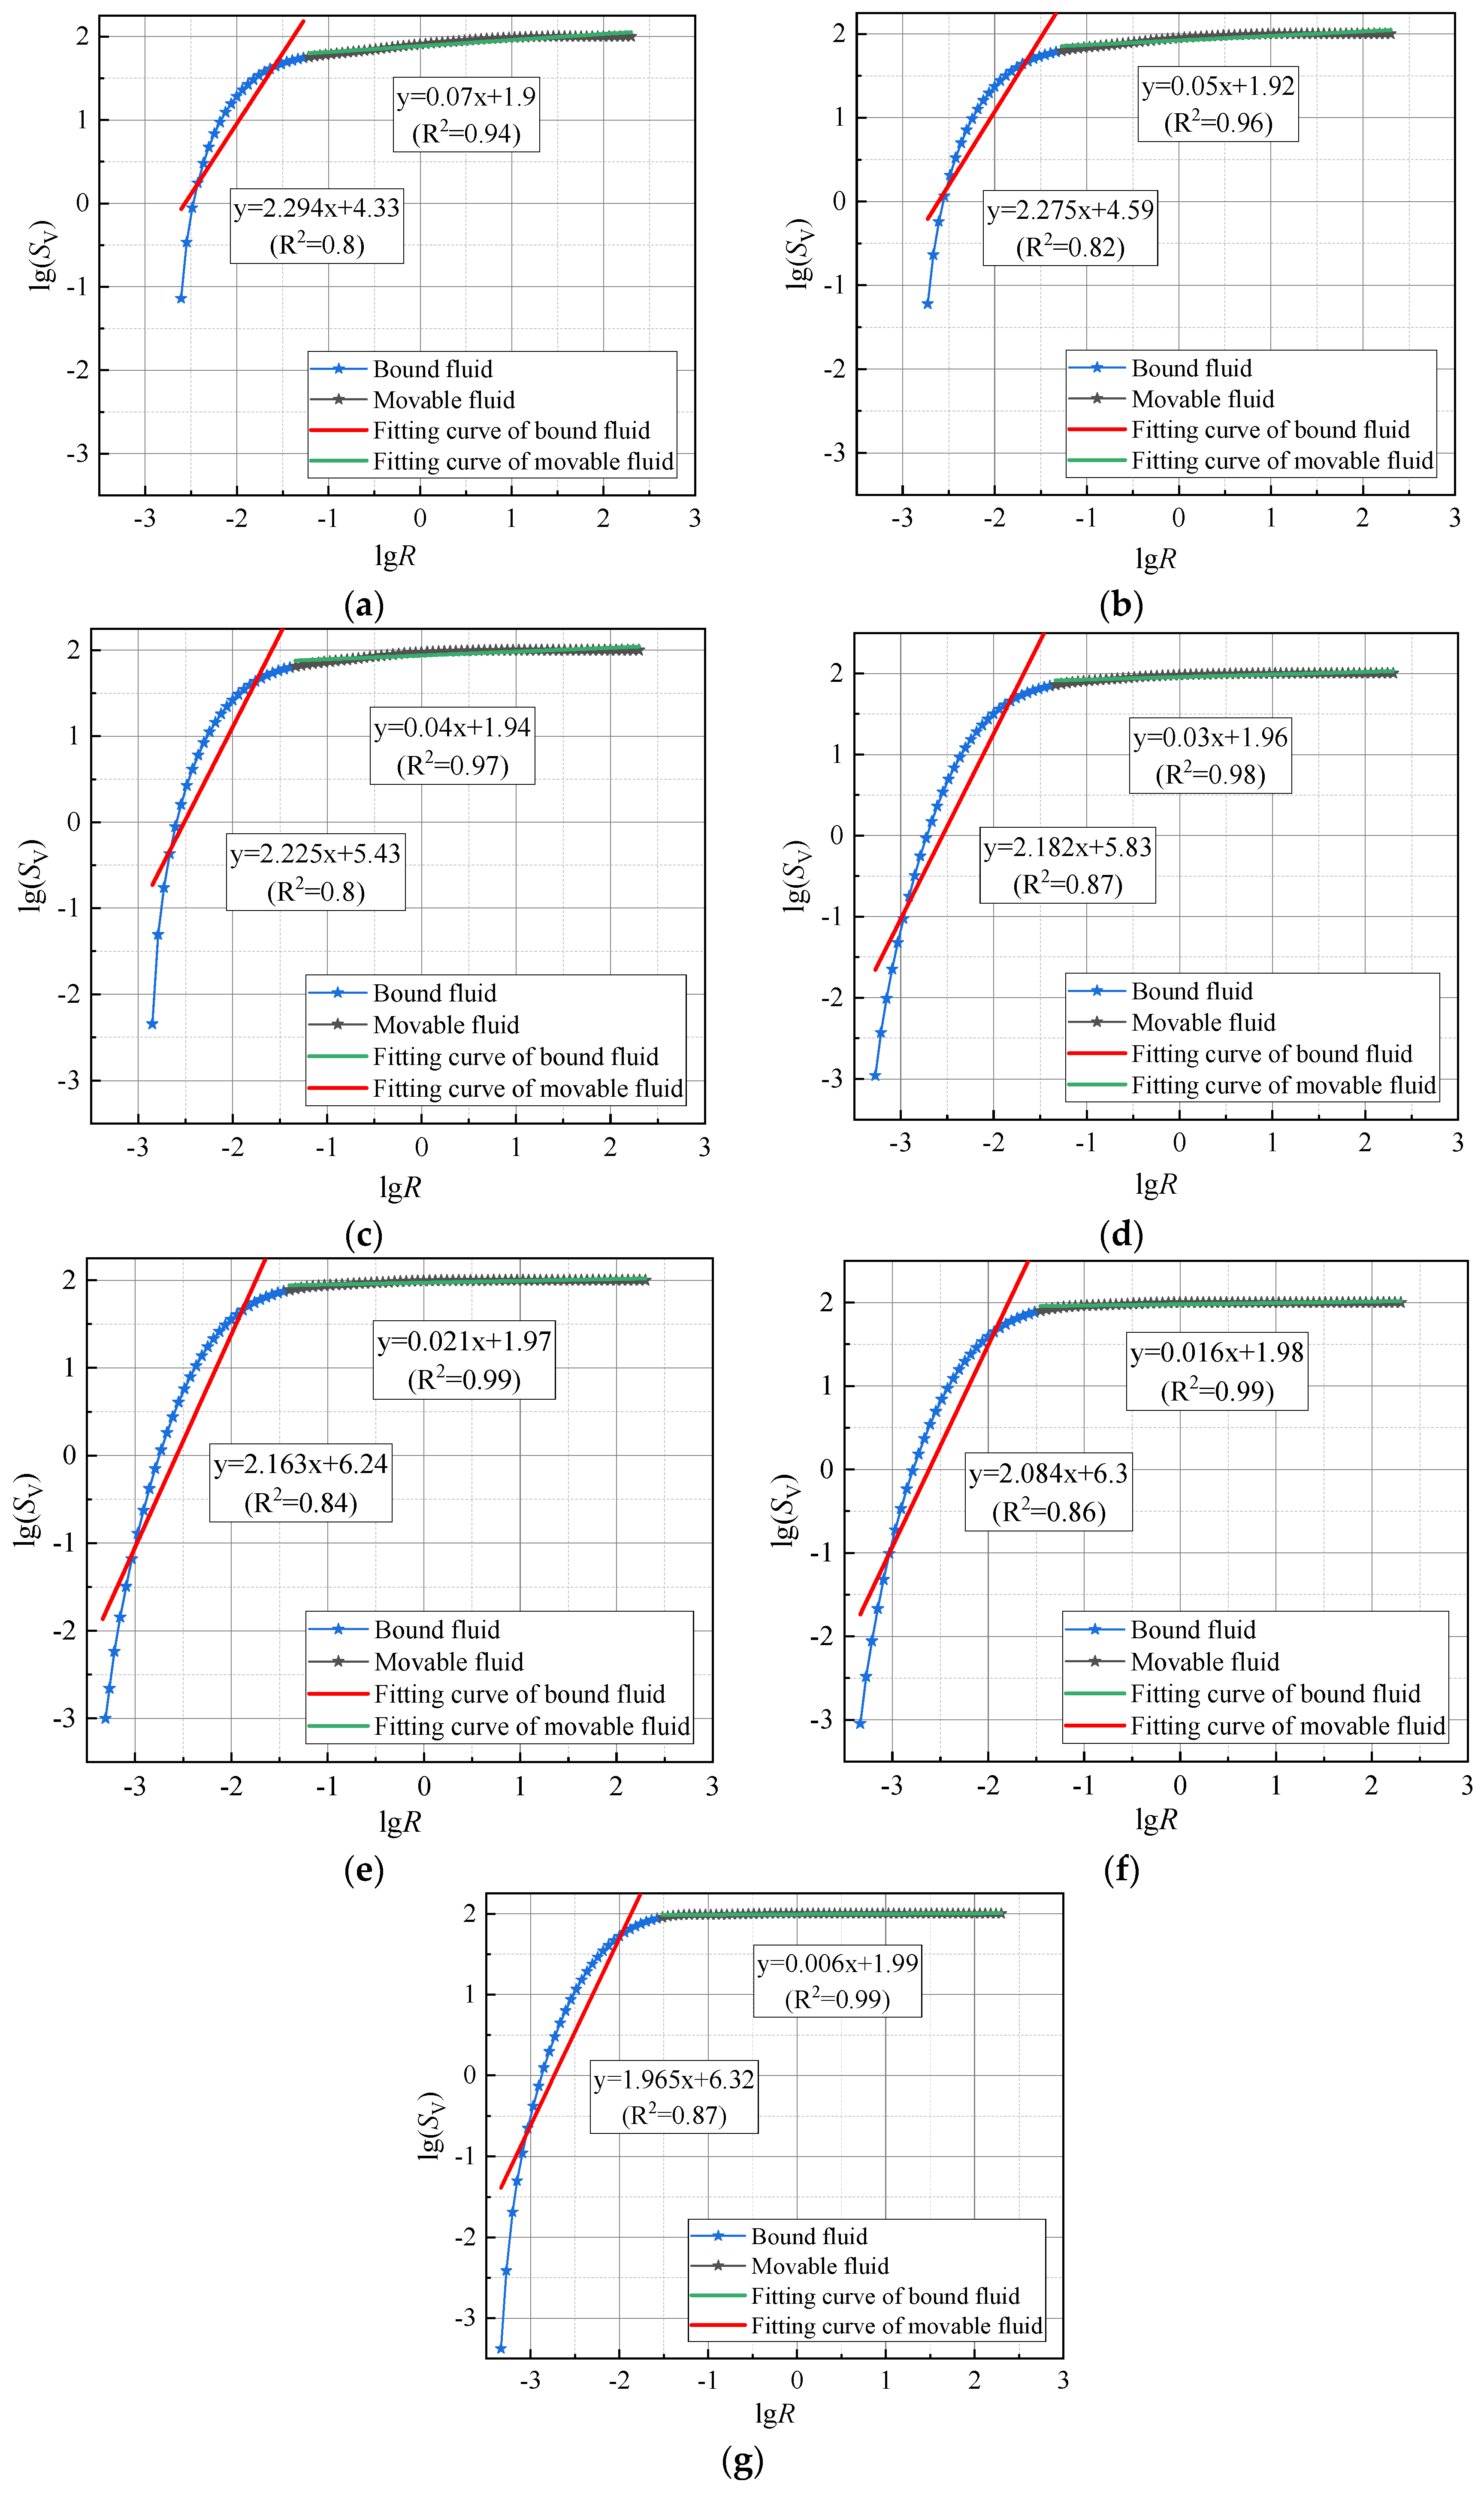
According to Figure 13 and Table 7, the fractal dimensions of soft soil with varying sand contents continue to follow pre-freezing fractal laws even after undergoing freeze–thaw effects. Fractal dimensions increase gradually with rising sand content, and the fractal characteristics of movable fluid are more pronounced than those of bound fluid. Changes in fractal dimensions before and after freezing correspond to the complexity of pore distribution, illustrating the internal damage process in sandy soft soil under freeze–thaw conditions. For bound fluid, the fractal dimensions of smaller pores slightly decrease post freeze–thaw, primarily because small pore water freezes and expands into larger pores, reducing the quantity of smaller pores. Consequently, the number of larger pores increases, thereby enhancing the fractal dimensions of movable fluid post freeze–thaw.
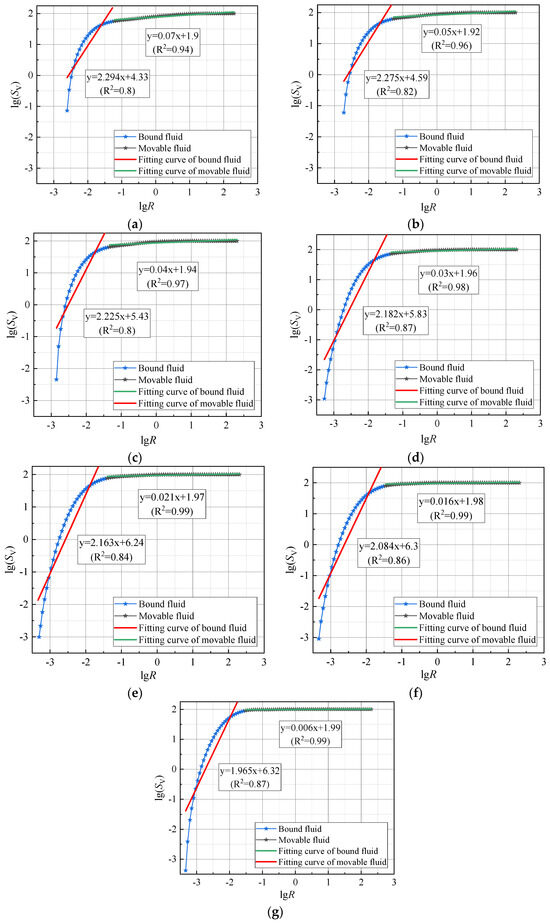
Figure 13.
Post-thaw lg(SV)-lgR curves of soft soil at different sand contents: (a–g) represent sand contents of 0%, 5%, 10%, 15%, 20%, 25%, 30%, respectively.
Table 7.
Post-freeze–thaw fractal dimension statistics for soft soil at various sand contents.
3.3. Analysis of the Unconfined Compressive Strength of Frozen Sand–Clay Mixtures
As shown in Figure 14 and Table 8, unconfined compressive strength tests were conducted on frozen sandy soft soil with sand content rates of 0%, 5%, 15%, 20%, 25%, and 30% at freezing temperatures of −5 °C, −10 °C, −15 °C, and −20 °C. The resulting graph illustrates the relationship between unconfined compressive strength, sand content rate, and freezing temperature, described by the following equation:
where is the unconfined compressive strength, T is the freezing temperature, and S is the sand content. As the sand content in the frozen sand–clay increases, its strength exhibits a decreasing trend. This is because the increase in sand particles reduces the soil’s cohesion. Furthermore, as the sand content increases, the soil’s permeability improves, enhancing water mobility. This increased water mobility hinders the freezing of water, thereby reducing the soil’s freezing capacity and subsequently affecting its post-freezing structural strength.
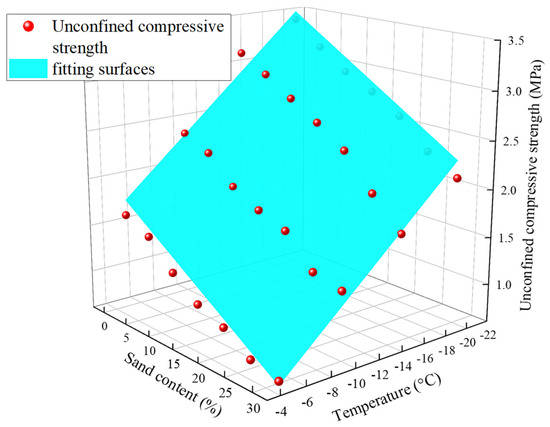
Figure 14.
The relationship between compressive strength, sand content, and freezing temperature.
Table 8.
Unconfined compressive strength of frozen sand–clay mixtures under various test conditions.
As the temperature decreases, the strength of the frozen sandy soft soil increases. This occurs because, under low-temperature conditions, the liquid phase water in the soil transitions to solid ice. The solid ice bonds the loose soil particles together, forming a much more stable frozen soil compared to non-frozen soil. As the temperature continues to decrease, the rate of phase transition of water in the soil increases, reducing its deformation capacity and making it more rigid and stable. This, in turn, leads to an increase in unconfined compressive strength.
4. Discussion
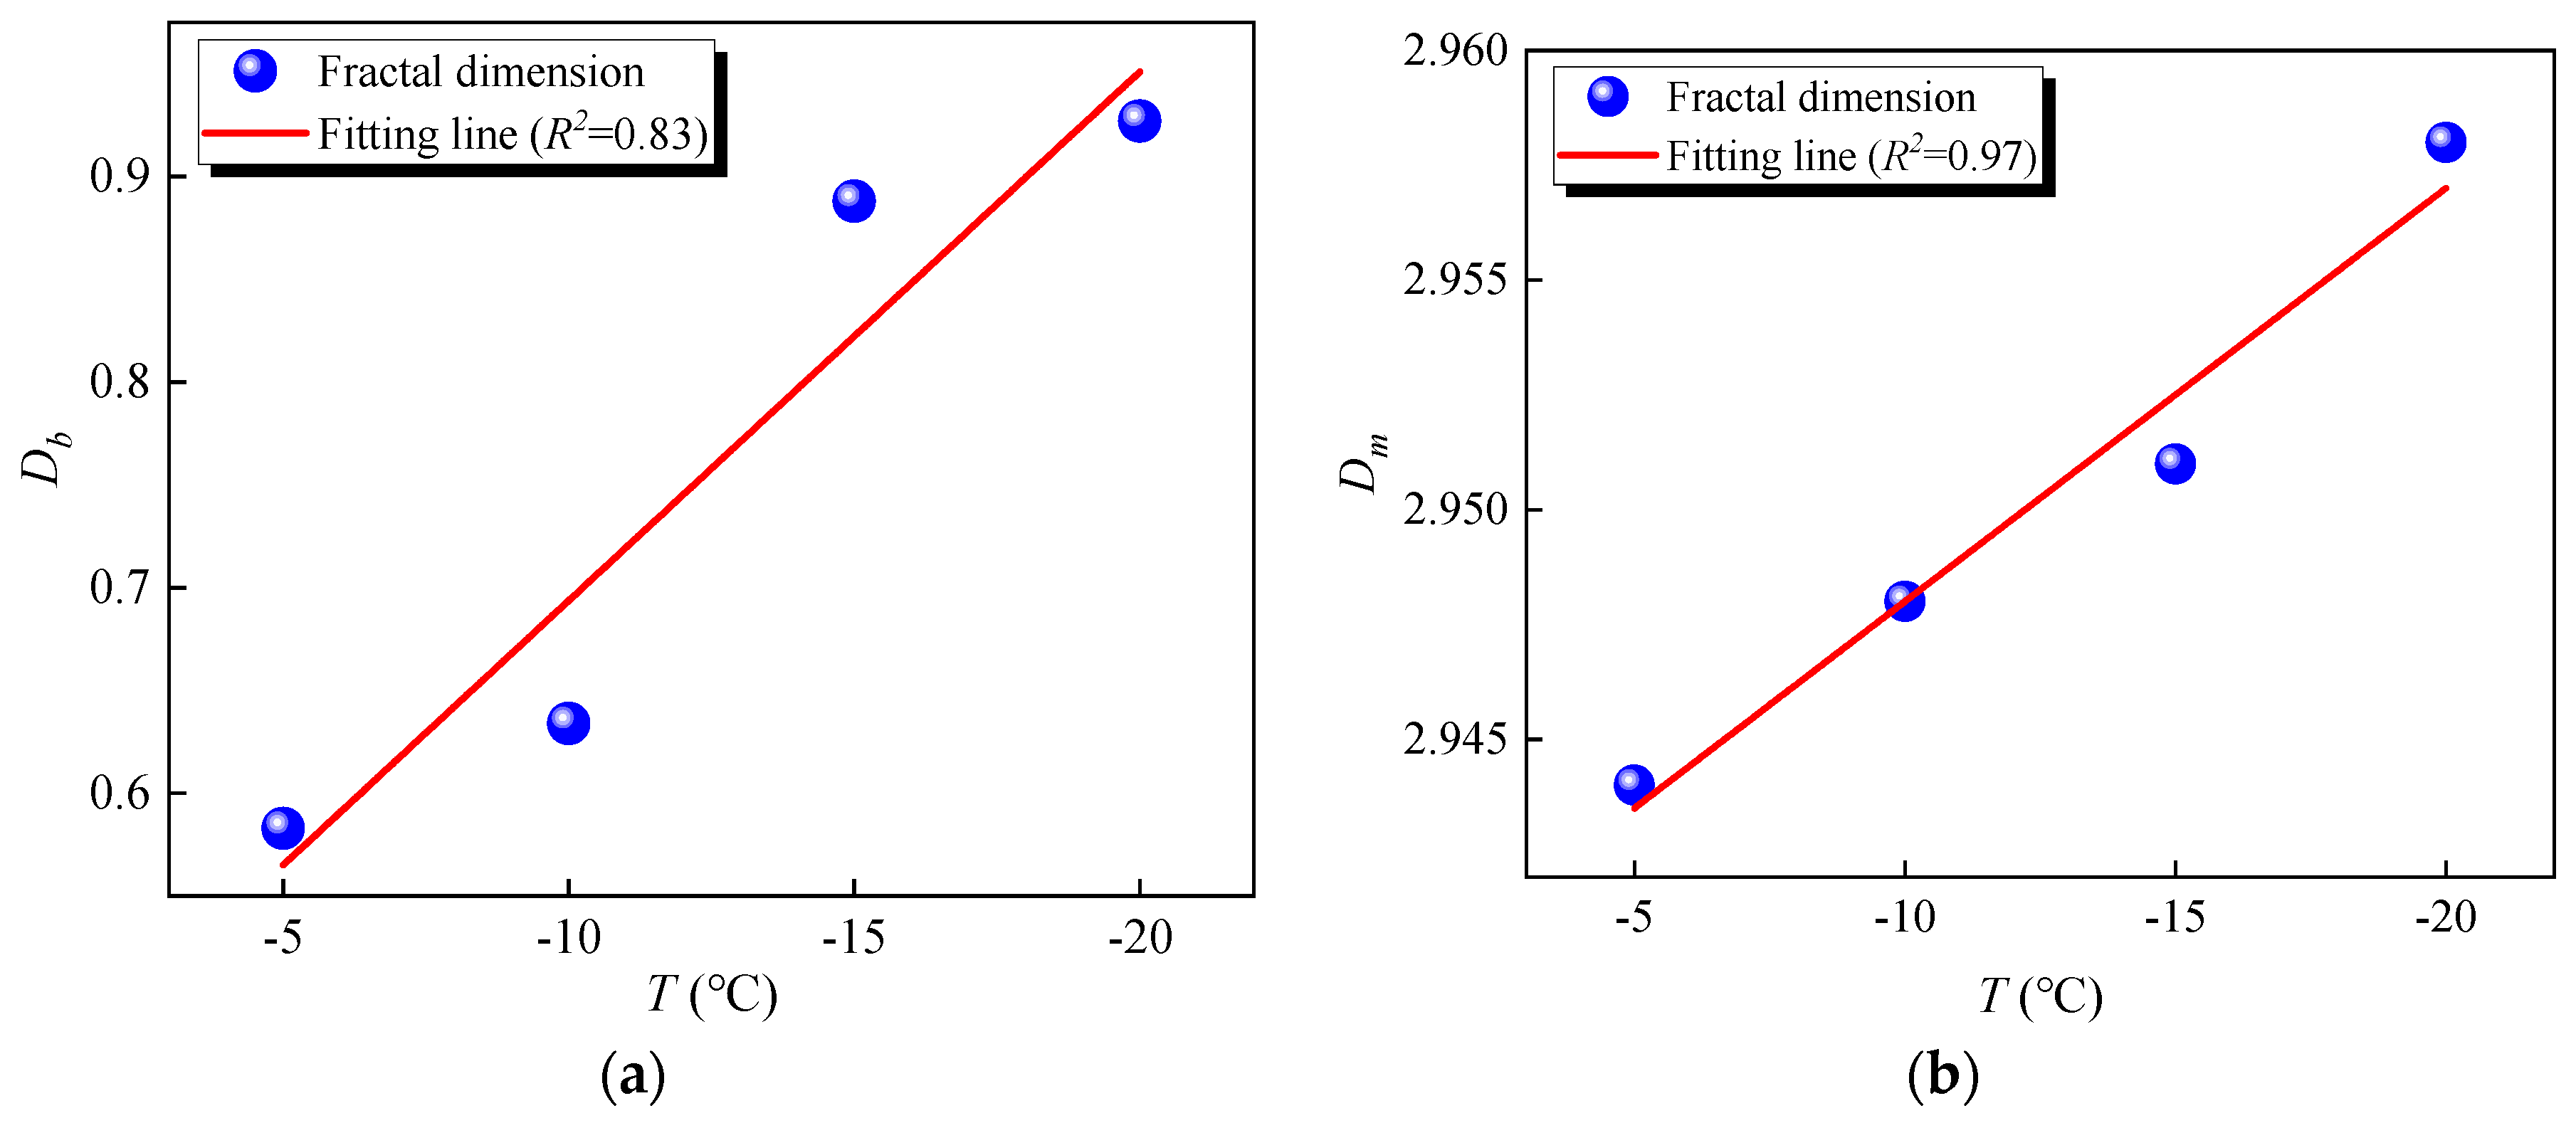
Figure 15a,b illustrate the relationship between fractal dimensions and freezing temperatures, vividly showing the extent of damage to pore structures due to freezing. Both bound and movable fluids’ fractal dimensions show a notable correlation with freezing temperatures, with the correlation being more significant for movable fluid. This occurs because the freezing process entails an energy exchange and lower freezing temperatures have greater energy to break chemical and physical bonds between pore water. Consequently, lower freezing temperatures lead to a looser skeletal structure and higher fractal dimensions. Additionally, since larger pore waters have higher volumes and their water molecules exhibit greater freedom of movement, they are more susceptible to freezing than smaller pore waters, further substantiating the stronger correlation of fractal dimensions with temperature in movable fluids compared to bound fluids.
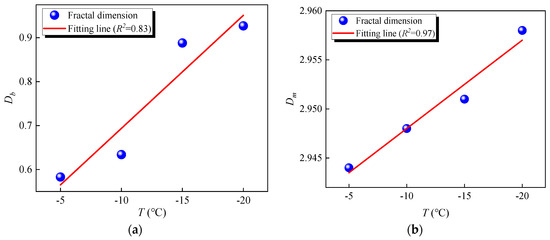
Figure 15.
Fractal dimensions of sandy soft soil at different freezing temperatures: (a) fractal dimension for bound fluid; (b) fractal dimension for movable fluid.
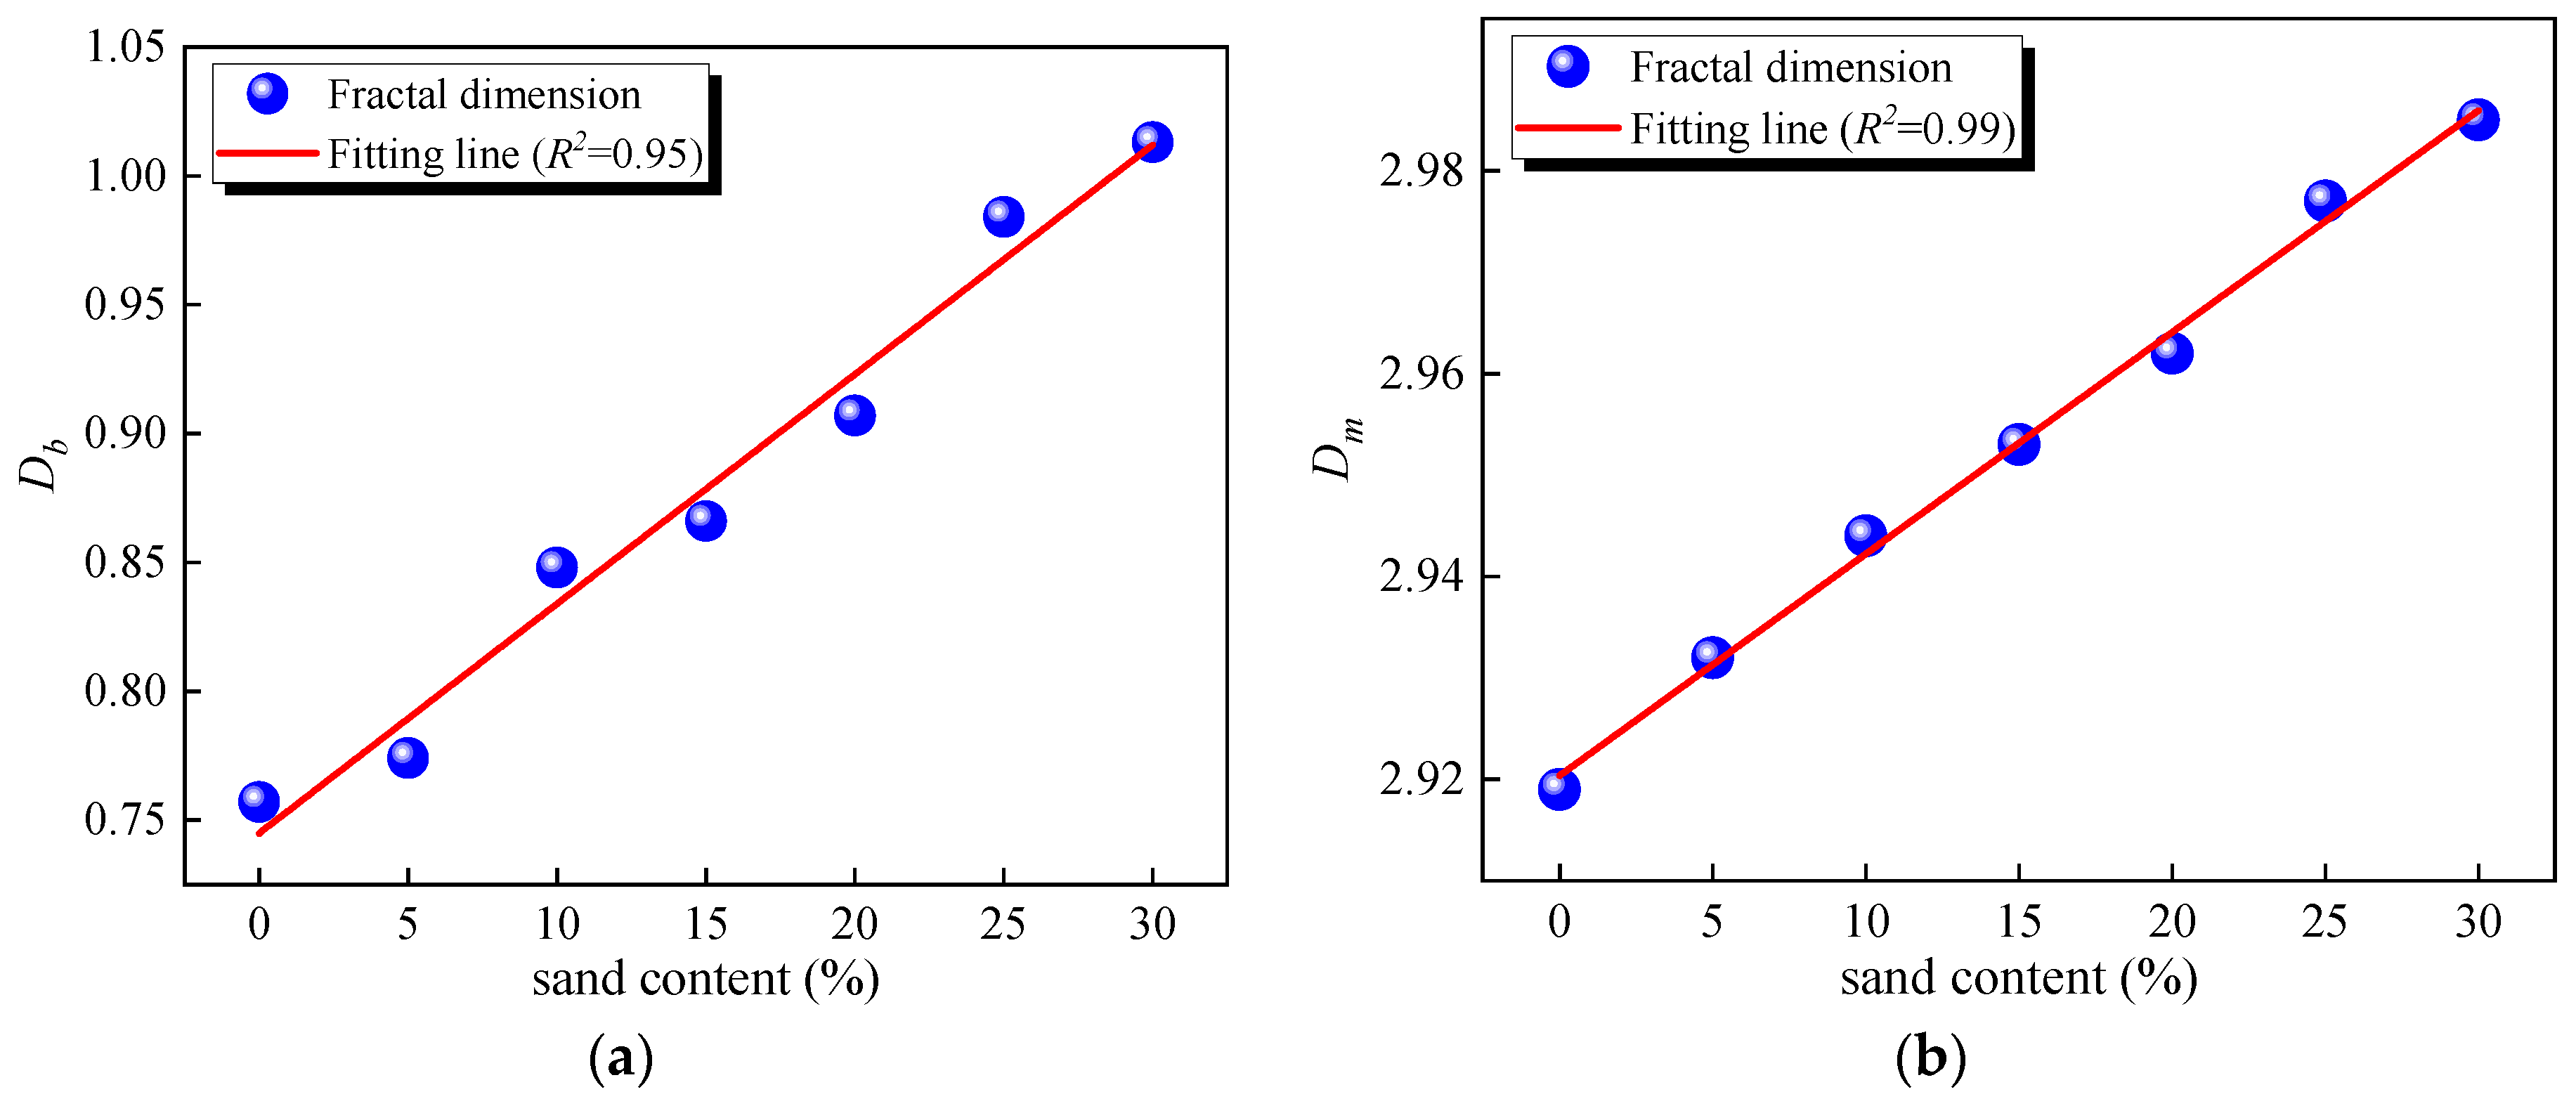
Figure 16a,b show the relationship between the fractal dimensions of sand-containing soft soils before freezing and the sand content, clearly illustrating the impact of sand content on pore structures. The fractal dimensions of both bound and free fluids exhibit a linear correlation with sand content. In soils with a higher sand content, pores are larger and distributed more irregularly and unevenly, contributing to an increase in fractal dimensions. The fractal dimension of the free fluid has a stronger correlation with the sand content because the sand has large particles, which form more irregular and large voids.
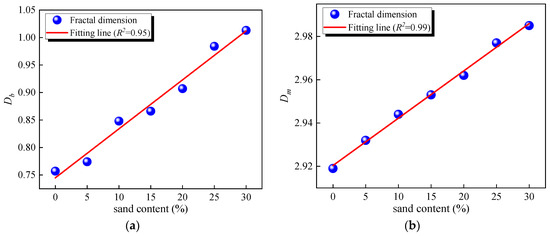
Figure 16.
Fractal dimension of sandy soft soil before freezing: (a) fractal dimension for bound fluid; (b) fractal dimension for movable fluid.
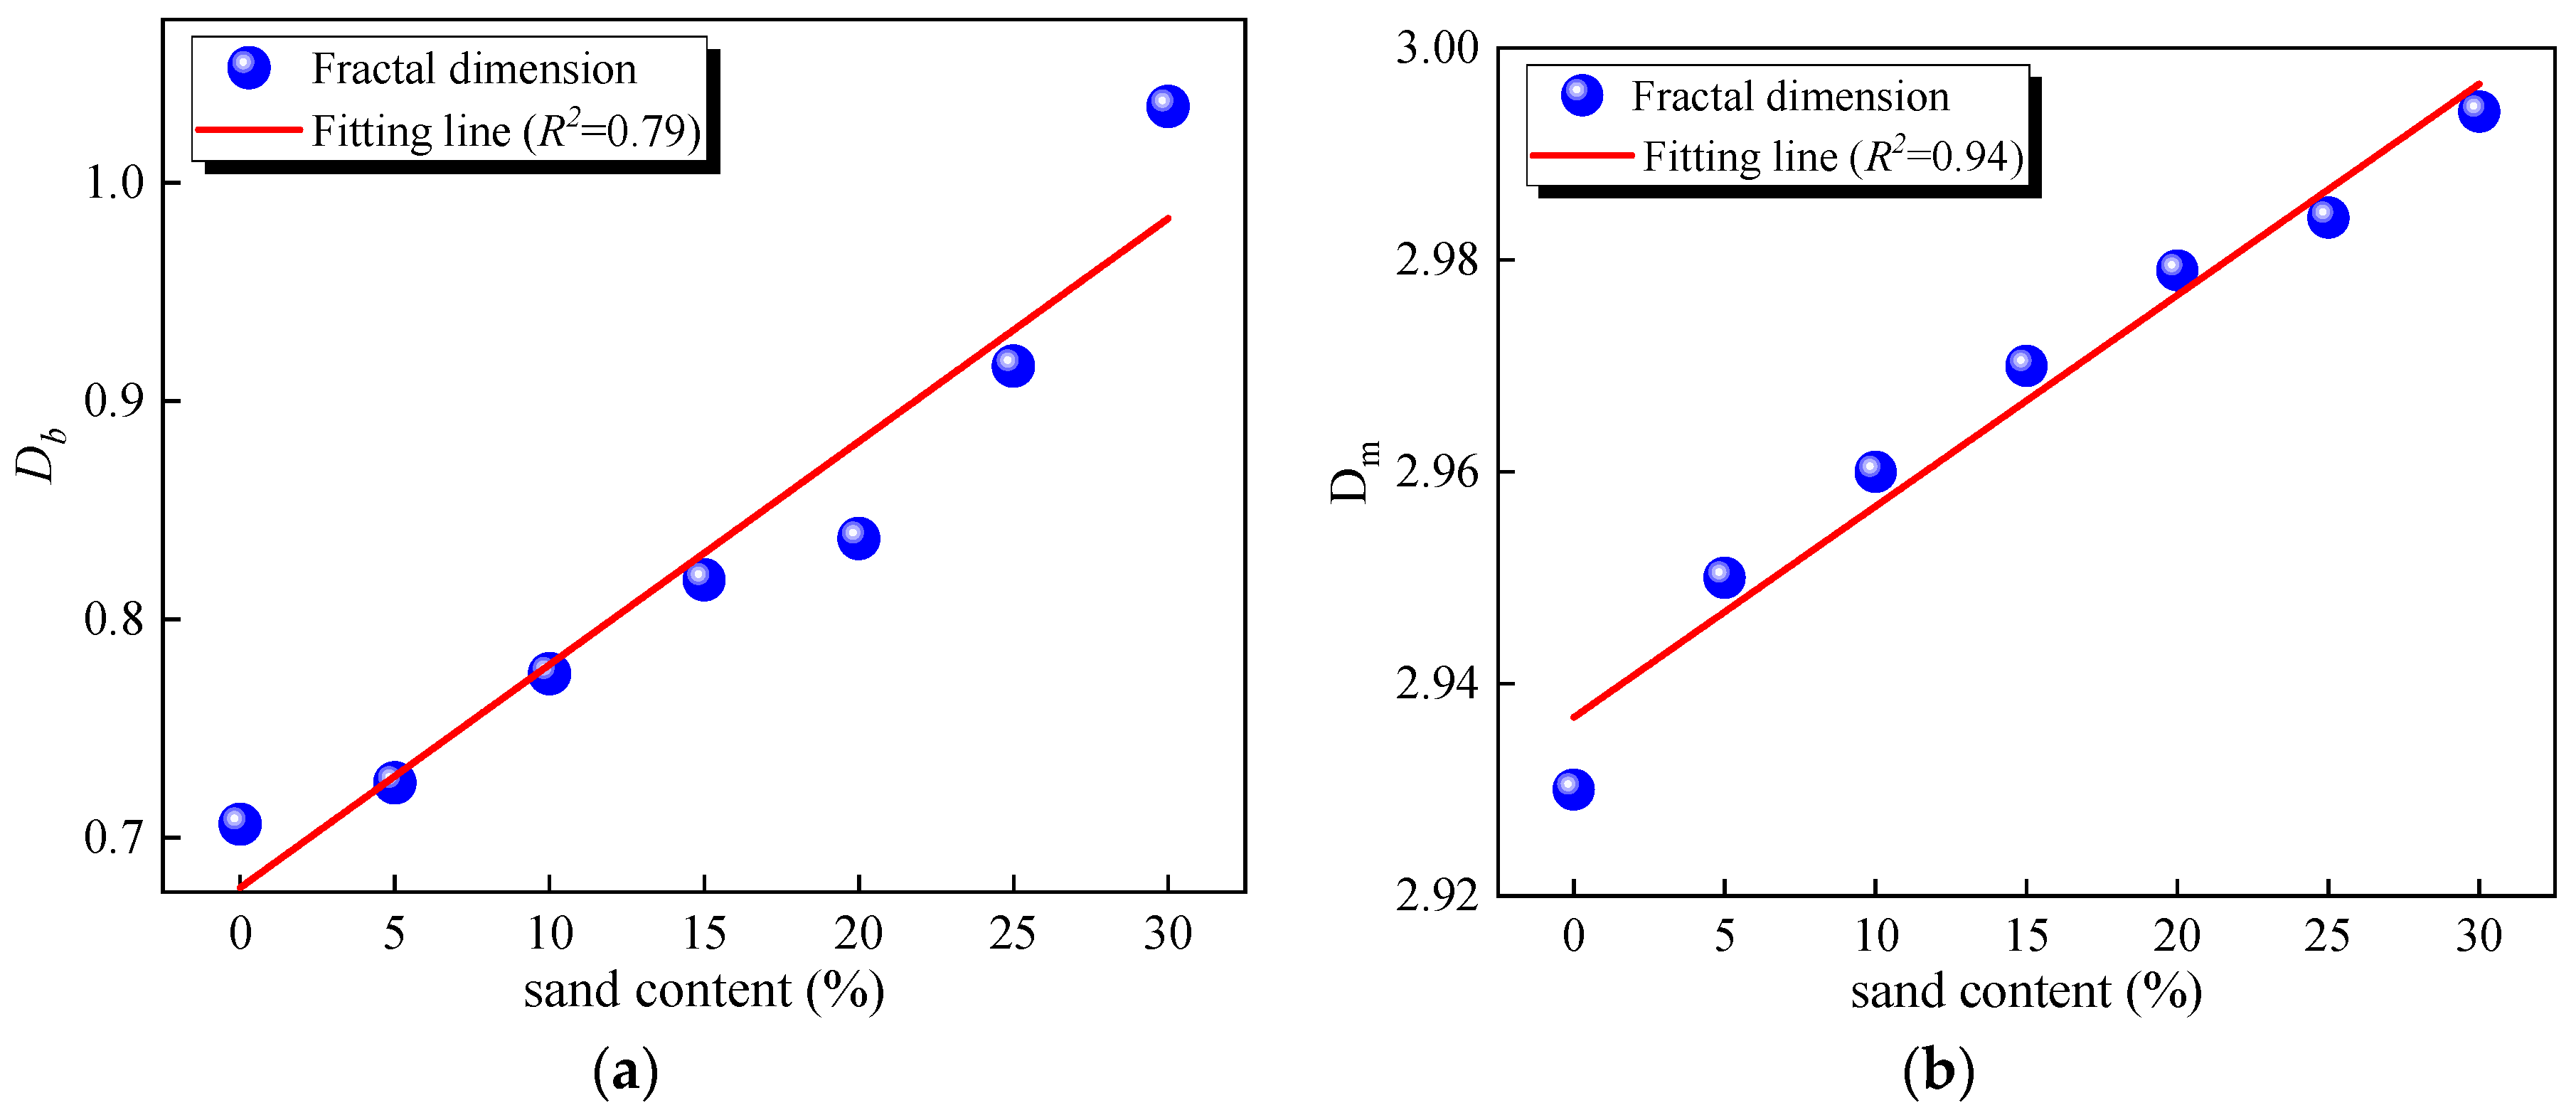
Figure 17a,b show the relationship between the post-freeze–thaw fractal dimensions of sandy soft soil and sand content, showing clear correlations for both bound and movable fluids’ fractal dimensions with sand content. However, these correlations are diminished compared to pre-freezing, primarily because sand resists deformation. After freezing, the specimen’s freezing and thawing are “suppressed” by the sand, weakening the correlation between the fractal dimension and sand content.
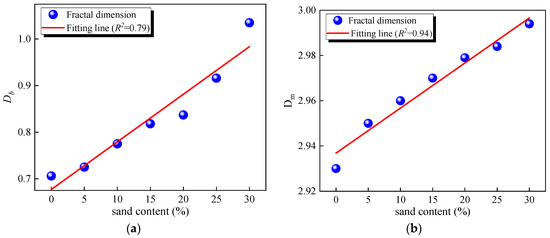
Figure 17.
Fractal dimension of sandy soft soil after freeze–thaw: (a) fractal dimension for bound fluid; (b) fractal dimension for movable fluid.
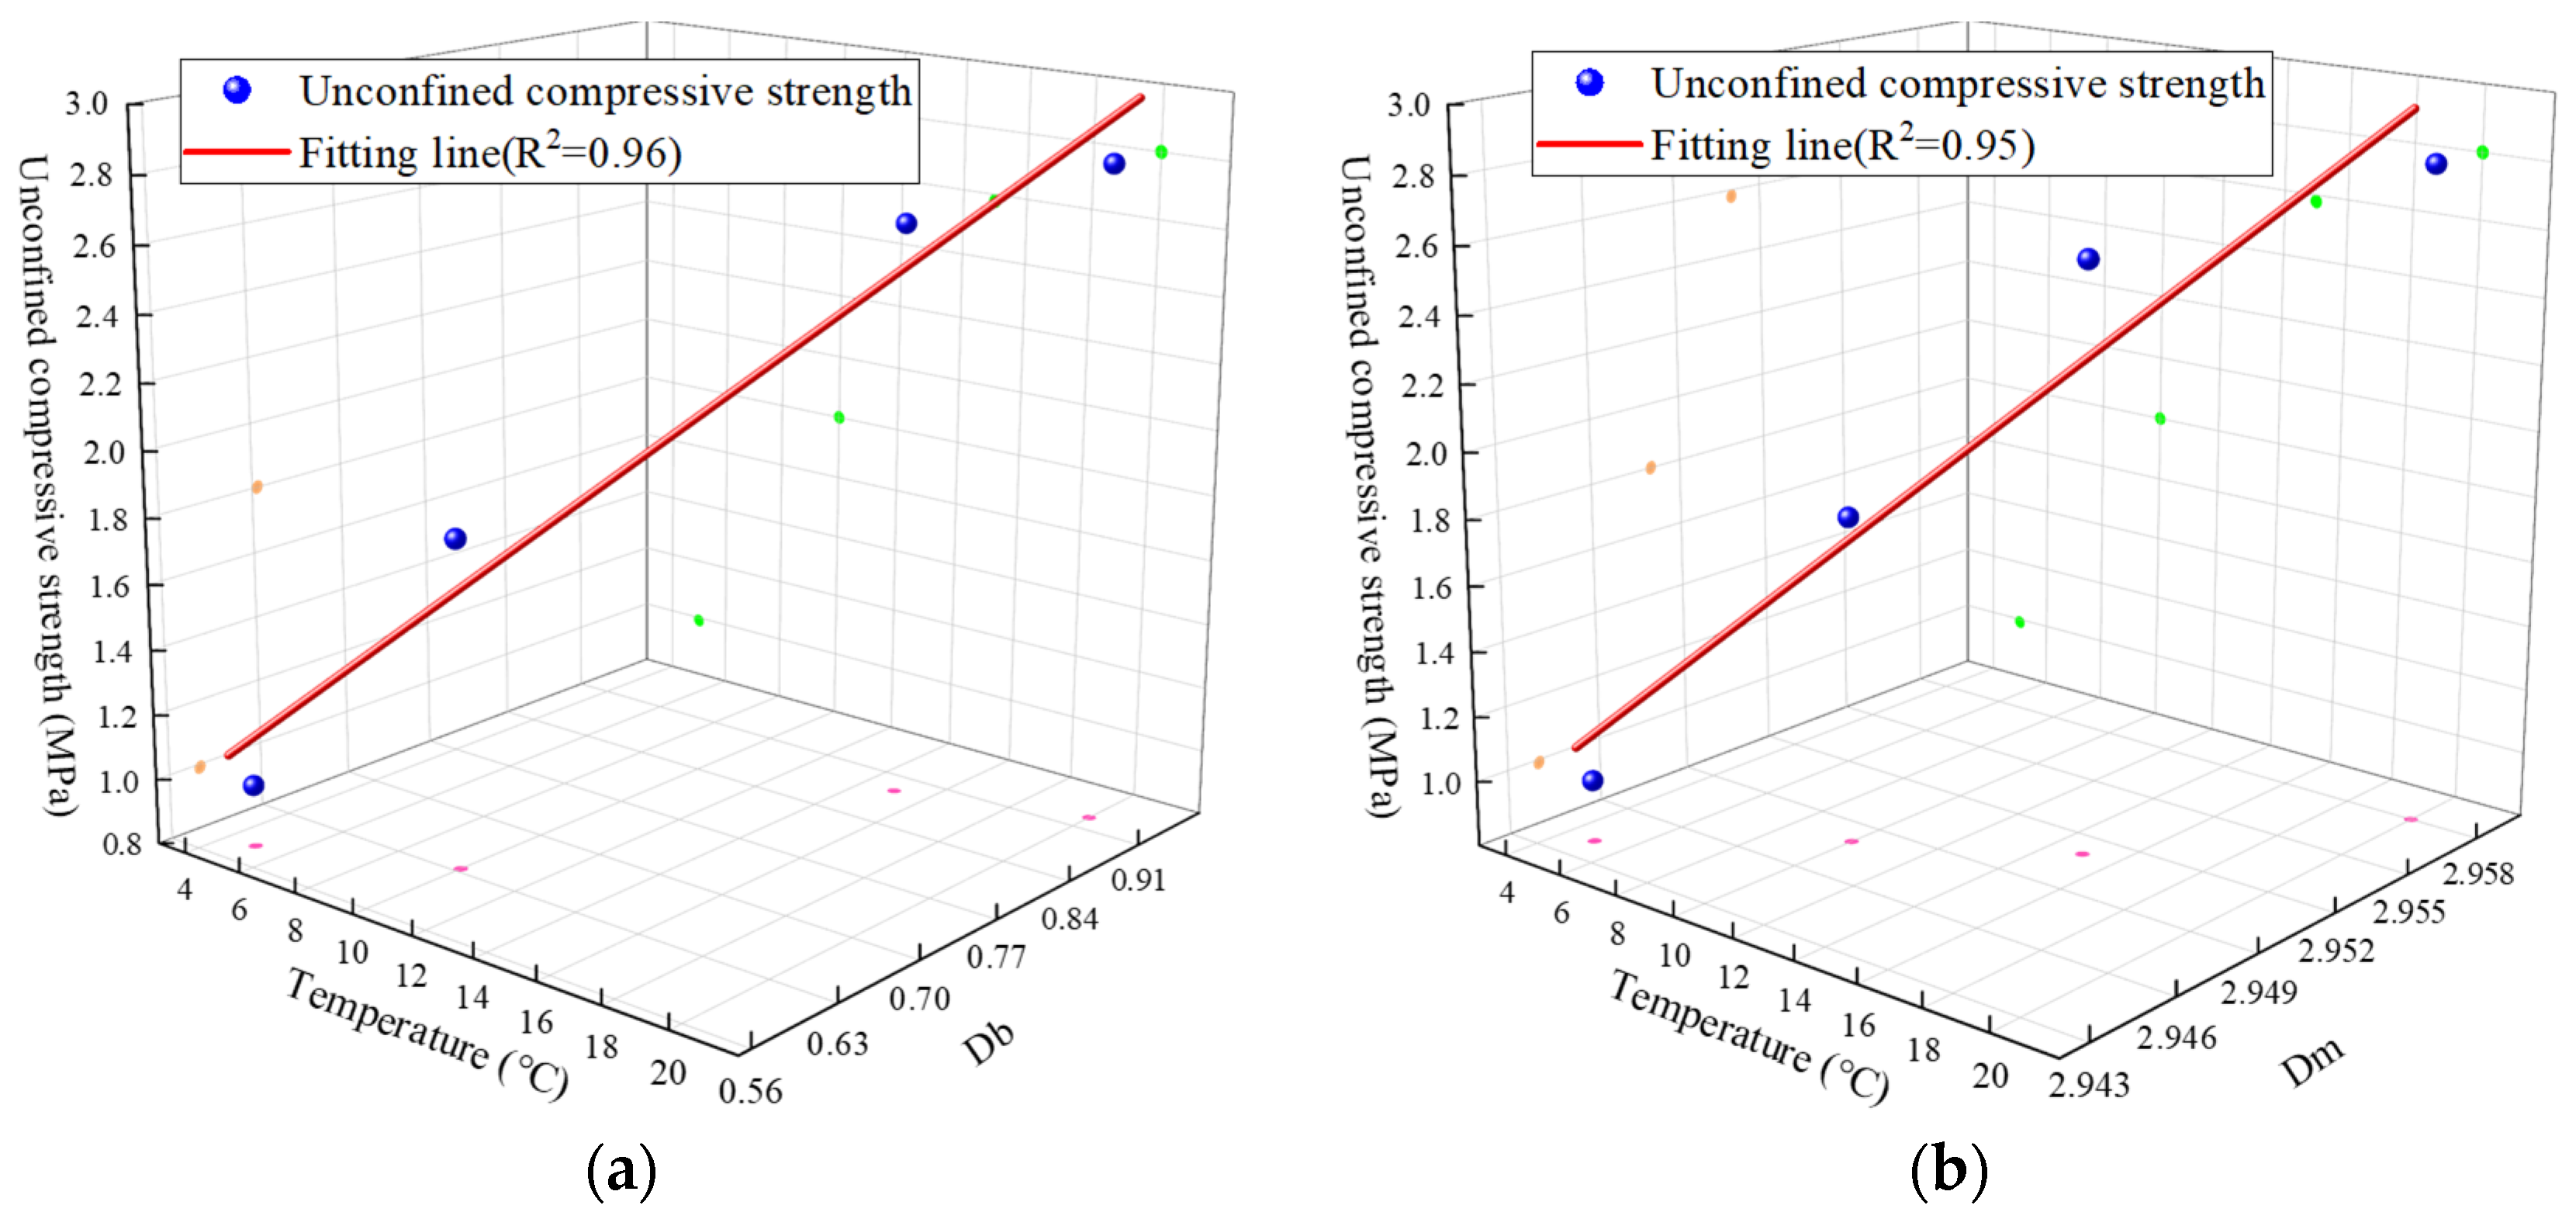
Figure 18a,b depict the relationship between the fractal dimension, freezing temperature, and unconfined compressive strength of frozen–thawed sand–clay. It is evident that the fractal dimension significantly influences the unconfined compressive strength. The fractal dimensions of both bound fluid and movable fluid exhibit a linear correlation with freezing temperature. From the previously discussed conclusions, it is known that when only the freezing temperature is lowered, it leads to a larger fractal dimension and the creation of a large number of pores with an irregular distribution and a high degree of inhomogeneity, and the structurally complex pores created in this case lead to a higher degree of freezing of the soil and consequently to a greater compressive strength of the frozen soil. At this point the change in fractal dimension is positively correlated with the strength of the permafrost.
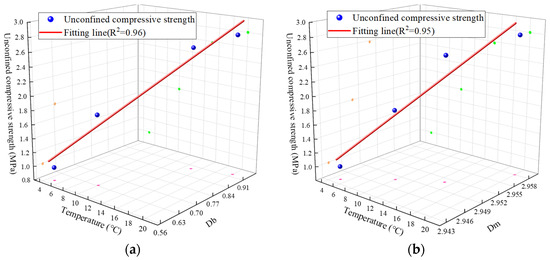
Figure 18.
The relationship between compressive strength, freezing temperature, and fractal dimension. (a) The relationship between bound fluid fractal dimension and compressive strength. (b) The relationship between movable fluid fractal dimension and compressive strength.
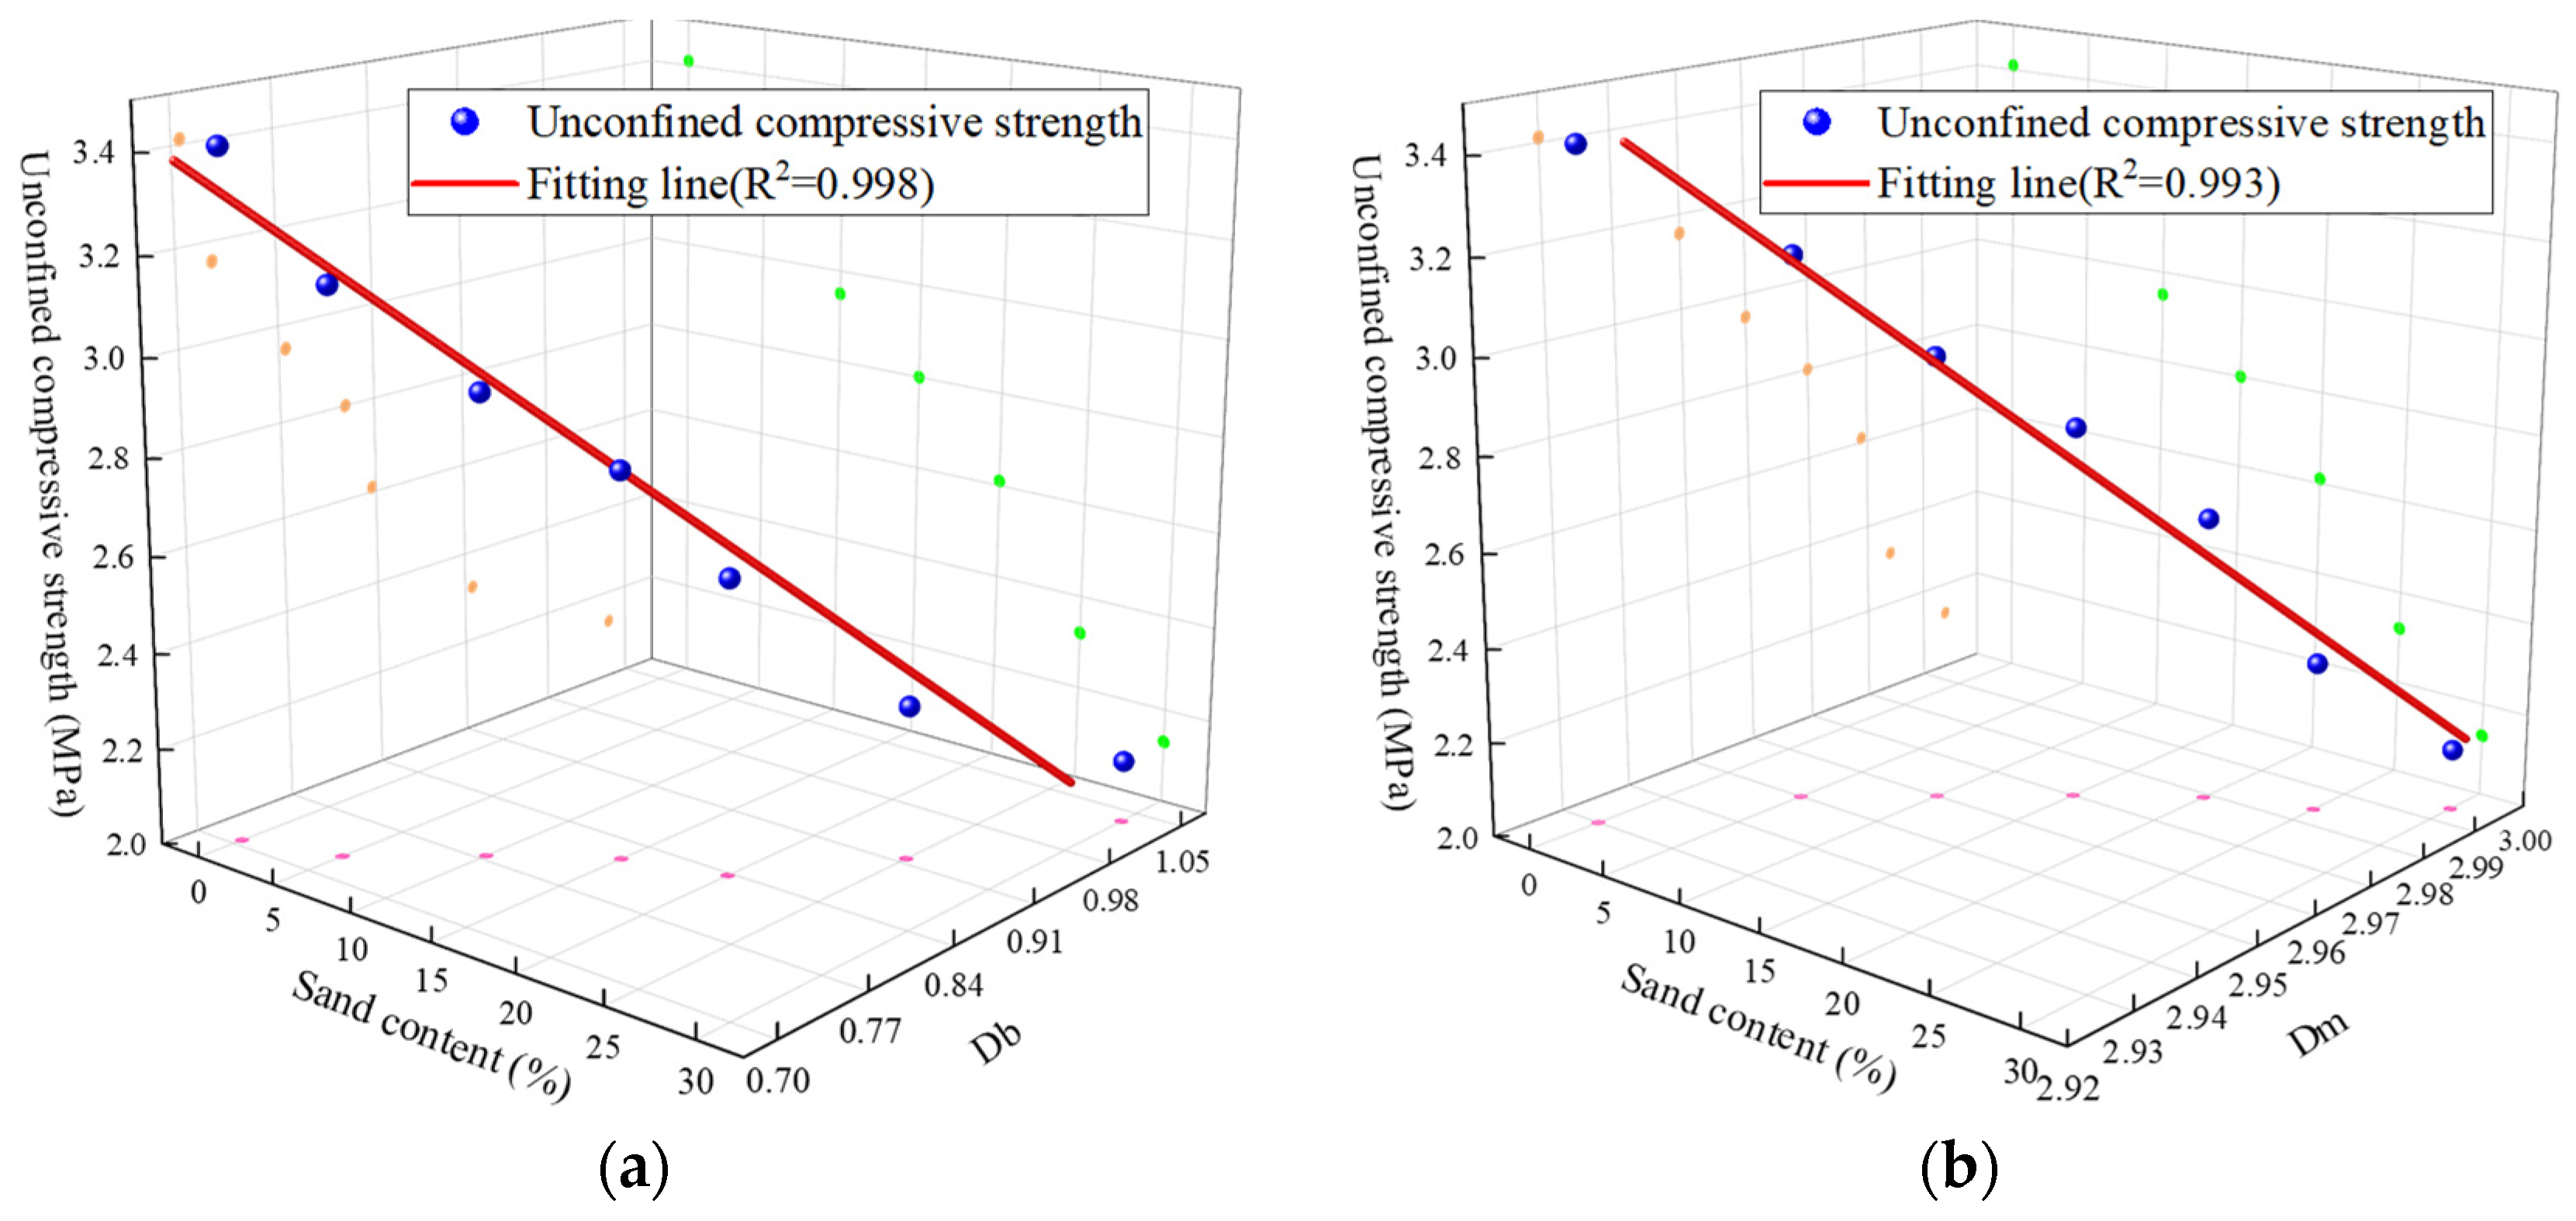
Figure 19a,b illustrate the relationship between fractal dimension, sand content, and unconfined compressive strength of frozen–thawed sand–clay. It is clear that the fractal dimension has a significant impact on the unconfined compressive strength. The fractal dimensions of both bound fluid and movable fluid show a linear relationship with sand content. As previously discussed, it is known that when only the sand content is increased, it leads to a larger fractal dimension, and the structurally complex pores produced in this case lead to a lower degree of freezing of the soil and consequently to a lower compressive strength of the frozen soil mass. At this point, the change in the fractal dimension is negatively correlated with the strength of the frozen soil.

Figure 19.
The relationship between compressive strength, sand content, and fractal dimension. (a) The relationship between bound fluid fractal dimension and compressive strength. (b) The relationship between movable fluid fractal dimension and compressive strength.
5. Conclusions
Artificial freezing methods are commonly used in water-rich sandy areas, but frost heave during construction can severely damage the soil’s structure. Nuclear magnetic resonance technology enables the observation of microscopic pore changes and the calculation of fractal dimensions in frozen–thawed sandy soil through pore distribution curves. This reveals the complexity and regularity of pore structures, providing a new perspective on the microstructural characteristics of soft soil. Uniaxial compression tests were conducted on frozen remolded clays at various freezing temperatures and sand contents to analyze the effect of freezing on the strength of remolded clays from the perspective of fractal dimension. The following conclusions have been drawn:
- (1)
- Pore distribution shows self-similarity, indicating fractal characteristics. Higher fractal dimensions in pore size distribution suggest more complex pore structures. Pore fluids are categorized based on the T2 cutoff value: fluids with T2 < 2.31 ms are considered bound, while those with T2 > 2.31 ms are considered movable. Fractal characteristics are more pronounced in movable fluids compared to bound fluids.
- (2)
- Both pre- and post-freeze–thaw pore distributions follow a bimodal pattern, with the main peak representing smaller pores and the secondary peak larger pores. After freezing, there is a trend towards increasing pore size, which becomes more pronounced as temperatures decrease. This indicates that as pore water expands during freezing, some smaller soil pores connect with adjacent pores to form larger pores or fissures.
- (3)
- Variations in sand content affect pore distribution. As sand content increases, the number of smaller pores decreases, and the largest pores in the soil structure tend to expand. This trend occurs because irregular sands form more branched and complex large void structures, altering the local soil structure.
- (4)
- Variations in sand content and freezing temperature both affect the unconfined compressive strength of frozen sand–clay. A higher sand content leads to a lower unconfined compressive strength of the frozen soil. Conversely, lower freezing temperatures result in higher unconfined compressive strength.
- (5)
- As the freezing temperature decreases, the skeletal structure becomes more loosely arranged, leading to an increase in fractal dimension. This indicates that lower temperatures exacerbate the damaging effects of freezing on soil structure.
- (6)
- The fractal dimensions of bound and free fluids show significant correlations with sand content both before and after freeze–thaw cycles, with these correlations being more pronounced before freezing. A higher sand content leads to larger, more irregularly and unevenly distributed pores, thereby increasing the fractal dimension.
- (7)
- A larger fractal dimension signifies more complex pores and a looser skeletal structure when the freezing temperature changes. This indicates a higher degree of freezing and results in greater unconfined compressive strength.
- (8)
- When sand content varies, a larger fractal dimension indicates an increase in large voids and a more complex pore structure, making it harder for water to freeze. This results in a lower degree of freezing and reduced unconfined compressive strength.
This paper investigates the strength and fractal characteristics of artificial frozen–thawed sandy soft soil, providing a reliable basis for predicting structural damage under freezing method construction conditions. It also aids in exploring the uneven settlement laws for underground lines in the Yangtze River Delta region. However, there are limitations. Firstly, this study was conducted in a closed system without external water influence. In actual engineering environments, soil typically exists in an open system, which may cause discrepancies between the experimental results and real-world conditions. Secondly, the study only conducted strength tests, making it difficult to fully understand the deformation and settlement mechanisms of artificially frozen and thawed sandy soft soil.
In future research, further studies should be conducted in an open system to better align with actual engineering conditions. Additionally, measurements of frozen–thawed soil deformation and other physical parameters should be included to better investigate the impact of freeze–thaw soil structural damage on the uneven settlement of metro lines.
Author Contributions
Conceptualization, B.K. and B.Z.; methodology, B.K. and Q.C.; validation, Y.Y. and J.Y.; formal analysis, B.K.; investigation, Y.Y. and H.H.; resources, B.K.; data curation, J.Y.; writing—original draft preparation, B.K.; writing—review and editing, B.K. and Y.Y.; visualization, Y.Y. and H.H.; supervision, Q.C.; project administration, B.Z.; funding acquisition, B.K. All authors have read and agreed to the published version of the manuscript.
Funding
This research was funded by the Zhejiang Provincial Natural Science Foundation of China, grant number LQ24A020015 and the Youth Natural Science Foundation of Zhejiang University of Science and Technology, grant number 2023QN026.
Data Availability Statement
The data are available from the corresponding author upon request.
Acknowledgments
The authors are very grateful to Jianzhong Xia from Zhejiang University of Science and Technology for his kind guidance in writing this article.
Conflicts of Interest
The authors declare no conflicts of interest.
References
- Tomassi, A.; Milli, S.; Tentori, D. Synthetic seismic forward modeling of a high-frequency depositional sequence: The example of the Tiber depositional sequence (Central Italy). Mar. Pet. Geol. 2024, 160, 106624. [Google Scholar] [CrossRef]
- Xue, F.C. Dynamic responses of subway tunnel in clay stratum to moving loads. Arab. J. Sci. Eng. 2017, 42, 1327–1340. [Google Scholar]
- Ding, Z.; Zhang, X.; Yin, X. Analysis of the influence of soft soil grouting on the metro tunnel based on field measurement. Eng. Comput. 2019, 36, 1522–1541. [Google Scholar] [CrossRef]
- Cui, Z.D.; Zhang, L.J.; Hou, C.Y. Seismic behavior of subway station in the soft clay field before and after freeze-thaw cycle. Soil Dyn. Earthq. Eng. 2023, 175, 108222. [Google Scholar] [CrossRef]
- Liu, J.; Yang, Y.; Yang, C. Analysis and prediction of long-term settlement of metro shield tunnel in saturated sand. Geotech. Geol. Eng. 2021, 39, 5241–5252. [Google Scholar] [CrossRef]
- Yan, Q.; Wu, W.; Zhang, C. Monitoring and evaluation of artificial ground freezing in metro tunnel construction—A case study. KSCE J. Civ. Eng. 2019, 23, 2359–2370. [Google Scholar] [CrossRef]
- Zhou, J.; Guo, Z.; Wang, C. Analysis of Freeze–Thaw Response and Pore Characteristics of Artificially Frozen Soft Soil under Combined Formation Seepage. Appl. Sci. 2022, 12, 10687. [Google Scholar] [CrossRef]
- Zhou, J.; Tang, Y. Practical model of deformation prediction in soft clay after artificial ground freezing under subway low-level cyclic loading. Tunn. Undergr. Space Technol. 2018, 76, 30–42. [Google Scholar] [CrossRef]
- Kong, B.; Xia, F.; Yu, B. Pore size changes in marine soft soil under various freezing conditions. J. Mar. Sci. Eng. 2020, 8, 170. [Google Scholar] [CrossRef]
- Yao, Y.; Zhu, Y.; Shen, D. Fuzzy random evaluation of creep model of frozen soft soil in metro tunnel construction using artificial ground freezing technique. Sci. Rep. 2023, 13, 9468. [Google Scholar] [CrossRef]
- Fan, W.; Yang, P.; Yang, Z.J. Impact of freeze-thaw on the physical properties and compressibility of saturated clay. Cold Reg. Sci. Technol. 2019, 168, 102873. [Google Scholar] [CrossRef]
- Fan, W.; Yang, P. Ground temperature characteristics during artificial freezing around a subway cross passage. Transp. Geotech. 2019, 20, 100250. [Google Scholar] [CrossRef]
- Li, J.; Tang, Y.; Feng, W. Creep behavior of soft clay subjected to artificial freeze–thaw from multiple-scale perspectives. Acta Geotech. 2020, 15, 2849–2864. [Google Scholar] [CrossRef]
- Xiao, J.; Shan, J.; Wu, N. Long-term settlement of metro viaduct piers: A case study in Shanghai soft soil. Transp. Geotech. 2023, 42, 101075. [Google Scholar] [CrossRef]
- Zhang, R.; Cheng, X.; Li, Y. Research on the ground subsidence mechanism of cross passage caused by freezing method construction. Adv. Civ. Eng. 2021, 2021, 6622177. [Google Scholar] [CrossRef]
- Ma, J.; Huang, K.; Zou, B. The influence of tunnel insulation measures on the temperature spatiotemporal variation of frozen soil during artificial ground freezing. Cold Reg. Sci. Technol. 2023, 214, 103942. [Google Scholar] [CrossRef]
- Pfeifer, P.; Avnir, D. Chemistry in noninteger dimensions between two and three. I. Fractal theory of heterogeneous surfaces. J. Chem. Phys. 1983, 79, 3558–3565. [Google Scholar] [CrossRef]
- Avnir, D.; Jaroniec, M. An isotherm equation for adsorption on fractal surfaces of heterogeneous porous materials. Langmuir 1989, 5, 1431–1433. [Google Scholar] [CrossRef]
- Li, J.; Ostoja-Starzewski, M. Thermo-poromechanics of fractal media. Philos. Trans. R. Soc. A 2020, 378, 20190288. [Google Scholar] [CrossRef]
- Zhao, Y.; Feng, Z.; Lv, Z. Percolation laws of a fractal fracture-pore double medium. Fractals 2016, 24, 1650053. [Google Scholar] [CrossRef]
- Chen, X.; Yao, G.; Herrero-Bervera, E. A new model of pore structure typing based on fractal geometry. Mar. Pet. Geol. 2018, 98, 291–305. [Google Scholar] [CrossRef]
- Zhu, J.F.; Liu, J.Z.; Yang, Y.M. Fractal characteristics of pore structures in 13 coal specimens: Relationship among fractal dimension, pore structure parameter, and slurry ability of coal. Fuel Process. Technol. 2016, 149, 256–267. [Google Scholar] [CrossRef]
- Xu, J.; Wu, K.; Li, Z. A model for gas transport in dual-porosity shale rocks with fractal structures. Ind. Eng. Chem. Res. 2018, 57, 6530–6537. [Google Scholar] [CrossRef]
- Wei, D.; Gao, Z.; Zhang, C. Pore characteristics of the carbonate shoal from fractal perspective. J. Pet. Sci. Eng. 2019, 174, 1249–1260. [Google Scholar] [CrossRef]
- Yu, Q.; Dai, Z.; Zhang, Z. Estimation of sandstone permeability with SEM images based on fractal theory. Transp. Porous Media 2019, 126, 701–712. [Google Scholar] [CrossRef]
- Sun, M.; Zou, C.; Xin, D. Pore structure evolution mechanism of cement mortar containing diatomite subjected to freeze-thaw cycles by multifractal analysis. Cem. Concr. Compos. 2020, 114, 103731. [Google Scholar] [CrossRef]
- Wang, H.Z.; Liu, X.H.; Yang, X.J. Intergrowth of a carbon layer and fractal-like trees on 3Y-TZP in TEM observations. Mater. Sci. Eng. A 2001, 311, 180–184. [Google Scholar] [CrossRef]
- Kulkarni, P.; Watwe, V.; Doltade, T. Fractal kinetics for sorption of methylene blue dye at the interface of Alginate Fullers earth composite beads. J. Mol. Liq. 2021, 336, 116225. [Google Scholar] [CrossRef]
- Xu, S.; Yang, Z.; Wu, S. Fractal analysis of pore structure differences between shale and sandstone based on the nitrogen adsorption method. Nat. Resour. Res. 2022, 31, 1759–1773. [Google Scholar] [CrossRef]
- Liu, K.; Jin, Z.; Zeng, L. Determination of clay bound water in shales from NMR signals: The fractal theory. Energy Fuels 2021, 35, 18406–18413. [Google Scholar] [CrossRef]
- Zhu, S.; Zhen, Q.; Zhang, X. Multifractal characteristics of the pore structures of physically amended sandy soil and the relationship between soil properties and multifractal parameters. Arch. Agron. Soil Sci. 2020, 66, 1188–1202. [Google Scholar] [CrossRef]
- Kong, B.; He, S.H.; Tao, Y. Pore structure and fractal characteristics of frozen–thawed soft soil. Fractal Fract. 2022, 6, 183. [Google Scholar] [CrossRef]
- He, S.H.; Ding, Z.; Hu, H.B. Effect of grain size on microscopic pore structure and fractal characteristics of carbonate-based sand and silicate-based sand. Fractal Fract. 2021, 5, 152. [Google Scholar] [CrossRef]
- Paz Ferreiro, J.; Miranda, J.; Vázquez, E.V. Multifractal analysis of soil porosity based on mercury injection and nitrogen adsorption. Vadose Zone J. 2010, 9, 325–335. [Google Scholar] [CrossRef]
- Guo, X.; Huang, Z.; Zhao, L. Pore structure and multi-fractal analysis of tight sandstone using MIP, NMR and NMRC methods: A case study from the Kuqa depression, China. J. Pet. Sci. Eng. 2019, 178, 544–558. [Google Scholar] [CrossRef]
- Hu, Z.; Zheng, S.; Li, Y. Synthesis of a novel porous diatomite/AlOOH composite material and its humidity control performance. Chem. Pap. 2022, 76, 3909–3918. [Google Scholar] [CrossRef]
- Ge, X.; Fan, Y.; Liu, J. An empirical method to correct nuclear magnetic resonance porosity of tight sandstone using low-field nuclear magnetic resonance data. AAPG Bull. 2023, 107, 539–551. [Google Scholar] [CrossRef]
- Kuptsov, K.; Griffiths, R.; Maggs, D. Technology update: Magnetic resonance-while-drilling system improves understanding of complex reservoirs. J. Pet. Technol. 2015, 67, 26–29. [Google Scholar] [CrossRef]
- Zhou, S.D.; Liu, D.M.; Cai, Y.D. Fractal characterization of pore–fracture in low-rank coals using a low-field NMR relaxation method. Fuel 2016, 181, 218–226. [Google Scholar] [CrossRef]
- Liang, Z.K.; Li, Z.; Jiang, Z.X. Characteristics of pore structure and fractal dimension in continental shale based on NMR experiments and SEM image analyses—A case study of Shahezi formation shale in Changling fault depression of Songliao Basin. China J. Earth Sci. Environ. 2020, 42, 313–328. [Google Scholar]


Disclaimer/Publisher’s Note: The statements, opinions and data contained in all publications are solely those of the individual author(s) and contributor(s) and not of MDPI and/or the editor(s). MDPI and/or the editor(s) disclaim responsibility for any injury to people or property resulting from any ideas, methods, instructions or products referred to in the content. |
© 2024 by the authors. Licensee MDPI, Basel, Switzerland. This article is an open access article distributed under the terms and conditions of the Creative Commons Attribution (CC BY) license (https://creativecommons.org/licenses/by/4.0/).