Article

Relationship Between Pore-Size Distribution and 1D Compressibility of Different Reconstituted Clays Based on Fractal Theory

1
School of Civil and Environmental Engineering, Harbin Institute of Technology (Shenzhen), Shenzhen 518055, China
2
College of Construction Engineering, Jilin University, Changchun 130012, China
3
PowerChina Huadong Engineering Co., Ltd., Hangzhou 311122, China
*
Author to whom correspondence should be addressed.
Fractal Fract. 2025, 9(4), 235; https://doi.org/10.3390/fractalfract9040235
Submission received: 27 January 2025 / Revised: 30 March 2025 / Accepted: 2 April 2025 / Published: 9 April 2025
(This article belongs to the Special Issue Fractal and Fractional Models in Soil Mechanics)

Abstract

:
This paper first examines the evolution of pore-size distribution (PSD) in four types of reconstituted clays during one-dimensional (1D) compression, utilising mercury intrusion porosimetry. Central to this work, fractal theory is then applied to quantify the complexity of the pore structure through fractal dimensions, followed by being correlated with 1D compressibility. The key findings are as follows: (1) The 1D compressibility of the four clays exhibits significant variability, with montmorillonite demonstrating the highest compressibility and Shenzhen clay, dominated by chlorite, the lowest. This is associated with distinct pore size evolution patterns under 1D loading while also emphasising the crucial role of mesopores in macroscopic clay deformation. (2) Fractal dimensions increase with loading, reflecting the progressive refinement of the pore structure, with natural Shenzhen clay demonstrating the most pronounced change. (3) A mathematical relationship between fractal dimension and 1D compressibility is established for each clay type, providing a quantitative tool for predicting 1D compressibility based on fractal dimensions. (4) The testing procedures and methods to ensure the representativeness of pore structure analysis are elaborated, ensuring reliable PSD data. By employing fractal theory, this study provides new insights into the correlation between pore structure complexity and compressibility in reconstituted clays.

1. Introduction

The one-dimensional (1D) compression behaviour of clay is a crucial parameter in geotechnical engineering, particularly in the design of foundations constructed on soft clay soils, as it is essential for predicting the settlement of geotechnical structures built on clayey ground. Over the past few decades, it has become well-established that the pore structure characteristics significantly influence the compressibility of clays [1,2,3,4]. An early study by Sridharan et al. [5], which tracked the changes in pore-size distribution (PSD) of kaolinite slurry specimens under mechanical loading, demonstrated that PSD is a sensitive parameter capable of capturing the effects of microstructural changes that impact the engineering behaviour of clay. Delage and Lefebvre [6] further emphasised that the compression behaviour of a sensitive Champlain clay is related to variations in its PSD curves. By analysing the evolution of PSD curves during 1D compression, they identified a pore collapse governing the sample deformation under 1D loading, where volume reduction results from the progressive and orderly collapse of the pore structure, with the largest inter-aggregate pores being the first to collapse [6]. To gain a more robust and profound understanding of the compression behaviour of clay, extensive studies have been conducted on the PSD evolution underlying the macro-response exhibited by clays with different origins and mineralogy during 1D compression [7,8].
Nevertheless, several potential issues and limitations persist in the existing studies on the PSD evolution of clay during 1D compression. Firstly, due to the challenges in sourcing pure illite clay, it remains inadequately studied. Given that illite is a common mineral in natural clays, understanding the PSD evolution of pure illite clay under 1D loading is of great significance. Secondly, when characterising the PSD evolution during 1D compression, nearly all existing studies have focused on measuring the PSD curves of different clay specimens subjected to varying maximum stress levels, assuming that they lie on the same compression curve [9]. However, the relevant testing protocols to ensure that the PSD of the clay samples tested microscopically is representative of the actual PSD under a given stress state during compression are rarely discussed in detail. Key considerations are often only briefly mentioned, such as how to maintain a consistent initial state before each compression test, how to minimise the rebound effects caused by stress release when extracting samples from the oedometer cell, and to effectively preserve clay samples to prevent changes in the pore structure between macro and micro tests. As a result, concerns regarding the representativeness of the microstructural analysis have been raised. Finally, and most critically, the correlation between 1D compressibility and porosimetry parameters, which could directly link the microstructural features of clay to its macroscopic behaviour, remains inadequately addressed.
The concept of “fractal”, first introduced by Mandelbrot [9], provides a powerful tool for studying complex and irregular geometries. In the last few decades, fractal theory has been refined, revealing that many material surfaces exhibit self-similarity across different scales, a hallmark of fractality [10,11,12,13]. This self-similar geometric characteristic, quantified by the fractal dimension, has become a valuable parameter for describing the microstructural features of various materials. Soil, as a porous medium, has been extensively studied under this framework, with numerous studies demonstrating that its pore structure exhibits clear fractal characteristics [14,15,16]. These fractal characteristics reflect the connectivity and complexity of the soil’s pore network, which directly influences its macroscopic physical and mechanical properties. The fractal dimension is a critical parameter for estimating the heterogeneity of complex pore structures in soils [17]. A higher fractal dimension typically indicates a more intricate pore structure, leading to higher resistance to fluid flow and greater mechanical strength [17,18]. Consequently, many studies have explored the use of fractal dimensions to link microstructural characteristics with macroscopic soil properties, such as permeability [19], shear strength [20], and crack patterns in freeze–thaw clays [21]. Despite these efforts, the relationship between the fractal dimension and the 1D compressibility of soils, particularly clays, remains inadequately defined. Variations in testing methods, model selection, and interpretations of fractal dimensions have contributed to inconsistent results.
To compensate for the research deficiencies described above, this study examines the PSD curves of four reconstituted clays containing different dominant clay minerals subjected to 1D loading using the mercury intrusion porosimetry (MIP) technique. The selection of homogeneous reconstituted clay samples in this study was made to eliminate the uncertainties associated with the spatial heterogeneity of deformed natural clay samples. While the compression characteristics of reconstituted soils may differ from those of naturally deposited soils due to the influence of soil structure, the inherent compressibility of reconstituted soils serves as a controlled reference framework for evaluating the fundamental deformation behaviour of natural clayey soils. This approach enables a more systematic and quantitative investigation of the relationship between pore structure and macroscopic compressibility, which remains challenging in natural soils due to their variability but is crucial for understanding their fundamental behaviour under different 1D loadings.
The primary objective of this study is to establish the relationships between the PSD and 1D compressibility of different reconstituted clays based on fractal theory. Unlike previous studies that typically focus on a single clay type or generalised fractal behaviour, this work systematically investigates four types of reconstituted clays, each representing a typical clay mineral, i.e., kaolinite, illite, montmorillonite, and chlorite, thus providing a mineralogy-based perspective on compression behaviour. Additionally, the study also aims to investigate the evolution of PSD during 1D compression for different types of clays with varying dominant mineral compositions, with particular emphasis on illite clay, which is often underrepresented in the existing literature and is examined here in its pure form (i.e., containing only illite minerals). Finally, this study elaborates on the testing procedures and methods to ensure the representativeness of the obtained pore structure data, an often overlooked aspect in PSD-based studies, which is essential for reliably linking microstructural features to the macroscopic compressibility of clays. The combined use of MIP data, fractal dimension analysis, and mechanical testing under a unified experimental framework constitutes one of the main innovations of this study. These findings are expected to provide valuable insights into the micro-macro linkages in the compression behaviour of reconstituted clays and lay the groundwork for the future development of structure-informed constitutive models.

2. Testing Materials

In this study, three commercial soils with typical clay minerals, namely kaolinite, montmorillonite, and illite, as well as one natural soil with chlorite as the primary clay mineral, were selected for testing. All the commercial soils were purchased from Guzhang Shan Lin Shi Yu Mineral Co., Ltd. (Changzhou, China), with the raw ore sourced from Lingshou County, Hebei Province, China. These commercial soils are highly refined dry powders of clay minerals, and their grain sizes are mostly smaller than 2 μm, determined by a mass-based BT-9300LD laser (Chongqing, China) diffraction particle size analyser (dry method), as shown in Figure 1. Hence, they herein are referred to as kaolinite clay, illite clay, and montmorillonite clay. The natural soil was sourced from Nanshan District, Shenzhen, China. Figure 1 shows that the clay fraction of this natural soil accounts for 55.8% with a median diameter, D50, of approximately 1.62 μm. Hereafter, it is referred to as Shenzhen clay. The mineralogical compositions of these four different clays are presented in Table 1, derived from X-ray diffraction (XRD) tests using the PANalytical X’Pert Pro diffractometer (Almelo, The Netherlands).
The basic physical and geotechnical properties of these four different types of clay were determined at the Geotechnical Engineering Laboratory of Harbin Institute of Technology (Shenzhen), as summarised in Table 2. The specific gravity, G s , was measured using the small pycnometer method (ASTM D854-23) [22], while the liquid limit and plastic limit were determined using the cone penetrometer method and the standardised manual thread-rolling method, respectively (ASTM D4318-17e1) [23]. In accordance with the Unified Soil Classification System (USCS) classification, both kaolinite clay and illite clay are classified as high plastic clays (CH); Shenzhen clay is a clay with intermediate plasticity (CI), and montmorillonite clay is a typical expansive clay (CE).

3. Testing Procedures and Methods

In this study, a series of carefully designed 1D compression tests were first conducted to obtain the compressibility of four types of reconstituted clays. Special attention was then given to the preparation of compressed clay specimens for subsequent pore structure examination. Afterward, MIP tests were performed to measure the PSD of the reconstituted clays. Finally, based on fractal theory, an attempt was made to establish the relationship between the 1D compressibility and the PSD-based fractal dimension, linking the macroscopic and microscopic characteristics of reconstituted clays. Figure 2 provides an overview of the experimental process in this study, including the experimental methods and instruments involved. The following section provides a detailed description of the testing procedures and methods.

3.1. One-Dimensional Compression Tests

In accordance with BS 1377: Part 5: 1990, a series of one-dimensional (1D) incremental load consolidation tests (standard oedometer tests) were carried out to characterise the 1D compressibility of the four different types of clay using the WG-Type single-lever consolidation apparatus from Nanjing Soil Instrument Factory Co., Ltd. (Nanjing, China). For this apparatus, the vertical load range is between 2.5 kPa and 2000 kPa, which meets the requirement of a maximum stress level of 1600 kPa in this study. The clay samples used for the 1D compression tests had a diameter of 79.8 mm, resulting in a sample area of 50 cm2 and a height of 20 mm. These samples were prepared in a reconstituted state by thoroughly mixing the soil with deionised water at a water content of 1.25 times the liquid limit, as Burland [24] suggested. Prior to being poured carefully into the steel consolidation ring, the resulting uniform clay slurries were vacuumed to remove the trapped air bubbles. The clay samples, sandwiched between the saturated porous stones at the top and bottom, were then one-dimensionally compressed to different maximum vertical effective stresses, σv, of 100, 400, 800, and 1600 kPa, with a load increment ratio of approximately 1.0 (here the load increment ratio is defined as the change in vertical effective stresses between two consecutive steps divided by the stress of the previous step), starting from 5 kPa. Each stress increment lasted for at least 48 h (it may be nearly a week for montmorillonite clay) to ensure that the primary consolidation settlement of the sample had been achieved at each loading stage, as judged by the deformation-square root curve.
For each type of clay, four separate 1D compression tests were performed, with final applied loads of 100, 400, 800 and 1600 kPa, in order to obtain the clay samples with different maximum stress levels. To ensure that the samples from four different tests followed an identical compression curve in the e–logσ’v plot, several special measures were implemented in this study, as outlined below: Firstly, the clay samples for these four tests were prepared from the same slurry to maintain consistency across all samples. Extra care was taken during each test when pouring the slurry into the consolidation ring to prevent air bubbles from being trapped inside the sample, which could lead to excessive settlement. Additionally, the surface of the sample was also made as flat as possible prior to the test, ensuring proper alignment with the top cover. Most critically, the initial void ratio of the sample for each test was rigorously controlled and calculated using the three equations (Equations (1)–(3)) presented in Rocchi and Coop [25]. In practice, the tests were repeated until the initial void ratios achieved an acceptable accuracy of ±0.01 (Table 3), guaranteeing that all four samples were compressed from the same initial void ratio. Details of the accuracy of calculating the initial void ratio can be found in Zheng et al. [3]. It should be mentioned that at the initial slurry state, it is challenging to achieve full saturation for the clays (i.e., K0, I0, M0, and S0). This slight initial under-saturation is common in reconstituted clay samples prepared at 1.25 times the liquid limit, as widely documented in the literature [2,3,25]. However, this does not influence the testing results, as full saturation was rapidly reached under 1D loading when the test started.
e i = γ w 1 + w i G s γ i 1
e i = γ w 1 + w f G s γ f 1 ε vol 1
e i = γ w G s γ d i 1
where γ w is the unit weight of water; γ d i represents the initial dry unit weight of soil; γ i and γ f represent the initial and final bulk unit weight of soil, respectively; and ε v o l is the total volumetric strain of the soil sample during the 1D compression test.

3.2. Sample Preparations for Pore Structure Analysis

When the sample had completed the primary consolidation settlement at the desired stress level (100, 400, 800, and 1600 kPa), the water from the oedometer cell (i.e., water bath, porous discs, and ducts) was removed as much as possible to ensure that there was minimal residual water surrounding the compressed clay sample. The sample was then unloaded and taken out from the cell in the fastest way possible, guaranteeing undrained unloading conditions. The above steps can effectively inhibit the swelling of the clay sample during stress release, i.e., the rebound effect, because of the build-up of an internal suction, which has been well validated by Delage and Lefebvre [6], Rocchi and Coop [25], Zheng et al. [3], and Zheng and Baudet [26]. It was also verified in practice that through the method described above, the void ratio of the clay samples before unloading remains virtually unchanged compared to those after unloading, with a deviation of less than 0.01. After promptly removing the excess water from the surface of the sample, the final dimensions and mass were measured. Subsequently, a quarter of the cake sample was carefully cut to determine the final water content, wf. The remaining portion of the compressed sample was first wrapped in cling film, then sealed with wax, and finally stored in an environmental chamber under low temperature and high humidity, awaiting pore structure analysis. In other words, the micro-scale pore structure analysis was performed on the compressed samples obtained from the various macroscopic compression tests presented in Table 3.
Prior to pore structure analysis, the previously wax-sealed sample was taken out of the environment chamber and trimmed into several small cubic sticks, with dimensions of about 10 mm × 10 mm × 5 mm, using a thin steel wire in a very quick manner, and then immediately dehydrated with liquid nitrogen which was previously vacuum-cooled at −220 °C using a vacuum freeze dryer (FD-1-50 Plus) from Boyikang (Beijing) Instrument Co., Ltd. (Beijing, China). Once frozen, the samples were immediately transferred to the vacuum chamber attached to the freeze-dryer for sublimation for at least 24 h. This freeze-drying process has been largely adopted for removing moisture from saturated clay mass, and there is substantial evidence that the PSD of freeze-dried clay samples can be considered to be the same as that of the previous saturated state [3,6,26].

3.3. Measurement of Pore-Size Distribution (PSD)

In this study, the PSD curves of different clay samples under varying maximum vertical effective stresses were measured by MIP testing by means of the Micrometrics AutoPore V Series Mercury Porosimeter (AutoPore IV 9500, Norcross, GA, USA) at Jilin University. Assuming that the pores are cylindrical pores with constant radius and interconnected, the entrance pore diameter, d, was calculated using the following equation [27]:
d = 4 σ cos θ / P
where P is the applied mercury intrusion pressure; σ is the surface tension of the mercury, and θ is the contact angle. According to the recommendation of Diamond [28], σ was set to 0.484 N/m at room temperature; θ was set to 139° for montmorillonite clay, 142° for Shenzhen clay, and 147° for kaolinite clay and illite clay. The pore diameters that can be measured by the MIP technique ranged from 0.0055 to 350 µm.

3.4. PSD-Based Fractal Analysis

It is widely acknowledged that soil, as a porous medium, possesses a pore structure that exhibits self-similarity, characterised by fractal characteristics [29,30,31]. Inspired by this knowledge, this study employed the fractal dimension, D, from PSD curves determined by MIP testing to describe the pore structure characteristics of different reconstituted clays. Specifically, introducing the concept of filling dimension proposed by Tricot [32] involves packing the pore space of the material with fractal characteristics using sufficiently small spheres as densely as possible while each sphere does not intersect or overlap with others. The Tricot’s “filling dimension” method [32] was selected in this study because it provides a continuous and quantitative characterization of pore-size distribution, making it particularly suitable for capturing the multiscale features commonly observed in the microstructures of reconstituted clays. While the box-counting method is commonly applied to binarised SEM images and primarily emphasises spatial distribution, the mass fractal model typically relates pore volume to structural scale. In contrast, the filling dimension employed here is derived from the cumulative pore volume distribution, which aligns well with the quantitative data obtained from MIP tests. Moreover, this approach is more sensitive to the distribution of pore volumes across different scales rather than simply accounting for the number of pores, thereby providing a more appropriate framework for linking pore-scale geometry to the macroscopic compressibility of clay. Here, the fractal dimension that characterises the evolution of the pore structure of four different types of reconstituted clays during the 1D compression is calculated as follows:
D = log 10 N / log 10 d
where d is the pore diameter corresponding to a specific applied mercury intrusion pressure, P (see Equation (4)) is obtained from MIP testing, and N is the number of pores with a diameter greater than or equal to d under this mercury intrusion pressure. Using the data interface of the embedded software in the Micrometrics AutoPore IV 9500, the cumulative PSD curve was output, expressed as cumulative pore volume, V (i.e., cumulative mercury intrusion volume) versus pore diameter, d . Then, at a given mercury intrusion pressure, the number of pores with a pore diameter, d , is given by
Δ N d = Δ V / 4 3 π d 2 3
The cumulative pore number, N , is calculated by summing the individual pore counts:
N = i d Δ N i
Taking the logarithms of N and d , a scatter plot of log 10 N vs. log 10 d was obtained and then subjected to linear fitting. If the log 10 N - log 10 d curve of the reconstituted clay exhibits a good linear relationship with a correlation coefficient greater than 0.95, it can be regarded as demonstrating obvious fractal characteristics. The negative reciprocal of the slope of the fitted line is the fractal dimension, D, which is focused on in this study. It should be noted that the fractal nature of the pore-size distribution in soils is generally valid only within a limited range of scales. This is due to both the physical constraints of soil structure and the resolution limits of the measurement technique (e.g., MIP). Therefore, the calculated fractal dimension in this study reflects the scaling behaviour within the measurable range and may not fully represent the pore geometry outside this scale.

4. Testing Results

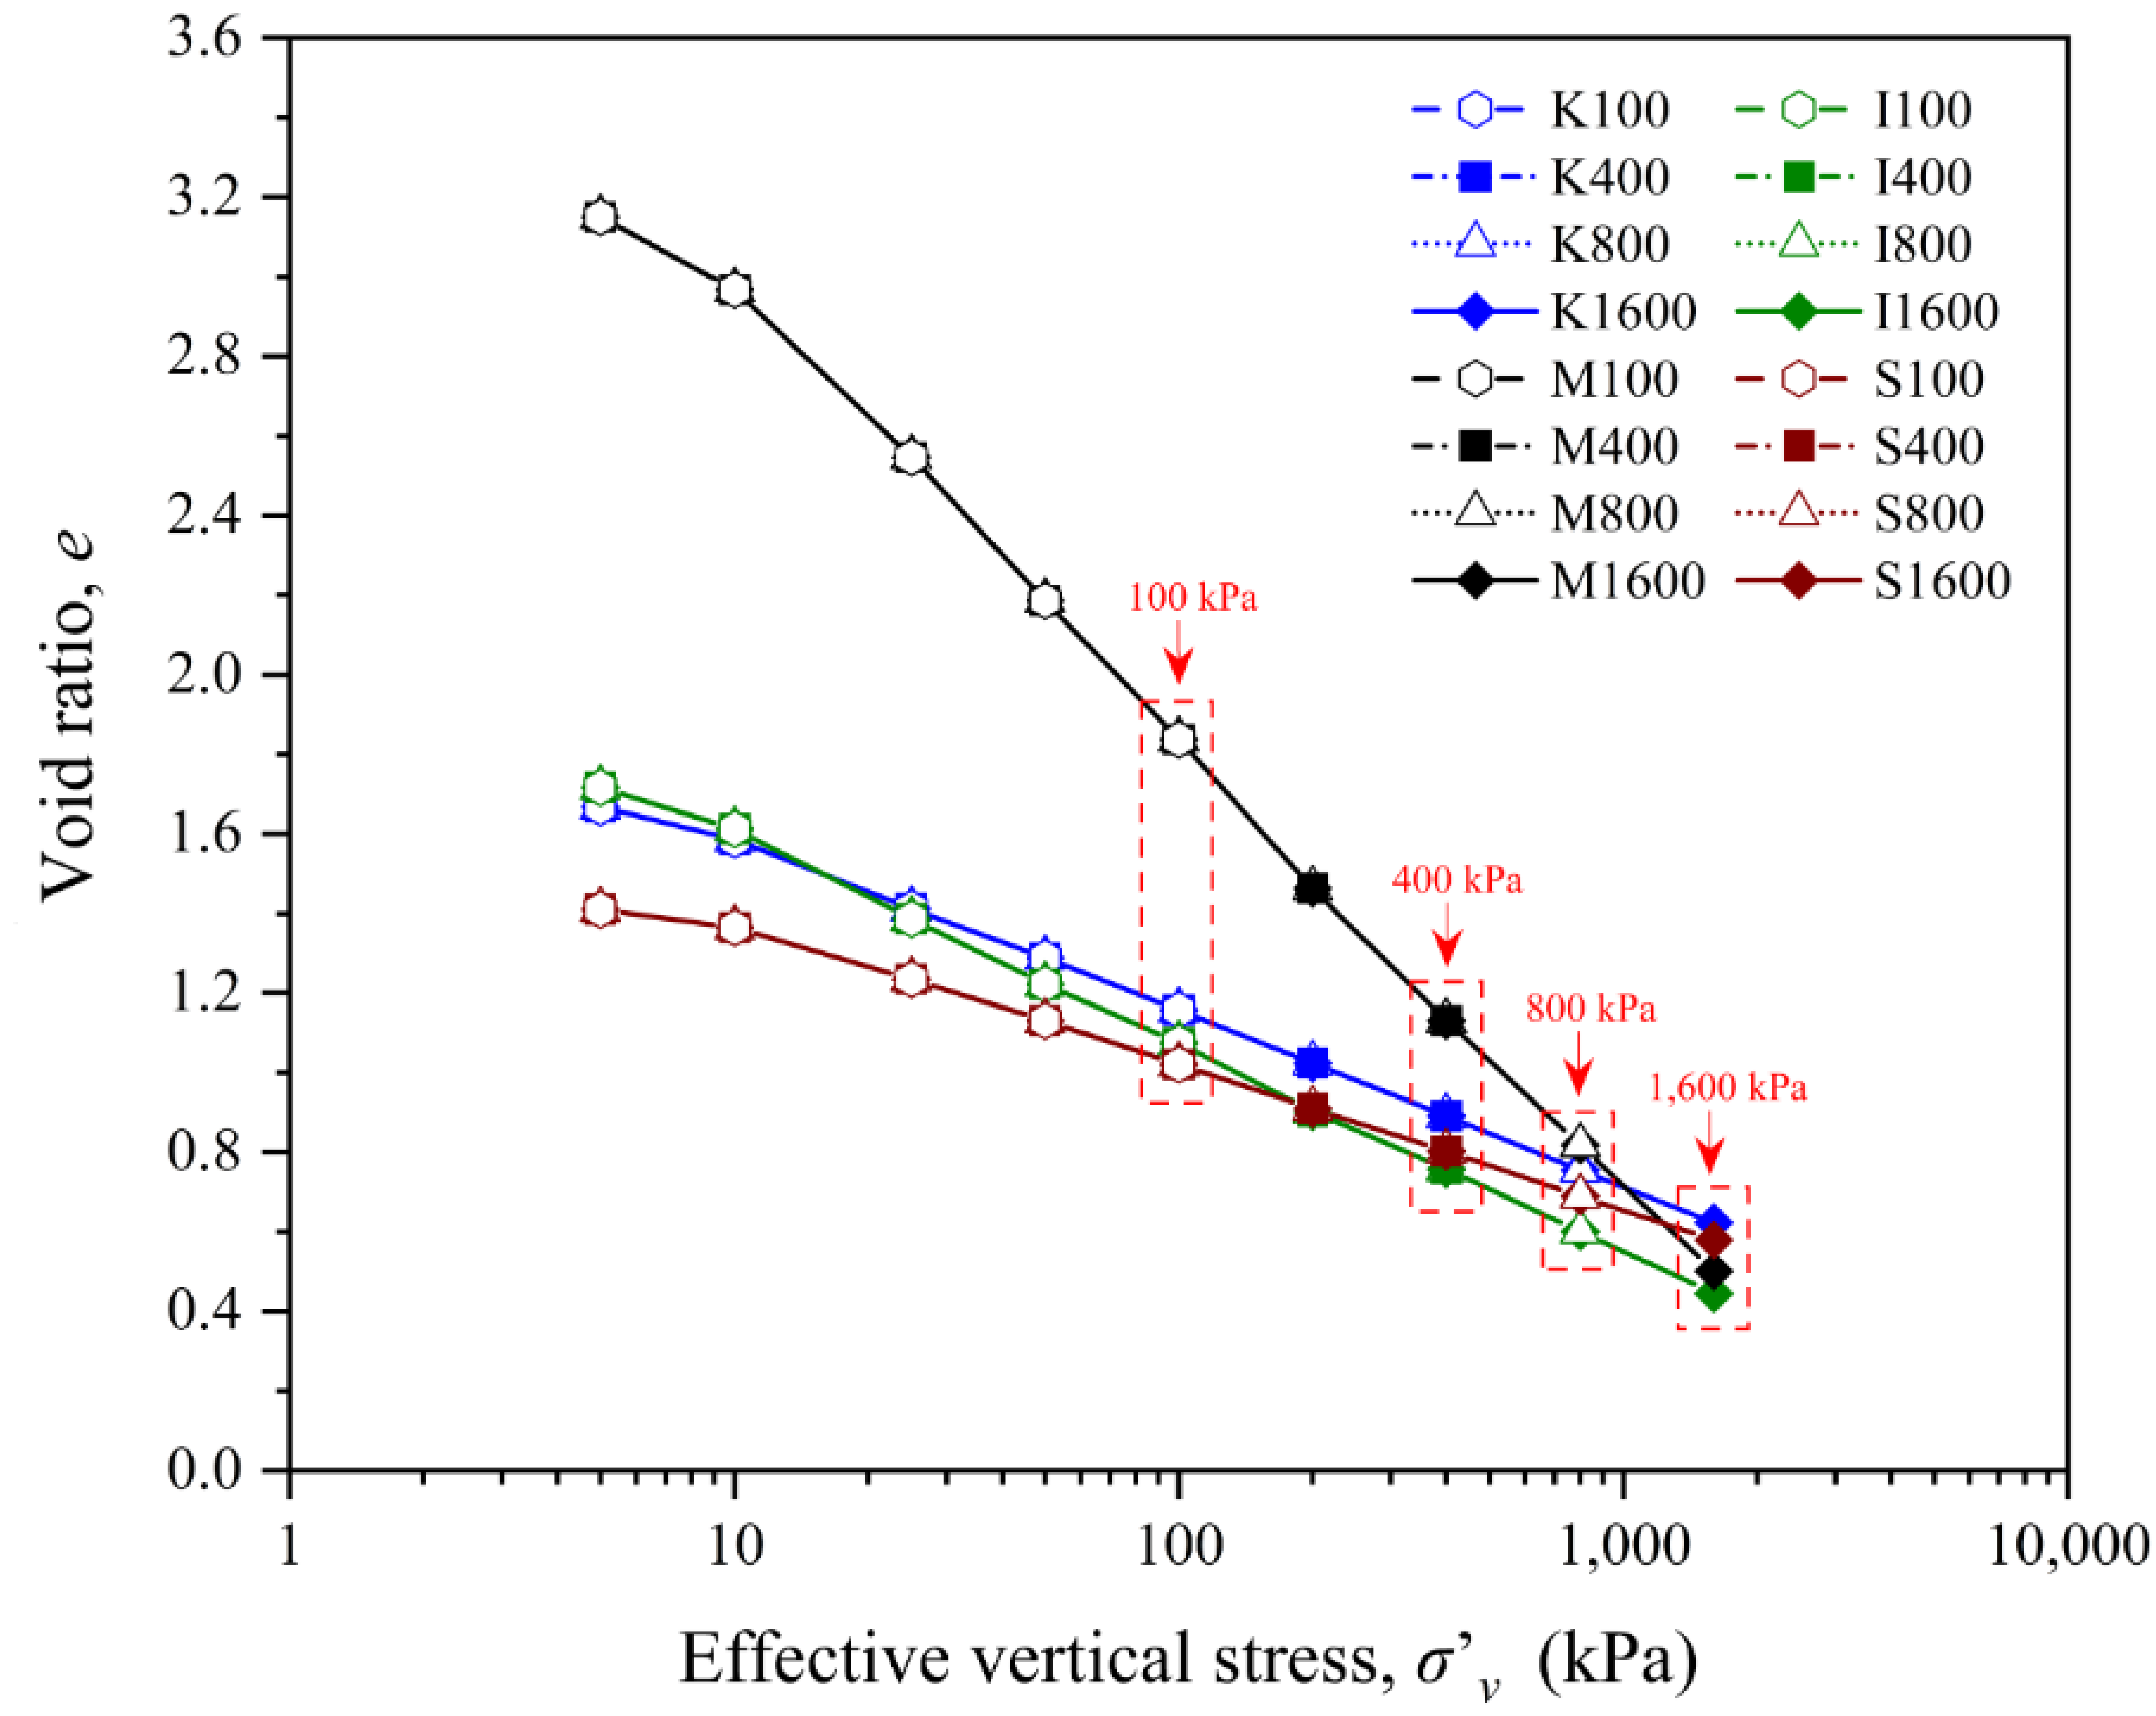
4.1. One-Dimensional Compressibility

The 1D compressibility of these four different types of clay was characterised by plotting the relationship between the void ratio of the clay sample, e, and the applied vertical effective stress obtained from the one-dimensional consolidation tests., as given in Figure 3. Under the precise and rigorous control of the initial void ratio for each type of clay, the four individual compression tests with the best void ratio accuracy followed the identical compression path. Consequently, the MIP analyses performed on the samples compressed to various desired stress levels (highlighted by red squares in Figure 3) allow them to be interpreted as representing the PSD evolution of the identical clay sample throughout the 1D compression process. Based on the 1D compression curves of these four types of clay shown in Figure 3, the compression index, Cc, for each soil was calculated. The Cc values for kaolinite clay, illite clay, montmorillonite clay, and Shenzhen clay are 0.425, 0.517, 1.098, and 0.343, respectively. Montmorillonite clay exhibited significantly higher compressibility compared to the other clays, while Shenzhen clay with chlorite as the dominant mineral had the lowest 1D compressibility, a result consistent with the findings reported in the existing literature [2,33,34].

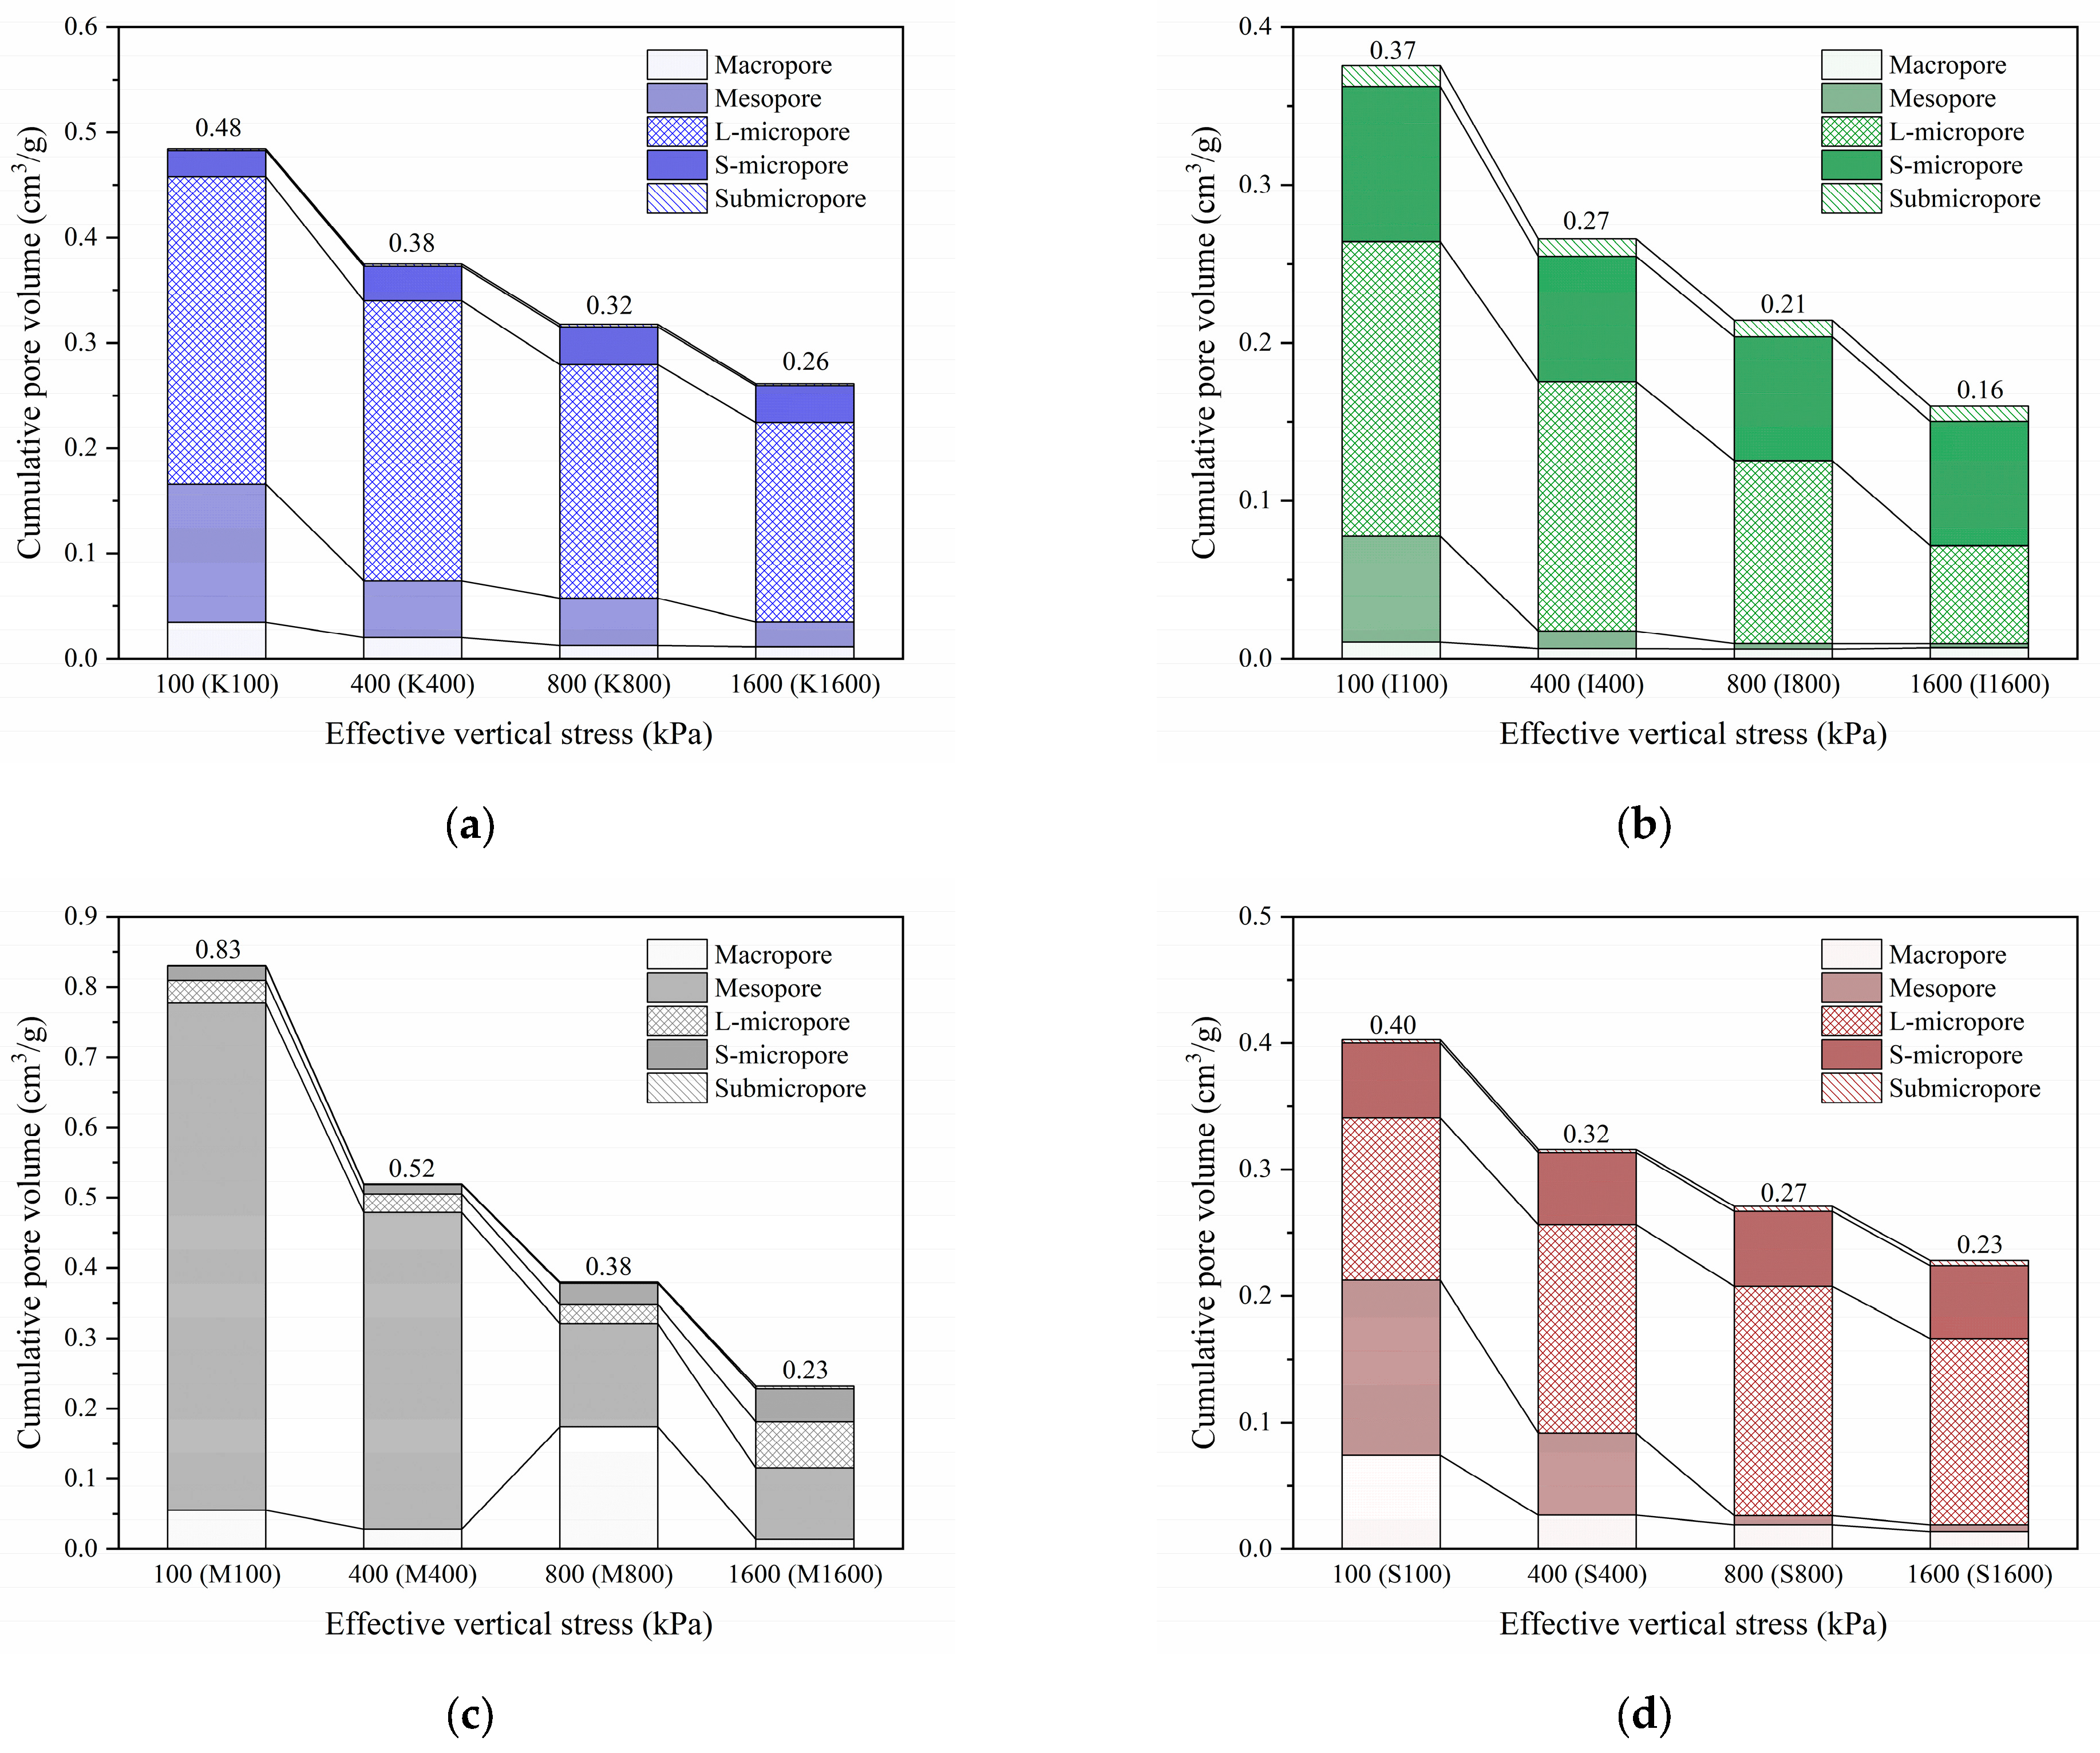
4.2. Evolution of the PSD

Figure 4 shows the evolution of the PSDs with 1D loading for four different reconstituted clay samples, determined by the MIP technique. It is evident that for all types of clays examined, an increase in vertical effective stress led to a substantial decrease in cumulative pore volume, although their PSD curves differed in shape. This microscopic observation corresponds well with the reduction in global void ratio, e, as the compression proceeded at the macro level (Figure 3). Under the same increment of vertical load, for kaolinite clay (Figure 4a), the total pore volume decreased by 0.22 cm3/g, from 0.48 cm3/g at 100 kPa to 0.26 cm3/g at 1600 kPa; for illite clay (Figure 4b), the total pore volume decreased by 0.21 cm3/g, from 0.37 cm3/g at 100 kPa to 0.16 cm3/g at 1600 kPa; for montmorillonite clay (Figure 4c), the total pore volume decreased by 0.60 cm3/g, from 0.83 cm3/g at 100 kPa to 0.23 cm3/g at 1600 kPa; and for Shenzhen clay (Figure 4d), the total pore volume decreased by 0.17 cm3/g, from 0.40 cm3/g at 100 kPa to 0.23 cm3/g at 1600 kPa. The rate of pore volume loss is not uniform across all types of clay, with the magnitude of reduction being more pronounced in montmorillonite clay with a higher initial void ratio (Table 3). Kaolinite and illite clays exhibited relatively moderate reductions in pore volume (0.22 cm3/g and 0.21 cm3/g, respectively), reflecting a more gradual compaction response to increasing vertical loading. Shenzhen clay experienced the smallest decrease in pore volume (0.17 cm3/g), indicative of a more stable pore structure compared to the other clays. The above MIP results suggest that different clay types have varying resistance to 1D compression, probably due to differences in mineral composition, compatible with the compression behaviour or 1D compressibility (Figure 3) obtained from 1D compression tests on these four types of clay.

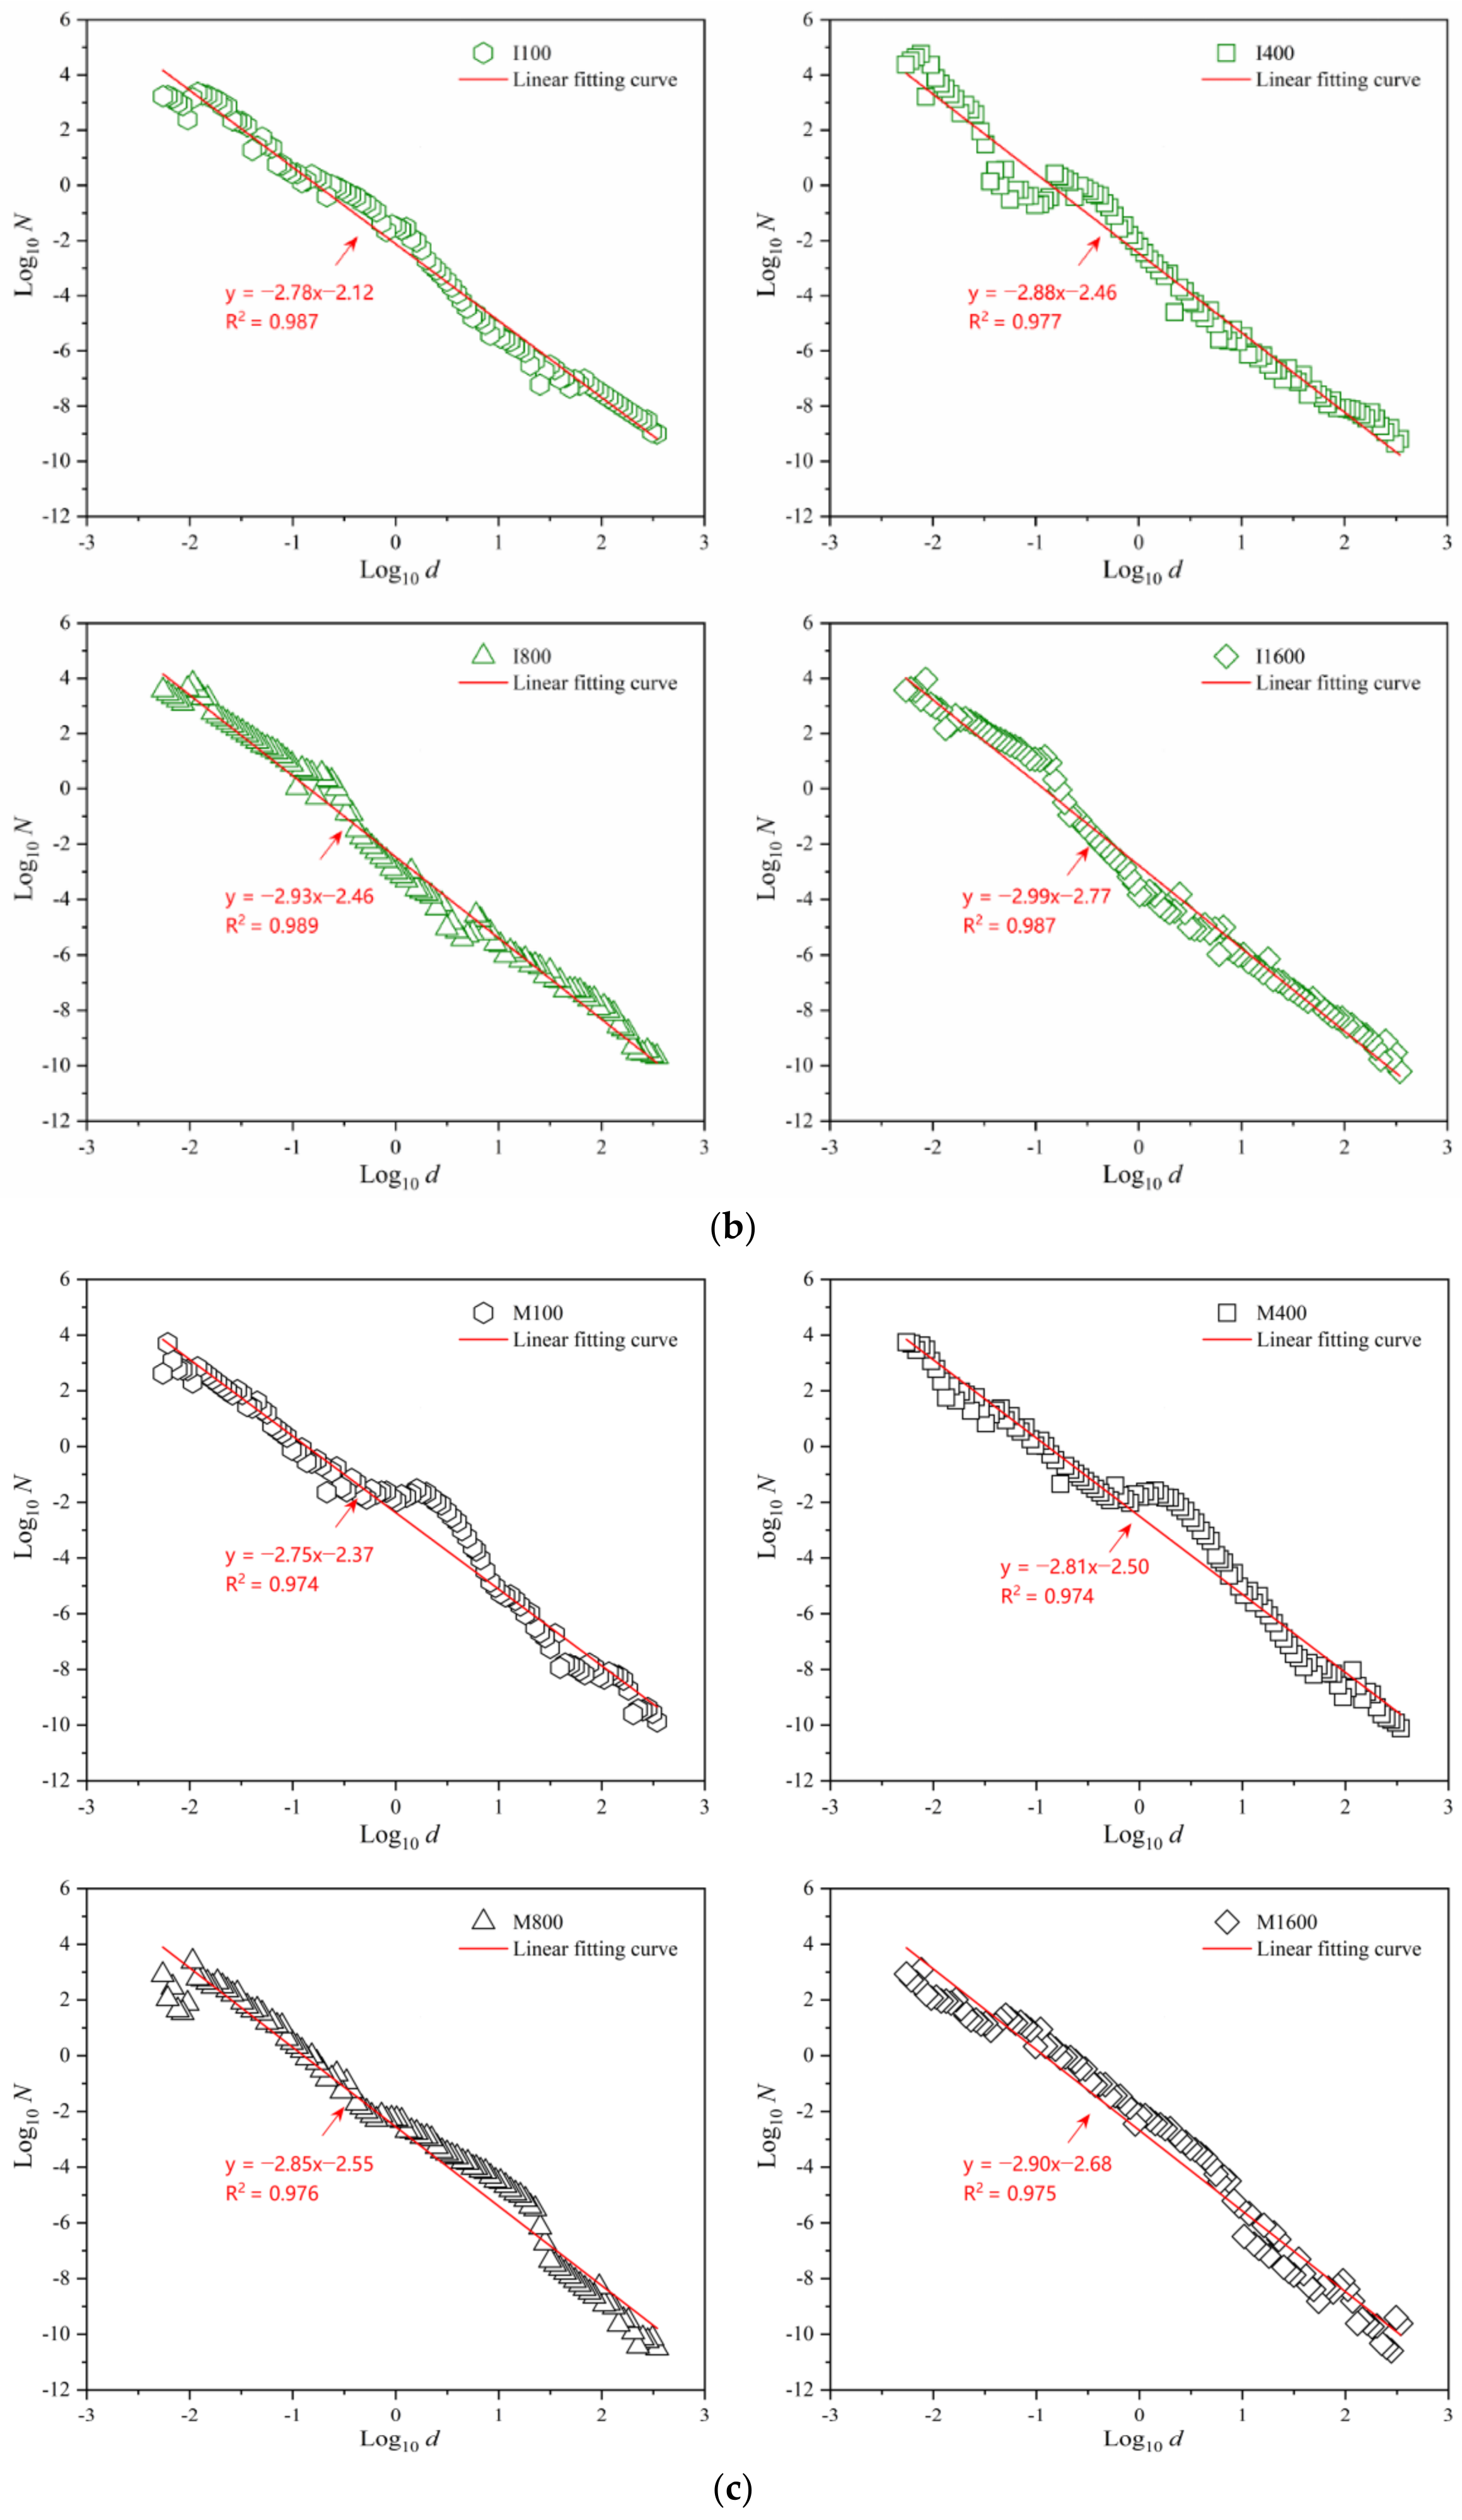
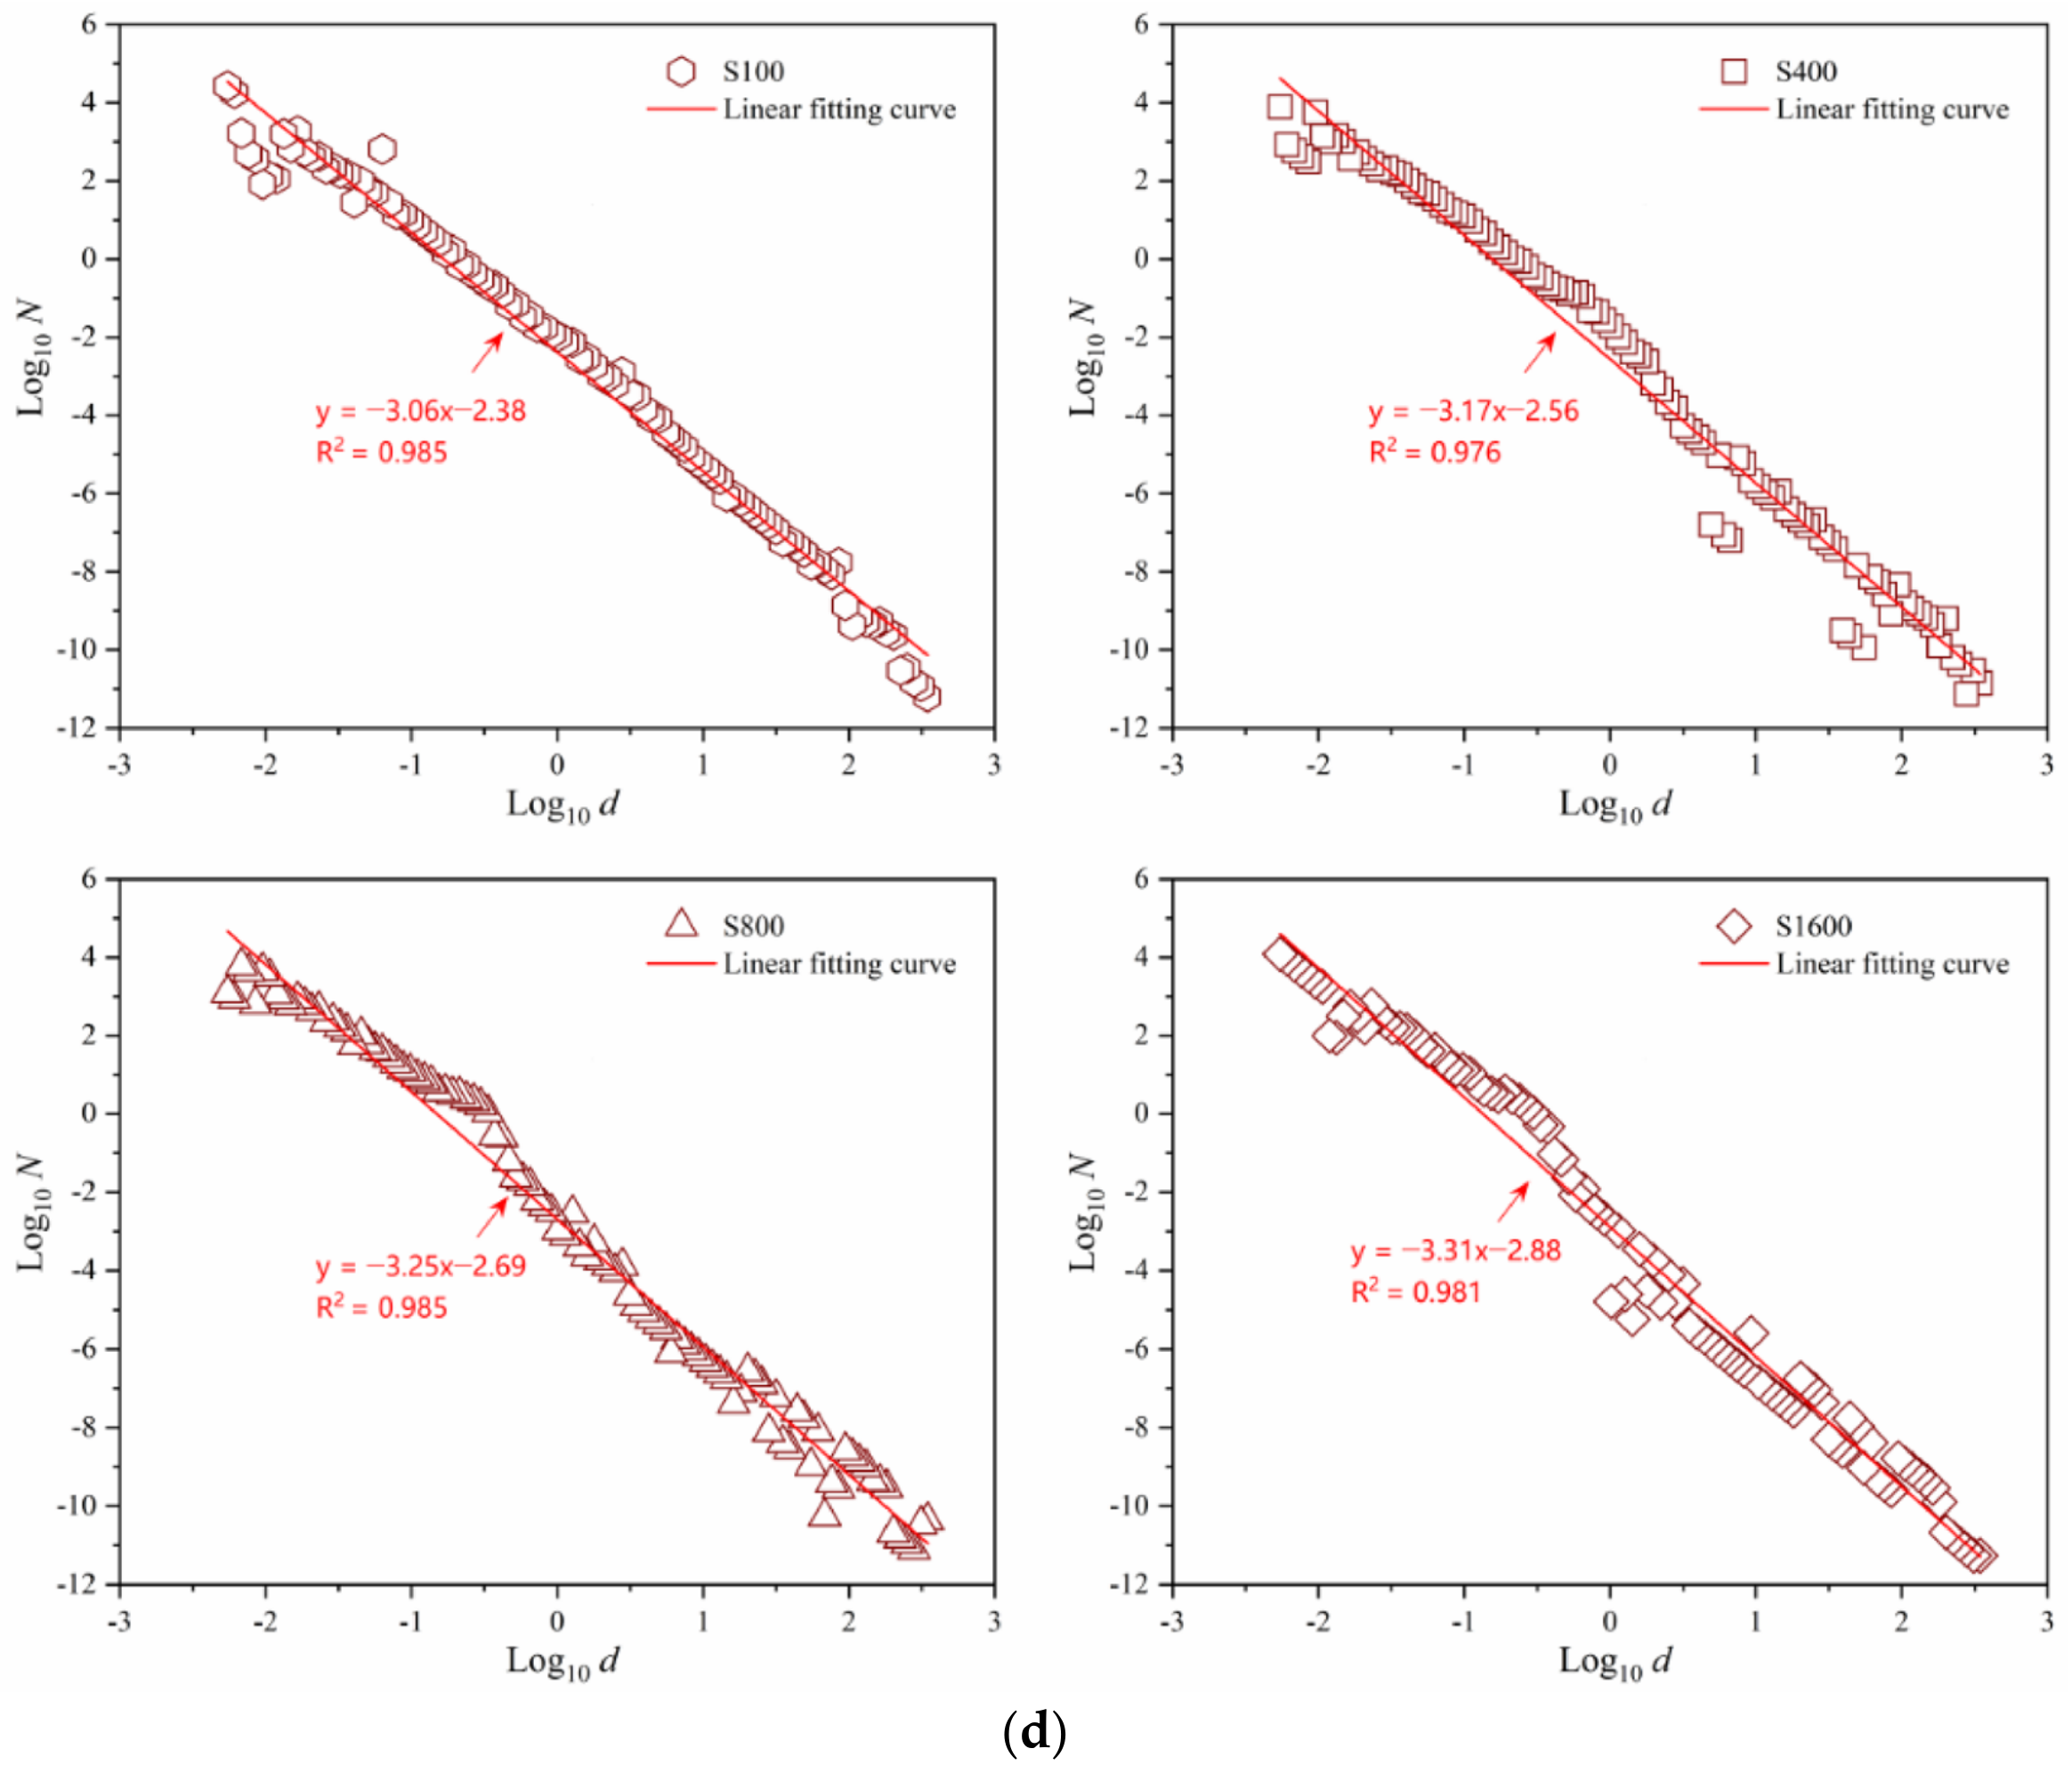
4.3. Evolution of the Fractal Dimension

Figure 5 displays the scatter plots of log 10 N vs. log 10 d and the corresponding fitting curves for the four reconstituted clay samples subjected to different stress levels. It is evident that, for all four clay types, log 10 N and log 10 d exhibit a strong linear correlation at each stress level, with the correlation coefficients of the fitting curves all exceeding 0.97. This indicates that the pore structure of reconstituted clay samples, dominated by kaolinite, illite, montmorillonite, and chlorite, exhibits distinct fractal characteristics. Additionally, this also validates that the filling dimension introduced in this study, as a special form of fractal dimension [32], is well-suited for the processing and analysis of the experimental data obtained by MIP testing. According to Equation (5), it can be concluded that the negative value of the slope of the linear fitting curve represents the fractal dimension of the pore structure of reconstituted clays, which is the main focus of this study. It can be found that, for the four reconstituted clays, the fractal dimension, although not the same, all gradually increased with the increase in stress levels. For kaolinite clay (Figure 5a), the fractal dimension increased step by step from 2.82 at 100 kPa to 3.05 at 1600 kPa. For illite clay (Figure 5b), the fractal dimension evolved from 2.78 at 100 kPa to 2.99 at 1600 kPa. For montmorillonite clay (Figure 5c), the fractal dimension rose from 2.75 at 100 kPa to 2.90 at 1600 kPa. For Shenzhen clay (Figure 5d), the fractal dimension progressed from 3.06 at 100 kPa to 3.25 at 1600 kPa.
In fractal theory, the fractal dimension, D, reflects the complexity and self-similarity of an object or structure. Hence, from a fractal viewpoint, the compression causes a “fine-tuning” of the pore network of reconstituted clays, increasing the complexity of its pore structure and creating more self-similar patterns at different scales. This could be explained by the fact that as 1D vertical loading increased, the pore structure of reconstituted clays underwent compression, causing the larger pores to close and the overall pore distribution to become denser. This led to a more intricate and densely packed structure, with smaller pores emerging or becoming more prominent as larger pores collapsed, which was also accompanied by higher surface roughness. Such a reconstruction process under 1D loading made the pore structure more refined while also increasing the complexity of its geometric configuration, thereby exhibiting more fractal-like characteristics, as evidenced by the rise in fractal dimension (Figure 5).

5. Discussion

5.1. Response of Pore Size to 1D Loading

As defined by Jia et al. [2], the pores within the clay can be categorised into several types based on their size: macropores (>10 μm), mesopores (1–10 μm), L-micropores (0.1–1 μm), S-micropores (0.01–0.1 μm), and submicropores (<0.01 μm). In accordance with this classification, Figure 6 illustrates the volume changes of these five pore types in the four different reconnoitred clays studied in this study under 1D loading from 100 kPa to 1600 kPa, with the aim of further analysing the pore-size changes during 1D compression. For kaolinite clay (Figure 6a), the reduction in pore volume is primarily caused by the compression of L-micropores and mesopores, which decreased by 0.107 cm3/g and 0.103 cm3/g, respectively, accounting for 46.2% and 48.2% of the total pore volume reduction (0.22 cm3/g). For illite clay (Figure 6b), the decrease in pore volume was mostly attributed to L-micropores, which decreased by 0.125 cm3/g, accounting for 57.8% of the total pore volume reduction (0.21 cm3/g), followed by mesopores, contributing 29.9%. For montmorillonite clay (Figure 6c), the collapse of mesopores was almost entirely responsible for the reduction in pore volume, with a decrease of 0.62 cm3/g, accounting for 103.7% of the total pore volume reduction (0.60 cm3/g). This is because, aside from a slight decline of 0.041 cm3/g in the volume of macropores, the volumes of L-micropores, S-micropores, and submicropores all experienced small increases, albeit slightly, by 0.034 cm3/g, 0.026 cm3/g, and 0.003 cm3/g, respectively. The increase in the volume of these three types of pores may be due to the fact that when subjected to 1D loading, the mesopores were broken or crushed and then split into smaller pores, a phenomenon also mentioned by Zheng et al. [3]. It is worth noting that at 800 kPa, an abnormal increase in the volume of macropores was observed, which may have been caused by a malfunction of the MIP instrument. Further repeated tests on reconstituted montmorillonite clay at this stress level will be conducted in the future to make the necessary corrections or provide an explanation for this anomaly. Finally, for Shenzhen clay (Figure 6d), the reduction in pore volume mainly arose from the significant compression of mesopores, which decreased by 0.133 cm3/g, accounting for 76.7% of the total pore volume reduction (0.17 cm3/g), almost reaching 80%. In addition to this, the volumes of macropores, S-micropores, and submicropores also decreased, contributing 33.4%, 1%, and 2.9%, respectively, to the total reduction in pore volume. In contrast, the volume of L-micropores increased by 0.0188 cm3/g, accounting for 10.4% of the total pore volume reduction. Such a response to 1D loading can similarly be explained by the rupture of mesopores, leading to the formation of larger volumes of L-micropores.
Overall, the response of pore size to 1D loading is quite distinct across these four clays with different dominant clay minerals. This underscores the importance of considering pore-size distributions when predicting the compression behaviour of reconstituted clays with different mineral compositions under 1D loading or evaluating their volumetric deformation in geotechnical applications. It should be noted, however, that among all four types of clay, mesopores with diameters in the range of 1–10 μm, typically corresponding to the pores between the aggregates within the reconstituted clay [2,3], are the primary contributors to the macroscopic deformation of clay samples during 1D compression, which plays a key role in the overall compressibility. This is consistent with the existing finding in the literature that for different clays with diverse dominant minerals, it is the aggregate-to-aggregate interactions, rather than the particle-to-particle interactions inside the aggregates, at a micro level, that govern their macro-mechanical response to 1D loading [6,7,8].

5.2. Relationship Between Fractal Dimension and 1D Compressibility

To explore the relationship between the PSD-based fractal dimension at the micro level and the 1D compressibility of reconstituted clay at the macro level, we first compared the evolution of fractal dimensions during 1D compression for four types of reconstituted clays with distinct dominant clay minerals, as shown in Figure 7. It is found that during 1D compression, the evolutionary trend of the fractal dimension for these four reconstituted clays all follows a logarithmic fitting curve with a correlation coefficient greater than 0.99. The only difference lies in the slight variation in the slopes of their fitting curves, with Shenzhen clay having the largest slope, followed by kaolinite clay, illite clay, and finally montmorillonite clay. This indicates that the 1D loading has the greatest effect on the pore structure of Shenzhen clay, while its impact on the pore structure of montmorillonite clay is the smallest. An interesting finding is that at each pressure level, the order of the fractal dimensions for the four types of clay remains consistent. Kaolinite clay exhibits the highest fractal dimension, significantly greater than that of illite clay, which ranks second, followed by montmorillonite clay, while Shenzhen clay has the lowest fractal dimension. Their varying fractal dimension values under the same stress conditions can be attributed to differences in the initial pore structures generated by the distinct mineral compositions of the four types of clay (Table 1). Shenzhen clay, as a natural soil, possesses more complex mineral compositions, which correspond to a higher degree of complexity in the spatial distribution of its pore structure. Therefore, it is not surprising that it exhibits the highest fractal dimension. In contrast, the other three commercial clays have simpler and more uniform mineral compositions, resulting in fractal dimensions that are significantly smaller than that of Shenzhen clay, with the differences between them not being very large. To provide a more intuitive understanding, the initial pore structures of the four types of clay were observed using a Hitachi S4800(Tokyo, Japan) scanning electron microscope (SEM), as shown in Figure 8. The clearly observable variations in clay microstructures, including their fabric and pore characteristics, highlight their unique microscopic features. It is worth noting that the ranking of the fractal dimensions of these four reconstituted clays corresponds well with that of their compressibility index (Figure 3), namely, the larger the D, the larger the Cc, implying that there is a potential relationship between the 1D compressibility of reconstituted clays and the PSD-based fractal dimension.
To better establish the relationship between fractal dimension and 1D compressibility, the modulus of compression, Es, a critical parameter for characterising the compression behaviour of clay layers as well as predicting settlement in foundations composed of reconstituted clays [35], was utilised in this study to represent the compressibility of reconstituted clays. Here, Es is defined as the ratio of the increase in applied vertical effective stress, Δσ’v, to the corresponding rise in volumetric strain, ε v o l , during 1D compression, expressed as Es = Δσ’v ε v o l [35]. According to the volume deformation of reconstituted clay samples recorded in 16 different 1D compression tests, the Es values of the four types of clay were calculated for different stress increments, as summarised in Table 4. It is not surprising that under increased stress levels, the Es showed an upward trend. This is because the increase in one-dimensional loading leads to a denser packing of clay particles and a reduction in pore volume, making it more difficult for the sample to undergo further compression, thereby resulting in a decrease in compressibility. As mentioned in Section 4.3, the D values of the four reconstituted clays increased with load level. Therefore, a linear regression analysis was performed on the D and Es data from the sixteen 1D compression tests of the four types of clays (Table 4) to investigate the relationship between the fractal dimension and the 1D compressibility of different reconstituted clays, as shown in Figure 9. It can be observed that for each type of reconstituted clay, during the compression process, the fractal dimension, D, exhibits a strong positive correlation with the modulus of compression, Es, with R-squared values all greater than 0.9. The specific mathematical relationships between Es and D for kaolinite clay, illite clay, montmorillonite clay, and Shenzhen clay are expressed by the following Equations (8)–(11), as shown below:
Kaolinite   clay :   E s = 12.96 D 36.43 , R 2 = 0.938
Illite   clay :   E s = 12.81 D 35.62 , R 2 = 0.941
Montmorillonite   clay :   E s = 14.26 D 39.08 , R 2 = 0.964
Shenzhen   clay :   E s = 13.61 D 41.39 ,   R 2 = 0.951
Compared to Es, the coefficient of volume compressibility, mv, is stress-dependent and offers more practical value as it is frequently used for settlement calculations. Therefore, the correlation between mv and D was further explored to enhance the practical significance of this study. Here, mv is defined as the ratio of the decrease in void ratio, Δe, to the increase in applied vertical effective stress, Δσ’v, during 1D compression, expressed as mv = Δeσ’v [35], which is the reciprocal of the modulus of compression, Es. Table 4 gives the calculated mv values of the four types of clay for different stress increments. Similarly, by performing linear regression analysis on the mv and D (Figure 10), the mathematical relationships between mv and D for kaolinite clay, illite clay, montmorillonite clay, and Shenzhen clay are expressed by the following Equations (12)–(15), as shown below:
Kaolinite   clay :   m v = 10.11 D + 30.87 , R 2 = 0.918
Illite   clay :   m v = 14.07 D + 42.04 , R 2 = 0.899
Montmorillonite   clay :   m v = 20.48 D + 59.43 , R 2 = 0.863
Shenzhen   clay :   m v = 7.27 D + 24.06 ,   R 2 = 0.872
Unlike the strong positive correlation between D and Es, the fractal dimension, D, and the coefficient of volume compressibility, mv, are still positively correlated during 1D compression for all clay types, with R2 values consistently above 0.85.
The above-derived mathematical relationships for the four reconstituted clays provide a quantitative tool to predict 1D compressibility based on fractal dimension. While all four types of reconstituted clays exhibit similar positive correlations, the differences in the actual values of Es and D (or mv and D) across the clays suggest that the mineralogical composition and initial microstructural characteristics influence the magnitude of this relationship. Therefore, these formulas can also, to some extent, reflect the unique pore structure characteristics of each clay type, offering insights into their macroscopic behaviour. More importantly, these derived equations establish a link between the fractal dimension of pore-size distribution curves and key compressibility parameters (Es and mv), offering a quantitative relationship that may aid constitutive modelling. Specifically, these equations (Equations (8)–(15)) provide a way to incorporate microstructural characteristics, represented by the fractal dimension, into macroscopic constitutive frameworks. This additional microstructural insight can help refine existing models, such as those building on the critical state-based framework proposed by Schofield and Wroth [36] or later modifications incorporating microstructure [37,38], or serve as a foundation for developing new ones that better account for the influence of pore structure characteristics on clay compressibility and its deformation behaviour by incorporating the fractal dimension. Therefore, these findings could enhance soil mechanics modelling to some degree, significantly benefiting modellers who rely on PSD data to predict the 1D compressibility of reconstituted clays.
In terms of practical relevance, these findings also suggest a potential pathway for enhancing settlement prediction models. Since parameters such as Es and mv are commonly used in estimating primary consolidation and deformation, the ability to infer these from measurable microstructural descriptors like fractal dimension opens up new possibilities for incorporating laboratory-obtained PSD data into early-stage site assessment or material classification. Nevertheless, it should be emphasised that the mathematical relationships proposed in this study are not directly applicable to practical design at this stage, and this limitation must be carefully acknowledged to avoid exaggerating their practical relevance. While still at a conceptual stage, this approach could eventually contribute to more structure-informed predictive tools in soft-ground engineering. It is also worth noting that the relationships between Es and D (or mv and D) for the four types of clays presented in this study are based on clays prepared in a reconstituted state and are applicable only to the tested reconstituted clays investigated here. Whether these mathematical relationships (Equations (8)–(15)) hold for clays dominated by kaolinite, illite, montmorillonite, and chlorite in their undisturbed natural state requires further validation in future research.

6. Conclusions

This work investigated the evolution of pore-size distribution (PSD) in four types of reconstituted clays during one-dimensional (1D) compression using mercury intrusion porosimetry (MIP). Fractal theory was employed to quantify the complexity of pore structures through PSD-based fractal dimensions under various stress conditions. By jointly analysing the fractal dimension and macro-mechanical parameters obtained from 1D compression tests, mathematical relationships between the fractal dimension and 1D compressibility were established. The key findings and innovations of this work are summarised as follows:
(1)
The 1D compressibility of four different reconstituted clays, including kaolinite clay, illite clay, montmorillonite clay, and Shenzhen clay, was systematically characterised, where montmorillonite clay exhibits the highest compressibility, while Shenzhen clay with chlorite as the dominant mineral demonstrates the lowest, revealing distinct compression behaviours linked to their mineralogical compositions. Correspondingly, the distinct pore-size evolution of each type of clay under 1D loading was revealed. This innovative observation highlights the importance of PSD in predicting 1D compressibility and emphasises the need to consider mineral composition when evaluating clay compression behaviour. It is found that mesopores (1–10 μm), typically corresponding to inter-aggregate pores, play a dominant role in the macroscopic deformation of clays, with their compression contributing significantly to the overall volume reduction during 1D compression. This insight highlights the critical influence of pore-size distribution and mineralogy on compressibility behaviour.
(2)
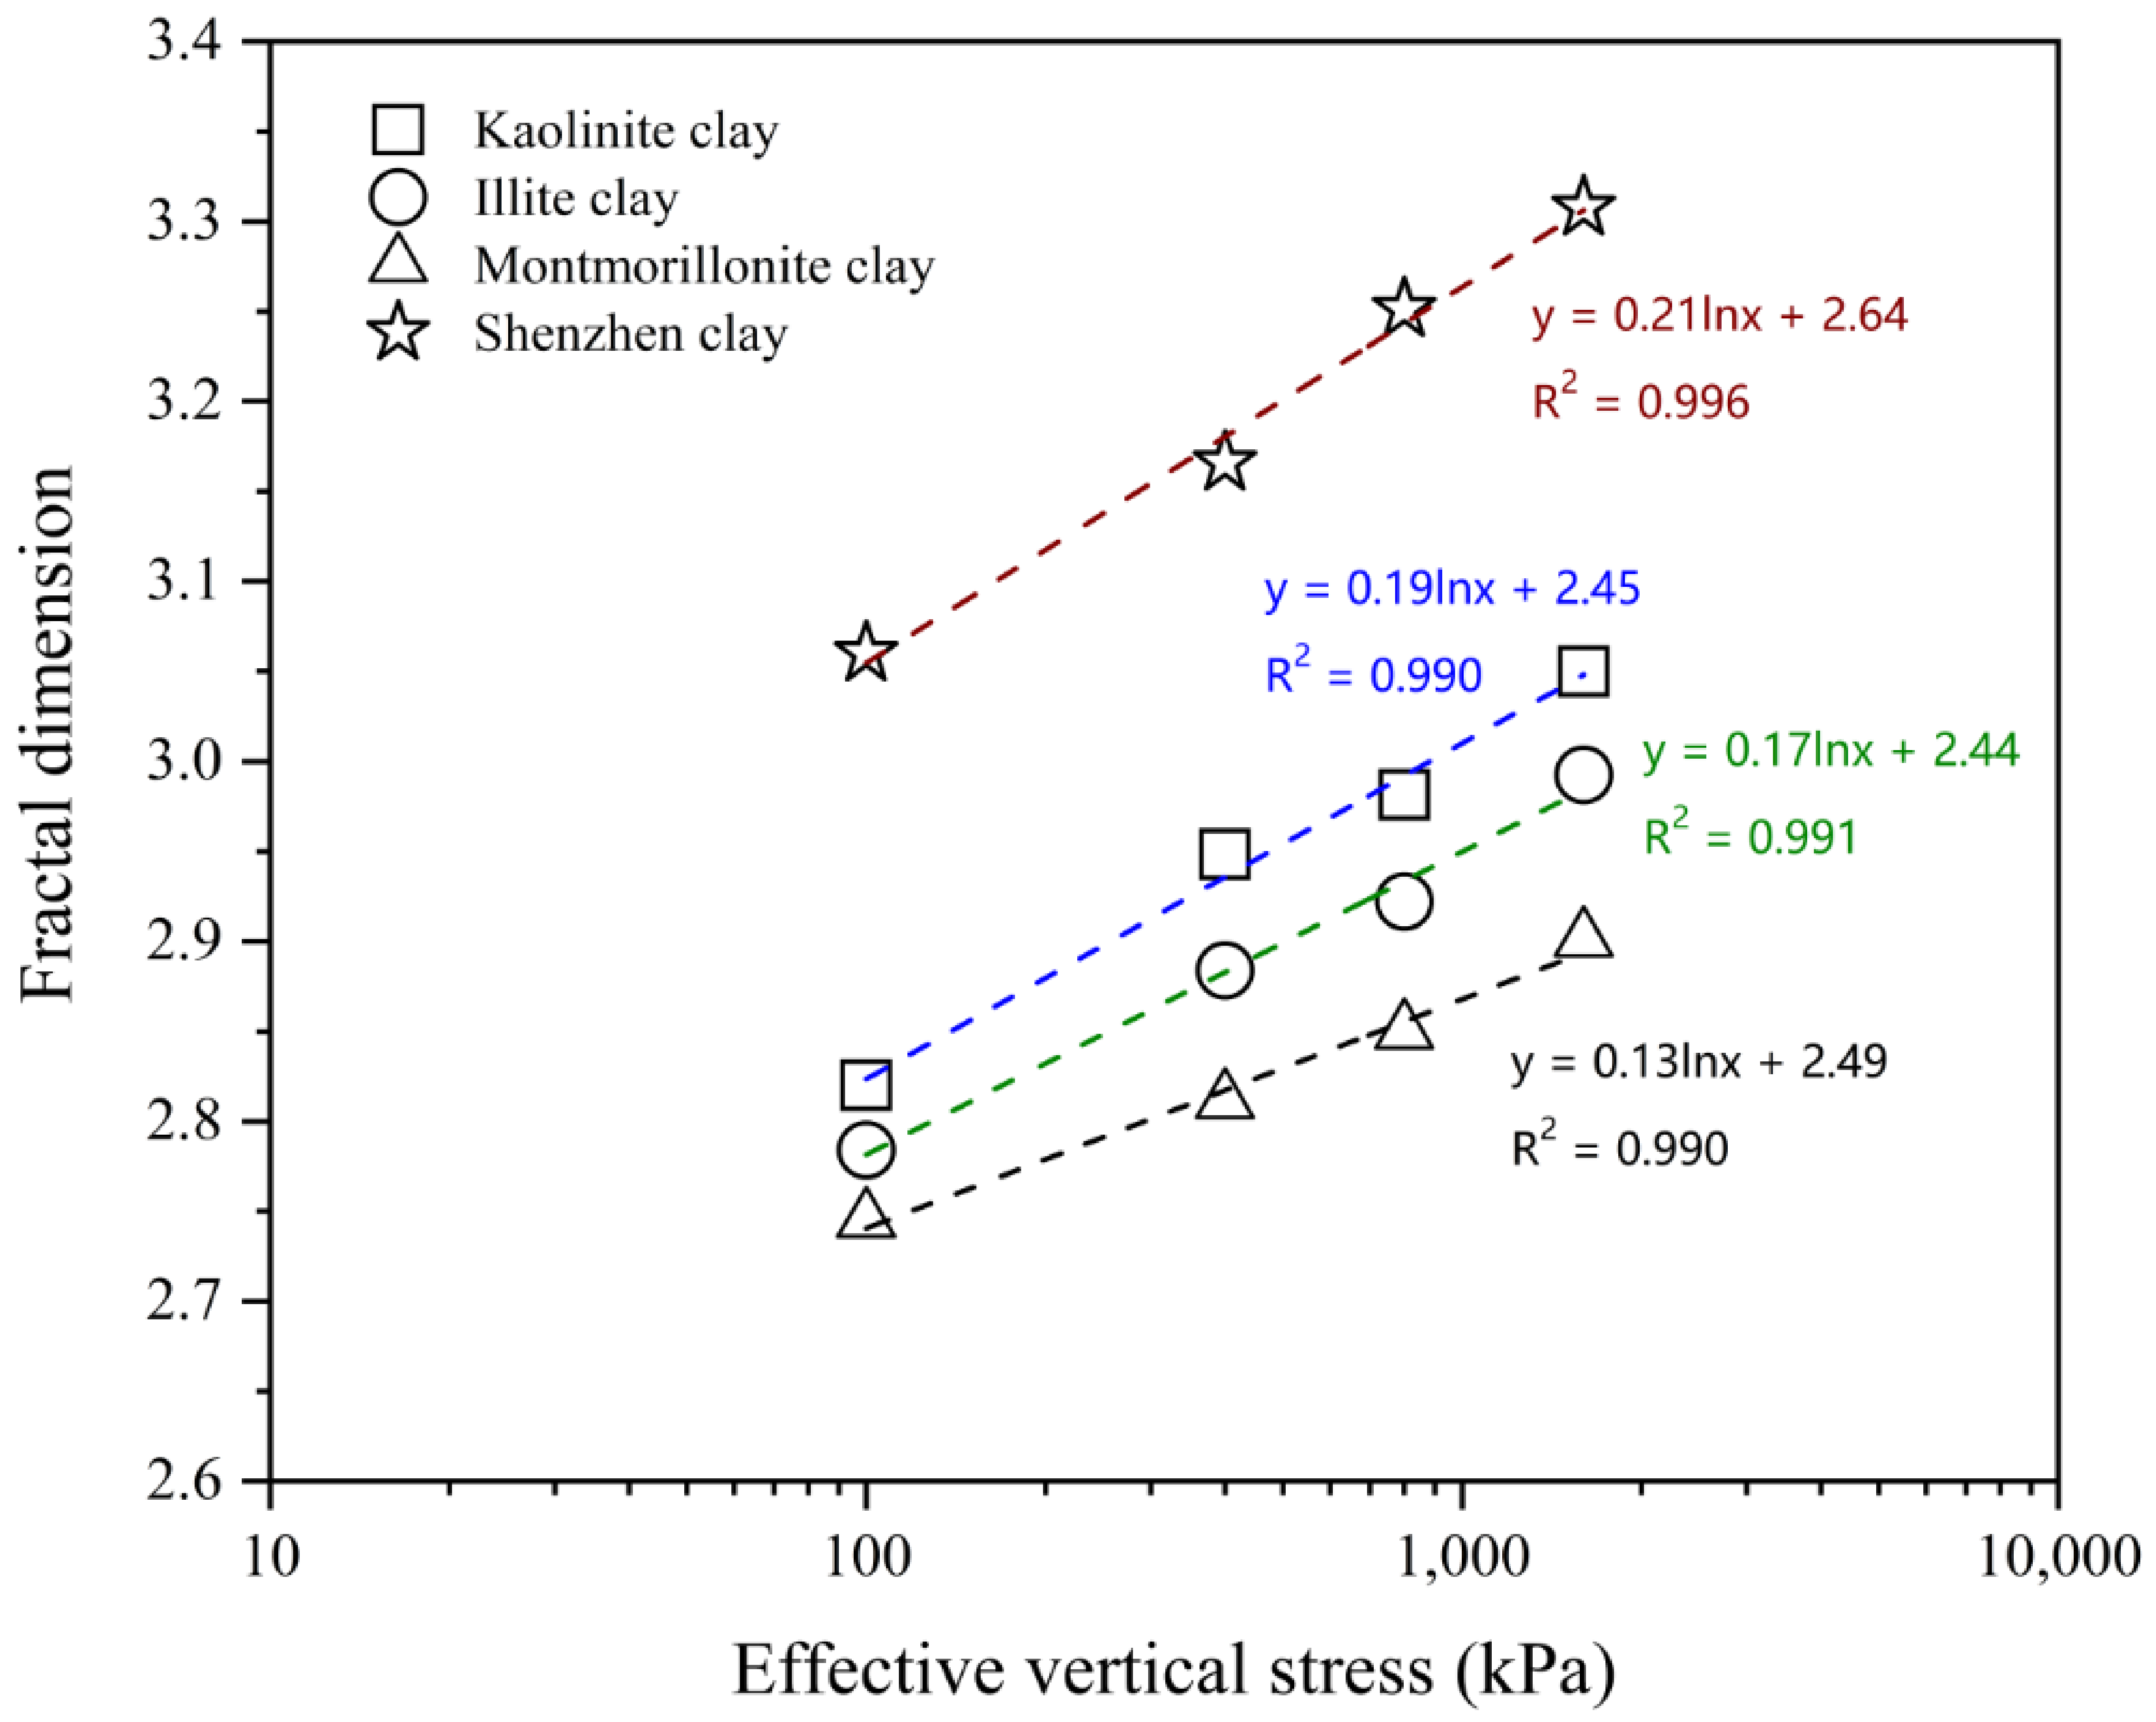
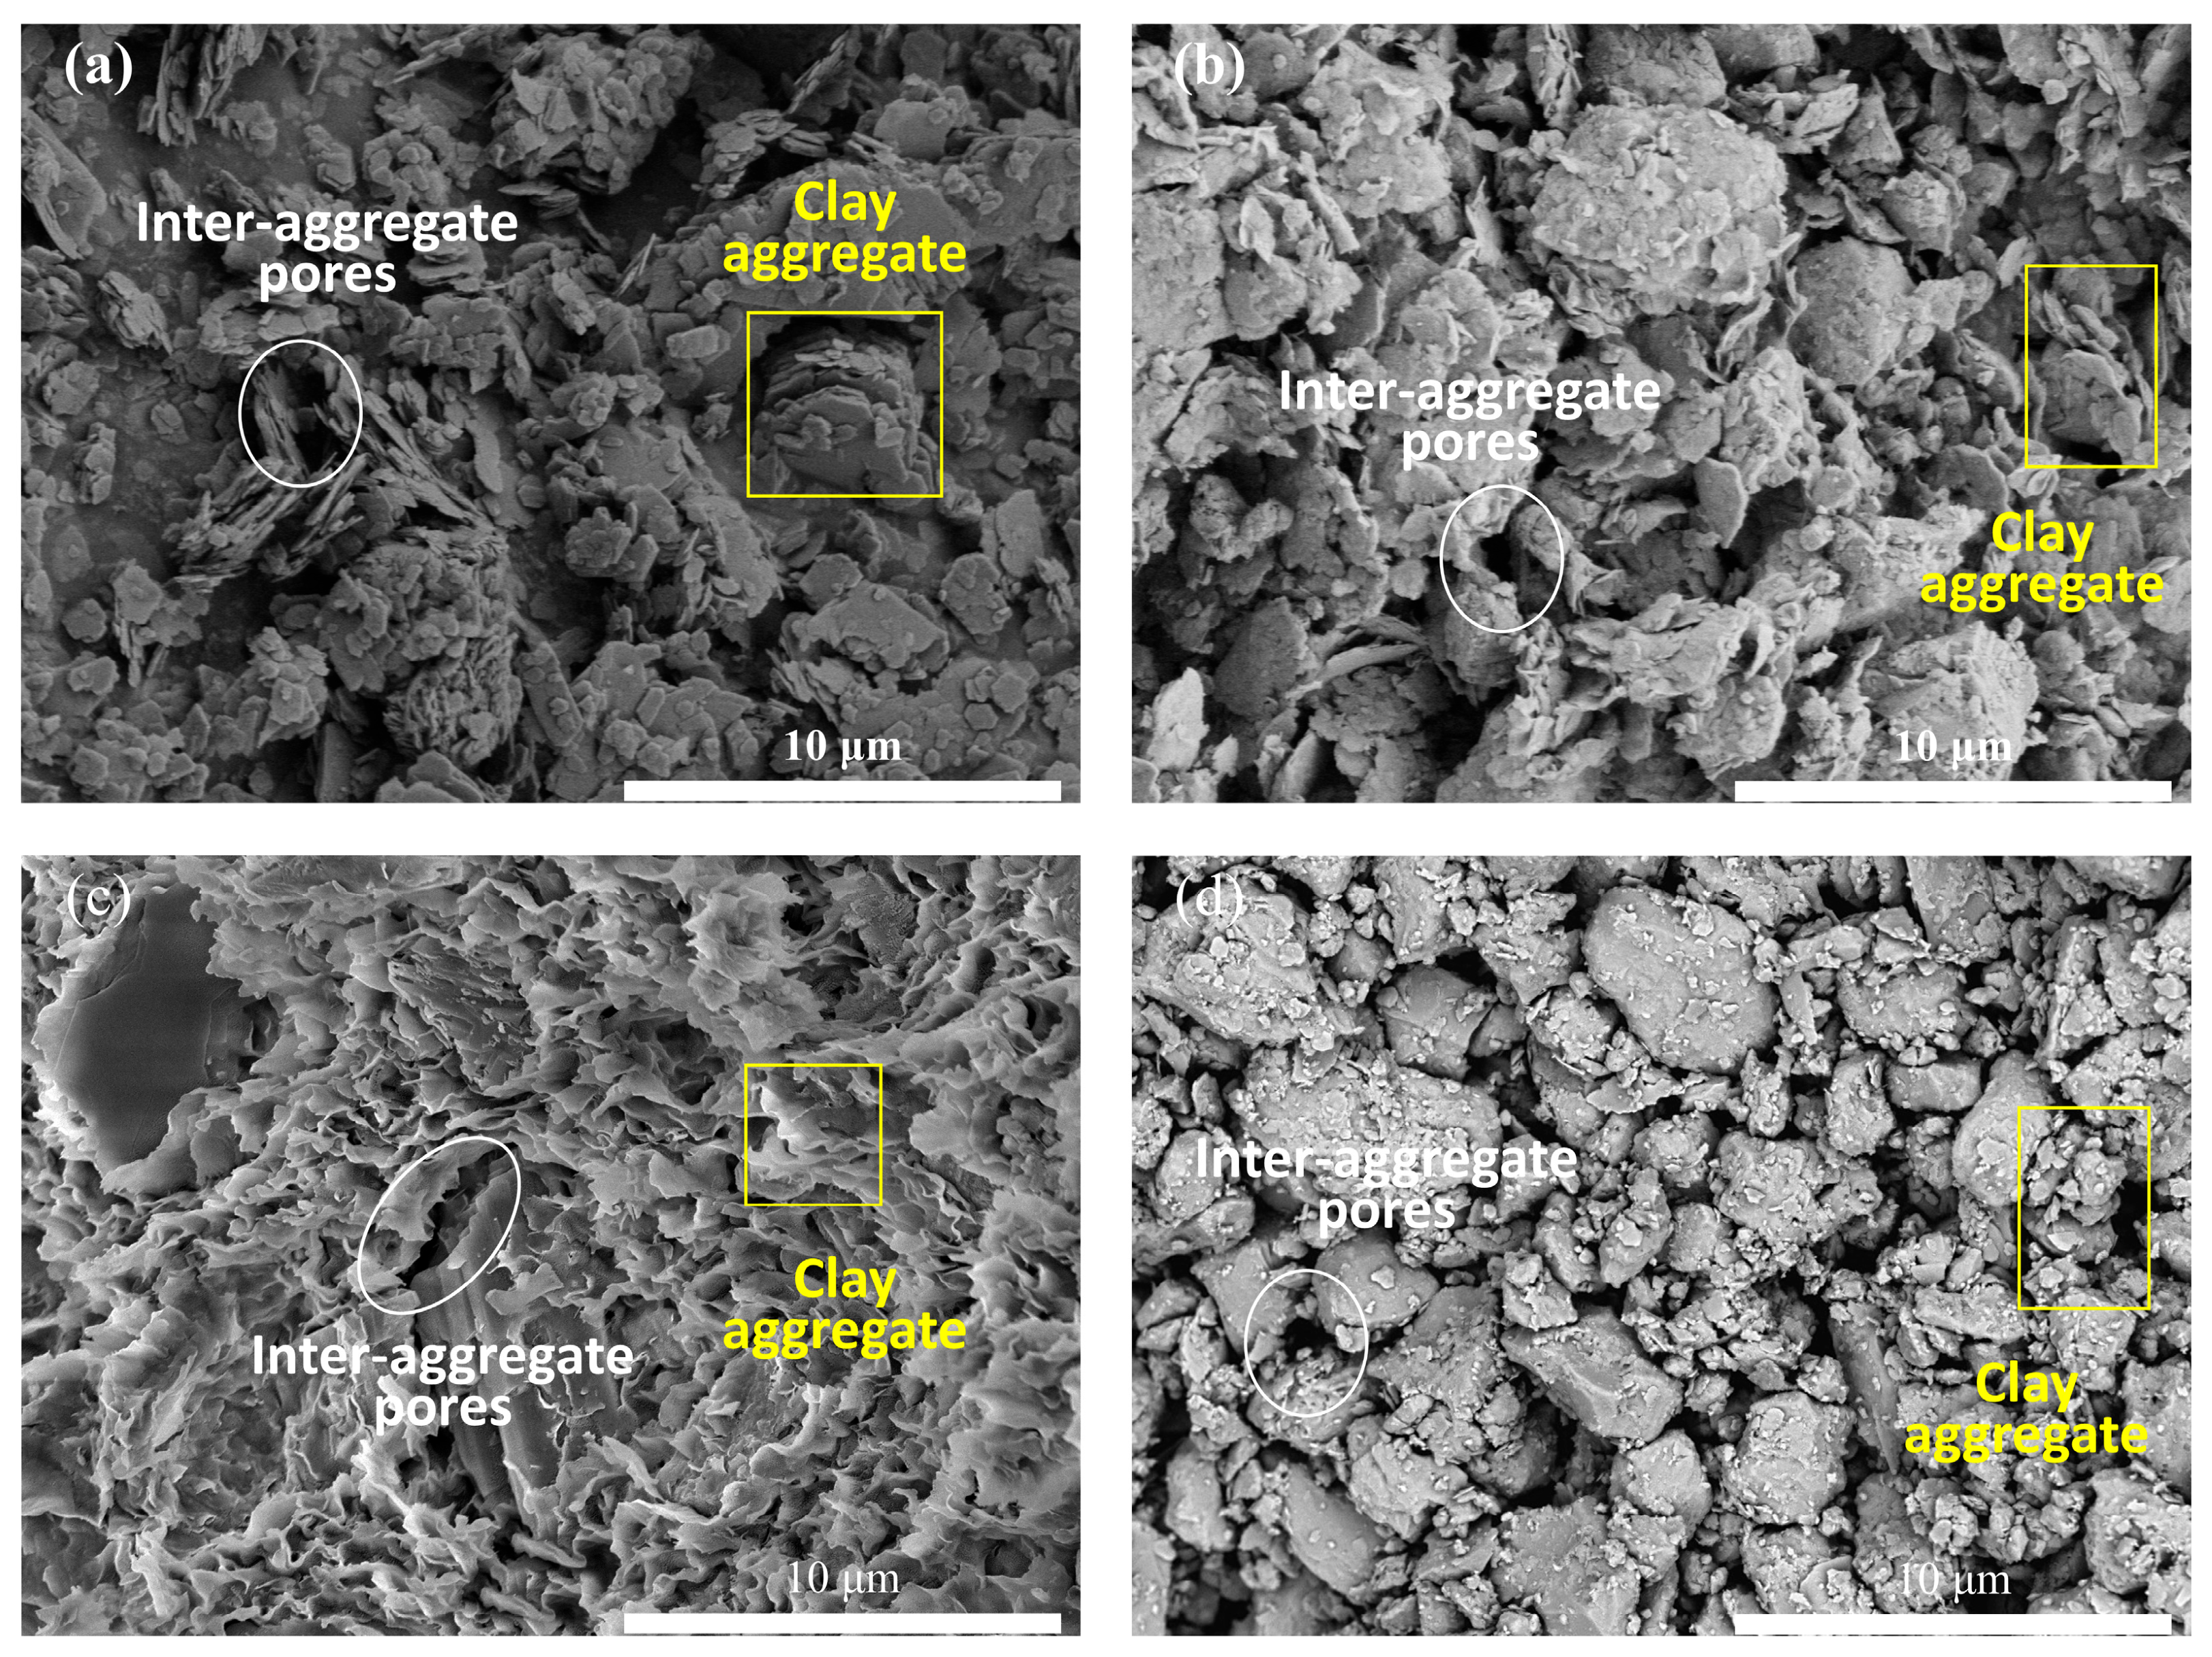
The PSD-based fractal dimension, D, was demonstrated to be an effective proxy for quantifying pore structure complexity. As 1D loading increased, the fractal dimension gradually rose, reflecting the increasing complexity and refinement of the pore structure in reconstituted clays during 1D compression. This change was found to follow a logarithmic trend, with the relationship being most pronounced in Shenzhen clay compared to other commercial soils, indicating its more intricate initial microstructure. The varying fractal dimension values of these four types of clay at the same stress level can be attributed to differences in the initial pore structures induced by the distinct mineral compositions, as evidenced by the SEM images.
(3)
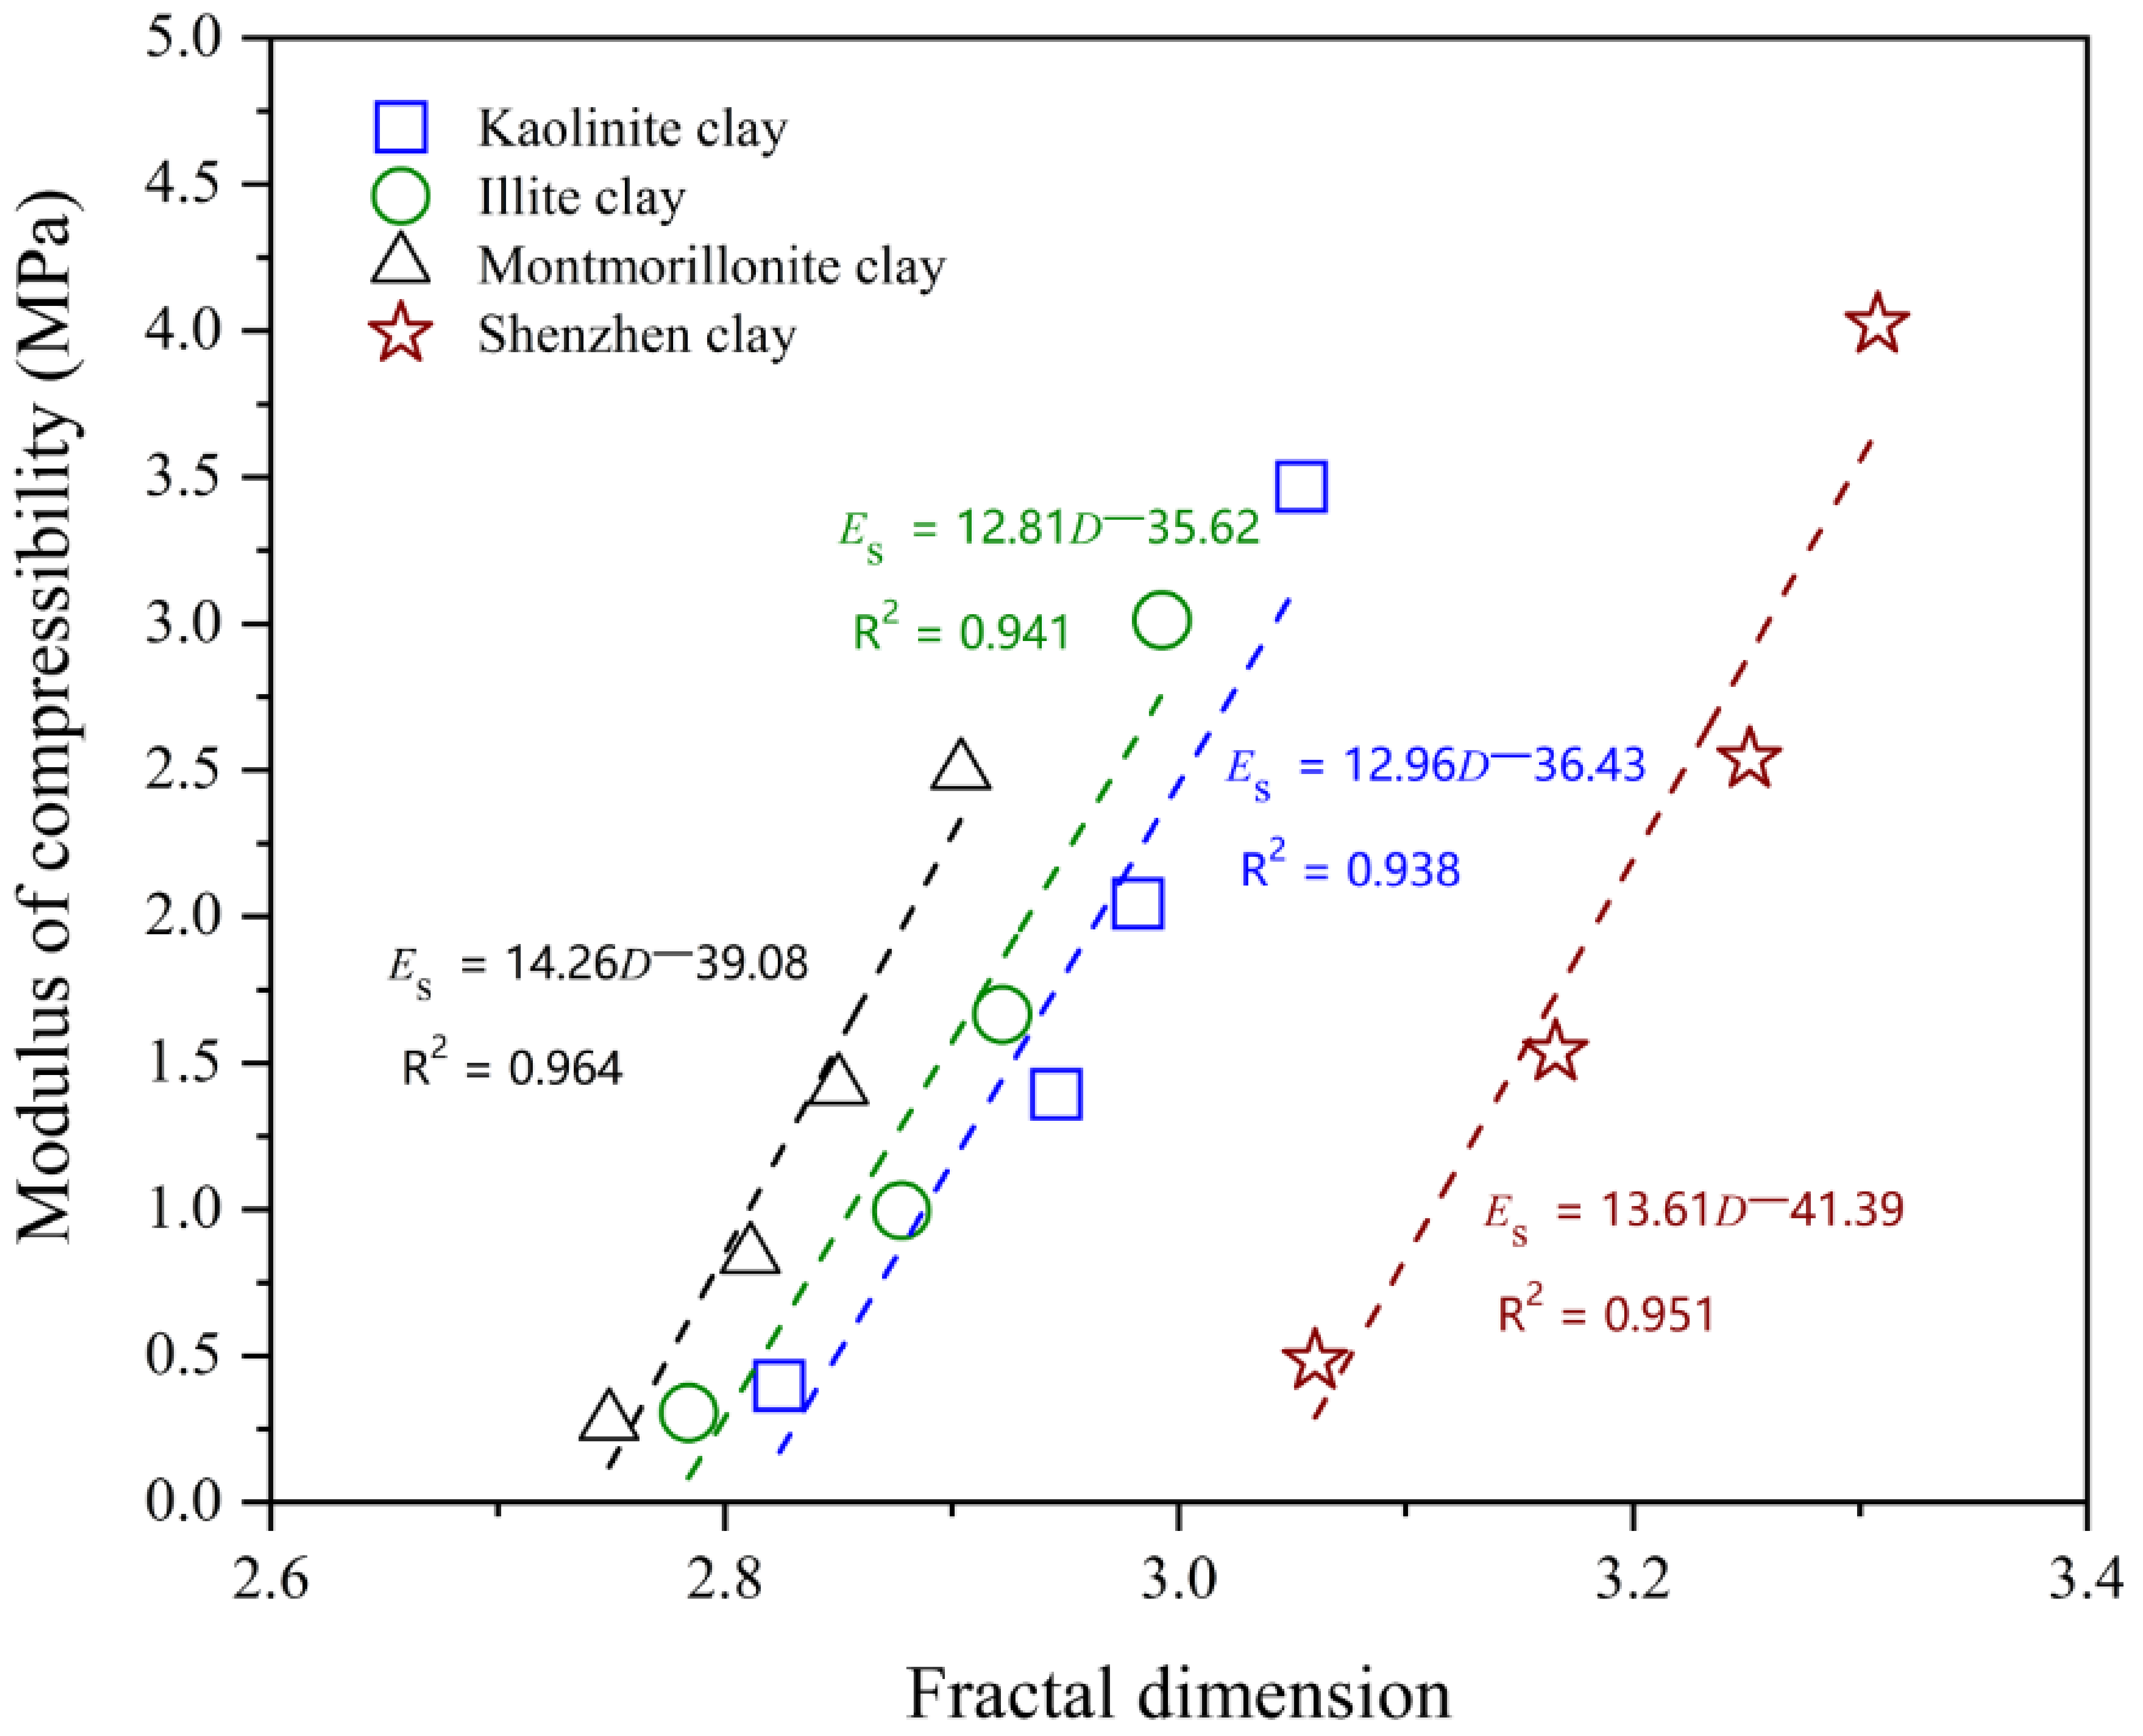
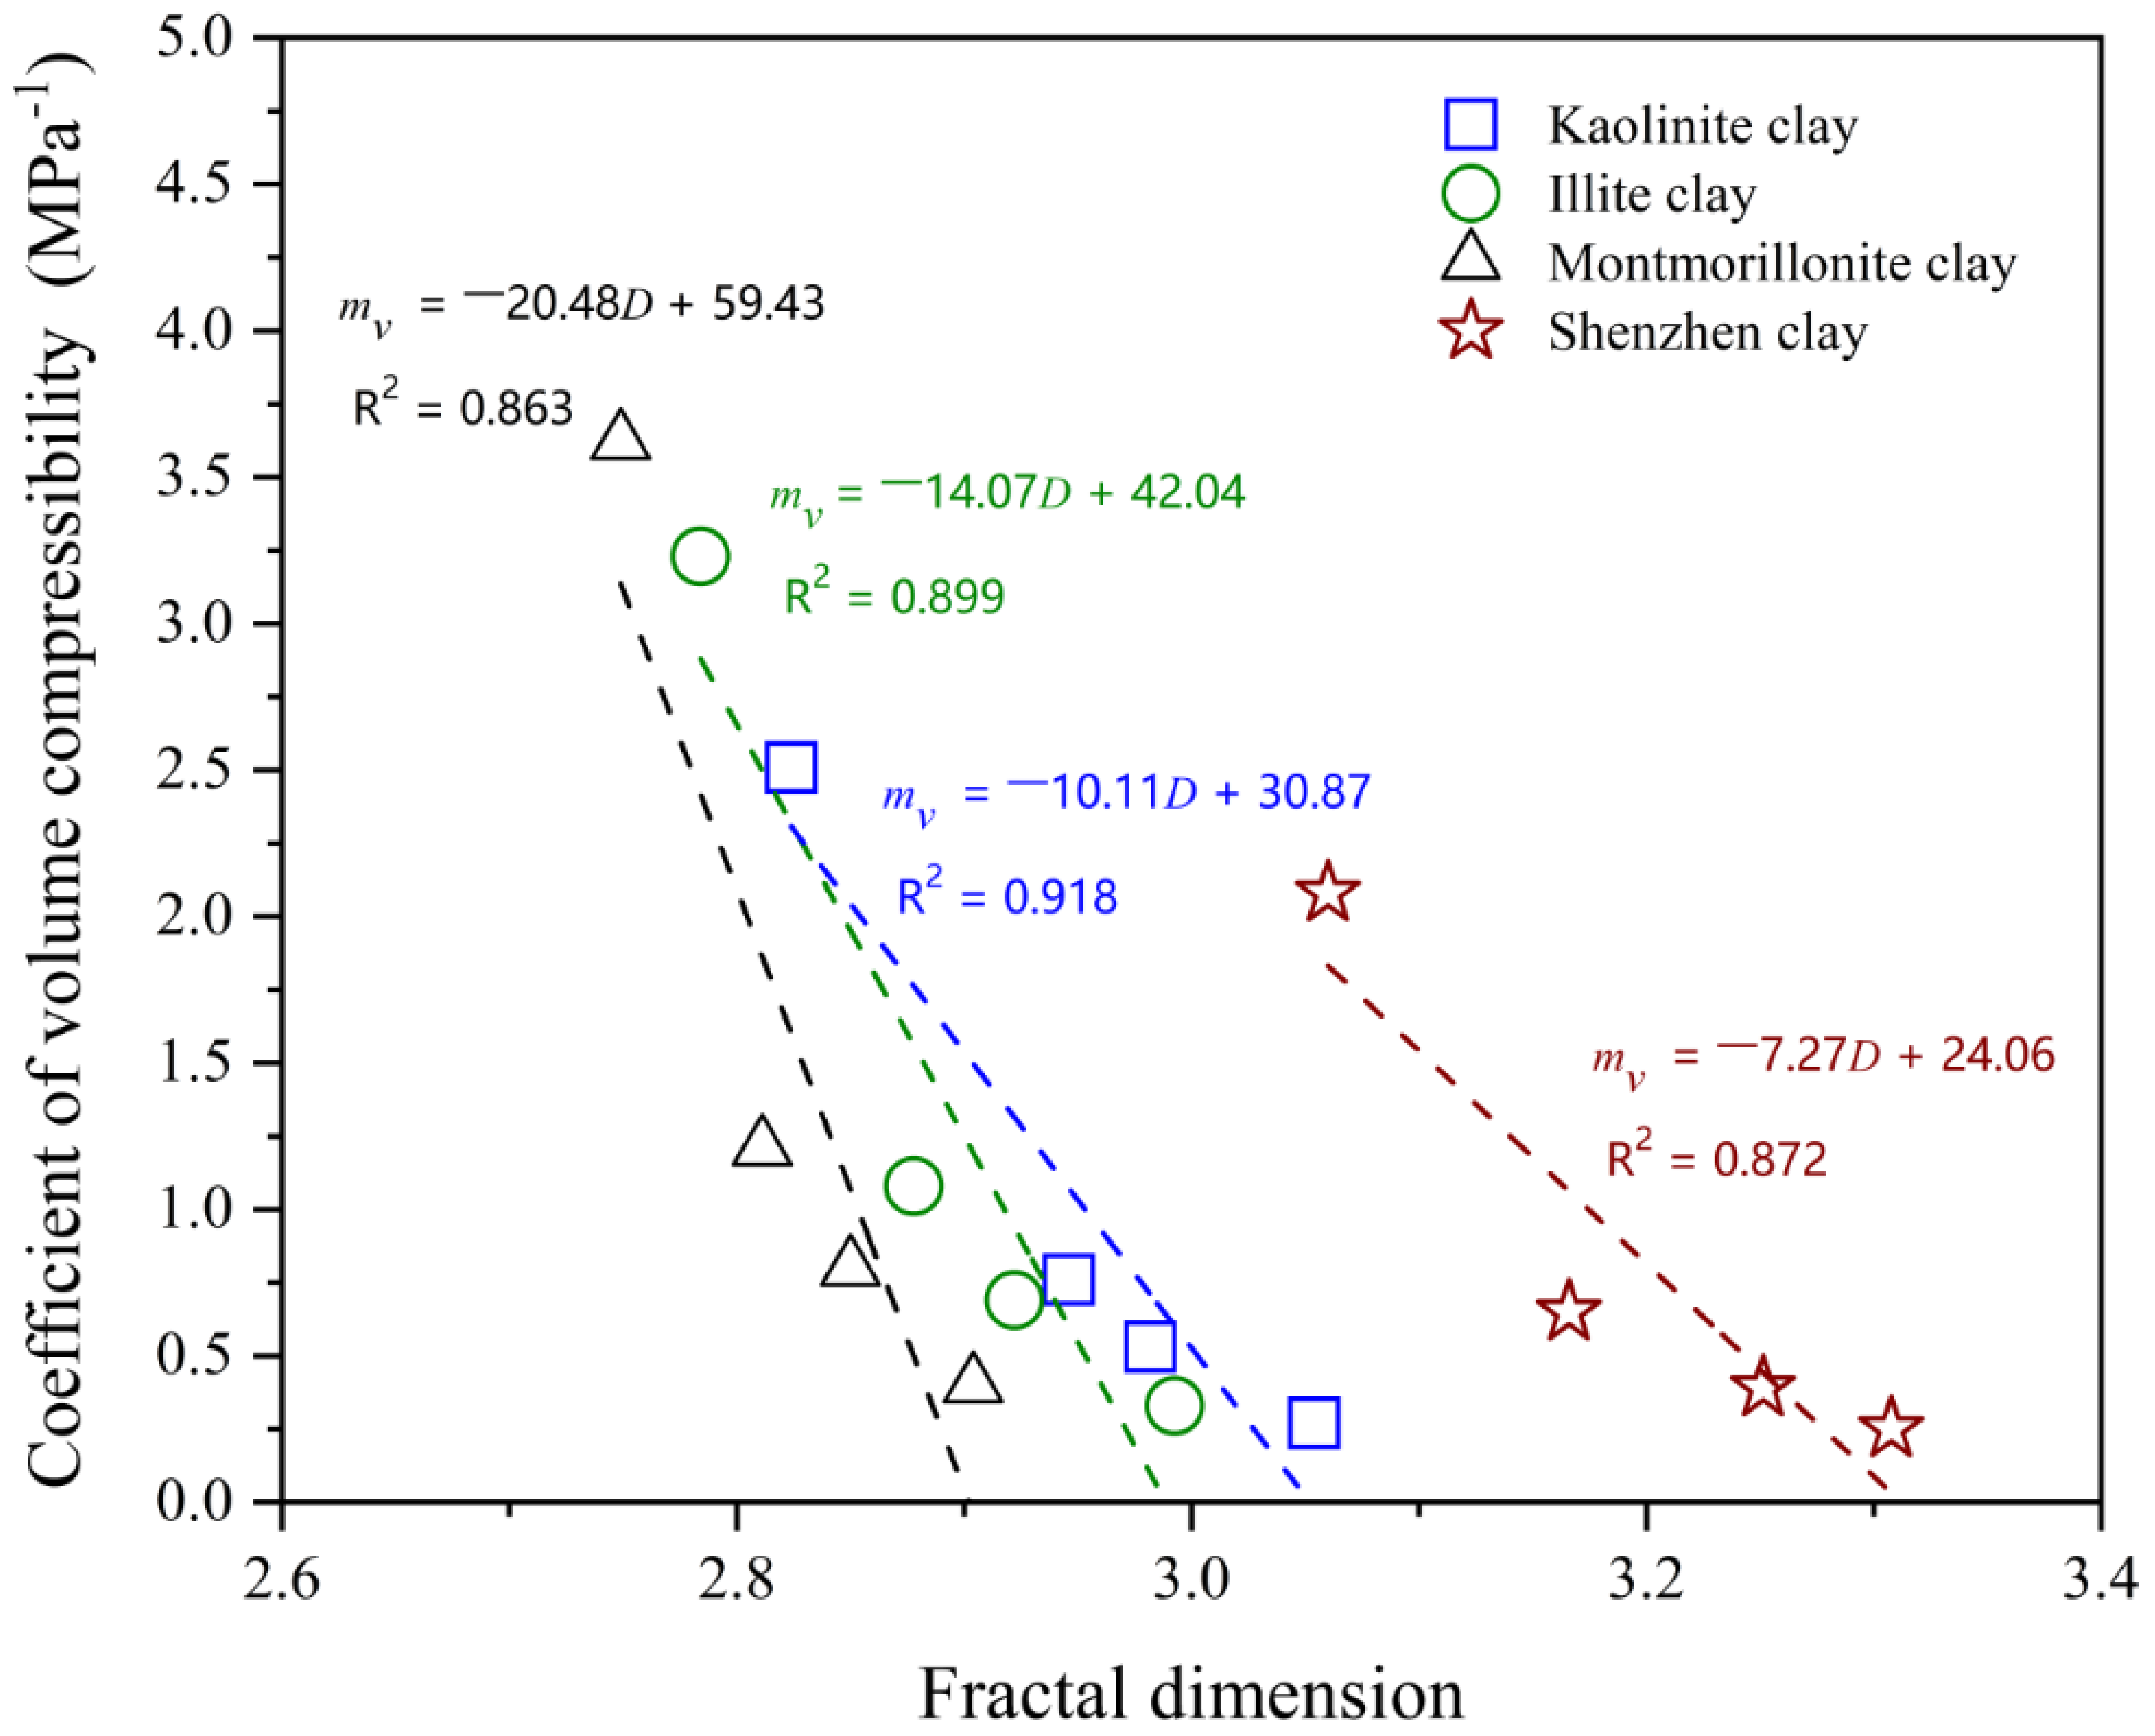
The core and most innovative contribution of this study is the establishment of some robust mathematical relationships between the fractal dimension, D, and key compressibility parameters, namely Es and mv, for four different types of clays, each containing one of the four common clay minerals—kaolinite, illite, montmorillonite, and chlorite. These relationships were quantitatively described by the derived equations for each clay type, offering a predictive tool for estimating 1D compressibility based on fractal dimension. These findings not only provide a novel theoretical basis for future soil mechanics models, particularly valuable for pore-based constitutive models that rely on PSD data, but also serve as a significant advancement in understanding how microstructural characteristics, specifically pore structure complexity, influence macroscopic 1D compressibility of reconstituted clays.
(4)
The experimental protocols adopted in this study, ranging from precise control of the initial void ratio to MIP-based pore structure characterisation, were carefully designed to ensure the reliability and representativeness of the PSD data. These procedures provide valuable methodological references for future studies on the microstructural behaviour of clays under various loading conditions, including triaxial and cyclic shear tests.
In summary, this study presents a novel approach that integrates fractal theory with quantitative PSD analysis to predict and interpret the 1D compressibility of reconstituted clays. These findings have significant implications for geotechnical applications, particularly in the prediction of settlement and consolidation behaviour of reconstituted clays in foundation design. In addition to extending these findings to undisturbed natural clays and exploring the broader applicability of fractal-based models, future work could focus on investigating the potential correlations between fractal dimension and other macroscopic mechanical parameters, such as shear strength or stiffness. Such efforts may help further integrate microstructural descriptors into broader constitutive frameworks beyond 1D compressibility. Furthermore, enhancing the resolution and reliability of pore structure measurements by combining MIP with complementary techniques may offer deeper insights into the evolution of pore geometry and improve the robustness of fractal dimension-based modelling approaches.

Author Contributions

Conceptualisation, Y.Z. and T.Z.; methodology, Y.Z.; software, Y.Z.; validation, Y.Z., T.Z. and J.C.; formal analysis, Y.Z.; investigation, Y.Z.; resources, Y.Z.; data curation, Y.Z. and K.S.; writing—original draft preparation, Y.Z.; writing—review and editing, J.C., K.S. and J.L.; visualisation, Y.Z. and K.S.; supervision, J.L.; project administration, Y.Z. and J.L.; funding acquisition, Y.Z. and J.L. All authors have read and agreed to the published version of the manuscript.

Funding

This work was financially supported by the National Natural Science Foundation of China (Grant no: 52239008), the Fellowship Program of China Postdoctoral Science Foundation (Grant no: 2024M754194; 2024M764195; GZC20233478), and the Shenzhen Science and Technology Program (Grant no: KJZD20230923114911022).

Data Availability Statement

The data sets generated during and/or analysed during the current study are available from the corresponding author upon reasonable request.

Acknowledgments

The authors are very grateful to Jinhui Li from Harbin Institute of Technology (Shenzhen) for her kind guidance and support.

Conflicts of Interest

Author Kun Shan was employed by the company PowerChina Huadong Engineering Co., Ltd. The remaining authors declare that the research was conducted in the absence of any commercial or financial relationships that could be construed as a potential conflict of interest.

References

  1. Delage, P. A Microstructure Approach to the Sensitivity and Compressibility of Some Eastern Canada Sensitive Clays. Géotechnique 2010, 60, 353–368. [Google Scholar]
  2. Jia, R.; Lei, H.; Li, K. Compressibility and Microstructure Evolution of Different Reconstituted Clays during 1D Compression. Int. J. Geomech. 2020, 20, 04020181. [Google Scholar]
  3. Zheng, Y.; Baudet, B.A.; Delage, P.; Pereira, J.-M.; Sammonds, P. Pore Changes in an Illitic Clay during One-Dimensional Compression. Géotechnique 2023, 73, 917–932. [Google Scholar] [CrossRef]
  4. Zhong, B.; Zhu, Y.; Feng, G.; Xiang, J.; Wang, Y. Matrix Compression and Pore Heterogeneity in the Coal-Measure Shale Reservoirs of the Qinshui Basin: A Multifractal Analysis. Fractal Fract. 2024, 8, 580. [Google Scholar] [CrossRef]
  5. Sridharan, A.; Altschaeffl, A.G.; Diamond, S. Pore Size Distribution Studies. J. Soil Mech. Found. Div. 1971, 97, 771–787. [Google Scholar] [CrossRef]
  6. Delage, P.; Lefebvre, G. Study of the Structure of a Sensitive Champlain Clay and of Its Evolution during Consolidation. Can. Geotech. J. 1984, 21, 21–35. [Google Scholar] [CrossRef]
  7. Hicher, P.Y.; Wahyudi, H.; Tessier, D. Microstructural Analysis of Inherent and Induced Anisotropy in Clay. Mech. Cohesive-Frict. Mater. 2000, 5, 341–371. [Google Scholar] [CrossRef]
  8. Jadda, K.; Bag, R. The Fabric Evaluation of Two Indian Bentonites Subjected to Different Suctions and Consolidation Pressures. Eng. Geol. 2022, 298, 106535. [Google Scholar] [CrossRef]
  9. Mandelbrot, B. How Long Is the Coast of Britain? Statistical Self-Similarity and Fractional Dimension. Science 1967, 156, 636–638. [Google Scholar] [CrossRef]
  10. Song, C.; Havlin, S.; Makse, H.A. Origins of fractality in the growth of complex networks. Nat. Phys. 2006, 2, 275–281. [Google Scholar] [CrossRef]
  11. Carpinteri, A.; Mainardi, F. Fractals and Fractional Calculus in Continuum Mechanics; International Centre for Mechanical Sciences, Courses and Lectures; Springer Vienna: Vienna, Austria, 1997. [Google Scholar]
  12. Rivero, J.J.B. The fractal geometry of Luhmann’s sociological theory or debugging systems theory. Technol. Forecast. Soc. Change 2019, 146, 31–40. [Google Scholar]
  13. Hattaf, K. A New Class of Generalized Fractal and Fractal-Fractional Derivatives with Non-Singular Kernels. Fractal Fract. 2023, 7, 395. [Google Scholar] [CrossRef]
  14. Rieu, M.; Sposito, G. Fractal Fragmentation, Soil Porosity, and Soil Water Properties: I. Theory. Soil Sci. Soc. Am. J. 1991, 55, 1231–1238. [Google Scholar] [CrossRef]
  15. Pyun, S.I.; Rhee, C.K. An investigation of fractal characteristics of mesoporous carbon electrodes with various pore structures. Electrochim. Acta 2004, 49, 4171–4180. [Google Scholar] [CrossRef]
  16. Kang, X.; Li, H.; Zhang, G.; Li, S.; Shan, L.; Zhao, J.; Zhang, Z. A Binary Medium Constitutive Model for Frozen Solidified Saline Soil in Cold Regions and Its Fractal Characteristics Analysis. Fractal Fract. 2024, 8, 33. [Google Scholar] [CrossRef]
  17. De Oliveira, J.A.; Pires, L.F.; Cássaro, F.A.; Gaspareto, J.V.; Posadas, A.N.; Mooney, S.J. Soil pore system complexity and heterogeneity as affected by contrasting management practices. Soil Tillage Res. 2022, 224, 105497. [Google Scholar]
  18. Wang, L.; Zeng, X.; Yang, H.; Lv, X.; Guo, F.; Shi, Y.; Hanif, A. Investigation and application of fractal theory in cement-based materials: A review. Fractal Fract. 2021, 5, 247. [Google Scholar] [CrossRef]
  19. Tao, G.; Wu, X.; Xiao, H.; Chen, Q.; Cai, J. A Unified Fractal Model for Permeability Coefficient of Unsaturated Soil. Fractals 2019, 27, 1940012. [Google Scholar]
  20. Zhang, Y.; Zhong, X.; Lin, J.; Zhao, D.; Jiang, F.; Wang, M.-K.; Ge, H.; Huang, Y. Effects of Fractal Dimension and Water Content on the Shear Strength of Red Soil in the Hilly Granitic Region of Southern China. Geomorphology 2020, 351, 106956. [Google Scholar]
  21. Li, J.; Chen, H.; Gao, X.; Ding, Q.; Shan, W.; Guo, H.; Zhuo, J. Cracks Evolution and Micro Mechanism of Compacted Clay under Wet-Dry Cycles and Wet-Dry-Freeze-Thaw Cycles. Cold Reg. Sci. Technol. 2023, 214, 103944. [Google Scholar] [CrossRef]
  22. ASTM D854-23; Standard Test Methods for Specific Gravity of Soil Solids by the Water Displacement Method. ASTM International: West Conshohocken, PA, USA, 2023.
  23. ASTM D4318-17e1; Standard Test Methods for Liquid Limit, Plastic Limit, and Plasticity Index of Soils. ASTM International: West Conshohocken, PA, USA, 2017.
  24. Burland, J.B. On the Compressibility and Shear Strength of Natural Clays. Géotechnique 1990, 40, 329–378. [Google Scholar]
  25. Rocchi, I.; Coop, M.R. Experimental Accuracy of the Initial Specific Volume. Geotech. Test. J. 2014, 37, 169–175. [Google Scholar]
  26. Zheng, Y.; Baudet, B.A. Evolution of Nano-Pores in Illite-Dominant Clay during Consolidation. Acta Geotech. 2024, 19, 71–83. [Google Scholar]
  27. Washburn, E.W. The Dynamics of Capillary Flow. Phys. Rev. 1921, 17, 273–283. [Google Scholar]
  28. Diamond, S. Pore Size Distributions in Clays. Clays Clay Miner. 1970, 18, 7–23. [Google Scholar]
  29. Pachepsky, Y.A.; Korsunskaia, L.P.; Hajnos, M. Fractal parameters of soil pore surface area under a developing crop. Fractals 1996, 4, 97–104. [Google Scholar]
  30. Ju, X.; Jia, Y.; Li, T.; Gao, L.; Gan, M. Morphology and multifractal characteristics of soil pores and their functional implication. Catena 2021, 196, 104822. [Google Scholar]
  31. Liu, Y.; Deng, H.; Wang, P.; Yu, S. Analysis of pore structure characteristics and strength prediction model of coarse-grained soil based on fractal theory. Environ. Earth Sci. 2023, 82, 592. [Google Scholar]
  32. Tricot, C. Curves and Fractal Dimension; Springer: New York, NY, USA, 1995. [Google Scholar]
  33. Griffiths, F.J.; Joshi, R.C. Change in Pore Size Distribution Due to Consolidation of Clays. Géotechnique 1989, 39, 159–167. [Google Scholar]
  34. Jalal, F.E.; Xu, Y.; Li, X.; Jamhiri, B.; Iqbal, M. Fractal approach in expansive clay-based materials with special focus on compacted GMZ bentonite in nuclear waste disposal: A systematic review. Environ. Sci. Pollut. Res. 2021, 28, 43287–43314. [Google Scholar] [CrossRef]
  35. Mitchell, J.K. Fundamentals of Soil Behavior, 2nd ed.; Wiley: New York, NY, USA, 1993. [Google Scholar]
  36. Schofield, A.N.; Wroth, P. Critical State Soil Mechanics; McGraw-Hill: London, UK, 1968; Volume 310. [Google Scholar]
  37. Callisto, L.; Rampello, S. An interpretation of structural degradation for three natural clays. Can. Geotech. J. 2004, 41, 392–407. [Google Scholar] [CrossRef]
  38. Fathalikhani, M.; Graham, J.; Kurz, D.; Maghoul, P. Investigation and modification of a CSSM-based elastic–thermoviscoplastic model for clay. Int. J. Geomech. 2022, 22, 04022161. [Google Scholar] [CrossRef]
Figure 1. Grain size distribution of the four clays investigated in this study.
Fractalfract 09 00235 g001
Figure 2. Schematic diagram illustrating the testing procedures and methods used in this study.
Fractalfract 09 00235 g002
Figure 3. Results of 1D compression tests on four reconstituted clays in the e–logσ’v plot.
Fractalfract 09 00235 g003
Figure 4. Evolution of the pore-size distribution (PSD) curves during 1D compression: (a) kaolinite clay; (b) illite clay; (c) montmorillonite clay; (d) Shenzhen clay.
Fractalfract 09 00235 g004
Figure 5. Curves of log 10 N - log 10 d of the reconstituted clay used to determine the fractal dimension: (a) kaolinite clay; (b) illite clay; (c) montmorillonite clay; (d) Shenzhen clay.
Fractalfract 09 00235 g005aFractalfract 09 00235 g005bFractalfract 09 00235 g005c
Figure 6. Volume changes of five types of pores inside the reconstituted clay during 1D compression: (a) kaolinite clay; (b) illite clay; (c) montmorillonite clay; (d) Shenzhen clay.
Fractalfract 09 00235 g006
Figure 7. Comparison of the evolution of fractal dimension of four reconstituted clays during 1D compression.
Fractalfract 09 00235 g007
Figure 8. Micrographs of four different types of clay in their initial state: (a) kaolinite clay; (b) illite clay; (c) montmorillonite clay; (d) Shenzhen clay.
Fractalfract 09 00235 g008
Figure 9. Mathematical relationship between the fractal dimension and the modulus of compression of reconstituted clays.
Fractalfract 09 00235 g009
Figure 10. Mathematical relationship between the fractal dimension and the coefficient of volume compressibility of reconstituted clays.
Fractalfract 09 00235 g010
Table 1. Mineralogical compositions of the four soils used in this study.
Kaolinite ClayIllite ClayMontmorillonite ClayShenzhen Clay
Kaolinite (%)92.5000
Illite (%)1.286.221.519.5
Montmorillonite (%)0051.71.5
Chlorite (%)00048.4
Quartz (%)5.612.519.617.3
Calcite (%)007.29.6
Micaceous minerals (%)1.9003.7
Feldspar minerals (%)01.36.50
Table 2. Geotechnical index properties of four different types of clay investigated in this study.
Kaolinite ClayIllite ClayMontmorillonite ClayShenzhen Clay
Specific gravity, G_s2.592.642.352.78
Nature water content, w_n (%)---52.6
Liquid limit, w_L (%)60.265.8106.548.4
Plastic limit, w_P (%)27.327.528.422.8
Plasticity index (PI) (%)32.938.378.125.6
USCS classification *CHCHCECI
Kaolinite clayIllite clayMontmorillonite clayShenzhen clay
Specific gravity, G_s2.592.642.352.78
* The Unified Soil Classification System (USCS) classification is used for soil classification in this study, where CH refers to clay with high plasticity, CI refers to clay with intermediate plasticity, and CE refers to expansive clay.
Table 3. Details of different clay samples subject to 1D compression and micro-analysis.
Test No.Maximum Stress Level (kPa)Water Content,
w (%) *
Saturation, Sr (%)Initial Void Ratio, eiFinal Void Ratio
Equation (1)Equation (2)Equation (3)Chosen Value **
K071.3899.21.8761.8851.8821.88
K10010045.831001.8771.8841.8831.881.16
K40040035.251001.8781.8831.8811.880.89
K80080030.131001.8751.8871.8801.880.75
K1600160024.851001.8791.8821.8831.880.62
I078.1598.72.0792.0812.0802.08
I10010042.831002.0812.0832.0812.081.08
I40040030.081002.0782.0822.0812.080.76
I80080023.721002.0772.0802.0792.080.61
I1600160017.951002.0802.0822.0802.080.45
M0147.351003.1633.1693.1713.17
M10010085.241003.173.1713.1643.171.84
M40040052.281003.1593.1753.1693.171.13
M80080034.861003.1693.1693.1663.170.82
M1600160025.321003.1613.1723.1713.170.49
S058.1697.51.541.5561.5521.55
S10010037.681001.5421.5571.5481.551.02
S40040031.421001.5481.5511.5491.550.80
S80080025.961001.5441.5541.551.550.69
S1600160021.371001.5451.5521.5511.550.58
* At the end of 1D compression tests. ** The average value calculated by the three Equations (1)–(3) was taken as the chosen value, following Zheng et al. [3].
Table 4. Evolution of the fractal dimension, D, and two key compressibility parameters, Es and mv, lus of compression, Es, during 1D compression.
Test No.Vertical Loading (kPa)DEs (MPa)mv (MPa−1)
K1000→1002.820.402.51
K4000→4002.951.390.72
K8000→8002.982.040.49
K16000→16003.053.470.29
I1000→1002.780.313.23
I4000→4002.881.001.00
I8000→8002.921.670.60
I16000→16002.993.010.33
M1000→1002.750.273.62
M4000→4002.810.841.19
M8000→8002.851.420.70
M16000→16002.902.490.40
S1000→1003.060.482.08
S4000→4003.171.540.65
S8000→8003.252.540.39
S16000→16003.314.020.25
Disclaimer/Publisher’s Note: The statements, opinions and data contained in all publications are solely those of the individual author(s) and contributor(s) and not of MDPI and/or the editor(s). MDPI and/or the editor(s) disclaim responsibility for any injury to people or property resulting from any ideas, methods, instructions or products referred to in the content.

