Article

Modeling the Creep Behavior of Sliding Zone Carbonaceous Shale Subjected to Dry–Wet Cycles Using a Fractional Derivative Approach

1
School of Resource and Environmental Engineering, Wuhan University of Science and Technology, Wuhan 430081, China
2
Hubei Key Laboratory for Efficient Utilization and Agglomeration of Metallurgic Mineral Resources, Wuhan 430081, China
3
College of Construction Engineering, Sanmenxia Polytechnic, Sanmenxia 472000, China
*
Author to whom correspondence should be addressed.
Fractal Fract. 2025, 9(4), 236; https://doi.org/10.3390/fractalfract9040236
Submission received: 6 March 2025 / Revised: 7 April 2025 / Accepted: 8 April 2025 / Published: 9 April 2025
(This article belongs to the Section Engineering)

Abstract

:
The long-term effects of dry–wet cycles induced by seasonal rainfall significantly influence the creep behavior of sliding zone soft rocks, contributing to landslide occurrence. Understanding this aspect is crucial for predicting and mitigating long-term slope instability. This study investigates the Mohuandang landslide, conducting shear creep tests on carbonaceous shale under dry–wet cycles. A quantitative approach was introduced, incorporating a fractional derivative to modify the Burgers model and develop an improved creep equation. Model validity was verified through experimental data. The key findings are as follows: (1) At low deviatoric stress levels (within the viscoelastic stage), creep deformation exhibits a nonlinear increase under dry–wet cycles, leading to a progressive reduction in long-term strength. (2) The modified creep model effectively captures the creep behavior of the sliding zone under the influence of dry–wet cycle-induced damage. (3) The damage evolution characteristics exhibit clear physical significance. These results provide theoretical insights and practical guidance for landslide prediction and risk management in regions subjected to dry–wet cycles induced by seasonal rainfall.

1. Introduction

Landslides induced by seasonal rainfall are a widespread geological hazard [1,2]. These landslides exhibit long-term creep deformation and often occur following a single intense rainfall event, as observed in the Shanshucao landslide [3], Huangtupo landslide [4], etc. Based on this failure pattern, previous studies have generally attributed landslides to intense rainfall, often overlooking a critical factor: the long-term weakening of sliding zones due to seasonal rainfall, which plays a key role in landslide occurrence [5,6,7]. Fluctuations in the water table and the resulting cyclic seepage pressure, induced by seasonal rainfall and commonly referred to as dry–wet cycles, reduce the strength of the sliding zone and accelerate the creep effect, ultimately leading to slope instability and failure [8,9]. It poses a severe threat to life safety, property loss, and infrastructure integrity. Therefore, a comprehensive understanding of the impact of dry–wet cycles on rock creep behavior is crucial, necessitating a model capable of describing and predicting the rock creep process under such conditions.
Numerous scholars have conducted creep experiments to investigate the impact of dry–wet cycles on rock behavior. Lian et al. [10] simulated the effects of dry–wet cycles by subjecting samples to immersion followed by heating. Sun et al. [11] conducted laboratory experiments on rock saturation and drying, revealing that the clay components in rock gradually disintegrate under dry–wet cycles, leading to strength degradation. CWW et al. [12] investigated the changes in the pore structure of rocks with varying water content under dry–wet cycles. The studies by Zhong et al. [13] and Yin et al. [14] indicated that the strain rate in the secondary creep stage increases with dry–wet cycles. Wang et al. [6], Qin et al. [15], and Gong et al. [16] have shown that rocks develop additional viscoplastic strains and failure during the creep acceleration stage when the applied stress exceeds a certain critical value, with dry–wet cycles decreasing the long-term strength of the rock, exacerbating creep deformation and accelerating rock failure.
However, they overlooked the effect of cyclic hydraulic pressure on sliding zones during seasonal rainfall. During the rainy season, frequent rainfall leads to rising water tables and increased hydraulic pressure on slopes. For example, in the Three Gorges Reservoir Area (TGRA), water levels fluctuate between 145 m and 175 m, with a variation of up to 30 m [17]. In fact, the deformation process of landslides is a creep process driven by hydraulic pressure and drying cycles. The effects of dry–wet cycles involve not only the softening of rock due to water infiltration but also hydromechanical interactions induced by cyclic hydraulic pressure [18]. These changes alter the mechanical properties of the rock, such as permeability and stress–strain relationships, thereby affecting the creep characteristics of the sliding zone. Therefore, in-depth research on rock creep behavior under dry–wet cycles is of great practical significance.
The development of creep models aims to capture the mechanical behavior of rocks. Various models have been proposed to describe the creep behavior of rocks [19,20,21], including the Kelvin–Voigt, Burger, and CVISC models, which effectively characterize the full-stage creep behavior of rocks. However, these models fail to capture the nonlinear creep behavior of rocks under external dynamic factors, such as dry–wet cycles. Zhang et al. [22] developed a variable-parameter creep damage model that incorporates a long-term strength degradation factor to describe the nonlinear behavior of rocks under dry–wet cycles. Wang et al. [23] developed a creep damage model based on the extent of microcrack propagation. Li et al. [18] proposed a new nonlinear Burgers model to explain the fluctuating creep behavior induced by dry–wet cycles. Gong et al. [16] developed a model capable of describing saturation-dependent creep behavior under dry–wet cycles. However, these models are constrained by experimental limitations and a large number of model parameters, making them applicable only to specific material behaviors. Fractional derivatives, such as mathematical tools capable of describing nonlocality and long-term memory effects, can better capture the history dependence and multiscale effects of nonlinear creep behavior in materials such as fluids, rocks, thin films, and electronic materials [24,25,26,27,28]. Some researchers have introduced fractional derivatives into creep models to characterize nonlinear creep behavior under damage effects [29,30,31]. Adolfsson et al. [32] proposed a fractional creep damage model based on the concept of internal variables. Li et al. [33] developed a nonlinear creep model by improving the Burger model using fractional derivatives to describe rock damage and creep behavior under dry–wet cycles. Huang et al. [34] proposed a creep model that combines dry–wet cycles with fractional derivatives to explain the time-dependent deformation and nonlinear characteristics of the entire failure process in rocks. These fractional derivative creep models often effectively describe rock behavior; however, the physical significance of damage variables in these models is unclear, making it difficult to interpret the damage mechanisms and creep characteristics of rocks under dry–wet cycle conditions. There is a significant coupling between rock failure and creep behavior [35,36,37]. Therefore, this study aims to explore the evolution and intrinsic relationships between dry–wet cycle-induced damage and rock mechanical failure mechanisms using fractional derivative methods.
In response to these issues, this study involved conducting multi-stage shear creep experiments on sliding zones under dry–wet cycles, analyzing the nonlinear creep behavior of rocks, and proposing an improved creep model incorporating quantitative dry–wet cycle-induced damage, a damage evolution equation, and the fractional derivative model. Subsequently, the model was validated by comparing theoretical and experimental results.

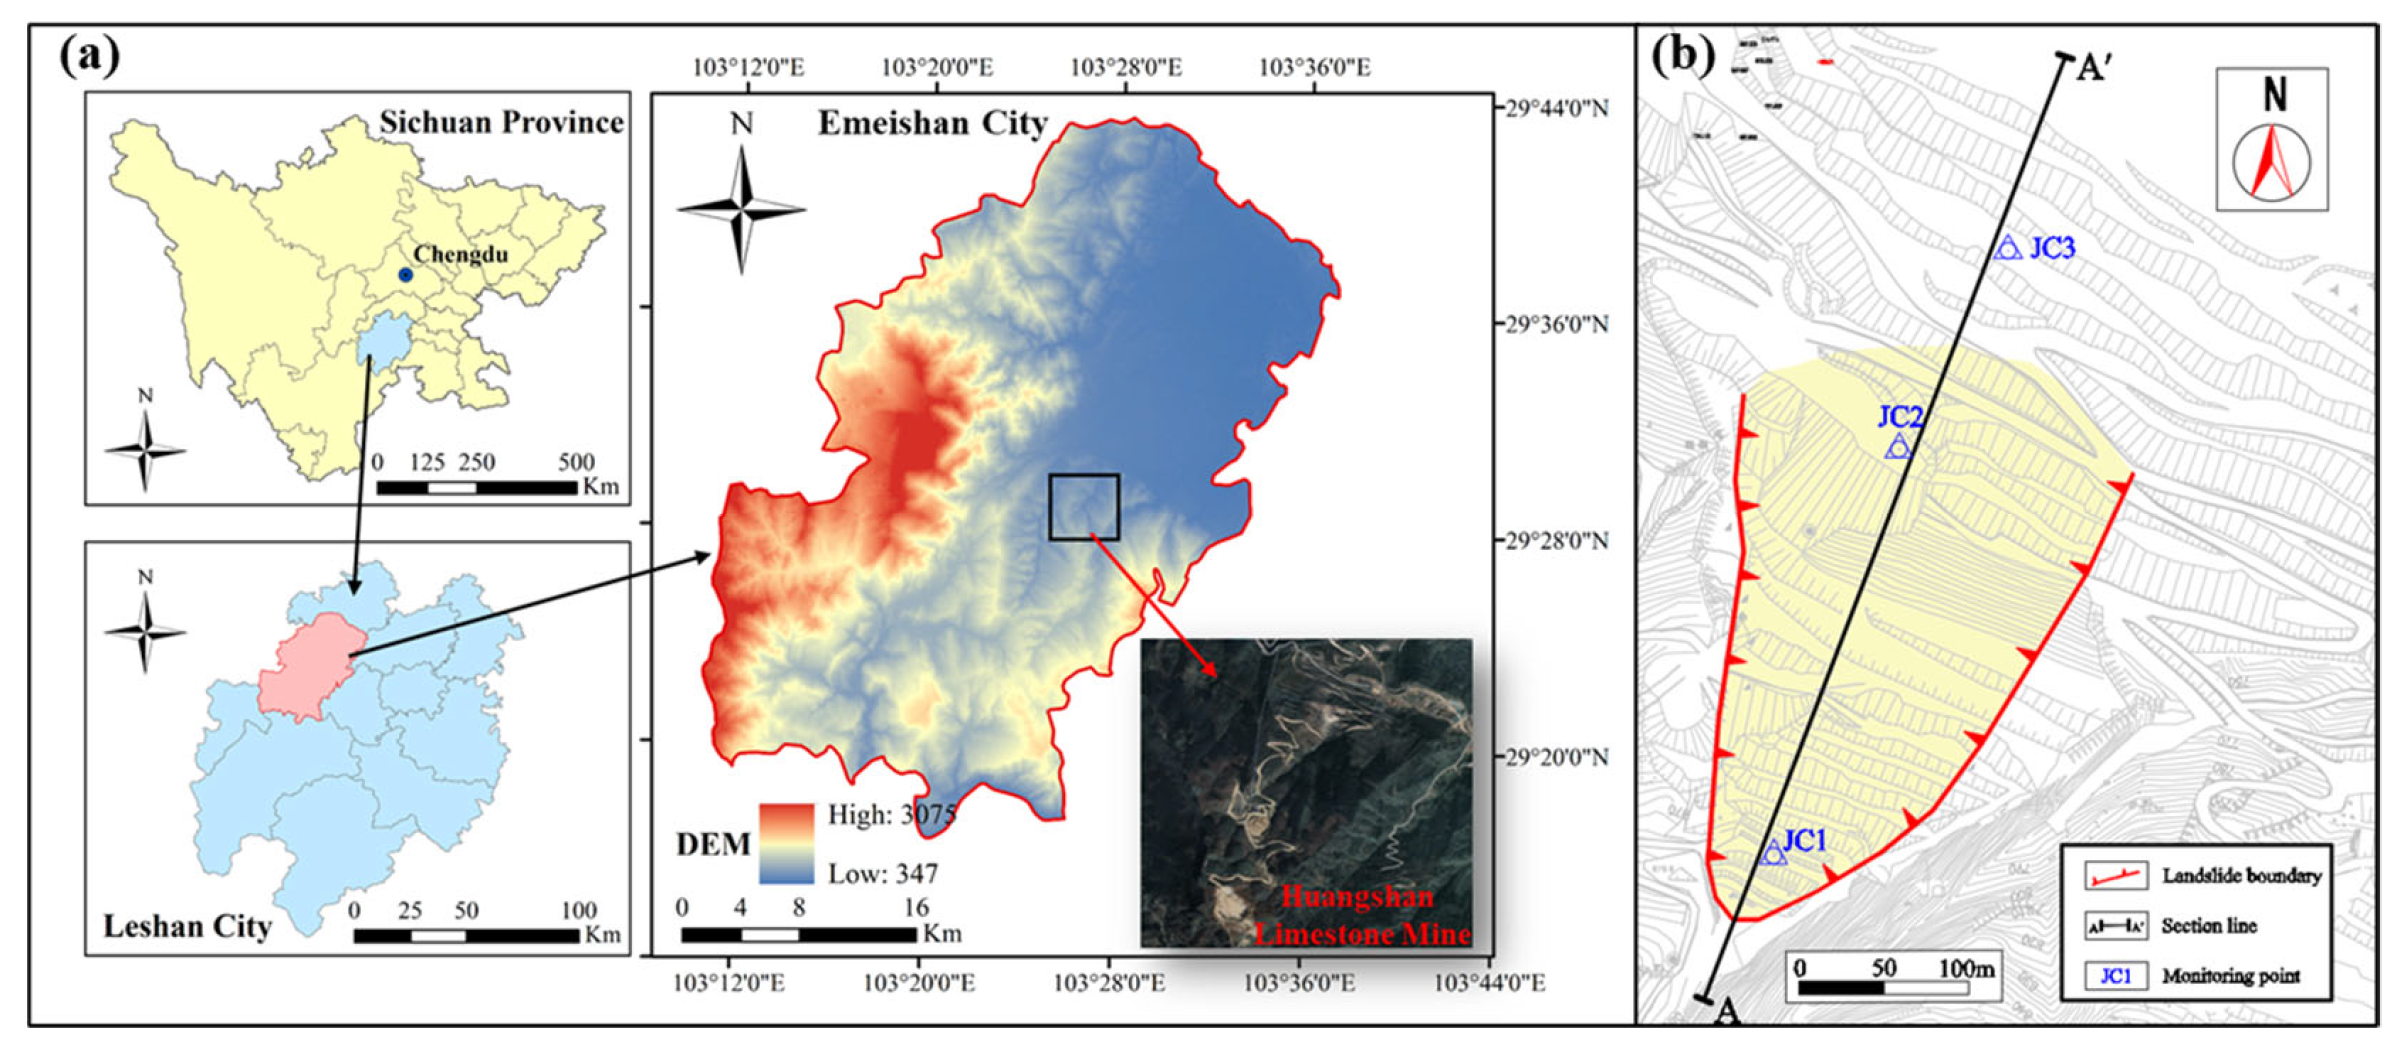
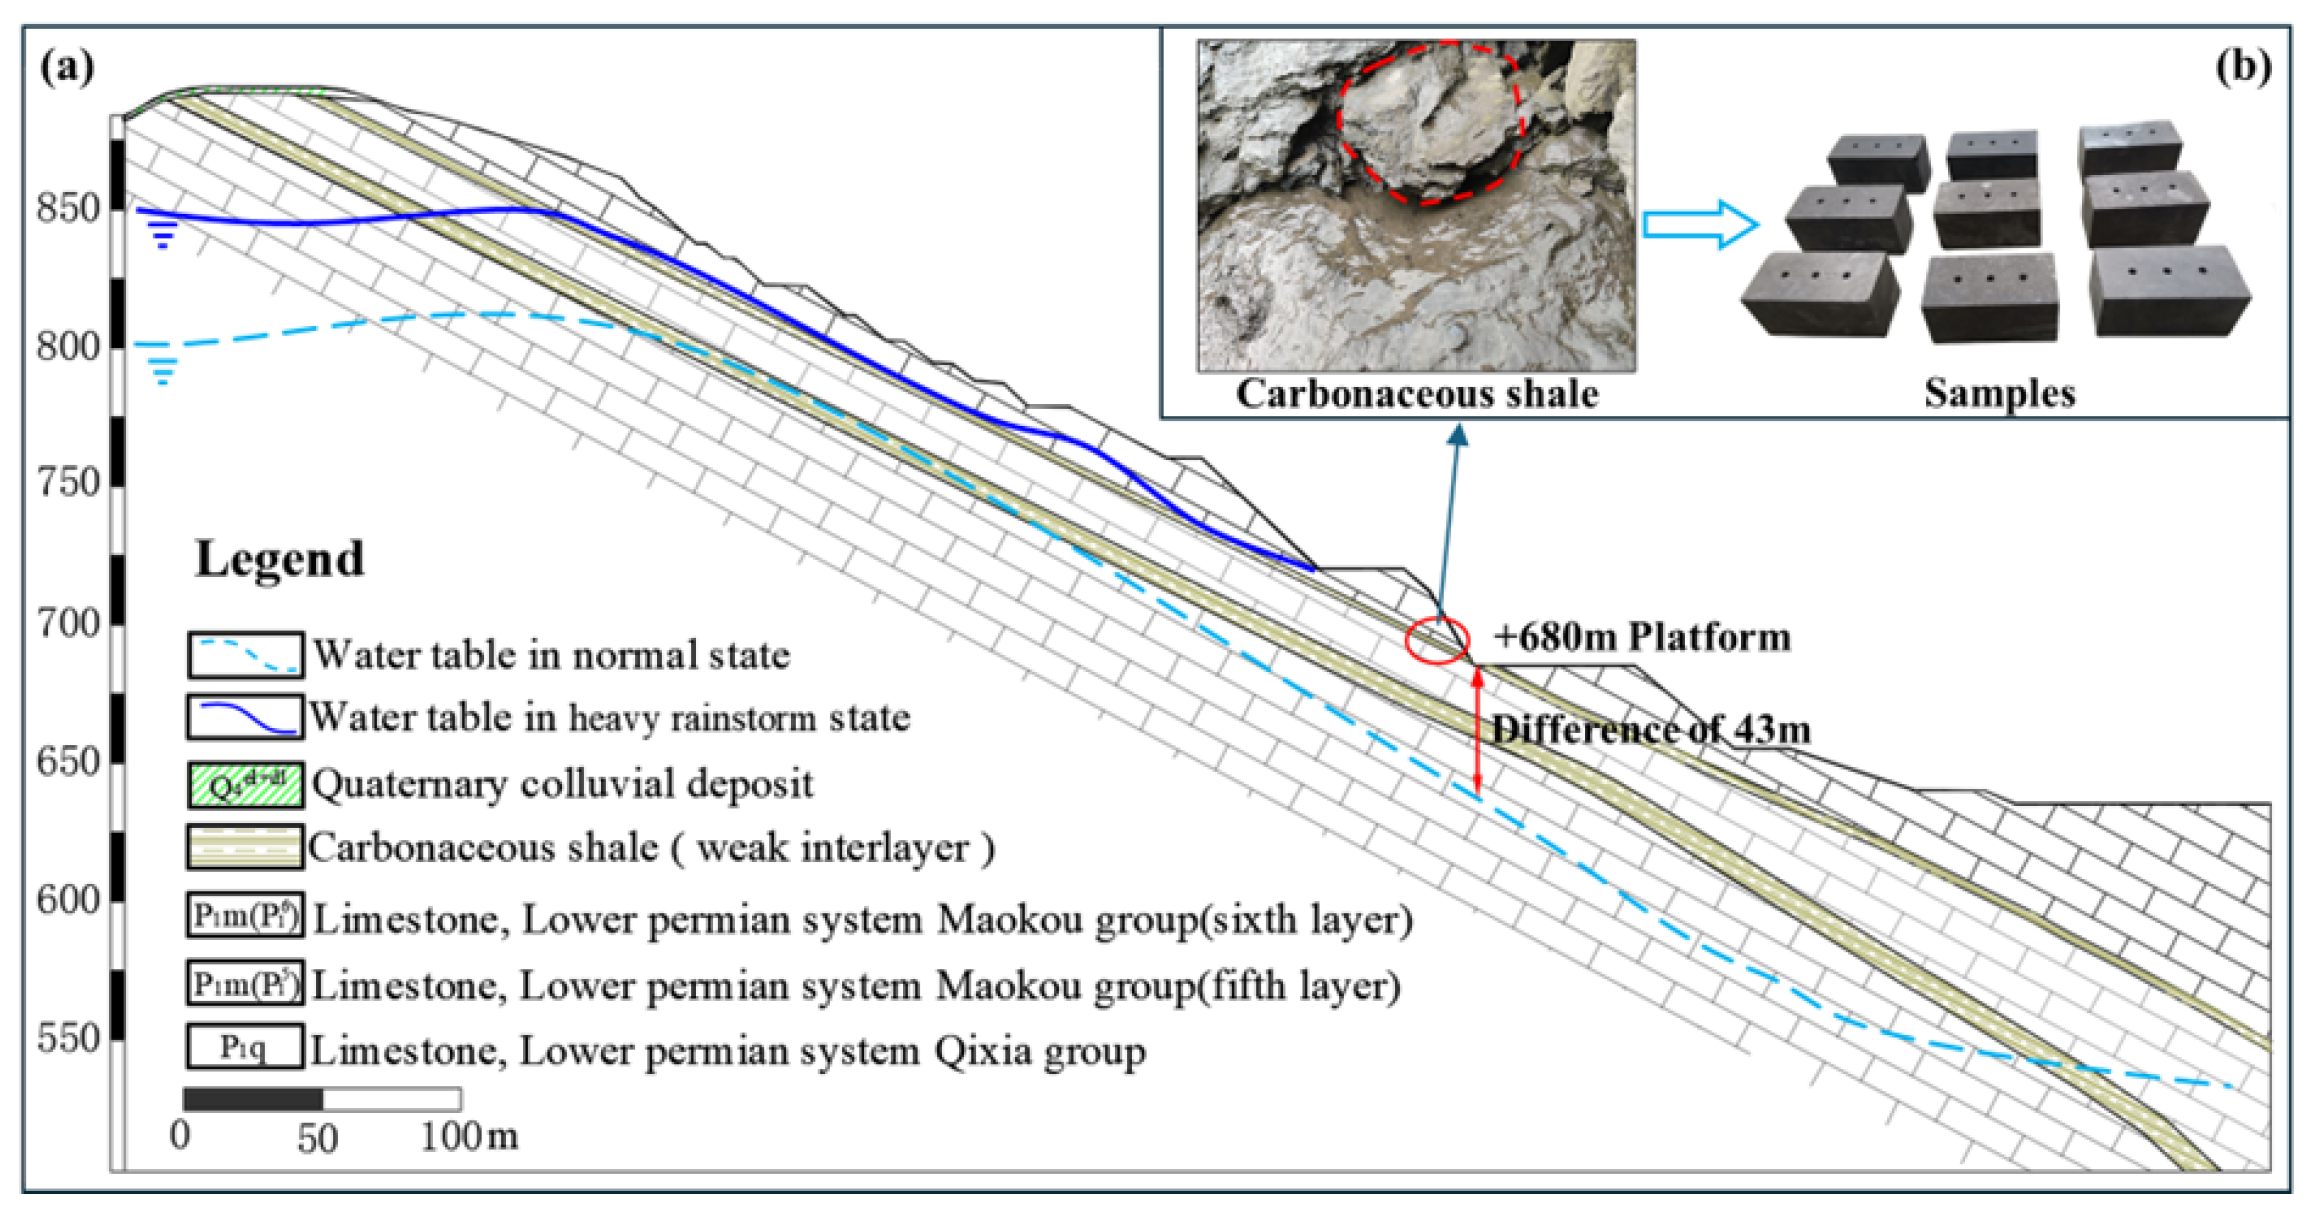
2. Experimental Study on Sliding Zone Rock Creep Behavior Under Dry–Wet Cycles

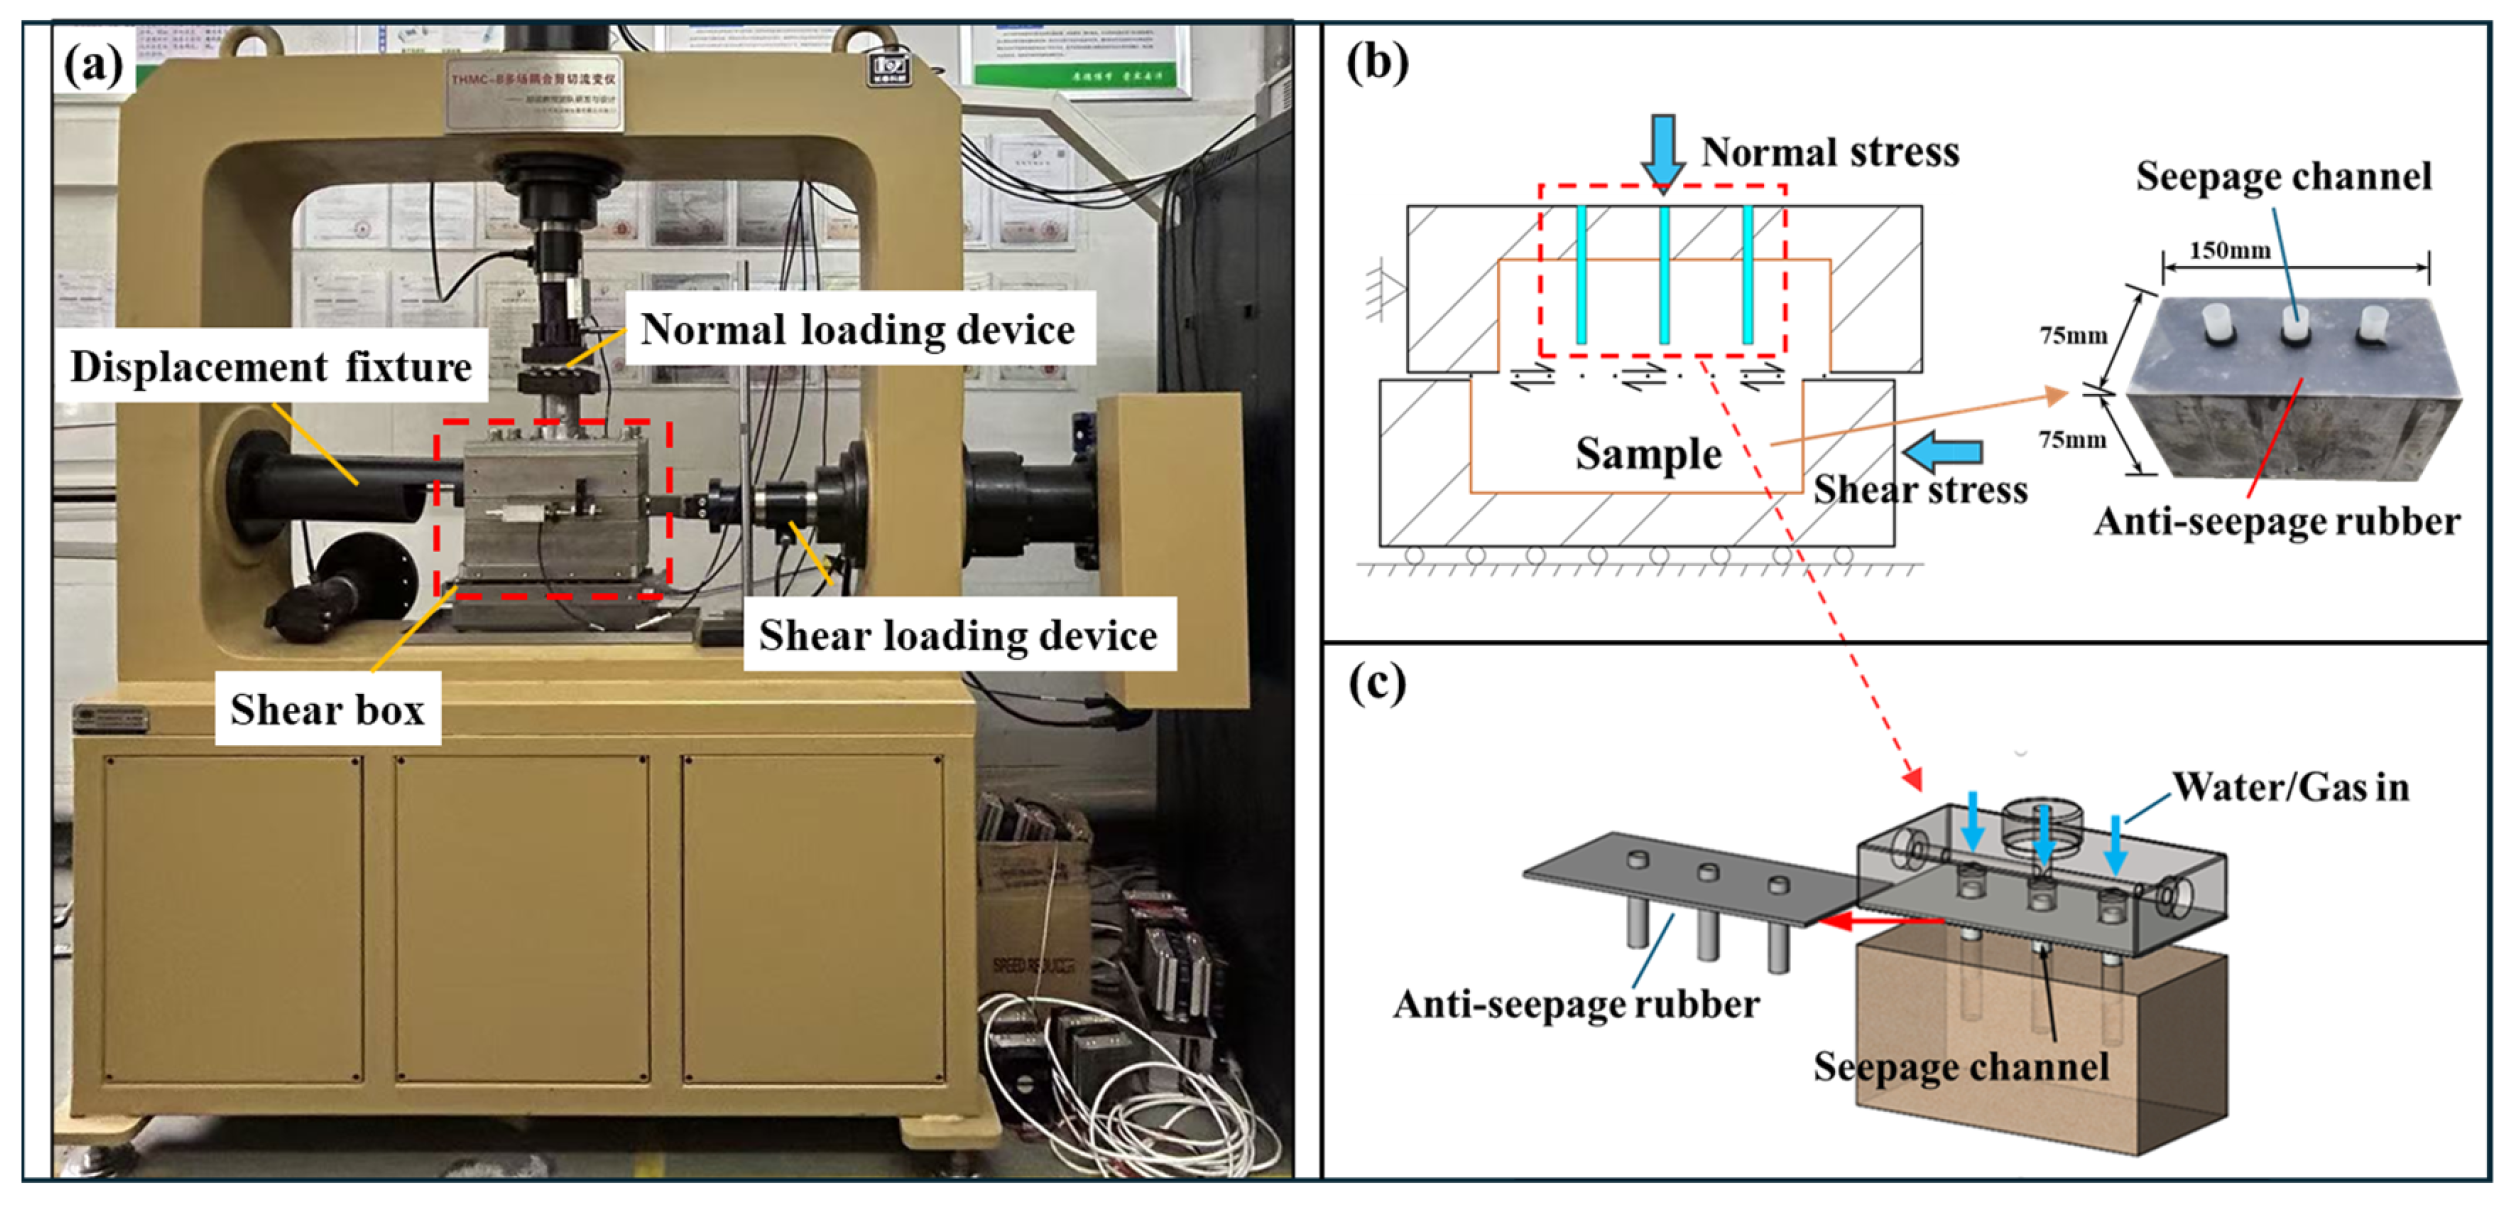
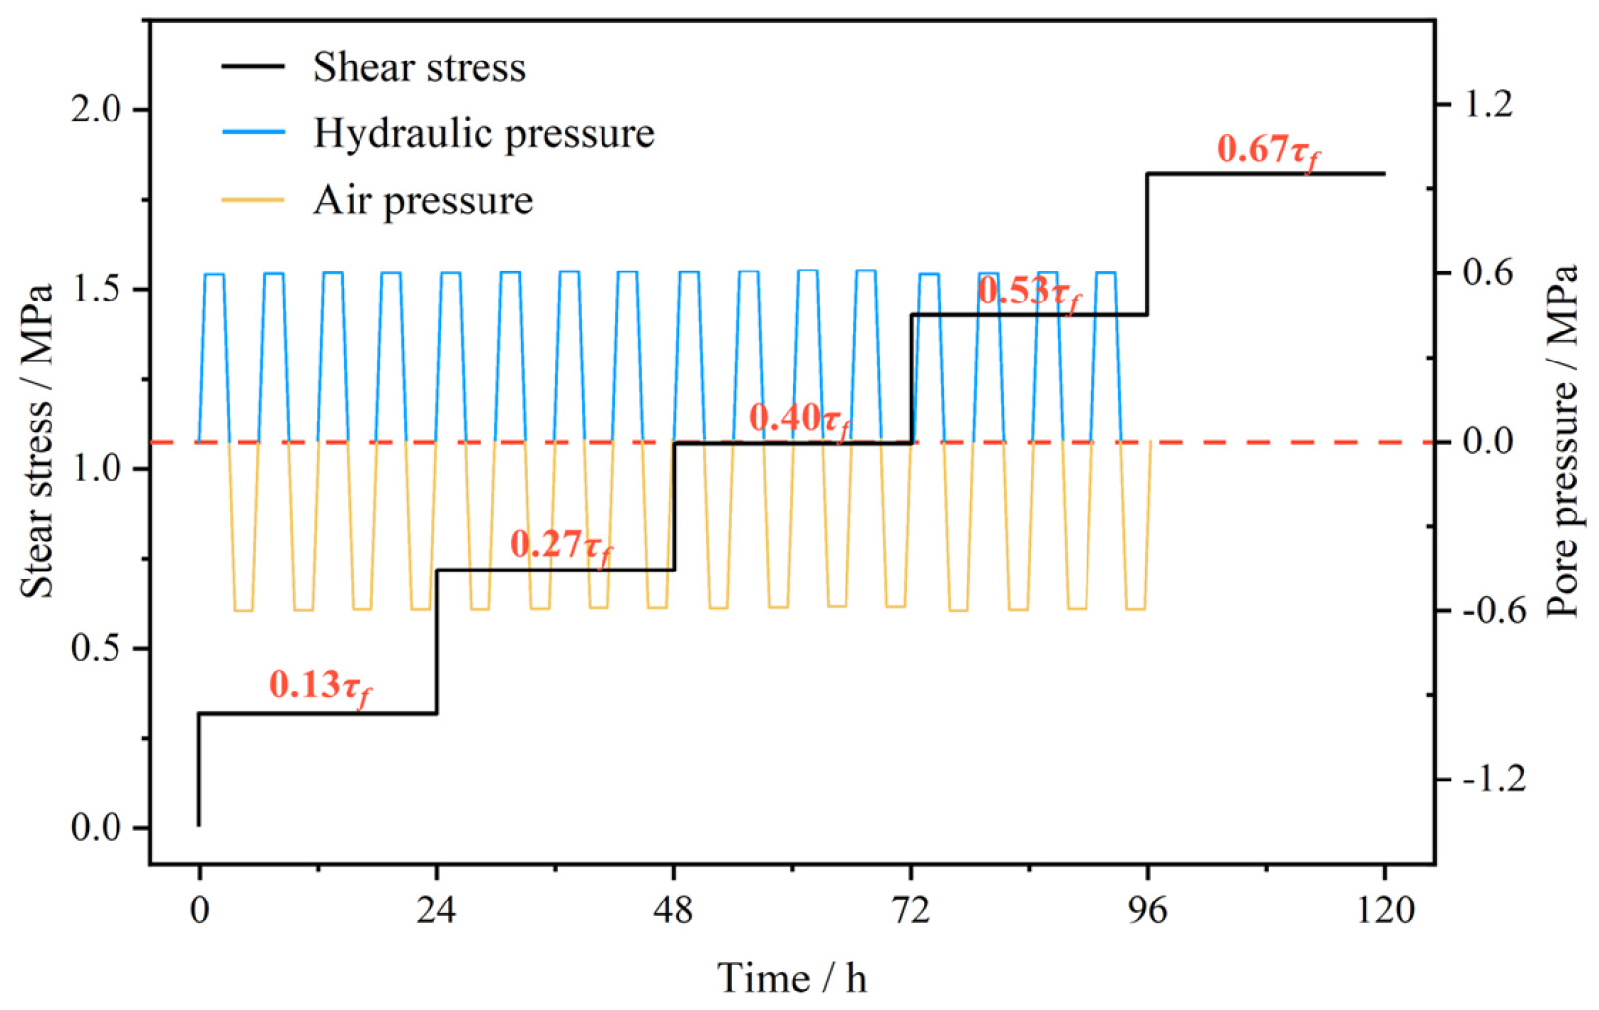
2.1. Experimental Tests

The Mohuandang landslide is located in the Huangshan Limestone Mine, Emeishan City, Leshan, Sichuan Province, China, as shown in Figure 1. It is situated in the transition zone from low mountains to middle–low mountains on the edge of the Sichuan Basin, with a general topographic trend sloping from southwest to northeast. On 22 August 2018, the Mohuandang landslide experienced a catastrophic failure, sliding entirely from the +680 m platform. This event was triggered by two heavy rainstorms occurring within a one-month period, resulting in a landslide volume of approximately 310,000 m3. After the heavy rainstorms, the water table fluctuated by 43 m at the +680 m platform, as shown in Figure 2a. Additionally, the Mohuandang landslide primarily consists of interbedded limestone from the Permian Maokou Formation ( P 1 6 ), which contains weak interlayers. The sliding zone is primarily composed of the first-layer weak interlayer, consisting of dark gray and gray-brown thin-bedded carbonaceous shale, as shown in Figure 2b. This study focuses on the sliding zone (carbonaceous shale) in the Mohuandang landslide to investigate the effects of dry–wet cycles on creep behavior. The sliding zone carbonaceous shale used in this experiment consisted of 38% calcite, 35% quartz, and 10% clay minerals. According to the Standard for Geotechnical Testing Methods (GB/T 50123-2019) [38], rock samples collected from the landslide site were cut and polished to produce specimens with dimensions of 75 mm × 75 mm × 150 mm. Three evenly spaced cylindrical holes (8 mm in diameter and 37.5 mm in depth) were drilled into the top of each sample, reaching the shear plane, to serve as reserved channels for applying dry–wet cycle conditions. The density and moisture content of the samples were controlled to match the original rock conditions, with a prepared density of 1.80 g/cm3 and a moisture content of 12.13%.
The experiment was conducted using a self-developed soft rock shear creep test system that simulates rainfall infiltration, as shown in Figure 3. The experimental apparatus consists of six independent modules: a normal pressure device, a shear pressure device, a displacement fixture, a seepage loading device, a data acquisition system, and a shear test box. The combination of the seepage loading device with the shear box allows seepage to be applied during stress loading, as illustrated in Figure 3b,c. Therefore, during the creep tests, water/gas pressure is cyclically applied through prefabricated seepage channels to simulate dry–wet cycles.
The stress conditions and hydraulic pressure are determined based on the stress conditions within the landslide’s sliding zone. In this study, the average burial depth of the sliding zone (carbonaceous shale) in boreholes is 25 m. The normal pressure for the experiment is set at 0.6 MPa, considering the in situ geological conditions of the rocks. The water table in the slope rises to approximately 40 to 60 m during heavy rainstorms, and the cyclic seepage pressure amplitude in this experiment is set to 0.6 MPa. Based on prior direct shear tests, the shear strength of carbonaceous shale at a normal stress of 0.6 MPa was determined to be 2.65 MPa. The shear stress loading plan was divided into six levels, with the maximum shear stress load set at 80% of the shear strength value from the direct shear test under the same normal stress, as shown in Table 1. To avoid long-term strength reduction due to the damage from dry–wet cycles, shear failure occurred at the fifth level of shear stress, with dry–wet cycles applied evenly across the first four levels of graded shear loads. To investigate the creep properties of samples under dry–wet cycle conditions, various numbers of dry–wet cycles (Δn = 0, 1, 2, 3, 4) were applied evenly across the first four levels, as illustrated in Figure 4.

2.2. Analysis of Experimental Results
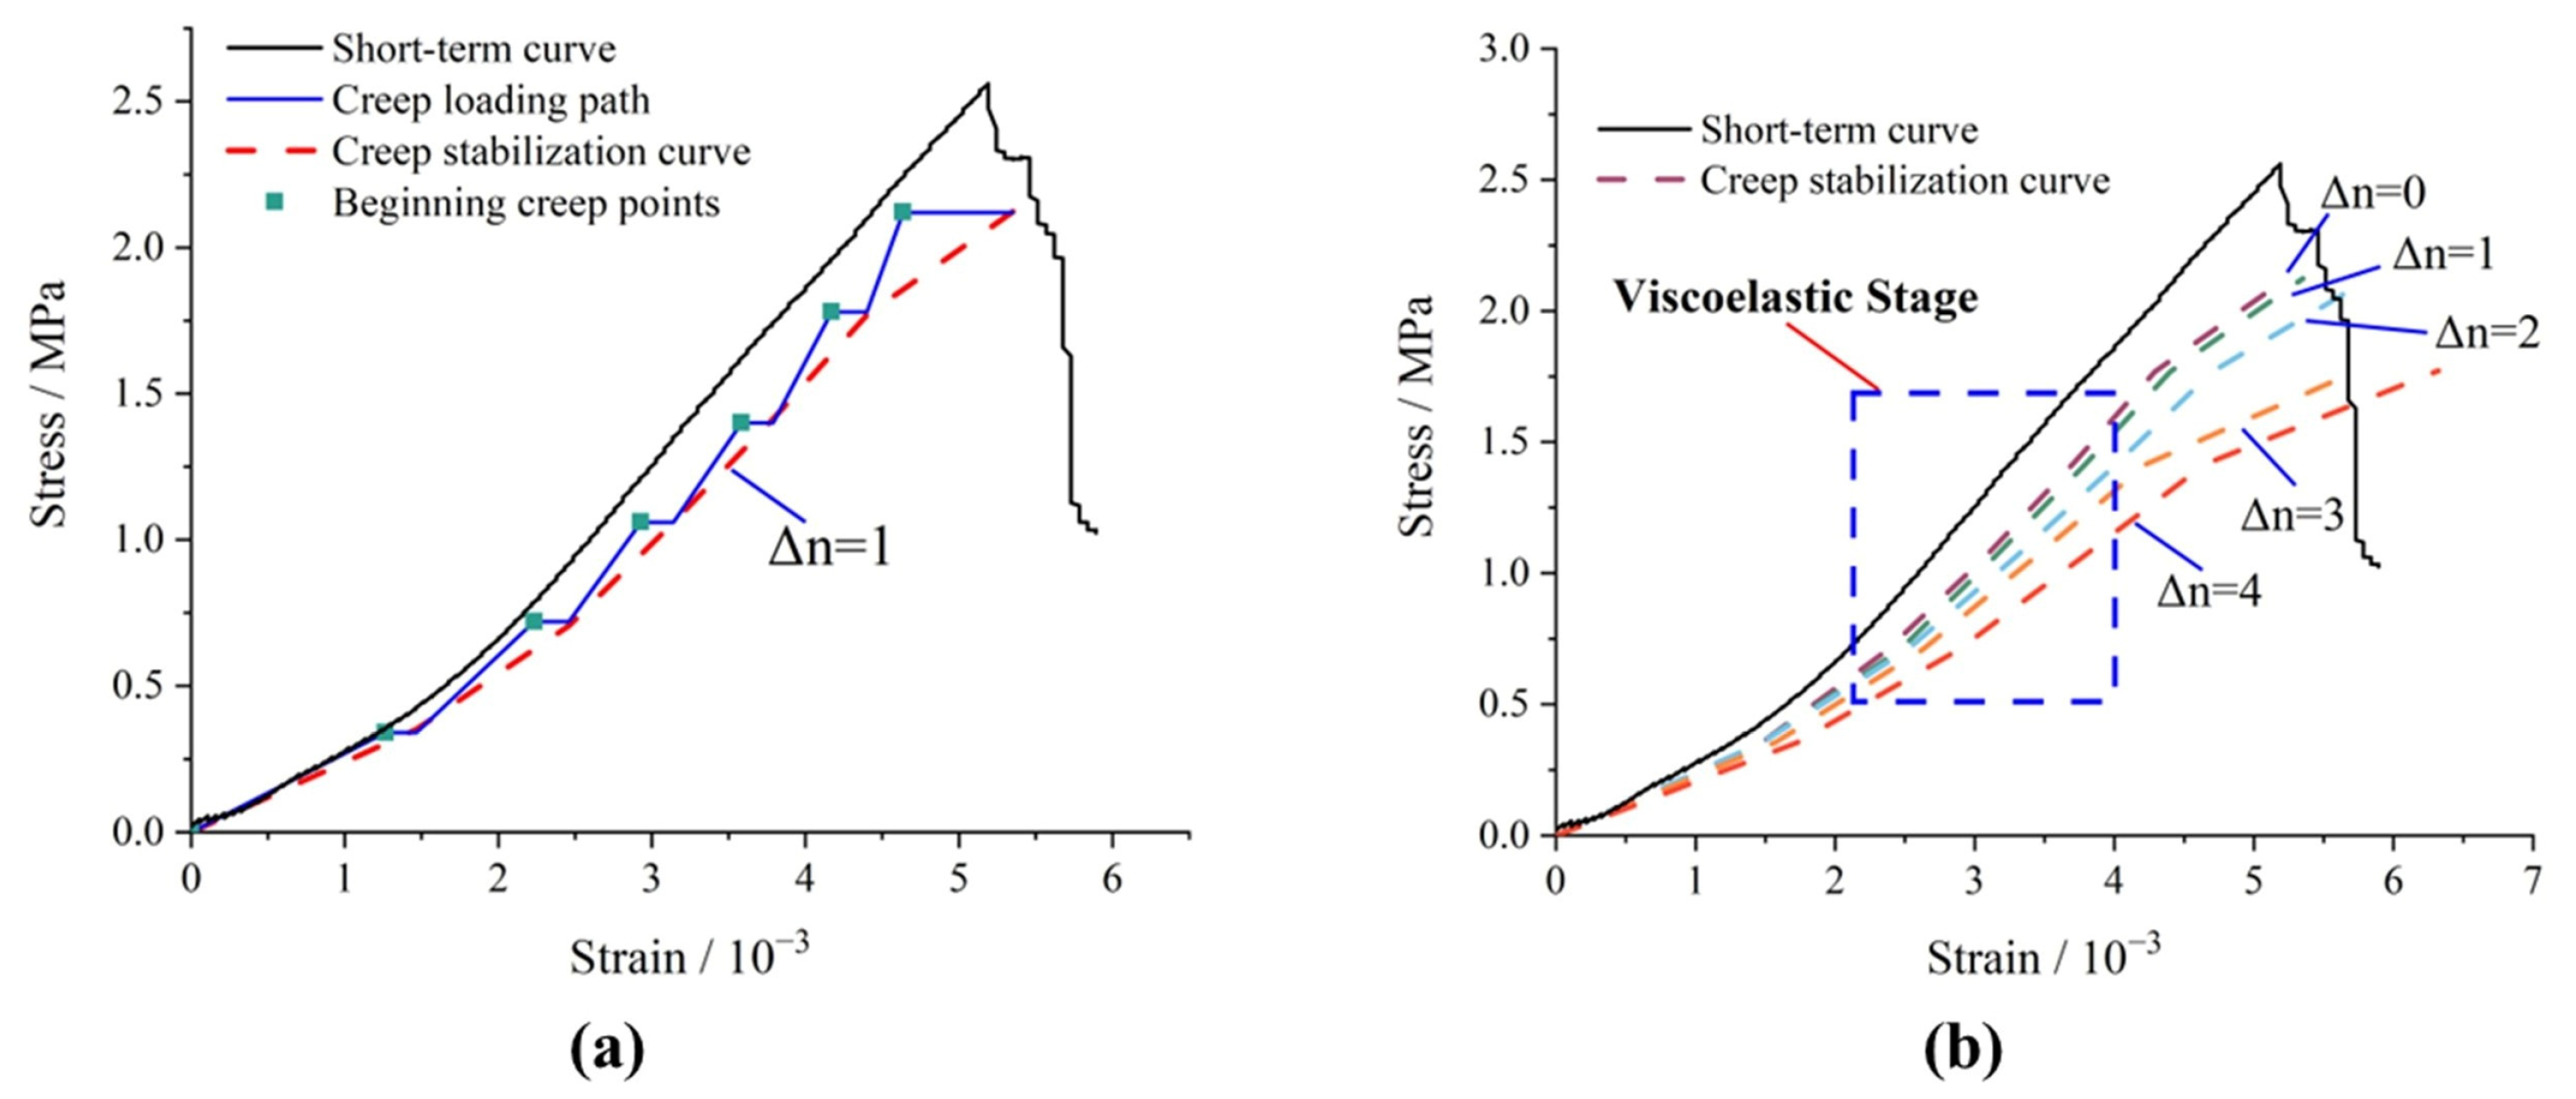
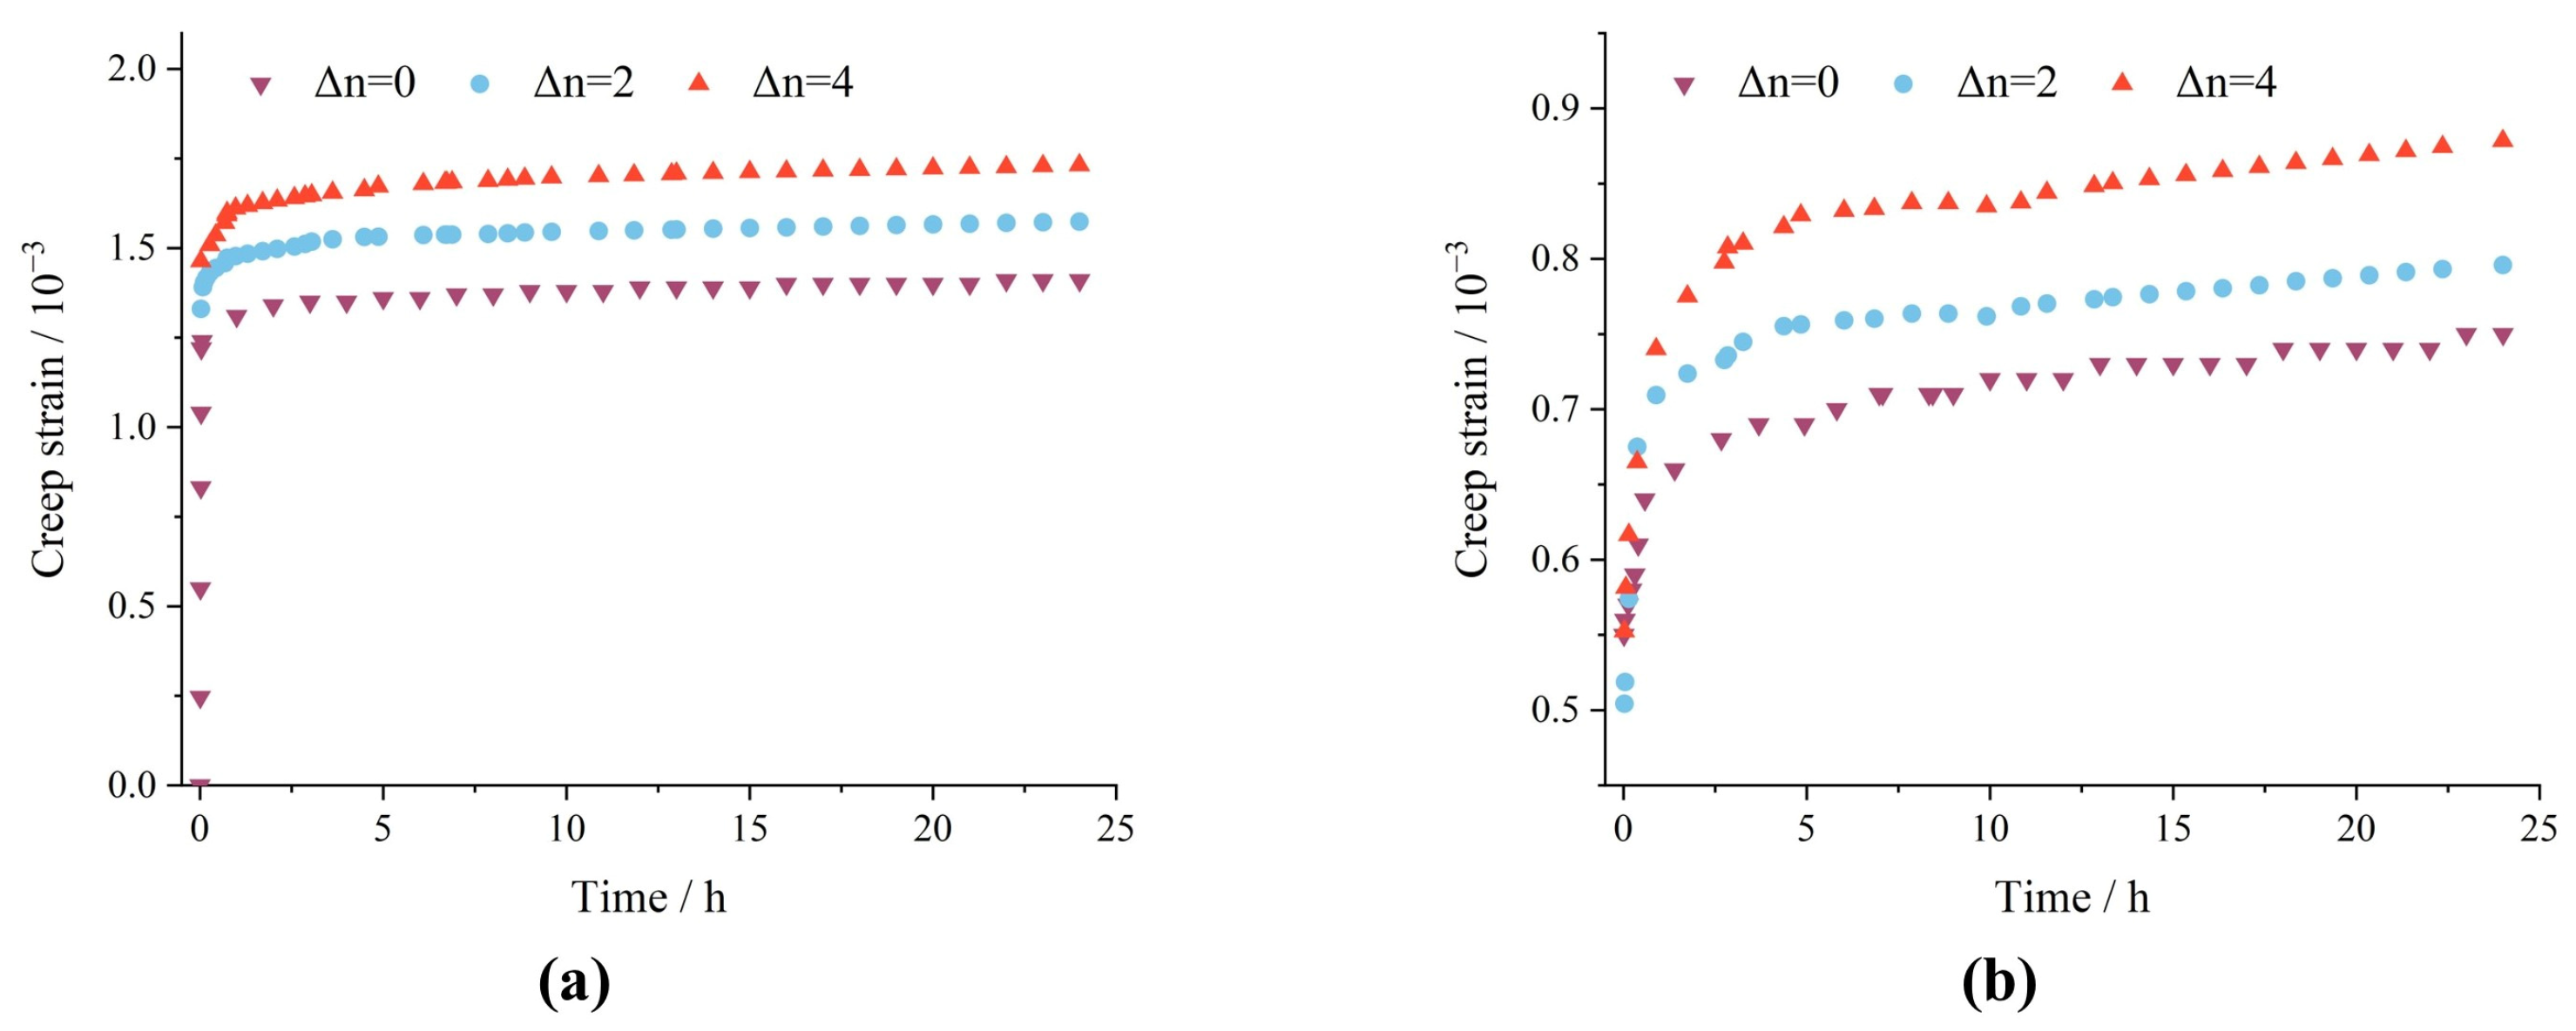
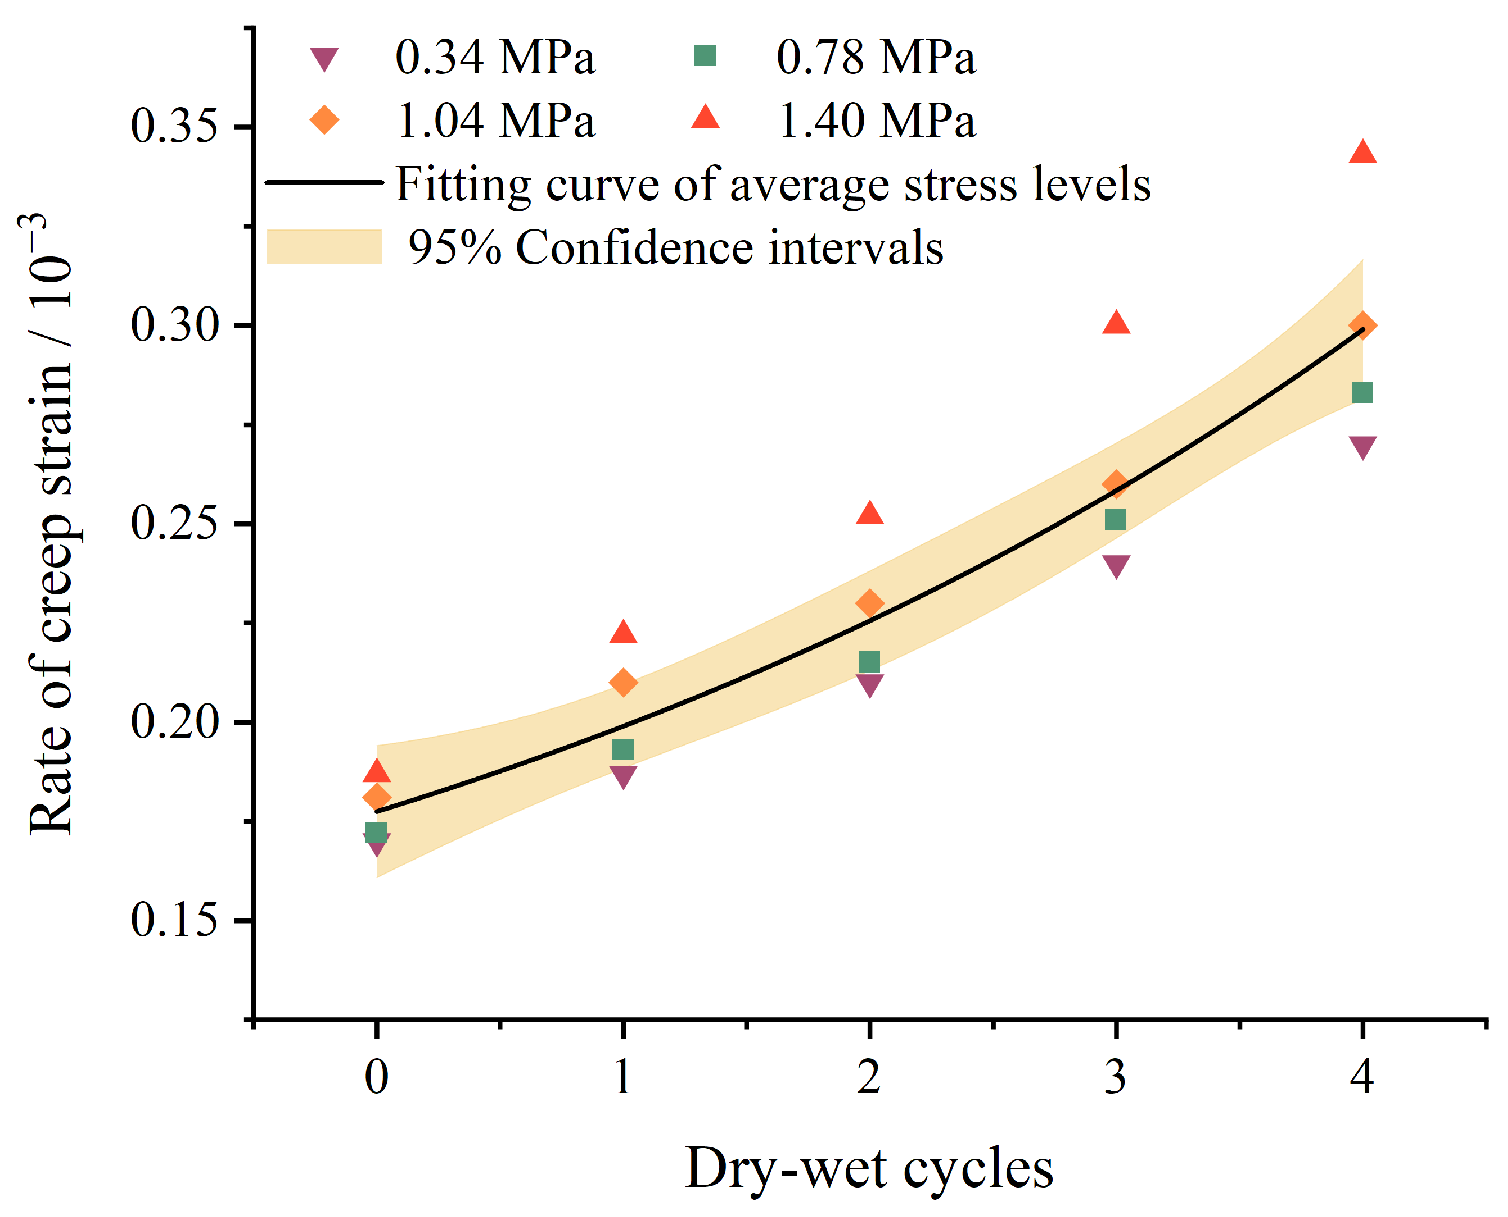
2.2.1. Creep Strain

Figure 5 illustrates the variation in strain over time for samples under different dry–wet cycle conditions in shear creep tests. The results show that strain increases with time at various stress levels. At a stress level of 2.12 MPa (0.80 τf), the samples exhibit significant increases in strain and eventual failure in their natural state (without dry–wet cycles, Δn = 0). Additionally, at the failure stress level of 2.12 MPa, with dry–wet cycles of Δn = 1 and 2, strain increases more rapidly, leading to quicker failure. However, at Δn = 3 and 4, the samples fail prematurely at a stress level of 1.78 MPa. This indicates that dry–wet cycles significantly affect the creep behavior of the samples.
To further investigate the effects of dry–wet cycles on the creep properties of carbonaceous shale, the stress–strain relationship of the samples can be derived from the creep stabilization curve. Using the creep loading path and creep strain [39], the creep stabilization curve can be obtained, as shown in Figure 6a. The stress–strain relationships of samples under different dry–wet cycle conditions are shown in Figure 6b. It can be clearly observed that under the same stress conditions, strain increased with the increment of Δn. Additionally, during the viscoelastic stage of the samples (i.e., at the first four stress levels set in the experiment), strain increased even without an increase in stress. This suggests that dry–wet cycles may influence the creep properties of the samples during the viscoelastic stage.
Figure 7 displays how the creep strain changes over time under 0.34 and 1.4 MPa stress levels (in the viscoelastic stage) with different dry–wet cycles. It can be observed that at a stress level of 0.34 MPa, the increase in the creep strain is relatively uniform with the increase in dry–wet cycles. However, at 1.4 MPa, the increase in creep strain becomes significantly more pronounced with additional dry–wet cycles. This is likely due to the increased damage that occurs with the accumulation of dry–wet cycles at n = 0, 8, 16. Figure 8 illustrates the variation in creep strain with dry–wet cycles under different stress levels during the viscoelastic stage. At all stress levels, the increase in creep strain exhibits an exponential growth trend with the number of dry–wet cycles. Moreover, at higher stress levels, the increase in creep strain is more pronounced. Specifically, as the stress level rises from 0.34 MPa to 1.4 MPa, the creep strain increases by 58.8%, 64.5%, 65.8%, and 83.4% with dry–wet cycles. Additionally, at the same level of dry–wet cycles, higher stress levels result in a more significant increase in the creep strain. Specifically, the increase in creep strain ranges from 10% at Δn = 0 to 27% at Δn = 4 as the stress level increases from 0.34 MPa to 1.4 MPa. This indicates that both the degree of dry–wet cycles and the stress level significantly influence the creep behavior of the samples. Furthermore, it demonstrates that as the stress level and cumulative wet–dry cycles increase, damage effects occur in carbonaceous shale even during the viscoelastic stage. This contradicts the widely accepted notion that rock damage and failure occur only in the viscoplastic stage, not during the viscoelastic stage. Therefore, further investigation is needed to understand the dry–wet cycle-induced damage on the creep behavior of carbonaceous shale.

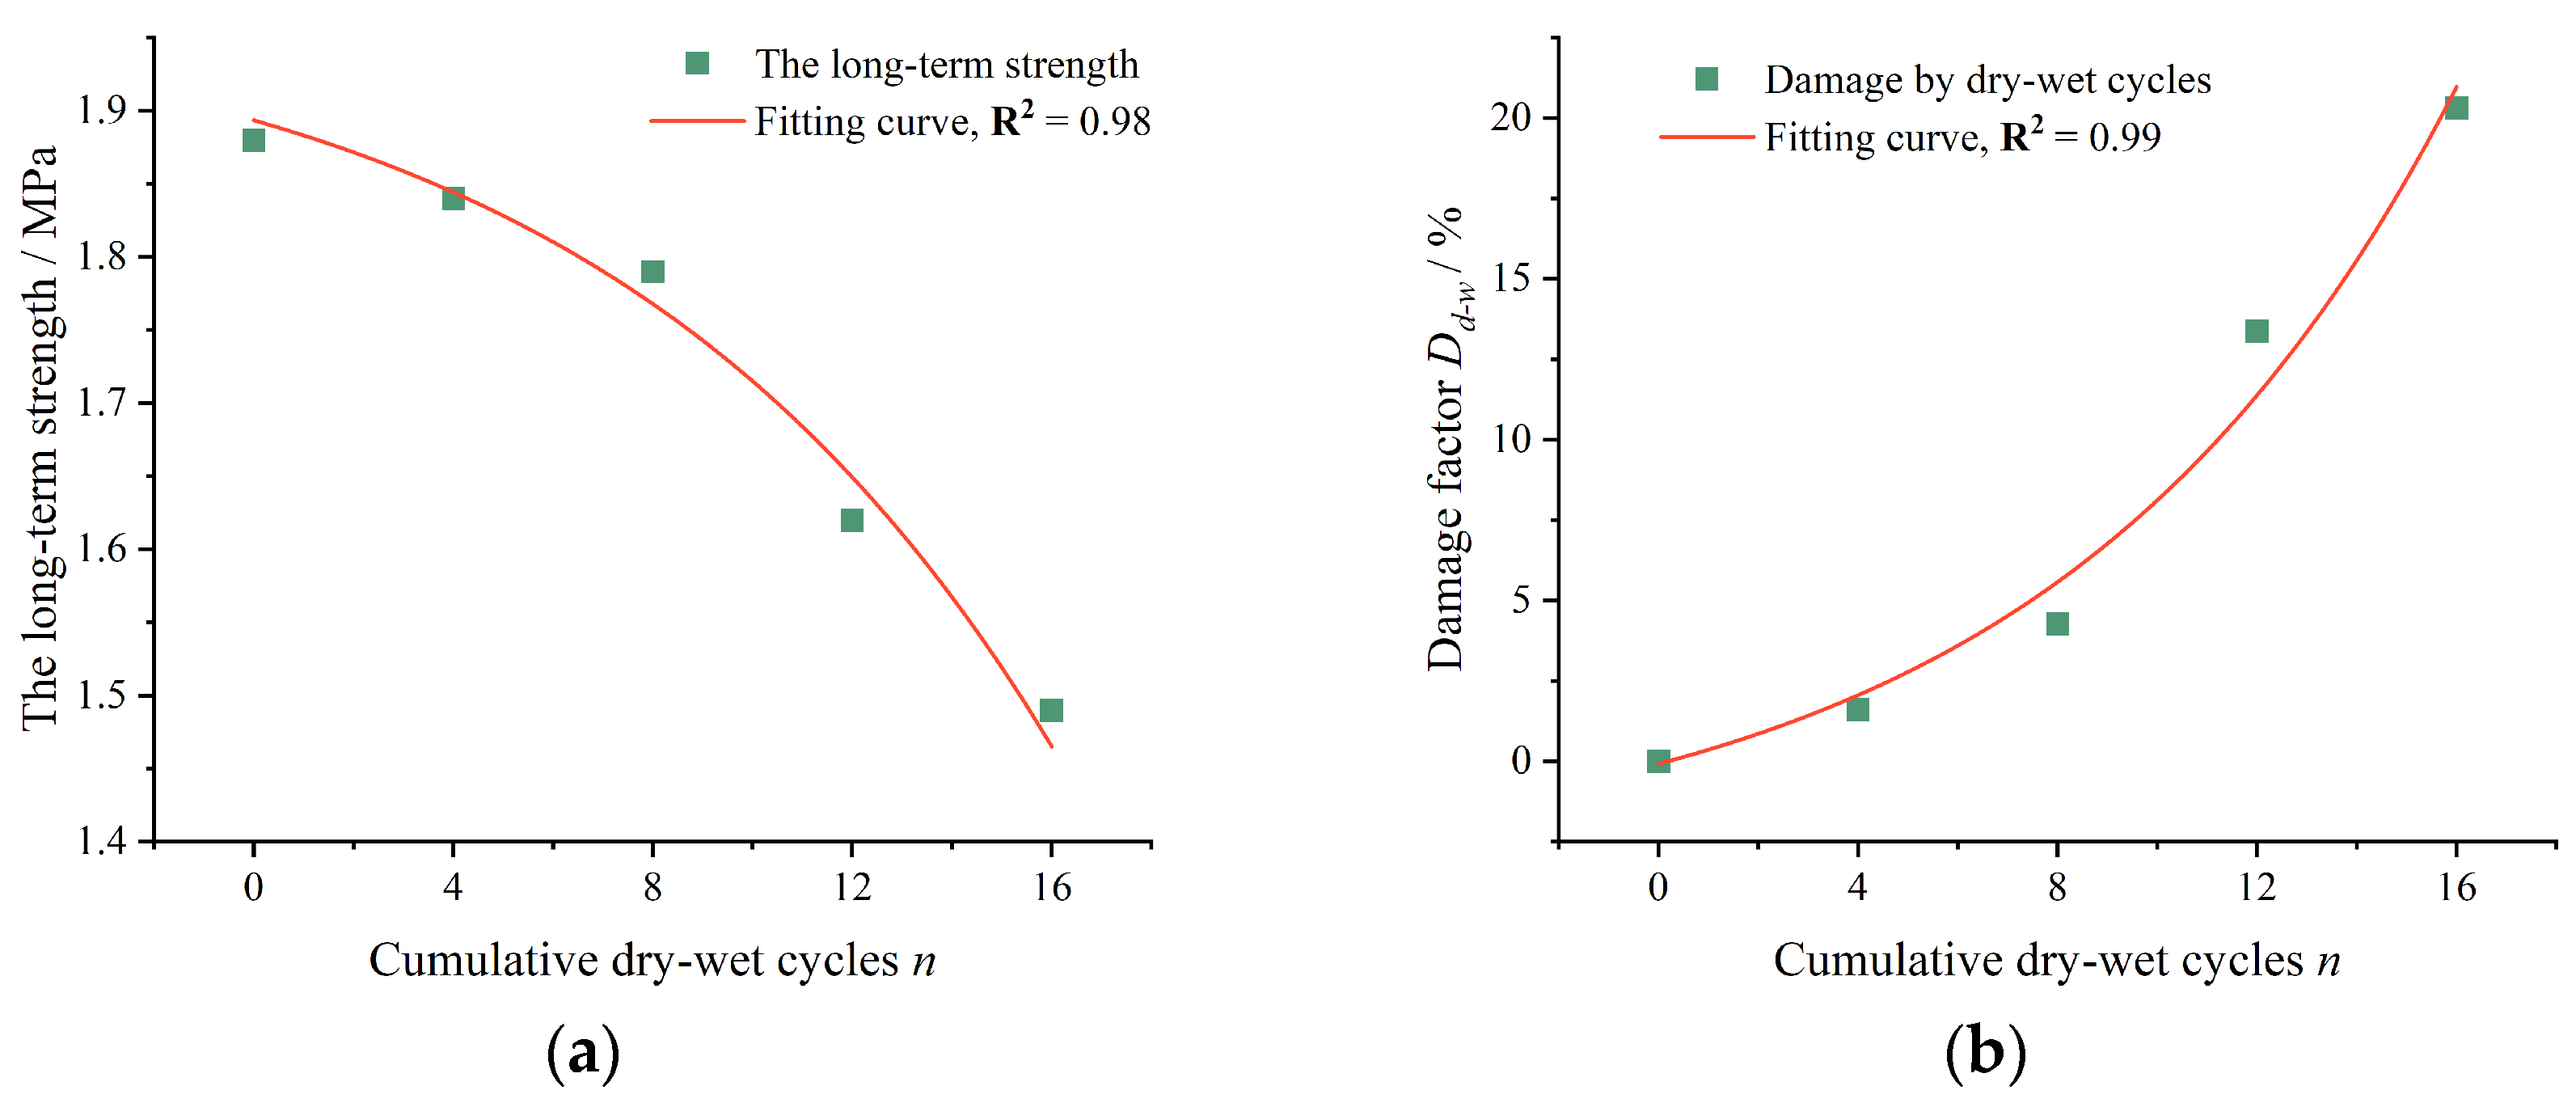
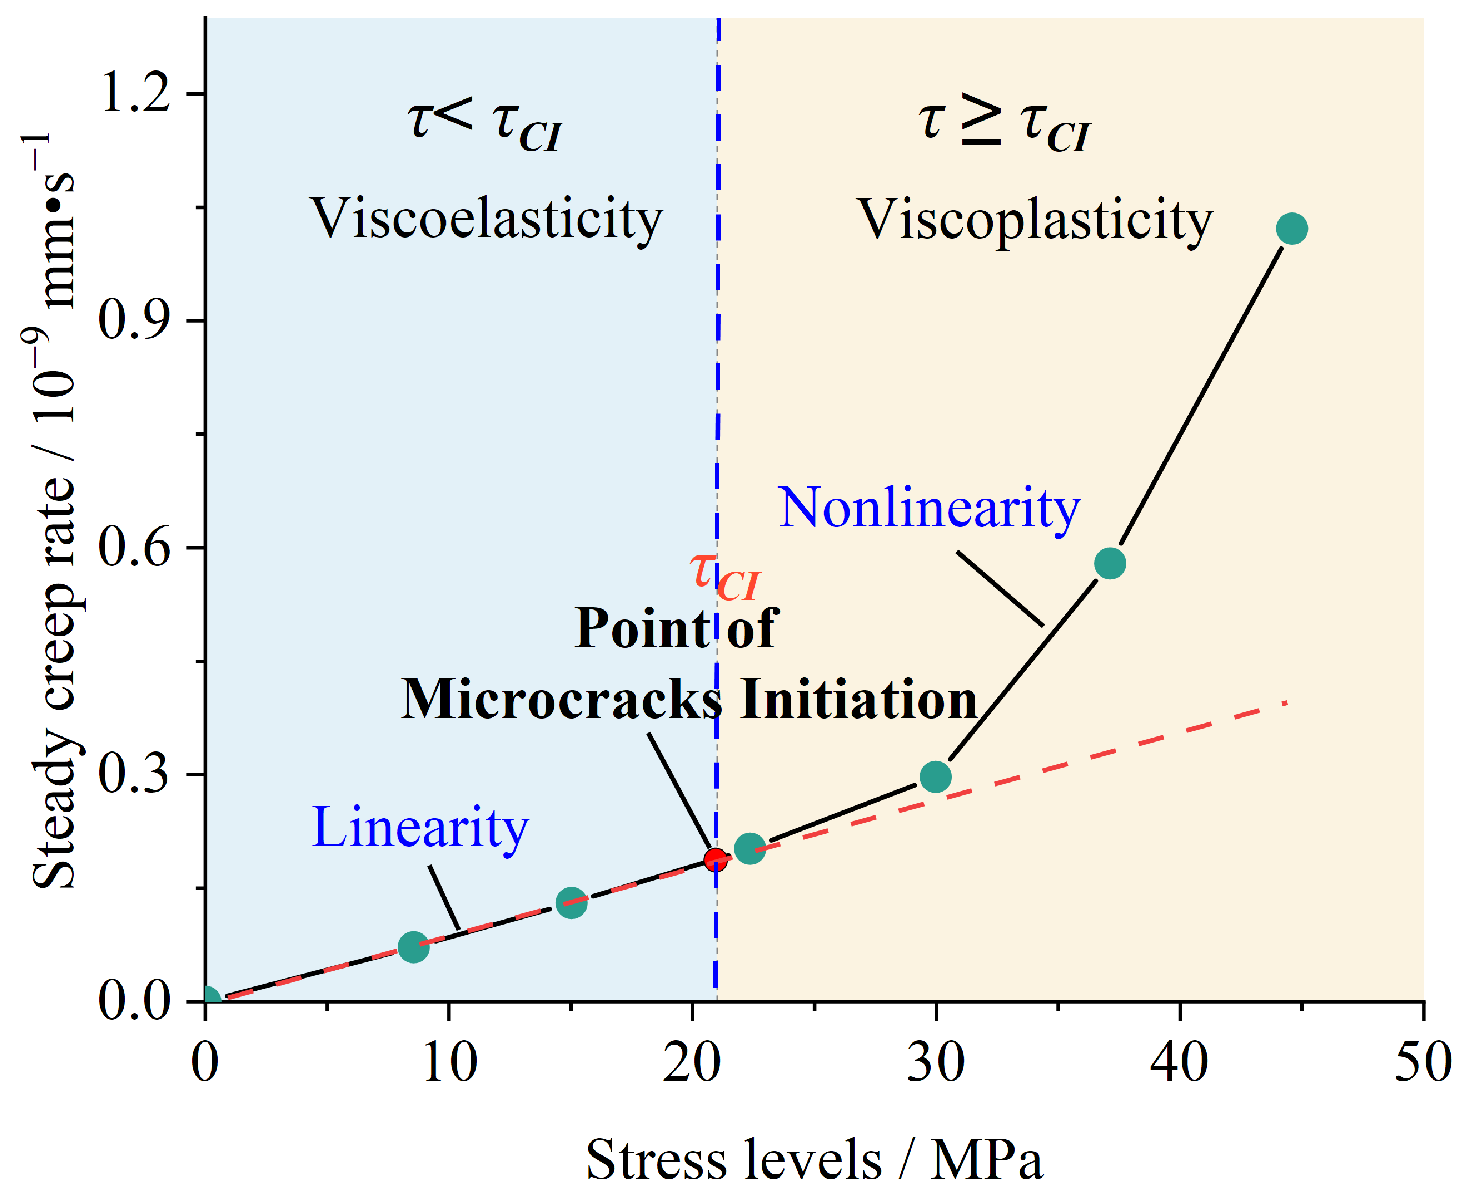
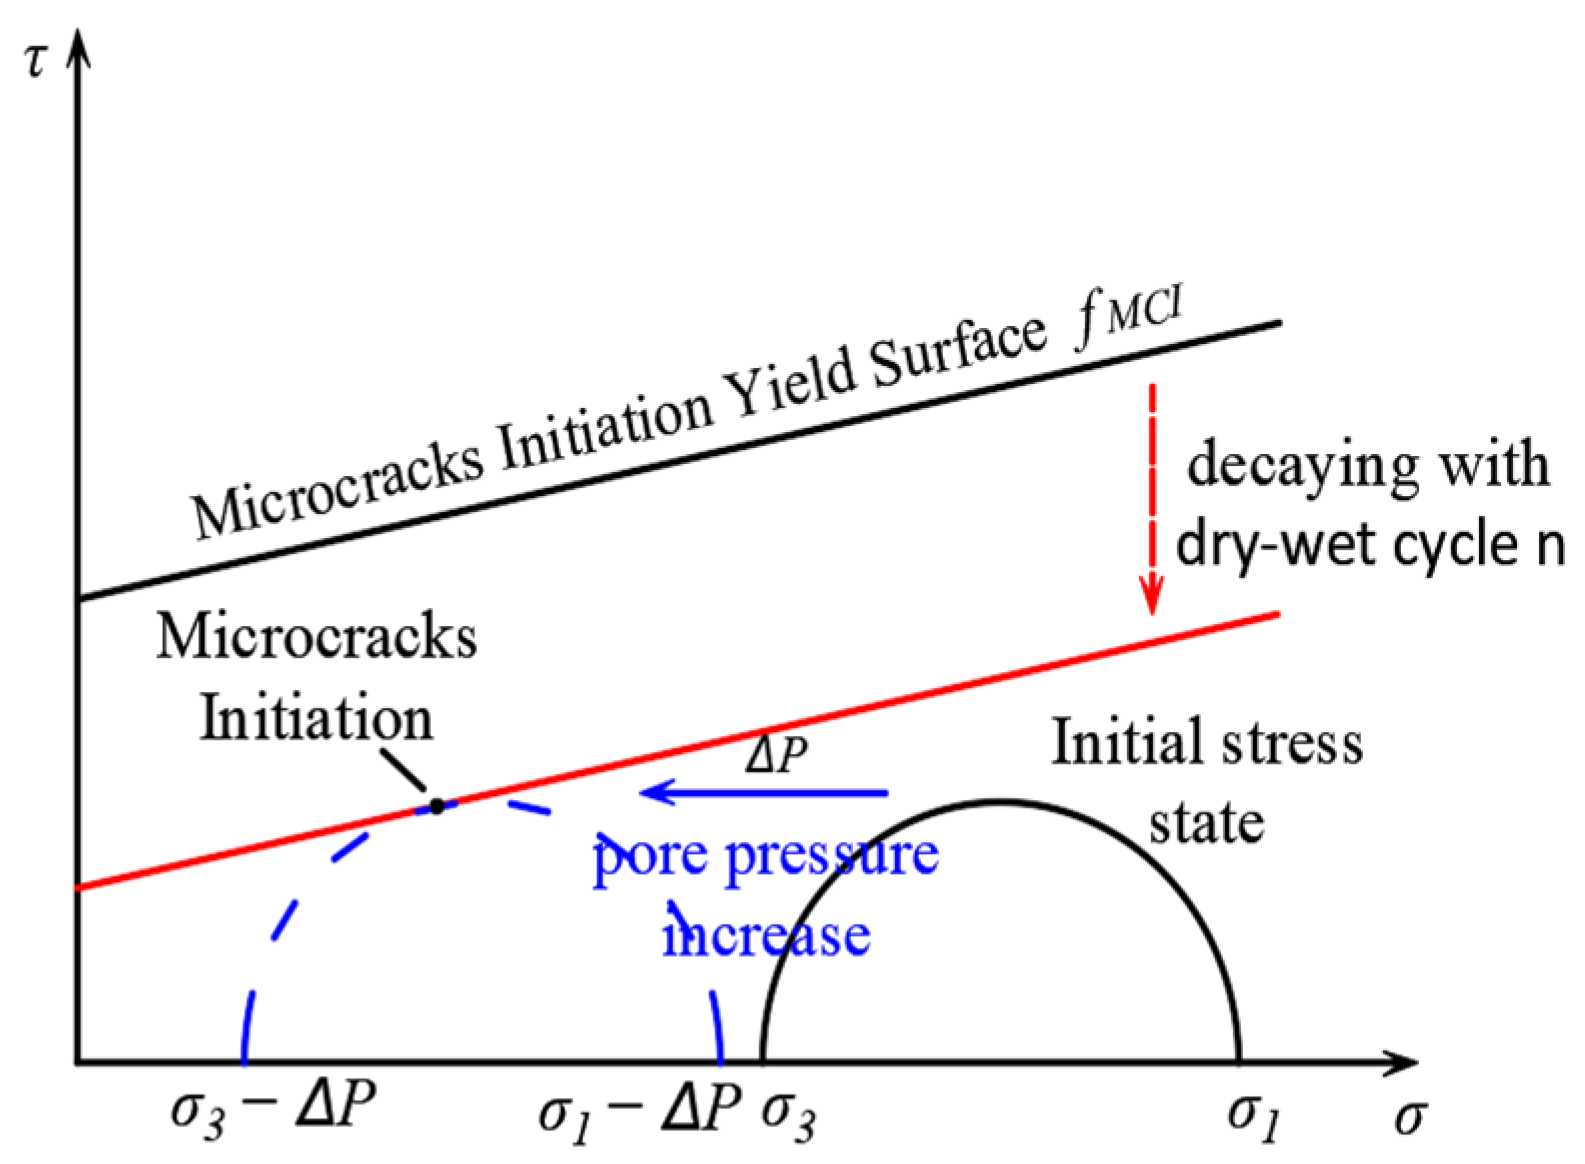
2.2.2. Long-Term Strength of Rock

The long-term strength of rock represents the mechanical transition from viscoelastic to viscoplastic behavior before failure. Based on the long-term strength of the rock, it is possible to explore the extent of the damage to the samples in the viscoelastic stage. In this study, the long-term strength of the samples under different dry–wet cycles was determined using the steady-state creep rate method, as shown in Figure 9a. The results show that the long-term strength of rock decreases exponentially with increasing dry–wet cycles. The fitted equation describing the relationship between long-term strength and cumulative dry–wet cycles (n) is given in Equation (1). Based on the Kachanov–Rabotnov theory [40], the evolution of the damage factor Dd-w with increasing dry–wet cycles is presented in Figure 9b. The results indicate that the damage factor Dd-w increases exponentially with cumulative dry–wet cycles n. The fitted equation describing the evolution of the damage factor Dd-w with cumulative dry–wet cycles (n) is presented in Equation (2). It is shown that under the same stress loading path, the long-term strength of the rock decreases with increasing n, indicating a reduction in the threshold for viscoplastic deformation. This phenomenon may be attributed to the softening of the mineral composition and structure induced by cyclic hydraulic action. As the number of cycles increases, the frictional properties of the rock deteriorate more rapidly, leading to a significant accumulation of damage. Therefore, further discussion is needed to elucidate the degradation mechanism of carbonaceous shale under dry–wet cycles.
τ v p ( n ) = 1.98 0.089 × exp ( 0.11 × n )
D d - w ( n ) = 0.033 × exp ( 0.13 × n ) 0.033

2.2.3. Micro-Mechanism of Shear Damage Affected by Dry–Wet Cycles

The structural characteristics of shale, which is rich in clay minerals, play a critical role in strength degradation and structural failure. The presence of clay, characterized by its low permeability and cementing properties, significantly affects the structural strength of rock during dry–wet cycles. Therefore, SEM tests were conducted to observe the microstructural nature of carbonaceous shale to further investigate the damage mechanisms induced by dry–wet cycles. Figure 10a illustrates that in the absence of dry–wet cycles, the samples exhibit only shear wear, revealing a clear microstructural composition consisting of quartz, calcite, and clay minerals. A schematic diagram of the sample’s microstructural composition can be obtained, showing clay filling the intergranular spaces between quartz and calcite crystals. When the sample is subjected to dry–wet cycles (Δn = 2) at each stress level, pronounced intergranular pores and microcracks can be observed due to the dissolution of clay minerals in the interparticle spaces. The hydraulic pressure induced by dry–wet cycles facilitates fluid flow. Due to the low permeability and weak cohesion of clay minerals, erosion occurs at structural defects or micropores when the shear stress at the solid–liquid interface exceeds a critical threshold. The reduction in clay mass due to hydraulic action weakens the cementation between particles, leading to the development of microcracks and the further expansion of pores. As the intensity of dry–wet cycles increases, the hydraulic pressure enhances fluid flow, intensifying the erosion of clay minerals and enlarging intergranular pores. Moreover, the increase in porosity further enhances hydraulic erosion, accelerating the detachment of clay minerals. It indicates that the samples are in a primary erosion stage, characterized by the formation of continuous fractures, as observed under the dry–wet cycle Δn = 4 in Figure 10c.
In summary, the shear damage mechanism of the samples is driven by the migration and fracturing of clay minerals due to the erosion caused by dry–wet cycles. The process is governed by a chain reaction involving hydraulically driven fluid flow, water-induced softening, and shear-enhanced microcrack development, ultimately leading to intergranular pore expansion and crack propagation under low-stress levels (which are considered parts of the viscoelastic stage).

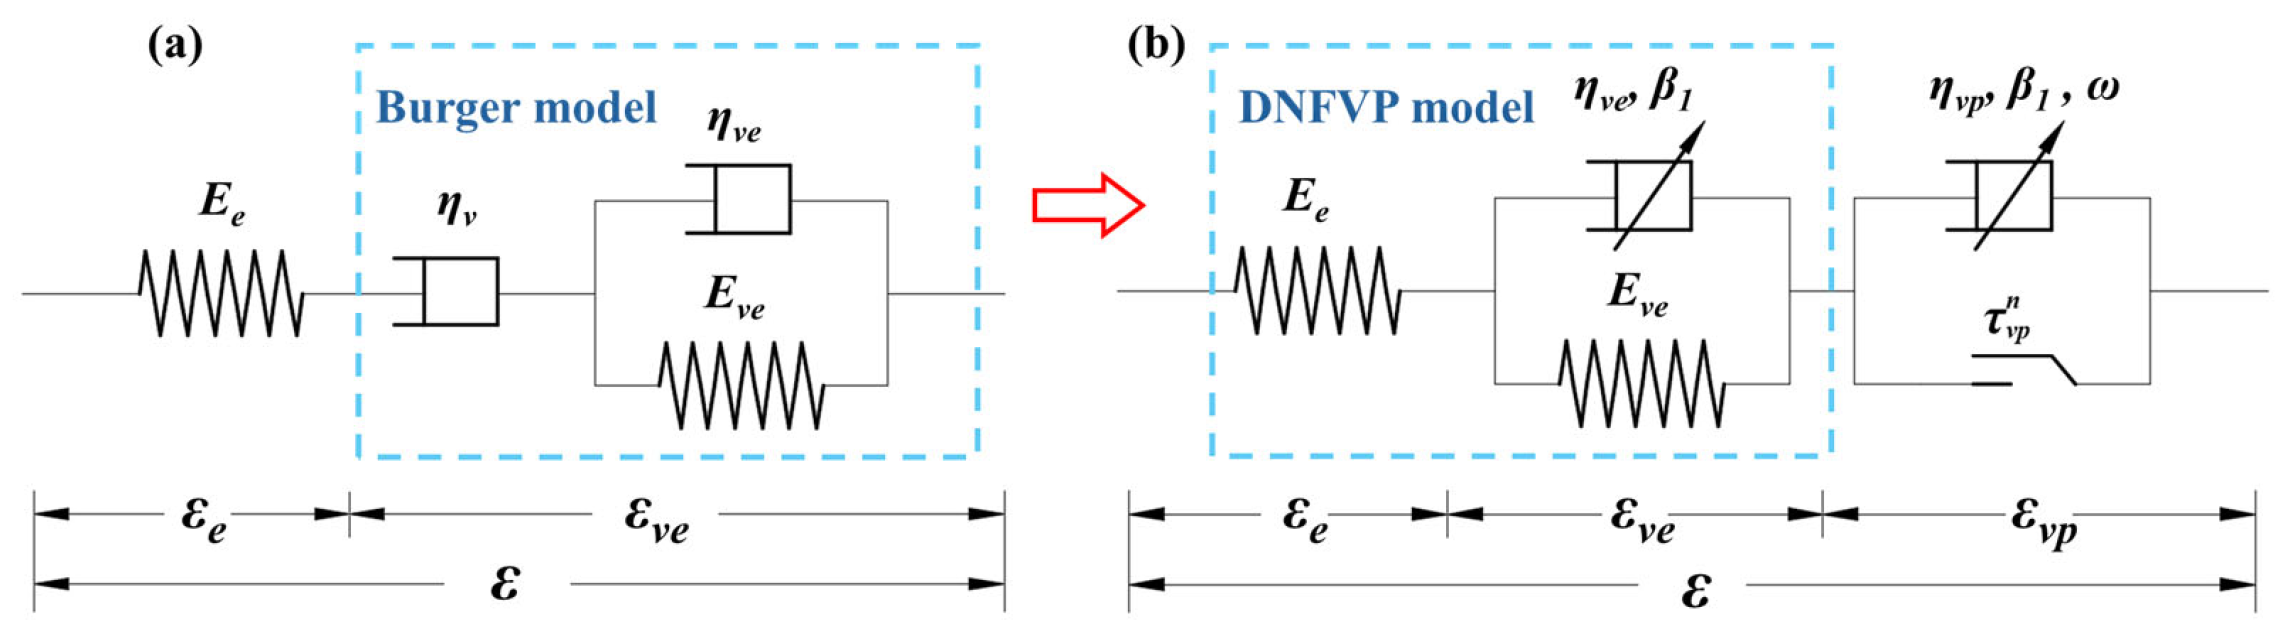
3. Establishment of Nonlinear Creep Model

Some studies on dry–wet cycle creep models primarily involve adding or replacing relevant elements in element creep models or fractional derivative creep models. However, in practice, this approach cannot adequately describe the creep behavior of rocks under dry–wet cycles: (1) it fails to describe the nonlinear creep behavior during the viscoelastic stage of rocks; (2) it does not sufficiently account for the coupling mechanism between damage evolution and dry–wet cycles. Therefore, more work is needed to better describe the creep behavior related to damage effects in the viscoelastic stage.

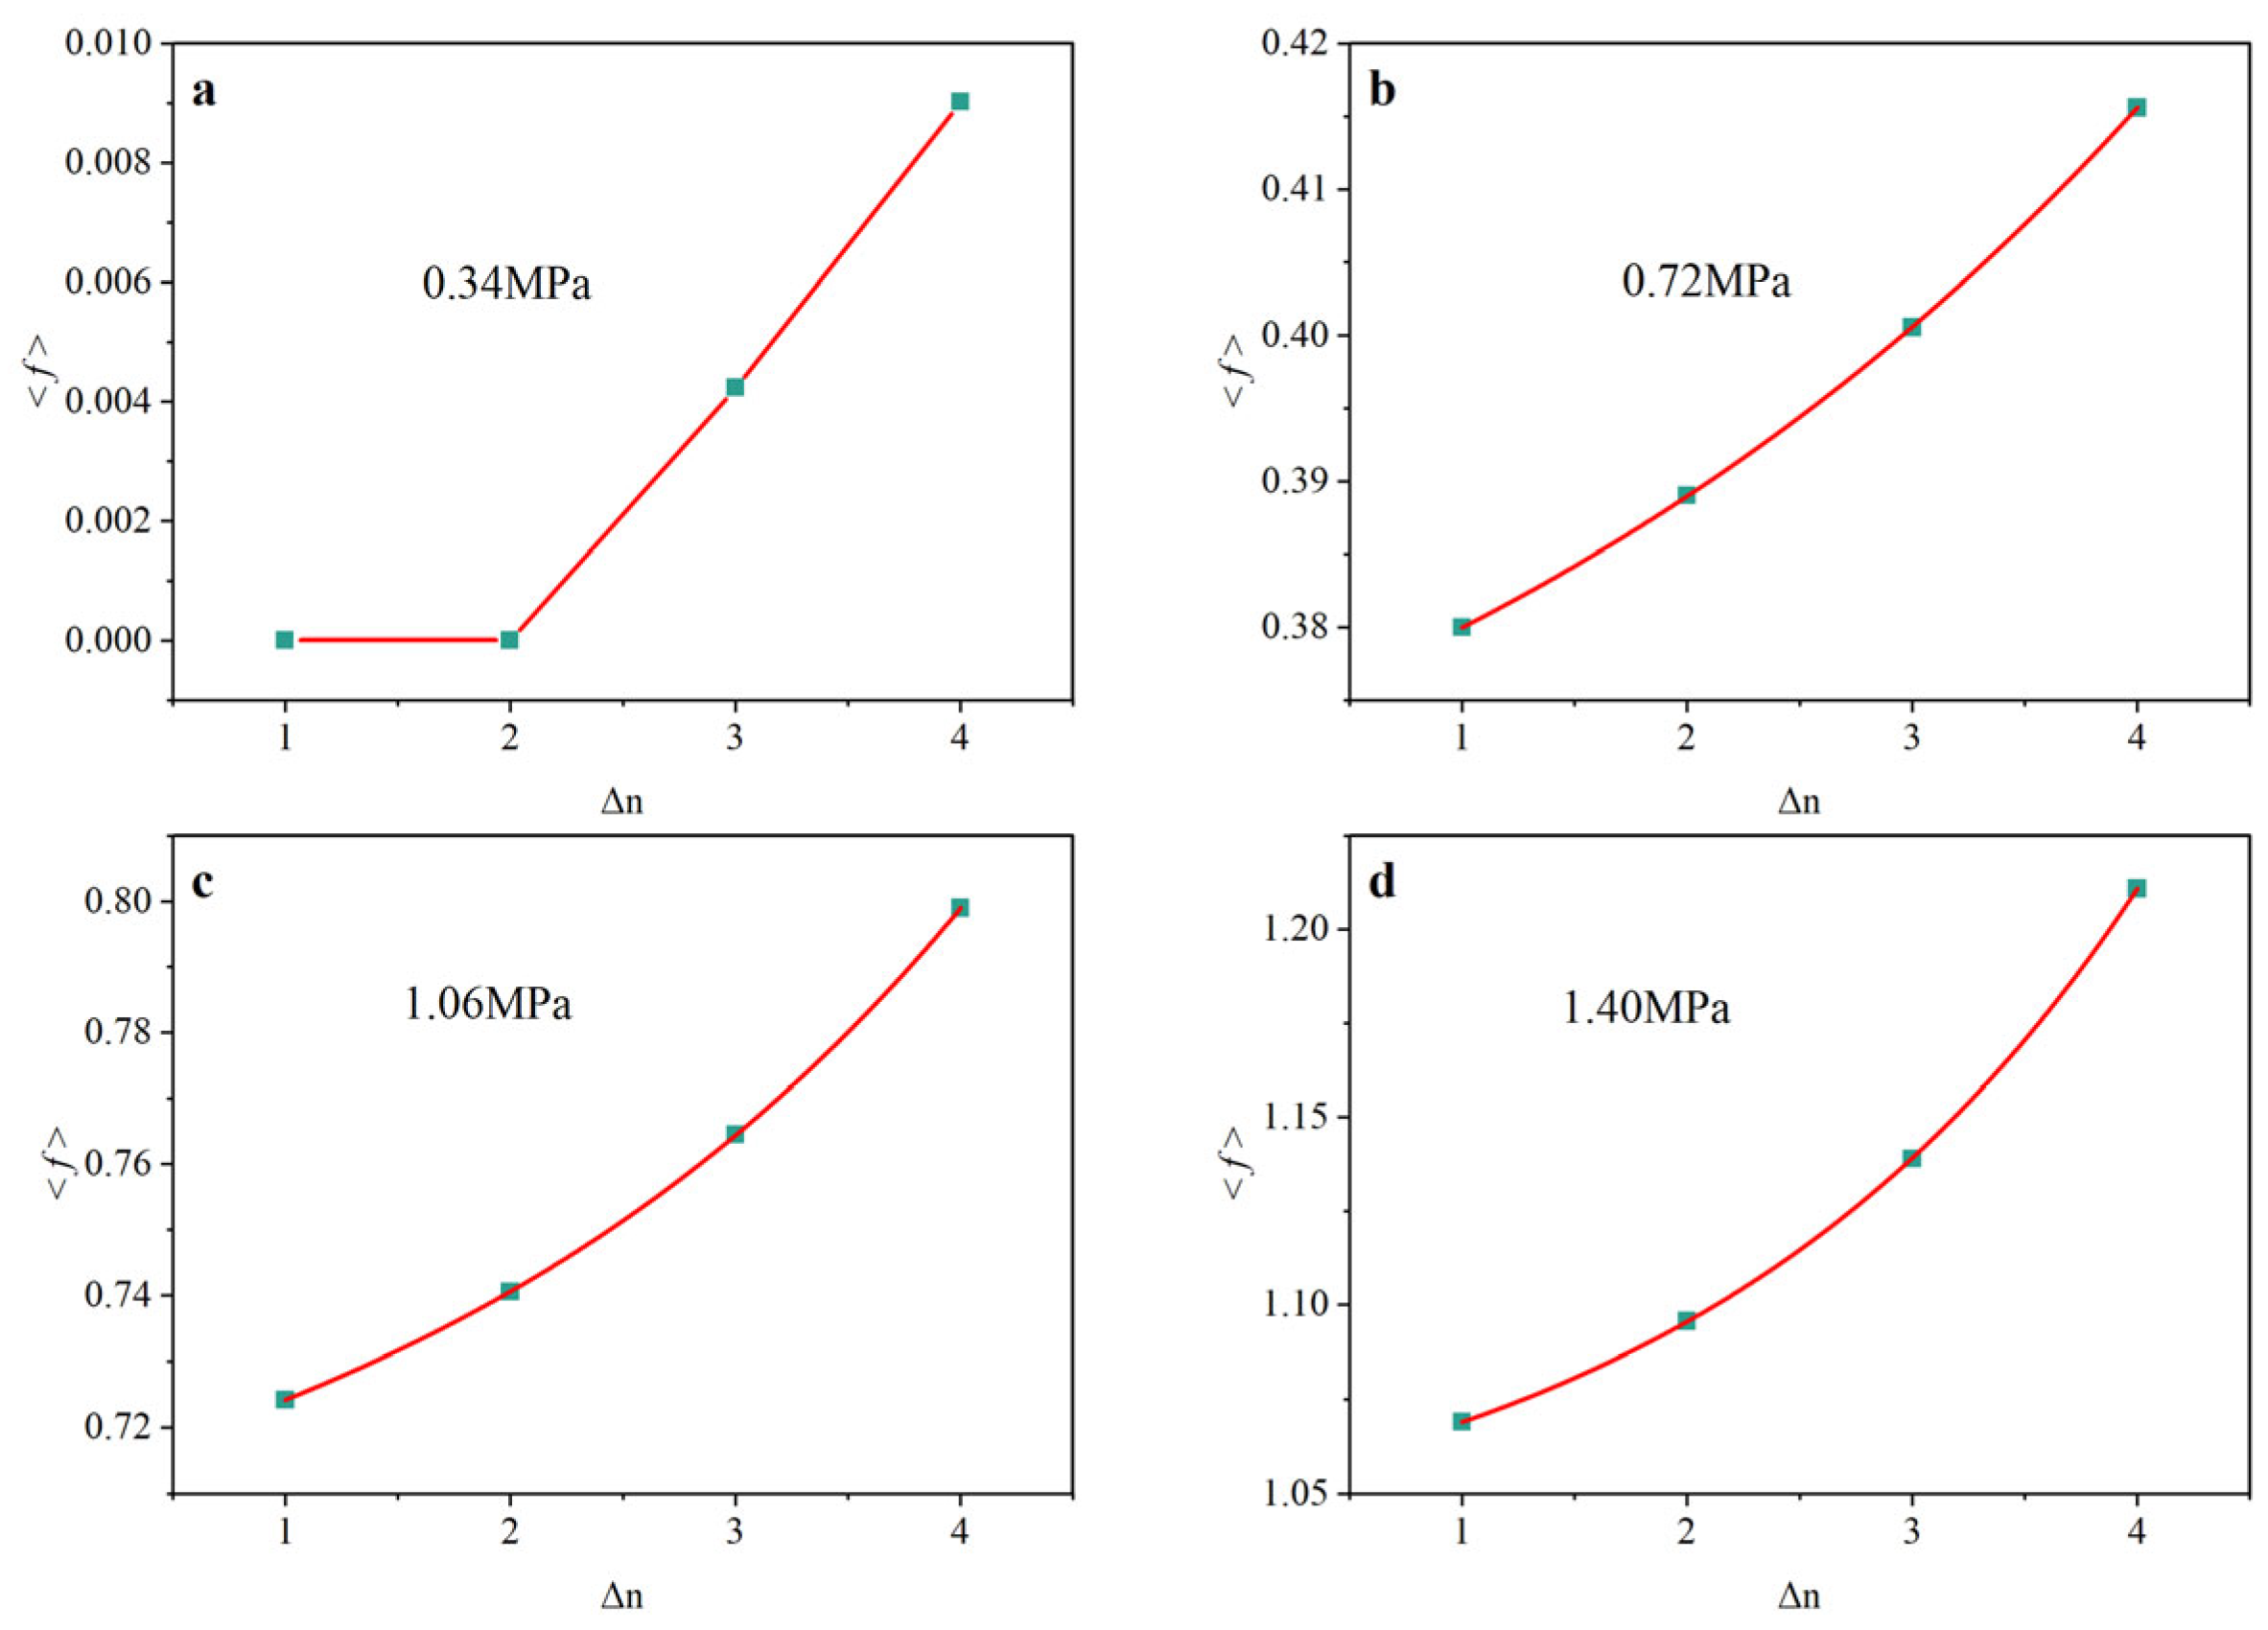
3.1. Quantification of Damage Effects

Typically, the viscoelastic behavior of rocks leads to reversible creep strain, characterized by a linear relationship between creep rate and deviatoric stress (as shown in Figure 11). However, this assumption does not align with the experimental results. Figure 11 shows that when the applied stress exceeds a threshold value (known as the crack initiation threshold, τCI), viscoplastic strain occurs. Therefore, based on the overstress theory proposed by Perzyna [41], a similar microcrack failure yield surface, fMCI, can be proposed to describe the damage effects of dry–wet cycles in the viscoelastic stage. For a rock stress state, after a dry–wet cycle, the strength of the microcrack failure yield surface decreases due to water erosion and softening while pore pressure increases, altering the initial stress state until the effective stress reaches or exceeds the strength of the yield surface. Microcracks then initiate and develop, resulting in irreversible viscoplastic strain, as shown in Figure 12. Therefore, according to the overstress theory, τMCI is the failure threshold for microcrack initiation, where the overstress exceeds <f> below
< f >   =   < τ τ M C I >
where <X> is a step function; <X> = 0 when X < 0 and <X> = X when X ≥ 0.
And <f> is expressed as follows according to the Mohr–Coulomb criterion [42]:
< f >   =   σ 1 m i 1 + sin φ 1 sin φ σ 3 + 2 c cos φ 1 sin φ )
where c and φ are the rock cohesion and angle of internal friction, and m is the empirical reduction factor for microcrack initiation (considering that τMCI = mi-τCI, τCI is the crack initiation threshold for creep failure yield surfaces (0.3 ≤ mi ≤ 0.7) [43,44,45].
Under dry–wet cycles, the microcrack yield strength decreases, and the corresponding microcrack initiation threshold ( τ M C I n ) decreases. The overstress <f> is as follows:
< f >   =   < τ τ M C I n >
It is generally considered that rock cohesion is gradually lost during crack propagation [46,47]. For simplicity, the degradation of rock cohesion is regarded as a performance of damage in this part. The cohesion decay evolution with the number of cumulative dry–wet cycles can be obtained as Equation (6).
c ( n ) = c ( 1 D d w ( n ) )
The overstress <f> explained in dry–wet cycle-induced damage is as follows:
< f >   =   ( σ 1 α p w ) m i ( 1 + sin φ 1 sin φ σ 3 + 2 c ( n ) cos φ 1 sin φ )
where α = 1 − K/Ks is the Biot coefficient [48]; K is the bulk moduli; and Ks is the grain bulk moduli.

3.2. Damage Evolution Equation

The random distribution of cracks and pores within rock materials leads to varying mechanical strength. It is not possible to describe the mechanical properties of the components with a single characteristic value. For simplicity, if a rock is decomposed into several elements, including mineral crystals, cement crystals, and microcracks, and these elements are small enough to be treated as particles in mechanics, i.e., they have a representative elementary volume (REV), statistical methods can then be used to describe the mechanical properties of the elements. Assuming that the representative elementary volume (REV) follows a Weibull distribution, its probability density function can be described as follows [49,50]:
P ( F h ) = m h F h 0 ( F h F h 0 ) m h 1 exp [ ( F h F h 0 ) m h ]
where Fh is the strength property of the randomly distributed REV, including Young’s modulus, tensile strength, and cohesion and friction angles. mh is represented by the concentration of the strength distribution of the REV. It should be emphasized that in this study, the damage probability was assumed to be related to the overstress <f> and to obey the Weibull distribution, thus defining the statistical damage parameter D, i.e., Fh is substituted for the overstress <f> to describe the development of microcracks. Thus, the number of damaged REVs (Nd) when the overstress reaches <f> is calculated as follows:
N d ( < f > ) = 0 < f > N P ( < f > ) d < f >   =   N { 1 exp [ ( < f > F ) m ] }
where m and F are the frictional damage parameters of geomaterials. Substituting Equation (9) into D = Nd/N, the evolution of damage within a geomaterial is the following:
D = 1 exp [ ( < f > F ) m ]

3.3. Nonlinear Creep Damage Model

The research status of rock creep models under dry–wet cycles is summarized in Table 2. The Burger model is commonly used to describe viscoelastic creep behavior. It introduces fractional derivatives instead of the Newtonian dashpot to describe the historical dependency of creep, addressing the limitations of complex expressions and numerous parameters, and is referred to as the DNFVP model. These models often consider damage due to dry–wet cycles using empirical methods or the Kachanov–Rabotnov theory. However, it is challenging to describe the damage of creep behavior to rocks under shear stress conditions amid dry–wet cycles. Consequently, this study selected carbonaceous shale as the research object. Based on the fractional derivative DNFVP model suitable for describing the creep characteristics of soft rock, an overstress indicator <f> was utilized. A uniform damage model based on the Weibull distribution was employed to quantify damage, leading to the development of a rock creep model that considered the effects of dry–wet cycles, as shown in Figure 13. Additionally, a more practical three-dimensional equation for engineering applications was derived.

3.3.1. Fractional Derivative Component

A fractional calculus can be defined in different ways, including the Riemann–Liouville fractional calculus.
Definition 1.
Let f be a piecewise continuous function at the interval (0, +∞) and integrable over any finite subinterval. For Re (β) > 0, t > 0, the Riemann–Liouville (R-L) integral of order β is defined by the following [51]:
D t β f ( t ) = d β f ( t ) d t β = 1 Γ ( β ) 0 t ( t τ ) β 1 f ( τ ) d τ
where Γ(·) is the gamma function and  Γ ( β ) = 0 t β 1 e t d t .
The fractional derivative of function f (t) of order β can be defined as follows:
D t β f ( t ) = d β f ( t ) d t β = d m d t m [ D t ( m β ) f ( t ) ]
where m is the smallest integer greater than β.
Table 2. Comparison of different creep models.
Yang et al. [52]Li et al. [18]Li et al. [33]This Study
Model nameBurgerImproved Burger modelDNFVP modelImproved DNFVP model
Model dimension1-D3-D3-D3-D
Consideration factorsStress effectPore pressure effectEffect of dry–wet cyclesStress effect and dry–wet cycles
Modified componentsNoneAdd a new damage factorAdd the fractional-order Newtonian dashpotAdd a new damage factor and a fractional derivative component
Damage theoryNoneKachanov–Rabotnov theoryEmpirical methodStatistical theory based on the dry–wet cycle-induced damage mechanism
Correlation equation ε ( t ) = σ E M + σ η M t + σ E K ( 1 e E K η K t ) ε = σ E k [ 1 exp ( E k η ˜ Δ u t ) ] η ˜ Δ u = η K ( 1 D ( t ) ) ε ( t ) = τ 0 η 1 ( 1 D ( n ) ) t β 1 Γ ( 1 + β 1 ) ε ( t ) = τ η v e ( 1 D ) k = 0 ( ( E v e / η v e ) k t β 1 ( 1 + k ) ) β 1 ( 1 + k ) Γ [ ( 1 + k ) β 1 ] + < f v p > η v p e ω t t β 2 Γ ( 1 + β 2 )
A typical application of fractional calculus is the Abel dashpot, which is a fractional derivative description of the Newtonian dashpot. The constitutive relation of the Abel dashpot is given by the following [53]:
τ ( t ) = η d β ε ( t ) d t β , ( 0 β 1 )
where η is the generalized viscosity coefficient of Abel dashpot and β is the derivative order.
In the particular case where β = 1, the Newtonian dashpot represents an ideal fluid, while in the case where β = 0, it represents an ideal solid spring. The Abel dashpot combines the characteristics of both a spring and a Newtonian dashpot and, moreover, eliminates the limitation of the component being exclusively a spring or a Newtonian dashpot. Therefore, the Abel dashpot is capable of describing strain responses across multiple time scales, which differ from the traditional spring or dashpot models constrained by exponential time dependence.
According to the Riemann–Liouville fractional calculus (Definition 1), considering τt = τ0 (constant stress), the material is under creep conditions, and the creep equation is as follows:
ε ( t ) = τ 0 η t β Γ ( 1 + β ) , ( 0 β 1 )

3.3.2. Time-Based Fractional Derivative Model

The Burgers model is widely used due to its clear viscoelastic theory and well-defined physical parameters for rock masses. In this study, a new creep model termed the time-based fractional derivative Burger model, named the Improved DNFVP model, is proposed by replacing the Newtonian dashpot with an Abel dashpot in the Burger model, as conducted by Yang et al. [52] in Figure 13a. This model consists of an elastic component (Hookean body), a viscoelastic body (an Abel dashpot and Hookean body), and a viscoplastic body (an Abel dashpot and friction element), as shown in Figure 13b.
During the creep process, the mechanical behavior of the rock generates microcracks, which propagate within it. Damage is modeled based on the Kachanov–Rabotnov concept of an effective stress-bearing surface [40]. Thus, we can obtain effective stress during the creep process as follows:
τ ˜ = τ 1 D
The total strain in Figure 13b is given by the following:
ε = ε e + ε v e + ε v p
For the elastic part, εe can be expressed as follows:
ε e = τ ˜ E e
where Ee is the elastic modulus.
For the viscoelastic part, the strain and stress of the viscoelastic body are as follows:
{ ε v e = ε H = ε A τ ˜ = E v e ε v e + η v e d β ε ( t ) d t β
where εH is the strain of spring Eve, εA is the strain of the Abel dashpot, and η is the viscosity coefficient of the Abel dashpot.
On the basis of the theory of fractional calculus [51], the relationship between the Riemann–Liouville fractional derivative and the Caputo fractional derivative CD is given by the following [54]:
D t a C f ( t ) = 1 Γ ( m a ) a t f m ( τ ) ( t τ ) α m + 1 d τ = d m d t m f ( a ) ( t a ) m a Γ ( m α + 1 ) + 1 Γ ( m a + 1 ) a t ( t τ ) m α d m + 1 d t m + 1 f ( τ ) d τ
D [ f ( t ) ] = C D [ f ( t ) ] + k = 0 m 1 t k β y ( k ) ( 0 ) Γ ( k β + 1 ) ( 0 < β < m )
Taking a Laplace transform on both sides of Equation (20), we obtain the following:
ε v e = τ ˜ η v e k = 0 ( ( E v e / η v e ) k t β 1 ( 1 + k ) ) β 1 ( 1 + k ) Γ [ ( 1 + k ) β 1 ] , 0 < β 1 < 1
For the viscoplastic part, based on the overstress theory, the accelerated creep process is initiated, leading to material failure when the stress exceeds the viscoplastic yield surface, fvp, as shown in Figure 14. The constitutive equation of viscoplastic strain is expressed as follows:
τ ~ τ v p n = η v p e ω t d β 1 ε ( t ) d t β 1 , τ ~ > τ v p n
where τ v p n is the rock viscoplastic yield strength for n times of dry–wet cycles (and is also the long-term strength of the rock); ω is the material constant reflecting the damage. The Laplace transformation of Equation (22) and further inverse transformation expresses the following constitutive equation of viscoplastic strain:
ε v p = < f v p > η v p e ω t t β 2 Γ ( 1 + β 2 ) , 0 < β 2 < 1
< f v p >   =   0 , τ ~ < τ v p n τ ~ τ v p n , τ ~ τ v p n
Synthetically, the total creep strain of the time-based fractional derivative Improved DNFVP model shown in Figure 13 is given by the following:
ε ( t ) = τ E e ( 1 D ) + τ η v e ( 1 D ) k = 0 ( ( E v e / η v e ) k t β 1 ( 1 + k ) ) β 1 ( 1 + k ) Γ [ ( 1 + k ) β 1 ] + < f v p > η v p e ω t t β 2 Γ ( 1 + β 2 )
According to the theory of elastic–plastic mechanics, the three-dimensional creep equation of the Improved DNFVP model is as follows:
ε ( t ) = S i j 2 G e ( 1 D ) + S i j η v e ( 1 D ) k = 0 ( ( E v e / η v e ) k t β 1 ( 1 + k ) ) β 1 ( 1 + k ) Γ [ ( 1 + k ) β 1 ] + < f v p > η v p ( 1 D ) e ω t t β 2 Γ ( 1 + β 2 ) + σ m δ i j 3 K < f v p >   =   { 0 , S i j < S i j v p n S i j S i j v p n , S i j S i j v p n

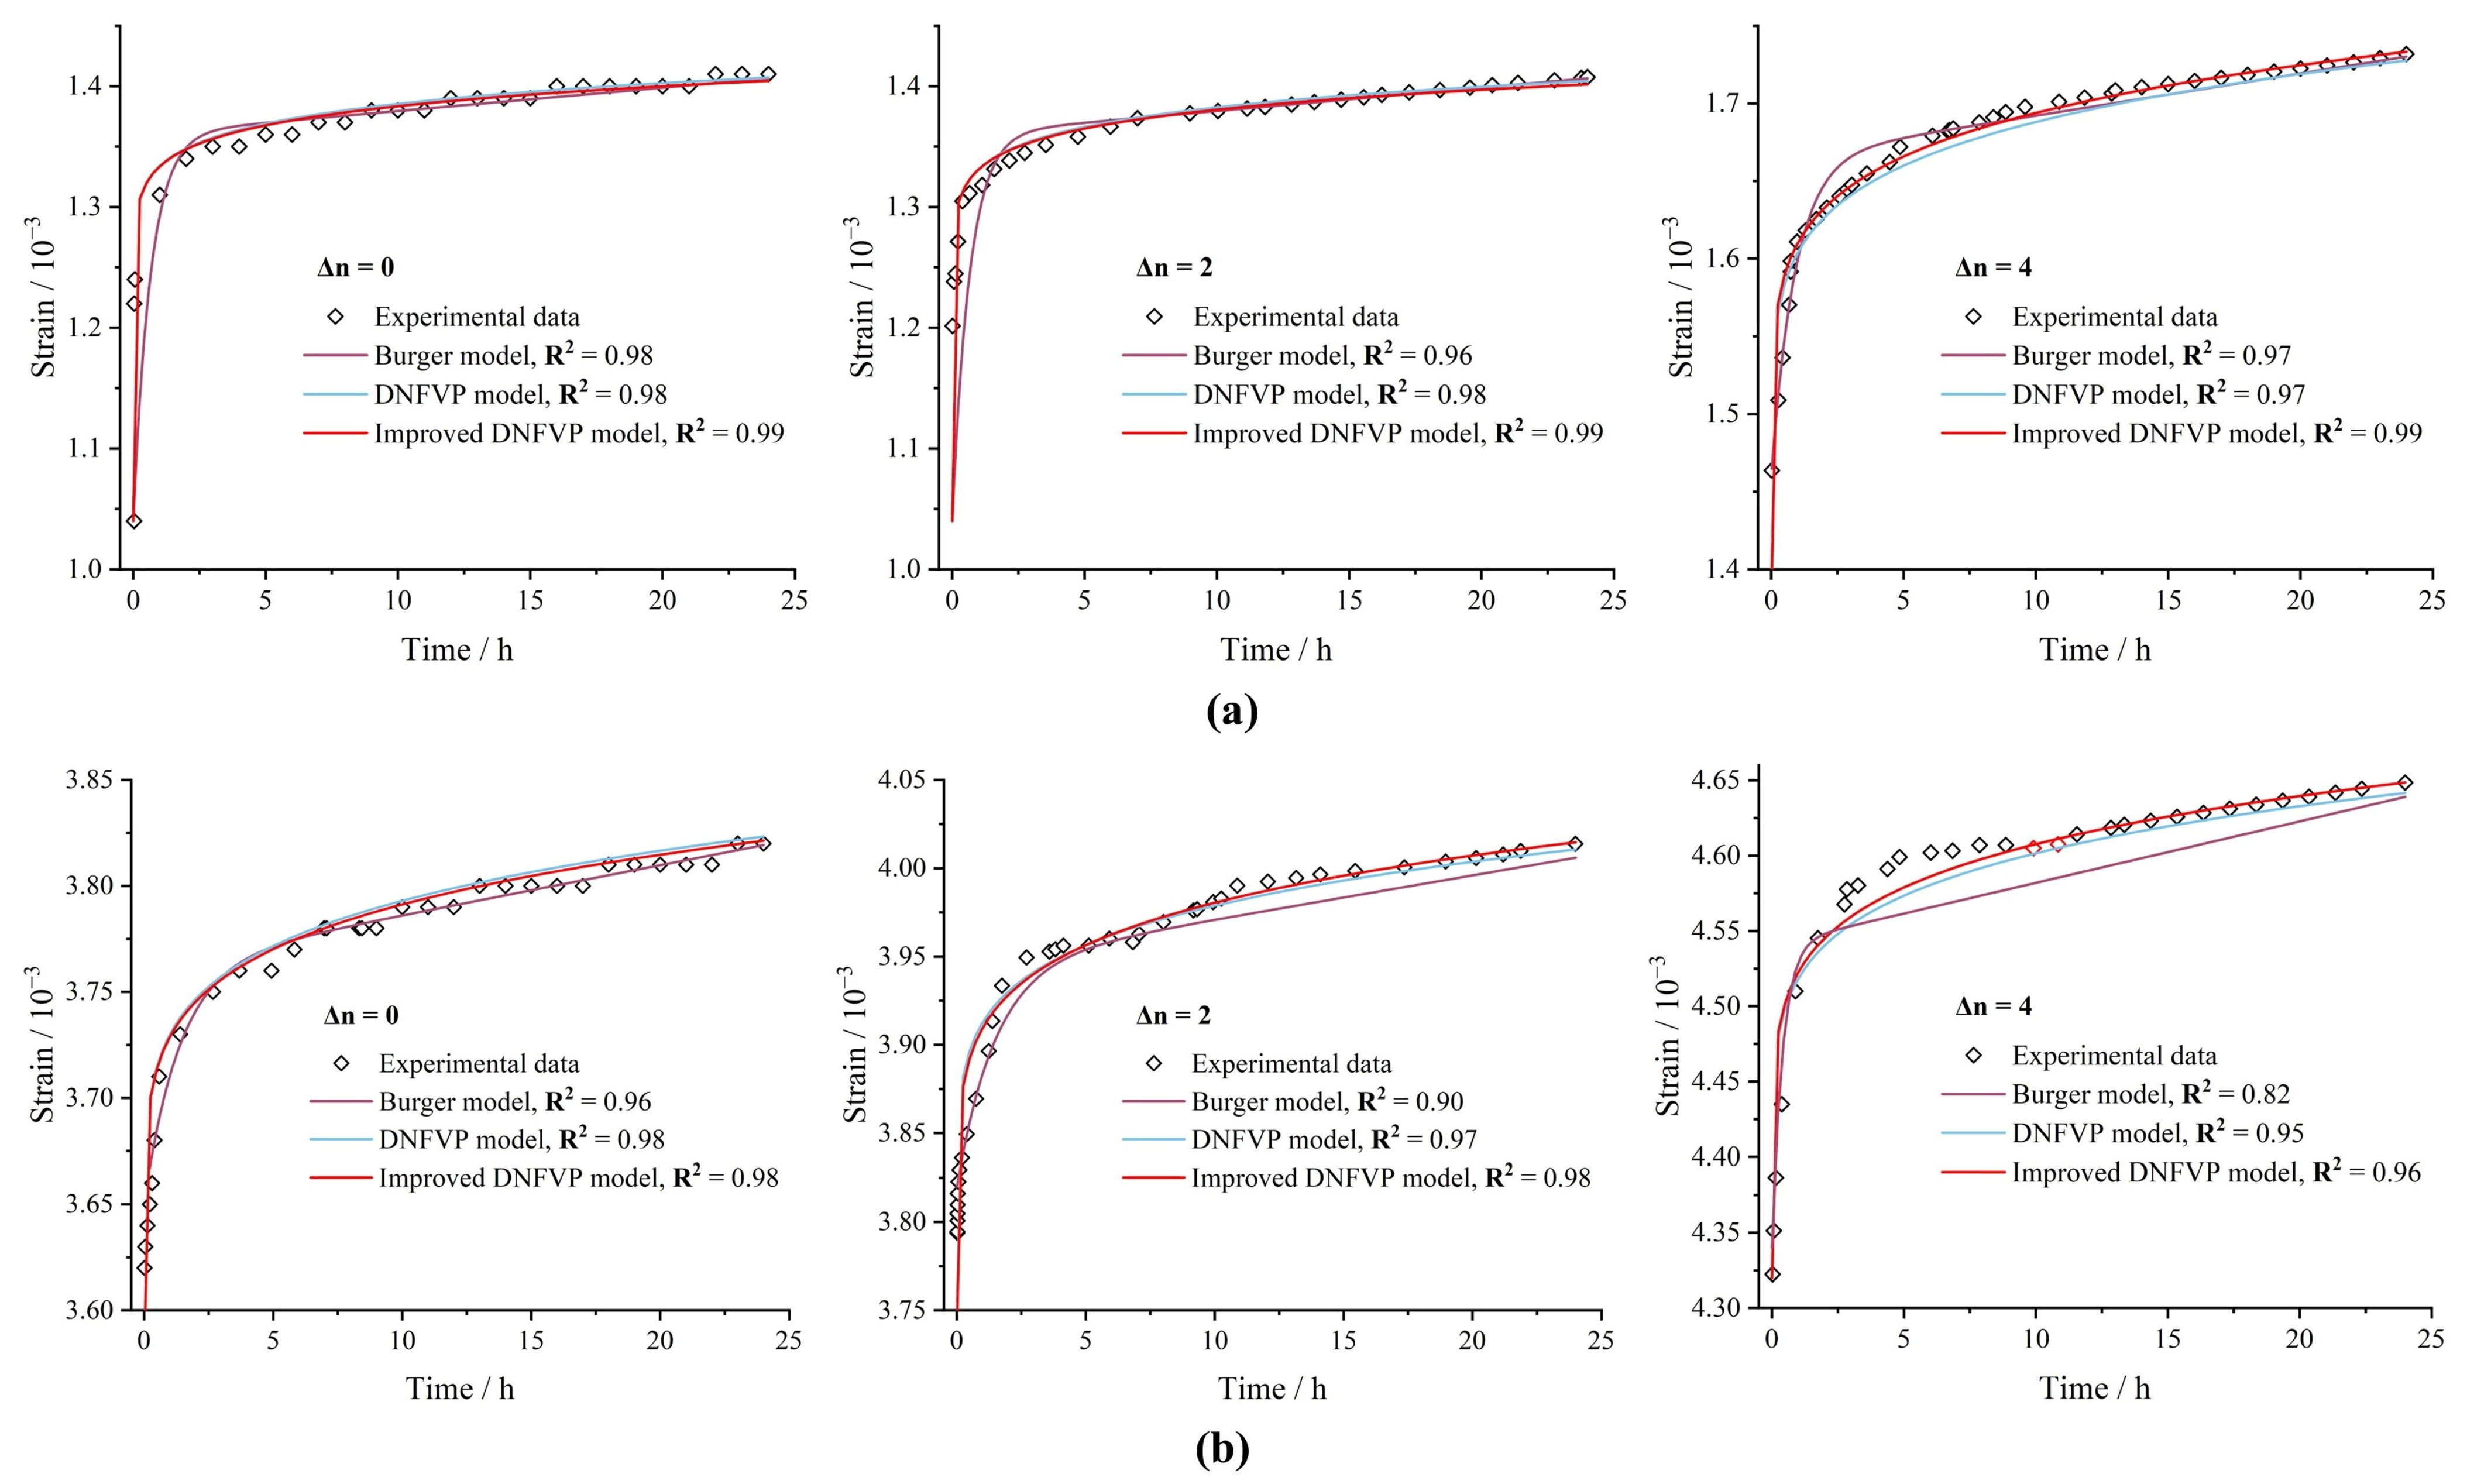
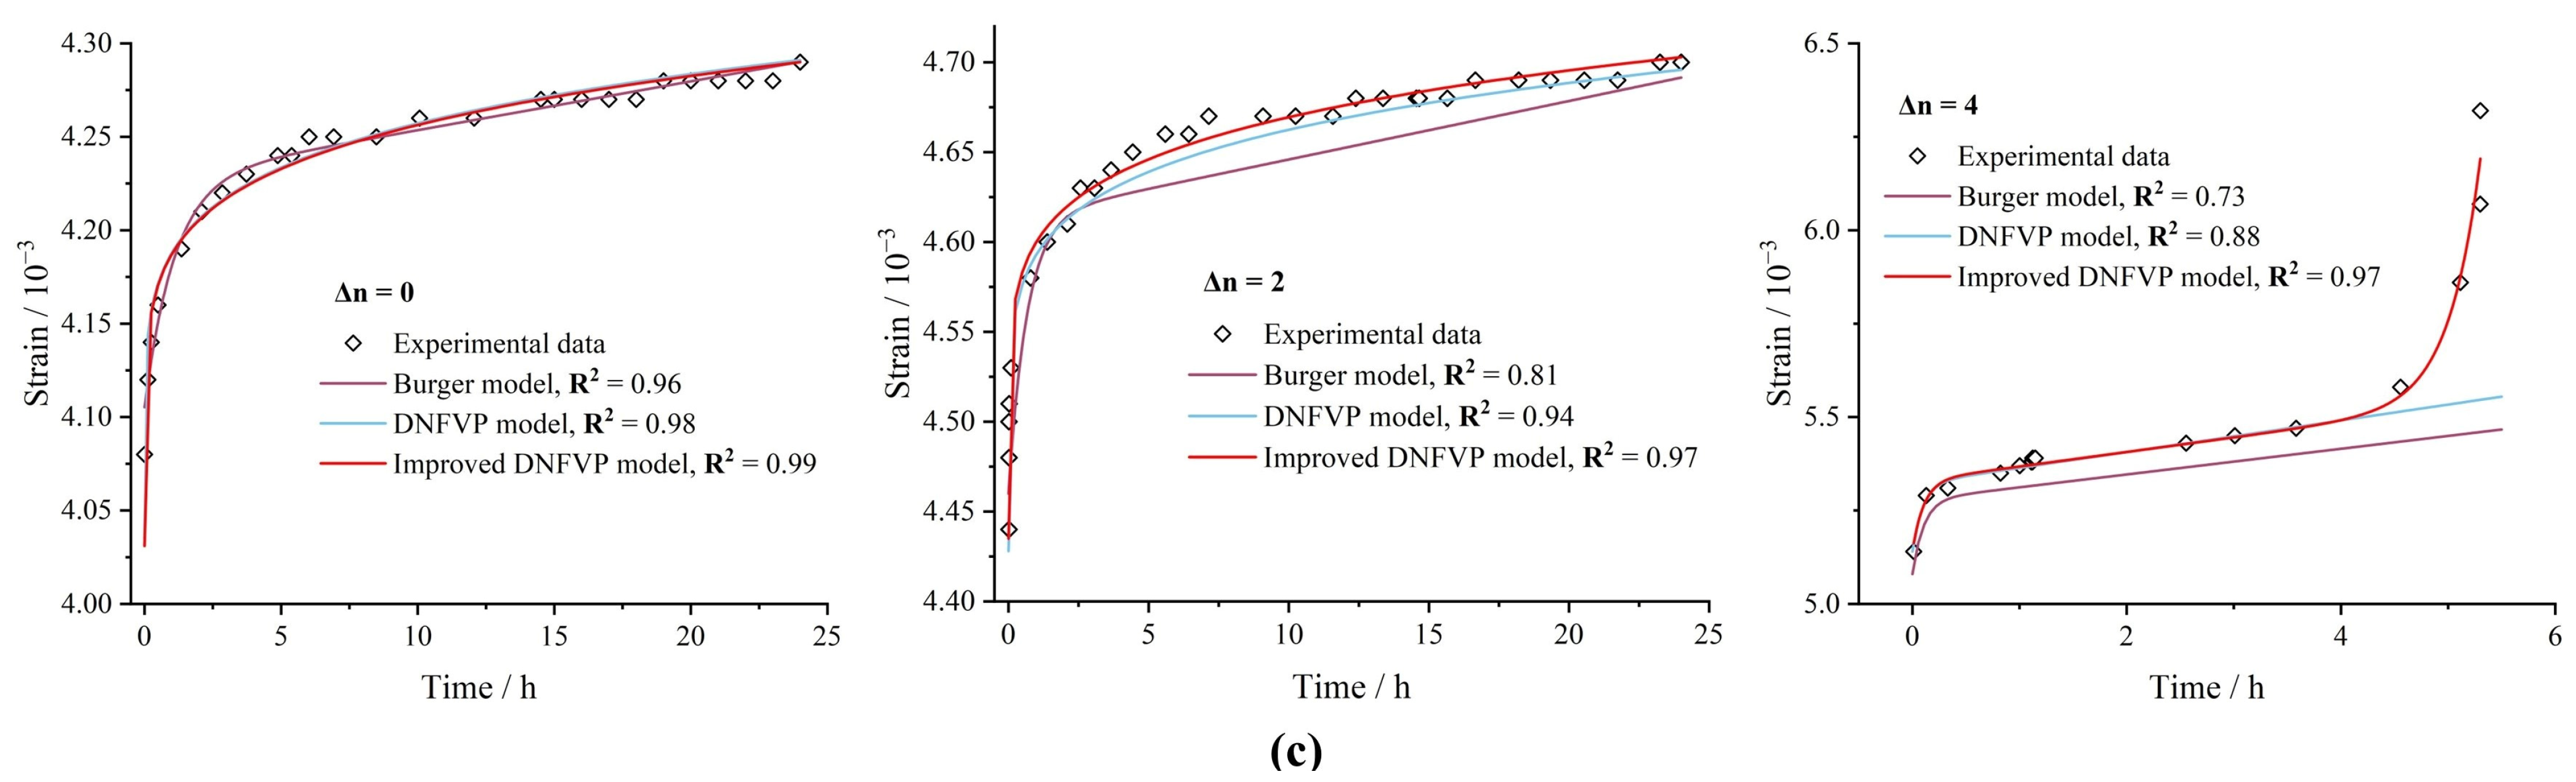
3.4. Validation of the Improved DNFVP Model

The effectiveness of the nonlinear creep model depends on its ability to fit the experimental creep data under dry–wet cycles. Furthermore, comparing it with the Burgers model and the DNFVP model can further validate the effectiveness of the Improved DNFVP model. The parameters related to the models are presented in Table 3, Table 4 and Table 5. The Levenberg–Marquardt optimization algorithm is employed to identify the parameters of the creep curve [55]. The fitted creep strain curves of samples under dry–wet cycles are shown in Figure 15.
The fitting results of the proposed model are generally consistent with the experimental results. It can be observed that at the first stress loading level at 0.34 MPa, all models can approximately fit the experimental data, despite variations in dry–wet cycle conditions, with correlation coefficients (R2) exceeding 0.95. As the stress loading level increases and the number of dry–wet cycles accumulates at a deviatoric stress of 1.4 MPa, both the DNFVP model and the Improved DNFVP model continue to reasonably describe the creep behavior under varying dry–wet cycles (R2 > 0.95), whereas the Burger model exhibits a lower correlation coefficient (R2 = 0.82). Additionally, during the experiment, the sample failed at deviatoric stress of 1.78 MPa under Δn = 4 dry–wet cycles. The Improved DNFVP model not only captures the entire creep failure process of the sample but also exhibits an accurate response to failure time with a correlation coefficient of R2 = 0.97, whereas the DNFVP model and the Burgers model perform poorly. This discrepancy primarily arises because the Burgers model completely neglects the irreversible strain induced by damage under dry–wet cycles. The DNFVP model introduces an empirical damage factor for dry–wet cycles, which can partially describe the irreversible strain caused by damage. However, this method fails to account for the damage mechanism resulting from the interaction between stress and dry–wet cycles, leading to an underestimation of the actual extent of the damage. Consequently, at lower deviatoric stress levels (0.67τf–1.78 MPa), the DNFVP model incorrectly assumes that the specimen remains in the viscoelastic stage and does not undergo failure. Therefore, the Improved DNFVP model, by incorporating damage quantification based on the dry–wet cycle damage mechanism, accurately captures the nonlinear creep behavior under the coupled effects of stress and dry–wet cycles.

4. Discussion

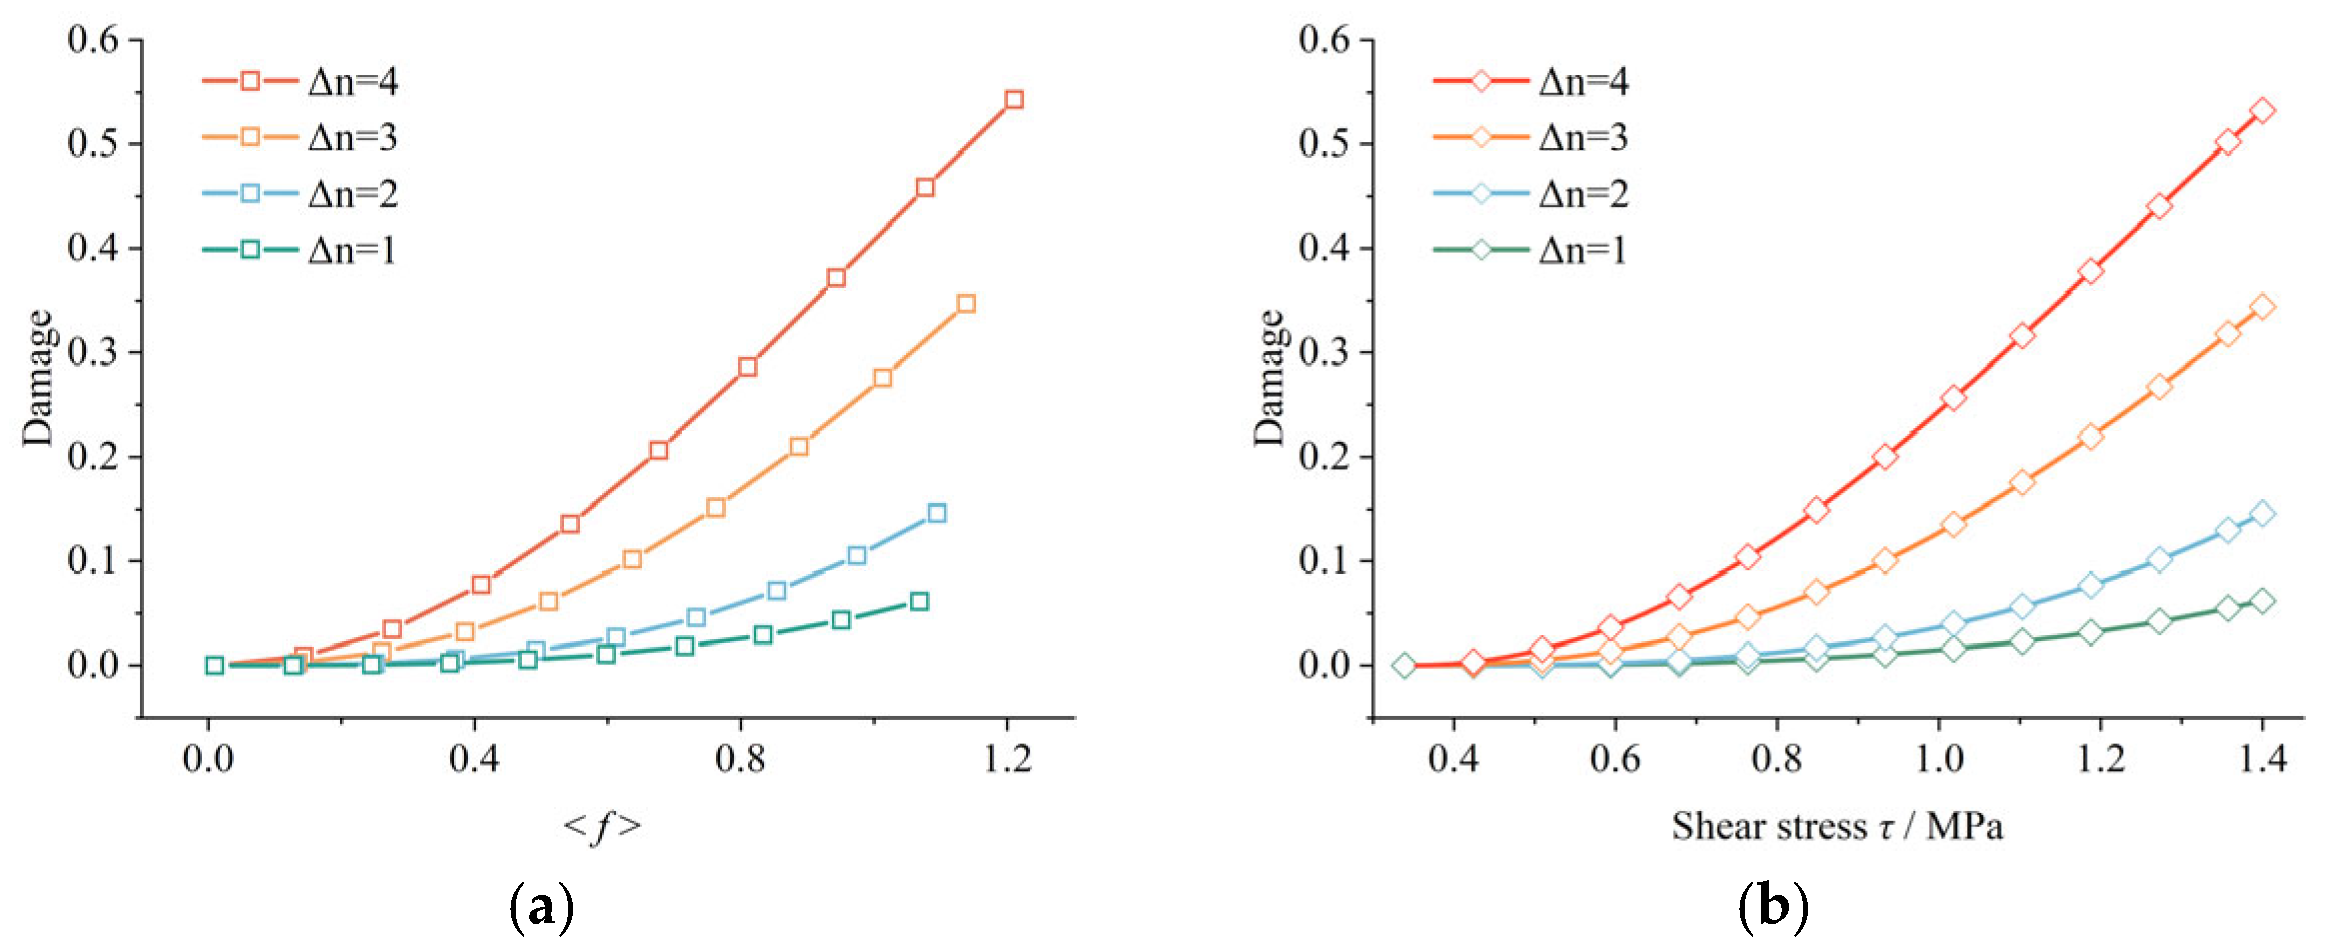
4.1. Damage Propagation Characteristics with Dry–Wet Cycles

As discussed in Section 3.1, overstress <f> is defined as a criterion for quantifying the degree of damage, which is influenced by both stress effects and dry–wet cycles. Therefore, based on the experimental results, the evolution of overstress <f> with the cumulative dry–wet cycles n under different applied stress levels can be obtained in Figure 16. At an applied stress level of 0.34 MPa, overstress <f> remains at zero for a low number of dry–wet cycles. This indicates that under low applied stress levels, the damaging effect of dry–wet cycles is not significant, as the threshold for microcrack initiation was not reached. Consequently, the rock exhibits reversible strain in the viscoelastic stage. Furthermore, overstress <f> exhibits a nonlinear increase with cumulative dry–wet cycles.
The evolution of damage propagation under different dry–wet cycle conditions is illustrated in Figure 17a, showing that damage propagation exhibits an exponential increase with overstress <f>. In addition, as the number of dry–wet cycles increases, both the rate and magnitude of damage propagation significantly increase. It suggests that increased dry–wet cycling reduces the rock’s frictional properties, thereby lowering the failure threshold of microcracks. Consequently, overstress <f> accelerates under the same stress conditions, driving the development of microcracks. At lower stress levels, the development of microcracks may lead to sample failure. Based on the relationship between overstress <f> and applied stress (as shown in Equation (4)), the evolution of damage propagation with shear stress is illustrated in Figure 17b. It can be observed that as shear stress increases, damage propagation exhibits an exponential growth trend, which is similar to the trend of overstress <f>. This demonstrates that shear stress is also a critical factor influencing the accumulation of rock damage in addition to dry–wet cycles. This finding is consistent with the experimental results analyzed in Section 2.2.1. Specifically, the increase in stress levels and cumulative wet–dry cycles promote microcrack development and accelerate the rock damage process.
According to the definition of the damage evolution equation in Section 3.2, the model parameters m and F represent the strength quality and strength characteristics of the rock, respectively. By validating the model and fitting it to experimental data, the evolution of parameters m and F under cumulative dry–wet cycles is illustrated in Figure 18. Parameter m exhibits a linear decline as the number of dry–wet cycles increase, indicating that dry–wet cycling accelerates the strength degradation of samples. Parameter F exhibits an exponential decline with increasing dry–wet cycles, which is consistent with the long-term strength variation in samples under dry–wet cycles. Thus, parameter F can be used to quantify the long-term strength degradation of samples during dry–wet cycles.

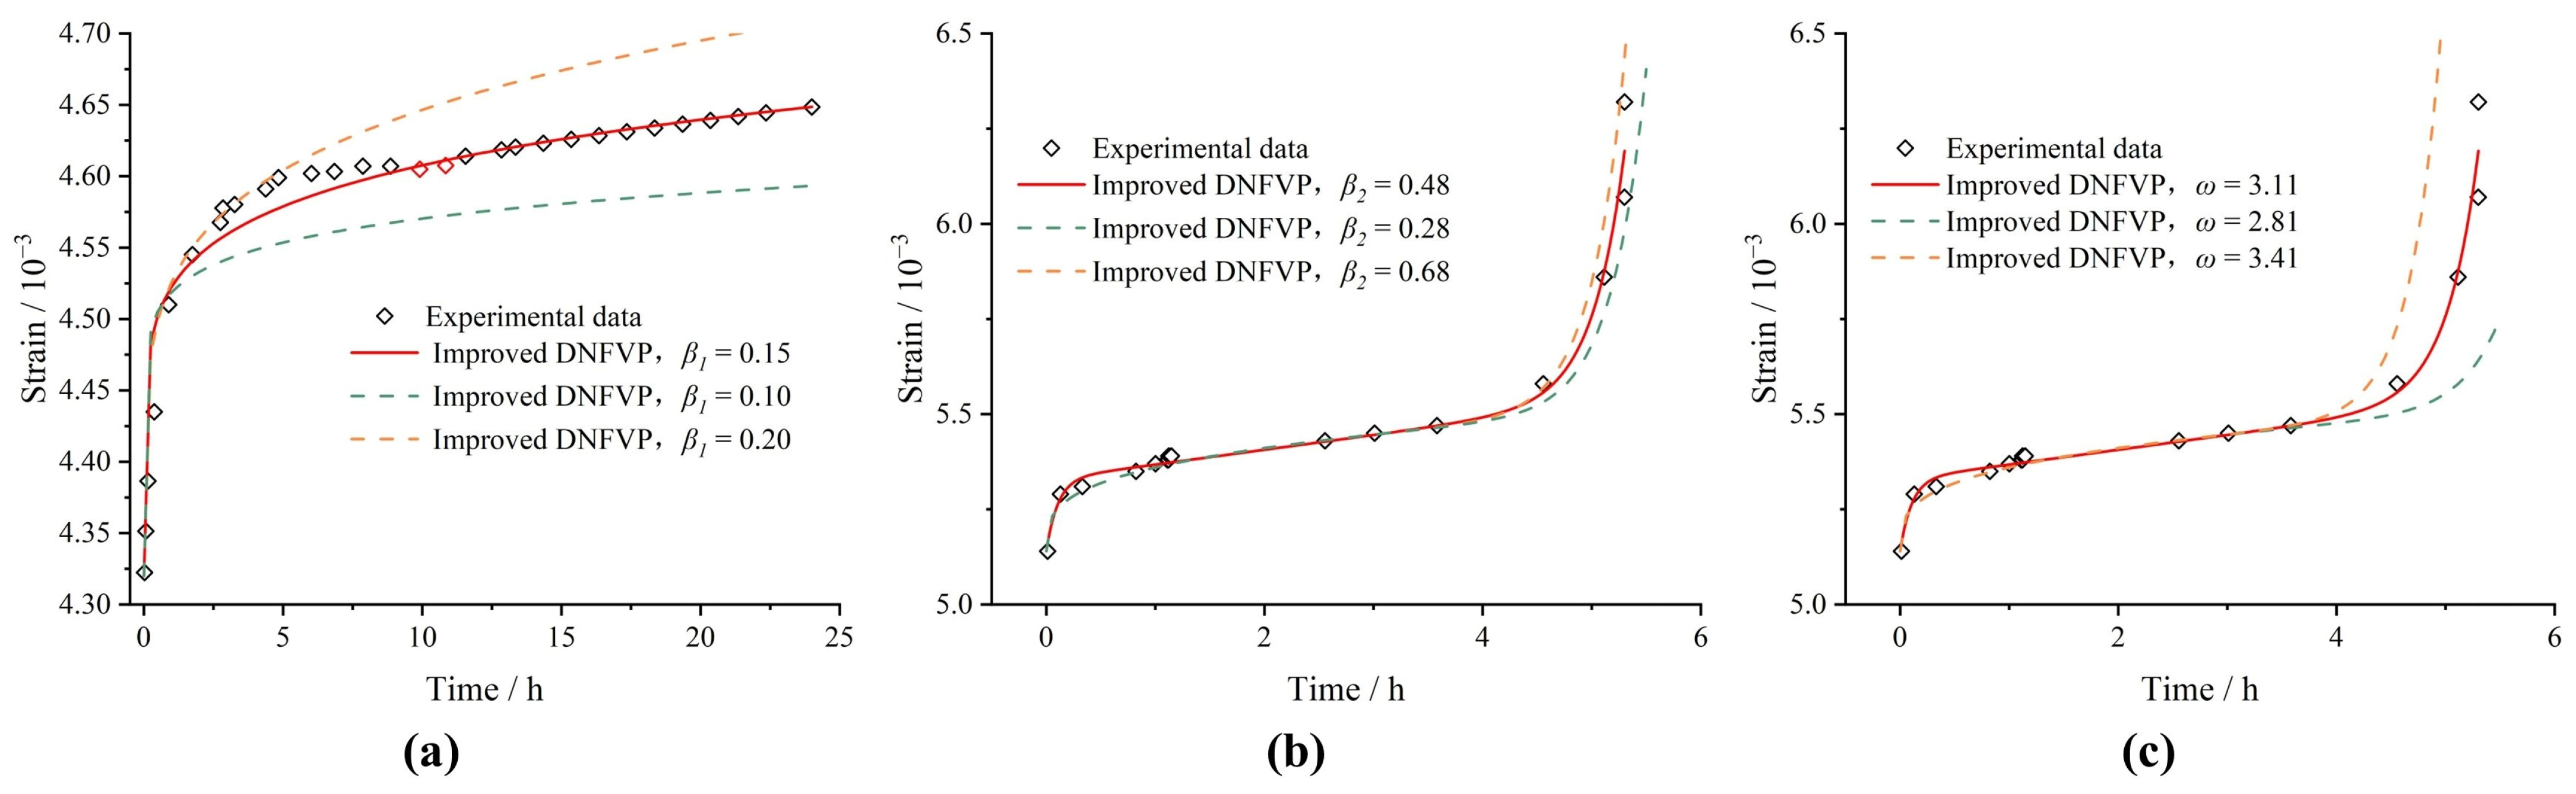
4.2. Sensitivity Analysis of the Improved DNFVP Constitutive Parameters

It is evident that the temporal strain dependence of the sample is governed by the creep parameters β1, β2, and ω. To better understand the sensitivity of these parameters on sample deformation, a parameter analysis was conducted to identify the most sensitive critical parameters (β1, β2, ω) and their impact on the creep curve. Figure 19a illustrates the variation in creep curves over time at different β1 values during the viscoelastic phase. It can be observed that as β1 increases, all creep strains increase, while transient creep remains nearly unaffected. This is attributed to the replacement of the Newtonian dashpot–Hookean body in Burger’s model with the fractal order Abel dashpot–Hookean body in the Improved DNFVP component, exhibiting viscoelastic characteristics. Figure 19b,c depict the changes in creep curves over time at various β2 and ω values during the failure phase. It is observed that β2 and ω values only affect creep strain in the viscoplastic stage, and as these values increase, they preemptively influence the onset of the accelerated creep stage. Moreover, ω is more sensitive than β2. It underscores the importance of ω in regulating damage progression to failure in the Improved DNFVP model.

4.3. Limitations of This Study

This study examines the creep behavior of sliding zone carbonaceous shale subjected to dry–wet cycles using the Mohuandang landslide as a case study. This study indicates that (1) the experimental conditions (e.g., the sample stress state, cyclic seepage pressure, and dry–wet cycling protocol) were specifically designed based on the geological conditions of the open-pit mine. Therefore, the broader applicability of the results requires further validation under different geological settings. (2) Additionally, although a uniform damage model based on the Weibull distribution was used to quantify damage with overstress <f> as an indicator, the heterogeneity and fracture characteristics of actual rock masses require further investigation. (3) This study has completed the engineering geological survey, laboratory experiments, and theoretical modeling analysis of the Mohuandang landslide concerning the creep behavior of sliding zone carbonaceous shale subjected to dry–wet cycles. Finite element modeling will be incorporated in future work to validate the model’s predictive capability.
Despite these limitations, this study remains highly reliable and significant. By introducing the Improved DNFVP model, this study not only investigates the nonlinear deformation of carbonaceous shale creep but also proposes a quantitative method for dry–wet cycling damage that aligns with rock damage mechanisms, providing a physically meaningful framework. The improved DNFVP model exhibits excellent correlation in fitting with the creep curves of carbonaceous mudstone, achieving an R2 value exceeding 95% and significantly outperforming classical creep models. Therefore, this model can be widely applied to slope stability assessment and provide practical guidance for landslide prediction and risk management.

5. Conclusions

This study investigates the shear creep behavior of the sliding zone (carbonaceous shale) under dry–wet cycles using the Mohuandang landslide in a limestone mining area as a case study. Based on the analysis of experimental results, the Improved DNFVP model is proposed. This model is validated and discussed using experimental data, leading to the following conclusions:
  • Key phenomena revealed by laboratory shear creep tests. At low deviatoric stress levels, within the viscoelastic stage, the creep deformation of the sliding zone (carbonaceous shale) exhibits a nonlinear increase with the degree of dry–wet cycles. Under dry–wet cycles, the material demonstrates significant creep strength degradation and structural damage.
  • Development of the Improved DNFVP model. To account for the effects of dry–wet cycles on the creep behavior of the sliding zone (carbonaceous shale), a quantitative damage approach was introduced. The Burgers model was modified by incorporating a fractional derivative, leading to the development of the creep equation for the Improved DNFVP model. Experimental data validated the model’s reliability, demonstrating that it effectively simulates a nonlinear increase in the creep strain with increasing dry–wet cycles.
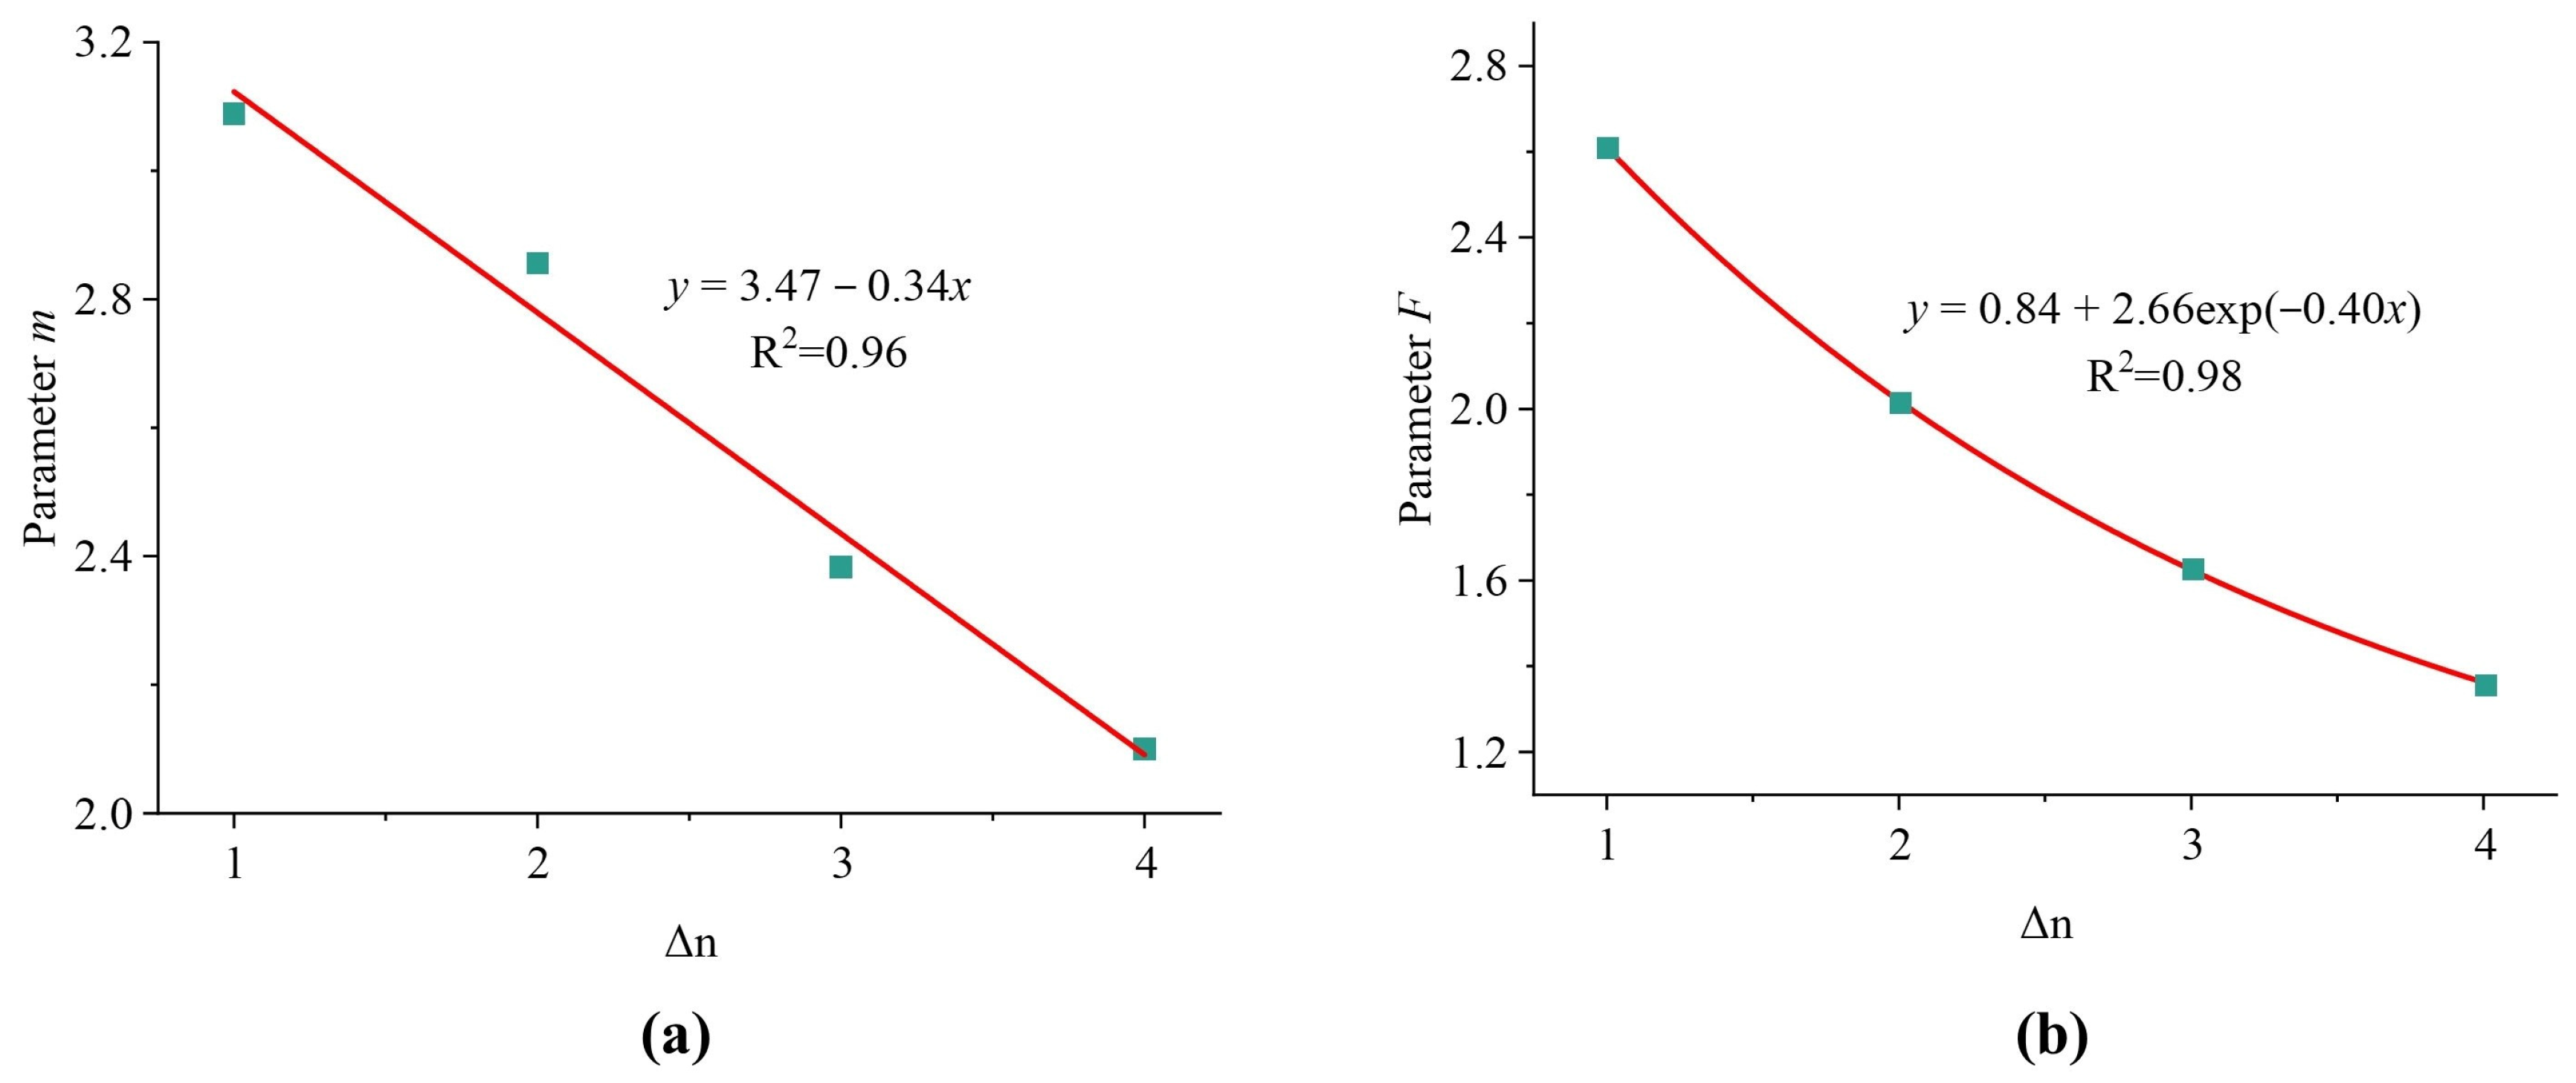
  • Analysis of damage propagation characteristics with dry–wet cycles. The Weibull distribution parameters m and F decrease with increasing dry–wet cycles, reflecting the degradation of rock strength quality due to damage propagation. We demonstrated that the proposed damage evolution equation is consistent with the rock damage mechanism and possesses clear physical significance.

Author Contributions

Conceptualization, B.H. and J.L.; Methodology, Z.Z.; Software, Z.Z. and K.C.; Validation, Z.Z. and J.S.; Investigation, J.S. and X.Z.; Writing—original draft, Z.Z., J.L., and X.Z.; Writing—review and editing, Z.Z., B.H., and J.L.; Visualization, Z.Z.; Supervision, J.L.; Project administration, B.H. and J.L.; Funding acquisition, B.H., J.L., and K.C. All authors have read and agreed to the published version of the manuscript.

Funding

This research was funded by the National Natural Science Foundation of China (Grant No. 42307252, U1802243), the Technology Projects of WUST Cultivate Innovation Teams (Grant No. 2018TDX01) and the Key Scientific Research Project of Colleges and Universities of Henan Province (Grant No. 24A620003). All financial support was greatly appreciated.

Data Availability Statement

The original contributions presented in this study are included in the article; further inquiries can be directed to the corresponding author.

Acknowledgments

The authors are grateful to the anonymous reviewers for their comments and suggestions which contributed to the further improvement of this paper.

Conflicts of Interest

The authors declare no conflicts of interest.

References

  1. Xu, C.; Sun, Q.; Yang, X. A study of the factors influencing the occurrence of landslides in the Wushan area. Environ. Earth Sci. 2018, 77, 406. [Google Scholar] [CrossRef]
  2. Tang, H.; Wasowski, J.; Juang, C.H. Geohazards in the three Gorges Reservoir Area, China–Lessons learned from decades of research. Eng. Geol. 2019, 261, 105267. [Google Scholar] [CrossRef]
  3. Xu, Q.; Li, W.; Liu, H.; Tang, R.; Chen, S.; Sun, X. Hysteresis effect on the deep-seated landslide by rainfall: The case of the Kualiangzi landslide, China. In Engineering Geology for Society and Territory-Volume 2: Landslide Processes; Springer: Cham, Switzerland, 2015. [Google Scholar]
  4. Sun, G.; Zheng, H.; Tang, H.; Dai, F. Huangtupo landslide stability under water level fluctuations of the Three Gorges reservoir. Landslides 2016, 13, 1167–1179. [Google Scholar] [CrossRef]
  5. Wang, S.; Wang, J.; Wu, W.; Cui, D.; Su, A.; Xiang, W. Creep properties of clastic soil in a reactivated slow-moving landslide in the Three Gorges Reservoir Region, China. Eng. Geol. 2020, 267, 105493. [Google Scholar] [CrossRef]
  6. Wang, X.-G.; Lian, B.-Q.; Wang, J.-D.; Feng, W.-K.; Gu, T.-F. Creep damage properties of sandstone under dry-wet cycles. J. Mt. Sci. 2020, 17, 3112–3122. [Google Scholar] [CrossRef]
  7. Liu, H.H.; Miao, H.B.; Chen, Z.W.; Huang, J.Y. Shear creep behaviors of sliding-zone soil of bedding landslide in Jurassic stratum in Three Gorges Reservoir area. Chin. J. Geotech. Eng. 2019, 41, 1573–1580. [Google Scholar]
  8. Lu, Y.; Jin, C.; Wang, Q.; Li, G.; Han, T. Deformation and failure characteristic of open-pit slope subjected to combined effects of mining blasting and rainfall infiltration. Eng. Geol. 2024, 331, 107437. [Google Scholar] [CrossRef]
  9. Do, T.N.; Wu, J.-H. Simulating a mining-triggered rock avalanche using DDA: A case study in Nattai North, Australia. Eng. Geol. 2020, 264, 105386. [Google Scholar] [CrossRef]
  10. Lian, B.; Wang, X.; Zhan, H.; Wang, J.; Peng, J.; Gu, T.; Zhu, R. Creep mechanical and microstructural insights into the failure mechanism of loess landslides induced by dry-wet cycles in the Heifangtai platform, China. Eng. Geol. 2022, 300, 106589. [Google Scholar] [CrossRef]
  11. Sun, Y.; Yu, C.; Jiang, S.; Chen, Y.; Wang, Z.; Duan, S.; Xie, J. Disintegration behaviors of red clay under wet-dry cycles. J. Rock Mech. Geotech. Eng. 2024. [Google Scholar] [CrossRef]
  12. Ng, C.W.W.; Peprah-Manu, D. Pore structure effects on the water retention behaviour of a compacted silty sand soil subjected to drying-wetting cycles. Eng. Geol. 2023, 313, 106963. [Google Scholar] [CrossRef]
  13. Zhong, Z.; Sheng, J.; Hu, B.; Li, J.; Wang, Z. Investigation of shear creep experiments and modelling of mud-shale under dry-wet cycles of rainfall. Phys. Scr. 2023, 99, 025010. [Google Scholar] [CrossRef]
  14. Yin, Z.; Zhang, X.; Liu, Y.; Yu, H.; Zhang, Q.; Li, X. A fractional-order damage creep model for grouting-reinforcement body under dry–wet cycle. Bull. Eng. Geol. Environ. 2023, 82, 172. [Google Scholar] [CrossRef]
  15. Qin, Z.; Liu, Y.; Pang, W.; Han, J.; Liu, W.; Feng, Q. A creep damage model for yellow sandstone under the action of wetting-drying cycles. Mech. Time-Depend. Mater. 2024, 28, 207–225. [Google Scholar] [CrossRef]
  16. Gong, F.; Yang, Y.; Li, P.; Wang, Z.; Zeng, B.; Jin, W.; Maekawa, K. Multi-physical analysis of saturation-dependent creep behavior for RC beam under sustained load and wet-dry cycles. Eng. Struct. 2024, 309, 117976. [Google Scholar] [CrossRef]
  17. Ye, B.; Qiu, H.; Tang, B.; Liu, Y.; Liu, Z.; Jiang, X.; Yang, D.; Ullah, M.; Zhu, Y.; Kamp, U. Creep deformation monitoring of landslides in a reservoir area. J. Hydrol. 2024, 632, 130905. [Google Scholar] [CrossRef]
  18. Li, Y.; Hu, X.; Zhang, H.; Zheng, H.; Xu, C. Nonlinear burgers model for sliding zone soil subjected to cyclic seepage pressure and its applications to the deformation analysis of landslide. Acta Geotech. 2025, 20, 743–763. [Google Scholar] [CrossRef]
  19. Shao, J.; Chau, K.; Feng, X. Modeling of anisotropic damage and creep deformation in brittle rocks. Int. J. Rock Mech. Min. Sci. Géoméch. Abstr. 2006, 43, 582–592. [Google Scholar] [CrossRef]
  20. Zhou, H.; Jia, Y.; Shao, J. A unified elastic–plastic and viscoplastic damage model for quasi-brittle rocks. Int. J. Rock Mech. Min. Sci. Géoméch. Abstr. 2008, 45, 1237–1251. [Google Scholar] [CrossRef]
  21. Vakili, A. An improved unified constitutive model for rock material and guidelines for its application in numerical modelling. Comput. Geotech. 2016, 80, 261–282. [Google Scholar] [CrossRef]
  22. Zhang, F.; Jiang, A.; Yang, X. Shear creep experiments and modeling of granite under dry-wet cycling. Bull. Eng. Geol. Environ. 2021, 80, 5897–5908. [Google Scholar] [CrossRef]
  23. Wang, R.; Li, L.; Simon, R. A model for describing and predicting the creep strain of rocks from the primary to the tertiary stage. Int. J. Rock Mech. Min. Sci. Géoméch. Abstr. 2019, 123, 104087. [Google Scholar] [CrossRef]
  24. Raza, A.; Khan, S.U.; Al-Khaled, K.; Khan, M.I.; Haq, A.U.; Alotaibi, F.; Mousa, A.A.A.; Qayyum, S. A fractional model for the kerosene oil and water-based Casson nanofluid with inclined magnetic force. Chem. Phys. Lett. 2022, 787, 139277. [Google Scholar] [CrossRef]
  25. Veeresha, P. The efficient fractional order based approach to analyze chemical reaction associated with pattern formation. Chaos Solitons Fractals 2022, 165, 112862. [Google Scholar] [CrossRef]
  26. Zheng, Y.; Shangguan, W.-B.; Liu, X.-A. Modeling of a quasi-zero static stiffness mount fabricated with TPU materials using fractional derivative model. Mech. Syst. Signal Process. 2022, 177, 109258. [Google Scholar] [CrossRef]
  27. Mshary, N.; Ahmed, H.M.; Rabie, W.B. Fractional Solitons in Optical Twin-Core Couplers with Kerr Law Nonlinearity and Local M-Derivative Using Modified Extended Mapping Method. Fractal Fract. 2024, 8, 755. [Google Scholar] [CrossRef]
  28. Borhan, J.R.M.; Miah, M.M.; Alsharif, F.; Kanan, M. Abundant Closed-Form Soliton Solutions to the Fractional Stochastic Kraenkel–Manna–Merle System with Bifurcation, Chaotic, Sensitivity, and Modulation Instability Analysis. Fractal Fract. 2024, 8, 327. [Google Scholar] [CrossRef]
  29. Chen, J.; Gong, L.; Meng, R. Application of Fractional Calculus in Predicting the Temperature-Dependent Creep Behavior of Concrete. Fractal Fract. 2024, 8, 482. [Google Scholar] [CrossRef]
  30. Zhou, H.; Wang, C.; Han, B.; Duan, Z. A creep constitutive model for salt rock based on fractional derivatives. Int. J. Rock Mech. Min. Sci. Géoméch. Abstr. 2011, 48, 116–121. [Google Scholar] [CrossRef]
  31. Wang, C.; Liu, J.; Cai, Y.; Chen, L.; Wu, Z.; Liu, J. Effects of Damage and Fractional Derivative Operator on Creep Model of Fractured Rock. Rock Mech. Rock Eng. 2024, 57, 9323–9341. [Google Scholar] [CrossRef]
  32. Adolfsson, K.; Enelund, M.; Olsson, P. On the fractional order model of viscoelasticity. Mech. Time-Depend. Mater. 2005, 9, 15–34. [Google Scholar] [CrossRef]
  33. Li, J.; Hu, B.; Sheng, J.; Huang, L. A Fractional-Order Creep-Damage Model for Carbonaceous Shale Describing Coupled Damage Caused by Rainfall and Blasting. Fractal Fract. 2024, 8, 459. [Google Scholar] [CrossRef]
  34. Huang, Z.; Zhang, W.; Zhang, H.; Zhang, J.-B.; Lu, X.-L. Study on the fatigue properties and constitutive model of siltstone under the coupled action of dry–wet cycles and cyclic loads. Soil Dyn. Earthq. Eng. 2023, 171, 107990. [Google Scholar] [CrossRef]
  35. Liu, J.; Chen, L.; Wang, C.; Man, K.; Wang, L.; Wang, J.; Su, R. Characterizing the mechanical tensile behavior of Beishan granite with different experimental methods. Int. J. Rock Mech. Min. Sci. Géoméch. Abstr. 2014, 69, 50–58. [Google Scholar] [CrossRef]
  36. Sun, C.; Jin, C.; Wang, L.; Ao, Y.; Zhang, J. Creep damage characteristics and local fracture time effects of deep granite. Bull. Eng. Geol. Environ. 2022, 81, 79. [Google Scholar] [CrossRef]
  37. Xu, T.; Zhou, G.; Heap, M.J.; Yang, S.; Konietzky, H.; Baud, P. The Modeling of Time-Dependent Deformation and Fracturing of Brittle Rocks Under Varying Confining and Pore Pressures. Rock Mech. Rock Eng. 2018, 51, 3241–3263. [Google Scholar] [CrossRef]
  38. GB/T 50123-2019; Standard for Geotechnical Testing Methods. Chinese Standard: Beijing, China, 2019.
  39. Maranini, E.; Brignoli, M. Creep behaviour of a weak rock: Experimental characterization. Int. J. Rock Mech. Min. Sci. Géoméch. Abstr. 1999, 36, 127–138. [Google Scholar] [CrossRef]
  40. Kachanov, L. Introduction to Continuum Damage Mechanics; Springer Science & Business Media: Berlin/Heidelberg, Germany, 2013; Volume 10. [Google Scholar]
  41. Perzyna, P. Fundamental problems in viscoplasticity. Adv. Appl. Mech. 1966, 9, 243–377. [Google Scholar]
  42. Liu, H.; Liu, J.; Zhang, S.; Feng, L.; Qiu, L. Experimental study on compression characteristics of fractured soft rock and its Mohr-Coulomb criterion. Theor. Appl. Fract. Mech. 2023, 125, 103820. [Google Scholar] [CrossRef]
  43. Zhao, Y.; Wang, Y.; Wang, W.; Wan, W.; Tang, J. Modeling of non-linear rheological behavior of hard rock using triaxial rheological experiment. Int. J. Rock Mech. Min. Sci. Géoméch. Abstr. 2017, 93, 66–75. [Google Scholar] [CrossRef]
  44. Brantut, N.; Heap, M.; Meredith, P.; Baud, P. Time-dependent cracking and brittle creep in crustal rocks: A review. J. Struct. Geol. 2013, 52, 17–43. [Google Scholar] [CrossRef]
  45. Liu, H.Z.; Xie, H.Q.; He, J.D.; Xiao, M.L.; Zhuo, L. Nonlinear creep damage constitutive model for soft rocks. Mech. Time-Depend. Mater. 2017, 21, 73–96. [Google Scholar] [CrossRef]
  46. Wang, J.; Wang, Z.; Yang, S. A coupled macro- and meso-mechanical model for heterogeneous coal. Int. J. Rock Mech. Min. Sci. Géoméch. Abstr. 2017, 94, 64–81. [Google Scholar] [CrossRef]
  47. Pourhosseini, O.; Shabanimashcool, M.; Sciences, M. Development of an elasto-plastic constitutive model for intact rocks. Int. J. Rock Mech. Min. Sci. 2014, 66, 1–12. [Google Scholar] [CrossRef]
  48. Skempton, A.W. Effective stress in soils, concrete and rocks. Sel. Pap. Soil Mech. 1984, 1032, 4–16. [Google Scholar]
  49. Tang, C.; Sciences, M. Numerical simulation of progressive rock failure and associated seismicity. Int. J. Rock Mech. Min. Sci. 1997, 34, 249–261. [Google Scholar] [CrossRef]
  50. Cai, W.; Dou, L.; Ju, Y.; Cao, W.; Yuan, S.; Si, G. A plastic strain-based damage model for heterogeneous coal using cohesion and dilation angle. Int. J. Rock Mech. Min. Sci. Géoméch. Abstr. 2018, 110, 151–160. [Google Scholar] [CrossRef]
  51. Kilbas, A.A.; Srivastava, H.M.; Trujillo, J.J. Theory and Applications of Fractional Differential Equations; Elsevier: Amsterdam, The Netherlands, 2006; Volume 204. [Google Scholar]
  52. Yang, C.; Zhu, Z.; Wang, J.; Deng, H.; Huang, D.; Tang, J. Damaged creep constitutive models of rock-like materials containing multiple flaws and their relationships to those of the intact materials. Theor. Appl. Fract. Mech. 2024, 130, 104306. [Google Scholar] [CrossRef]
  53. Fei, W.; Jie, L.; Quanle, Z.; Cunbao, L.; Jie, C.; Renbo, G. A triaxial creep model for salt rocks based on variable-order fractional derivative. Mech. Time-Depend. Mater. 2021, 25, 101–118. [Google Scholar] [CrossRef]
  54. Diethelm, K.; Ford, N. The Analysis of Fractional Differential Equations; Lecture Notes in Mathematics, 2010; Springer: Berlin/Heidelberg, Germany, 2004. [Google Scholar]
  55. Liang, C.; Liu, J.; Yang, J.; Xu, H.; Chen, Z.; Ran, L. A creep model for ultra-deep salt rock considering thermal-mechanical damage under triaxial stress conditions. J. Rock Mech. Geotech. Eng. 2024, 16, 588–596. [Google Scholar] [CrossRef]
Figure 1. Location of the study area. (a) Location of Mohuandang landslide; (b) landslide area.
Fractalfract 09 00236 g001
Figure 2. Geological conditions of Mohuandang landslide. (a) Engineering geological composition of A-A’ before landslide; (b) sliding zone.
Fractalfract 09 00236 g002
Figure 3. Soft rock shear creep test system. (a) Testing system; (b) shear box; and (c) seepage loading device.
Fractalfract 09 00236 g003
Figure 4. Loading procedure for creep tests.
Fractalfract 09 00236 g004
Figure 5. Creep strain under different dry–wet cycles.
Fractalfract 09 00236 g005
Figure 6. Creep stabilization curve. (a) The creep stabilization curve as a case of Δn = 1. (b) Creep stabilization curve under different dry–wet cycles.
Fractalfract 09 00236 g006
Figure 7. Increase in creep strain under dry–wet cycles at the same stress level: (a) 0.34 MPa; (b) 1.40 MPa.
Fractalfract 09 00236 g007
Figure 8. Creep strain with dry–wet cycles during the viscoelastic stage.
Fractalfract 09 00236 g008
Figure 9. Damage characteristics with cumulative dry–wet cycles n. (a) Long-term strength of rock. (b) Damage factor Dd-w.
Fractalfract 09 00236 g009
Figure 10. Microstructure of carbonaceous shale under dry–wet cycles. (a) Δn = 0. (b) Δn = 2. (c) Δn = 4.
Fractalfract 09 00236 g010
Figure 11. Variation in the creep strain rates during the secondary stage.
Fractalfract 09 00236 g011
Figure 12. Change in Mohr–Coulomb circles on dry–wet cycles n.
Fractalfract 09 00236 g012
Figure 13. Schematic representations of creep model. (a) Burger model. (b) Improved DNFVP model.
Fractalfract 09 00236 g013
Figure 14. Illustration of internal stress path associated with the dry–wet cycles in the Mohr plane.
Fractalfract 09 00236 g014
Figure 15. Validation of experimental data and models. (a) A stress loading level of 0.34 MPa. (b) A stress loading level of 1.40 MPa. (c) A stress loading level of 1.78 MPa.
Fractalfract 09 00236 g015aFractalfract 09 00236 g015b
Figure 16. Evolution of overstress <f> versus dry–wet cycles at each applied stress level: (a) 0.34 MPa; (b) 0.72 MPa; (c) 1.06 MPa; and (d) 1.40 MPa.
Fractalfract 09 00236 g016
Figure 17. Evolution of damage propagation. (a) Damage propagation with <f>. (b) Damage propagation with shear stress.
Fractalfract 09 00236 g017
Figure 18. Evolution of model parameters with dry–wet cycles. (a) Parameter m. (b) Parameter F.
Fractalfract 09 00236 g018
Figure 19. Sensitivity analysis of the Improved DNFVP constitutive parameters. (a) Parameter β1. (b) Parameter β2. (c) Parameter ω.
Fractalfract 09 00236 g019
Table 1. Experiment scheme.
SamplesNormal Pressure (MPa)Shear Strength τf (MPa)Δn 1Loading Shear Stress at Each Level (MPa)
0.13τf0.27τf0.40τf0.53τf0.67τf0.80τf
ST-000.62.6500.340.721.061.41.782.12
ST-011
ST-022
ST-033
ST-044
1 Δn is the number of dry–wet cycles at each level.
Table 3. The parameters of the Improved DNFVP model.
Stress Loading LevelDeviatoric Stress (MPa)Ee (GPa)Eve (GPa)ηve (GPa·hβ1)β1β2ωηvp
(GPa·hβ2)
1st0.340.321.061.200.068///
4th1.400.3812.4510.080.152///
5th1.780.4314.5412.250.1630.483.115.32 × 106
Table 4. The parameters of the DNFVP model.
Stress Loading LevelDeviatoric Stress (MPa)Ee (GPa)ηve
(GPa·hβ1)
β1β2ωηvp
(GPa·hβ2)
1st0.340.321.200.066///
4th1.400.3710.080.153///
5th1.780.4412.250.1650.503.11/
Table 5. The parameters of the Burger model.
Stress Loading LevelDeviatoric Stress (MPa)Ee (GPa)Eve (GPa)ηve
(GPa·hβ1)
ηv
(GPa·hβ1)
1st0.340.321.060.69176.23
4th1.400.3812.4517.07591.72
5th1.780.4314.5415.892612.30
Disclaimer/Publisher’s Note: The statements, opinions and data contained in all publications are solely those of the individual author(s) and contributor(s) and not of MDPI and/or the editor(s). MDPI and/or the editor(s) disclaim responsibility for any injury to people or property resulting from any ideas, methods, instructions or products referred to in the content.

