Abstract
The pore–fracture structure of ultra-deep coal is critical for evaluating resource potential and guiding the exploration and development of deep coalbed methane (CBM). In this study, a coal sample was obtained from the Gaogu-4 well at a depth of 4369.4 m in the Shengli Oilfield of Shandong, China. A comprehensive suite of characterization techniques, including Field Emission Scanning Electron Microscopy (FE-SEM), X-ray diffraction (XRD), Mercury Intrusion Porosimetry (MIP), Low-temperature Nitrogen Adsorption (LT-N2GA), and Low-pressure CO2 Adsorption (LP-CO2GA), were employed to investigate the surface morphology, mineral composition, and multi-scale pore–fracture characteristics of the ultra-deep coal. Based on fractal geometry theory, four fractal dimension models were established, and the pore structure parameters were then used to calculate the fractal dimensions of the coal sample. The results show that the ultra-deep coal surface is relatively rough, with prominent fractures and limited pore presence as observed under FE-SEM. Energy Dispersive Spectrometer (EDS) analysis identified the elements such as C, O, Al, Si, S, and Fe, thus suggesting that the coal sample contains silicate and iron sulfide minerals. XRD analysis shows that the coal sample contains kaolinite, marcasite, and clinochlore. The multi-scale pore–fracture structure characteristics indicate that the ultra-deep coal is predominantly composed of micropores, followed by mesopores. Macropores are the least abundant, yet they contribute the most to pore volume (PV), accounting for 70.9%. The specific surface area (SSA) of micropores occupies an absolute advantage, accounting for up to 97.46%. Based on the fractal model, the fractal dimension of the coal surface is 1.4372, while the fractal dimensions of the micropores, mesopores, and macropores are 2.5424, 2.5917, and 2.5038, respectively. These results indicate that the surface morphology and pore–fracture distribution of the ultra-deep coal are non-uniform and exhibit statistical fractal characteristics. The pore–fracture structure dominated by micropores in ultra-deep coal seams provides numerous adsorption sites for CBM, thereby controlling the adsorption capacity and development potential of deep CBM.
1. Introduction
As a clean energy, CBM recovery can reduce dependence on fossil fuels, promote the comprehensive utilization of coal resources, enhance energy efficiency, and contribute to the realization of green, low-carbon development [1,2]. Presently, commercial CBM development has been achieved in 14 countries of the whole world, and the top 4 countries with major CBM production are Australia, the United States, Canada, and China, respectively. Significant progress has been made in the exploration and development of CBM and, in the case of China [3,4], particularly with the discovery of several high-yield CBM wells in the eastern margin of the Ordos Basin, which demonstrates the vast potential of deep CBM resources [5]. The pores and fractures in coal serve as the primary storage sites and migration pathways for CBM [6,7]. Their size, shape, distribution, and connectivity directly influence processes such as adsorption, desorption, diffusion, and seepage, ultimately determining the reserves and exploitability of CBM.
Currently, the characterization of pore–fracture structure of coal primarily relies on image observation methods, fluid intrusion techniques, and non-destructive characterization methods. In image observation, techniques such as Scanning Electron Microscopy (SEM), optical microscopy, atomic force microscopy (AFM), and CT imaging allow direct visualization of pore–fracture structure of coal, morphology, and connectivity, and also enable exploration of the formation mechanisms of these pores and fractures [8,9,10]. However, the data obtained from these methods often suffer from insufficient statistical representativeness, hindering quantitative characterization [11,12]. Among fluid intrusion methods, techniques such as MIP, LT-N2GA, and LP-CO2GA are commonly used. MIP is mainly used to characterize larger pores with diameters greater than 50 nm, while LT-N2GA is employed for pores in the range of 2–50 nm, and LP-CO2GA focuses on pores with diameters below 2 nm. Fractal theory, with its advantages of practicality and simplicity, has become a significant method for investigating the fractal characteristics of coal reservoirs and explaining the complexity of pore–fracture structure of coal. A range of fractal models have been developed, including the Sierpinski model, the Frenkel–Halsey–Hill (FHH) model, the Menger model, the thermodynamic model, and the multifractal model [13,14,15]. Furthermore, the current studies demonstrated that the structure of pore–fracture in coal displays obvious fractal characteristics [16,17], which directly dominates the fractal properties on the adsorption and transport of CBM [18,19].
In recent years, numerous scholars have integrated pore–fracture characterization techniques with fractal theory to study deep coal seams, resulting in valuable findings. For instance, Wei et al. (2021) [20]. conducted an extensive study to investigate the pore structure and methane adsorption capacity of deep-buried coals from the Panji Deep Area in the Huainan Coalfield, China. A range of experimental techniques, including MIP, N2/CO2 adsorption, FE-SEM, and methane adsorption, were employed. The results revealed that the deep-buried coals exhibit a variety of pore types and microfractures. Micropores were found to contribute the majority of the SSA, whereas macropores predominantly governed the PV. Wang et al. (2024) [21] investigated deep coal samples from the DJ57 well using FE-SEM, LT-N2GA, LP-CO2GA, MIP, and micro-CT methods for quantitative characterization. Their findings revealed a variety of pore types, including primarily organic matter pores, inorganic pores (intraparticle and interparticle pores), and microfractures, with a strong connectivity network formed by the coexistence of micropores and microfractures. Zhang et al. (2024) [22] utilized X-ray diffraction (XRD), SEM, MIP, and computed tomography (CT) scanning to analyze the pore–fracture networks in deep coal samples from the Shangwan Coal Mine. They found that tectonically deformed coal exhibited more complex fissure morphologies and enhanced connectivity compared to primary structural coal, with fractal dimensions increasing as measurement scales decreased. Their study highlighted the importance of multi-scale fractal models in predicting porosity and volume fractal dimensions, thereby providing a scientific basis for coal mine safety and gas control. Similarly, Li et al. (2024) [23] investigated the full-aperture pore structures of deep coal seams using MIP, LT-N2GA, and LP-CO2GA methods. They observed that macropores dominated the pore volume distribution, whereas micropores and mesopores contributed significantly to the SSA. Their findings indicated that coal metamorphism significantly influenced pore structure, as evidenced by a nonlinear decrease in micropore volume and surface area with increasing volatile matter content. The study also employed sponge, FHH, and density function models to analyze pore complexity, revealing that higher degrees of coal metamorphism led to more regular microporous structures. Current research on coal PSD, morphology, and connectivity, alongside the application of fractal dimensions and models, has provided substantial theoretical foundations and technical support for CBM development and exploration. These studies have enhanced the understanding of gas adsorption–desorption dynamics, which are critical for optimizing CBM extraction and ensuring coal mine safety. However, most research on deep coal seams has focused on depths up to 3000 m, and studies on ultra-deep coal seams exceeding 4000 m remain scarce. Therefore, understanding the multiscale pore–fracture structure and fractal characteristics of ultra-deep coal seams (>4000 m) is crucial for evaluating the potential of ultra-deep CBM resources and guiding exploration and development efforts. With increasing CBM extraction depths, future research should further investigate variations in coal pore structures and fractal characteristics under diverse geological conditions at greater depths. Additionally, the impact of these variations on CBM development particularly concerning gas storage capacity, permeability, and extraction efficiency should be thoroughly examined to enhance the feasibility and sustainability of deep CBM exploitation.
By FE-SEM, XRD, MIP, LT-N2GA, and LP-CO2GA, this study investigates ultra-deep coal samples sourced from depths exceeding 4000 m, with the aim of analyzing surface morphology, mineral composition, and multi-scale pore structure. Additionally, pore structure parameters, including PV, SSA, and pore size distribution (PSD), are systematically evaluated. Meanwhile, based on fractal theory, quantitative analysis of the surface roughness and heterogeneity of the multi-scale pore–fracture structure of the coal is conducted, aiming to provide more precise data to support the exploration, development, and utilization of ultra-deep CMB.
2. Samples and Methods
2.1. Samples
Coal samples examined in this study were collected from the Gaogu-4 well in the Shengli Oilfield, Shandong Province, China, at a depth of 4369.36 m within the deep coal seam of the Shanxi Formation. The sampling well section spans from 4364.50 m to 4403.50 m, with a total stratigraphic thickness of 39 m. This section comprises 16.50 m of dark mudstone and 4.00 m of coal seam. Together, the thicknesses of the mudstone and coal seam account for 52.6% of the total stratigraphic thickness of this section. The mudstone, acting as a low-permeability caprock, inhibits the upward migration of coalbed methane, thereby facilitating its accumulation within the coal seam. The lithology of the well section is predominantly composed of light gray fine sandstone, fluorescent fine sandstone, and argillaceous sandstone, intercalated with dark gray mudstone, thin layers of black coal, grayish-black carbonaceous mudstone, and dark gray sandy mudstone.
Proximate analysis of the coal samples was performed in accordance with the Chinese standard GB/T 212-2008 [24], with the results summarized in Table 1. The analysis indicates that the coal sample exhibits a moisture content of 0.98%, an ash yield of 25.33%, a volatile matter content of 32.28%, and a fixed carbon content of 50.06%.

Table 1.
Proximate analysis of coal sample.
2.2. Experimental Methods
The International Union of Pure and Applied Chemistry (IUPAC) pore size classification scheme, i.e., micropores (<2 nm), mesopores (2–50 nm), and macropores (>50 nm), was applied in this study [25].
The qualitative characterization of the coal samples was primarily achieved through direct observation and descriptive analysis of pores using SEM. In this study, high-resolution imaging was conducted using a ZEISS Sigma 500 FE-SEM (Carl Zeiss AG, Oberkochen, Germany) to obtain detailed SEM images of the samples. The coal samples were prepared into small pieces with dimensions less than 1 cm. After drying in an oven at 60 °C for 24 h, the samples were subjected to Scanning Electron Microscopy (SEM) analysis. A relatively flat surface of the coal sample was selected for testing. A series of FE-SEM images captured at various resolutions were used to directly examine the morphological features of pores, the spatial relationships between pores and particles, and the connectivity of pore networks [21,26]. Additionally, the elemental composition of coal, including the types and contents of elements, was determined through EDS analysis.
XRD was a widely utilized technique for characterizing crystal structures, facilitating the determination of mineral composition and content in coal samples. In this study, a D8 ADVANCE X-ray diffractometer (Bruker AXS, Karlsruhe, Germany) was employed to analyze the coal samples. The instrument operated at a scanning speed of 10°/min, covering an angular range from 10° to 80°. Prior to analysis, the coal samples were sectioned into blocks not exceeding dimensions of 2 cm × 1 cm × 1 cm and positioned directly onto the diffractometer stage.
MIP determinations were conducted employing a MicroActive AutoPore V 9600 mercury porometer (Micromeritics Instrument Corp., Norcross, GA, USA). The instrument is capable of applying a maximum pressure of approximately 60,000 psi (equivalent to 414 MPa), corresponding to a minimum detectable pore size of approximately 3 nm. Prior to the experiment, the coal samples were subjected to drying in an oven at 60 °C for more than 48 h to remove any moisture content. Furthermore, a vacuum condition was meticulously maintained within the instrument throughout the testing process. Based on the data obtained from the automated recording of the mercury intrusion process, the relationship between intrusion pressure and the corresponding PD (pore diameter) was determined using the Washburn equation [27]. Consequently, pore structure parameters, including PV, SSA, and PSD, were derived from the data for the coal samples.
LT-N2GA experiments were performed using a Anton Paar Nova 600 surface area analyzer (Anton Paar GmbH, Graz, Austria), with high-purity nitrogen as the adsorbate. Coal samples, with particle sizes ranging from 60 to 80 mesh (1–2 g), were degassed under vacuum at 105 °C for 12 h to remove moisture. Nitrogen adsorption–desorption isotherms were obtained at 77 K, with relative pressures (P/P0) ranging from 0.001 to 0.999. The relationship between nitrogen adsorption and relative pressure was established. PV, SSA, and PSD were derived using the Brunauer–Emmett–Teller (BET) model and the Barrett–Joyner–Halenda (BJH) model [28,29,30].
LP-CO2GA experiments were conducted using the same instrument employed for LT-N2GA. Given that the molecular diameter of CO2 is only 0.33 nm, CO2 adsorption is particularly effective in characterizing the pore structure of micropores [18]. Prior to experimentation, the samples were ground to a particle size of 60–80 mesh and subsequently dried in an oven at 105 °C for 8 h. Thereafter, approximately 1–2 g of the ground sample was placed in a container and degassed for 16 h to remove moisture. Adsorption measurements were performed at 273 K, with relative pressures ranging from 0.0001 to 0.03. Data from the CO2 adsorption experiments were analyzed using the Density Functional Theory (DFT) model, which effectively describes gas adsorption behavior and phase transitions at the molecular scale, thus providing more accurate determinations of PV, SSA, and PSD for micropores [31,32].
2.3. Fractal Theory
The fractal dimension is widely regarded as a critical parameter for characterizing the complexity of coal pore networks [33]. Several types of fractal dimensions exist, including the topological dimension, the Hausdorff dimension, the box-counting dimension, and the self-similarity dimension, among others. The box-counting dimension has been demonstrated to be an effective method for characterizing the heterogeneity of PSD on the coal surface. As is well known, PSD in coal, as observed in SEM images, is heterogeneous and exhibits fractal characteristics [34,35,36]. In this study, the widely adopted box-counting method was employed. By covering a binary image with boxes of length δ, the fractal dimension is calculated using Equation (1):
where D represents the fractal dimension and N(δ) denotes the number of boxes required to completely cover the binary images, Equation (1) can generally be expressed as follows:
Thus, the box-counting dimension can be determined from the slope of a linear plot of ln(N(δ)) against lnδ [14].
The application of the Menger sponge model in the calculation of the fractal dimension of porous media has been extensively validated by numerous researchers. In this study, the model is utilized to calculate the fractal dimension derived from MIP, with the most commonly employed mathematical expression represented by Equation (3):
where P represents the mercury intrusion pressure in MPa, V denotes the cumulative volume of mercury intruded at a given pressure P in units of cm3/g, D is the fractal dimension, and B is the slope of the and ln P scatter plot fitting curve [37,38].
The FHH model, based on gas adsorption isotherms, is a fundamental approach for quantifying the fractal dimension of adsorptive pores in coal reservoirs. This model has been widely employed to correlate gas adsorption behavior with the fractal surfaces of solid porous media. The nitrogen adsorption–desorption isotherms of coal exhibit a distinct hysteresis loop, indicative of the formation of micropores and mesopores [39,40]. These observations are consistent with the pore size range relevant to the FHH model. Therefore, the FHH model is applied to determine the fractal dimension of the samples [41]. The FHH model can be expressed as shown in Equations (4) and (5):
where V represents the adsorption volume at equilibrium pressure P, expressed in cm3/g; P0 denotes the saturation vapor pressure, in MPa; and C is a constant. When plotting the data from LT-N2GA as lnV versus ln(), the slope of the fitted line is designated as k, while D represents the fractal dimension.
The calculation of the fractal dimension of micropores using LP-CO2GA data involves various models, including the V-S model and the Sierpinski model, among others. The V-S model, initially proposed by Mandelbrot, determines the fractal dimension of pores by analyzing the correlation between PV and SSA in solid porous media. As a porous sedimentary material, previous research has shown that the V-S model is distinguished by its high computational accuracy, as well as its exceptional fitting precision and stability when applied to the characterization of coal pore structure. The V-S model is particularly effective in determining the fractal dimension of micropores [42,43]. The equation for calculating the fractal dimension of micropores is given in Equation (6):
where V represents the cumulative PV, measured in cm3/g; S denotes the cumulative SSA, expressed in m2/g; D signifies the fractal dimension; and K is a constant.
3. Results and Discussion
3.1. FE-SEM Results and Fractal Characteristics
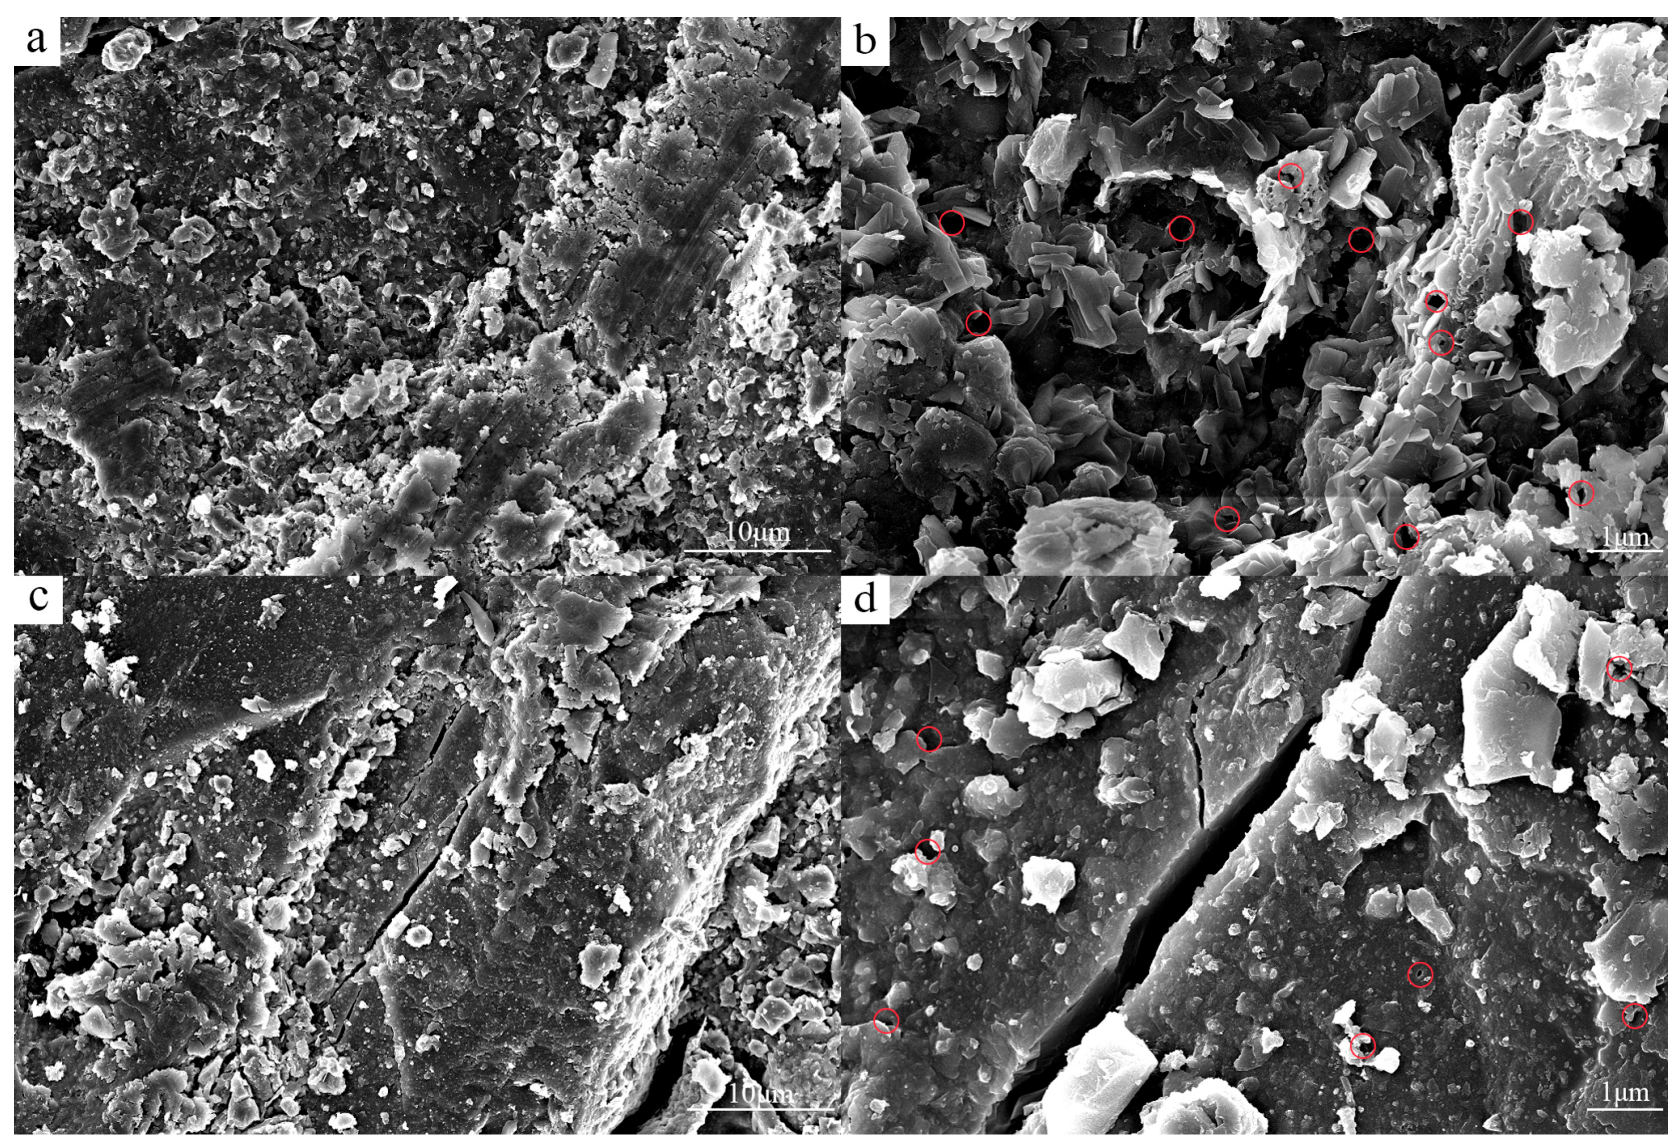
The results of FE-SEM observations are presented in Figure 1. As shown in Figure 1a,b, coal samples exhibit a complex pore structure, with pore sizes ranging from nanometers to micrometers. These pores exhibit diverse shapes, including circular, elliptical, and irregular forms, and can either be interconnected or isolated, significantly influencing the adsorption and permeability properties of coal. Figure 1c,d also reveal the presence of microfractures within the coal samples. These microfractures vary in shape, size, and origin, particularly in flaky minerals, where numerous long, narrow, plate-like microfractures with one open end are developed. Well-developed open microfractures exhibit excellent connectivity [44]. The presence of these microfractures can significantly enhance the permeability of deep coal reservoirs locally, providing effective space and pathways for the transformation of adsorbed gas to free gas and for gas migration.
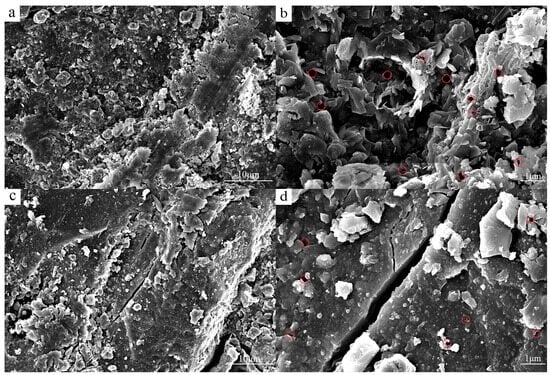
Figure 1.
FE-SEM images of coal sample: (a) is from sampling point A at 1000× magnification; (b) is from sampling point B at 5000× magnification, with red circles indicating pores; (c) is from sampling point C at 1000× magnification; (d) is from sampling point D at 5000× magnification, with red circles indicating pores.
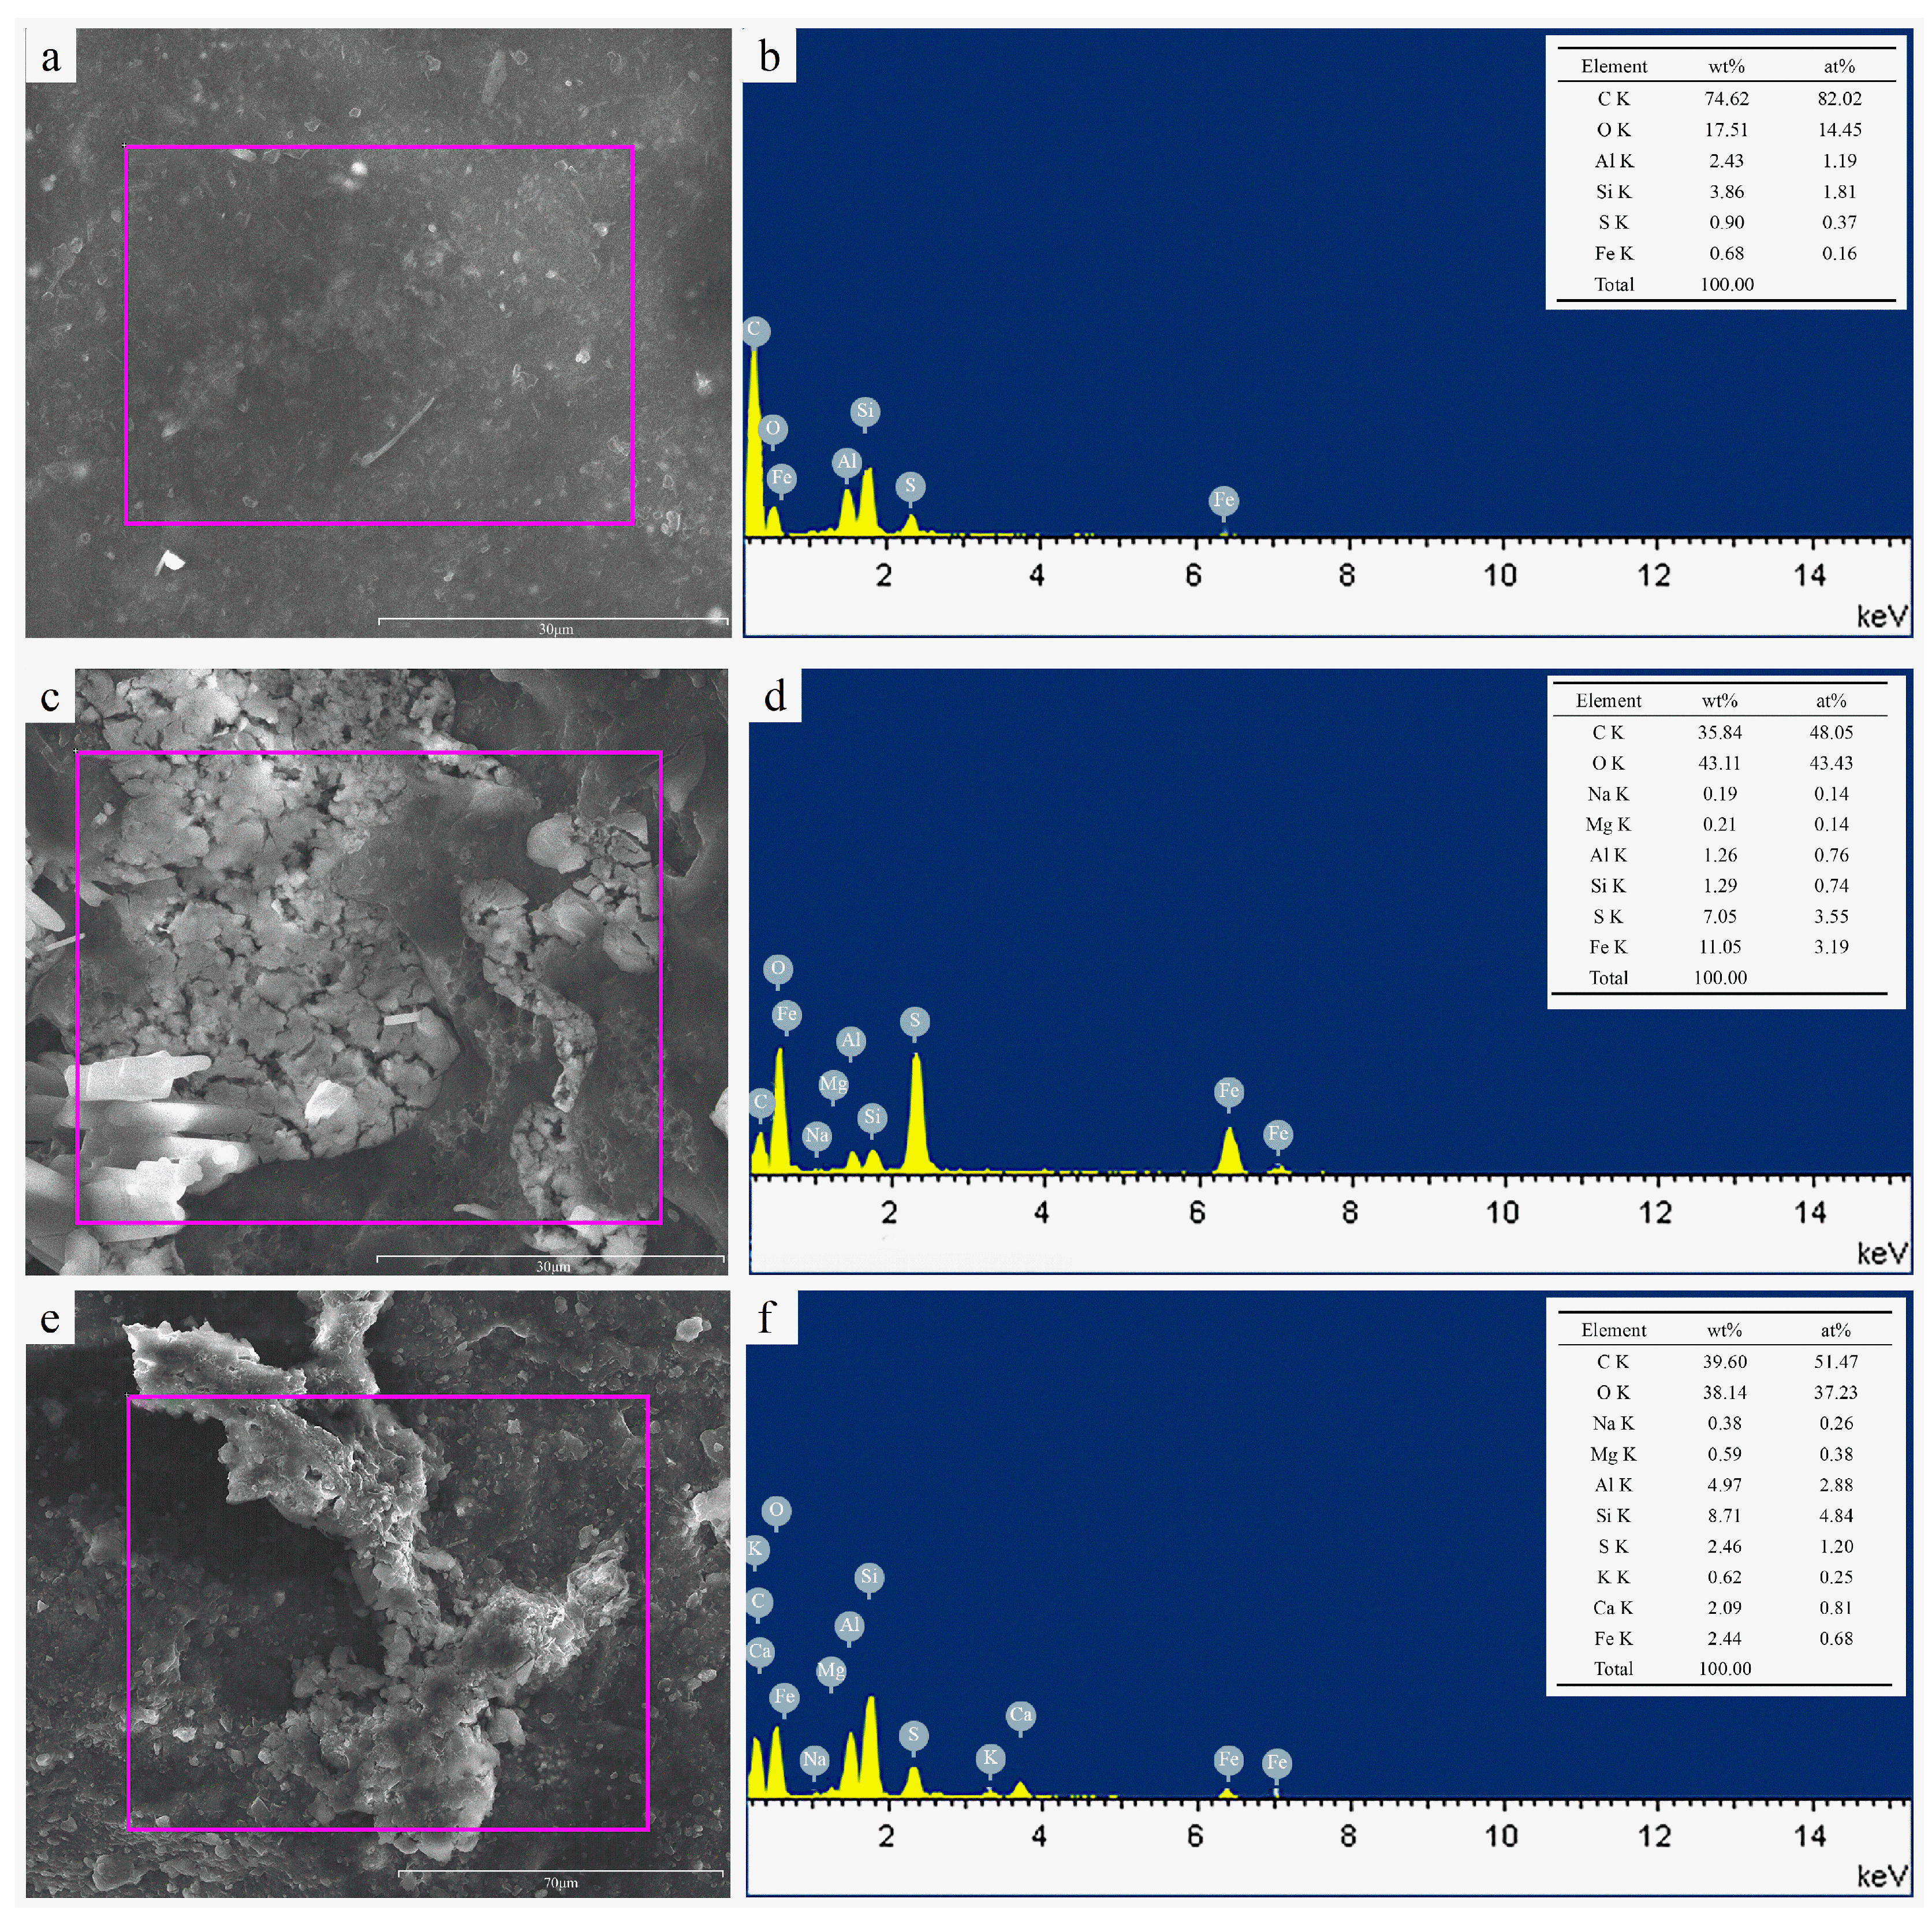
The Energy Dispersive X-ray Spectroscopy (EDS) analysis using FE-SEM can quantitatively analyze the mineral elements in the coal samples. As shown in Figure 2, three distinct regions of the coal sample were chosen for microscopic analysis. The results reveal significant variations in morphological characteristics, elemental composition, and mineral occurrence, emphasizing the heterogeneity of multiphase components in coal and the complexity of the diagenetic environment. The detailed analysis is presented as follows: As shown in Figure 2a,b, this region of the coal sample primarily consists of a coal matrix, with major elements including C, O, Al, and Si, and minor amounts of S and Fe. Based on the elemental composition, this region is inferred to be dominated by silicate minerals, with trace amounts of iron sulfide minerals. As shown in Figure 2c,d, this region of the coal sample is characterized by the presence of C, O, S, and Fe as the main elements, with lower content of Al and Si and trace amounts of Na and Mg. The elemental composition suggests that this region is predominantly composed of iron sulfide minerals, with a minor presence of silicate minerals. As shown in Figure 2e,f, the elemental composition of this region is more complex, primarily consisting of C (39.60 wt%), O (38.14 wt%), Al (4.97 wt%), Si (8.71 wt%), S (2.46 wt%), Ca (2.09 wt%), and Fe (2.44 wt%), with trace amounts of Na (0.38 wt%), Mg (0.59 wt%), and K (0.62 wt%). Based on the elemental distribution, it is inferred that this region contains both iron sulfide minerals and silicate minerals, with a possible presence of minor carbonate minerals. The results of EDS analysis indicate that the ultra-deep coal contains various minerals (mainly silicate and iron sulfide minerals), which may occupy pore spaces, thereby reducing total porosity. This reduction in porosity may, in turn, decrease the storage capacity and mobility of CBM.
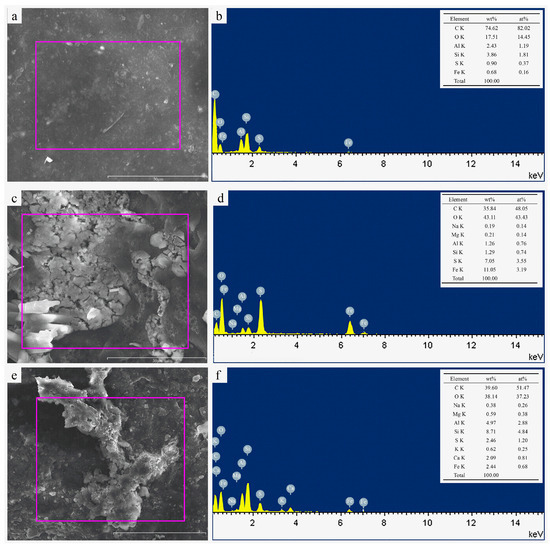
Figure 2.
EDS analysis results: (a) Secondary electron images of the first coal sample; (b) EDS analysis results in the Marked Region (a); (c) Secondary electron images of the second coal sample; (d) EDS analysis results in the Marked Region (c); (e) Secondary electron images of the third coal sample; (f) EDS analysis results in the Marked Region (e).
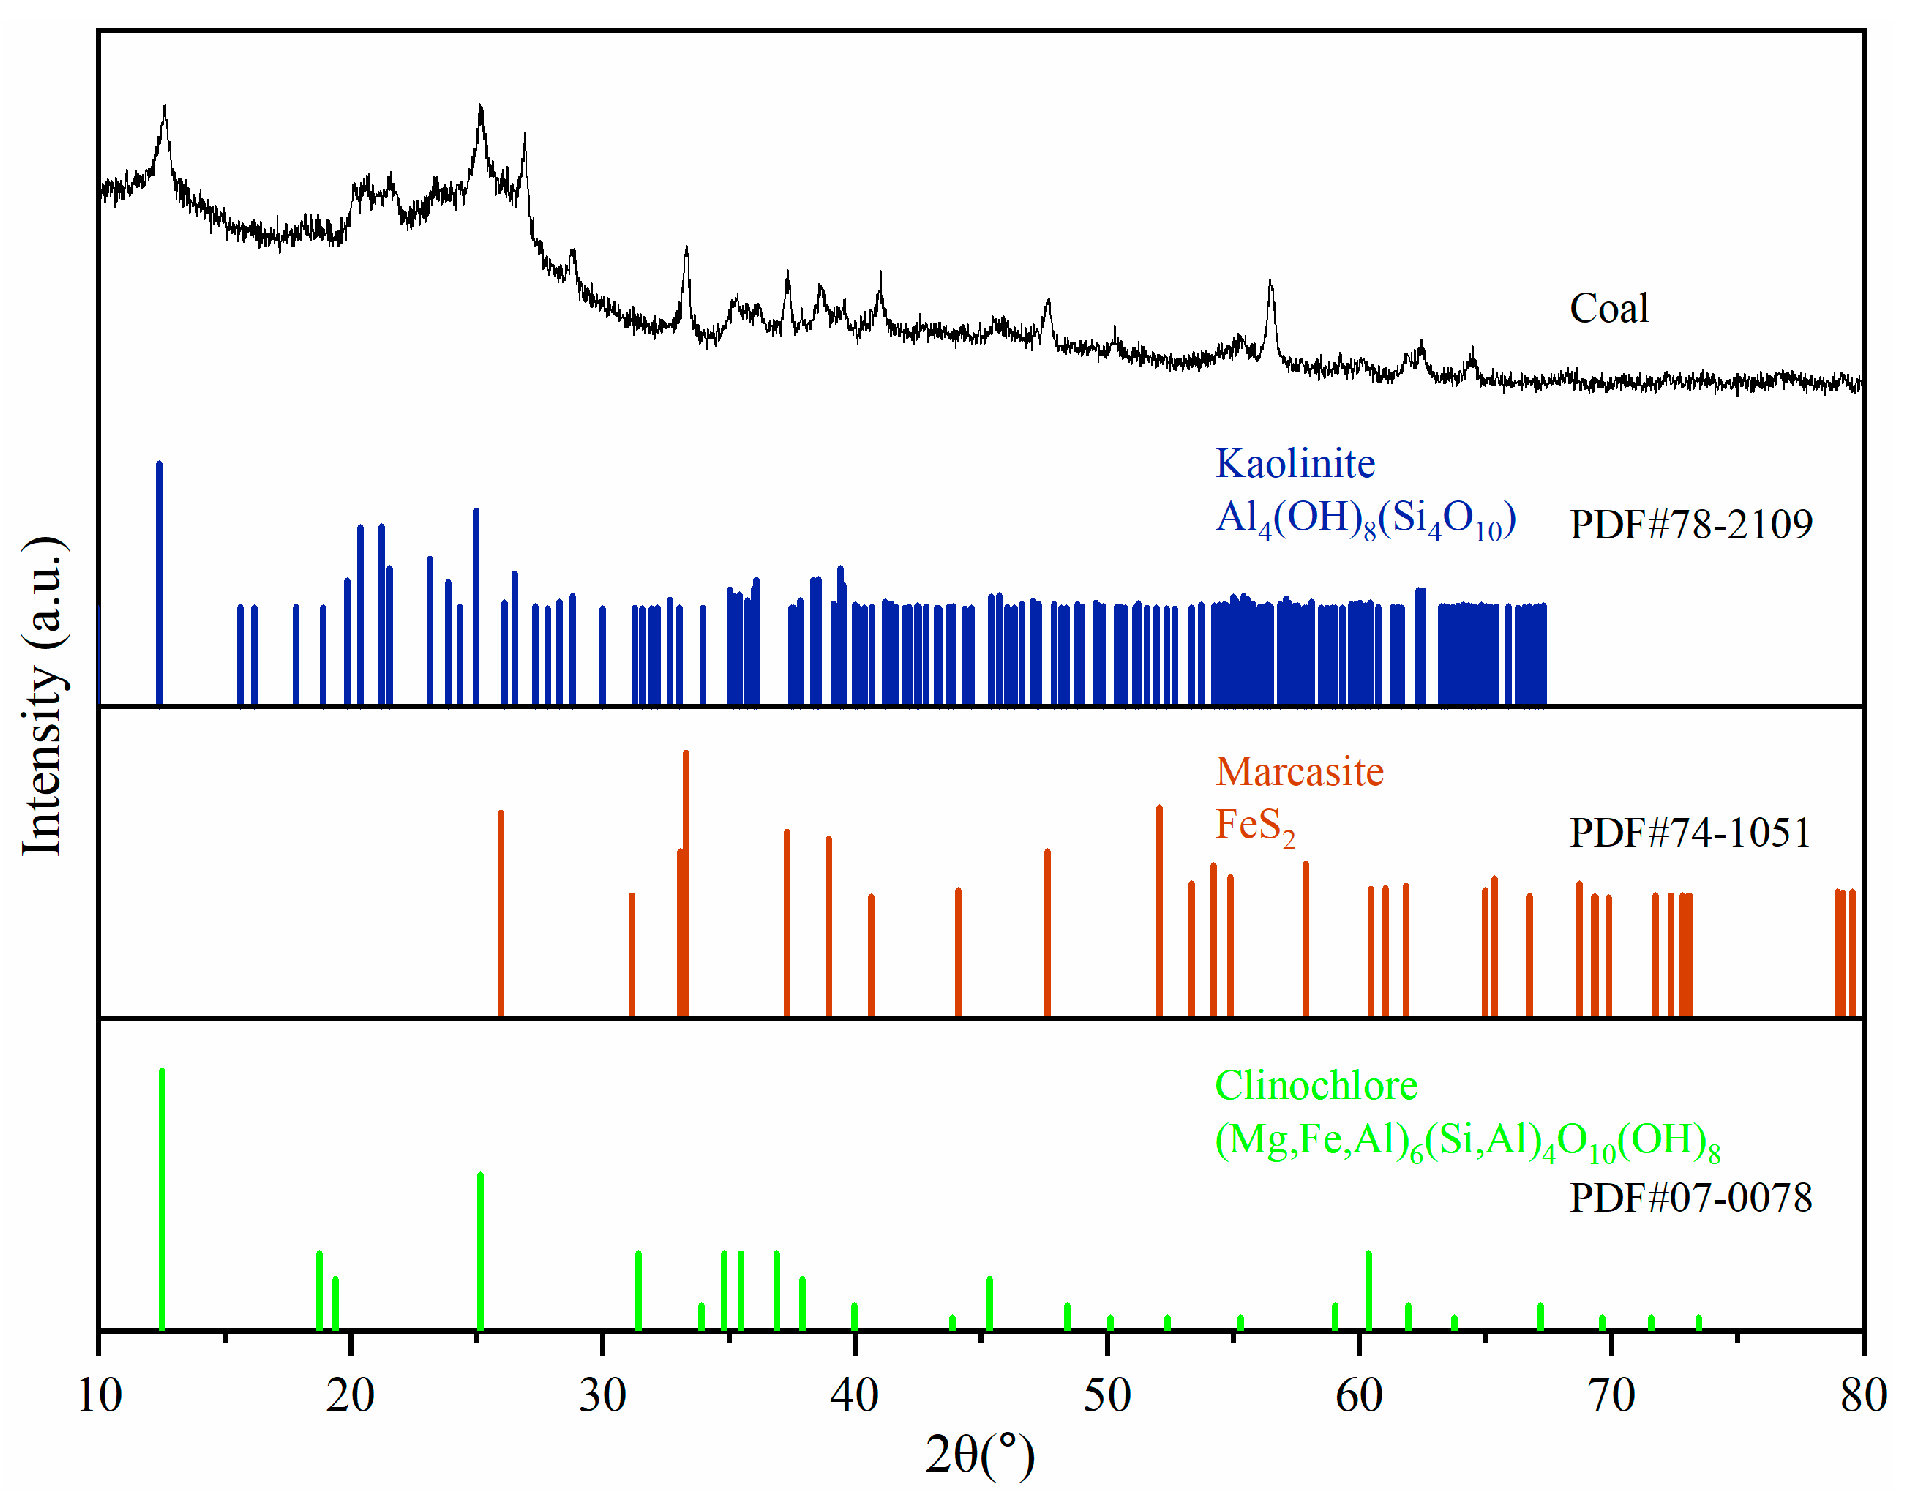
To further determine the mineral composition of coal samples, XRD analysis was performed, and the mineral types were semi-quantitatively assessed using Jade 6.0 software (Materials Data, Inc., Livermore, CA, USA). As depicted in Figure 3, three minerals were identified in the coal samples: kaolinite (Al4(OH)8(Si4O10), PDF#78-2109), marcasite (FeS2, PDF#74-1051), and clinochlore ((Mg,Fe,Al)6(Si,Al)4O10(OH)8, PDF#07-0078), corresponding to silicate, sulfide, and carbonate mineral categories, respectively. These minerals exert complex influences on the pore structure of coal samples, exhibiting both beneficial and detrimental effects. Kaolinite can generate specific pores but may also impair pore connectivity through adsorption and swelling. Marcasite may occlude pores, and its oxidation can further modify the pore structure. As a silicate mineral, clinochlore tends to fill or coat the pores and fractures within coal. This filling effect significantly reduces the porosity and connectivity of coal, thereby influencing the adsorption and desorption capacity of coalbed methane. The presence and transformation of these minerals collectively shape the coal pore structure, influencing permeability, reservoir characteristics, and fluid flow properties, ultimately affecting CMB extraction [45,46].

Figure 3.
XRD spectra of coal sample.
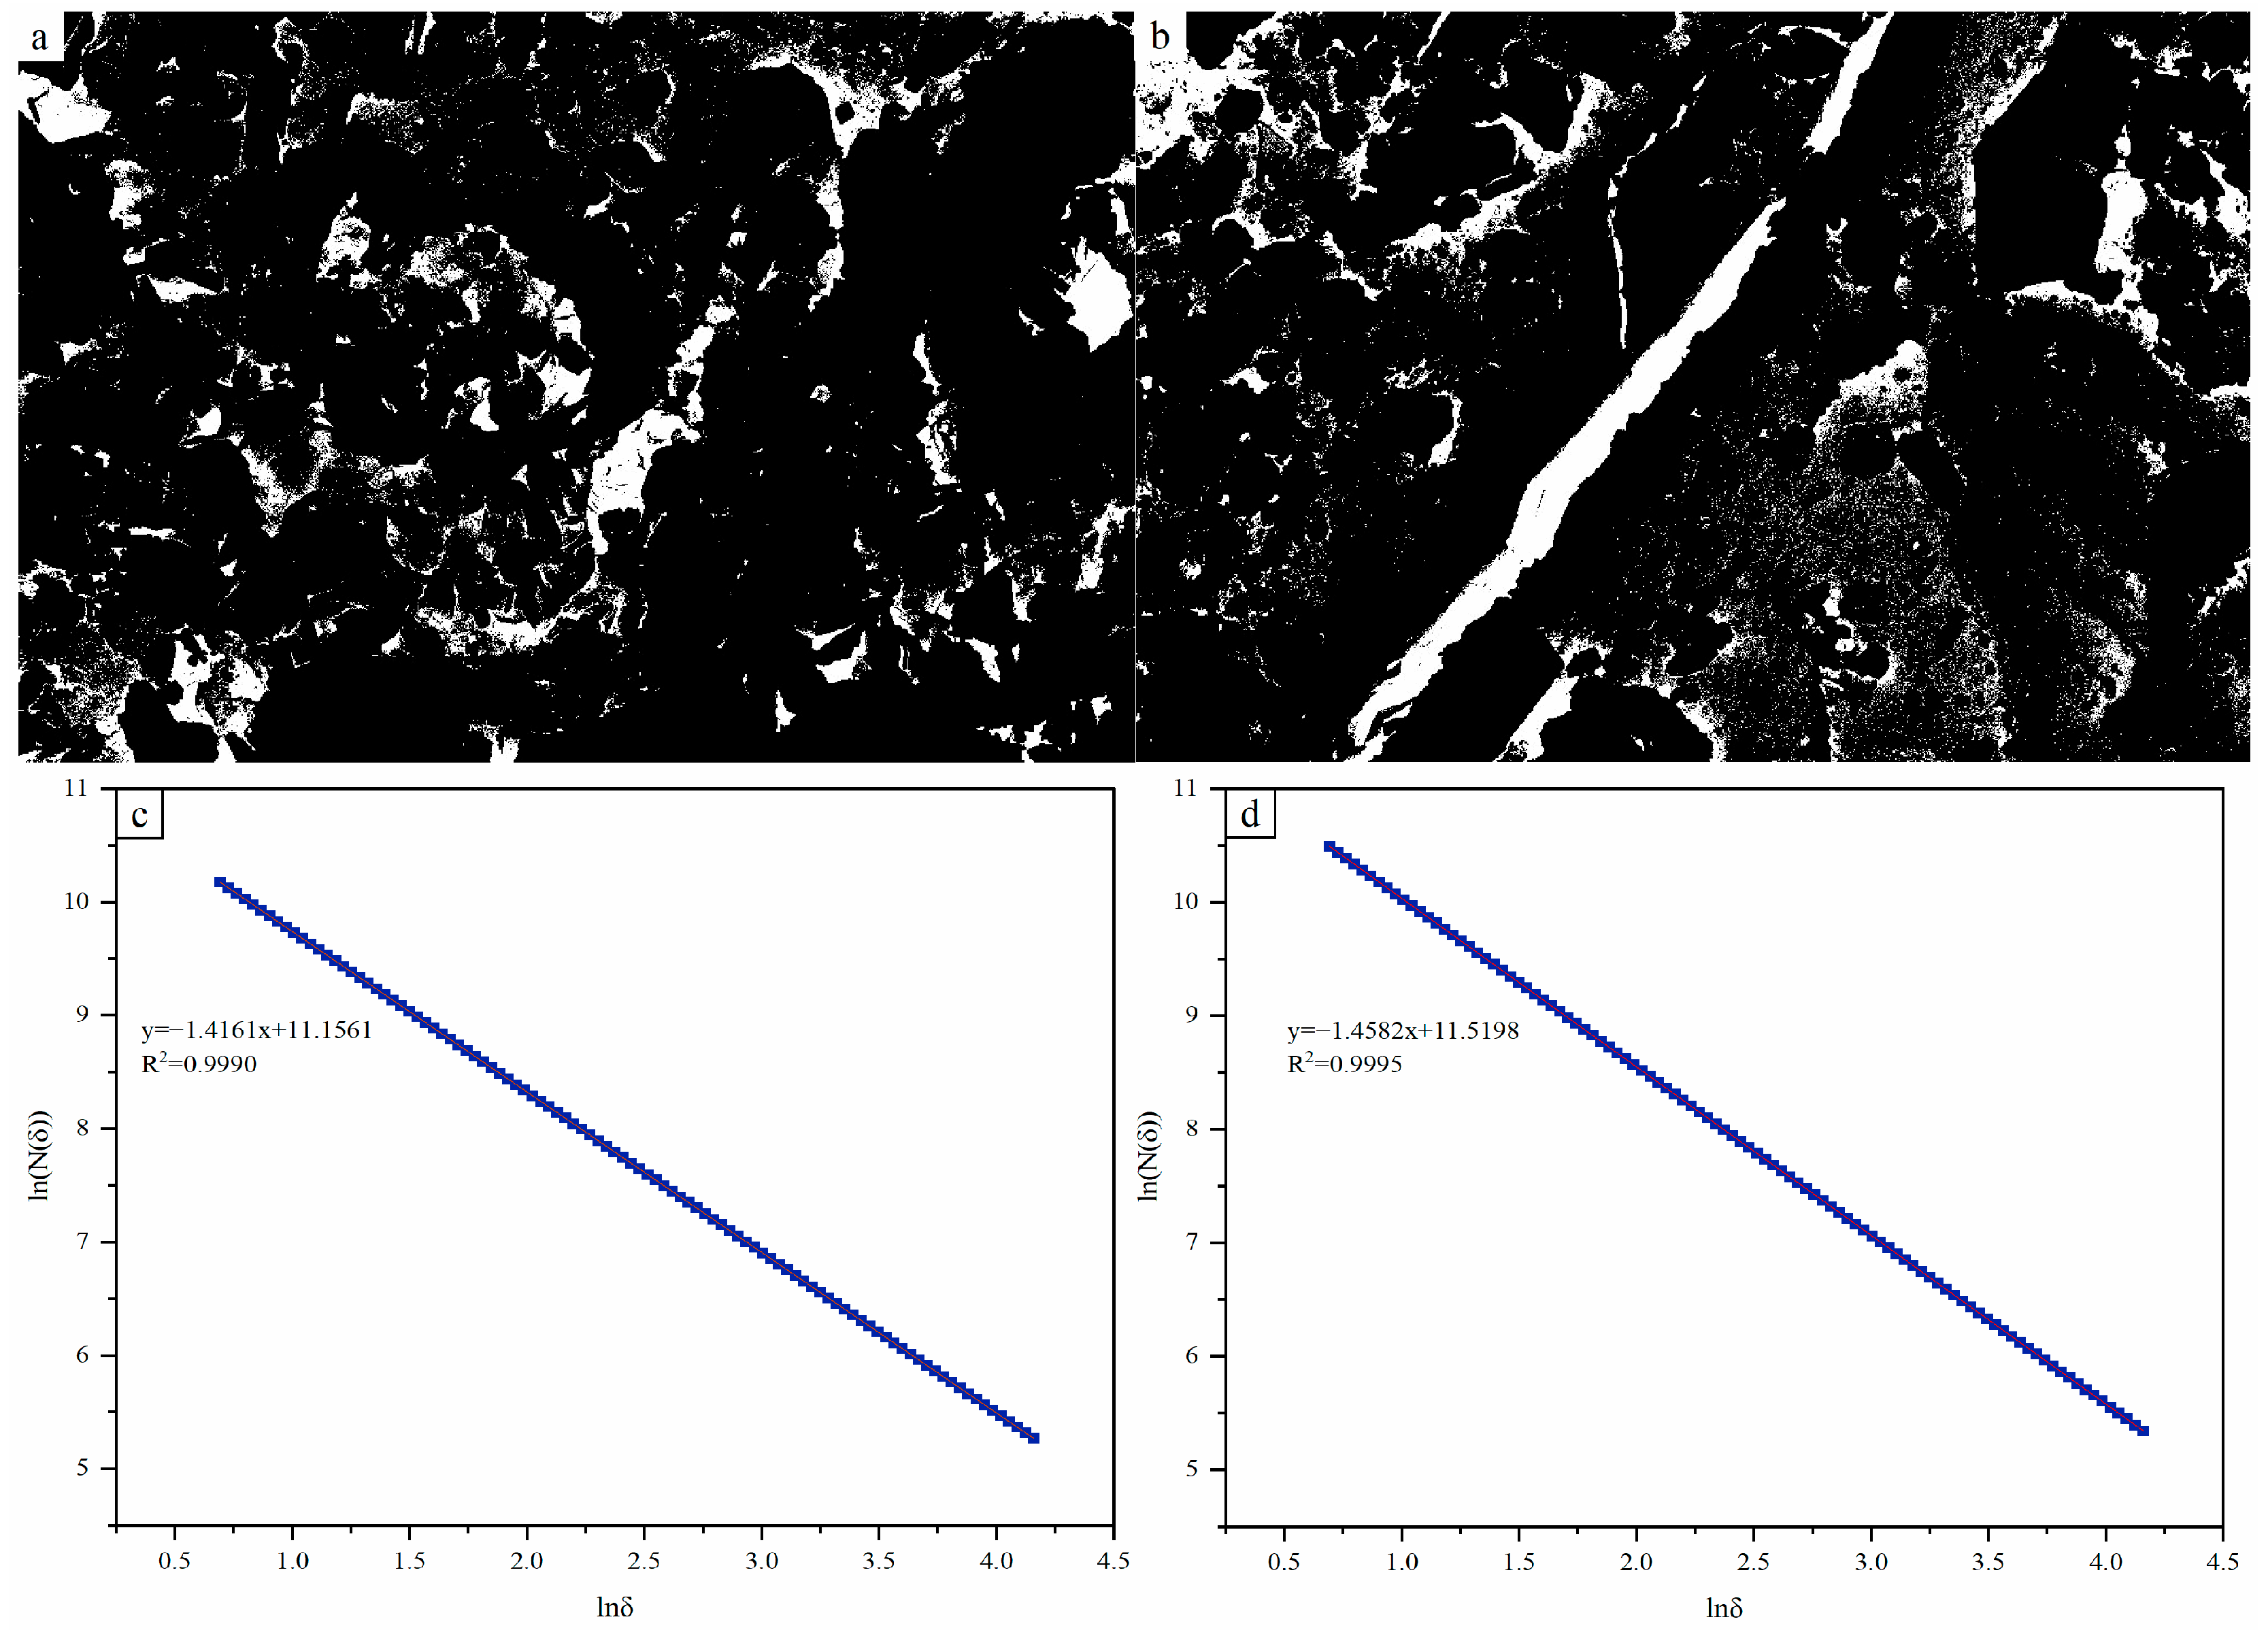
The original grayscale FE-SEM images are unsuitable for quantitative analysis of pore structure, including PSD and fractal characteristics. To extract the fractal characteristics of the coal sample pores, the images were converted into binary format. In the FE-SEM images of the coal samples, pores typically appear as darker grayscale regions compared to the background. Consequently, pores and backgrounds can be easily differentiated based on distinct grayscale levels [47]. The global thresholding method has been demonstrated to be an effective technique for determining the appropriate grayscale threshold [48]. In this study, ImageJ version 1.54f (National Institutes of Health, Bethesda, MD, USA) was employed to process the FE-SEM images presented in Figure 1b,d, as shown in Figure 4a,b. Following the establishment of an appropriate grayscale threshold, the pores in the coal samples were segregated from the background, resulting in binary images where the coal matrix is represented in black and the pores and fractures in white. The fractal dimension was subsequently calculated using the box-counting method, with the results illustrated in Figure 4.

Figure 4.
Binary images of the (a,b) views of the coal samples, and fractal dimension fitting plots for the (c,d) views.
As depicted in Figure 4c,d, the fractal dimensions determined using the box-counting method are 1.4161 ± 5.2059 × 10⁻⁷ and 1.4582 ± 4.6061 × 10⁻⁷, respectively. These values suggest that the pore distribution on the coal surface demonstrates distinct fractal characteristics, with varying degrees of complexity in different directions. The fractal dimensions not only characterize the complexity of the pore distribution but also offer valuable insights into the heterogeneity of the coal samples.
3.2. MIP Results and Fractal Characteristics
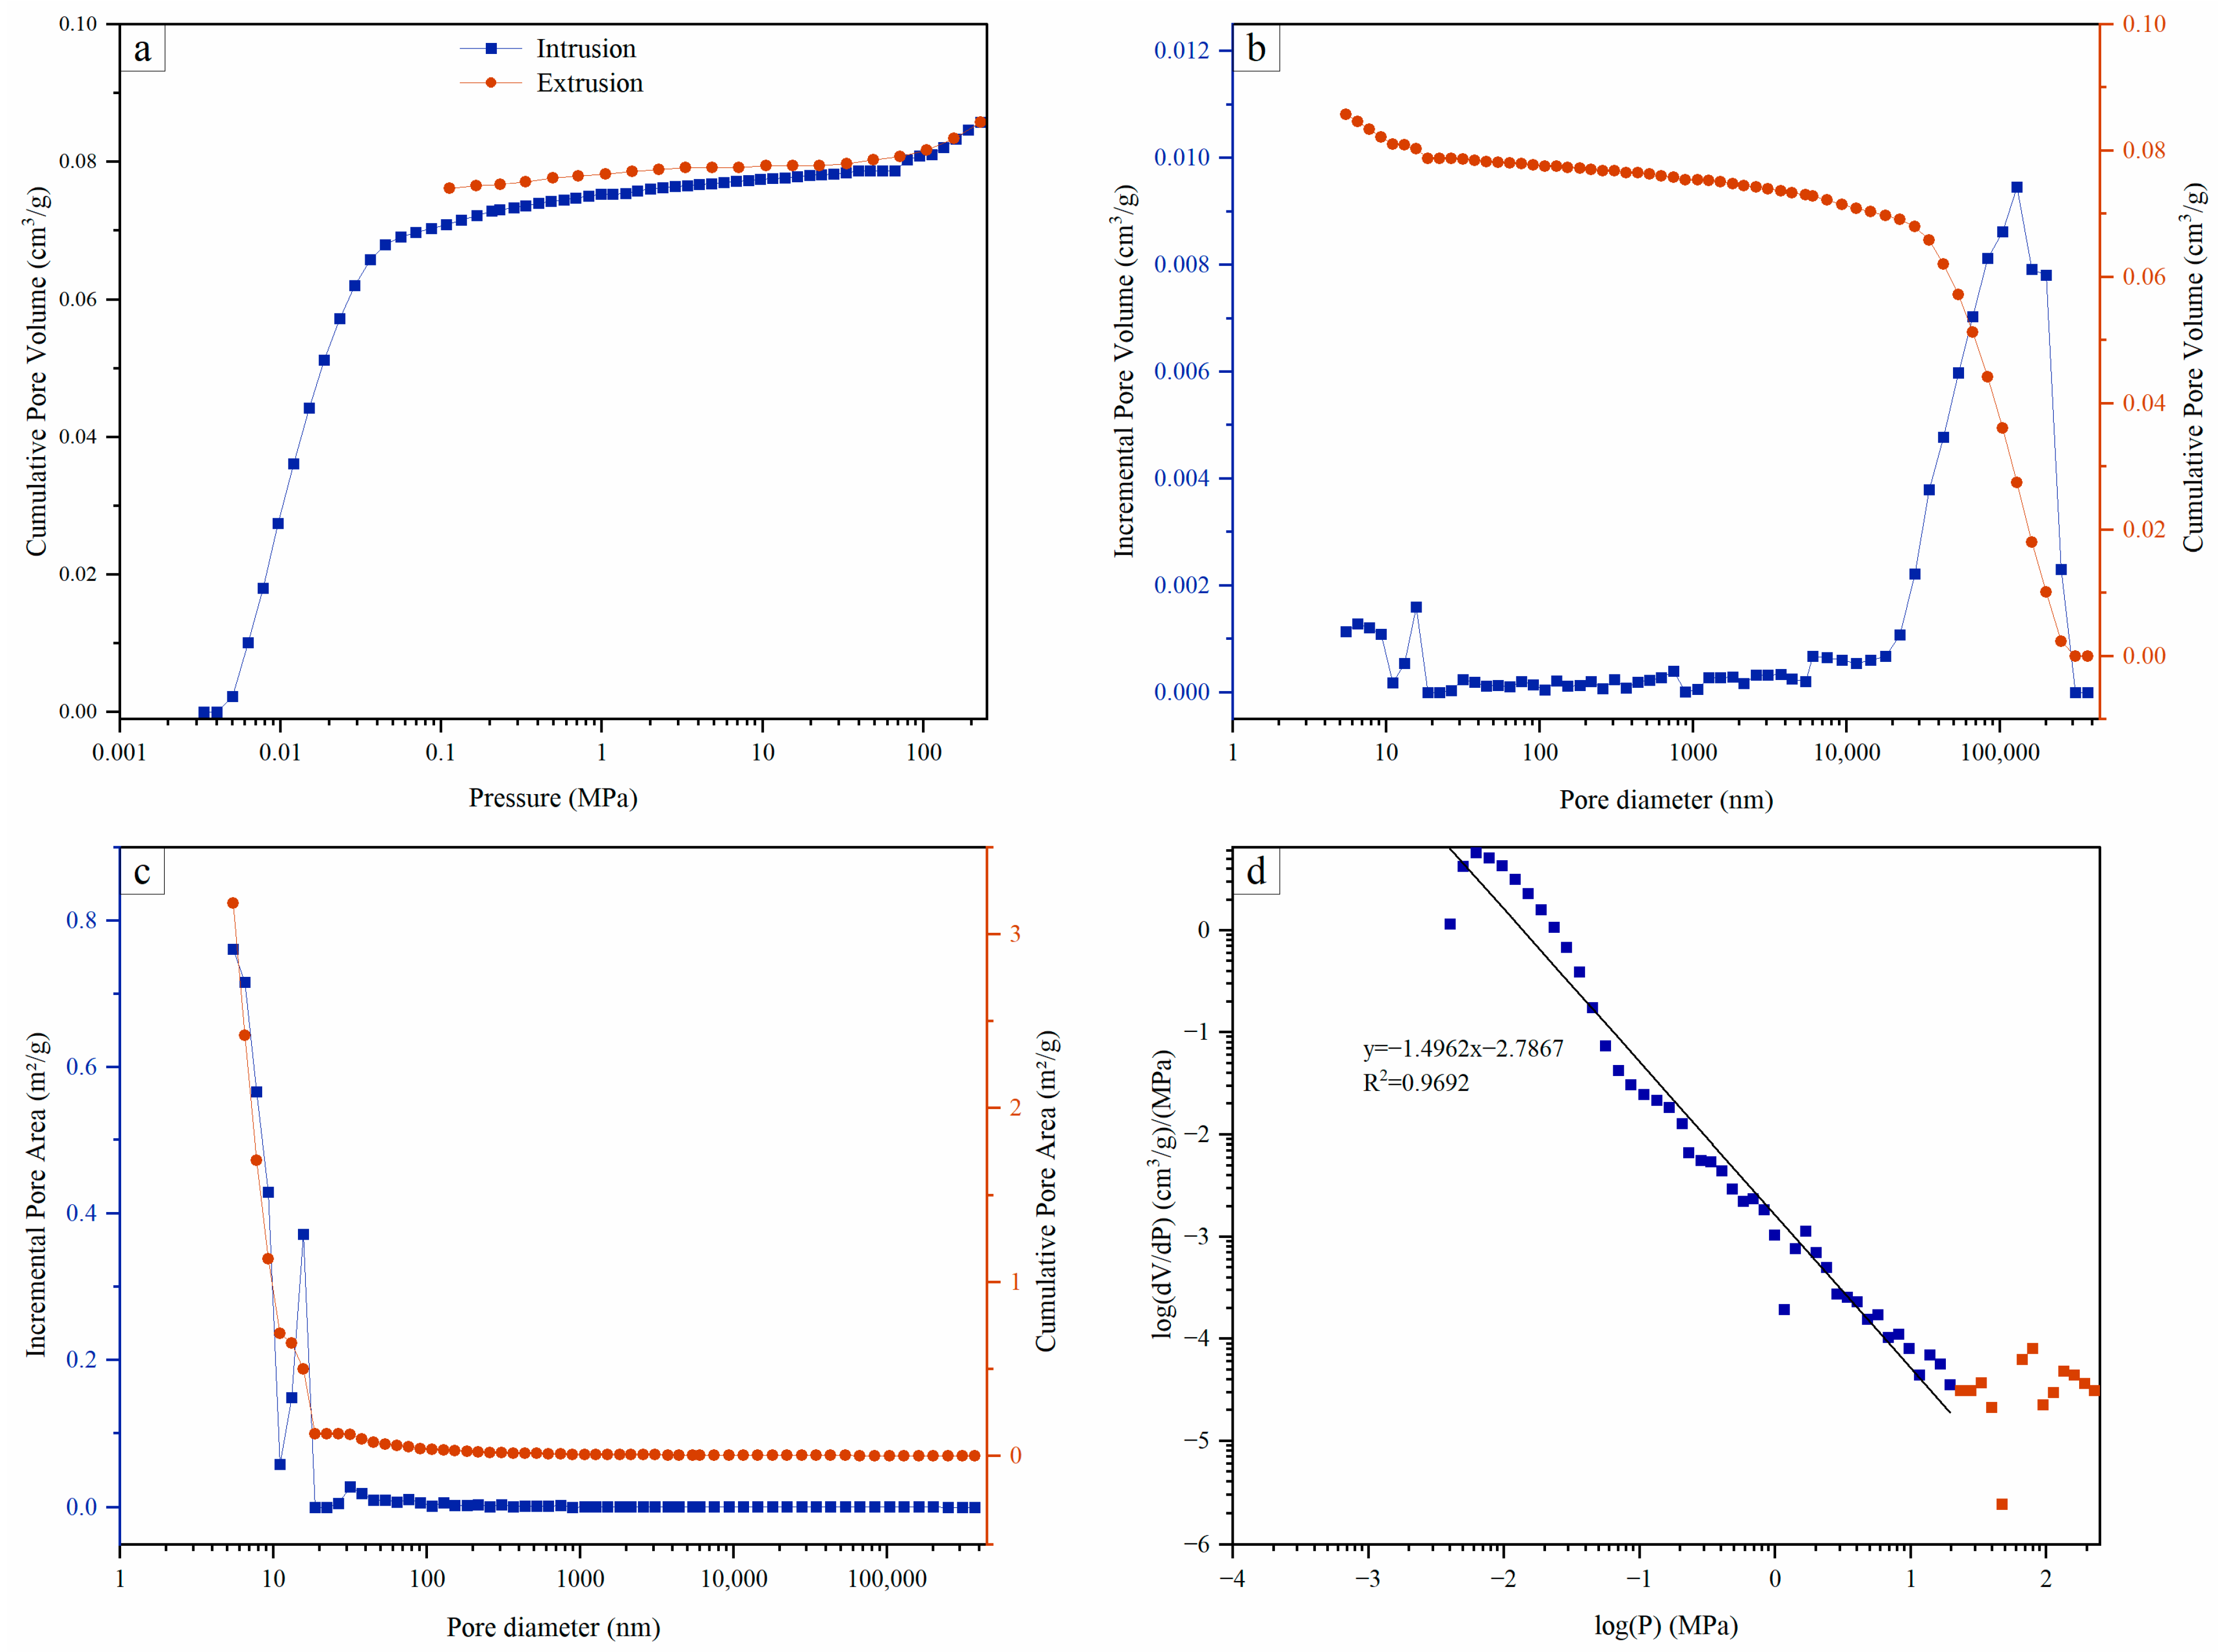
The shapes of the mercury intrusion and extrusion curves in the MIP experiments reflect differences in the openness and connectivity of pore structures within the coal samples. Pores in coal can be classified into closed, semi-closed, and open pores based on their connectivity. Among these, open pores can form a hysteresis loop during mercury intrusion, while semi-closed and closed pores do not exhibit such a loop.
As depicted in Figure 5a, when p > 10 MPa, the discrepancy between the mercury intrusion and extrusion curves is minimal, suggesting that the coal samples primarily contain closed and semi-closed pores, with poorly developed open pore structures. The openness and connectivity of these pores are relatively low. In contrast, when p < 10 MPa, the hysteresis loop in the mercury intrusion curve becomes more pronounced, and the mercury extrusion efficiency is reduced, with a substantial amount of high-pressure mercury remaining within the coal pores. This indicates that the larger mesopores in the coal samples are predominantly open, with a high proportion of open pores and fewer semi-closed and closed pores. The connectivity of these pores is relatively well developed [49].
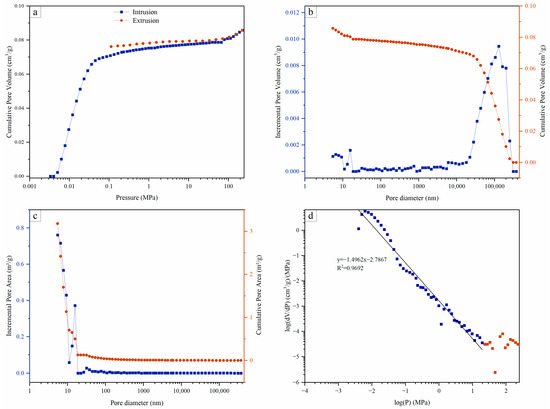
Figure 5.
(a) Mercury intrusion and extrusion curves; (b) PSD vs. PV; (c) PSD vs. SSA; (d) fractal dimension fitting plot.
According to the MIP experimental results, the total PV of the coal samples is 0.086 cm3/g, the total SSA is 3.178 m2/g, the average pore size is 107.94 nm, and the porosity is 30.56%. As illustrated in Figure 5b, the peak of the PSD curve for PV occurs at 130,000 nm, suggesting that large pores contribute the most to the total pore volume. The mercury intrusion volume for large pores is 0.078 cm3/g, accounting for 91.03% of the total PV, while the intrusion volume for mesopores is 0.0088 cm3/g, representing 8.97% of the total PV. As shown in Figure 5c, the peak of the PSD curve for SSA occurs at 5 nm, indicating that mesopores account for the majority of the SSA. The SSA of mesopores is 3.11 m2/g, representing 97.87% of the total surface area, while the SSA of large pores is 0.068 m2/g, comprising 2.13% of the total surface area.
Based on the MIP experimental results and Equation (3) for calculation, Figure 5d was derived. As presented in Figure 4d, the fractal dimension of the coal samples displays a segmented characteristic. For pores larger than 50 nm (macropores), the fractal dimension is 2.5038 ± 0.04023, with a fitting degree of 0.9692, suggesting that these pores exhibit fractal characteristics and a complex pore structure. However, the fractal dimension for mesopores is not further discussed due to measurement errors arising from the compression of the coal matrix during mercury intrusion, which distorts the pore structure. These measurement errors increase as the pore size decreases [23].
3.3. LT-N2GA Results and Fractal Characteristics
The pore structure of coal demonstrates considerable complexity, exhibiting a wide PSD that spans from millimeter to nanometer scales. Due to this complexity, qualitative characterization methods alone are inadequate for fully and accurately revealing the entirety of the coal pore structure. A combination of qualitative and quantitative methods is essential to achieve a comprehensive characterization of coal pore structure. In the present study, results obtained from FE-SEM were employed for the qualitative analysis of pore and fracture morphologies on the coal surface. The observations reveal that the coal surface is relatively rough, with pores and fractures at the micrometer and millimeter scales being clearly visible, while nanometer-scale micropores remain undetectable by FE-SEM. Therefore, to overcome this limitation, LT-N2GA and LP-CO2GA experiments are indispensable, as they facilitate the precise characterization of micropore and mesopore structures and morphologies in coal, thereby providing critical insights into the overall understanding of coal pore structure [44,50].
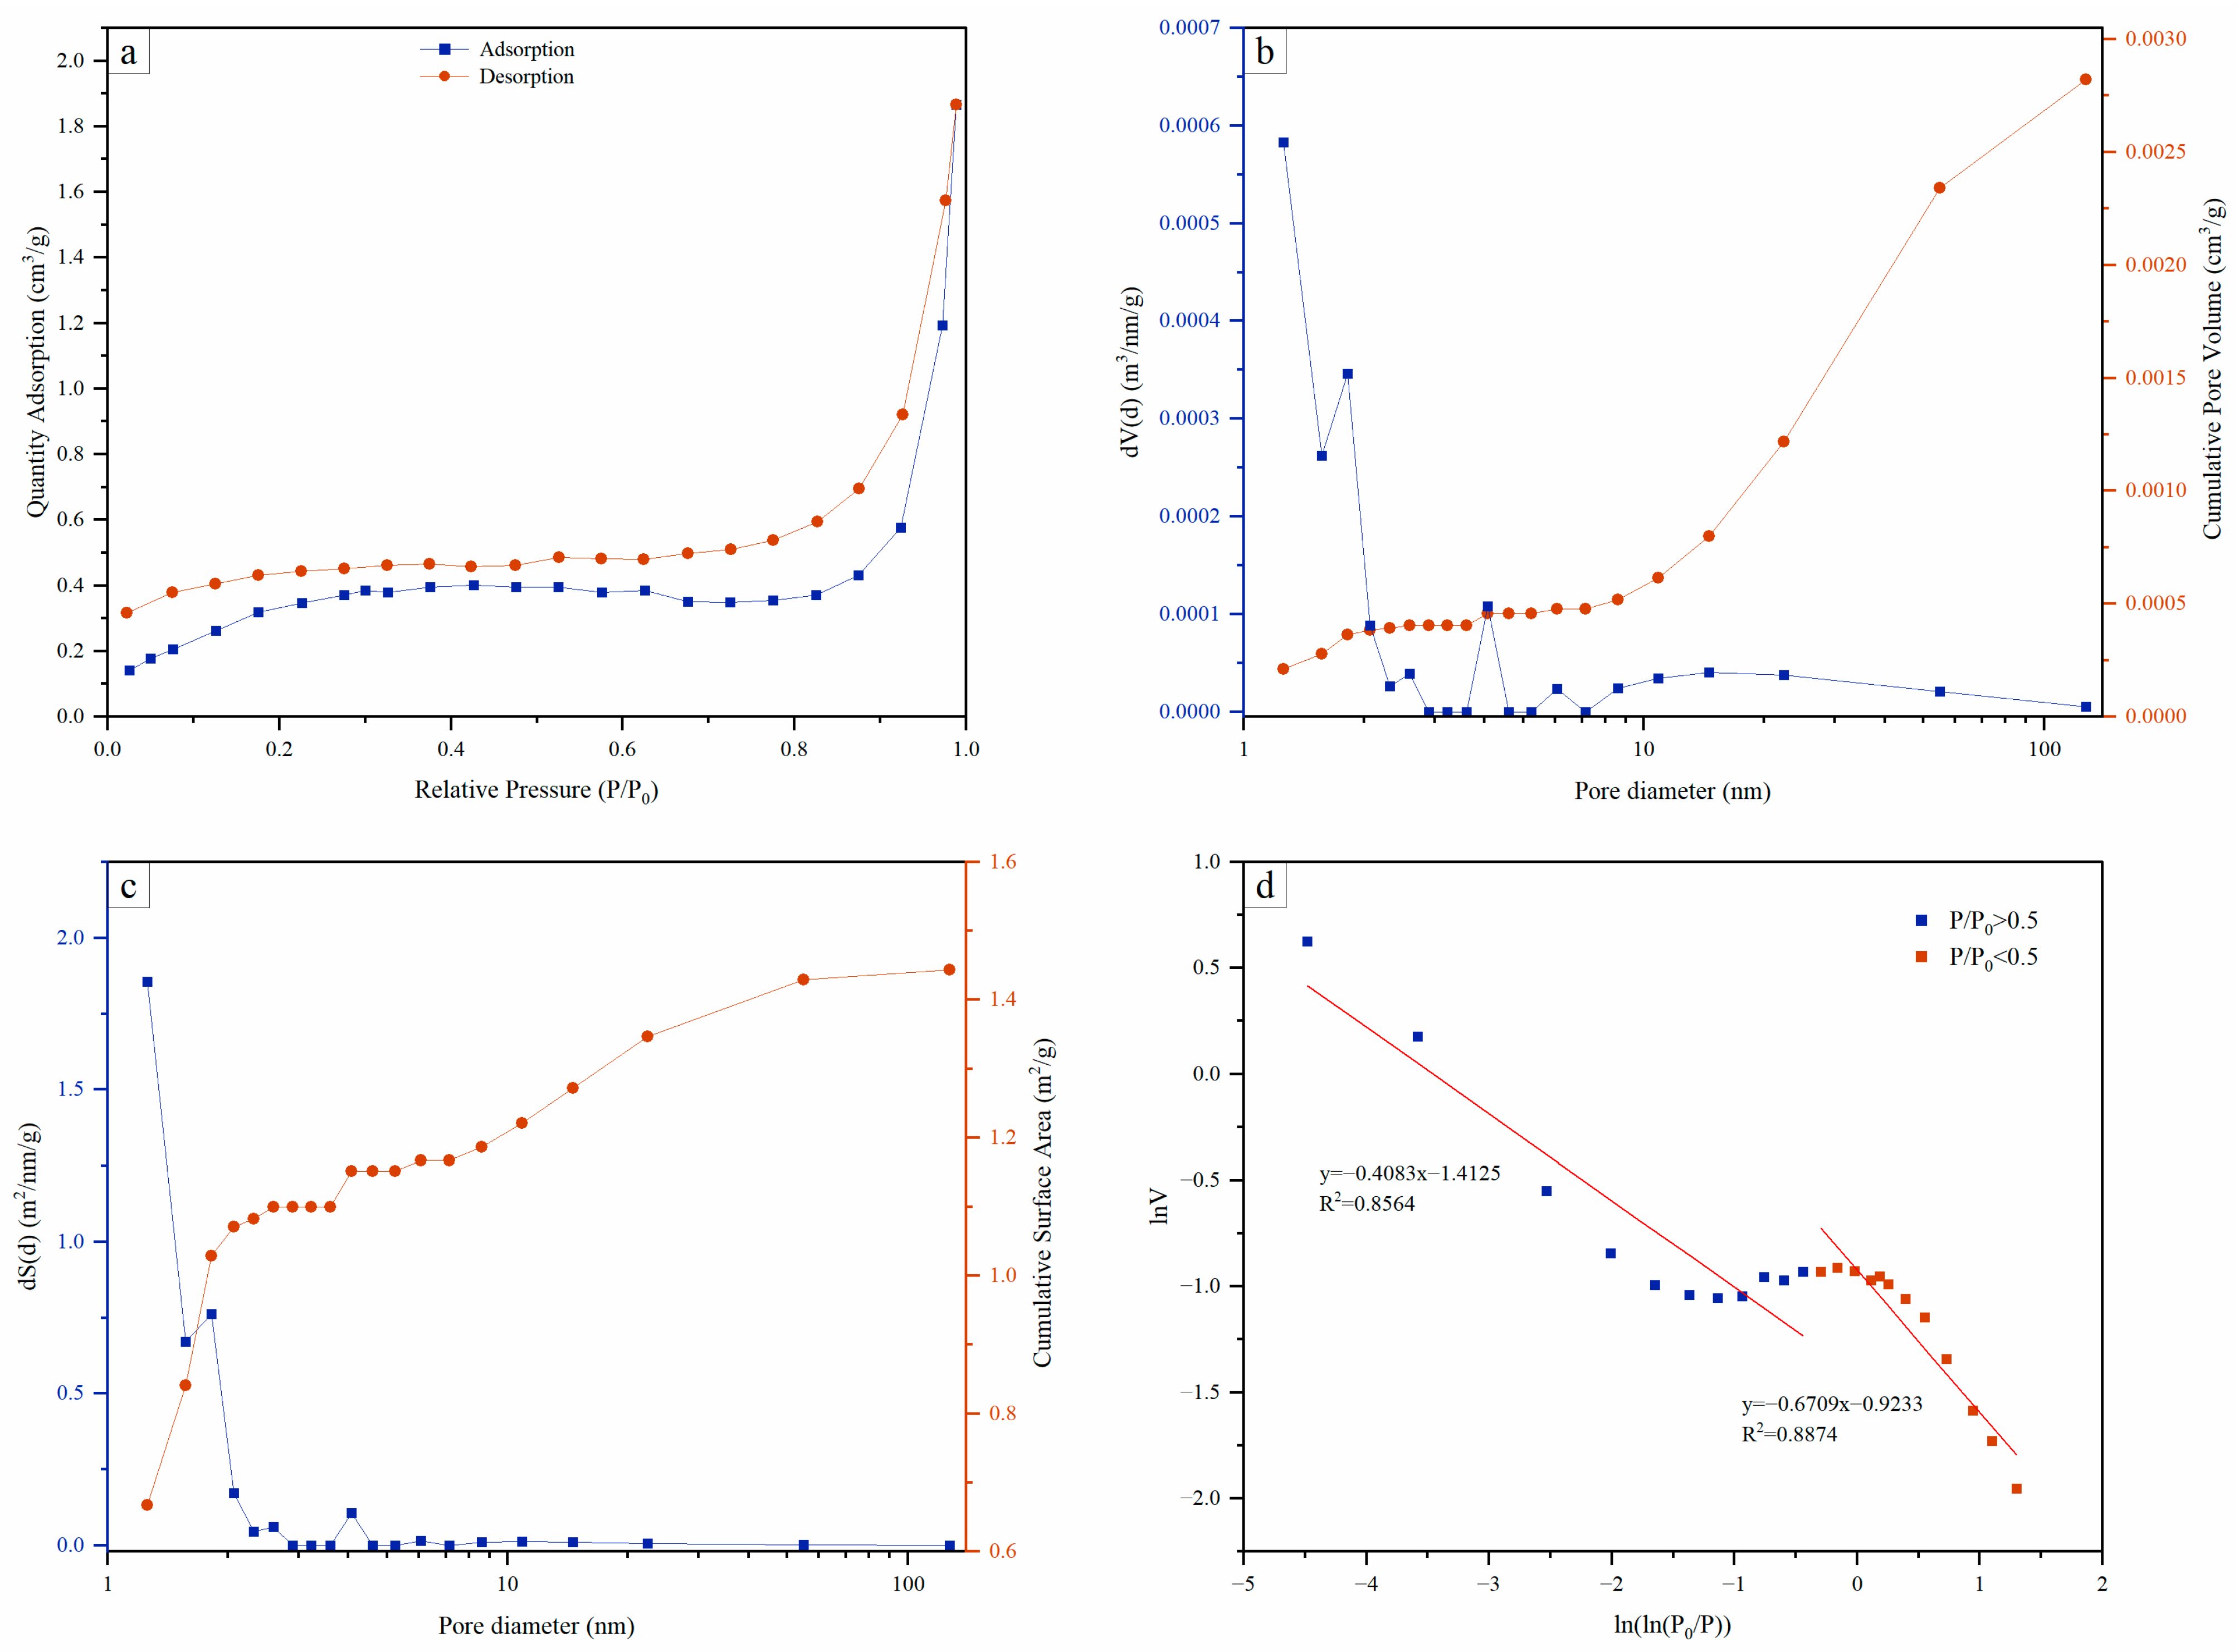
IUPAC classifies adsorption–desorption isotherms into six distinct types [25]. As shown in Figure 6a, the nitrogen adsorption isotherms of the coal samples generally correspond to Type IV isotherms but exhibit notable deviations. The overall adsorption curve displays an upward trend, characterized by a lower adsorption branch and a higher desorption branch. In the low-pressure regime, the initial monolayer adsorption transitions to multilayer adsorption. As relative pressure increases, multilayer adsorption begins, with the adsorption quantity progressively increasing until multilayer adsorption is fully established. When the relative pressure exceeds 0.9, the curve exhibits a sharp rise, signifying a significant increase in adsorption quantity. This behavior suggests that in the low-pressure region, the transition from monolayer to multilayer adsorption occurs, and with increasing relative pressure, multilayer adsorption develops, leading to a gradual increase in adsorption quantity until saturation is reached at the saturation vapor pressure, at which point the adsorption layer becomes infinitely large [51,52]. The pronounced hysteresis loop and the absence of a distinct inflection point indicate the lack of ink-bottle pores. Adsorption curve and desorption are parallel, which suggests that the pore system predominantly consists of open pores, including cylindrical pores at both ends and parallel plate pores on all sides. This pore structure promotes CBM migration, demonstrating favorable permeability and connectivity.
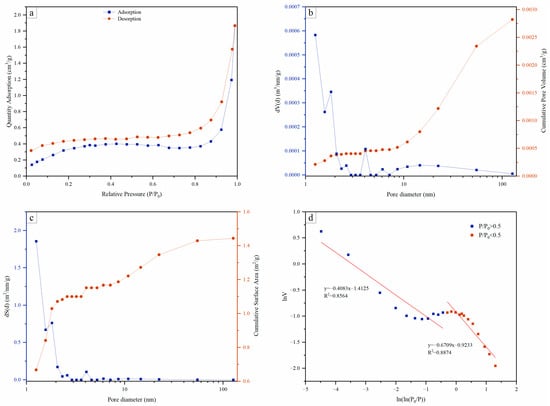
Figure 6.
(a) LT-N2GA adsorption–desorption curve; (b) PD and PV distribution curve; (c) PD and SSA distribution curve; (d) fractal dimension fitting diagram.
SSA of coal samples, calculated using the BET model, is 1.31 m2/g, while that obtained using the BJH model is 1.44 m2/g. PV is 0.0028 cm3/g. PSD is broad, ranging from 1.26 nm to 127.44 nm, with an average value of 14.36 nm. As illustrated in Figure 6b,c, PSD of coal samples follows a multimodal pattern, with peaks between 1.2 nm and 4.0 nm, suggesting a higher development of micropores and mesopores within this range. According to BJH model calculations, PV for micropores is 0.00036 cm3/g, for mesopores, it is 0.00086 cm3/g, and, for macropores, it is 0.0016 cm3/g. SSA for micropores is 1.03 m2/g, for mesopores, it is 0.32 m2/g, and, for macropores, it is 0.097 m2/g. The significantly larger SSA of micropores and mesopores, compared to that of macropores, enhances the potential for CBM storage and migration.
The nitrogen adsorption–desorption isotherms obtained from LT-N2GA experiments were used to construct a double logarithmic plot of adsorption volume versus relative pressure, as described by Equation (4). Linear regression analysis of ln(ln(P0/P)) versus lnV provided the slope of the fitted line, which was then used to determine the fractal dimension according to Equation (5). As shown in Figure 6d, the fractal dimension fitting curve of the coal samples can be divided into distinct low-pressure and high-pressure regions. In the low-pressure regime, gas adsorption is primarily governed by van der Waals forces, the intensity of which correlates with the surface roughness of the coal samples. In contrast, in the high-pressure regime, increasing relative pressure leads to a reduction in van der Waals forces between the coal matrix and liquid nitrogen molecules. At this point, gas adsorption is predominantly driven by capillary condensation forces, which become dominant and are intricately associated with the internal pore structure of the coal. A higher fractal dimension in the low-pressure region indicates a more pronounced surface roughness of the coal samples, while a higher fractal dimension in the high-pressure region reflects a more complex distribution of internal pore structures. Specifically, in the low-pressure region (P/P0 < 0.5), the surface fractal dimension of the coal samples is 2.3921 ± 0.05245, which is consistent with the fractal characteristics observed via FE-SEM. In the high-pressure region (P/P0 > 0.5), the pore fractal dimension of the coal samples is 2.5917 ± 0.07165, indicating a significant degree of heterogeneity within the coal samples [23,53].
3.4. LP-CO2GA Results and Fractal Characteristics
LT-N2GA primarily measures pores within the size range of 1.26–127.44 nm. In materials with micropores smaller than 2 nm, interactions between the pore walls and overlapping potential energies lead to significantly higher gas adsorption quantities compared to mesoporous materials. Micropore filling occurs when P/P0 < 0.01, and for materials with pore sizes ranging from 0.5 to 1.0 nm, P/P0 may need to reach 10−5 to 10−7. Consequently, the analysis of micropores is more complex than that of mesopores. In this study, CO2 adsorption experiments were conducted to characterize the pore structure of micropores with sizes less than 2 nm [54].
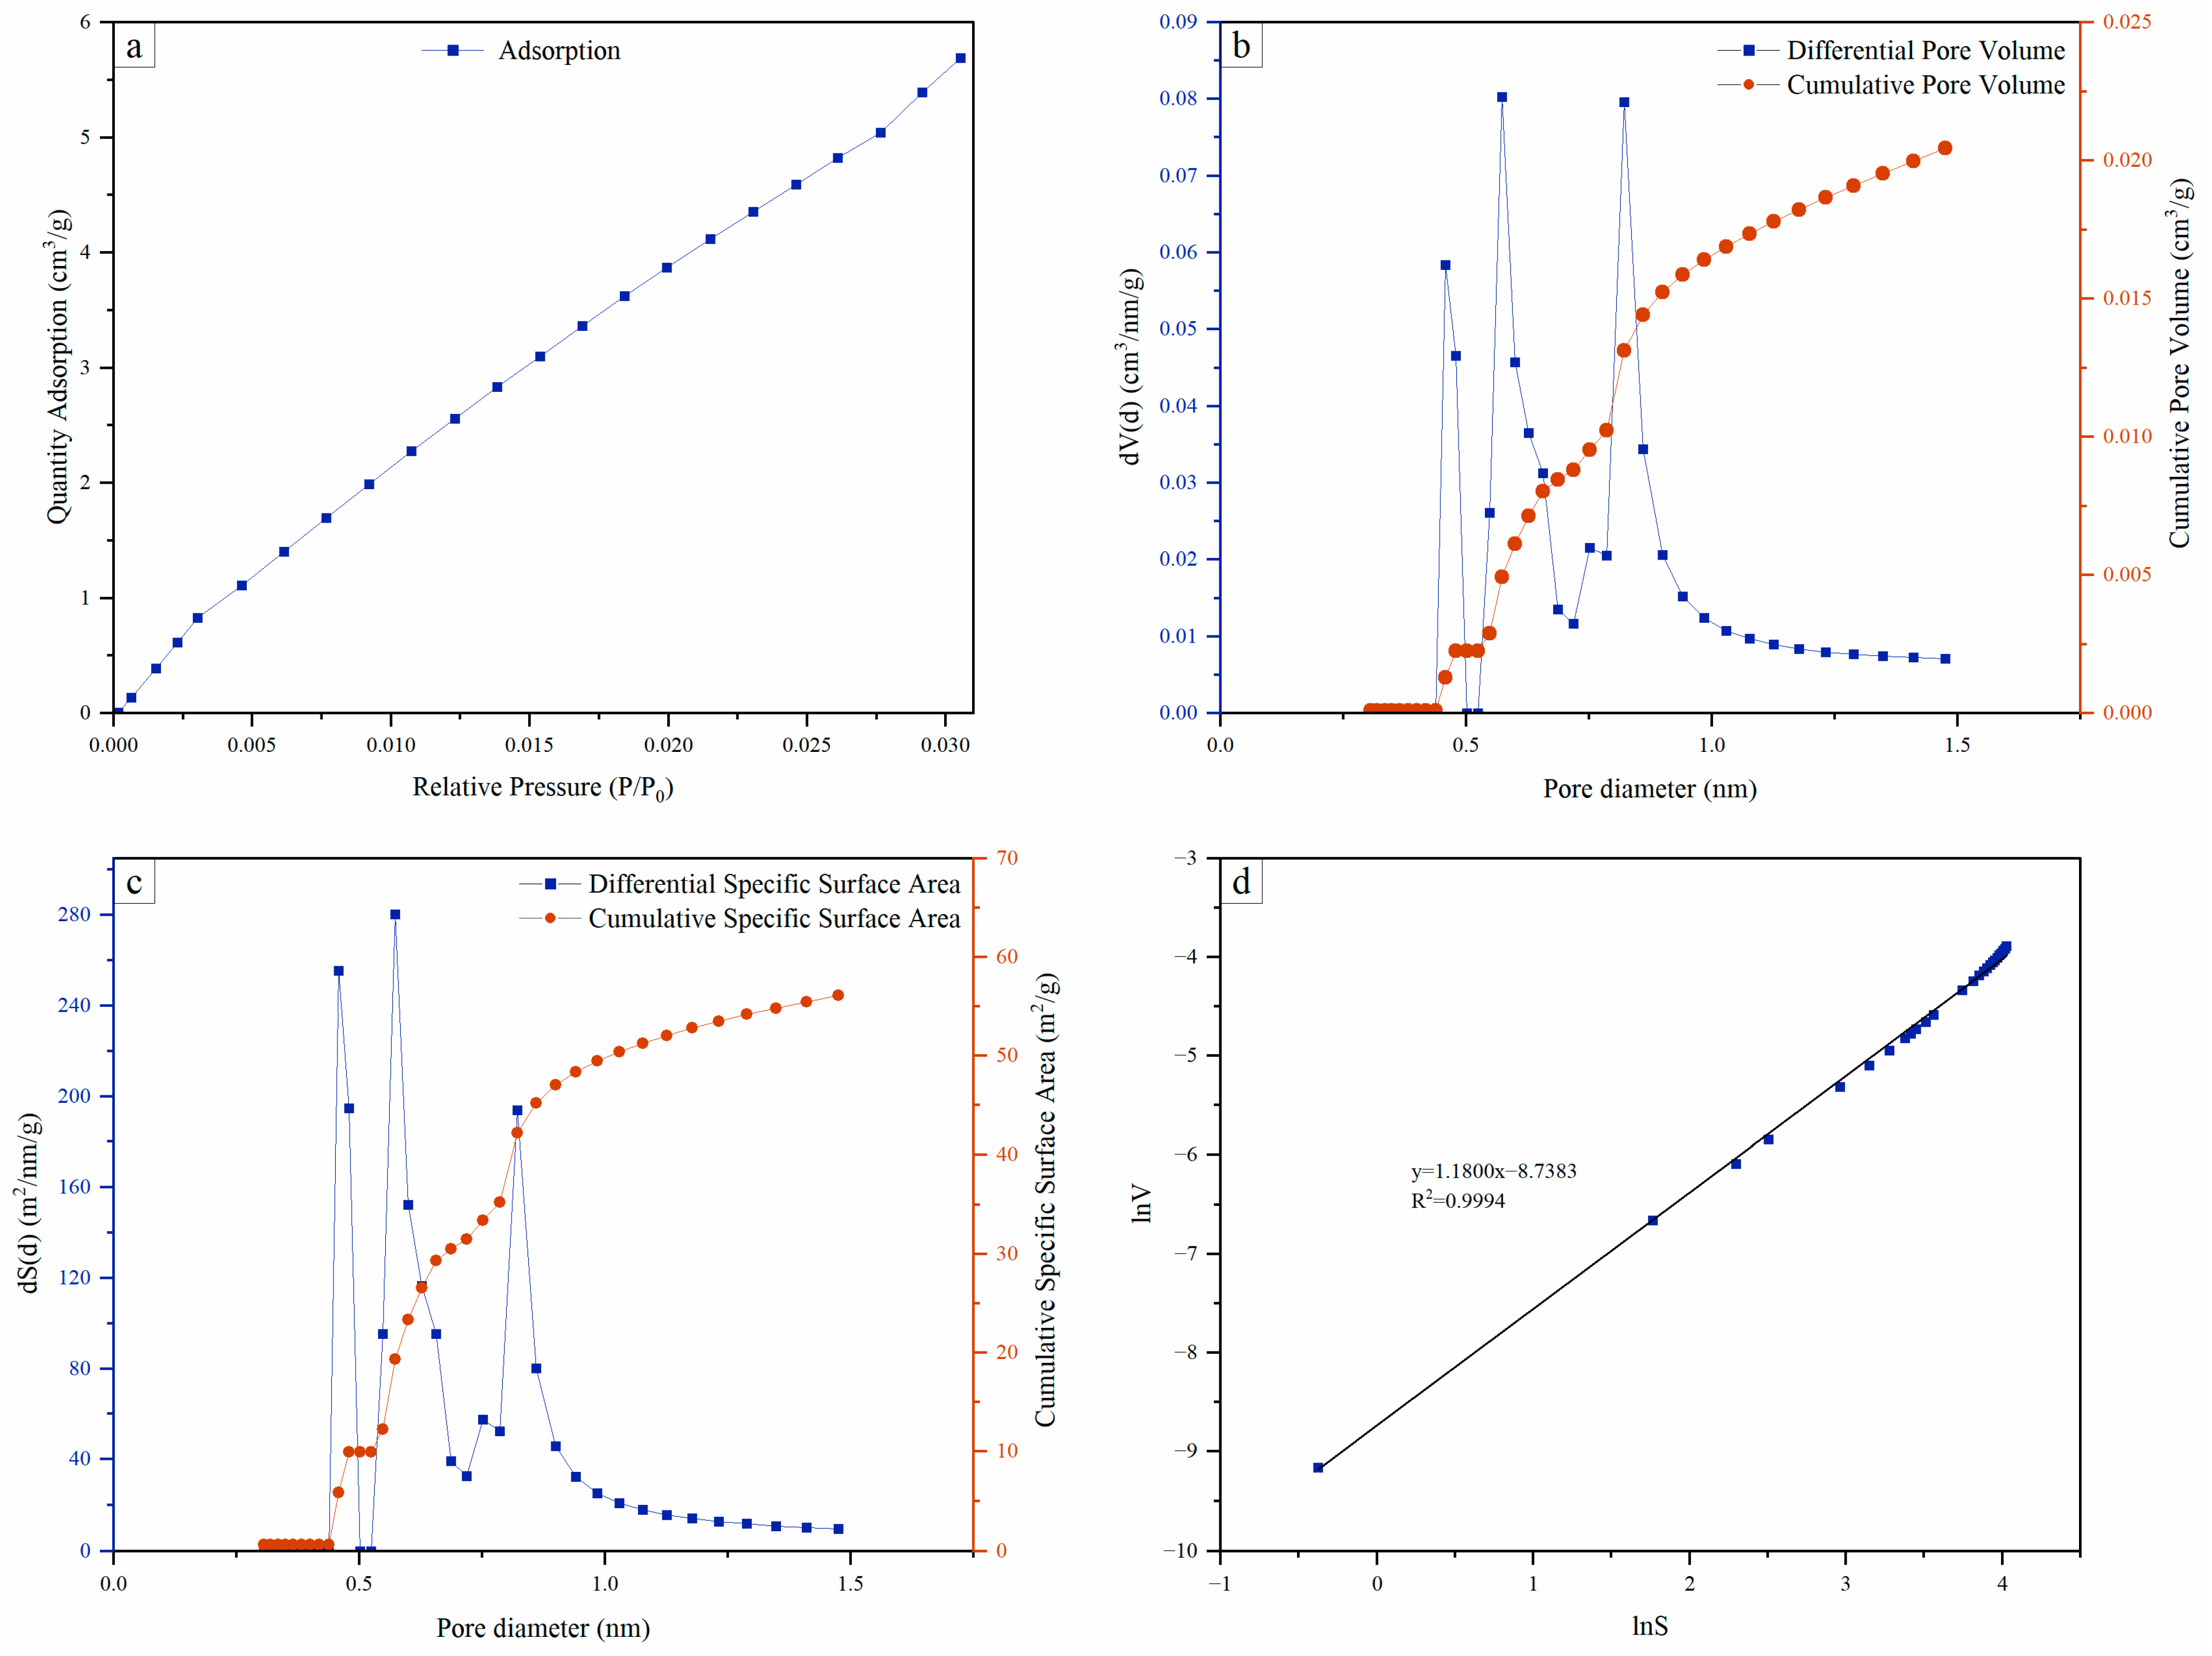
During LP-CO2GA measurements, the saturation vapor pressure cannot be attained due to pressure limitations, and the samples adsorb within the relative pressure range of 0–0.03. Figure 7a presents the isothermal adsorption curves of the coal samples, where the adsorption quantity increases steadily with increasing pressure. Under low-pressure conditions, the adsorption sites on the adsorbent surface are abundant, allowing CO2 molecules to form a uniform monolayer on the surface. The strong correlation between adsorption quantity and pressure suggests a uniform distribution of micropore structures, resulting in evenly distributed adsorption sites.
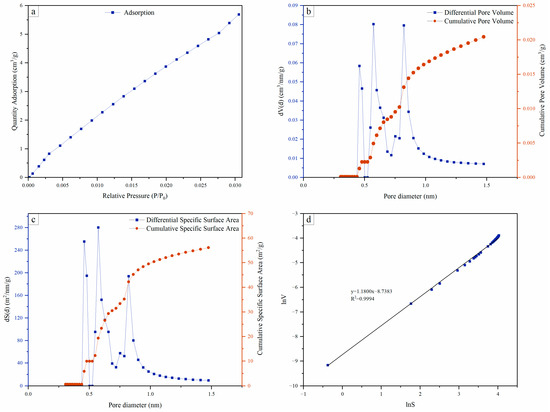
Figure 7.
(a) LP-CO2GA adsorption–desorption curve; (b) PD and PV distribution curve; (c) PD and SSA distribution curve; (d) fractal dimension fitting diagram.
The pore size analysis in LP-CO2GA is primarily based on DFT, with the PSD presented in Figure 7b,c. CO2 adsorption occurs in pores with diameters ranging from 0.30 to 1.50 nm. The micropore volume of the coal samples is 0.020 m3/g, and the SSA of micropores is 56.11 m2/g, which is notably higher than the SSA derived from nitrogen adsorption. This further suggests that micropores are the primary sites for gas adsorption in coal. The micropore size distribution of the coal samples exhibits a multimodal pattern, with a high degree of consistency between the peak positions of PV and SSA. Peaks are observed at 0.45 nm, 0.60 nm, and 0.80 nm, with the micropores at 0.60 nm contributing the most to both PV and SSA. Given the well-developed micropores in the coal samples and their large SSA, these pores provide abundant adsorption sites for gas storage. Overall, the micropores in the coal samples are highly developed, with the most pronounced development observed in the pore size range of 0.45–0.80 nm.
The fractal characteristics of coal micropores are critical to gas adsorption capacity [43]. Based on the results of CO2 adsorption experiments and Equation (6), a double logarithmic plot of cumulative PV and cumulative SSA was constructed. As shown in Figure 7d, the logarithms of cumulative PV (lnV) and cumulative SSA (lnS) exhibit a strong linear correlation, with a correlation coefficient (R2 = 0.9994). The fractal dimension of the micropore structure was calculated to be 2.5424 ± 0.00496, confirming its clear fractal characteristics. This further corroborates the complex nature of the pore structure in deep coal.
3.5. Multi-Scale Pore Structure Characterization and Fractal Characteristics
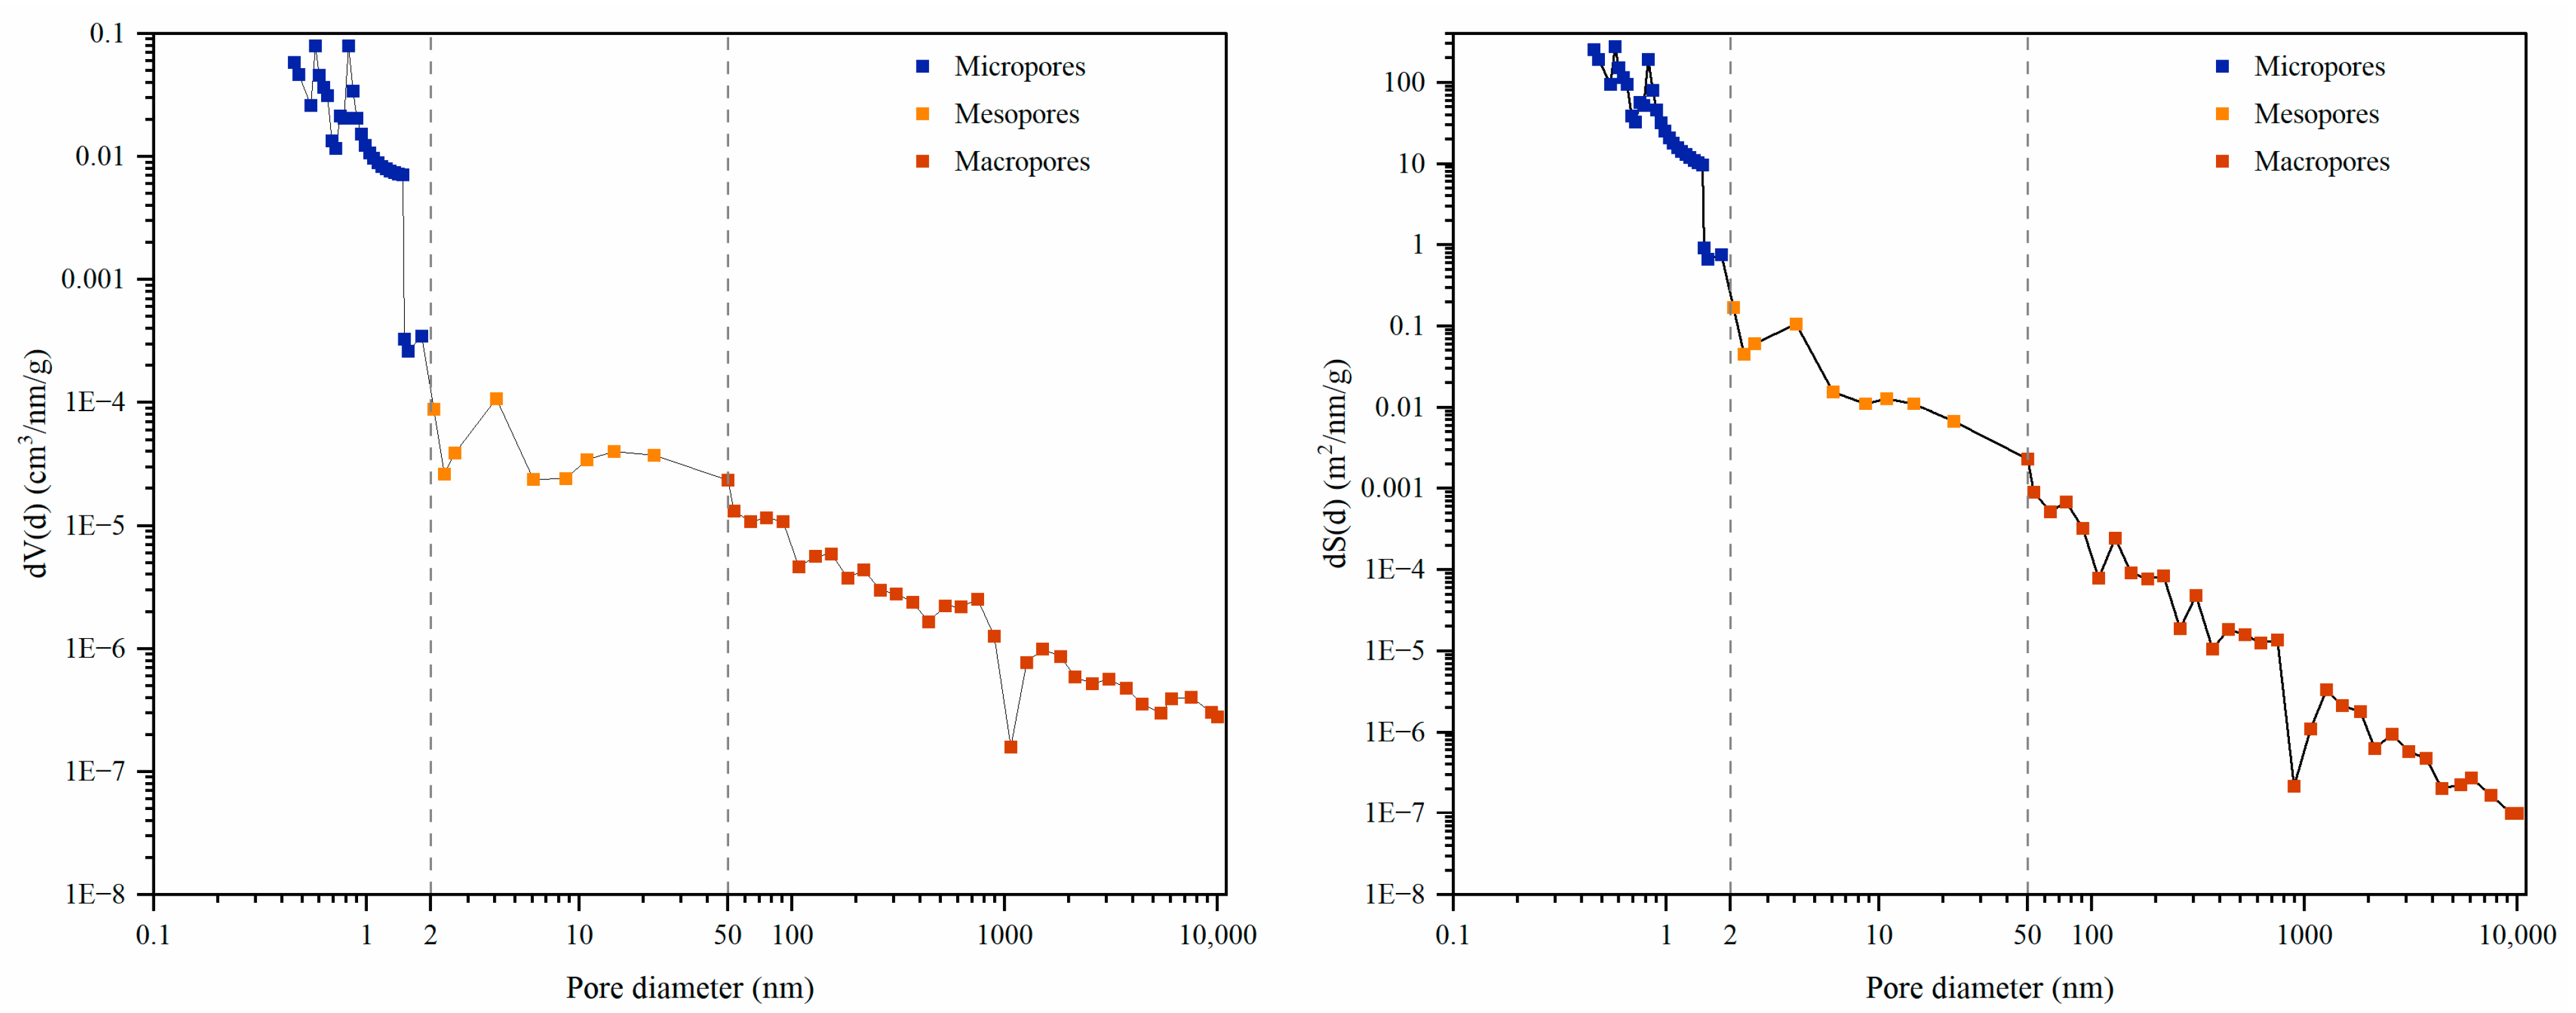
The coal samples exhibit a complex pore structure, which poses significant challenges for precise characterization using a single testing method. Based on the principles of the respective tests and the characteristics of the calculation models, MIP, LT-N2GA, and LP-CO2GA each have specific pore size ranges in which they are most effective for accurate characterization. The LP-CO2GA results, calculated using the DFT model, are capable of accurately characterizing pores within the size range of 0.30–1.50 nm. The LT-N2GA results, calculated using the BJH model, are suitable for characterizing pores in the size range of 0–50 nm [55,56,57,58]. The theoretical pore size range for the MIP method spans 3.6 nm to 10 µm, covering the distribution of mesopores and macropores. However, due to the compressibility of coal under high pressure, when the mercury intrusion pressure exceeds 30 MPa (corresponding to a pore size of approximately 50 nm), the coal matrix is compressed, and micropores are also affected. Therefore, the MIP method is unsuitable for characterizing micropores and mesopores but more effective for characterizing pores within the range of 50 nm to 10 µm [55,59]. In summary, this study evaluated the optimal pore size ranges for each experimental method and selected the appropriate calculation models. The effective pore size measurement ranges from 0.31 to 1.47 nm for LP-CO2GA and 1.26–127.44 nm for LT-N2GA. The overlap between these two ranges is 1.26–1.50 nm, and, for this interval, the LP-CO2GA results were used to characterize the overlapping region. The MIP results, calculated using the Washburn equation, provided an effective pore size range of 5 nm to 10 µm. The overlap with the LT-N2GA results lies in the range of 5.0–50 nm, and for this interval, the LT-N2GA results were used due to the matrix compression effect observed in MIP experiments at pressures exceeding 30 MPa. The multi-scale PSD characteristics of the coal samples are illustrated in Figure 8.
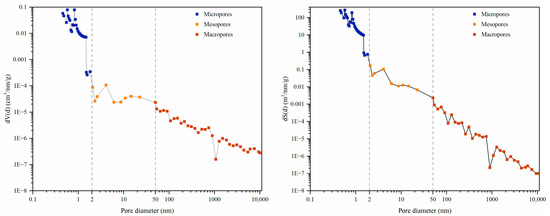
Figure 8.
Multi-scale pore distribution of coal samples.
The multi-scale pore structure of the coal samples demonstrates a multimodal distribution, with a predominant concentration in the micropore range of 0.45–0.80 nm. A summary of the PV and SSA results across multiple scales is provided in Table 2. The PV of the coal samples ranges from 0.002 to 0.078 cm3/g, with macropores contributing the largest proportion to the total PV at 70.9%, followed by micropores at 19.09%. Similarly, the SSA of the coal samples spans 0.068 to 57.18 m2/g, with micropores accounting for 97.46%—a contribution that significantly exceeds that of mesopores and macropores. These findings suggest that micropores are highly developed in ultra-deep coal seams, providing a larger surface area for CBM adsorption and thereby enhancing the adsorption capacity and storage potential of the coal.
Table 2.
PV SSA of multi-scale pore structure in coal samples.
The fractal dimension of coal’s multi-scale pore structure quantitatively represents the complexity of pore structures and surface roughness, which, in turn, influences the adsorption and permeability characteristics of coal. Consequently, the fractal dimension serves as a crucial indicator for describing pore structure characteristics and the extent of heterogeneity [59,60,61]. Drawing on the experimental results and the previously described fractal models, the fractal dimensions were calculated as 2.5424 for micropores, 2.5917 for mesopores, and 2.5038 for macropores. These results indicate that the pore structures of micropores and mesopores in ultra-deep coal are more complex than those of macropores.
In summary, the elevated specific surface area of micropores in ultra-deep coal offers numerous adsorption sites for CBM, markedly augmenting the coal’s adsorption capacity. The intricate fractal characteristics of micropores and mesopores, as opposed to macropores, further enhance the coal’s adsorption potential. While macropores constitute the majority of the total PV, underscoring their pivotal role in CBM permeability, the development of micropores and mesopores directly affects the adsorption and storage capacity of CBM, thus influencing the resource’s recoverability. Therefore, investigations into pore structure and fractal characteristics can inform more effective CBM development strategies. For example, augmenting coal seam permeability and refining extraction methodologies can elevate CBM recovery rates.
3.6. Implication and Limitation
The previous research mainly studied the pore structure characteristics, including the fractal characteristics of pore structure in coal seams within the depth of 3000 m, limiting the comprehensive and insightful understanding of the pore structure characteristics, due to the rare coal samples from ultra-deep coal seams exceeding the depth of 4000 m. In this study, the valuable coal sample was obtained from the Gaogu-4 well at a depth of 4369.4 m in the Shengli Oilfield of Shandong, China, providing the opportunity to explore the pore structure characteristics of the ultra-deep coal seam. Accordingly, the key pore structure characteristics were examined by a series of comprehensive measurements of FE-SEM, MIP, LT-N2GA, and LP-CO2GA, including the surface morphology, mineral composition, and multi-scale pore structure. The key pore structure parameters include PV, SSA, and PSD. In addition, the fractal characteristics of the multi-scale pore structure were prospected by quantitative analysis of the surface roughness and heterogeneity in the ultra-deep coal seam. The above findings can facilitate the understanding and estimating of the adsorption capacity and development potential of ultra-deep CBM [62,63,64]. All of the above contributions are devoted to providing more precise data to support the exploration, development, and utilization of the ultra-deep CMB. However, it is deduced that there are significant differences in the micropore (<2 nm), mesopore (2~50 nm), and macropore (>50 nm) structures of coal with different depths. Therefore, exploring the fractal evolutionary characteristics of coal samples with different depths in deep coal seams has important theoretical and practical guiding significance for the efficient exploitation and development of CBM in future studies.
4. Conclusions
(1) FE-SEM images reveal the pronounced heterogeneity of coal sample surfaces, with unevenly distributed pores that are typically circular, elliptical, or slit-like in shape and exhibit a relatively rough surface texture. Fractures are generally irregular in shape and partially interconnected, forming a complex pore network. The fractal dimension calculations of the coal sample surfaces indicate distinct fractal characteristics.
(2) The EDS analysis identified elements such as C, O, Al, Si, S, and Fe, confirming the presence of silicate and iron sulfide minerals. However, the restricted three samples in this analysis may introduce uncertainties regarding the representativeness of these mineralogical identifications. XRD analysis revealed that the coal sample contains kaolinite, marcasite, and clinochlore.
(3) The multi-scale pore characteristics of ultra-deep coal indicate that SSA is predominantly contributed by micropores (0.45–0.8 nm), accounting for 97.46% of the total SSA. The PV distribution follows the order of macropores > micropores > mesopores, with macropores contributing the largest proportion (70.9%).
(4) The fractal dimensions of the pore structures in ultra-deep coal were calculated as 2.5424 for micropores, 2.5917 for mesopores, and 2.5038 for macropores, indicating significant heterogeneity and pronounced multi-scale characteristics of the pore structures. The extensive development of micropores, surpassing mesopores and macropores, identifies them as the primary sites for gas adsorption. These findings are crucial for understanding the adsorption capacity and development potential of deep CBM, providing essential scientific insights for its efficient exploitation.
(5) It is noted that the analysis performed in this paper is restricted to the research samples and the theoretical model is based on only these samples. Therefore, exploring the fractal evolutionary characteristics of coal samples with different depths in deep coal seams has important theoretical and practical guiding significance for the efficient exploitation and development of CBM in future studies.
Author Contributions
Conceptualization, Y.Q., F.C., Z.S., R.L., G.L. and B.L.; methodology, Y.Q., F.C. and L.M.; software, Y.Q., F.C., L.M. and P.J.; validation, Y.Q., F.C., P.J. and L.M.; formal analysis, Y.Q., F.C., G.L., J.R. and R.L.; investigation, Y.Q., F.C., P.C., J.R. and G.B.; data curation, Y.Q., F.C., P.J. and L.M.; writing—original draft preparation, Y.Q. and F.C.; writing—review and editing, Y.Q., F.C., G.L. and Z.S.; visualization, Y.Q., F.C., L.M., J.R. and P.J.; supervision, Y.Q., Z.S., G.L., R.L., P.C. and G.B.; funding acquisition, Z.S., B.L. and G.L. All authors have read and agreed to the published version of the manuscript.
Funding
This research was supported by the National Natural Science Foundation of China (No. 42172189 and No. 42372205), the Henan Province International Science and Technology Cooperation Project (No. 242102520034), the Henan Province Science and Technology Research Project (No. 242102320365), and the Key Research Projects of Higher Education Institutions in Henan Province (No. 24B170005).
Data Availability Statement
The original contributions presented in the study are included in the article; further inquiries can be directed to the corresponding author.
Conflicts of Interest
The authors declare no conflicts of interest.
References
- Al-Jubori, A.; Johnston, S.; Boyer, C.; Lambert, S.W.; Bustos, O.A.; Pashin, J.C.; Wray, A. Coalbed Methane: Clean Energy for the World. Oilfield Rev. 2009, 21, 4–13. [Google Scholar]
- Liu, G.; Liu, H.; Xian, B.; Gao, D.; Wang, X.; Zhang, Z. Fuzzy Pattern Recognition Model of Geological Sweetspot for Coalbed Methane Development. Pet. Explor. Dev. 2023, 50, 924–933. [Google Scholar] [CrossRef]
- Lau, H.C.; Li, H.; Huang, S. Challenges and Opportunities of Coalbed Methane Development in China. Energy Fuels 2017, 31, 4588–4602. [Google Scholar] [CrossRef]
- Xian, B.; Liu, G.; Bi, Y.; Gao, D.; Wang, L.; Cao, Y.; Shi, B.; Zhang, Z.; Zhang, Z.; Tian, L.; et al. Coalbed Methane Recovery Enhanced by Screen Pipe Completion and Jet Flow Washing of Horizontal Well Double Tubular Strings. J. Nat. Gas Sci. Eng. 2022, 99, 104430. [Google Scholar] [CrossRef]
- Li, S.; Qin, Y.; Tang, D.; Shen, J.; Wang, J.; Chen, S. A Comprehensive Review of Deep Coalbed Methane and Recent Developments in China. Int. J. Coal Geol. 2023, 279, 104369. [Google Scholar] [CrossRef]
- Ren, J.; Song, Z.; Li, B.; Liu, J.; Lv, R.; Liu, G. Structure Feature and Evolution Mechanism of Pores in Different Metamorphism and Deformation Coals. Fuel 2021, 283, 119292. [Google Scholar] [CrossRef]
- Zhang, Z.; Liu, G.; Wang, X.; Wang, M.; Li, B.; Liu, H. Fractal Characterization on Three-Dimensional Fractur Tortuosity in Coal Based on CT Scanning. Fractals 2023, 31, 2350034. [Google Scholar] [CrossRef]
- Qin, L.; Zhai, C.; Liu, S.; Xu, J.; Wu, S.; Dong, R. Fractal Dimensions of Low Rank Coal Subjected to Liquid Nitrogen Freeze-Thaw Based on Nuclear Magnetic Resonance Applied for Coalbed Methane Recovery. Powder Technol. 2018, 325, 11–20. [Google Scholar] [CrossRef]
- Ji, X.; Song, D.; Zhao, H.; Li, Y.; He, K. Experimental Analysis of Pore and Permeability Characteristics of Coal by Low-Field NMR. Appl. Sci. 2018, 8, 1374. [Google Scholar] [CrossRef]
- Fu, H.; Tang, D.; Xu, T.; Xu, H.; Tao, S.; Li, S.; Yin, Z.; Chen, B.; Zhang, C.; Wang, L. Characteristics of Pore Structure and Fractal Dimension of Low-Rank Coal: A Case Study of Lower Jurassic Xishanyao Coal in the Southern Junggar Basin, NW China. Fuel 2017, 193, 254–264. [Google Scholar] [CrossRef]
- Zheng, S.; Liu, Y.; Huang, F.; Liu, S.; Sang, S.; Dai, X.; Wang, M. Pore Structure Evolution of Coal After Supercritical CO2–Water–Rock Treatment: A Multifractal Analysis. Fractal Fract. 2025, 9, 144. [Google Scholar] [CrossRef]
- Liu, D.; Qiu, F.; Liu, N.; Cai, Y.; Guo, Y.; Zhao, B.; Qiu, Y. Pore Structure Characterization and Its Significance for Gas Adsorption in Coals: A Comprehensive Review. Unconv. Resour. 2022, 2, 139–157. [Google Scholar] [CrossRef]
- Yu, S.; Bo, J.; Fengli, L.; Jiegang, L. Structure and Fractal Characteristic of Micro- and Meso-Pores in Low, Middle-Rank Tectonic Deformed Coals by CO2 and N2 Adsorption. Microporous Mesoporous Mater. 2017, 253, 191–202. [Google Scholar] [CrossRef]
- Liu, X.; Nie, B. Fractal Characteristics of Coal Samples Utilizing Image Analysis and Gas Adsorption. Fuel 2016, 182, 314–322. [Google Scholar] [CrossRef]
- Yang, Y.; Wei, J.; Zhu, W.; Xu, D.; Bai, K.; Zhang, A.; Zhou, X.; Zeng, Q.; Wang, A.; Li, Y.; et al. Pore Structure Sensitivity to External Fluids for Coal Reservoir and Fracturing Initiation/Propagation Mechanism by Using the T1 ∼ T2 NMR Spectrum and Physical Simulation Experiment. Energy Fuels 2023, 37, 222–236. [Google Scholar] [CrossRef]
- Liu, G.; Zhang, Z.; Cao, Y.; Wang, X.; Liu, H.; Li, B.; Si, N.; Guan, W. An Analogical Method on Fractal Dimension for Three-Dimensional Fracture Tortuosity in Coal Based on CT Scanning. Fractals 2023, 31, 2350072. [Google Scholar] [CrossRef]
- Zhang, Z.; Liu, G.; Chang, P.; Wang, X.; Lin, J. Fractal Characteristics for Coal Chemical Structure: Principle, Methodology and Implication. Chaos Solitons Fractals 2023, 173, 113699. [Google Scholar] [CrossRef]
- Zhang, Z.; Liu, G.; Liu, H.; Wang, X.; Lin, J.; Barakos, G.; Chang, P. Fractal Characterization on Methane Adsorption in Coal Molecular Structure. Phys. Fluids 2024, 36, 126611. [Google Scholar] [CrossRef]
- Feng, K.; Liu, G.; Zhang, Z.; Liu, H.; Lv, R.; Wang, X.; Chang, P.; Lin, J.; Barakos, G. Fractal Strategy for Improving Characterization of N2 Adsorption–Desorption in Mesopores. Fractal Fract. 2024, 8, 617. [Google Scholar] [CrossRef]
- Wei, Q.; Zheng, K.; Hu, B.; Li, X.; Feng, S.; Jiang, W.; Zhu, W.; Feng, W. Methane Adsorption Capacity of Deep-Buried Coals Based on Pore Structure in the Panji Deep Area of Huainan Coalfield, China. Energy Fuels 2021, 35, 4775–4790. [Google Scholar] [CrossRef]
- Wang, T.; Zhou, G.; Fan, L.; Zhang, D.; Shao, M.; Ding, R.; Li, Y.; Hu, H.; Deng, Z. Full-Scale Pore and Microfracture Characterization of Deep Coal Reservoirs: A Case Study of the Benxi Formation Coal in the Daning–Jixian Block, China. Int. J. Energy Res. 2024, 2024, 5772264. [Google Scholar] [CrossRef]
- Zhang, X.; Zhang, X.; Liu, J.; Pang, S.; Zhu, K.; Zheng, Z. Multi-Scale Quantitative Characterization of Three-Dimensional Pores and Fissures in Deep Coal and Study of the Evolution Laws. Constr. Build. Mater. 2024, 449, 138449. [Google Scholar] [CrossRef]
- Li, Q.; Wu, Y.; Qiao, L. Comprehensive Characterization and Metamorphic Control Analysis of Full Apertures in Different Coal Ranks within Deep Coal Seams. Appl. Sci. 2024, 14, 8566. [Google Scholar] [CrossRef]
- GB/T 212-2008; Proximate Analysis of Coal. Standardization Administration: Beijing, China, 2008.
- Sing, K.S.W. Reporting Physisorption Data for Gas/Solid Systems with Special Reference to the Determination of Surface Area and Porosity (Recommendations 1984). Pure Appl. Chem. 1985, 57, 603–619. [Google Scholar] [CrossRef]
- Song, S.-B.; Liu, J.-F.; Yang, D.-S.; Ni, H.-Y.; Huang, B.-X.; Zhang, K.; Mao, X.-B. Pore Structure Characterization and Permeability Prediction of Coal Samples Based on SEM Images. J. Nat. Gas Sci. Eng. 2019, 67, 160–171. [Google Scholar] [CrossRef]
- Washburn, E.W. The Dynamics of Capillary Flow. Phys. Rev. 1921, 17, 273–283. [Google Scholar] [CrossRef]
- Brunauer, S.; Emmett, P.H.; Teller, E. Adsorption of Gases in Multimolecular Layers. J. Am. Chem. Soc. 1938, 60, 309–319. [Google Scholar] [CrossRef]
- Barrett, E.P.; Joyner, L.G.; Halenda, P.P. The Determination of Pore Volume and Area Distributions in Porous Substances. I. Computations from Nitrogen Isotherms. J. Am. Chem. Soc. 1951, 73, 373–380. [Google Scholar] [CrossRef]
- Ross, D.J.K.; Marc Bustin, R. The Importance of Shale Composition and Pore Structure upon Gas Storage Potential of Shale Gas Reservoirs. Mar. Pet. Geol. 2009, 26, 916–927. [Google Scholar] [CrossRef]
- Evans, R.; Marconi, U.M.B.; Tarazona, P. Capillary Condensation and Adsorption in Cylindrical and Slit-like Pores. J. Chem. Soc. Faraday Trans. 2 Mol. Chem. Phys. 1986, 82, 1763–1787. [Google Scholar] [CrossRef]
- Curtis, M.E.; Sondergeld, C.H.; Ambrose, R.J.; Rai, C.S. Microstructural Investigation of Gas Shales in Two and Three Dimensions Using Nanometer-Scale Resolution Imaging. AAPG Bull. 2012, 96, 665–677. [Google Scholar] [CrossRef]
- Deng, G.; Zheng, R. Micropore Structure and Fractal Characteristics of Low-Permeability Coal Seams. Adv. Mater. Sci. Eng. 2018, 2018, 4186280. [Google Scholar] [CrossRef]
- You, L.; Chen, Q.; Kang, Y.; Yu, Y.; He, J. Evaluation of Formation Damage Using Microstructure Fractal in Shale Reservoirs. Fractals 2015, 23, 1540008. [Google Scholar] [CrossRef]
- Wang, G.; Ju, Y.; Bao, Y.; Yan, Z.; Li, X.; Bu, H.; Li, Q. Coal-Bearing Organic Shale Geological Evaluation of Huainan–Huaibei Coalfield, China. Available online: https://pubs.acs.org/doi/abs/10.1021/ef501285x (accessed on 28 December 2024).
- Song, H.; Min, L.; Jun, X.; Lushi, S.; Peisheng, L.; Sheng, S.; Xuexin, S. Fractal Characteristic of Three Chinese Coals. Fuel 2004, 83, 1307–1313. [Google Scholar] [CrossRef]
- Xie, H.; Wang, J.; Qan, P. Fractal Characters of Micropore Evolution in Marbles. Phys. Lett. A 1996, 218, 275–280. [Google Scholar] [CrossRef]
- Ye, Z.; Hou, E.; Duan, Z. Micrometer-Scale Pores and Fractures in Coals and the Effects of Tectonic Deformation on Permeability Based on Fractal Theory. AIP Adv. 2020, 10, 025118. [Google Scholar] [CrossRef]
- Zhang, S.; Tang, S.; Tang, D.; Huang, W.; Pan, Z. Determining Fractal Dimensions of Coal Pores by FHH Model: Problems and Effects. J. Nat. Gas Sci. Eng. 2014, 21, 929–939. [Google Scholar] [CrossRef]
- Wood, D.A. Estimating Organic-Rich Shale Fractal Dimensions from Gas Adsorption Isotherms: Combining Different Methods Leads to More Reliable Values and Insight. Nat. Resour. Res. 2021, 30, 3551–3574. [Google Scholar] [CrossRef]
- Pfeifer, P.; Wu, Y.J.; Cole, M.W.; Krim, J. Multilayer Adsorption on a Fractally Rough Surface. Phys. Rev. Lett. 1989, 62, 1997–2000. [Google Scholar] [CrossRef]
- Mandelbrot, B.B.; Wheeler, J.A. The Fractal Geometry of Nature. Am. J. Phys. 1983, 51, 286–287. [Google Scholar] [CrossRef]
- Li, Y.; Liu, W.; Song, D.; Ren, Z.; Wang, H.; Guo, X. Full-Scale Pore Characteristics in Coal and Their Influence on the Adsorption Capacity of Coalbed Methane. Environ. Sci. Pollut. Res. 2023, 30, 72187–72206. [Google Scholar] [CrossRef] [PubMed]
- Nie, B.; Liu, X.; Longlong, Y.; Meng, J.; Xiangchun, L. Pore Structure Characterization of Different Rank Coals Using Gas Adsorption and Scanning Electron Microscopy. Fuel 2015, 158, 908–917. [Google Scholar] [CrossRef]
- Bin, L.; Wei, Z.; Zhenhua, X.; Xiaojiao, C.; Yong, C. FTIR and XRD Microscopic Characterisation of Coal Samples with Different Degrees of Metamorphism. J. Mol. Struct. 2024, 1309, 138270. [Google Scholar] [CrossRef]
- Liu, L.; Ge, Z.; Zhou, Z.; Li, Z.; Deng, Q. Mineral Composition, Pore Structure and Mechanical Properties of Coal Measure Strata Rocks: A Case Study of Pingdingshan Coalfield. Sci. Total Environ. 2024, 952, 175944. [Google Scholar] [CrossRef]
- Dathe, A.; Eins, S.; Niemeyer, J.; Gerold, G. The Surface Fractal Dimension of the Soil–Pore Interface as Measured by Image Analysis. Geoderma 2001, 103, 203–229. [Google Scholar] [CrossRef]
- Jiao, K.; Yao, S.; Liu, C.; Gao, Y.; Wu, H.; Li, M.; Tang, Z. The Characterization and Quantitative Analysis of Nanopores in Unconventional Gas Reservoirs Utilizing FESEM–FIB and Image Processing: An Example from the Lower Silurian Longmaxi Shale, Upper Yangtze Region, China. Int. J. Coal Geol. 2014, 128–129, 1–11. [Google Scholar] [CrossRef]
- Liu, S.; Xue, H.; Zhao, M. Pore Structure and Fractal Characteristics of Coal Measure Shale in the Wuxiang Block in the Qinshui Basin. Processes 2023, 11, 3362. [Google Scholar] [CrossRef]
- Li, Z.; Liu, D.; Cai, Y.; Wang, Y.; Teng, J. Adsorption Pore Structure and Its Fractal Characteristics of Coals by N2 Adsorption/Desorption and FESEM Image Analyses. Fuel 2019, 257, 116031. [Google Scholar] [CrossRef]
- Thommes, M.; Kaneko, K.; Neimark, A.V.; Olivier, J.P.; Rodriguez-Reinoso, F.; Rouquerol, J.; Sing, K.S.W. Physisorption of Gases, with Special Reference to the Evaluation of Surface Area and Pore Size Distribution (IUPAC Technical Report). Pure Appl. Chem. 2015, 87, 1051–1069. [Google Scholar] [CrossRef]
- Han, W.; Zhou, G.; Gao, D.; Zhang, Z.; Wei, Z.; Wang, H.; Yang, H. Experimental Analysis of the Pore Structure and Fractal Characteristics of Different Metamorphic Coal Based on Mercury Intrusion-nitrogen Adsorption Porosimetry. Powder Technol. 2020, 362, 386–398. [Google Scholar] [CrossRef]
- Wang, L.; Wu, S.; Han, S.; Hu, B.; Wang, Q.; Zhang, K.; Song, T. Fractal Analysis of Coal Pore Structure Based on Low-Pressure Gas Adsorption and Its Influence on Methane Adsorption Capacity: A Perspective from Micropore Filling Model. Energy Fuels 2024, 38, 4031–4046. [Google Scholar] [CrossRef]
- Jiang, J.; Yang, W.; Cheng, Y.; Zhao, K.; Zheng, S. Pore Structure Characterization of Coal Particles via MIP, N2 and CO2 Adsorption: Effect of Coalification on Nanopores Evolution. Powder Technol. 2019, 354, 136–148. [Google Scholar] [CrossRef]
- Wang, G.; Ju, Y.; Yan, Z.; Li, Q. Pore Structure Characteristics of Coal-Bearing Shale Using Fluid Invasion Methods: A Case Study in the Huainan–Huaibei Coalfield in China. Mar. Pet. Geol. 2015, 62, 1–13. [Google Scholar] [CrossRef]
- Zhao, Y.; Liu, S.; Elsworth, D.; Jiang, Y.; Zhu, J. Pore Structure Characterization of Coal by Synchrotron Small-Angle X-Ray Scattering and Transmission Electron Microscopy. Energy Fuels 2014, 28, 3704–3711. [Google Scholar] [CrossRef]
- Labani, M.M.; Rezaee, R.; Saeedi, A.; Hinai, A.A. Evaluation of Pore Size Spectrum of Gas Shale Reservoirs Using Low Pressure Nitrogen Adsorption, Gas Expansion and Mercury Porosimetry: A Case Study from the Perth and Canning Basins, Western Australia. J. Pet. Sci. Eng. 2013, 112, 7–16. [Google Scholar] [CrossRef]
- Liu, X.; Kong, X.; Nie, B.; Song, D.; He, X.; Wang, L. Pore Fractal Dimensions of Bituminous Coal Reservoirs in North China and Their Impact on Gas Adsorption Capacity. Nat. Resour. Res. 2021, 30, 4585–4596. [Google Scholar] [CrossRef]
- Song, D.; Ji, X.; Li, Y.; Zhao, H.; Song, B.; He, K. Heterogeneous Development of Micropores in Medium-High Rank Coal and Its Relationship with Adsorption Capacity. Int. J. Coal Geol. 2020, 226, 103497. [Google Scholar] [CrossRef]
- Yang, F.; Ning, Z.; Liu, H. Fractal Characteristics of Shales from a Shale Gas Reservoir in the Sichuan Basin, China. Fuel 2014, 115, 378–384. [Google Scholar] [CrossRef]
- Cai, Y.; Liu, D.; Pan, Z.; Yao, Y.; Li, J.; Qiu, Y. Pore Structure and Its Impact on CH4 Adsorption Capacity and Flow Capability of Bituminous and Subbituminous Coals from Northeast China. Fuel 2013, 103, 258–268. [Google Scholar] [CrossRef]
- Guo, F.; Liu, G.; Zhang, Z.; Lv, R.; Xian, B.; Lin, J.; Barakos, G.; Chang, P. A Fractal Adsorption Model on Methane in Coal with Temperature Effect Dependence. Fractal Fract. 2024, 8, 370. [Google Scholar] [CrossRef]
- Zhang, Z.; Liu, G.; Wang, X.; Lv, R.; Liu, H.; Lin, J.; Barakos, G.; Chang, P. A Fractal Langmuir Adsorption Equation on Coal: Principle, Methodology and Implication. Chem. Eng. J. 2024, 488, 150869. [Google Scholar] [CrossRef]
- Zhang, Z.; Liu, G.; Liu, H.; Wang, X.; Lin, J.; Barakos, G.; Chang, P. Fractal Dynamics Model of Gas Adsorption in Porous Media. Phys. Fluids 2025, 37, 016623. [Google Scholar] [CrossRef]
Disclaimer/Publisher’s Note: The statements, opinions and data contained in all publications are solely those of the individual author(s) and contributor(s) and not of MDPI and/or the editor(s). MDPI and/or the editor(s) disclaim responsibility for any injury to people or property resulting from any ideas, methods, instructions or products referred to in the content. |
© 2025 by the authors. Licensee MDPI, Basel, Switzerland. This article is an open access article distributed under the terms and conditions of the Creative Commons Attribution (CC BY) license (https://creativecommons.org/licenses/by/4.0/).