Abstract
Optical feedback interferometry (OFI) applied to microscale flow sensing is studied theoretically and experimentally. A new model is investigated that predicts the OFI signal. This model is based on the Lang-Kobayashi equations and highlights the importance of the laser beam propagation and the laser-particle scattering performances. For the first time, the angle distribution of the scattered light is involved in the model. The model evaluates the impact on the OFI signal of the light propagation in the micro-scale channel geometry. The flow rate measurement shows good agreement with the model.
1. Introduction
Thanks to many advantages such as high speed, reduction of reagent consumption, and lowered cost, microfluidic systems are of great interest in bio-medical and chemical engineering domains. Consequently, many characterizations are required in microfluidic applications, among which volume flow rate sensing takes much attention. By inducing many benefits such as compact, self-aligned, low-cost, optical feedback interferometry (OFI) is a promising technique on microfluidic sensing topic, various related research works have been reported [1]. However, OFI based microfluidic flowmeter sensor study remains indeed challenging. First, a large amount of particles with different velocities contribute to the OFI signal simultaneously, resulting in a complex signal with a continuous frequency spectrum. On the other side, because of the extremely small size and construction complexity, the influences on the OFI spectrum from the fluidic system structure should be taken into account.
In order to develop an appropriate OFI flowmetry sensor in microfluidic measurement, we had presented a novel simulation method for prediction of the Doppler frequency spectrum [2]. Here, this model is completed taking into account the dispersion of the light incident and scattered propagation directions.
2. Materials and Methods
2.1. OFI Theoretical Fundamental
When the laser beam is pointing on a moving target, the Doppler shifted reflected or scattered light from the target re-enters the cavity where it interacts with the laser free-running light. This interaction results in an oscillation of the laser output power Pf, which can be express as [3]
where is the initial power, is the Doppler frequency shift due to the target velocity, is a constant that defines the feedback strength and depends on the ratio of feedback light amplitude re-entering the laser cavity over the initial laser output power .
with the amplitude reflectivity of the laser output facet, the photon lifetime, and the round trip time of flight in the laser cavity.
In OFI flowmetry, the feedback perturbation is generated by many flowing particles in the channel. All the scattered light that re-enters the laser can modulate the output power. The OFI power can be considered as sum of all the scattered power contributions from each particle:
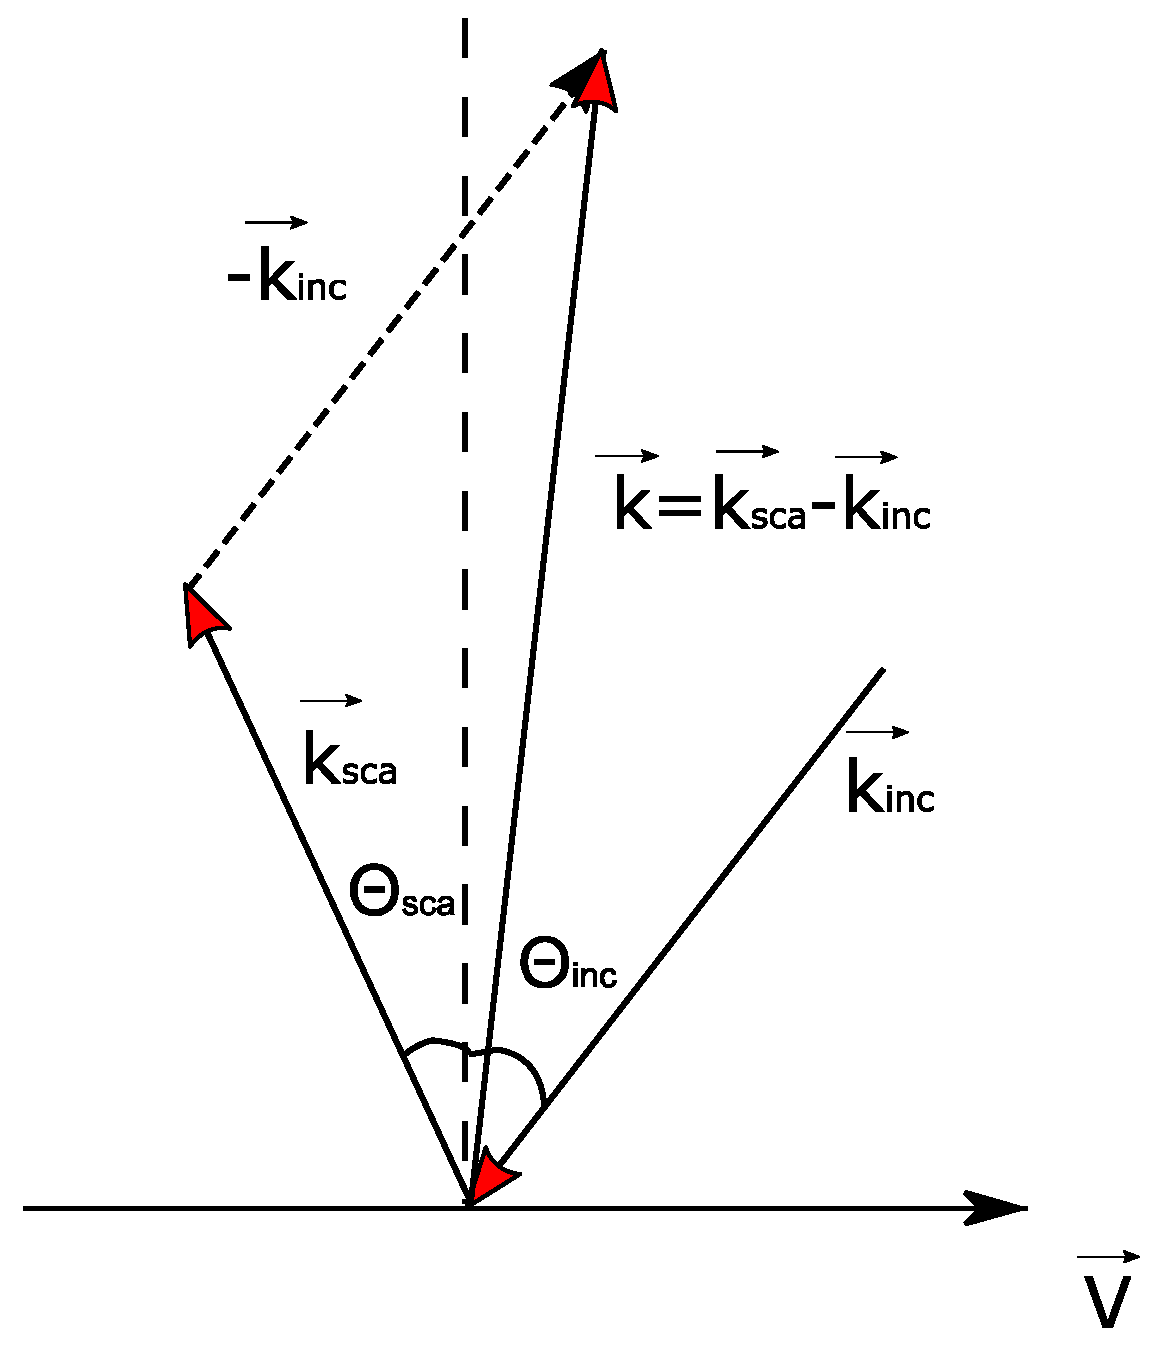
As sketched in Figure 1, both the incident wave and the scattered radiation are defined with reference to the perpendicular axis to the particle velocity vector . Thus the Doppler frequency is expressed under the following form
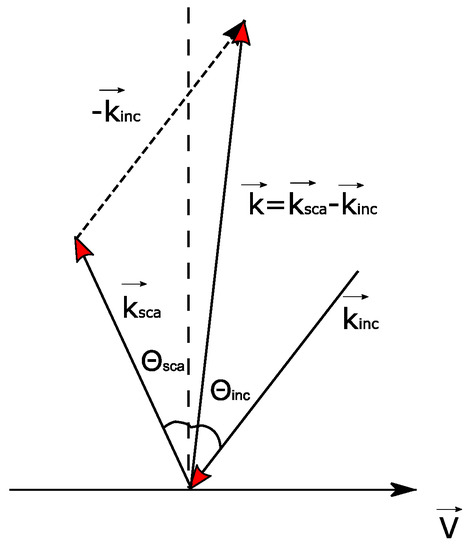
Figure 1.
The schematic of the incident and scattered light vector.
Taking into account the angular distribution on scattering and incident propagating directions, the OFI signal can be expressed as
2.2. Numerical Simulation
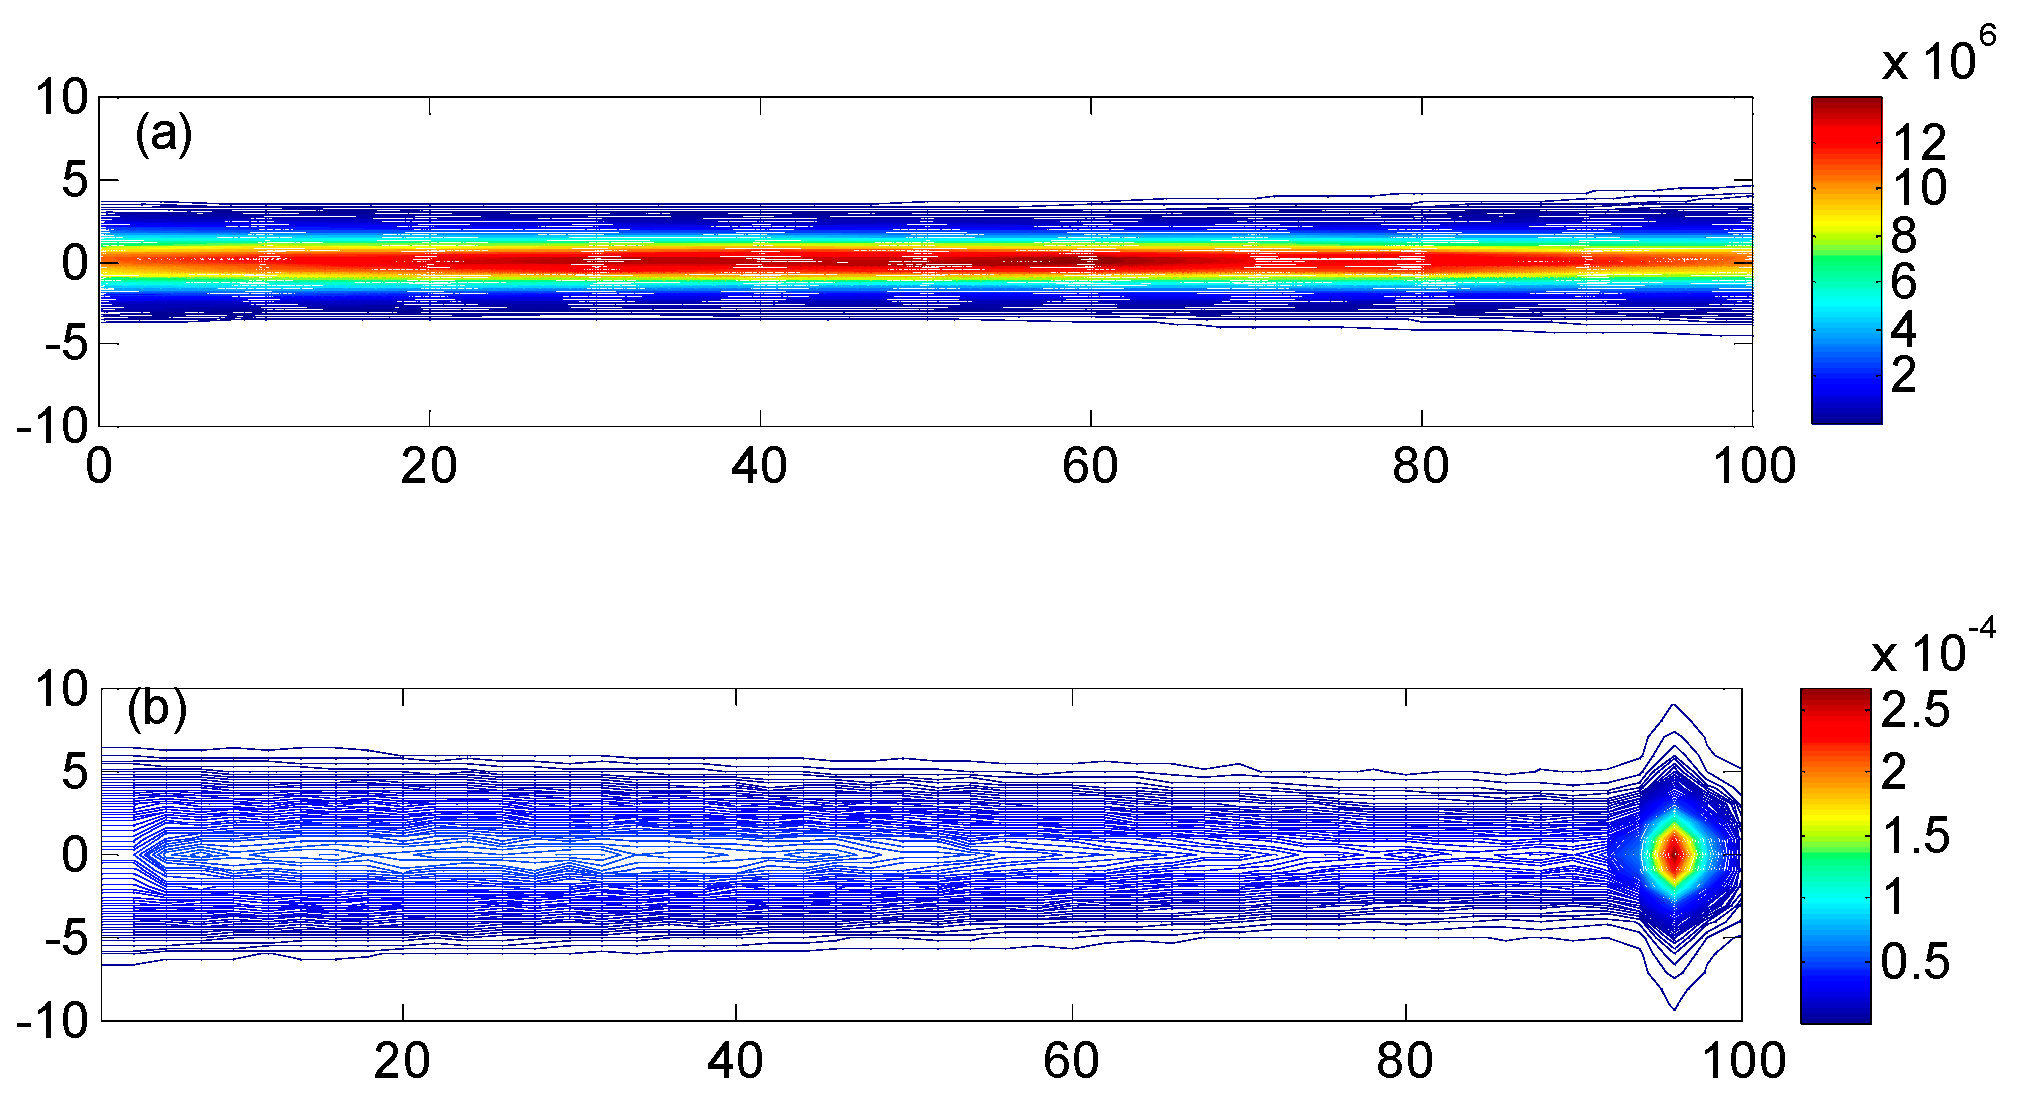
The entire OFI system and the channel are modeled by the ray tracing software ZEMAX. The illumination profile is depicted in Figure 2a. Then a cuboid mesh (14 µm × 14 µm × 100 µm) is built in the channel for 3D mapping, the three dimensions grid intervals are set as: dx = dy = 1 µm, dz = 0.5 µm. For each coordinates, a 4.89 µm PS micro sphere is placed at the node position and the ray tracing is performed to calculate scattered light power ratio over the initial output power .

Figure 2.
2D ZEMAX simulation mapping: (a) Incident irradiant profile; (b) Power fraction profile of back-scattered light in different particle positions.
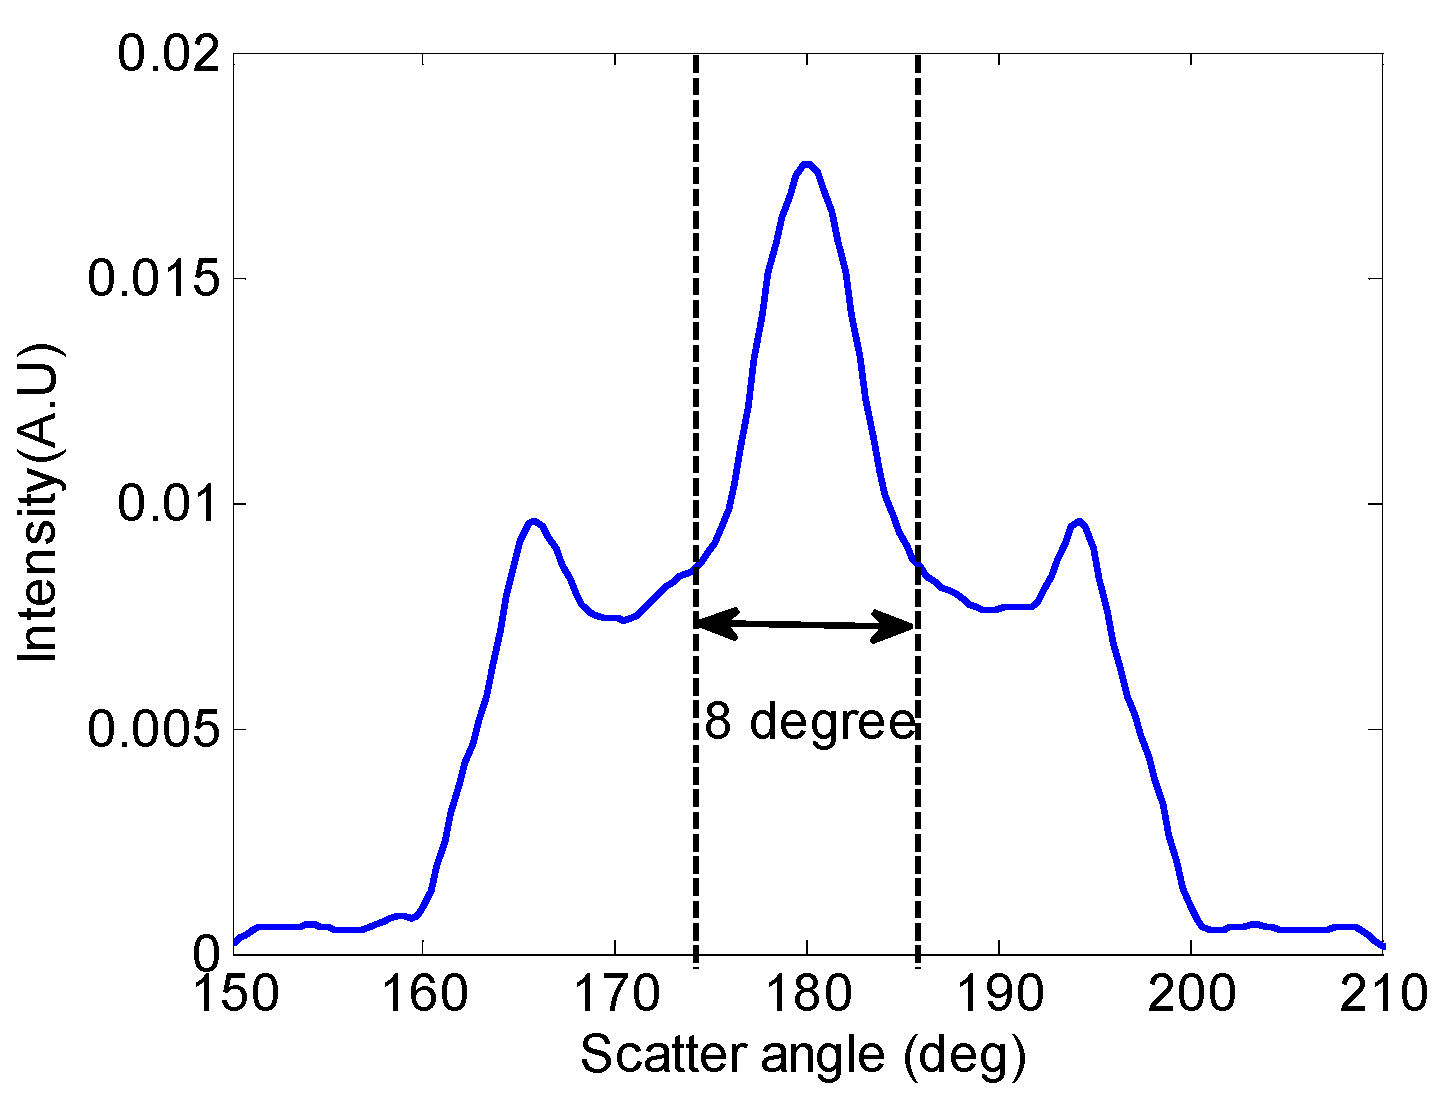
To investigate the position dependence of particle scattering properties, the same simulations are repeated at all particle coordinates in the mesh. The resulting 2D profile in the X-Z′ plane is plotted in Figure 2b while the illumination for each mesh coordinate is depicted in Figure 2a. As depicted in [2], the enhancement close to the back wall is due to the reflection on the wall of the forward scattered light. The angular distribution of the scattered light vector is simulated at Figure 3. Considering the VCSEL limited aperture, only ±2.5° range is taken account in the backwards direction as re-entering the cavity.
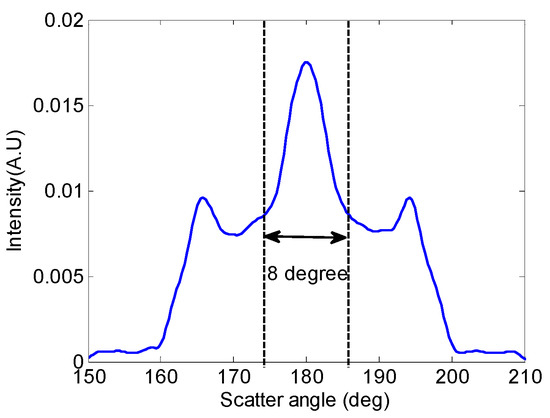
Figure 3.
Normalized scattered light radiation profile simulated as a function of the scatter angle.
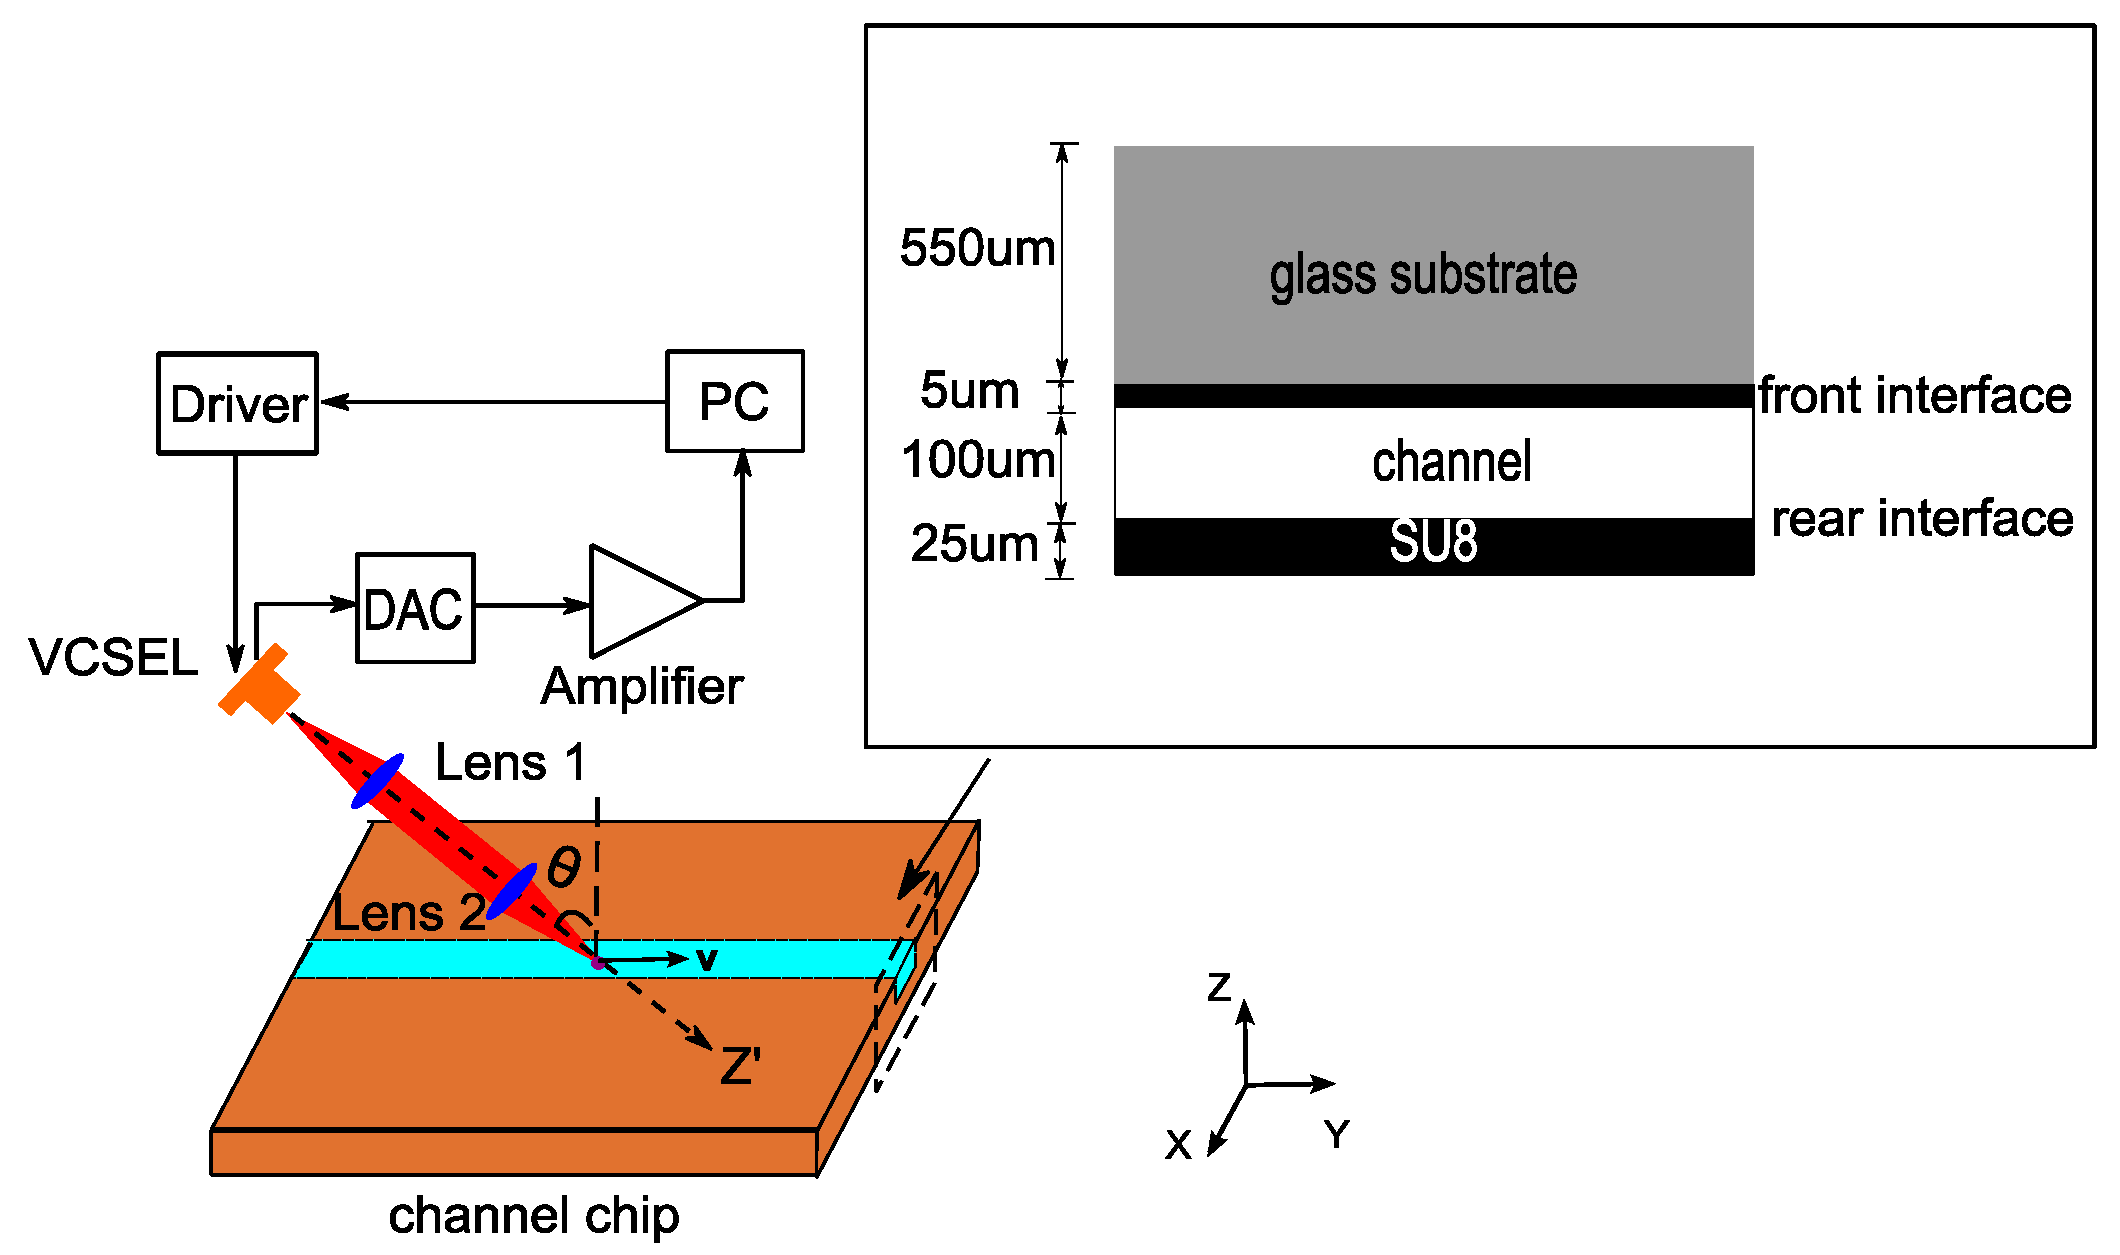
2.3. Experiments
The OFI flow rate measurements are performed with the setup depicted in Figure 4. The micro-reactor is a custom made SU-8 photoresist square channel with a 100 μm × 100 μm square cross-section. The schematic of the channel is presented in the inset of Figure 2. Polystyrene (PS) micro spheres are used as the scattering particles pumped into the channel in the Y direction. A commercial singlemode Vertical-Cavity Surface-Emitting Laser (VCSEL) at 670 nm is used as the laser source and detector, and its beam divergence angle (HWHM) is 5° under 3.5 mA current. The incident angle θ between the laser emission axis Z’ and the perpendicular to the plane of the channel chip is set to 15°.
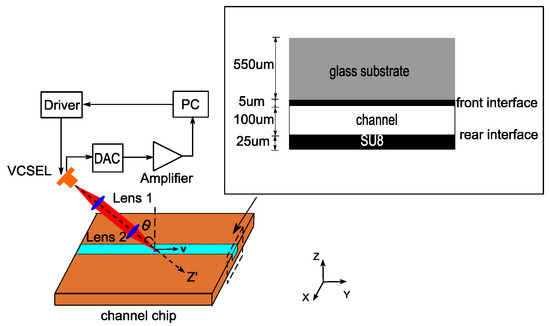
Figure 4.
Schematic of the experimental setup (inset: cross section of the microfluidic channel structure).
3. Results and Discussion
In Figure 5, the OFI signal spectrum simulated for a flow rate Q of 10 µL/min (in red) compared with the measured one (in blue). The simulated and measured Doppler signals are quite resembling. In particular, both spectra have a sharp peak at low frequency peak that corresponds to the reflection of the forward scattered light on the rear interface. Also, and despite certain visible differences, the signal spectrum is continuous up to a maximum frequency fd2 of 40 kHz that corresponds to the velocity in the center of the channel. The measured signal shows a 1/f trend that is not taken into account in the simulated signal, and for unclear reasons, the measured spectrum after the low-frequency peak is less flat than the simulated one.
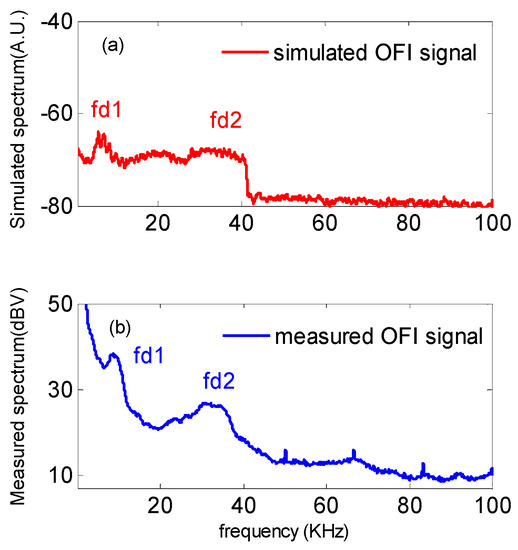
Figure 5.
OFI frequency spectrum with a flow rate of 10 μL/min. (a) Simulation; (b) Measurement
4. Conclusions
A novel numerical modeling approach of OFI sensing scheme in micro-scale fluidic systems is developed by merging simulations of fluid mechanics, optics propagation and laser rate equations. A new expression of the laser output power involving all the feedback perturbation from each scatterer is proposed. Moreover, the dependence of the OFI signal upon the scattering vector angular distribution is taken into account. Experimental results show a good agreement with the simulation and validate our model and methodology.
Acknowledgments
The authors acknowledge the funding support of China Scholarship Council.
Conflicts of Interest
The authors declare no conflict of interest.
References
- Campagnolo, L.; Nikolić, M.; Perchoux, J.; Lim, Y.L.; Bertling, K.; Loubière, K.; Prat, L.; Rakić, A.D.; Bosch, T. Flow profile measurement in microchannel using the optical feedback interferometry sensing technique. Microfluid. Nanofluid. 2013, 14, 113–119. Available online: http://link.springer.com/10.1007/s10404-012-1029-0 (accessed on 19 August 2014). [CrossRef]
- Zhao, Y.; Perchoux, J.; Campagnolo, L.; Camps, T.; Atashkhooei, R.; Bardinal, V. Optical feedback interferometry for microscale-flow sensing study: Numerical simulation and experimental validation. Opt. Express 2016, 24, 23849–23862. Available online: https://www.osapublishing.org/abstract.cfm?URI= oe-24-21-23849 (accessed on 9 June 2017). [CrossRef] [PubMed]
- Wang, W.M.; Boyle, W.J.; Grattan, K.T.; Palmer, A.W. Fiber-optic Doppler velocimeter that incorporates active optical feedback from a diode laser. Opt. Lett. 1992, 17, 819–821. Available online: https://www.osapublishing.org/abstract.cfm?URI=ol-17-11-819 (accessed on 9 May 2017). [CrossRef] [PubMed]

Publisher’s Note: MDPI stays neutral with regard to jurisdictional claims in published maps and institutional affiliations. |
© 2017 by the authors. Licensee MDPI, Basel, Switzerland. This article is an open access article distributed under the terms and conditions of the Creative Commons Attribution (CC BY) license (https://creativecommons.org/licenses/by/4.0/).