Article

An Advanced Compression Molding Simulation and Validation of a Thick-Walled Carbon Fiber Sheet Molding Compound Brake Caliper

1
Institute of Polymer Product Engineering, Johannes Kepler University Linz, Altenberger Str. 69, 4040 Linz, Austria
2
Institute of Automotive Engineering, Graz University of Technology, Inffeldgasse 11/II, 8010 Graz, Austria
3
Leartiker, Xemein Etorbidea 12 A, 48720 Markina-Xemein, Spain
*
Author to whom correspondence should be addressed.
J. Manuf. Mater. Process. 2025, 9(4), 137; https://doi.org/10.3390/jmmp9040137
Submission received: 12 March 2025 / Revised: 9 April 2025 / Accepted: 14 April 2025 / Published: 19 April 2025

Abstract

:
This study introduces a methodology for characterizing and modeling the viscosity and specific volume–pressure–temperature (pvT) behavior of sheet molding compound (SMC) materials, based on the use of specialized testing equipment. Conventional rheometers are inadequate for such materials due to the presence of long fibers, necessitating the use of specialized equipment like squeeze flow rheometers and pvT dilatometers. Our findings demonstrate that traditional oscillatoric rheometer measurements underestimate the viscosity of CF-SMCs, highlighting the need for advanced, albeit non-standardized, testing methods. Additionally, we found that standard Tait models failed to capture the temperature-dependent porosity of CF-SMCs at low pressures, whereas models based on thermodynamic state variables (TSVs) provided accurate predictions across a broader range of conditions. The study also addressed the complexities introduced by fiber–flow coupling and the fiber orientation in measuring the viscosity, revealing limitations in conventional modeling approaches. The numerical analysis showed that a power law-based anisotropic viscosity model (PL-IISO) combined with a TSV model offered the best predictive performance in finite volume flow simulations, especially for thick-walled regions. However, the current modeling approaches have limited predictive capabilities for the fiber orientation in thin-walled regions. This research underscores the challenges in accurately modeling CF-SMC materials in terms of the fiber orientation, whereas the compression forces needed from the pressing machine could be predicted accurately within an average error of 6.5% in the squeeze flow experiments.

1. Introduction

In recent years, the material class of sheet molding compounds (SMCs) has steadily gained more attention in applications related to public transportation, such as automotive and aviation applications. The reason for this can be attributed to their high mechanical properties, especially stiffness, while their weight is kept low. This qualifies sheet molding compounds as a potential alternative to replace heavy metal components without compromising the mechanical performance. Furthermore, SMCs are commonly processed using compression molding, which allows for short cycle times while producing high-quality components in relatively cheap molds compared to, e.g., those used in injection molding [1,2,3,4,5,6,7,8]. However, their mechanical properties are lower than the corresponding properties of continuous fiber-reinforced composites due to their inherently randomly distributed, discontinuous fiber bundles. These fiber bundles usually have a fiber length range between 15 mm and 50 mm and are embedded in thermoset matrices like epoxy or vinyl ester resins. As for traditional thermoset-based composites, carbon and glass fibers are the most commonly used reinforcement phases in SMCs [5,6,7]. Current research is also dealing with thermoplastic-based SMC materials since they have shown potential within a cascade recycling scheme for high-performance unidirectional fiber-reinforced tapes [9,10,11,12,13].
Nevertheless, SMC materials, based either on thermoset or thermoplastic matrix systems, reveal complex behavior in terms of their process–structure–property relationship as a result of their heterogeneous nature. This means that the resulting macroscopic properties of a component or structure are linked to the process conditions during compression molding and the established microstructure, including its voids, fillers and, most important, fiber orientation. As a result, adequate numerical simulation models are needed to allow for a correct prediction of the material properties and part performance within the design stage [4]. Whereas mechanical properties and the influence of the stochastic microstructure have frequently been investigated in the literature [14,15,16,17,18], the behavior of the material during processing is not fully understood yet, and different philosophies in terms of modeling exist. The flow behavior of randomly oriented, discontinuous fibers or fiber bundles impregnated within either a thermosetting or thermoplastic matrix is complex due to the inherent properties of the polymeric matrix, the fibers and the overall heterogeneity of the system. On the one hand, the viscosity of conventional matrix systems demonstrates a significant temperature and pressure dependency, superimposed by classical shear thinning behavior common for polymeric melts and resins. Additionally, crystallization effects in semi-crystalline polymers or ongoing curing under elevated temperatures in resins can influence the matrix flow behavior too [1,4,19,20,21]. On the other hand, the fibers incorporated in SMC materials are much longer (between 15 mm and 50 mm) than commercial injection molding grades, which are typically shorter than 5 mm. As a consequence, these fibers introduce a certain, for SMCs, non-neglectable, anisotropy during the flow of the material. Over the past decade, different fiber–flow coupling models have been developed and implemented in commercial simulation software, for example, the informed isotropic (IISO) viscosity model in Moldex3D 2024 (CoreTech System Co., Ltd, Zhubei City, Taiwan) developed by [2,22,23]. However, these models are usually based on assumptions valid for short fiber-reinforced injection molding grades, like a velocity gradient-based estimation of the fiber orientation, which provides some drawbacks when applying them to the fiber lengths used in SMCs. Due to the common assumption considering fibers as rigid, cylindrical rods, large-scale fiber bending deformations are not predicted accurately by these models [24,25,26]. The alternative approach of direct fiber simulation, as used, for example, by the software package 3DTimon version 10 (Toray Engineering D Solutions Co., Ltd., Tokyo, Japan Japan), shows the potential to better predict the fiber orientation of very long fibers [27]. In general, a different approach to modeling the behavior of SMC material during compression molding is to use a stress-based Lagrangian formulation [6] or combinations of Lagrangian and Eulerian formulations in, e.g., a coupled Eulerian–Lagrangian (CEL) solution [7,28,29]. Excessive element deformations and high computational costs are often limiting factors for this approach when it comes to large flowpath situations. At high deformation states, these issues can be solved through the utilization of a finite volume approach.
In addition to the flow behavior and fiber orientation evolution, the specific volume as a function of the temperature and pressure is essential to know for an accurate prediction of the required closing and compression forces. Therefore, Doppelbauer et al. [30] showed the necessity of using an advanced pressure–specific volume–temperature (pvT) model to consider the initial porosity, which is not possible with classical formulations like the Tait model [20,30]. Especially in thick-walled SMC components, a correctly predicted pressure distribution can help to identify regions which potentially include voids.
This study aimed to consider all the aspects and influencing parameters during the flow stage of sheet molding compound (SMC) materials produced through a compression molding process. Specifically, it focused on the application and validation of the fiber–flow-coupled IISO viscosity and various pressure–volume–temperature (pvT) models within a holistic flow simulation of a complex, thick-walled carbon fiber SMC (CF-SMC) brake caliper shell for motorcycles. The primary objective was to investigate whether advanced flow and specific volume models can accurately predict the fiber orientation in a thick-walled CF-SMC component using finite volume simulations. Detailed information about the investigated brake caliper can be found in [31,32]. Comparable studies on SMC materials used in thick-walled structures are sparse in the literature. However, Martulli et al. [33] examined the mechanical performance of an automotive component with a nominal wall thickness of 15 mm, which exceeded the typical values for similar SMC structures. The compression molding models used in this study were calibrated using experimental data from squeeze flow and pvT dilatometer measurements. For validation, computer tomography analysis was performed on the final brake caliper component and a dedicated region of interest to qualitatively and quantitatively assess the fiber orientation. These results were then compared with the fiber orientations obtained from numerical simulations. For a better understanding of the underlying workflow, Figure 1 provides an illustration of the sequentially conducted experimental and numerical steps within the framework of this study.

2. Materials and Methods

This section provides information about the materials and experimental methods used to characterize specific flow properties. For the validation of the calculated fiber orientation, computer tomography measurements were performed on full-scale brake caliper prototypes and dedicated smaller regions. Furthermore, data reduction and evaluation schemes are described.

2.1. Carbon Fiber-Reinforced Sheet Molding Compound

For the detailed analysis, characterization and manufacturing of a thick-walled motorcycle brake caliper, the carbon fiber-reinforced sheet molding compound (CF-SMC) material STR120N131 from the Mitsubishi Chemical Corporation (Tokyo, Japan) was used. According to the technical data sheet, the CF-SMC included 25.4 mm (1 inch) type TR50S fibers with a 15K tow size, which were incorporated into a vinyl ester resin matrix. Each fiber bundle had a width of 8 mm and a thickness of 0.115 mm according to [14]. A fiber content of 53 wt% resulted in an areal weight of 3100 g/m2 for the material sheets, which had a nominal sheet thickness of 2 mm. The recommended process settings according to the material supplier included a mold temperature of 140 °C, resulting in curing for 2–5 min per mm of CF-SMC material at a molding pressure of between 5 and 10 MPa [34,35].

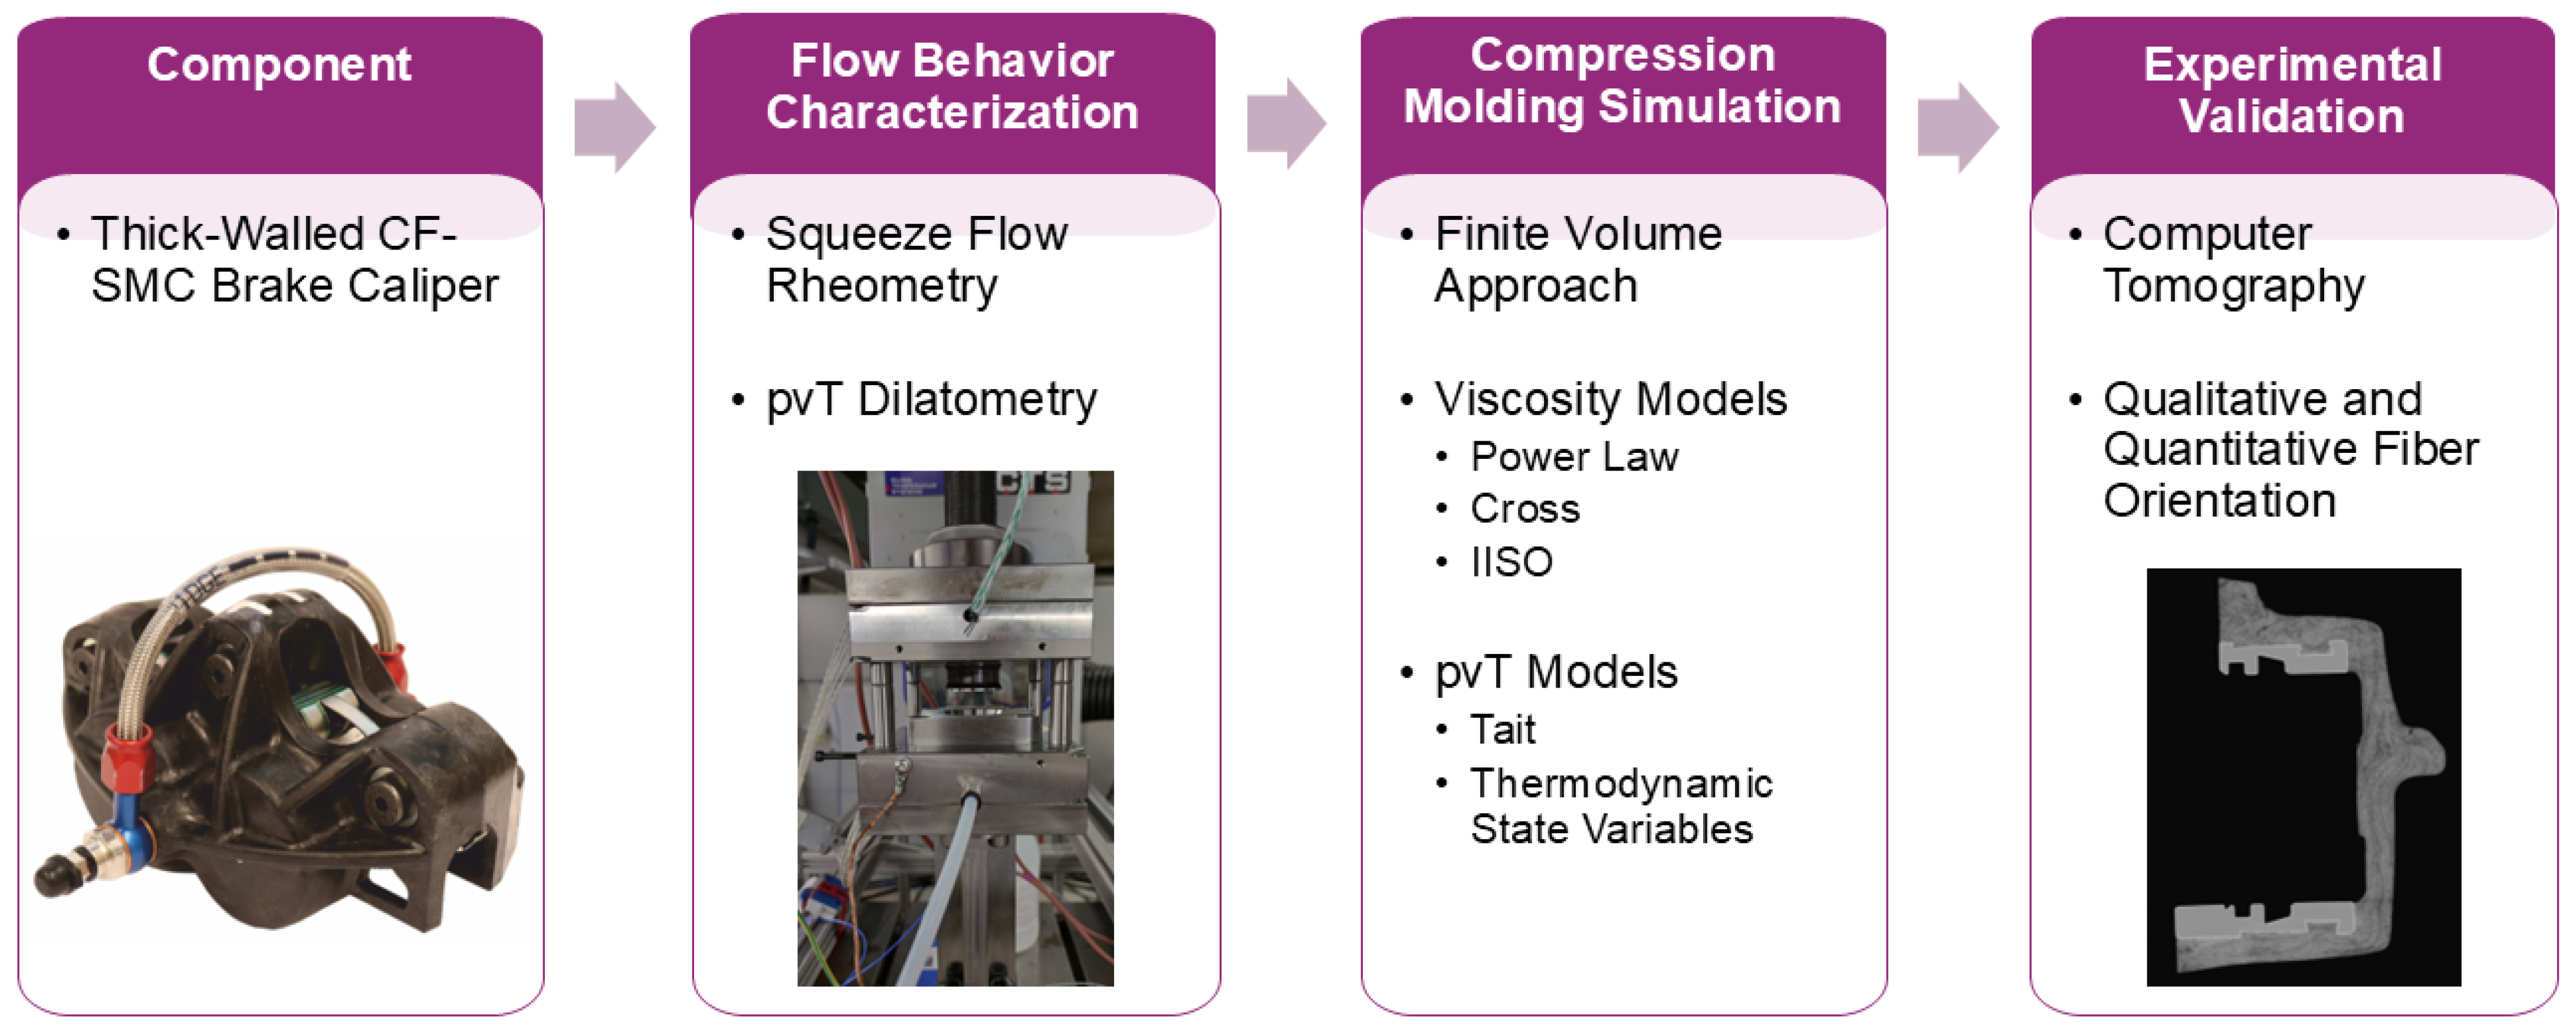
2.2. Experimental Methodology and Data Generation

In the following subsection, all equipment and test setups which were utilized to conduct physical experiments will be introduced. Furthermore, X-ray computer tomography images were used to determine the fiber orientation in the final brake caliper prototype.

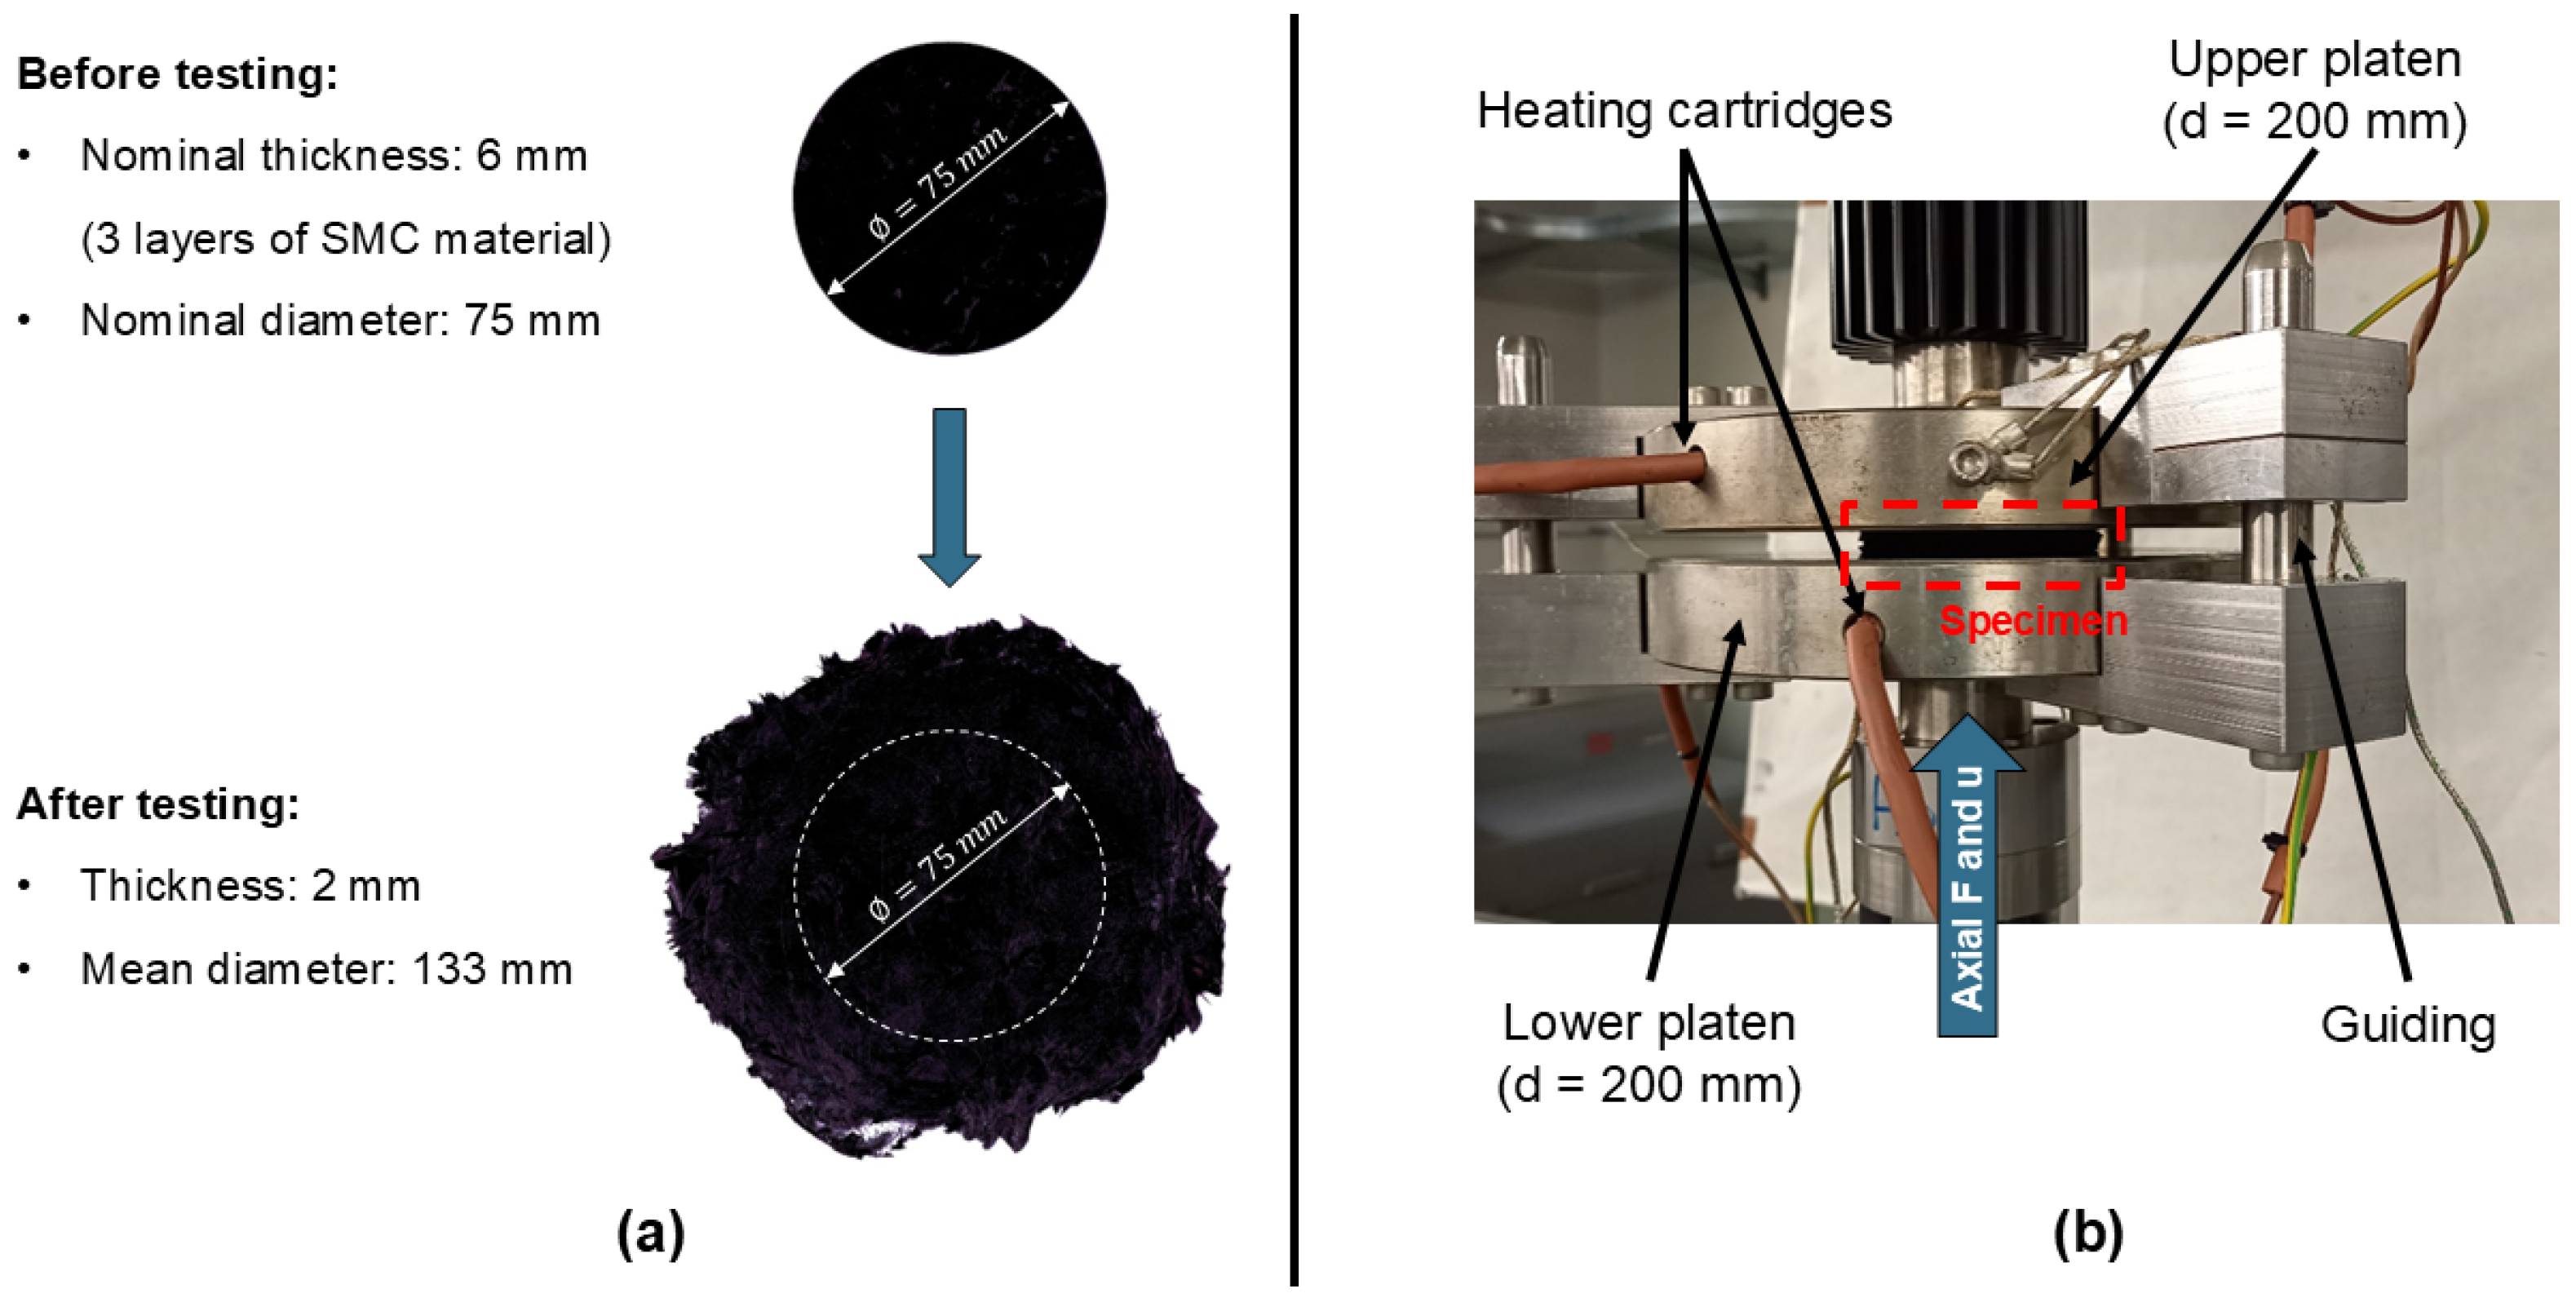
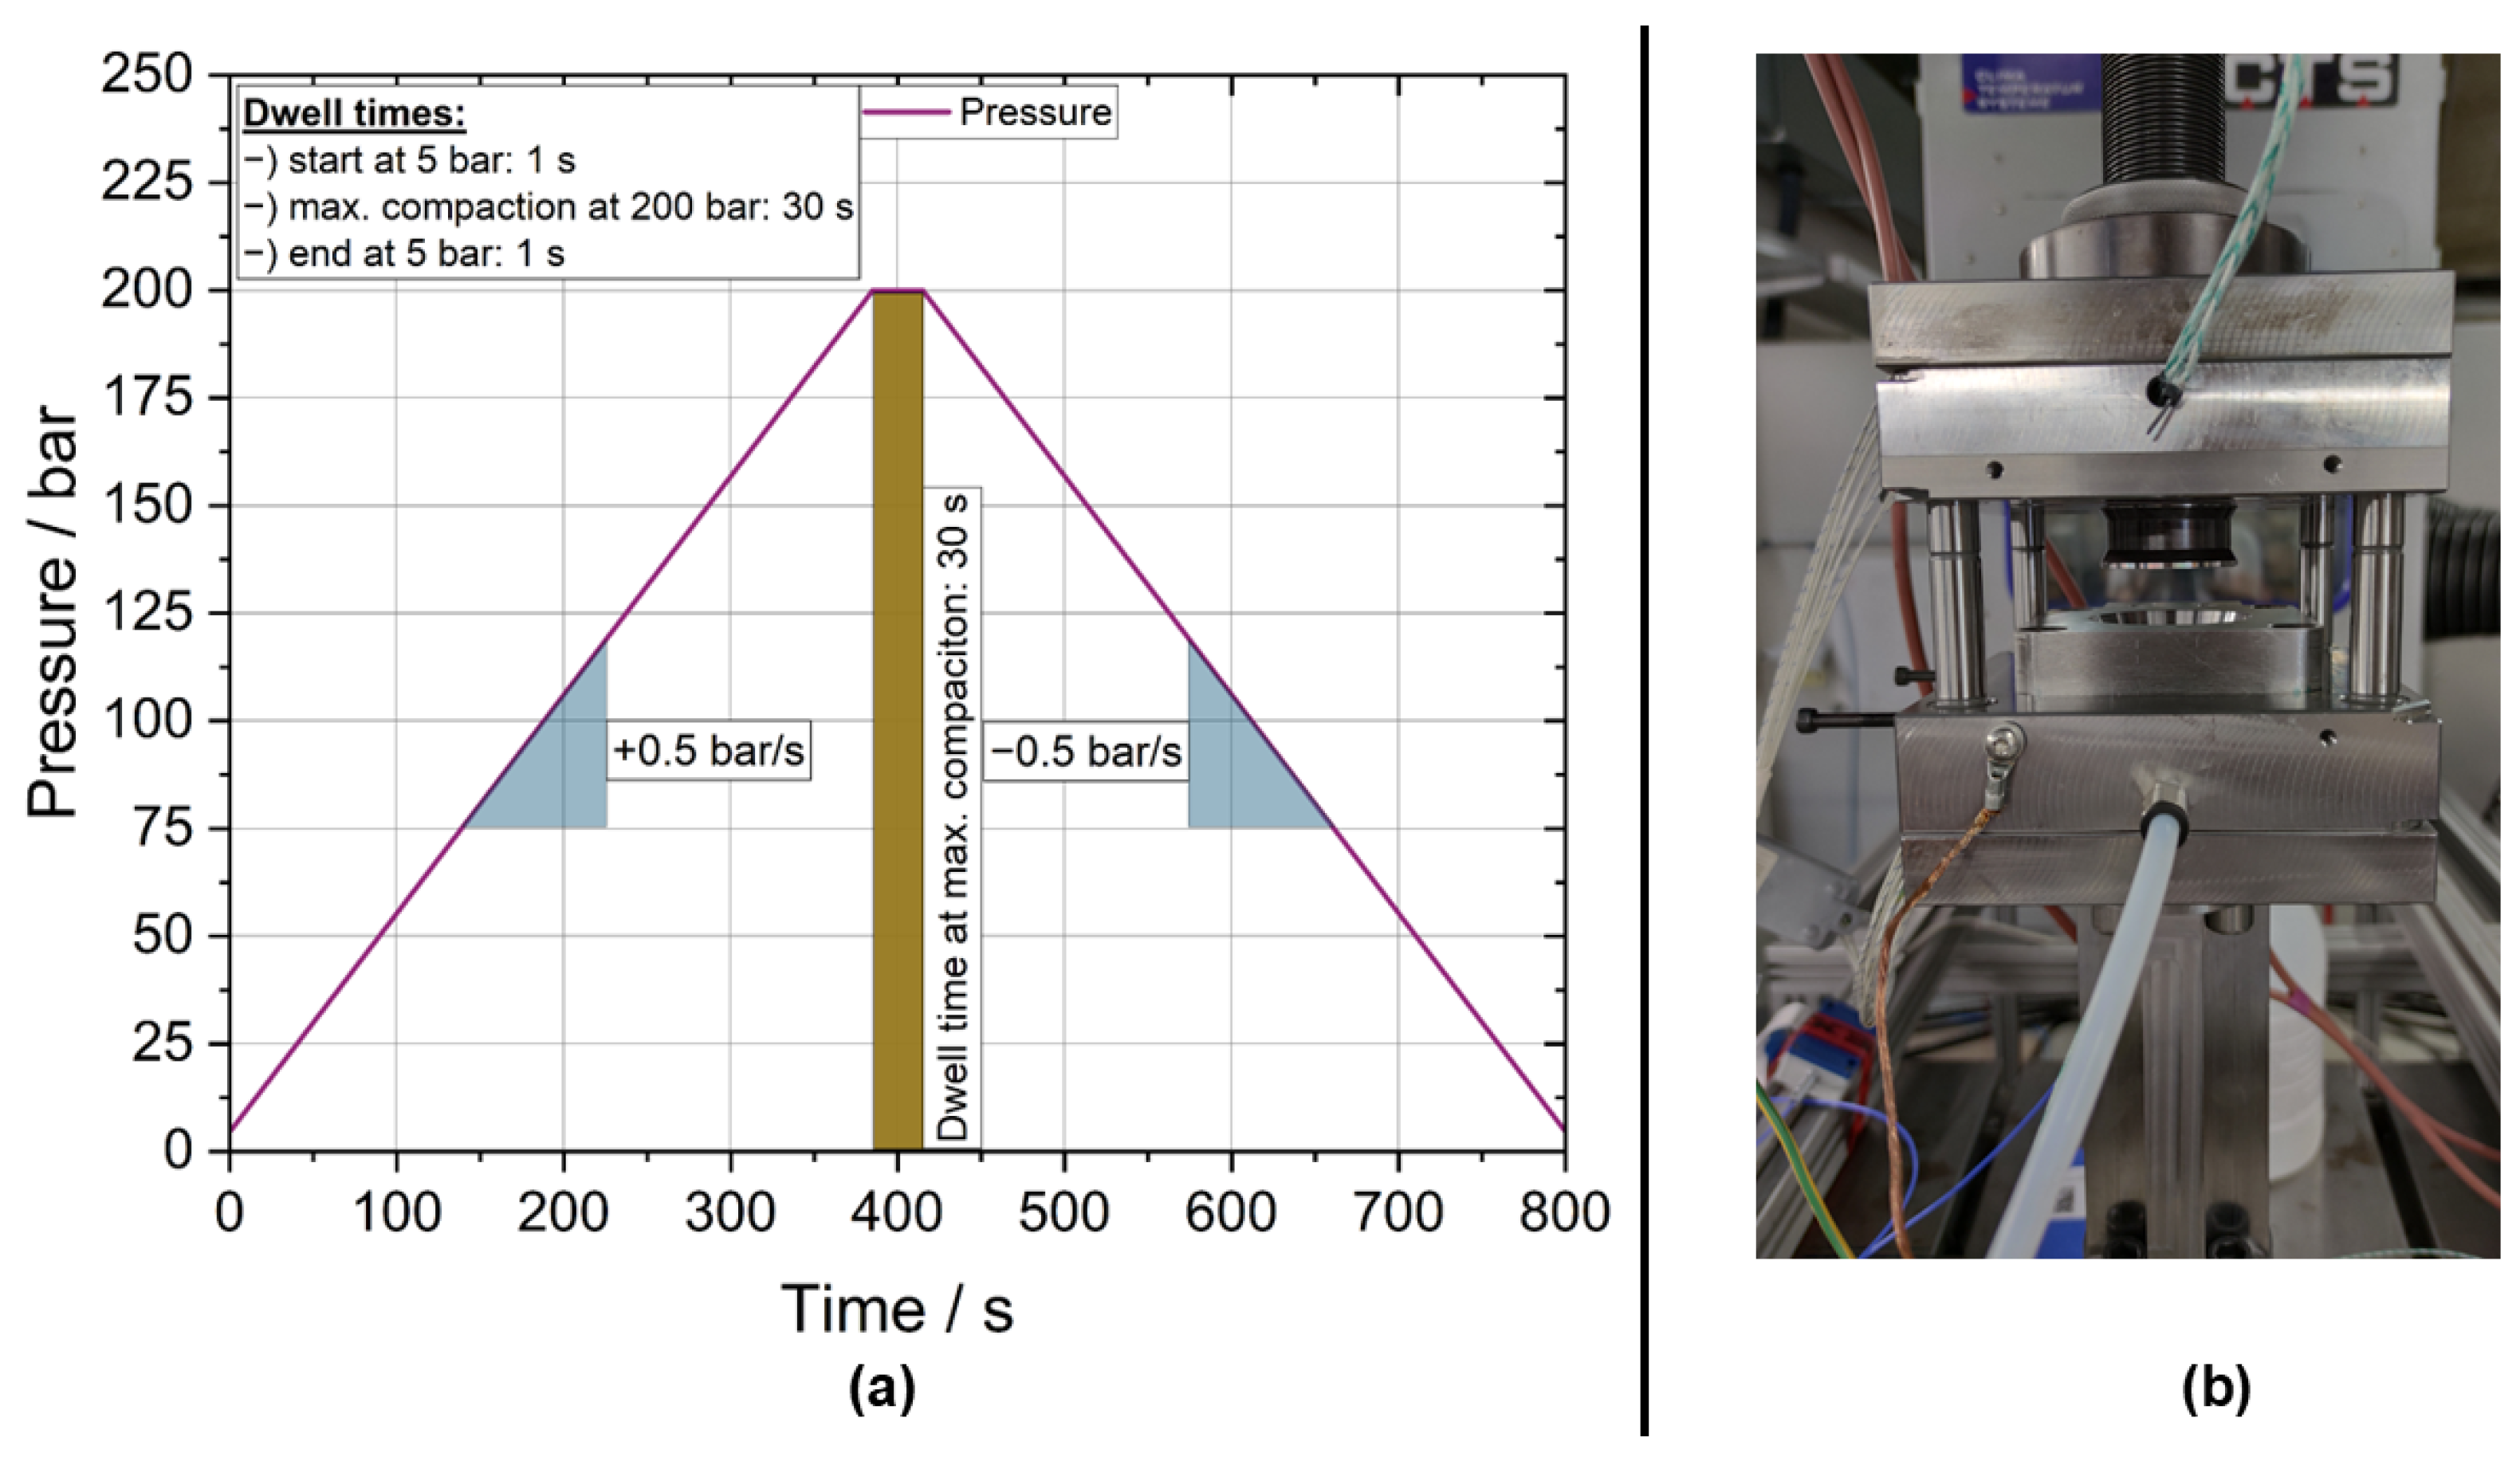
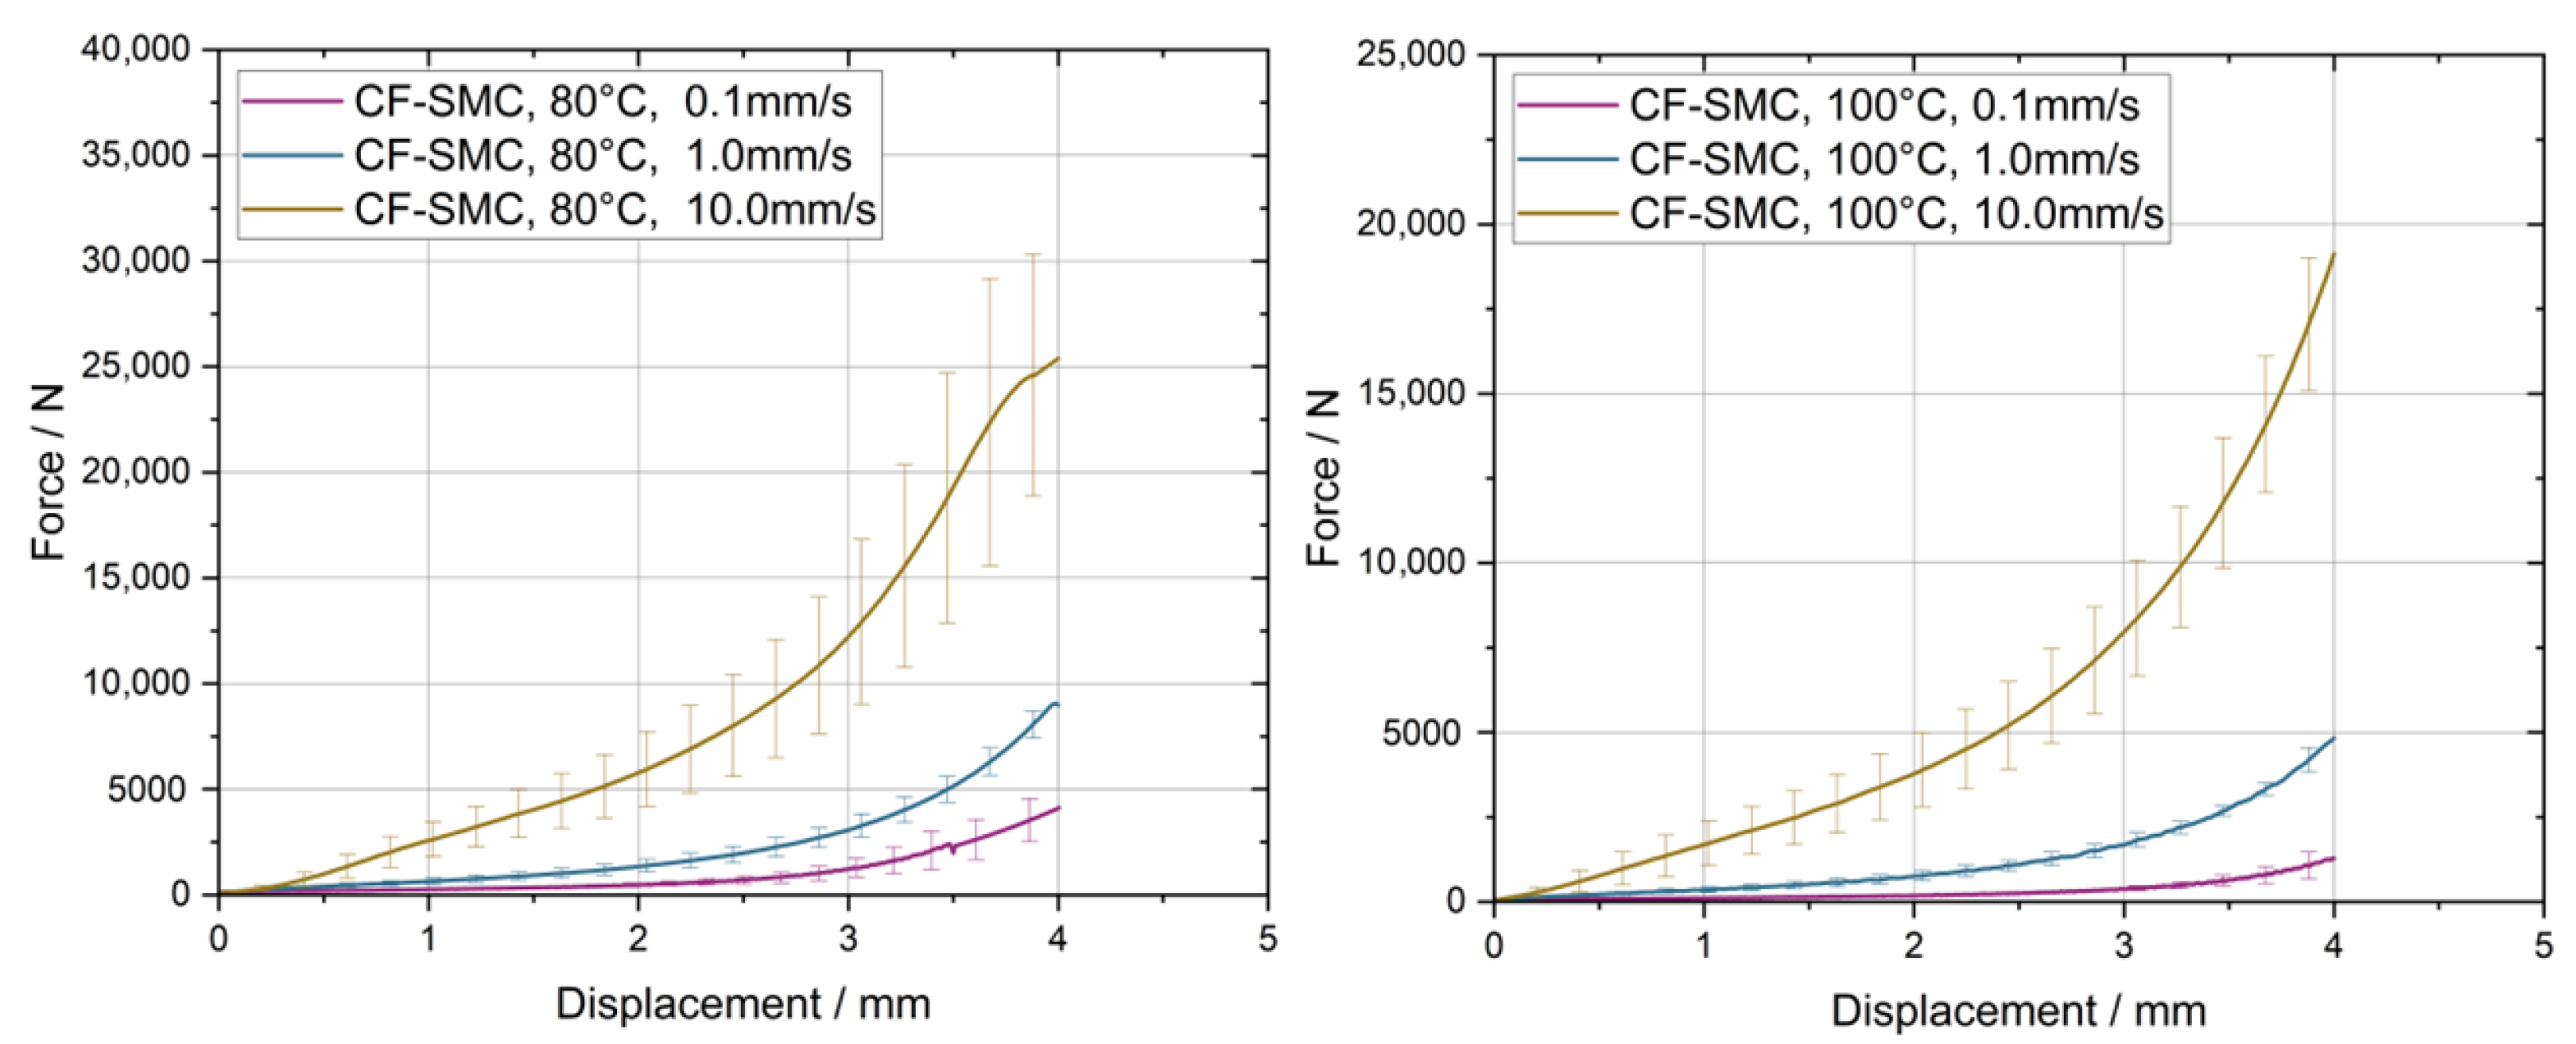
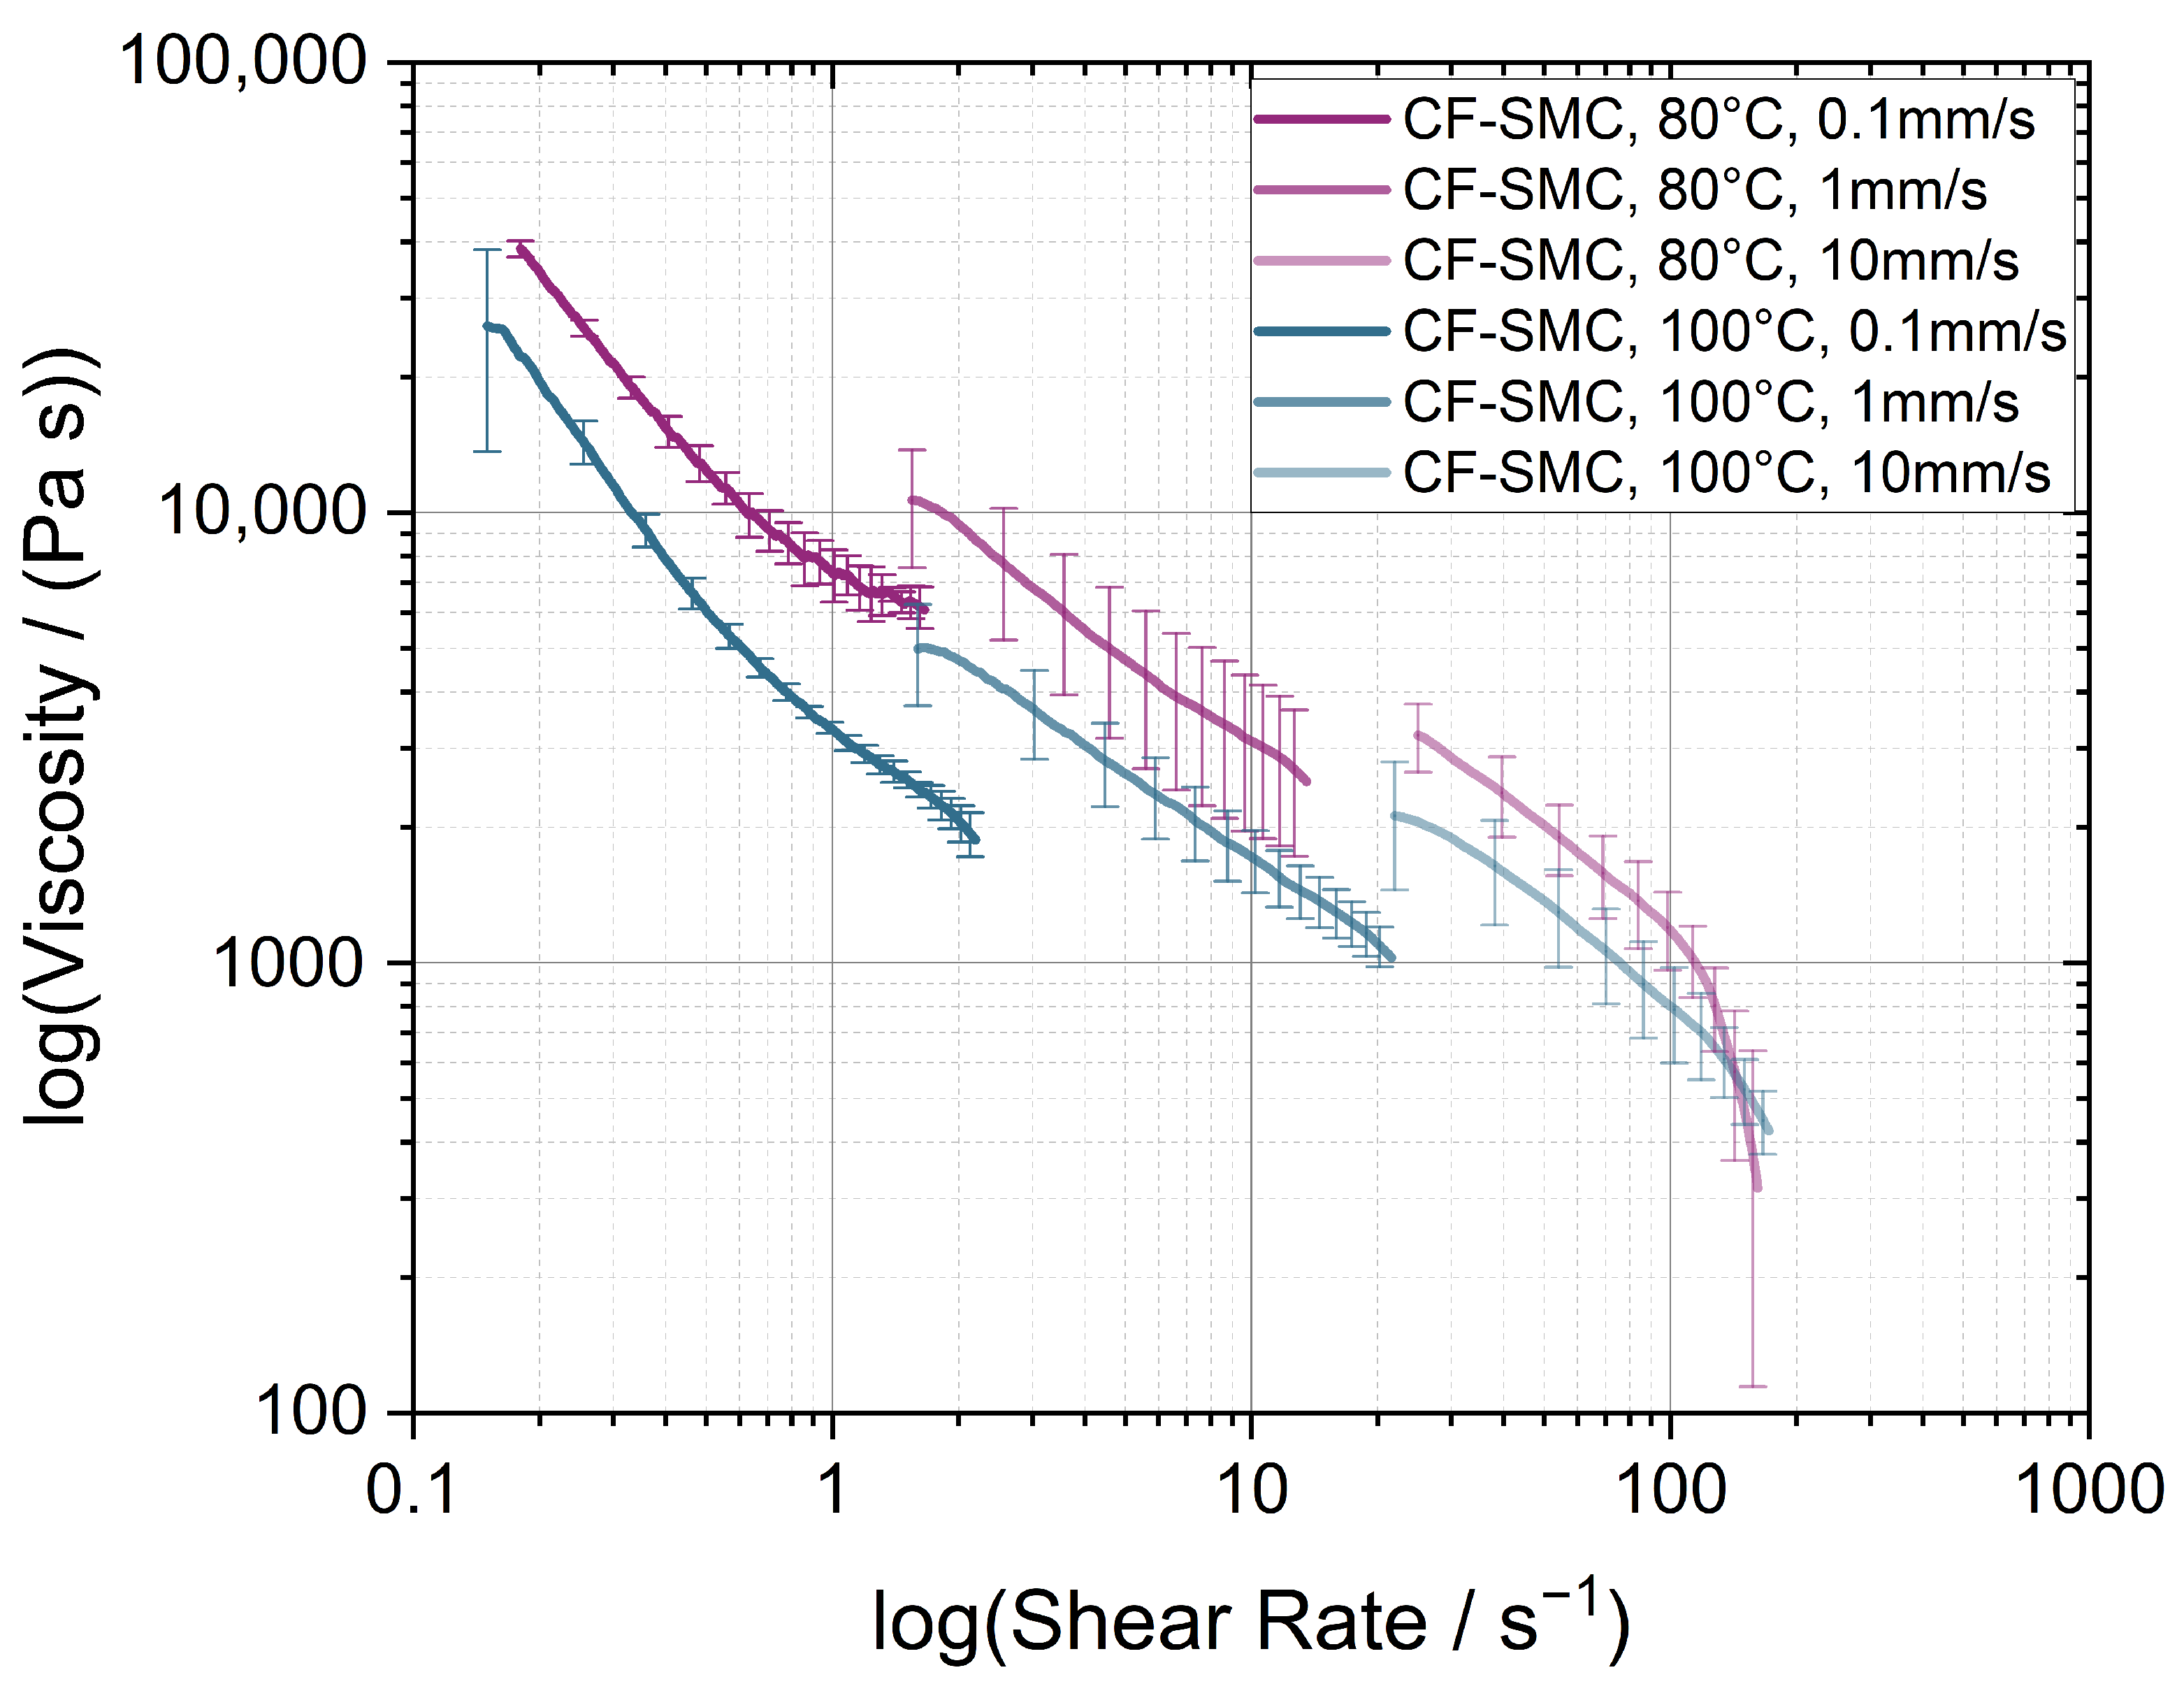
2.2.1. Squeeze Flow Rheometry

In the compression molding of SMCs, the flow behavior of the material is a combination of extension and shear flow, in contrast to the shear flow dominance in classical polymer processing methods like injection molding [21,36,37,38]. Thus, a squeeze flow rheometer consisting of two 30 mm thick circular steel platens with a diameter of 200 mm, initially developed in the work of Rienesl et al. [21], was used to experimentally investigate the flow behavior of the CF-SMC material. The temperature of the testing rig was controlled by eight 300 W heating cartridges (ASIM H1080S300A), with four cartridges placed in each platen, utilizing PID feedback control implemented in LabVIEW 14 (National Instruments Corporation, Austin, TX, USA) measurement software. Based on the signals from two thermocouples, one for each platen, which were placed in the center and close to the specimen contact surface, isothermal measurements at 80 °C and 100 °C were conducted. Numerical simulations and temperature measurements performed preliminarily confirmed a homogeneous temperature distribution for the upper and lower platens. Furthermore, the digital image correlation system ARAMIS 4M (Carl Zeiss GOM Metrology GmbH, Braunschweig, Germany) was used to record the radial flow front development of the material during the test. As a testing machine, the MTS 852 Damper Test System (MTS Systems Corporation, Eden Prairie, MN, USA) equipped with a 50 kN load cell was used to perform the displacement-controlled experiments at three different speeds of 0.1 mm/s, 1 mm/s and 10 mm/s. In terms of the specimen geometry, circular specimens with a nominal diameter of 75 mm and consisting of three single CF-SMC layers (equivalent to a nominal thickness of 6 mm) were used. In Figure 2a, an illustration of a representative specimen is shown, while in Figure 2b, the overall setup including the platens, thermocouples and guidings is shown. The experiment was repeated three times for each configuration. In addition, a water-based release agent was applied to the metallic platens before each measurement to ensure that the tested specimen could be removed from the testing rig after the experiment.
The axial force, F, and displacement, u, signals were recorded with a sampling rate of 300 Hz. Images of the evolving flow front and specimen shape were recorded accordingly, with a frame rate of 10 fps, throughout the measurement duration. In terms of the specimen shape, the actual specimen radius, R, and height, h, were measured accurately by using a Python script for edge detection. Subsequently, Stefan equations, valid for constant volume experiments, were used to derive proper viscosity curves. In principle, three main assumptions are included in the derivation according to Stefan: (i) the material is assumed to behave like a Newtonian fluid, (ii) is in a quasi-static flow state and (iii) no wall slip occurs between the tool surfaces and the material [21,39]. The corresponding relations for the viscosity, η , and shear rate, γ ˙ , are shown in Equations (1) and (2), respectively.
η = 2 F h 3 3 R 4 π u
γ ˙ = 3 v R 2 h 2
In Equation (2), the parameter v represents the constant speed of the moving platen.

2.2.2. Pressure–Volume–Temperature Dilatometry

The characterization of the CF-SMC´s pressure–specific volume–temperature (pvT) behavior was performed using a testing device designed in house, specifically for the analysis of SMC materials [30]. In the configuration used, the setup included a cylindrical cavity with a 20 mm height and a diameter of 50 mm. According to the requirements of the test setup, three circular specimens with a diameter of 50 mm were stacked, resulting in a nominal sample thickness of 6 mm. Five repeats were performed for each set of testing parameters. The measurements were conducted, similarly to the squeeze flow experiments, on the MTS 852 Damper Test System (MTS Systems Corporation, Eden Prairie, MN, USA) equipped with a 50 kN load cell. A LabView program ensured isothermal conditions in the cavity during the measurement by controlling eight heating cartridges. The pvT characteristics of the investigated material were measured at 80 °C and 100 °C. The compressive loading of the initially uncured CF-SMC material was applied in a force-controlled mode, where in the first step the material was compacted with a constant rate of 100 N/s. After reaching the maximum defined pressure of 200 bar, which was equivalent to a load of 39.3 kN, the force was kept constant for 30 s before deloading with a negative compression rate was performed. The conducted loading cycle is shown in Figure 3a, along with an image of the mounted setup in Figure 3b.

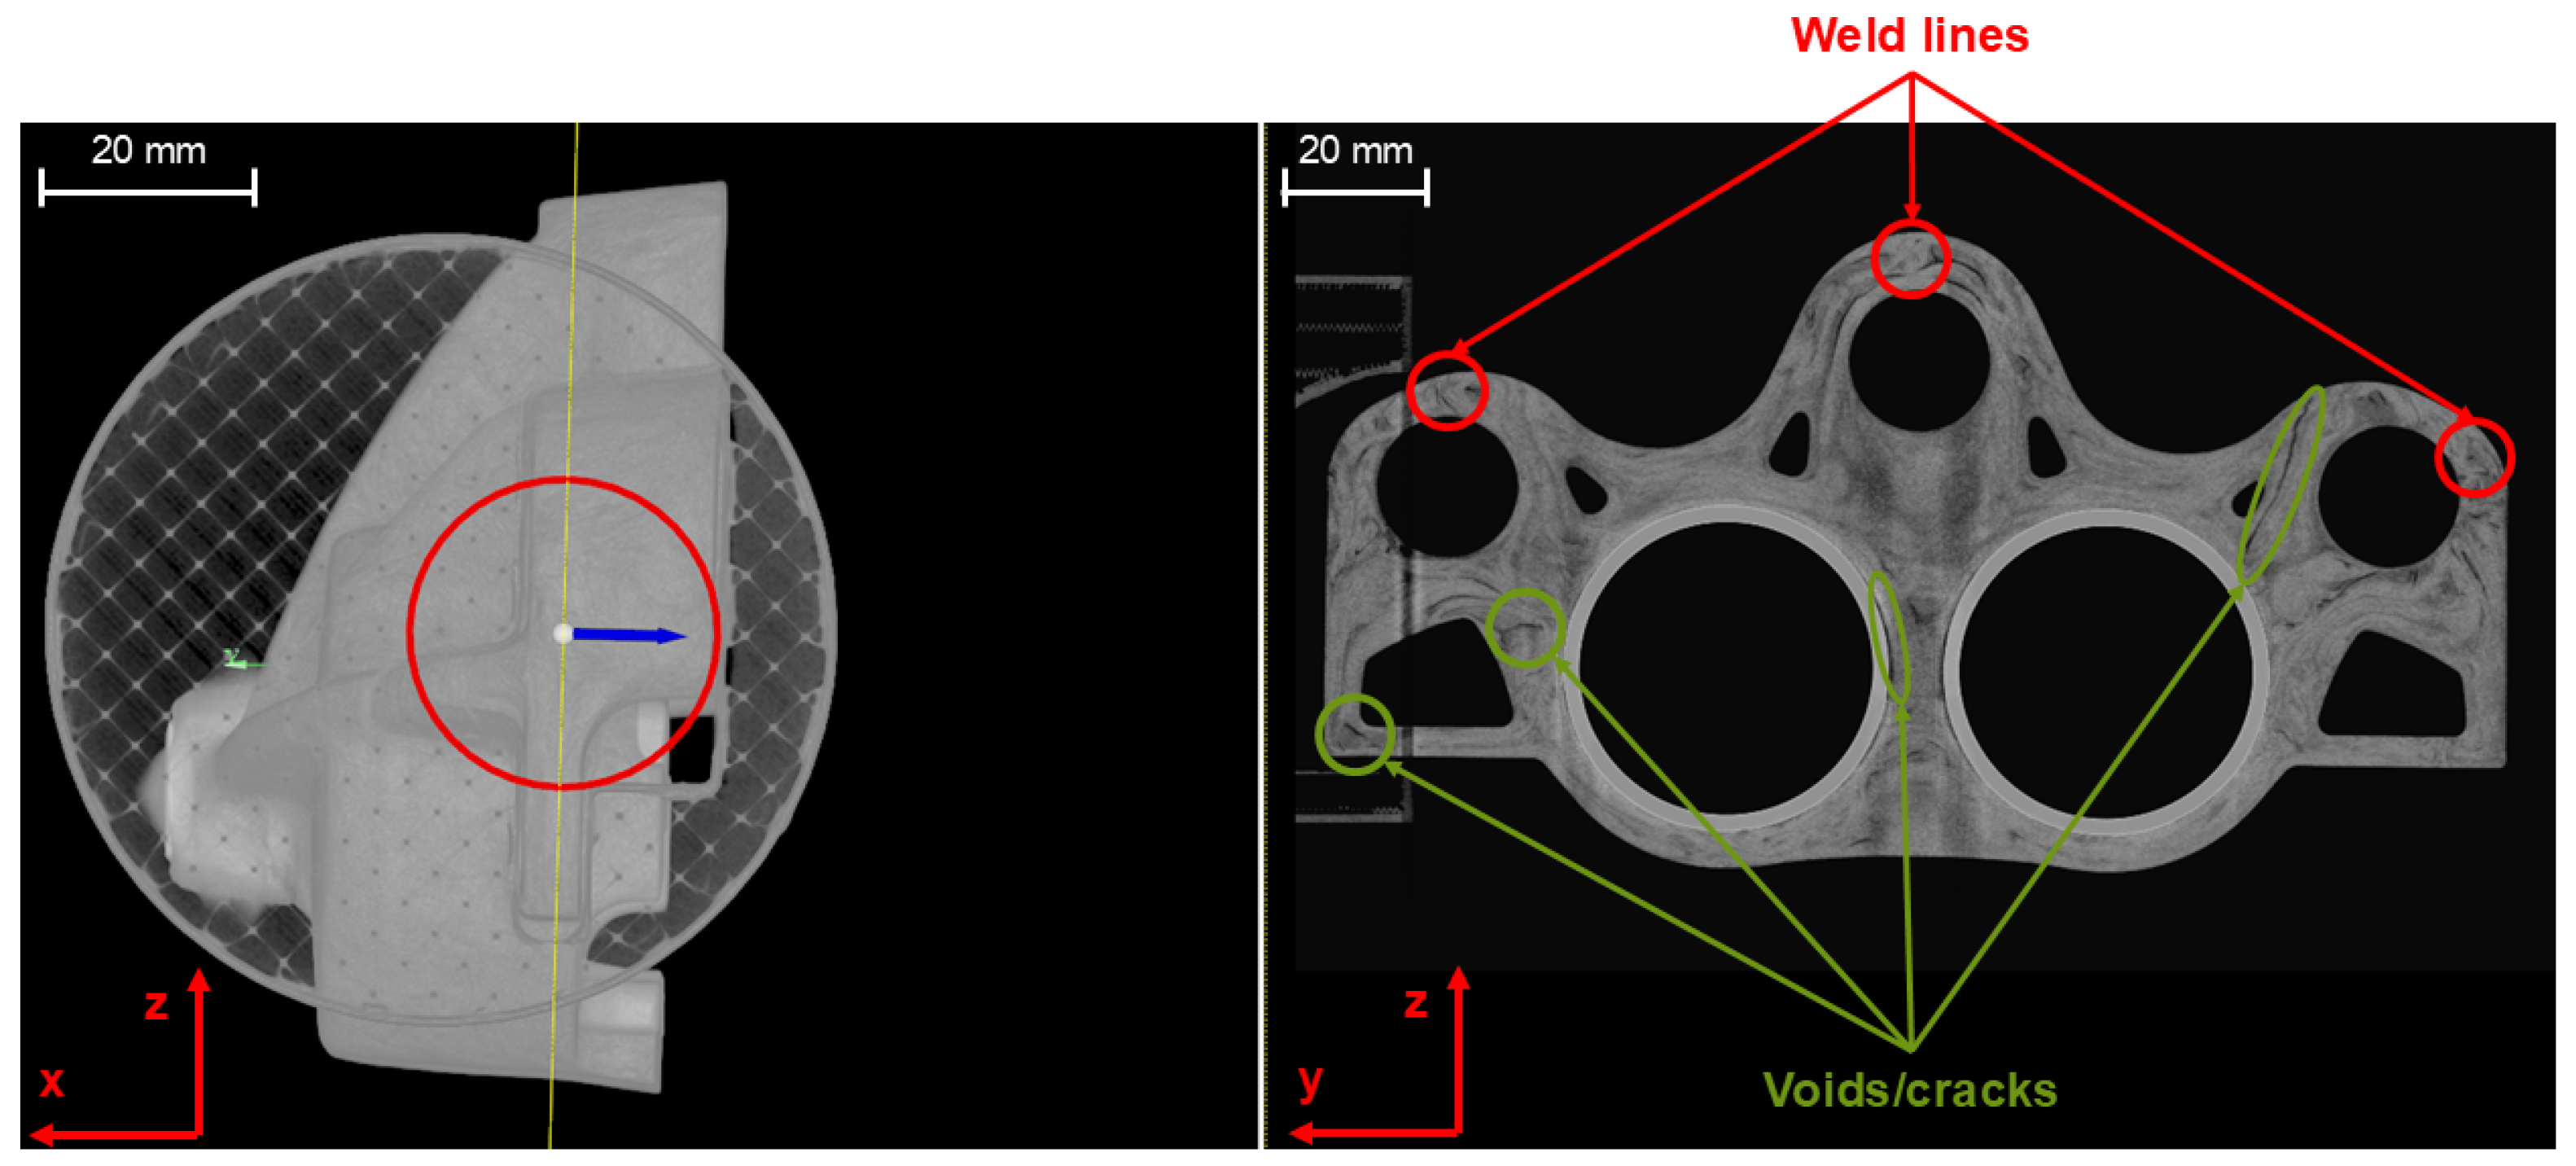
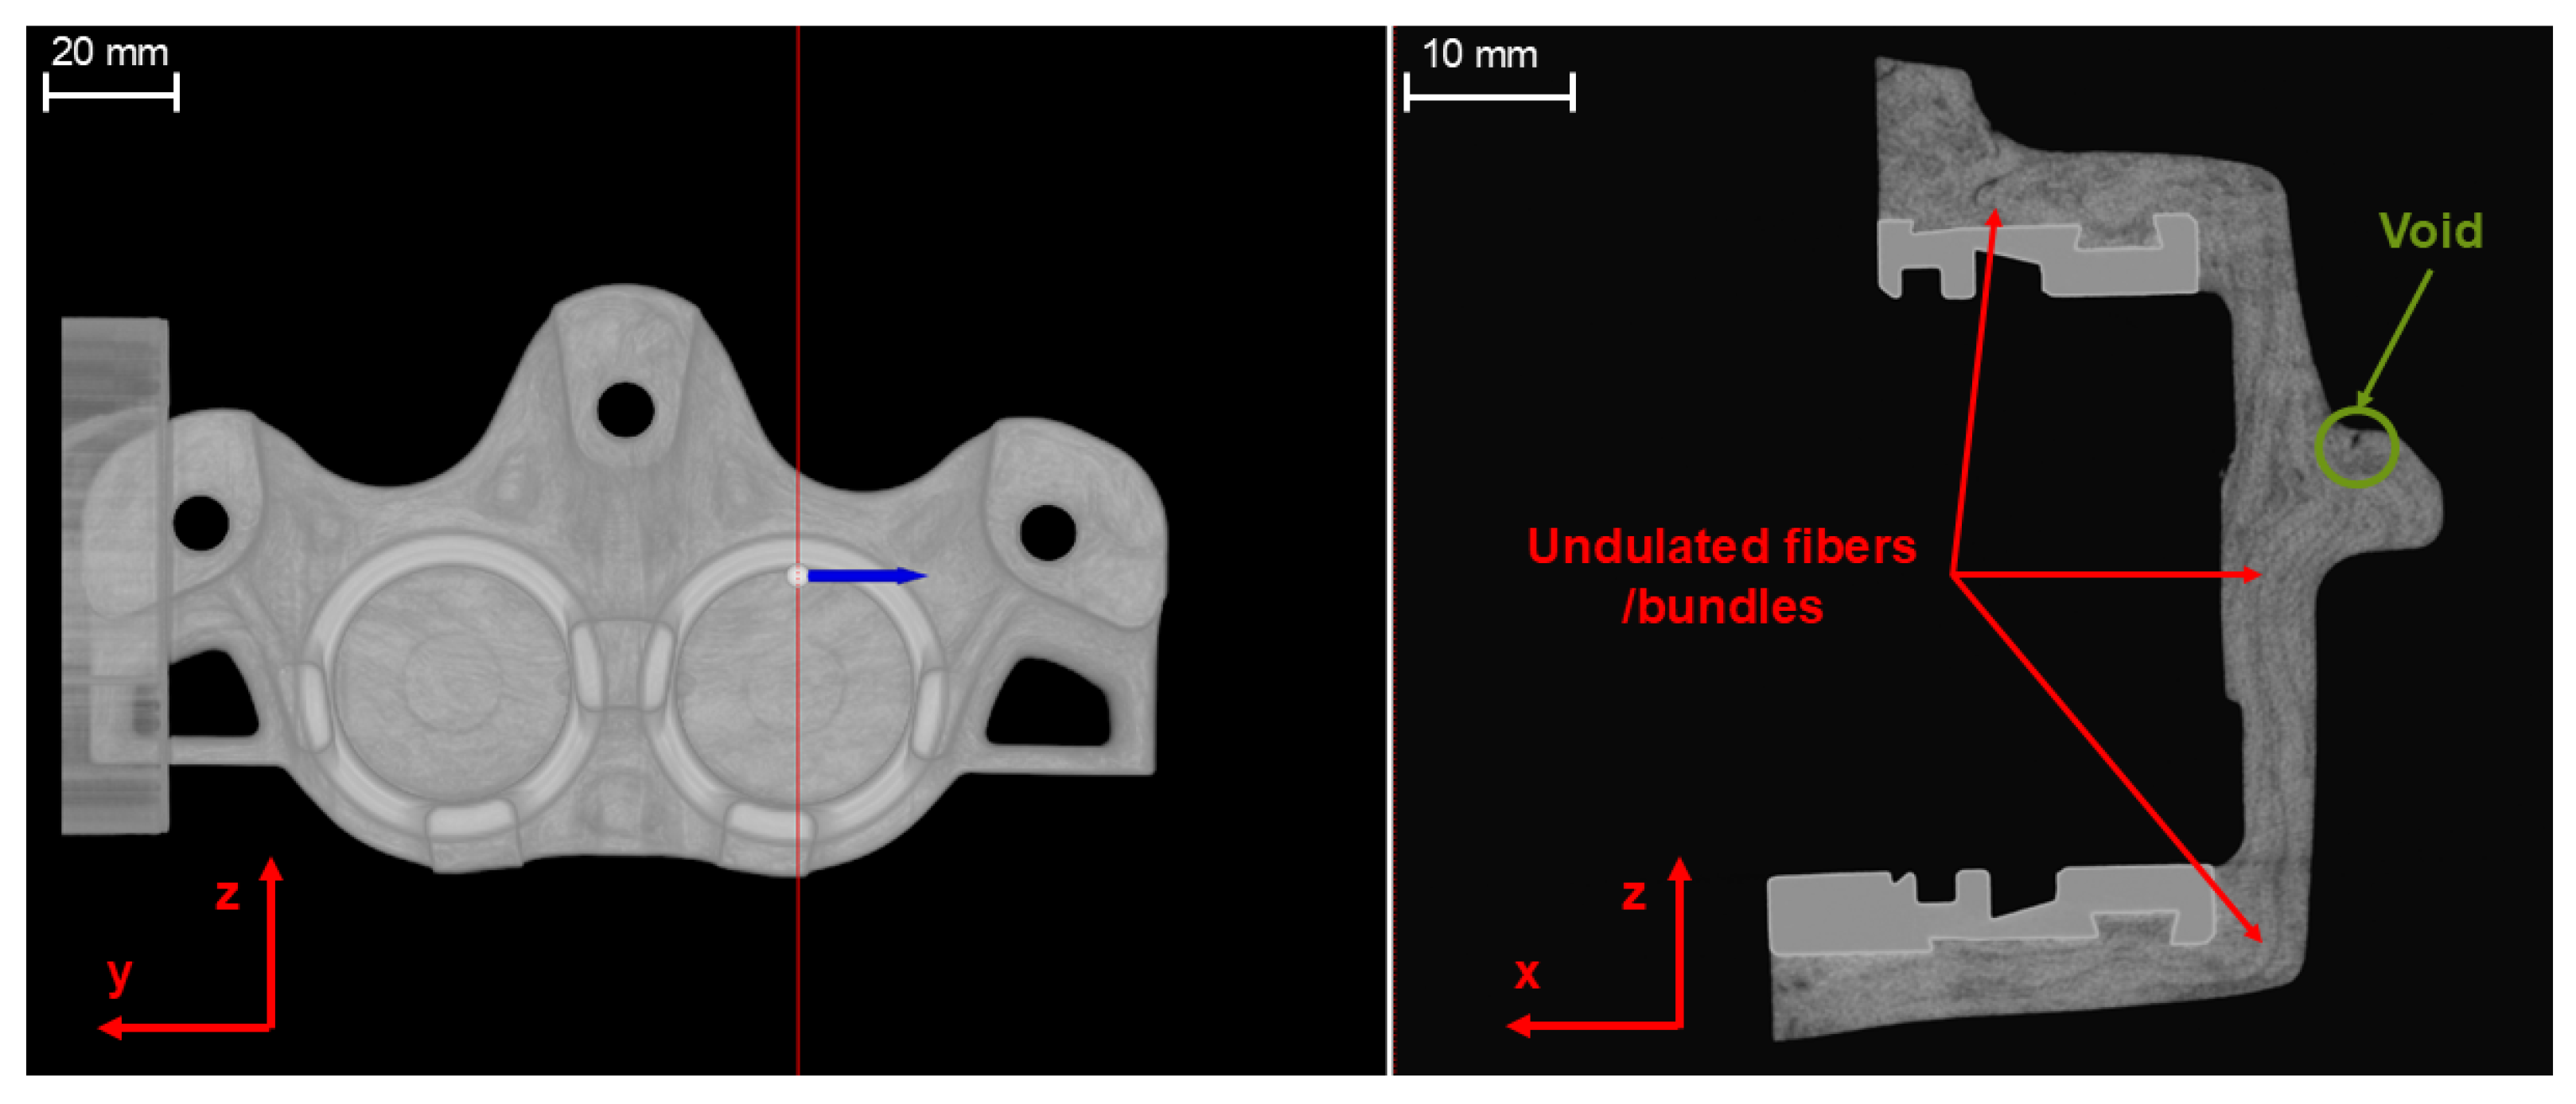
2.2.3. X-Ray Computer Tomography

In fiber-reinforced composites, the fiber orientation is crucial for determining the resulting macroscopic properties of the manufactured structure or component. Therefore, ensuring the accuracy of fiber orientations predicted by numerical simulations is essential in modern integrated computational materials engineering (ICME) approaches. To validate the compression molding simulations performed for the CF-SMC brake caliper investigated in this study, X-ray computer tomography (XCT) measurements were performed on the final prototypes. Due to the inverse relation between the resolution and sample size, 2 setups were used to conduct the X-ray tomography. First, the component was analyzed as a whole, including all metallic inserts. In the second step, a small region from the inner rib ( 5.0 × 4.5 × 5.0   mm 3 ) was scanned. In addition to the quantitative analysis performed using the second-order fiber orientation tensor, a qualitative analysis of the FO was performed for two defined cross sections. Figure 4 provides the front view of the investigated CF-SMC brake caliper shell, where the corresponding cross sections and significantly loaded ribs are shown in green and encircled in red, respectively. Furthermore, the cut-out XCT specimen is shown, as well as its dimensions. The measurements were performed on a TomoScope® XS Plus Werth Messtechnik GmbH, Gießen, Germany) with a detector resolution of 2800 × 2304 pixels. Derived from the applied magnification, a voxel size of 1.74 μm was used with a generator power of 3 W and a tube voltage of 40 kV to measure the cut-out ribs. No filter was placed in front of the X-ray source. In contrast, when measuring the entire component, a 1.0 mm thick Cooper filter was used to reduce the influence of soft radiation since aluminum and steel inserts were incorporated in the caliper during the pressing process. Generator power and tube voltage values of 80 W and 160 kV were chosen, respectively. Data postprocessing was performed by using the software package WinWerth CT version 9.44 (Werth Messtechnik GmbH, Gießen, Germany) and Python scripts to evaluate the fiber orientation.
In this section, the materials and experimental procedures used to characterize the CF-SMC (carbon fiber sheet molding compound) material and validate the simulation models have been outlined. The selected material, STR120N131 from Mitsubishi Chemical, consisted of TR50S carbon fibers embedded in a vinyl ester resin, with a fiber content of 53 wt%. From an experimental perspective, squeeze flow rheometry was used to analyze the flow behavior under compression at two temperatures (80 °C and 100 °C) and various speeds, and pvT dilatometry was conducted with a custom-built setup to measure the pressure–specific volume–temperature behavior. X-ray computer tomography (XCT) was performed on the molded brake caliper both at the macro and micro scales to assess and quantify fiber orientations.

3. Results

In the following subsections, the obtained and postprocessed experimental data for all the performed experiments are shown. These data were the foundation for the derived material models needed for the numerical simulations. The modeling and fitting procedures will be explained in these sections as well.

3.1. Squeeze Flow Rheometry—Viscosity Model

The recorded force and displacement signals were used to derive averaged force–displacement curves for each temperature (80 °C and 100 °C) and speed (0.1 mm/s, 1.0 mm/s and 10 mm/s) combination. Furthermore, the standard deviation was evaluated as a measure of the spread observed during the measurements. In Figure 5, the resulting line plots, including error bars, are illustrated, with the data grouped according to temperatures and the compression speeds indicated by the different colors of magenta, blue and yellow. Each setting has a similar curve shape, starting with a moderate slope at the beginning and a transition towards a rapid force increase for higher displacement values.
An isothermal comparison of the curves shows a distinct loading rate dependency for the compression force at both 80 °C and 100 °C. Considering the setting of 80 °C and 0.1 mm/s as a reference, a ten times higher speed led to an increase of 120% in the maximum force up to a value of 9046 N. With a further increase to 10 mm/s, an even higher value of 25 kN was observed, which was equivalent to a 516% change. The inverse behavior, generally speaking, a reduction in the compression force, was shown if the speed was kept constant and the temperature was increased. A 20 °C temperature change from 80 °C to 100 °C reduced the maximum force by 69%, 47% and 25% for 0.1 mm/s, 1.0 mm/s and 10 mm/s, respectively. The observed curve shape and temperature/rate dependency are in good agreement with similar measurements from the literature [6,21,40]. Analyzing the plotted error bars, a progressive trend for higher speeds at both investigated temperatures can be seen in contrast to the relatively small deviations for the slower speeds.
By applying the previously introduced relations according to Stefan (Equations (1) and (2)), the experimentally obtained force and displacement values could be transferred to viscosity curves representing the ability of the material to flow under the applied shear loading conditions. The double logarithmic plot in Figure 6 provides the calculated and averaged curves, again including error bars to indicate the observed spread of the data. Similarly, the aforementioned temperature and rate dependency is visible. As can be seen, a higher temperature and shear rate are related to lower viscosity values and vice versa. This can be attributed to the classical shear thinning behavior of polymer melts and resins.
Theoretical lines at the same temperature but derived from different speeds should be co-linear and form a continuous line over the investigated shear rate range. However, for the performed measurements, discontinuities between the different speeds can be observed in the vertical shifts of the derived curves. The reason for this phenomenon can be explained by the data postprocessing scheme we used utilizing the Stefan equation for the shear rate calculation. In squeeze flow experiments, the shear rate is non-uniformly distributed within the specimen. Therefore, Equation (2) will provide an averaged shear rate instead of the local one. Another influencing parameter for such a behavior could be rooted in velocity-dependent wall slip effects at high shear rates. This hypothesis needs, however, to be addressed in future research.
On the basis of the experimental data, temperature-dependent power law (PL) and Cross viscosity models were fitted based on a weighted least-square error algorithm in the software package OriginPro 2022 (OriginLab Corporation, Northampton, MA, USA). The corresponding equations correlating the resin viscosity, η , with the actual shear rate, γ ˙ , in terms of the PL and Cross models, are given by Equations (3) and (4). The calibrated parameters for the PL model are presented later in this manuscript.
η ( γ ˙ ) = A × e ( T b / T ) × γ ˙ ( n 1 )
η ( γ ˙ ) = A × e ( T b / T ) 1 + ( A   ×   e ( T b / T )   ×   γ ˙ τ * ) ( 1     n )
where A and T b are parameters used to describe the exponential temperature dependency of the resin. In the case of the Cross model, τ * gives the transition shear stress from the upper Newtonian plateau to the shear thinning region, whereas the latter is described by the power law index, n, in both models. Finally, the polymer’s temperature is defined by T, according to [20]. The fitted Cross model showed an R 2 value of 0.989, and the corresponding parameter values are given in Table 1.
Aiming at capturing the highly anisotropic flow behavior of fiber-reinforced polymers in finite volume-based flow simulations, a modeling approach based on the informed isotropic viscosity (IISO) model was used. As is frequently reported in the literature, the IISO model performs well for short fibers dispersed in a polymeric resin [22,41,42,43]. However, its application in suspensions, including of very long fibers (>5 mm), e.g., for SMC materials, was analyzed in [2,18,23,44] and was found to provide reliable results for thin-walled structures. From a modeling point of view, the mathematical formulation of the constitutive model is isotropic, although it is dependent on the deformation and fiber orientation, which emphasize anisotropic behavior. The informed isotropic viscosity, η I I S O , can be interpreted as a scaling of the matrix shear viscosity, η m , along the fiber orientation. In Equation (5), η I I S O is represented by the shear viscosity increase factor, κ , the anisotropy factor, R η , and the stretching kernel ( d ̲ ̲ : A ̲ ̲ ̲ ̲ : d ̲ ̲ ) .
η I I S O = η m κ 1 + 4 R η 1 d ̲ ̲ : A ̲ ̲ ̲ ̲ : d ̲ ̲
In this equation, the last term, d ̲ ̲ , represents the rate of the deformation tensor divided by the strain rate. A ̲ ̲ ̲ ̲ is the fourth-order fiber orientation tensor, an essential component for considering the changing fiber alignment while a suspension is flowing. For more details regarding the model, refer to [20,22,42]. R η was calibrated on the previously presented force–displacement curves in Figure 5 within the framework of a power law-based viscosity model. A best fit optimization algorithm was applied during calibration. Notably, the calibration of the anisotropy factor could not be performed with the previously introduced Cross model due to numerical divergence. Nevertheless, in Table 2, the originally derived PL parameters for the isotropic viscosity model are listed together with the adjusted parameters for the IISO model used to consider fiber–flow coupling.

3.2. pvT Dilatometry—Temperature-Dependent Compaction Behavior

The performed pvT dilatometer measurements revealed a distinct pressure and temperature dependency for the SMC’s specific volume, v. Initially, v showed a rapid decrease with increasing pressure values for both the analyzed temperatures. After a certain pressure level was reached, the slope reduced, and the values of v decreased marginally with a constant slope if the pressure was further increased. This was the case for the very first compaction of the material, v p , indicated by the solid lines in Figure 7, as well as for the behavior after the first compaction, v b , represented by the dashed lines. The difference between the solid and dashed lines can be interpreted as a porosity measure of the material, as explained by [30]. This effect was more pronounced for higher temperatures, which can be observed by comparing the corresponding data for 80 °C and 100 °C. At the initial pressure level of five bar, the specific volume after the first compaction was 10% lower at 100 °C, compared to a 2% reduction at 80 °C. Furthermore, the higher temperature setting led, as expected, to increased v-values. Another interesting aspect was the high scattering of the experimental data, indicated by the error bars provided in Figure 7. The average standard deviation was 1.4 × 10 8 m3/kg for 80 °C, which was equivalent to 2% of the overall mean value at 80 °C. The values at 100 °C were 3.23 × 10 8 m3/kg and 4%.
The previously mentioned initial porosity of the SMC material is critical for compression molding, especially when it comes to the prediction of the compression force needed to completely fill the cavity. Traditional pvT models, originally developed for thermoplastic polymers, are able to model the plateau region but fail in predicting the specific volume of the material for low pressures [30]. One of the most widely used models of this kind is the Tait formulation in the form written in Equation (6), according to [20]. This model is already implemented in various commercial software packages, for example, Moldex3D.
v ( p , T ) = ( b 1 + b 2 T ) × 1 C × l n 1 + p b 3 × e b 4 T
The parameters b 1 b 4 and C are constants which are usually defined applying by curve fitting to experimental data collected at different temperatures [20]. Alternatively, the pvT model based on the thermodynamic state variables (TSV model) proposed by Doppelbauer et al. [30] can be used to capture the initial porosity at the beginning more accurately. Hence, the pressure-dependent specific volume in Equation (7) is extended by a temperature shift term, which is dependent on a pressure-related volumetric expansion factor, β , as stated in Equation (8). The resulting formulation representing a pressure- and temperature-dependent specific volume is also able to capture the initial porosity of the material, as shown in Equation (9).
v ( p ) = ( v 0 v f ) p   +   p t p t ψ + v f + ( v 0 , p v 0 ) p   +   p t , p p t , p κ
β ( p ) = 1 v T r v T 2 ( p ) v T 1 ( p ) T 1 T 2
v ( p , T ) = v ( p ) + 1 + β ( p ) Δ T
The parameter v f describes the specific volume the curves tend to converge to for an infinite pressure at a defined reference temperature, T r . At zero pressure, the corresponding specific volumes are described by v 0 and v 0 , p , respectively, while the subscript p refers to the situation before the first compaction. The points where a change from the initially rapid decrease in the curves to a less pronounced reduction takes place are indicated by p t and p t , p . The reduction itself can be described by the parameters κ and ψ , which represent the curve slopes before and after compaction from a logarithmic point of view. In Table 3, the parameters of both presented pvT models are listed for the investigated vinyl ester-based CF-SMC material. For the derivation of the presented parameters, a least-square fitting algorithm was applied, which took the experimental curves as an input using OriginPro 2022. The parameters were subsequently used to plot the resulting pvT response to compare it with the experimentally recorded curves. From a qualitative perspective, the Tait model showed good agreement with the experiments for pressures above 50 bar. This outcome was evidenced by the numerical R2-values of 0.997 and 0.983 for 80 °C and 100 °C at pressures above 50 bar, respectively. However, as previously mentioned, the initial porosity of the material could not be captured, as shown in Figure 8a. Considering the TSV model, better overall results were observed due to the ability of the model to accurately represent the porosity of SMC materials at low pressures. In the line plot in Figure 8b, the magenta curves indicate the experimental (solid lines) and modeled (dashed lines) data at 80 °C, which was also chosen as the reference temperature, T r . At this particular temperature, an R2-value of 0.932 was reached, which was slightly lower compared to that of the Tait model but was valid for the entire pressure range and not restricted to pressures above 50 bar. In addition, the blue lines underscore the predictive capabilities of the model for a second temperature (100 °C) if a pressure-dependent β -formulation is used.

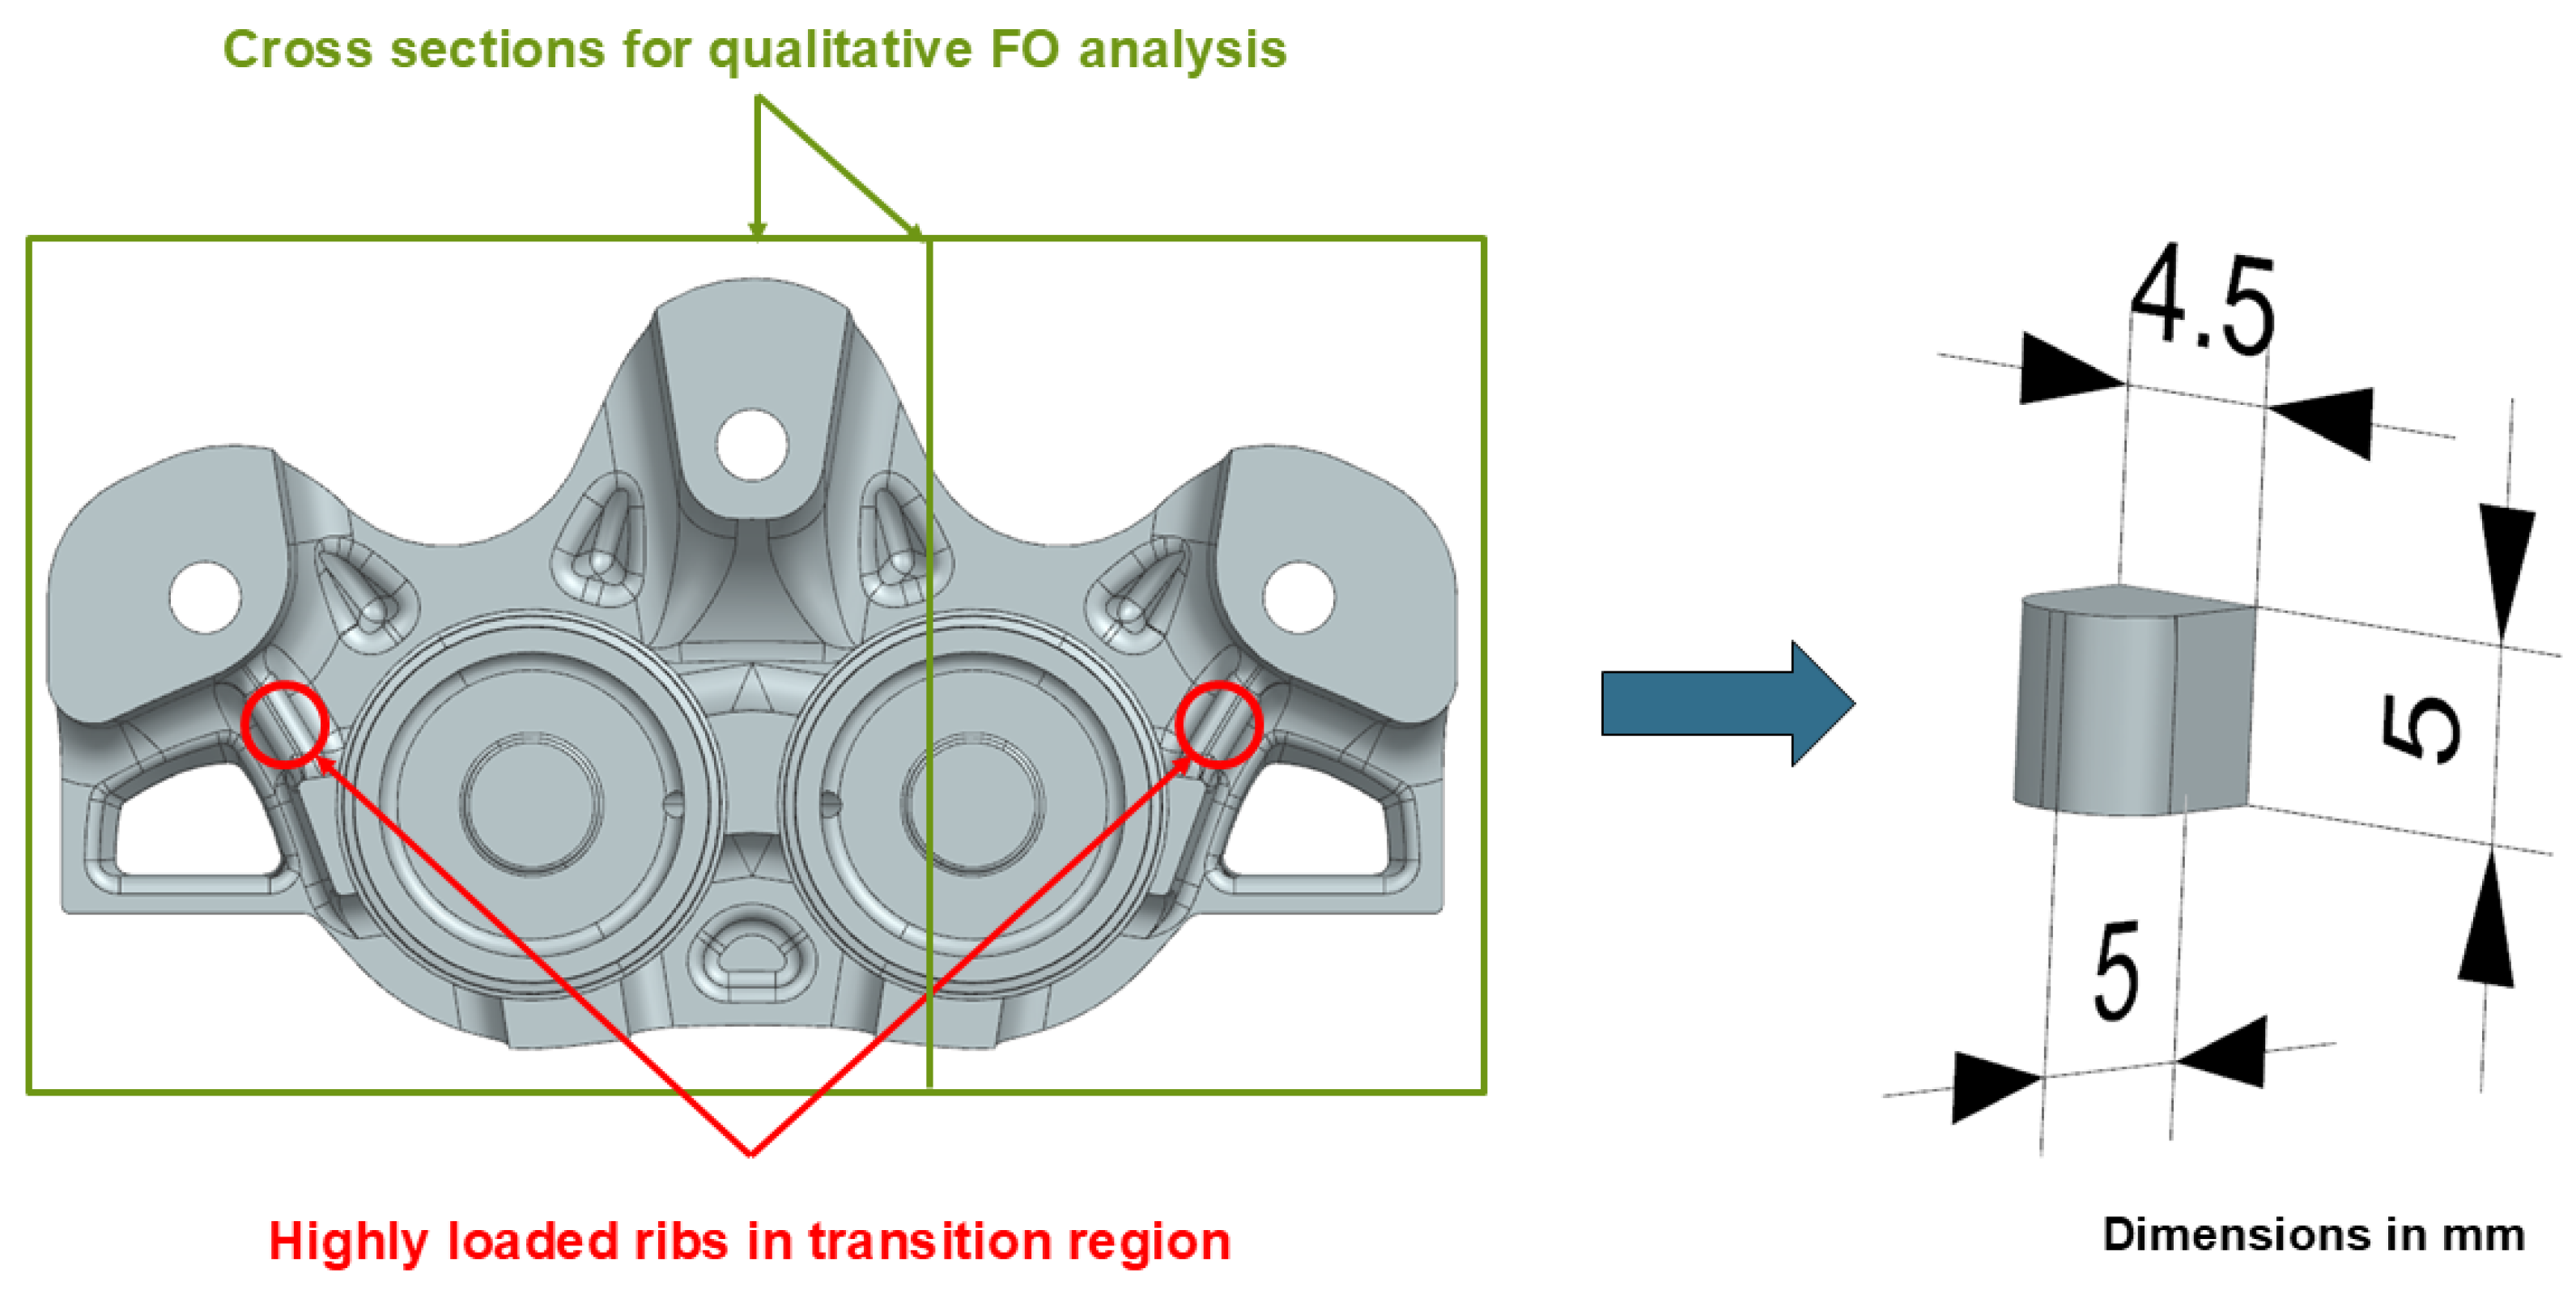
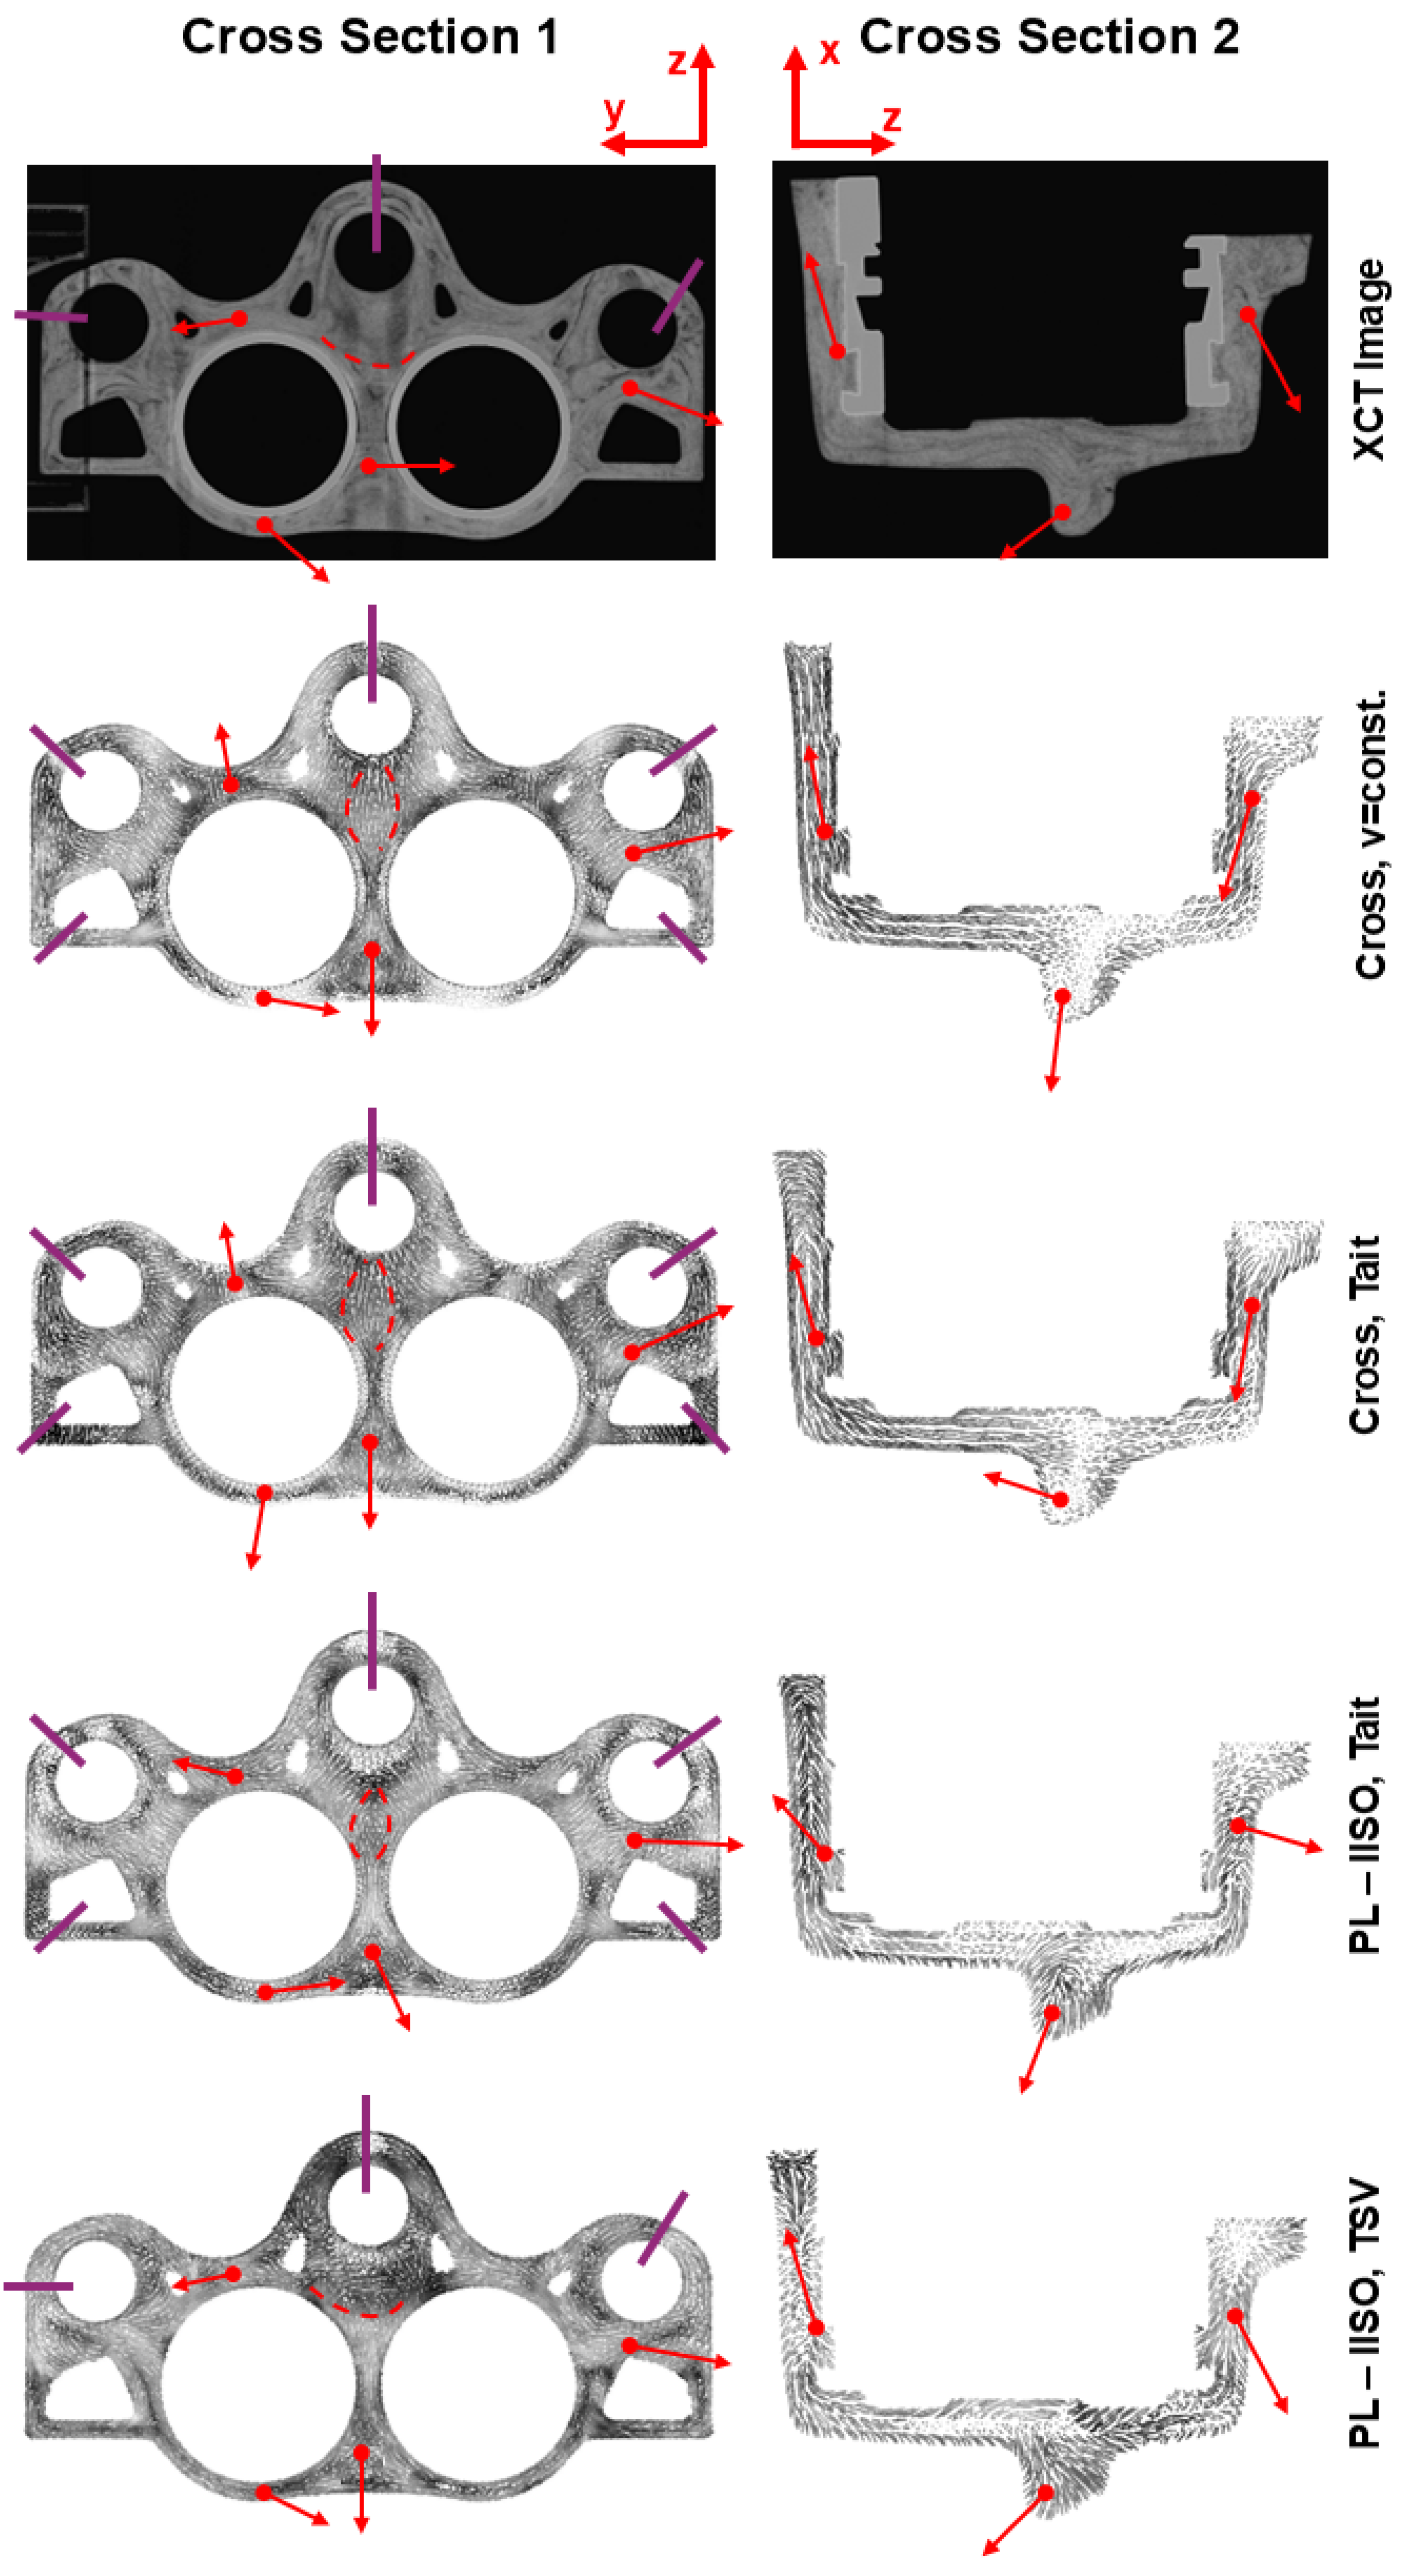
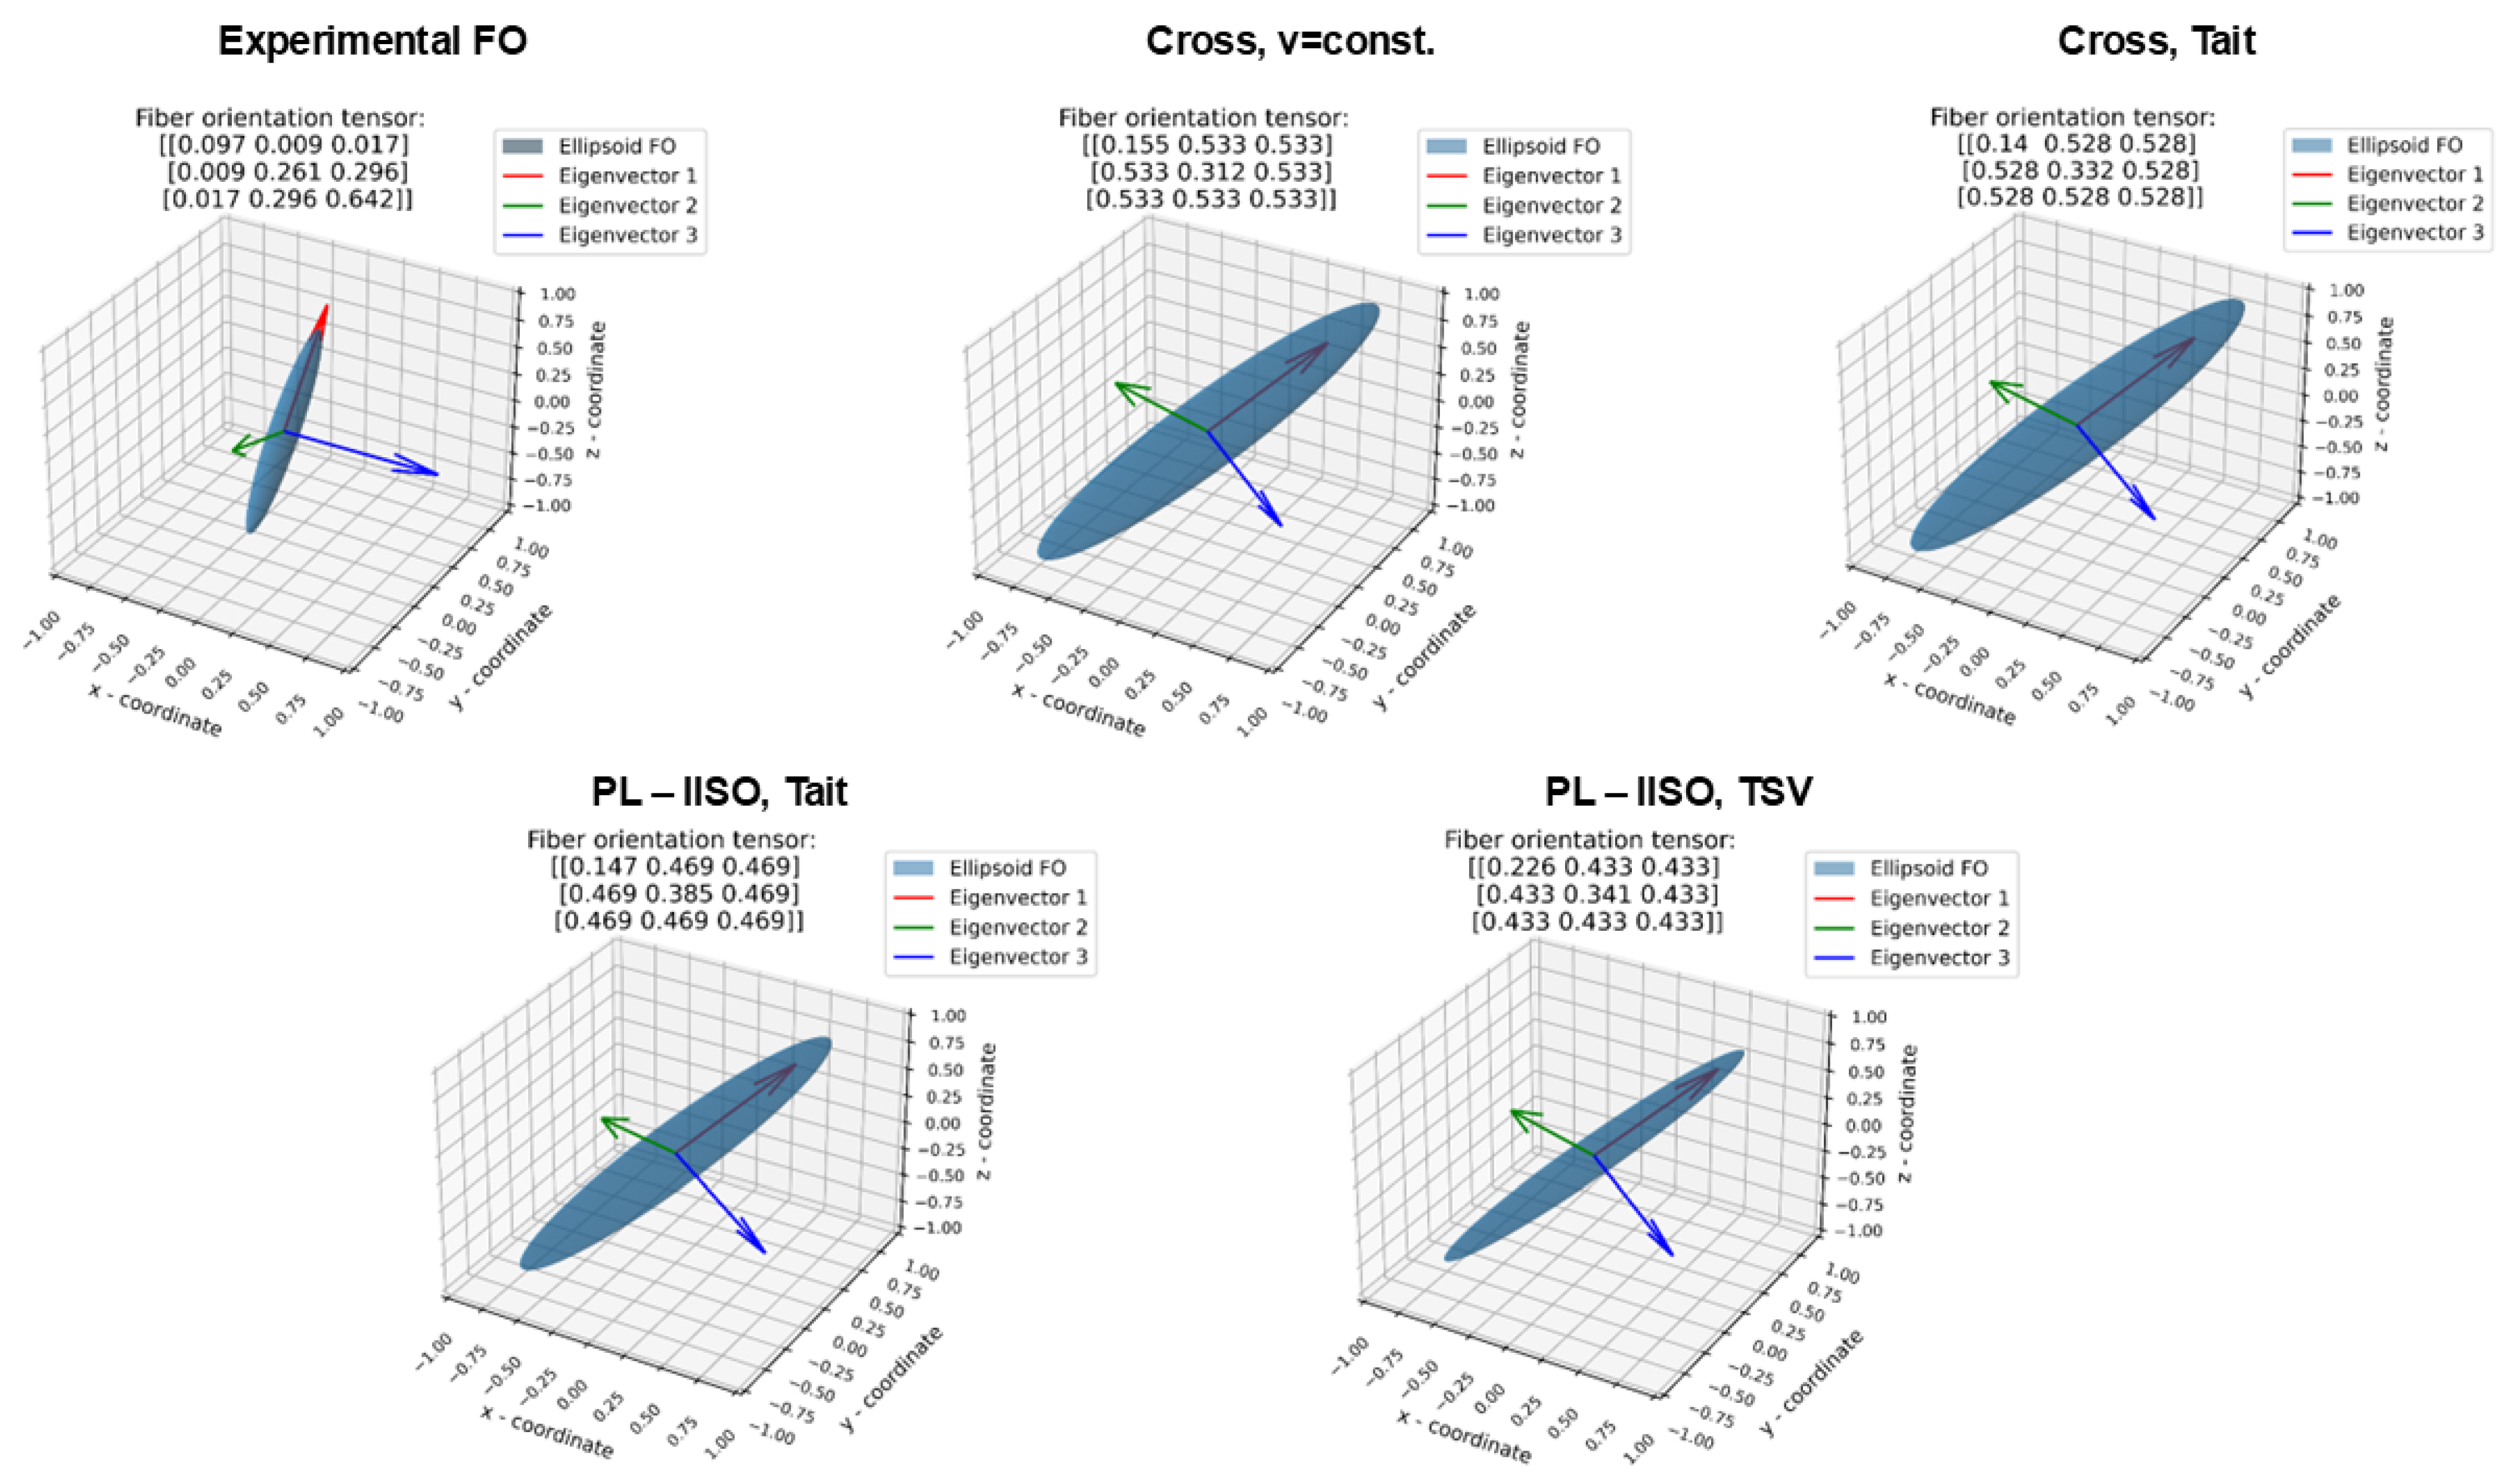
3.3. Qualitative and Quantitative Fiber Orientation Analysis of Brake Caliper

In Figure 9 and Figure 10, a reconstructed 3D representation of the brake caliper is shown from two perspectives. On the left-hand side of the figures, the cutting plane is illustrated within the global coordinate system of the component. On the right-hand side, the corresponding cross section is shown, revealing the qualitative fiber orientation and resulting microstructural defects like voids and regions of colliding flow fronts (weld lines). The defects mentioned are mainly shown in Figure 9. It should be noted that the circular region displayed on the left side of the caliper can be attributed to a 3D-printed component fixation. This fixation was used to ensure the reproducible and fast XCT measurement of all the available prototypes.
In the marked regions in Figure 9, distinct weld lines can be found around the circular regions, which correspond to the designated attachment points for screws. Surprisingly, no weld lines can be detected around the hollow regions below the lateral attachment points. Near colliding flow fronts, voids are visible and marked in green. Indeed, larger continuous voids, forming easily detectable cracks, are shown in the top-right region of the caliper or in the center between the piston inserts. The latter seems to have been a region where the CF-SMC material was debonded from the aluminum piston insert, which was detrimental in terms of leak-tightness. However, to provide evidence on the bonding state, further destructive testing methods like high-resolution microscopy need to be applied in future research. In comparison to Figure 9, Figure 10 provides a cross sectional slice of the caliper in a plane transverse to the previous one, cutting through the aluminum piston insert. The purpose of this was to investigate if the small radial undercuts in the insert were fully filled with SMC material, and indeed, no unfilled regions were found. Furthermore, the results shown on the right-hand side of Figure 10 allowed for the qualitative analysis of the fiber orientation and revealed the undulation of the fibers/bundles in three selected areas. Microstructural defects like voids were again found within the analyzed cross section of the component, underlining their high number of occurrences.
The quantitative fiber orientation analysis of the small rib region was performed by utilizing a Python script developed in house to obtain the second-order fiber orientation tensor, A ̲ ̲ . Thus, a representative volume element in the center of the rib was chosen to segment the fibers with its different grayscale values compared to the surrounding vinyl ester matrix. An illustration of the investigated rib region, including the global caliper coordinate system, which was shifted to the center of the rib, as well as the corresponding fiber orientation tensor, is shown in Figure 11a,b. In Figure 11b, a three-dimensional interpretation of the fiber orientation is shown, using the Eigenvectors of A ̲ ̲ as the principal axis of an ellipsoid, whereby the Eigenvalues of the tensor define the spatial ellipsoidal shape by acting as scaling factors in the corresponding principal directions. The fibers in this region were mainly orientated along the rib, indicated by the first Eigenvector and the −value of the fiber orientation tensor. Furthermore, the ellipsoid shape was very narrow in the x-direction but more pronounced in the y-direction. This correlated well with the tensor entries A 11 and A 22 , respectively. Only one caliper was used to determine the local, quantitative fiber orientation in the rib due to the small number of the total available prototypes. Thus, no statistical data regarding the presented A ̲ ̲ -tensor can be provided.
In summary, the data from the experimental work and the resulting models were presented in this section. The squeeze flow rheometry data showed significant temperature and shear rate dependencies, leading to pronounced shear thinning behavior. Viscosity models were derived using power law and Cross formulations. These were further extended using the informed isotropic (IISO) model to incorporate anisotropic flow behavior due to the fiber orientation. The pvT measurements demonstrated that the material’s specific volume rapidly decreased with the pressure and that the porosity was strongly temperature-dependent. Classical pvT models like the Tait model failed to predict this initial porosity accurately, while the thermodynamic state variable (TSV) model proved effective. The XCT analysis of the brake caliper revealed voids, weld lines and qualitative fiber orientation patterns. Quantitative orientation tensors were extracted from a selected rib region, confirming the predominant fiber alignment along the rib.

4. Numerical Implementation

The previously introduced viscosity and pvT models were used to simulate the compression molding process of a thick-walled CF-SMC brake caliper. Here, we describe how the performance of the models and combinations of models was investigated and compared. Subsequently, fiber orientations obtained by XCT in the rib region and cross section of the caliper were used to evaluate the accuracy of the compression molding simulation. Before the brake caliper was analyzed, the models were validated by simulating the squeeze flow experiments presented in Section 3.1.

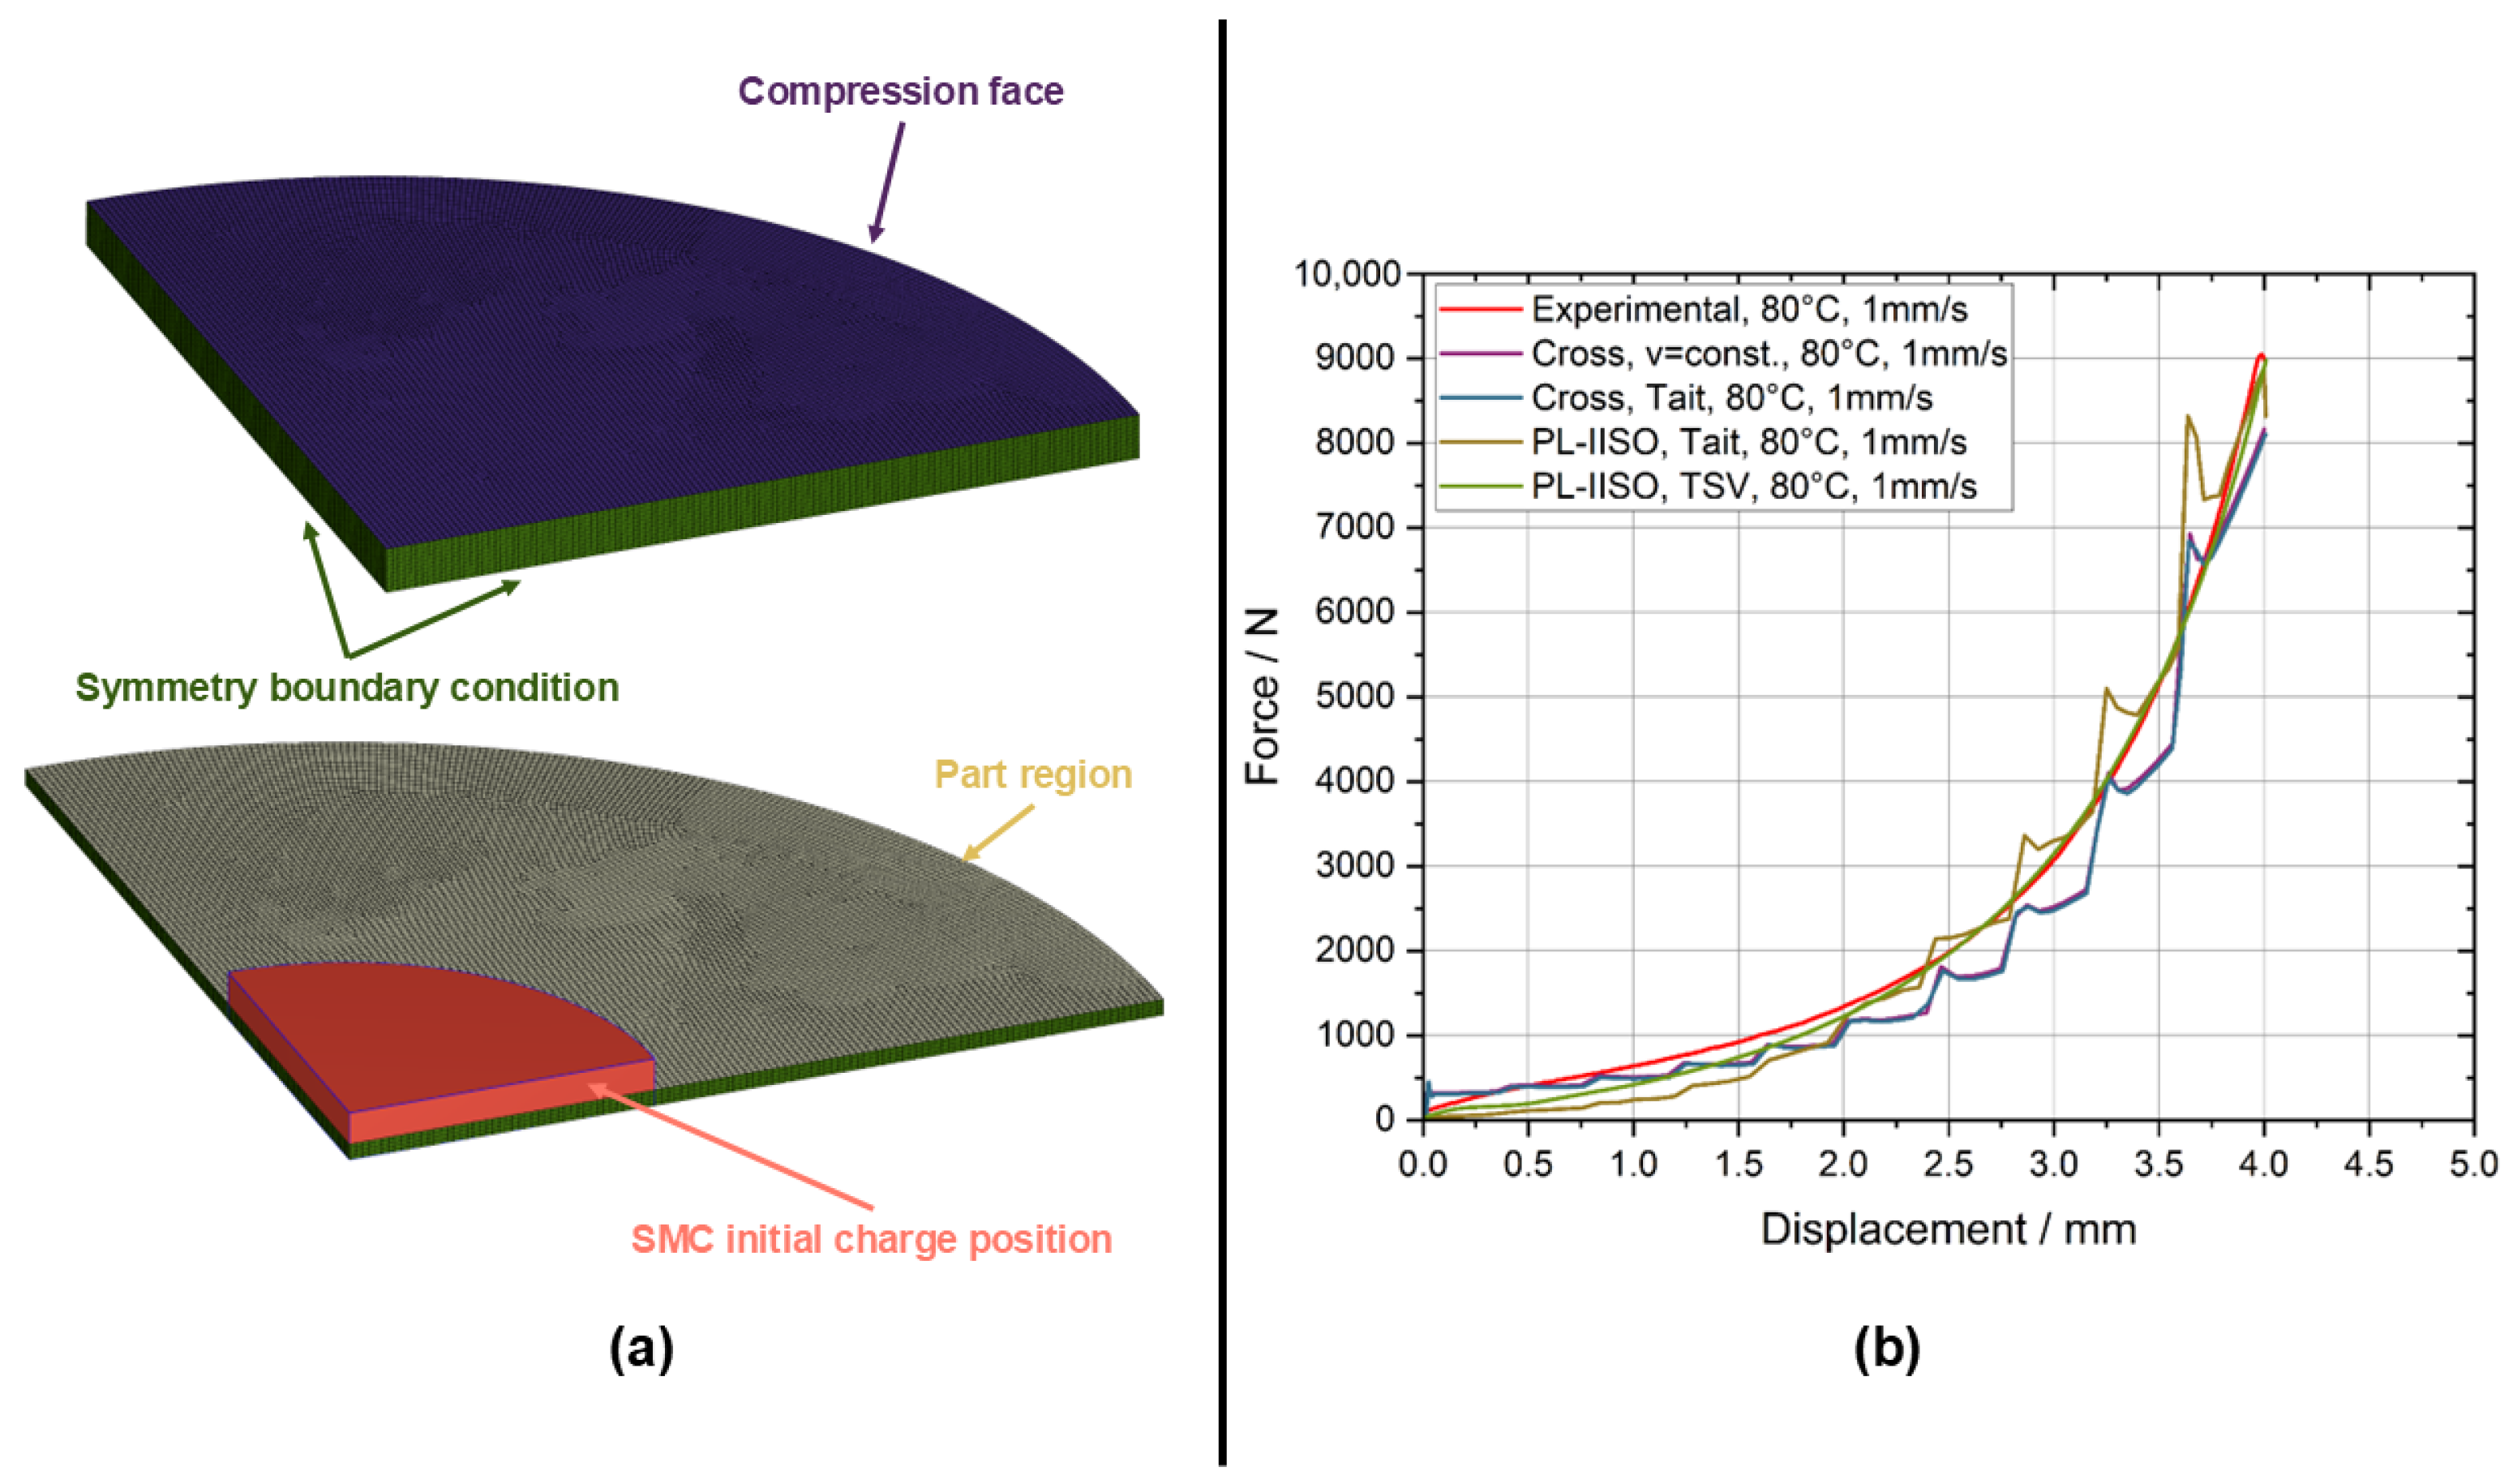
4.1. Flow Model Validation

The power law and Cross viscosity models, as well as the calibrated Tait and TSV pressure–specific volume–temperature models derived in Section 3, were used to simulate the squeeze flow experiment described in the corresponding section. This was performed to validate the derived models within a finite volume process simulation. Considering the PL, this model only describes the shear thinning behavior of the viscosity for increasing shear rates ( γ ˙ ), while the Cross model additionally models the Newtonian plateau for very low γ ˙ -values. The Tait model aims to represent the pvT response without any porosity, as is the case for common polymer melts. On the contrary, the TSV model was specifically designed to capture the influence of the porosity during compression molding. The digital model represented the testing setup shown in Figure 2b. However, only a quarter of the setup was simulated due to symmetry for the analysis, enabled by including symmetry boundary conditions. For meshing the six-millimeter-high flow region with a radius of 100 mm, solid 0.8 × 0.8 × 0.4   mm 3 hexahedral elements were used. According to the physical SMC specimen’s geometry, introduced in Section 2, the charges had a radius of 75/2 mm = 37.5 mm and a height of 6 mm. The compression of the charges was performed at the previously stated temperatures and speeds until reaching a resulting material height of 2 mm, which was equivalent to a displacement of 4 mm. An illustration of the simulation model is provided in Figure 12a. In total, four different combinations of viscosity and pvT models were investigated, namely, (i) a Cross viscosity model assuming a constant specific volume, (ii) a Cross viscosity model combined with the calibrated Tait pvT model, (iii) an anisotropic power law (PL-IISO) including the calibrated Tait pvT model and (iv) an anisotropic power law (PL-IISO) including the calibrated TSV pvT model.
The overall flow behavior of all the models was found to be similar to that in the physical experiments, in terms of the resulting average diameter and specimen weight after compression. The simulated diameters deviated from the measured average diameter by 0.86%, with a corresponding standard deviation of 0.21%, when compared to the measured values of the specimens, which were extracted from the images recorded during physical testing. The maximum deviation of 1.02% was shown for the PL-IISO and Tait model with a resulting diameter of 130.494 mm. In terms of the specimen weight, a higher average deviation of 5.92% can be reported regarding the measured mean of 43.64 g. Therefore, the highest divergence can be attributed to the PL-IISO and TSV model with an 8.44% lighter specimen after the simulation had finished. Despite these measures, the resulting force–displacement curves (see Figure 12b) from the simulations were used to interpret the accuracy of the models. The red line in the plot in Figure 12b illustrates the experimental reference results compared to the extracted simulation results for the investigated models. Remarkably, the Cross model with a constant density (magenta line) and the equivalent model extended with the Tait pvT model (blue line) were very similar and the lines coincided in a certain portion. However, these two curves provided a very unsteady response compared to the continuous measurement result. A comparable curve was generated by using the anisotropic PL-IISO model including the Tait pvT model (yellow line), shifted to slightly higher values. Consequently, the described unsteady response can be attributed to porosity-neglecting pvT models, as applied in the aforementioned examples. The most complex model, consisting of the PL-IISO and TSV pvT models, ended up with a good representation of the experimental data, showing a continuous response over the whole displacement range. This model predicted the experimental force of 8975.72 N with a value of 8978.31 N. Interestingly, both models including the Cross viscosity formulation overestimated the compression force needed at the beginning (<0.5 mm) and performed the opposite for larger displacement values, whereas the power law models acted in the opposite manner. At 100 °C, the results followed the same characteristics and trends at shifted force levels.

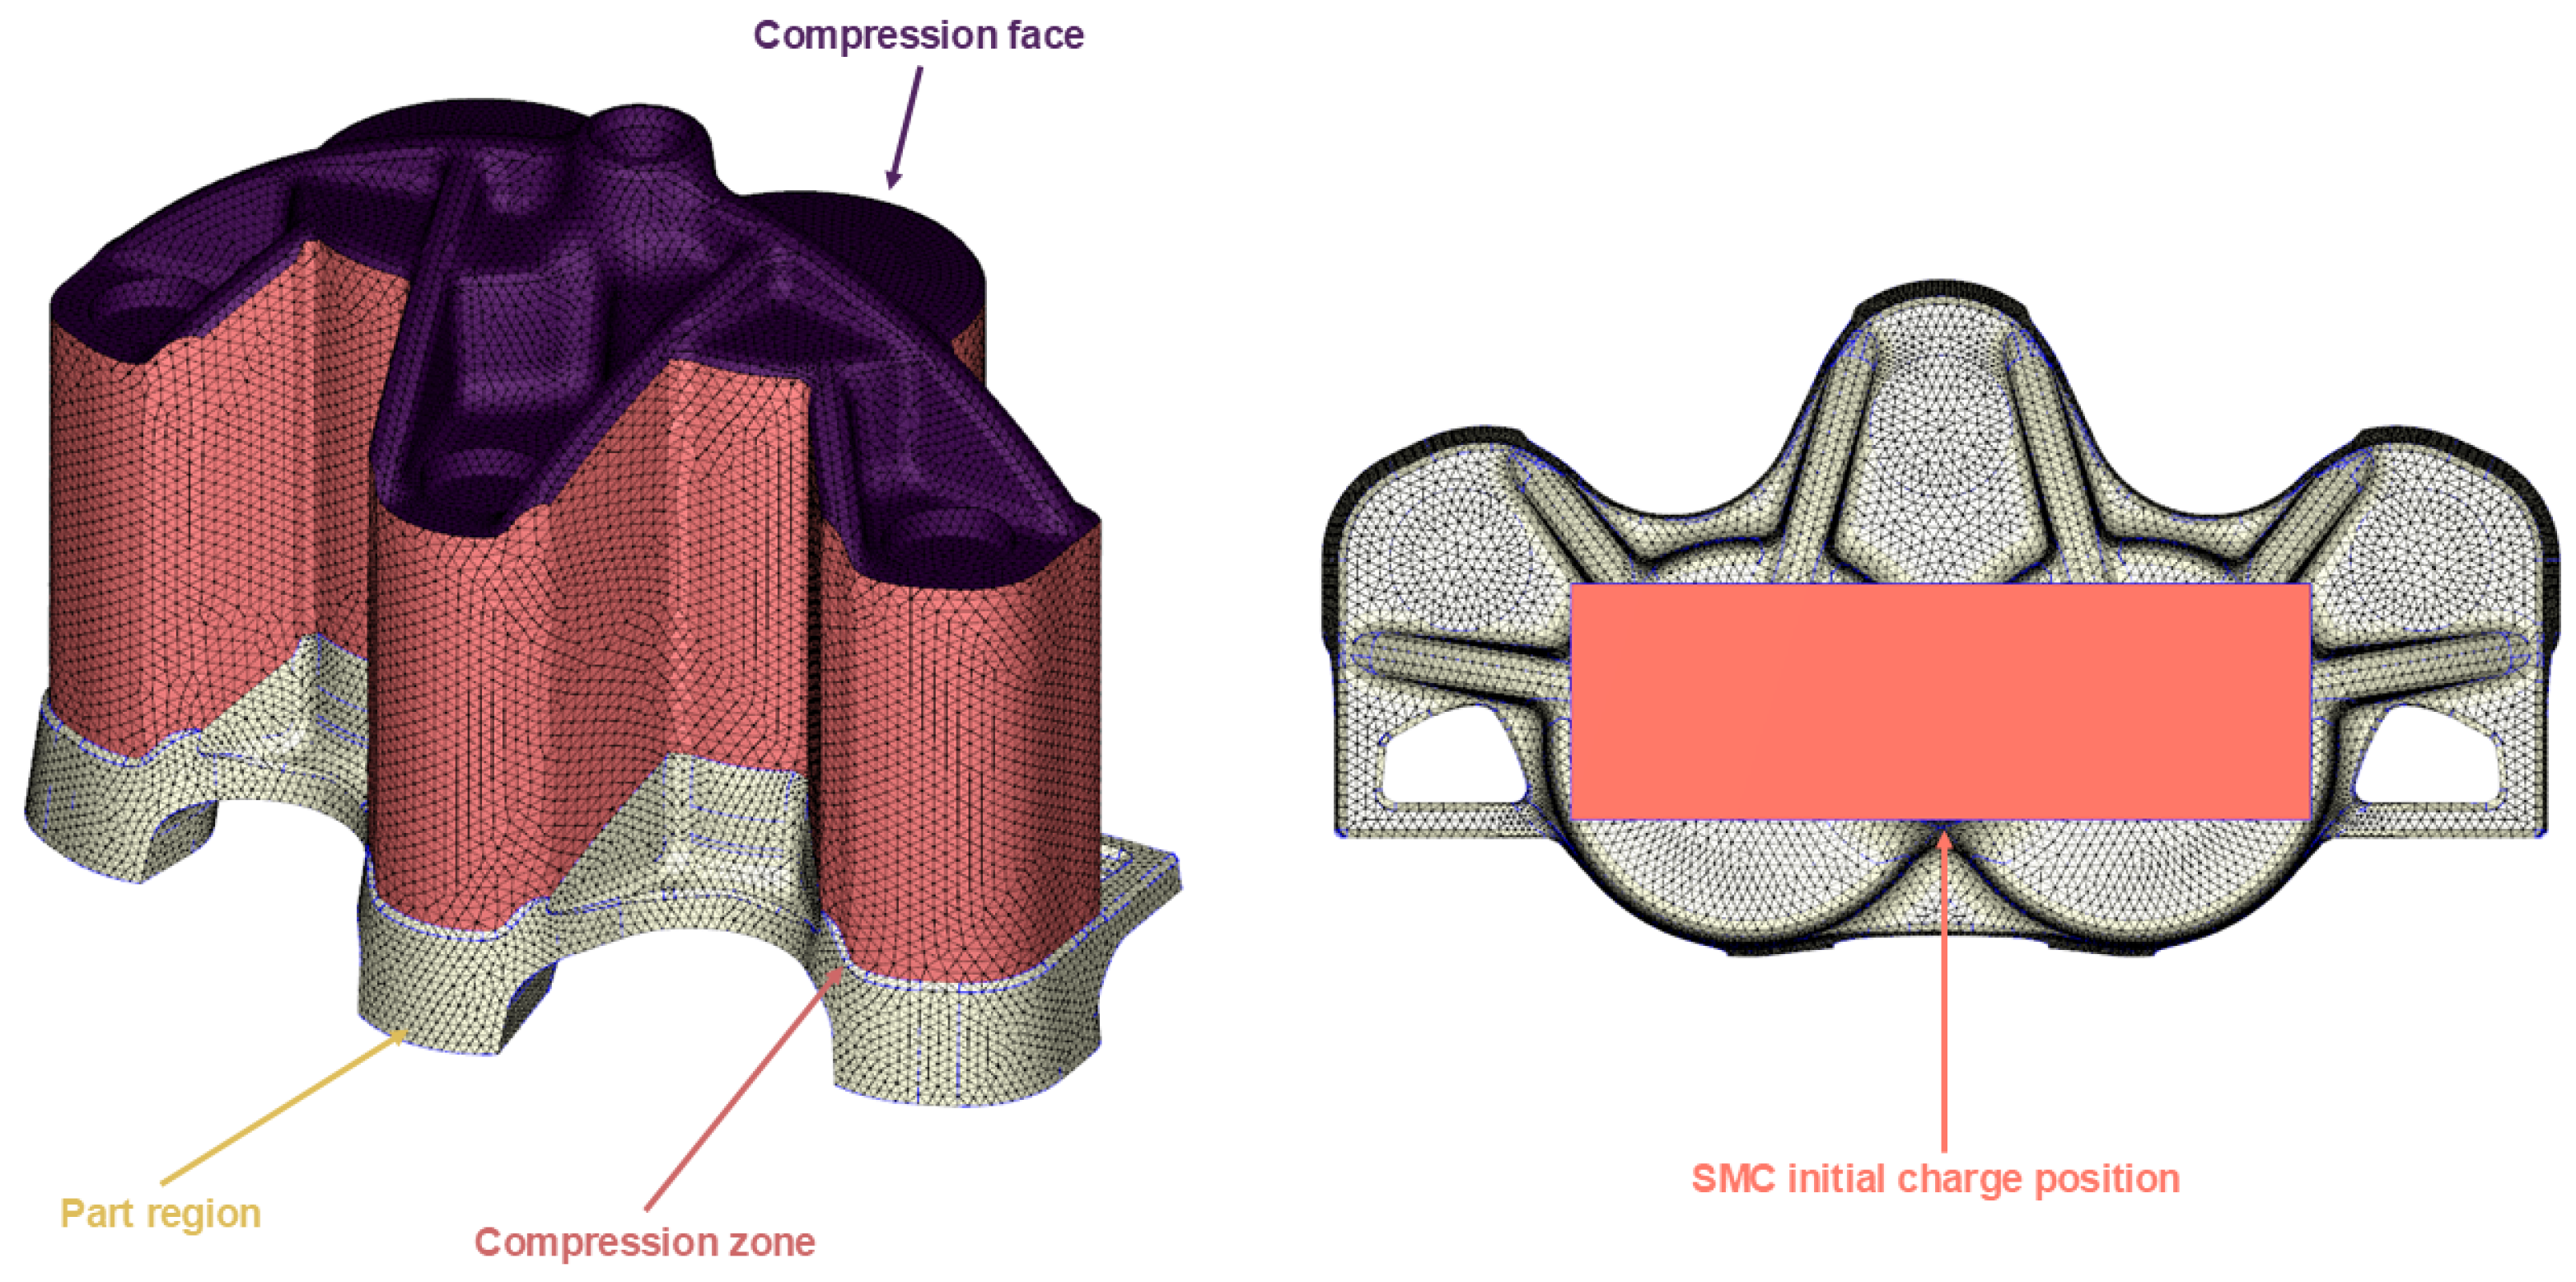
4.2. Compression Molding Simulation of Brake Caliper

To reproduce the real manufacturing process of the investigated brake caliper shell, an isothermal compression molding simulation, including gravity (g = 9.81 m/s2), was set up in Moldex3D. Hereby, the mold and SMC temperatures were fixed at 80 °C, which was a valid assumption since the material was preheated to the pressing temperature as stated in [32]. The compression molding model consisted of the part region, representing the final part geometry, the compression zone with a height of 60 mm, the defining physical space where the SMC material was allowed to flow and the compression face as a representative of the closing mold half. Both regions, the part and compression zones, were discretized using linear tetrahedral volume elements with a nominal size of 1.5 mm. In total, 797,348 tetrahedrons were generated for the finite volume simulation. The charge shape of the CF-SMC material was defined similarly to that of the stacked charge in physical manufacturing, consisting of 19 layers with a thickness of 2 mm each and in-plane dimensions of 94 × 30 mm2. For simplicity, the charge was assumed to be one block including an initial 2D random fiber orientation, perpendicular to the closing direction of the mold. In Figure 13, the discretized model is illustrated, where the part region, compression zone and compression face are represented in yellow, red and violet, respectively. Furthermore, the charge positioning in the numerical simulation is shown, which was equivalent to that in the physical experiments. The compression molding simulation was performed in a displacement-controlled way using a closing speed of 1 mm/s. The curing effects of the vinyl ester matrix system were neglected because the compression of the material was much shorter than the necessary curing time at this temperature in particular.

4.3. Fiber Orientation Validation

According to the XCT measurement results, which have already been presented in Figure 9, Figure 10 and Figure 11, a comparison of the observed, qualitative fiber orientation to the fiber orientation calculated from compression molding simulations could be performed, as in Figure 14. Cross section 1 allowed us to rate the prediction of weld lines, weld line positions and the overall macroscopic fiber orientation around the piston inserts, attachment points and hollow regions. For a better visualization of the mentioned fiber orientation, red arrows illustrate the designated positions of both the investigated cross sections. The fiber bundle orientation in the center of cross section 1 was chosen as another feature, which is marked by dashed red lines in the corresponding figure, Figure 14.
All the simulation models predicted the weld lines around the three circular attachment points. Additionally, the weld line position at the top of the center hole was similarly represented in all four investigated models. This was different for the lateral attachment points. As shown in Figure 9, the non-symmetric position of the colliding flow fronts was visible for the lateral attachment points. Only the PL-IISO and TSV model represented a similar situation, where the weld line, marked by magenta lines in Figure 14, was not symmetric regarding the x- and z-planes. Also, this model did not reveal any weld lines surrounding the hollow regions underneath the lateral attachment points. This agreed well with the XCT images and could not be reproduced by any other model combination. Nevertheless, the weld line positions predicted by the fourth model combination were slightly shifted compared to the reference tomography images.
In the caliper center, between the two circular piston inserts, Cross models, as well as the PL-IISO model including the Tait pvT description, predicted a favored fiber orientation tangential to the inserts. Within the physical prototype, however, large fiber bundles could be identified bridging the gap between the circular regions, as indicated by the dashed red line in Figure 14. This means that the dominant fiber orientation was along the y-direction. For the PL-IISO and TSV model, this fiber orientation was indicated below the central attachment point but not on the opposite side of the piston inserts. The red arrow shown between these inserts states this fact as well. While the arrow was horizontally aligned in the XCT image, the fiber orientation at the same position was rotated by about 90 degrees in the case of the PL-IISO and TSV model. Cross section 2 allowed us to interpret how well the piston inserts and its small undercuts were filled by the SMC material and to what degree the macroscopic fiber undulations were able to be predicted in thin-walled regions. Regarding the former case, a fully filled insert was found in each simulation, which agreed with the XCT image. Furthermore, the deformation of the fibers/fiber bundles within the small circumferential undercut region was well predicted by all models. Compared to thick-walled regions within the caliper geometry, the predicted qualitative fiber orientations showed large variations, and they were not comparable to the XCT measurements. The reason for this can be attributed to the gradient-based fiber orientation calculation algorithm. In thin-walled regions, the effect of long, undulated fibers is no longer correctly described by the assumption of rigid fibers, which are not affected by bending deformations. These simplifications in terms of fiber modeling were the reasons for the disagreement with the quantitative analysis of the fiber orientation in the thin but highly loaded ribs on the inner side of the caliper. As shown in Figure 11b, the carbon fibers were mainly aligned in the rib direction. The narrow ellipsoid emphasizes the small deviations in the physical specimen. In Figure 15, this exact experimentally derived ellipsoid is compared to the fiber orientation extracted from the compression molding simulations utilizing different flow model combinations. In all simulations, the fiber orientation in the x-direction was overestimated. An indication for this is provided by the ellipsoid tilted in the mathematical negative direction around the y-axis. If one considers the first entry, A 11 , for the presented fiber orientation tensors, this overestimation is also evident in terms of the total numbers. Despite the PL-IISO and TSV model results, the simulations revealed a broader expansion in the direction of the second Eigenvector, which emphasizes the non-uniform alignment of the fibers.
Within this section, we described how the previously developed viscosity and pvT models were implemented in finite volume simulations of both the squeeze flow experiments and the compression molding of the brake caliper. Four combinations of models were evaluated, and the one combining the PL-IISO viscosity with the TSV pvT model demonstrated the best agreement with the experimental data, accurately predicting the required compression force and capturing the flow behavior. The full-scale caliper simulation revealed that this model combination also yielded the most realistic predictions of weld line formation and the fiber orientation in thick-walled regions. However, in thin-walled regions, the simplified assumption of rigid, non-deformable fibers limited the accuracy of fiber orientation predictions.

5. Discussion

It is important to note that SMC materials, especially those reinforced with long fibers, require special equipment for characterization, such as squeeze flow rheometers and pvT dilatometers. However, these measurement methods are not yet standardized, and the material itself exhibits some inherent stochasticity, leading to the uncertainty represented by the high standard deviations in the gathered results. Furthermore, the need for accurate pvT models to model the inherent porosity of the material has been shown in this study. Standard Tait models are not able to capture the highly temperature-dependent porosity at low pressures, whereas a model based on thermodynamic state variables (TSVs) works well. Unfortunately, such models are not yet available in commercial software packages such as Moldex3D 2024 (CoreTech System Co., Ltd, Zhubei City, Taiwan) and must be implemented using user-defined materials. Another level of complexity is introduced by considering the influence of the fiber orientation on the viscosity of the system, also known as fiber–flow coupling. In Section 2, the best fit values of the informed isotropic (IISO) viscosity model are presented. However, this model led to numerical divergence in combination with the Cross viscosity model. This made it necessary to change the viscosity formulation to a simpler power law (PL) description. By its nature, the PL is only capable of modeling the shear thinning region of the viscosity curve. However, with respect to the provided experimental data in Figure 6, this was accurate enough for the observed shear rate range.
Non-destructive XCT measurements are well suited for obtaining quantitative information on macroscopic defects such as voids and weld lines. Small specimens like the example shown in Figure 11a must be cut out of the component or structure to perform a detailed quantitative analysis using XCT measurements. The representation of choice for fiber orientations is, according to the literature [2,22,23,24,25,26,45], the second-order tensor A ̲ ̲ . Another more illustrative representation of the current state of the fiber orientation is shown in Figure 11b by an ellipsoid oriented in the principal directions of the A ̲ ̲ -tensor. The qualitative and quantitative comparison of the investigated flow model combinations, presented in Section 4, revealed that the best results were obtained by the PL-IISO and TSV model. However, the prediction capabilities in terms of fiber orientations were not satisfactory for either the qualitative or quantitative analysis. As mentioned in the corresponding section, this can be attributed to the strong simplification of the fibers to non-deformable, rigid rods in the applied fiber orientation calculation algorithm. This simplification is especially critical in thin-walled regions. The PL-IISO and TSV model predicted the experimentally observed weld line positions accurately, whereas models with other pvT formulations provided no realistic results. Nevertheless, Figure 12b shows that the compression force needed from the machine could be estimated to within a range of 6.5%.
Future research needs to address the influence on integrated computational materials engineering schemes to understand the impact of errors in fiber orientation prediction on the structural performance of safety-relevant components such as the presented brake caliper. Furthermore, more accurate simulation models for the compression molding of SMC materials are required to predict fiber orientations more accurately. This provides the necessity for research on explicit fiber modeling schemes, based either on a purely Lagrangian or coupled Eulerian–Lagrangian approach, to provide alternatives for the prediction of long and rigid fibers.

6. Conclusions

In conclusion, the predictive capabilities of a finite volume modeling approach for CF-SMC materials are mainly limited to compressive force considerations and qualitative analyses of the fiber orientation in thick-walled regions. In addition, a complex pvT model is required to represent the inherent material porosity, which can lead to numerical convergence problems. Specialized but non-standardized setups are required to generate representative processing data for the material. Therefore, the characterization is prone to high scatter and systematic errors. To enhance clarity, the main conclusions of this work are summarized in the following list:
  • SMC materials require specialized equipment for characterization (e.g., squeeze flow rheometers and pvT dilatometers).
  • Standard Tait models fail to capture the temperature-dependent porosity at low pressures, while a model based on thermodynamic state variables (TSVs) can provide this capability.
  • The informed isotropic (IISO) viscosity model led to numerical divergence when combined with the Cross model. Consequently, it is suggested that a simpler but stable power law (PL) description be applied as the basis for the IISO model, which still provides accurate results in the required shear rate range.
  • The best results were obtained using the PL-IISO and TSV model.
  • The prediction capabilities for fiber orientations were not satisfactory for either qualitative or quantitative analysis due to the simplification of fibers to non-deformable, rigid rods.
  • Finite volume modeling approaches for the compression molding of CF-SMC materials are mainly limited to compressive force considerations and the determination of the weld line positions.

Author Contributions

Conceptualization, A.K.; methodology, A.K.; software, A.K.; validation, A.K., S.H.-K. and K.Z.; formal analysis, A.K., S.H.-K., K.Z., P.F. and Z.M.; investigation, A.K., S.H.-K. and K.Z.; resources, Z.M.; data curation, A.K. and K.Z.; writing—original draft preparation, A.K.; writing—review and editing, A.K., S.H.-K., K.Z., P.F. and Z.M.; visualization, A.K.; supervision, P.F. and Z.M.; project administration, P.F. and Z.M.; funding acquisition, P.F. and Z.M. All authors have read and agreed to the published version of the manuscript.

Funding

This research was funded by the Johannes Kepler University Open Access Publishing Fund, the federal state of Upper Austria, the Austrian Federal Ministry of Climate Action, Environment, Energy, Mobility, Innovation and Technology (BMK), the Austrian Federal Ministry of Transport, Innovation and Technology, and the Austrian Research Promotion Agency (FFG) within the framework of the project CARBOBRAKE (M-ERA.NET and “Produktion der Zukunft”, grant number 889149).

Data Availability Statement

The original data presented in the study are openly available in the CARBOBRAKE GitLab repository at https://gitlab.onelab.info/cm3/carbobrake (accessed on 13 April 2025).

Acknowledgments

The authors would like to thank Konrad Rienesl and Oskar Eibel for their support in assisting with the performance of the experimental measurements and the Linz Institute of Technology (LIT Factory) for making it possible to carry out the XCT measurements. Supported by Johannes Kepler University Open Access Publishing Fund.

Conflicts of Interest

Author Kepa Zulueta was employed by Leartiker. The remaining authors declare that the research was conducted in the absence of any commercial or financial relationships that could be construed as a potential conflict of interest.

References

  1. Alnersson, G.; Tahir, M.W.; Ljung, A.L.; Lundström, T.S. Review of the Numerical Modeling of Compression Molding of Sheet Molding Compound. Processes 2020, 8, 179. [Google Scholar] [CrossRef]
  2. Favaloro, A.J.; Sommer, D.E.; Denos, B.R.; Pipes, R.B. Simulation of prepreg platelet compression molding: Method and orientation validation. J. Rheol. 2018, 62, 1443–1455. [Google Scholar] [CrossRef]
  3. Hohberg, M.; Kärger, L.; Henning, F.; Hrymak, A. Rheological measurements and rheological shell model Considering the compressible behavior of long fiber reinforced sheet molding compound (SMC). Compos. Part A Appl. Sci. Manuf. 2017, 95, 110–117. [Google Scholar] [CrossRef]
  4. Görthofer, J.; Meyer, N.; Pallicity, T.D.; Schöttl, L.; Trauth, A.; Schemmann, M.; Hohberg, M.; Pinter, P.; Elsner, P.; Henning, F.; et al. Virtual process chain of sheet molding compound: Development, validation and perspectives. Compos. Part B Eng. 2019, 169, 133–147. [Google Scholar] [CrossRef]
  5. Meyer, N.; Ilinzeer, S.; Hrymak, A.N.; Henning, F.; Kärger, L. Non-isothermal direct bundle simulation of SMC compression molding with a non-Newtonian compressible matrix. J. Non-Newton. Fluid Mech. 2022, 310, 104940. [Google Scholar] [CrossRef]
  6. Qian, C.C.; Yuan, H.; Jesri, M.; Khan, M.; Kendall, K.N. Flow Behaviour of Carbon Fibre Sheet Moulding Compound. Key Eng. Mater. 2022, 926, 1350–1357. [Google Scholar] [CrossRef]
  7. Romanenko, V.; Duhovic, M.; Schommer, D.; Hausmann, J.; Eschl, J. Advanced process simulation of compression molded carbon fiber sheet molding compound (C-SMC) parts in automotive series applications. Compos. Part A Appl. Sci. Manuf. 2022, 157, 106924. [Google Scholar] [CrossRef]
  8. Rothenhäusler, F.; Meyer, N.; Wehler, S.; Hohberg, M.; Gude, M.; Henning, F.; Kärger, L. Experimental and Numerical Analysis of SMC Compression Molding in Confined Regions—A Comparison of Simulation Approaches. J. Compos. Sci. 2022, 6, 68. [Google Scholar] [CrossRef]
  9. Cousins, D.S.; Suzuki, Y.; Murray, R.E.; Samaniuk, J.R.; Stebner, A.P. Recycling glass fiber thermoplastic composites from wind turbine blades. J. Clean. Prod. 2019, 209, 1252–1263. [Google Scholar] [CrossRef]
  10. Krauklis, A.E.; Karl, C.W.; Gagani, A.I.; Jørgensen, J.K. Composite Material Recycling Technology—State-of-the-Art and Sustainable Development for the 2020s. J. Compos. Sci. 2021, 5, 28. [Google Scholar] [CrossRef]
  11. Stieven Montagna, L.; Ferreira de Melo Morgado, G.; Lemes, A.P.; Roberto Passador, F.; Cerqueira Rezende, M. Recycling of carbon fiber-reinforced thermoplastic and thermoset composites: A review. J. Thermoplast. Compos. Mater. 2023, 36, 3455–3480. [Google Scholar] [CrossRef]
  12. Savandaiah, C.; Kapshammer, A.; Plank, B.; Stolcer, V.; Marschik, C.; Major, Z. Thermo-mechanical characterisation of polycarbonate-based sheet moulded composites fabricated from off-cut waste unidirectional tapes. Express Polym. Lett. 2024, 18, 883–900. [Google Scholar] [CrossRef]
  13. Emminger, C.; Kapshammer, A.; Birtha, J.; Cakmak, U.; Fischer, J.; Major, Z. Improving Damping Performance of Thermoplastic Composite Materials Through SMC—TPU Hybridization. J. Appl. Polym. Sci. 2025, e56938. [Google Scholar] [CrossRef]
  14. Martulli, L.M.; Kerschbaum, M.; Lomov, S.V.; Swolfs, Y. Weld lines in tow-based sheet moulding compounds tensile properties: Morphological detrimental factors. Compos. Part A Appl. Sci. Manuf. 2020, 139, 106109. [Google Scholar] [CrossRef]
  15. Martulli, L.M.; Muyshondt, L.; Kerschbaum, M.; Pimenta, S.; Lomov, S.V.; Swolfs, Y. Morphology-induced fatigue crack arresting in carbon fibre sheet moulding compounds. Int. J. Fatigue 2020, 134, 105510. [Google Scholar] [CrossRef]
  16. Kravchenko, S.G.; Sommer, D.E.; Denos, B.R.; Favaloro, A.J.; Tow, C.M.; Avery, W.B.; Pipes, R.B. Tensile properties of a stochastic prepreg platelet molded composite. Compos. Part A Appl. Sci. Manuf. 2019, 124, 105507. [Google Scholar] [CrossRef]
  17. Alves, M.; Martulli, L.M.; Kerschbaum, M.; Swolfs, Y.; Lomov, S.V.; Pimenta, S. A 3D finite element stochastic framework for the failure of tow-based discontinuous composites. Compos. Sci. Technol. 2023, 232, 109846. [Google Scholar] [CrossRef]
  18. Sommer, D.E.; Kravchenko, S.G.; Pipes, R.B. A numerical study of the meso-structure variability in the compaction process of prepreg platelet molded composites. Compos. Part A Appl. Sci. Manuf. 2020, 138, 106010. [Google Scholar] [CrossRef]
  19. Arquier, R.; Miquelard-Garnier, G.; Iliopoulos, I.; Régnier, G. Assessing the shear viscous behavior of continuous carbon fiber reinforced PEKK composites with squeeze flow measurements. Polym. Test. 2023, 123, 108060. [Google Scholar] [CrossRef]
  20. Moldex3D 2023 Help. Available online: https://university.moldex3d.cloud/#/help?url=2023%2Fen%2F4-1-1_analysislog.html (accessed on 13 April 2025).
  21. Rienesl, K.; Stelzer, P.S.; Major, Z. Squeeze flow rheometry and data analysis of carbon fiber sheet molding compounds. Mater. Today Proc. 2022, 62, 2433–2435. [Google Scholar] [CrossRef]
  22. Favaloro, A.J.; Tseng, H.C.; Pipes, R.B. A new anisotropic viscous constitutive model for composites molding simulation. Compos. Part A Appl. Sci. Manuf. 2018, 115, 112–122. [Google Scholar] [CrossRef]
  23. Favaloro, A.J.; Sommer, D.E. On the use of orientation tensors to represent prepreg platelet orientation state and variability. J. Rheol. 2020, 64, 517–527. [Google Scholar] [CrossRef]
  24. Tseng, H.C.; Chang, R.Y.; Hsu, C.H. Phenomenological improvements to predictive models of fiber orientation in concentrated suspensions. J. Rheol. 2013, 57, 1597–1631. [Google Scholar] [CrossRef]
  25. Tseng, H.C.; Chang, R.Y.; Hsu, C.H. An Integration of Microstructure Predictions and Structural Analysis in Long-Fiber-Reinforced Composite with Experimental Validation. Int. Polym. Process. 2017, 32, 455–466. [Google Scholar] [CrossRef]
  26. Tseng, H.C.; Chang, R.Y.; Hsu, C.H. Improved fiber orientation predictions for injection molded fiber composites. Compos. Part A Appl. Sci. Manuf. 2017, 99, 65–75. [Google Scholar] [CrossRef]
  27. Teuwsen, J.; Hohn, S.K.; Osswald, T.A. Direct Fiber Simulation of a Compression Molded Ribbed Structure Made of a Sheet Molding Compound with Randomly Oriented Carbon/Epoxy Prepreg Strands—A Comparison of Predicted Fiber Orientations with Computed Tomography Analyses. J. Compos. Sci. 2020, 4, 164. [Google Scholar] [CrossRef]
  28. Lee, S.; Shin, D.; Kim, G.; Ji, W. Numerical model for compression molding process of hybridly laminated thermoplastic composites based on anisotropic rheology. Compos. Part C Open Access 2022, 7, 100215. [Google Scholar] [CrossRef]
  29. Dörr, D.; Ivanov, S.; Gergely, R.; Meyer, N.; Henning, F.; Straatman, A.G.; Hrymak, A. A Sequential Approach for Simulation of Thermoforming and Squeeze Flow of Glass Mat Thermoplastics. In Proceedings of the ESAFORM 2021: 24th International Conference on Material Forming, Liege, Belgium, 14–16 April 2021. [Google Scholar] [CrossRef]
  30. Doppelbauer, L.K.; Rienesl, K.; Stelzer, P.S.; Zulueta, K.; Chang, L.Y.; Major, Z. A macroscopic model of the compaction process during compression molding of carbon fiber sheet molding compounds. Compos. Part A Appl. Sci. Manuf. 2023, 169, 107535. [Google Scholar] [CrossRef]
  31. Fidler, A.; Zulueta, K.; Kapshammer, A.; Altemirov, A.; Stiefmann, M.; Huemer-Kals, S.; Fischer, P.; Bruyneel, M. (Eds.) Carbon-fibre reinforced sheet moulding compound in brakes: Design and simulation of a lightweight motorcycle brake calliper. In Proceedings of the Eurobrake 2023: Europe’s Braking Technology Conference & Exhibition, Barcelona, Spain, 12–14 September 2023; FISITA: Bishops Stortford, UK, 2023. [Google Scholar] [CrossRef]
  32. Fidler, A.; Huemer-Kals, S.; Kapshammer, A.; Mersch, C.; Dos Santos, M.; Belategi, U.A.; Fischer, P. (Eds.) Carbon fibre reinforced sheet moulding compound in brakes: Manufacturing and testing of a lightweight motorcycle brake calliper. In Proceedings of the EuroBrake 2024: Europe’s Braking Technology Conference & Exhibition, Mainz, Germany, 17–19 June 2024. [Google Scholar] [CrossRef]
  33. Martulli, L.M.; Creemers, T.; Schöberl, E.; Hale, N.; Kerschbaum, M.; Lomov, S.V.; Swolfs, Y. A thick-walled sheet moulding compound automotive component: Manufacturing and performance. Compos. Part A Appl. Sci. Manuf. 2020, 128, 105688. [Google Scholar] [CrossRef]
  34. Technical Data Sheet Forged Molding Compound STR120N131. Available online: https://www.m-chemical.co.jp/carbon-fiber/en/product/fmc/ (accessed on 13 April 2025).
  35. Carbon Fiber Tow (Continuous Fiber) Properties. Available online: https://www.m-chemical.co.jp/carbon-fiber/pdf/tow/Carbon%20Fiber%20Tow%20(Continuous%20Fiber)%2020240930.pdf (accessed on 13 April 2025).
  36. Engmann, J.; Servais, C.; Burbidge, A.S. Squeeze flow theory and applications to rheometry: A review. J. Non-Newton. Fluid Mech. 2005, 132, 1–27. [Google Scholar] [CrossRef]
  37. Ferré-Sentis, D.; Dumont, P.; Orgéas, L.; Martoïa, F.; Sager, M. Rheological response of compressible SMCs under various deformation kinematics: Experimental aspects and simple modelling approach. Compos. Part A Appl. Sci. Manuf. 2022, 154, 106774. [Google Scholar] [CrossRef]
  38. Guiraud, O.; Dumont, P.; Orgéas, L.; Favier, D. Rheometry of compression moulded fibre-reinforced polymer composites: Rheology, compressibility, and friction forces with mould surfaces. Compos. Part A Appl. Sci. Manuf. 2012, 43, 2107–2119. [Google Scholar] [CrossRef]
  39. Stefan, J. Versuche über die scheinbare Adhäsion. In Sitzungsberichte der Mathematisch-Naturwissenschaftlichen Classe. Abteilung II; Kaiserl. Akademie der Wissenschaften in Wien: Wien, Austria, 1874; Volume 69, pp. 713–735. [Google Scholar]
  40. Yuan, H.; Khan, M.; Peijs, T.; Qian, C. Experimental process characterisation for high-volume compression moulding of hybrid-architecture composites. Compos. Part A Appl. Sci. Manuf. 2024, 181, 108137. [Google Scholar] [CrossRef]
  41. Tseng, H.C.; Chang, R.Y.; Hsu, C.H. Numerical prediction of fiber orientation and mechanical performance for short/long glass and carbon fiber-reinforced composites. Compos. Sci. Technol. 2017, 144, 51–56. [Google Scholar] [CrossRef]
  42. Tseng, H.C.; Favaloro, A.J. The use of informed isotropic constitutive equation to simulate anisotropic rheological behaviors in fiber suspensions. J. Rheol. 2019, 63, 263–274. [Google Scholar] [CrossRef]
  43. Huang, C.T.; Lai, C.H. Investigation on the Coupling Effects between Flow and Fibers on Fiber-Reinforced Plastic (FRP) Injection Parts. Polymers 2020, 12, 2274. [Google Scholar] [CrossRef]
  44. Sommer, D.E.; Favaloro, A.J.; Pipes, R.B. Coupling anisotropic viscosity and fiber orientation in applications to squeeze flow. J. Rheol. 2018, 62, 669–679. [Google Scholar] [CrossRef]
  45. Favaloro, A.J.; Tucker, C.L. Analysis of anisotropic rotary diffusion models for fiber orientation. Compos. Part A Appl. Sci. Manuf. 2019, 126, 105605. [Google Scholar] [CrossRef]
Figure 1. Schematic illustration of all the experimental and numerical steps conducted throughout this study. Detailed information about each single aspect and the applied numerical models will be provided in their corresponding sections.
Jmmp 09 00137 g001
Figure 2. (a) Representative CF-SMC specimen used for squeeze flow experiments before and after testing; (b) squeeze flow testing setup including steel platen, thermocouples and guidings.
Jmmp 09 00137 g002
Figure 3. (a) Schematic representation of the performed pressure-controlled measurement cycle including the loading rates and dwell time; (b) pressure–specific volume–temperature (pvT) measurement setup mounted on the MTS 852 Damper Test System.
Jmmp 09 00137 g003
Figure 4. CAD representation of the investigated caliper shell and the analyzed XCT specimen. The ribs circled in red were identified as the highest-loaded regions of the CF-SMC brake caliper during operation [31]. From these regions, small specimens with dimensions of 5.0 × 4.5 × 5.0   mm 3 were cut out, which were subsequently used for XCT scans to evaluate the fiber orientation tensor.
Jmmp 09 00137 g004
Figure 5. Averaged F-u curves including spread obtained from squeeze flow experiments at 80 °C and 100 °C with axial speeds of 0.1 mm/s, 1.0 mm/s and 10.0 mm/s.
Jmmp 09 00137 g005
Figure 6. Viscosity curves of the CF-SMC material at 80 °C and 100 °C at three different speeds/shear rates derived from the Stefan equations, Equations (1) and (2).
Jmmp 09 00137 g006
Figure 7. Measured specific volume response to pressure of the CF-SMC material at 80 °C and 100 °C. The index p refers to the initially uncompacted state, whereas b represents the material’s response after the first compaction of up to 200 bar.
Jmmp 09 00137 g007
Figure 8. (a) Comparison between the experimentally determined pvT behavior of the CF-SMC and the derived Tait model for 80 °C and 100 °C; (b) comparison between the experimentally determined pvT behavior of the CF-SMC and the derived TSV model including the pressure-dependent volumetric thermal expansion coefficient, β ( p ) , for 80 °C and 100 °C.
Jmmp 09 00137 g008
Figure 9. Reconstructed XCT results for the brake caliper prototype. The measurement was conducted with a voxel size of 84 μm. The position of the cutting plane (yellow) is defined by the rotational degree of freedom (red circle) and the normal direction (blue arrow) of the plane (left); corresponding cross section including representative weld lines (red) and voids/cracks (green) within the component (right).
Jmmp 09 00137 g009
Figure 10. XCT results for the brake caliper prototype. The measurement was conducted with a voxel size of 84 μm. The position of the cutting plane (red) used to investigate the filling of the aluminum piston insert is defined by the normal direction (blue arrow) of the plane in the global coordinate system (left); corresponding cross section including representative undulated fibers/bundles (red) and one void (green) within the component (right).
Jmmp 09 00137 g010
Figure 11. (a) Representative volume element of the highly loaded caliper rib (see Figure 4). The reference coordinate system used for the result evaluation was equivalent to the global coordinate system and was shifted to the center of the 5.0 × 4.5 × 5.0   mm 3 specimen. (b) Graphical representation of the fiber orientation using a 3D ellipsoid at the origin of the reference coordinate system. The principal axes are defined by the Eigenvectors of the fiber orientation tensor A ̲ ̲ .
Jmmp 09 00137 g011
Figure 12. (a) Moldex3D model of the squeeze flow rheometer setup used to validate the derived viscosity and pvT models. Due to its symmetry, 198,510 solid prism elements were used to model one quarter of the setup. (b) Resulting axial compression from the simulations compared to the experimentally recorded data (red line) for a temperature of 80 °C and a testing speed of 1 mm/s.
Jmmp 09 00137 g012
Figure 13. Illustration of the discretized simulation model including the part region, compression zone and compression face. Additionally, the initial charge positioning in the numerical simulation is shown.
Jmmp 09 00137 g013
Figure 14. Qualitative comparison of the fiber orientation obtained from XCT images to that calculated in the numerical simulation for different combinations of flow behavior models in Moldex3D. The corresponding cross sections, 1 (center region) and 2 (cross section cutting through piston inserts), are shown in Figure 4. The magenta lines mark the weld line positions for a better visualization. Furthermore, the red arrows provide the fiber orientation at designated points whilst the dashed red lines indicate the fiber bundle orientation in the thickest center region of the caliper to emphasize the differences between the models.
Jmmp 09 00137 g014
Figure 15. Quantitative representation of the local fiber orientation (FO) for the experimental data set and data generated by compression molding simulations utilizing different viscosity and pvT models. All ellipsoids are represented in the global coordinate system of the brake caliper. The origin of the coordinate system was shifted to the center of the investigated rib for a proper representation.
Jmmp 09 00137 g015
Table 1. Cross viscosity model parameters fitted on experimental data for the SMC material STR120N131 from Mitsubishi, with the resin behavior represented by R 2 = 0.989 .
ParameterValueUnit
A 1.73 × 10 29 Pa s
T b 29,610.55K
τ * 2000Pa
n0.233-
Table 2. Power law parameters fitted on experimental data for the SMC material STR120N131 from Mitsubishi for the isotropic and anisotropic IISO models. The latter’s model parameters resulted from a best fit calibration yielding an anisotropy factor of R η = 8.52 × 10 6 .
Isotropic PL ModelIISO PL Model
ParameterValueUnitParameterValueUnit
A0.18742Pa sA 1.46 × 10 9 Pa s
T b 4055.19K T b 4055.19K
n0.2-n0.2-
Table 3. Modeling parameters for the Tait and TSV pvT models derived from experimental data through curve fitting using a least-square algorithm.
Tait Model Parameters
ParameterValueUnit
b 1 4.00 × 10 6 m3/kg
b 2 1.99 × 10 6 m3/(kg K)
b 3 3.7 × 10 9 Pa
b 4 0.010291/K
C0.0894-
TSV Model Parameters
ParameterValue at 80 °CValue at 100 °CUnit
v 0 7.59 × 10 4 7.74 × 10 4 m3/kg
v 0 , p 5.54 × 10 4 3.71 × 10 4 m3/kg
v f 5.53 × 10 4 2.65 × 10 4 m3/kg
ψ 0.0250.02-
κ 0.351.04-
p t 1.29 × 10 4 2.64bar
p t , p 5.382.75bar
Disclaimer/Publisher’s Note: The statements, opinions and data contained in all publications are solely those of the individual author(s) and contributor(s) and not of MDPI and/or the editor(s). MDPI and/or the editor(s) disclaim responsibility for any injury to people or property resulting from any ideas, methods, instructions or products referred to in the content.

