Abstract
Injection moulding (IM) is a manufacturing technique used to produce intricately detailed plastic components with various surface finishes, enabling the production of high-tolerance functional parts at scale. Conversely, stereolithography (SLA) three-dimensional (3D) printing offers an alternative method for fabricating moulds with shorter lead times and reduced costs compared to conventional manufacturing. However, fabrication in a layer-by-layer fashion results in anisotropic properties and noticeable layer lines, known as the stair-step effect. This study investigates post-processing techniques for plaques with contrasting stair-step effects fabricated from commercially available SLA high-temperature resin, aiming to assess their suitability for IM applications. The results reveal that annealing significantly enhances part hardness and heat deflection temperature (HDT), albeit with a trade-off involving reduced flexural strength. Experimental findings indicate that the optimal stage for abrasive surface treatment is after UV curing and before annealing. Plaques exhibiting contrasting stair-step effects are characterized and evaluated for weight loss, dimensional accuracy, and surface roughness. The results demonstrate that abrasive blasting effectively removes the stair-step effect without compromising geometry while achieving polished surface finishes with roughness average (RA) values of 0.1 μm through sanding. Overall, a combination of abrasive blasting and sanding proves capable of precisely defining surface roughness without significant geometry loss, offering a viable approach to achieving traditional IM finishes suitable for both functional and aesthetic purposes.
1. Introduction
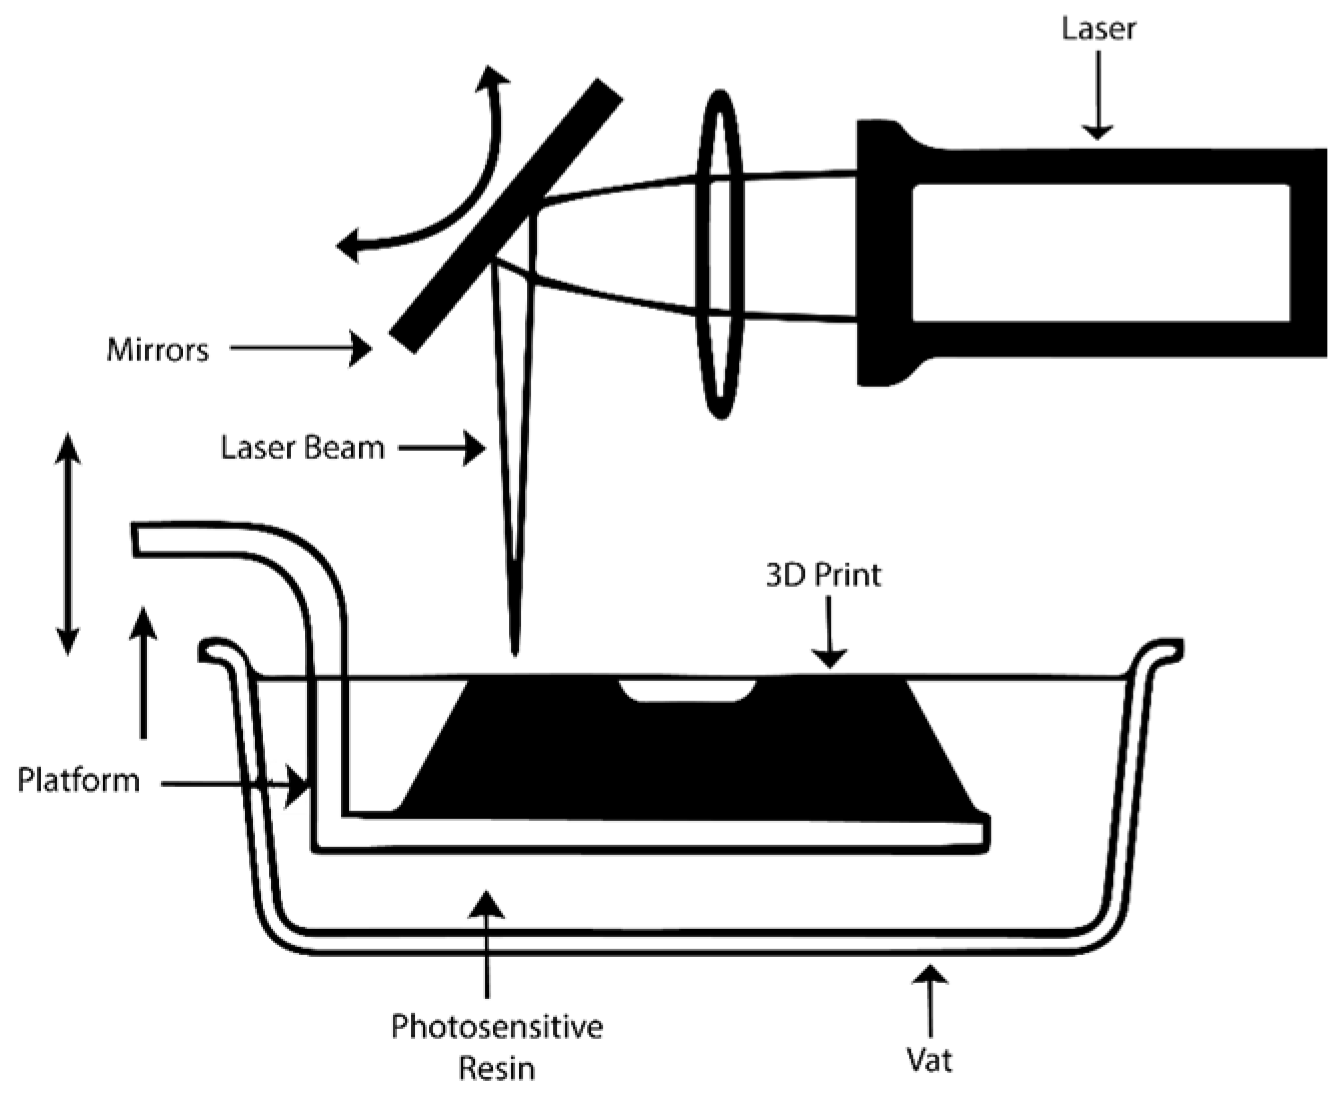
Additive manufacturing (AM), the official industry term, but also widely referred to as three-dimensional printing (3DP), rapid prototyping (RP), or solid freeform fabrication, is the technique used to build physical models, prototypes, production parts, and insert tooling components in a layer-by-layer fashion [1]. Stereolithography (SLA) is a process belonging to the Vat Photopolymerization family, where a component is built chemically with liquid photopolymer from a photopolymer reservoir or vat. The build platform is first positioned in the vat of liquid photopolymer. A layer is selectively cured using a UV laser to solidify a cross-section of the photopolymer resin. The platform then moves along the Z-axis at the distance of one layer, and a sweeper blade coats the surface. Illustrated in Figure 1, the laser beam is focused on the predetermined path using a set of mirrors, called galvos, or a digital micro-mirror device (DMD) to reflect and focus UV light on the surfaces of photo-reactive materials. However, on build completion, parts require additional UV and thermal treatment to attain maximum properties [2,3]. By cross-linking the remaining unreacted monomer in the part, a proportional improvement in strength, stiffness, temperature resistance, and chemical resistance is achieved [4].

Figure 1.
A basic schematic of stereolithography technology.
Injection moulding (IM) is a leading manufacturing process when identical parts are required in large production volumes with high dimensional tolerance, consistent quality, and specific surface finishes [5,6]. Prototype or bridge tooling is generally machined by computer numerical control (CNC) from aluminium or steel and requires timely design, specialised equipment, high-end software, and skilled operators [7,8]. When small to medium scale quantities are needed of IM parts, SLA 3D printing offers an alternative solution to fabricate insert moulds with a fraction of the time and cost compared to steel moulds [9]. In comparison to other AM techniques, SLA utilises photoresins that are expected to have high thermal resistance and superior surface quality, making them ideal for insert tooling [10]. Since skilled machine operators are not required and fabrication time is reduced from weeks to hours, assumptions can be quickly evaluated with end-use materials [11]. Rahmati et al. investigated the maximum quantity of IM coupons produced from SLA tooling and reported 500 successful injections before tool failure from excessive flexural stress [12]. Recent studies conducted by Hopkins et al. [13] and Moritz et al. [14] compared the mechanical properties of IM coupons produced from a range of commercially available photoresins and found their properties to be similar to coupons produced from steel tooling. However, in both studies, only a handful of parts were produced before incidental fractures caused by large hairline cracks rendered the SLA inserts unusable. Nevertheless, specialist resins for tooling are constantly being released which may make printed tooling a viable option for short runs.
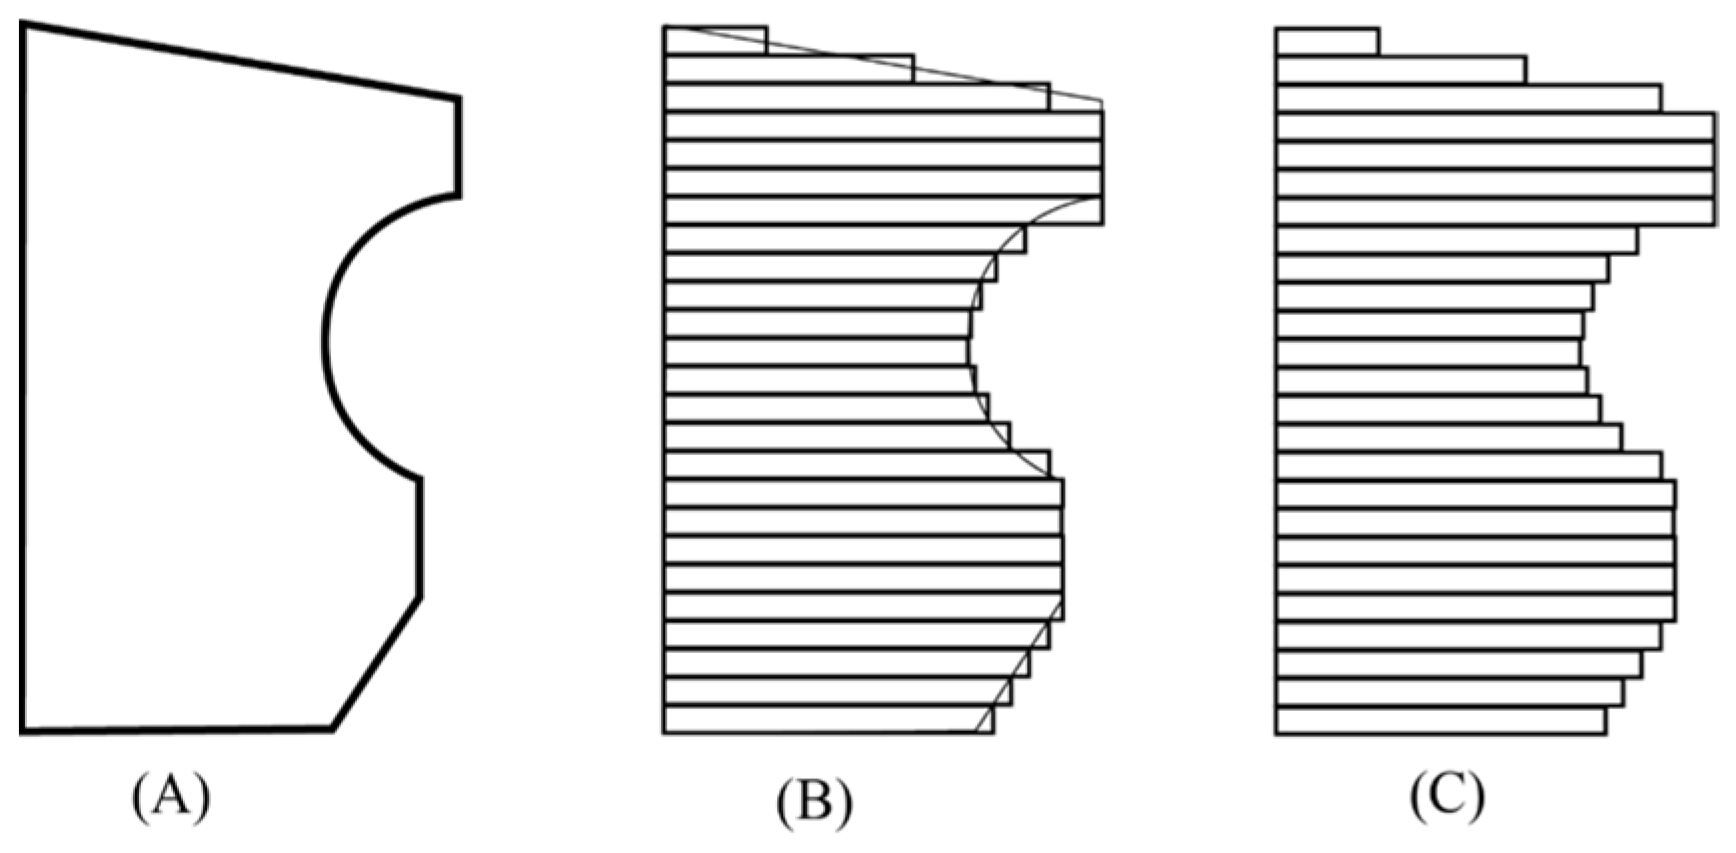
Spencer et al. [15] discussed how the stair-step effect is a critical drawback to the adaptation of SLA tooling. The surface of the tool is represented on the part, making removal of the part difficult as the surface roughness on the tool can be keyed into the surface of the moulded part. The stair-step effect is influenced by the 3D printing process, material, orientation of the print, and print parameters, which can be optimised to improve the component’s surface roughness [16,17]. In the manufacture of 3D-printed parts, a 3D CAD model is first sliced into a set of two-dimensional (2D) layers. By stacking these 2D layers together, a physical part can be fabricated in an AM process to approximate the original CAD model as illustrated in Figure 2. The stair-step effect is generated by the offset needed between two layers to create a slope. It is the relationship between the thickness of a layer and its offset from the previous layer. It should be noted that, to fabricate an insert mould with any 3D printing technology, the orientation will likely be prioritised for build success and geometric accuracy before surface finish. Factors that will have the largest influence on the stair-step effect include Z height resolution, part orientation, rounded corners, and concave or convex surfaces [18].

Figure 2.
(A); Outline of CAD geometry, (B); outline of CAD geometry after slicing, (C); 3D-printed outline of layers.
Post-process treatments refer to the procedures implemented after the completion of the 3D printing build-process to achieve the desired material properties [17]. These additional steps are primarily undertaken to overcome challenges inherent in AM processes. Surface roughness arising from the stair-step effect, dimensional disparities from CAD design to the final part, and limitations in thermal, mechanical, and anisotropic properties have been outlined as inhibitors limiting the greater adaptation of AM [19]. Studies evaluating post-processing methods for polymer-based 3D printing techniques tend to focus on improving the surface roughness and mechanical properties of parts fabricated by material extrusion (ME) technology and materials [17,20,21], which is likely due to the low-cost entry-level printers. Moreover, newly emerging technologies developed by AMT (Hartland, WI, USA), PostPro3D (Hartland, WI, USA), and Dye Mansion (Austin, TX, USA) have automated the post-process steps required for ME and powder-based techniques to remove the stair-step effect and render parts with texture and polished finishes without extensive material removal to maintain geometric accuracy [22,23,24]. In contrast, investigations into the enhancement of resin-based 3D-printed surface quality and part accuracy frequently concentrate on pre-build printing parameters, including orientation, Z-height resolution, and support structures [25,26]. Mass finishing techniques applied to SLA parts including barrel tumbling and vibratory bowl finishing were found to be effective at reducing surface roughness; however, the authors acknowledged that the processes resulted in a loss of definition in critical areas, such as smoothing sharp edges [15]. Abrasive blasting SLA-printed jewellery was found to significantly reduce the surface roughness without compromising geometric tolerance. Nonetheless, the authors emphasized that the effectiveness of this process hinged on various parameters including media type, pressure, and blasting distance and angle [27]. Furthermore, Hu et al. explored the correlation between SLA part build orientation and UV cure time on part hardness. Their findings suggest that a lower orientation and prolonged UV cure time may enhance the predicted hardness value [28]. Zguris et al. examined the tensile strength and modulus of SLA resins cured under various UV wavelengths, specifically 365 nm, 385 nm, and 405 nm. In each instance, the parts exhibited optimal response when cured at 405 nm [2].
If resin-based 3D printing is to be widely adopted by the production and manufacturing industry (particularly for IM applications, which consume nearly 30% of all plastic parts [7], with an estimated compound annual growth rate of 5.1% by 2033 according to global market insights [23]), the ability to replicate conventional finishes should follow a degree of logic in practical steps. Hence, there is a necessity for the development of reliable, controllable, and predictable post-processes to enhance the effectiveness of SLA. As such, the focus of this study has been to remove the stair-step effect and replicate standard plastic surface finishes on SLA insert tooling. This study further intends to evaluate post-processing techniques on plaques produced with contrasting stair-step effects from fabrication in a range of orientation from commercial SLA high-temperature resin. The trade-offs in thermal and mechanical properties resulting from post-curing will be assessed for IM applications. The study aims to provide valuable insights by recording the impact of abrasive post-process techniques on surface roughness and dimensional accuracy.
2. Materials and Methods
2.1. Fabrication of Plaques
SLA-printed plaques were fabricated from commercially available photopolymer resin, namely Formlabs high temp resin RS-F2-HTAM-02 with a heat deflection temperature (HDT) of 238 °C at 0.45 MPa for precision applications [29]. The 3D-printed plaques were manufactured as illustrated in Figure 3 on a FormLabs 2 (FormLabs Ltd., Somerville, MA, USA) utilising the inbuilt 250 mW laser at 405 nm wavelength at 50 microns layer height. SLA plaques were designed in SolidWorks 2022 (Dassault Systems SolidWorks Corp., Waltham, MA, USA). Plaques were printed at orientations ranging from 0–90 degrees in increments of 10 degrees. The initial phase of the study focused on examining the mechanical and thermal properties of 3D-printed plaques subjected to post-production UV curing (referred to as “Cured”) or post-production UV curing followed by annealing (referred to as “Annealed”). The aim was to discern the trade-offs associated with heat treatment in the context of IM applications. In addition to the aforementioned cured and annealed plaques, trials were conducted on plaques that underwent no treatment post printing, termed as “Green”. The experimental investigation aimed to assess the hardness of plaques and the cutting rate at each stage of cure. This assessment was conducted to pinpoint the optimal stage of post-curing for implementing abrasive post-processing surface treatment techniques.
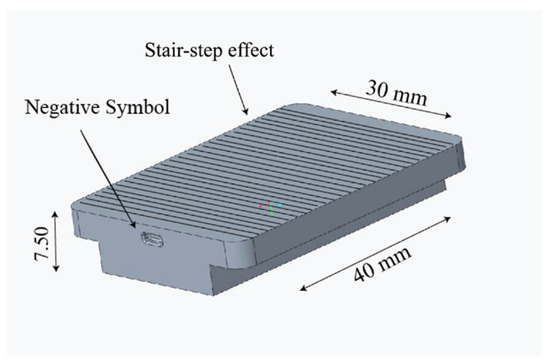
Figure 3.
Dimensions of 3D-printed plaques (length 40.00 mm, width 30.00 mm, height 7.50 mm).
2.2. Surface Finish Benchmarks
The benchmarks used in this study for each orientation to achieve are named, described, and cross-referenced in terms of numerical value and international injection moulding specification in Table 1 [30,31].

Table 1.
Benchmark surface finish selected for study.
2.3. Post-Processing
Upon build completion, all plaques were removed from the build platform and placed in a wash basket containing used isopropyl alcohol (IPA) for 5 min. Plaques were then separated from support material and transferred to a second wash basket containing unused IPA for an additional five minutes of soaking and rinsing.
Green plaques consisted of parts with their supports removed, soaked in IPA for 10 min, and air-dried without post-curing. Plaques referred to as UV-cured were post-cured in a 3D Systems ProCur350 UV Chamber (Rock Hill, SC, USA) at 395 nm wavelength for 10 min per side after support removal. Annealed plaques were post-UV-cured and then placed in a non-food oven heated to 160 °C for 180 min, as recommended by manufacturing guidelines, to achieve peak mechanical properties for high-temperature applications [4].
2.3.1. Sanding
Wet and dry abrasive paper of grits ranging from 60 to 2500 were obtained from Athlone Motor Factors, (Athlone, Ireland). Abrasive paper was cut into 30 mm × 40 mm rectangles and attached to a medium-density foam sanding block. All sanding procedures were completed by hand; the sanding block was rotated in a circular motion with light pressure at an average of 120 revolutions per minute.
2.3.2. Abrasive Blasting
Abrasive blasting was carried out using a manual sandblaster with 200 μm round glass balls sourced from Sinterit sp. z o.o., (Krakow, Poland). Plaques were positioned 20 mm from the nozzle at a 90° angle and manually moved across the blasting nozzle 6 times per minute at 75 psi.
2.3.3. Vapour Smoothing Tetrahydrofuran
(THF) was sourced from Lennox Laboratory Supplies Ltd., (Dublin, Ireland) and utilised as a solvent to be vaporised during this study. The setup consisted of 25 mL of solvent poured into a glass dish enclosed by a cardboard lid. Plaques were suspended at heights of 25 and 50 mm above the solvent and visually inspected at 5 min intervals for 30 min. An induction heating plate was used to vaporise the THF solution between 64 °C and 66 °C, and the temperature was monitored using a thermometer.
2.4. Mechanical and Thermal Characterisation
2.4.1. Shore D Hardness
Shore hardness was measured using a Durometer Shore D Hardness Scale at 20 °C room temperature for 15 s per sample. Five measurements were taken per plaque. A total of 45 plaques were subjected to testing, with 5 plaques prepared for each orientation.
2.4.2. Flexural Modulus/Strength
Flexural testing was conducted on a Lloyd LRX Tensometer after conditioning for a minimum of 24 h at 23 ± 2 °C. The Tensometer was fitted with a 2.5 kN loadcell and 3-point bending jig. Experiment settings: span 96.0 mm, speed of bending 2 mm/min, max deflection 2 mm (Modulus), 35 mm (Strength). A total of 30 specimens were prepared to ISO 178:2010+A:2013 standards to determine flexural properties.
2.4.3. Heat Deflection Temperature (HDT)
The specimens were placed under the deflection-measuring device and lowered into a silicone oil bath, and a flexural stress of 1.80 MPa was applied. The temperature was increased from ambient at a uniform heating rate of 120 °C/h. The Heat Deflection Temperature of the material was tested according to ISO 75-2:2013, Method A. A total of 30 samples were prepared in three orientations of uniform dimensions measuring 80 mm in length, 10 mm in width, and 4 mm in height. The test was complete when each sample reached a deflection of 0.34 mm.
2.4.4. Surface Roughness
Surface roughness was measured using an E35 B HandySurf Surface Finish Analyser tester from Zeiss (Oberkochen, Germany). It has a measuring range X = 16 mm and Z = 370 µm with a resolution of 0.7 nm. Three measurements were taken in the X and Y direction to give an average surface roughness value per direction.
2.4.5. Weight and Dimensional Tolerance
Samples of between 8.0000–8.9000 g were weighed using a Sartorius analytical balance with a resolution of 0.0001 g. Digital Vernier callipers were used to measure and record the height of the plaques, which were designed in CAD to have a nominal height of 7.50 mm. Three measurements were taken per sample at each step during procedures to identify the average loss of geometry.
2.5. Digital Microscopic Images
Images were taken with a Nikon Digital Microscope ShuttlePix P-400R (Krakow, Poland) before and after abrasive post-processing steps to help identify removal of the stair-step effect and to visually benchmark IM surface finishes on plaques. Plaques were centred on an LED illuminator and the microscope was lowered to a z height of 17,000 µm with a magnification of 12.5×.
3. Results and Discussion
3.1. Observations from Print Orientations
All plaques printed without difficulty. Visually, there was a considerable difference in the stair-step effect depending on the print angle. The success rate of large flat 3D-printed surface areas common in insert tooling can be significantly increased by tilting the model. According to Formlabs [35], orienting the model at an angle of 10 to 20 degrees can substantially boost the success rate of printing. This is achieved by decreasing the contact area between the part and the tank, resulting in a reduced cross-sectional surface area or volume per layer. In most cases, the slicing software for resin-based applications will offer an automated orientation to help ensure print success. The stair-step effect is determined by the orientation in which the 3D-printed part is fabricated. As illustrated in Figure 4, a gradual slope of 10 degrees will have noticeably protruding wide “steps” in comparison to a steep slope of 80 degrees with barely visible “steps”, while a slope of 45 degrees will render a uniform stair-step pattern. These orientations were deliberately selected to create a wide array of distinctive stair-step effects, facilitating a comprehensive evaluation of post-processing techniques and their impact on dimensional geometry and surface roughness.
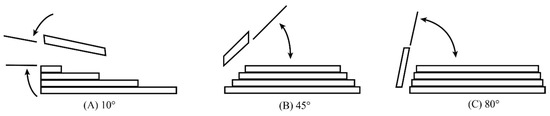
Figure 4.
Illustration of the stair-step effect built at (A) 10°, (B) 45°, and (C) 80° orientations.
3.2. Material Characterisation after UV and Thermal Treatment
3.2.1. Heat Deflection Temperature
HDT testing was conducted on post-fabrication cured and annealed plaques. Results illustrated in Figure 5 that changes in print orientation resulted in significant differences in the HDT of the plaques (p < 0.005). During the build process, UV light is used to solidify the resin and form the shape of the part being fabricated. However, parts do not reach optimal polymerization and often require additional UV and thermal treatment after printing to attain maximum mechanical properties. By cross-linking, the remaining polymer proportionally improves strength, stiffness, temperature resistance, chemical resistance, and most noticeably becomes harder [21,36]. In the literature, both Hopkins et al. and Moritz et al. reported incidental fractures caused by large hairline cracks rendering SLA IM insert unusable before reaching the desired quantity of parts during trials [13,14], likely due to the brittle nature of the tooling when used for high heat applications. The HDT serves as a metric for assessing a polymer’s ability to endure deformation when exposed to predetermined loads and elevated temperatures [37], as observed in IM. Increasing the HDT value can notably improve the performance of 3D-printed polymer insert moulds. By improving thermal resilience, inserts become capable of enduring elevated temperatures without compromising their structural integrity or incurring deformations. Consequently, this enables dimensional stability in moulded components by mitigating heat accumulation during the injection process, which is a common source of distortion and warping.
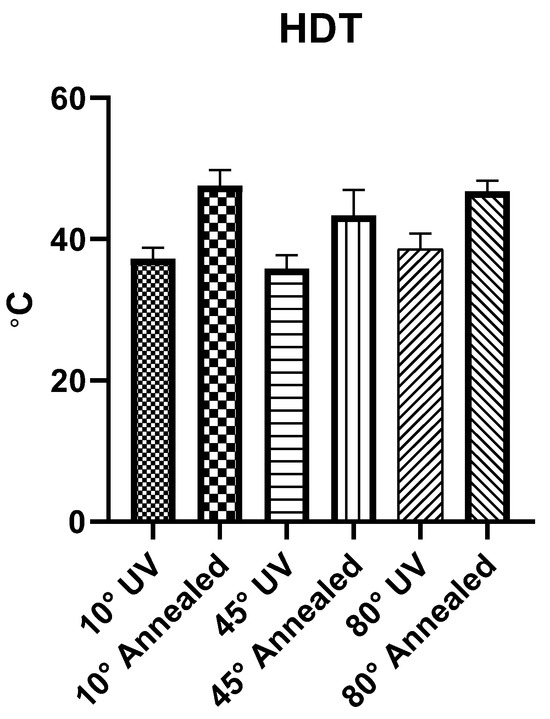
Figure 5.
HDT comparison results from UV vs. annealed plaques fabricated in orientations of 10°, 45°, and 80°.
3.2.2. Flexural Properties
Flexural properties of polymers refer to the material’s ability to withstand bending or flexural stress without breaking. The mechanical properties can be used to assess a polymer’s strength, stiffness, and its ability to maintain its structural integrity under various loads [38,39]. Flexural property data was obtained following HDT testing from cured and annealed plaques across utilised orientations.
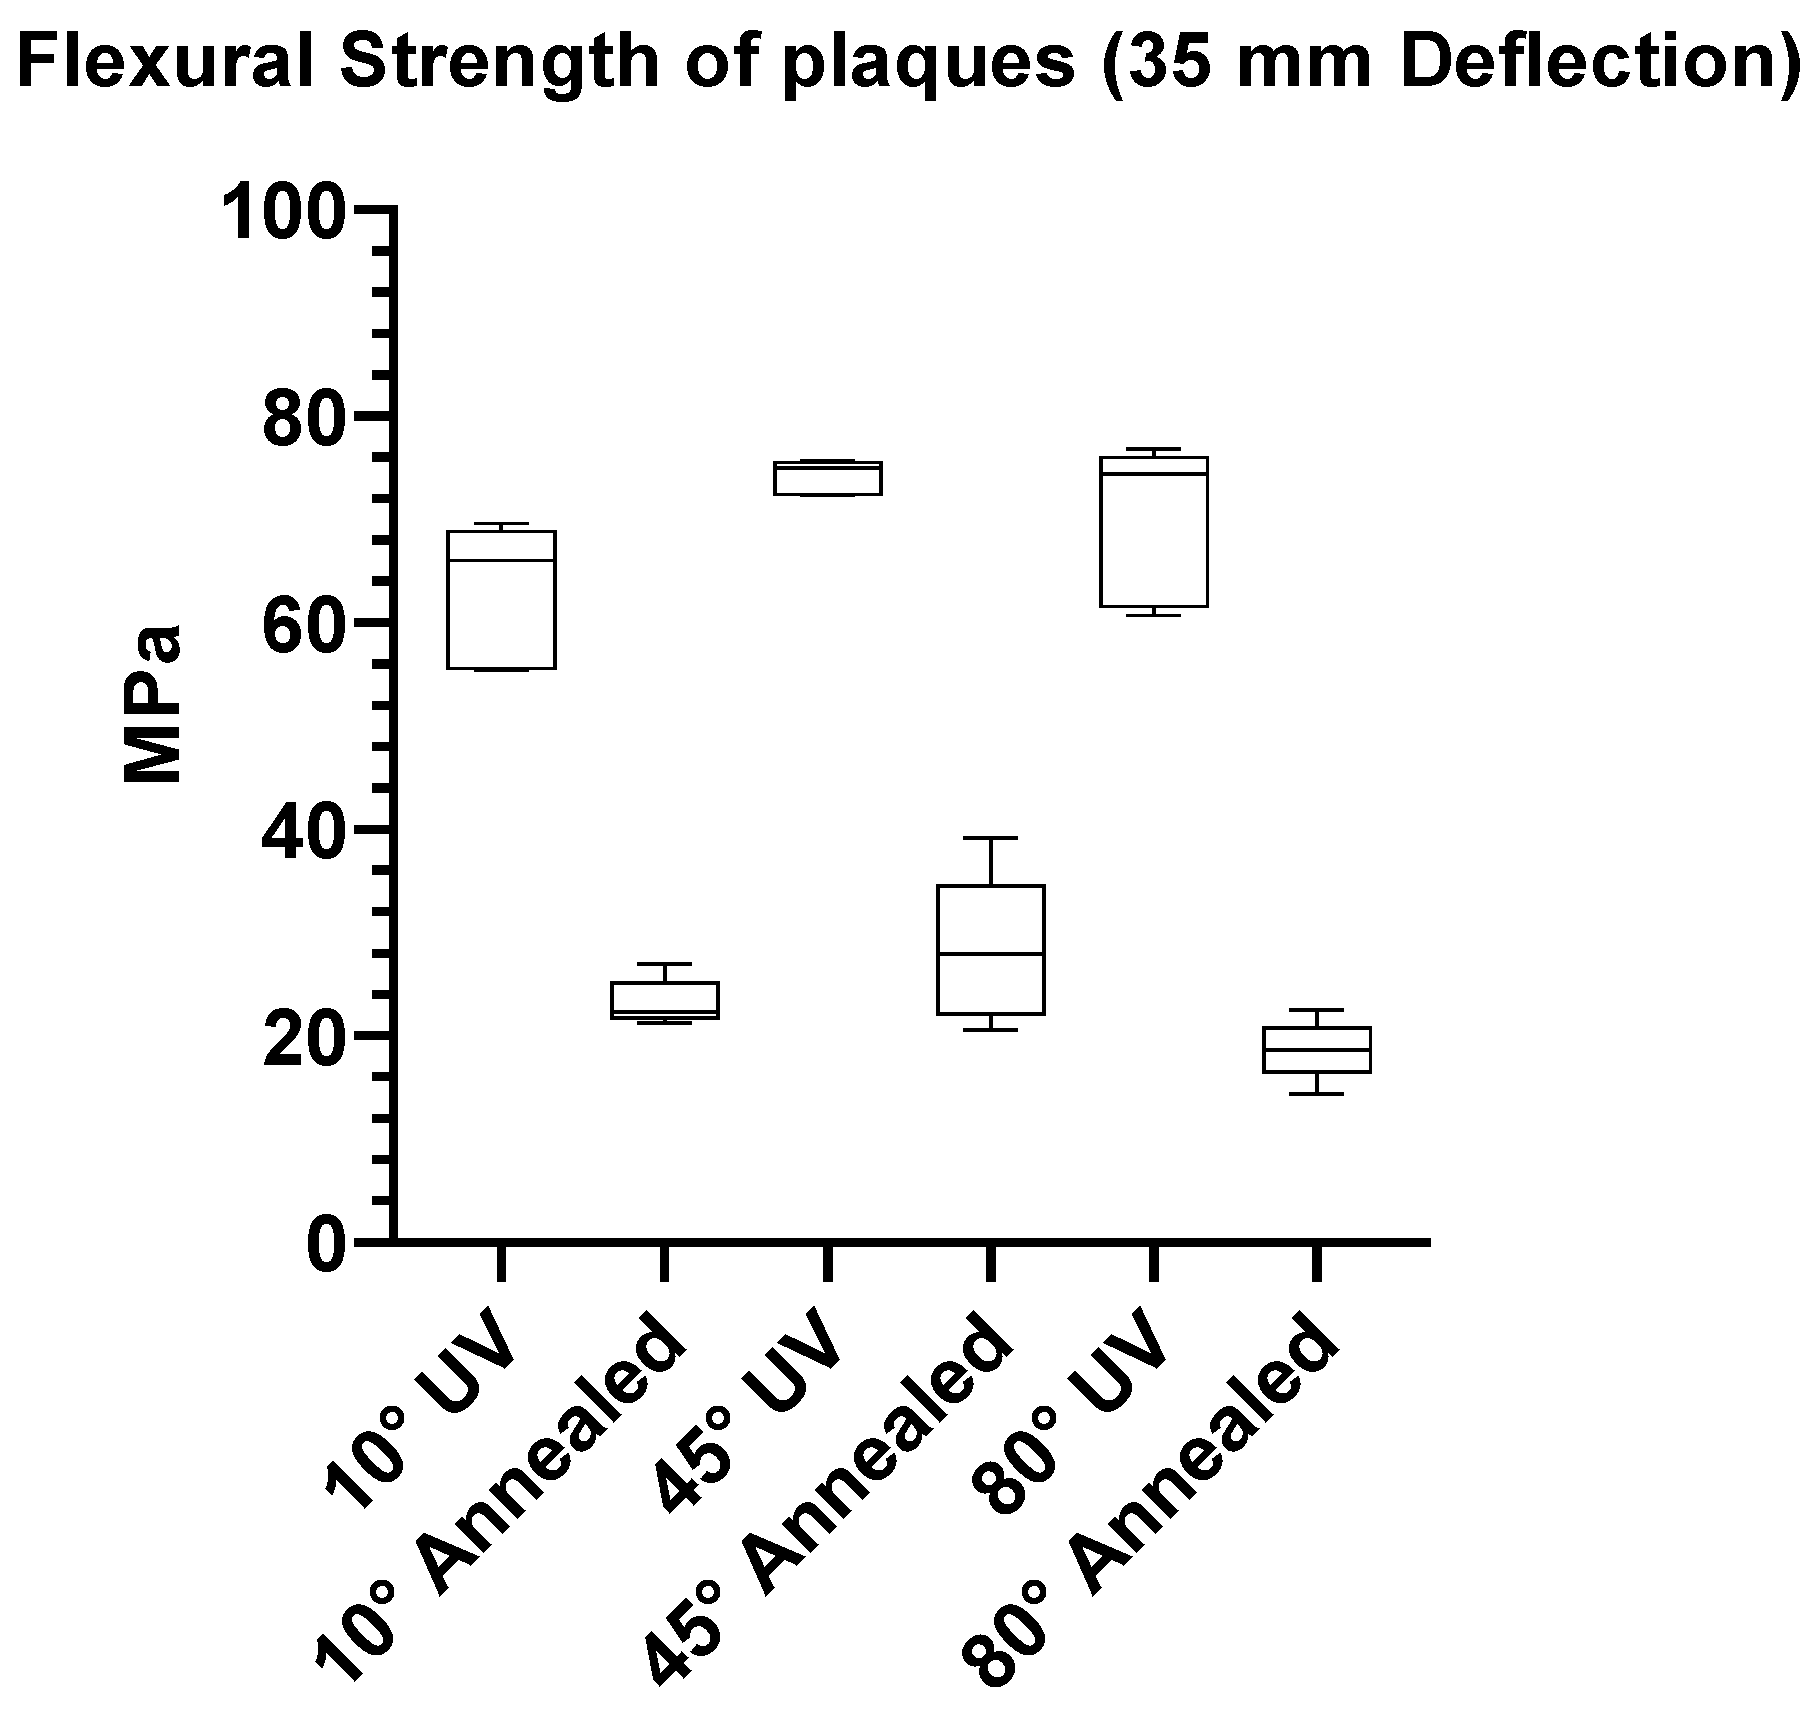
The findings listed in Figure 6 for UV-treated plaques are consistent with the manufactures guidelines and those of Cosmi et al. [3], although the materials, print orientations, and parameters were not exactly the same, which is likely the reason for the slight differences. Consequently, heat treatment following the manufactures guidelines proved to have a significant effect on the average flexural strength of plaques in all orientations; the average strength from plaques annealed declined from 68.35 MPa to 23.37 MPa. The manufacturers reported a slight insignificant decrease in material properties after annealing, although post-UV curing was completed using a FormCure box that is composed of an 80 °C heated chamber and 405 nm wavelength bulbs [40]. It is likely that the polymer chains in the 3D-printed plaques degraded from excessive heat caused by the annealing process and that an increased UV wavelength and duration for curing may resulted in improved mechanical properties.
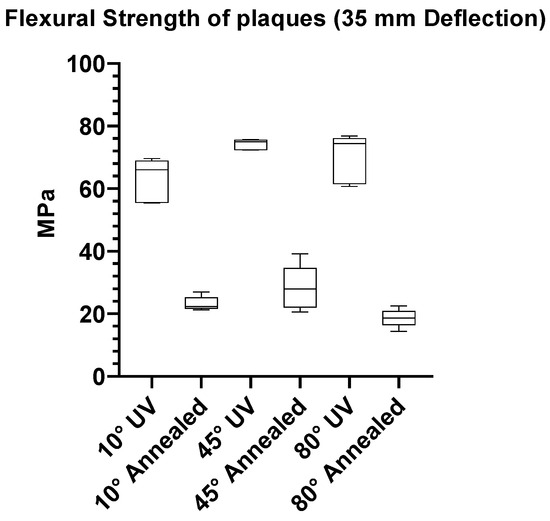
Figure 6.
Flexural strength results for UV vs. annealed groups of plaques in orientations of 10°, 45°, and 80°.
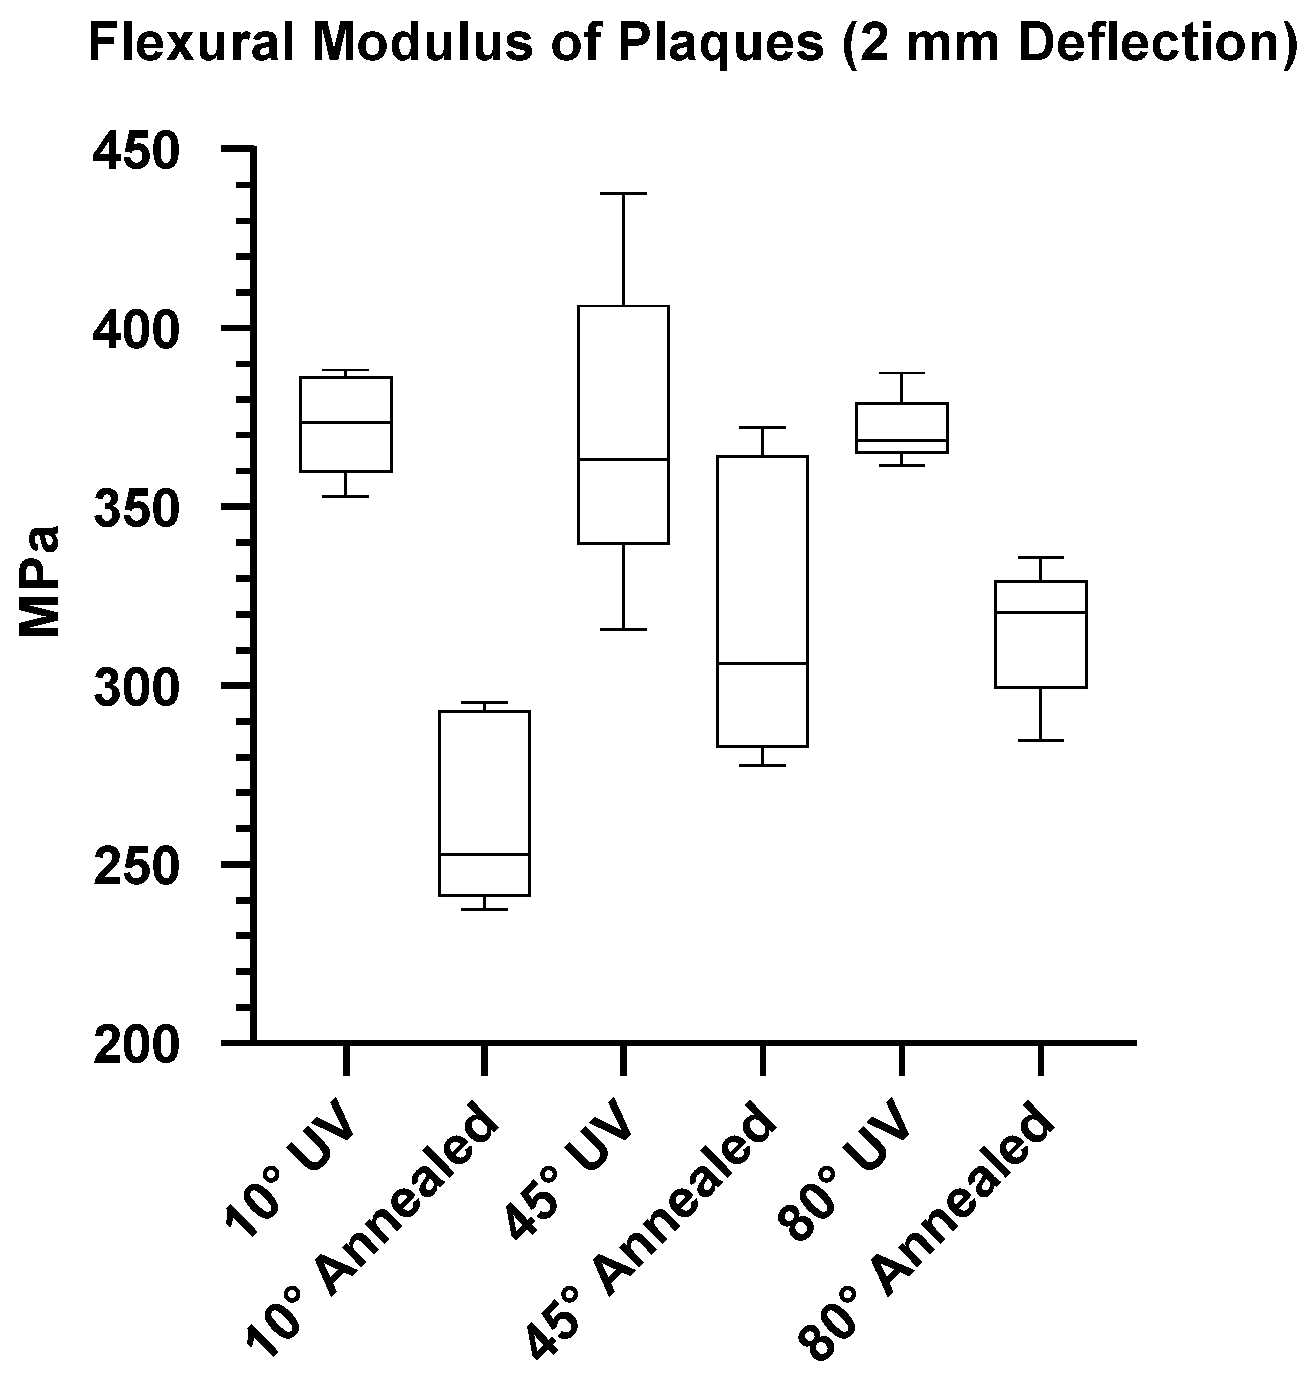
A significant decrease was noted in the flexural modulus of annealed plaques, as illustrated in Figure 7. The results differ from those of the manufacturers data sheets, which showed no difference in flexural modulus after heat treatment [40]. Furthermore, significant differences were observed between orientations following heat treatment; plaques printed at a 10° angle exhibited a 29.2% reduction, whereas those printed at an 80° angle demonstrated a 15.1% overall reduction to an average value of 315.5 MPa. Annealing involves heating the polymer to a specific temperature and allowing it to cool, thereby promoting molecular rearrangement and relaxation of internal stresses caused by the building process. Research aiming to improve mechanical and thermal properties by annealing 3D-printed parts is usually limited to ME processes; this can be attributed to low-cost entry-level FDM printers using thermoplastic materials such as polylactic acid (PLA) that generally respond well to heat treatment secondary processes [18,41,42].
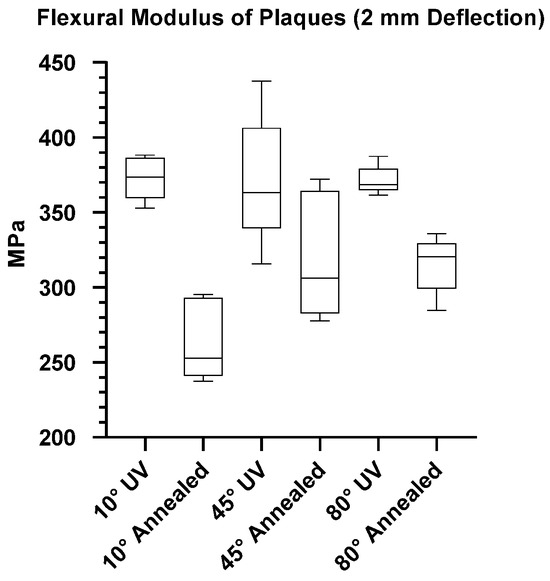
Figure 7.
Flexural modulus results for UV vs. annealed groups of plaques in orientations of 10°, 45°, and 80°.
3.2.3. Shore D Hardness
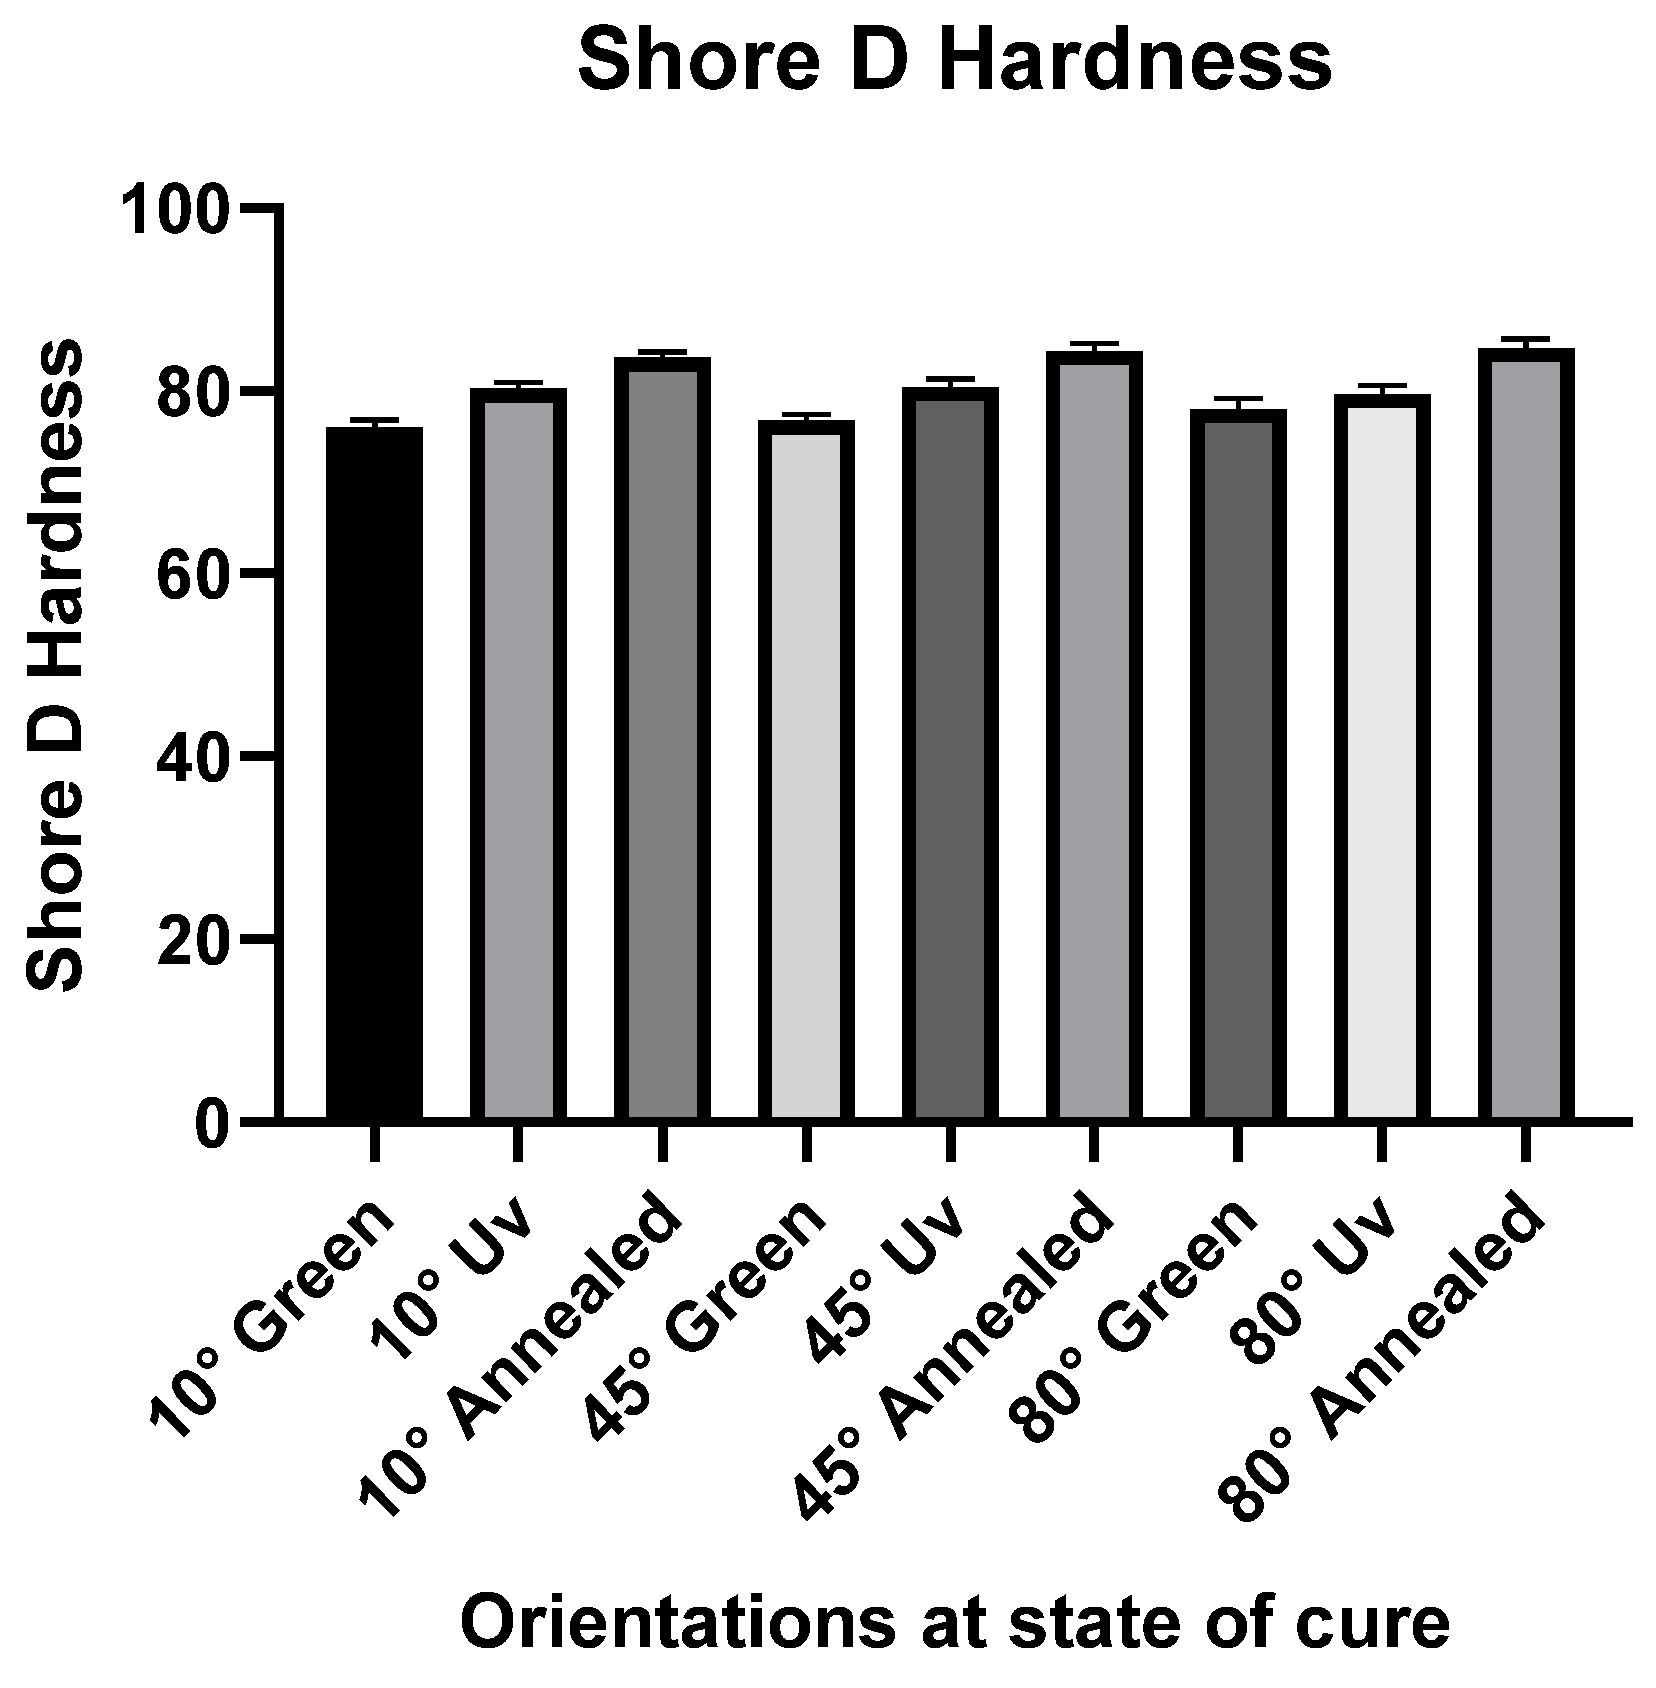
The hardness of a plastic is an important performance index used to evaluate and compare polymer materials. The hardness of the 3D-printed photopolymer resin can affect the durability and performance when utilised for IM applications, enabling it to resist scratches and withstand deformation, breakage, and indentation [43]. In each orientation, annealed specimens proved to be the hardest, followed by cured plaques, as shown in Figure 8 Statistical differences (p < 0.05) were observed across all utilised orientations. UV curing significantly increased the hardness of specimens that received no curing, while annealing further increased the hardness from samples that were only UV-cured. In general, specimens printed in upright orientations such as 45° and 80° showed slightly higher properties than specimens printed at 10°. The results are consistent and in line with the literature [44].
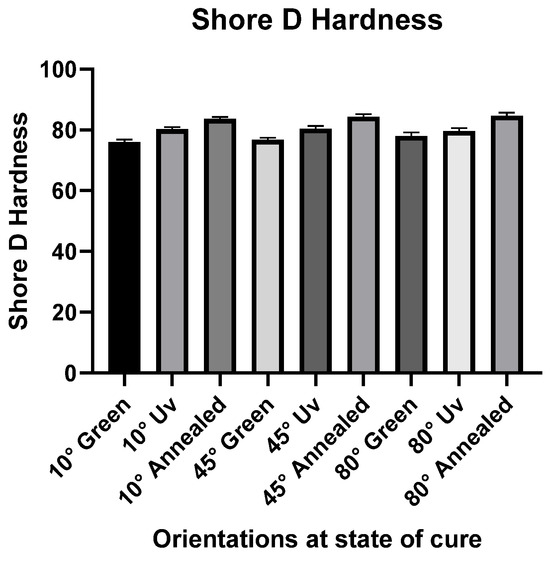
Figure 8.
Overview of shore D hardness results on selected orientation of 10°, 45°, and 80° in green, UV-cured, and UV-cured and annealed state of cure.
3.3. Investigation of Post-Process Cutting Rates at Green, UV, and Annealed States of Cure
The predominant resin-based post-processing methods employed for mitigating surface roughness commonly involve manual abrasive finishing techniques, such as sanding and abrasive blasting [27,45]. Experimental investigations aimed to determine the optimal stage of cure for surface treatment when utilising abrasive post-processing techniques to remove the stair-step effect. Specifically, these experiments assessed the cutting rate on plaques printed at orientations of 10°, 45°, and 80°. Each experiment was carried out for a 60 s duration; measurements were taken before and after surface treatment to evaluate and compare the reductions in surface roughness and weigh.
Optimal Stage of Cure for Abrasive Post-Process Methods
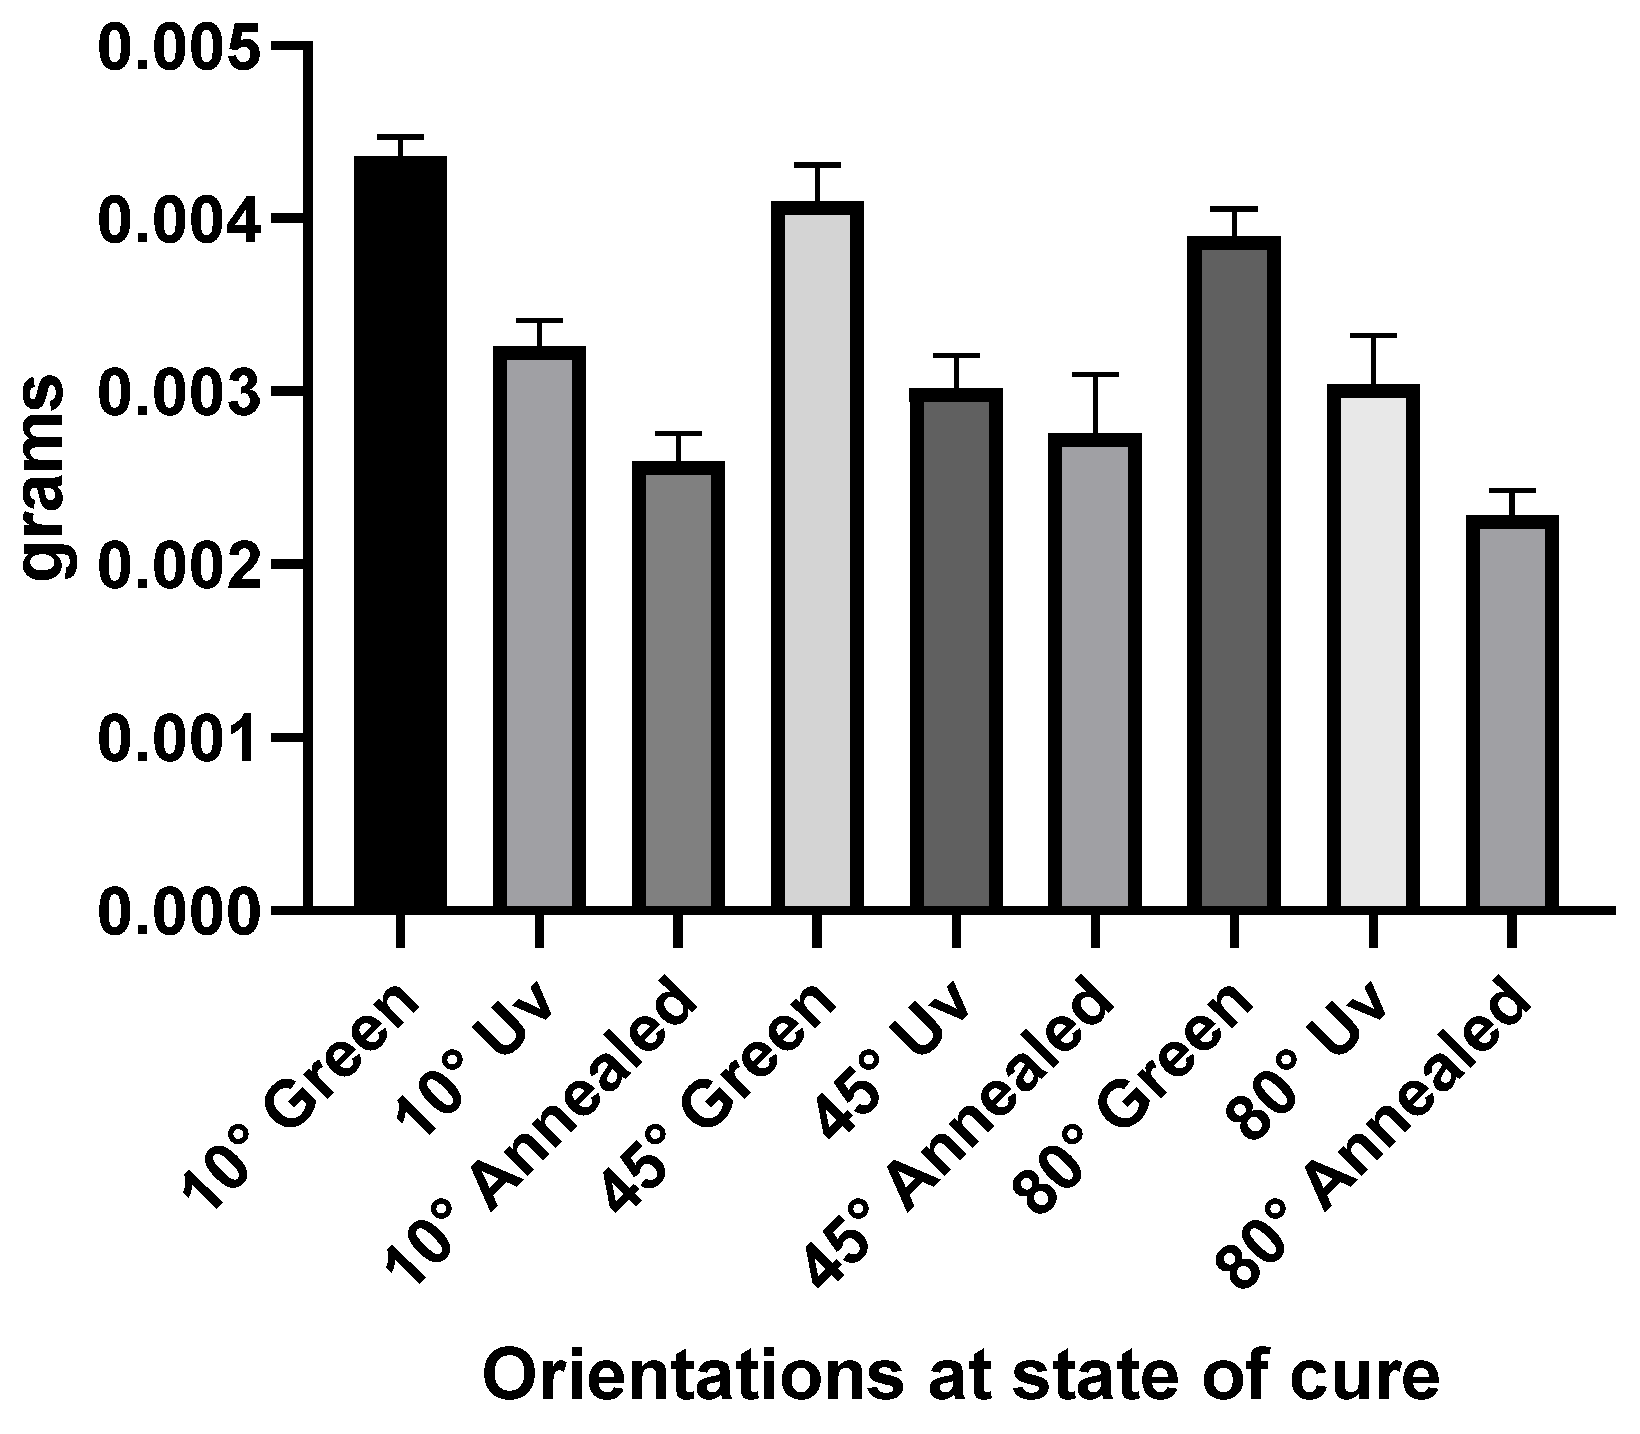
Figure 9 presents the weight loss differences after dry sanding procedures across 10°, 45°, and 80° orientations at each state of cure. Each orientation lost the highest amount of material in a green state and showed the least effective cutting rate after UV curing and annealing. Weight loss after wet sanding procedures resulted in a similar trajectory to dry sanding across all orientations.
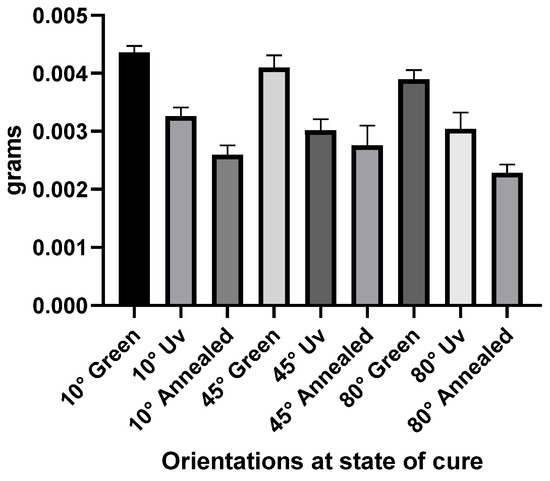
Figure 9.
Overview of dry sanding weight removal results on plaques printed in orientations of 10°, 45°, and 80° at green, UV-cured, and annealed stages of cure.
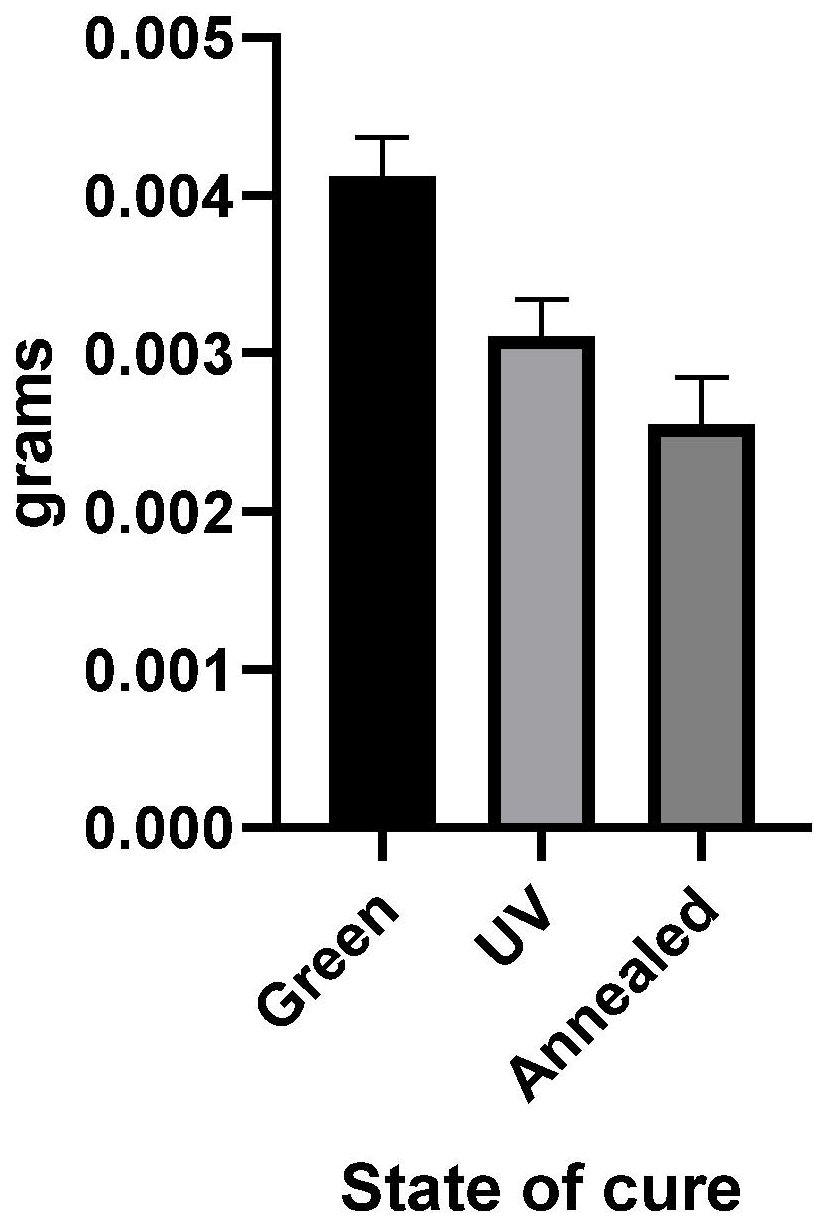
Further evidence, illustrated in Figure 10, indicates that the abrasive post-process procedures are less effective after UV curing and least effective with the combination of UV curing and annealing. Nevertheless, in the absence of UV curing, a thin film of viscous residual resin persisted on the surfaces of the plaques. Notably, glass beads and dust particles were observed to be firmly adhered to these surfaces, rendering them unsuitable for further evaluation. The abrasive blasting process has shown that the stage of cure will significantly affect the cutting rate with a p value < 0.05. Samples treated in a green state lost an average of 24.59% more material compared to plaques UV-cured. Additionally, plaques in a green state lost on average 38.18% more material than UV-cured and annealed plaques. Surface roughness was measured before and after procedures to ascertain and calculate any reduction in roughness. Surface roughness values after treatment did not prove to be significant, likely due to the short duration of the test and the contrast in surface roughness caused by the stair-step effect prior to treatment.
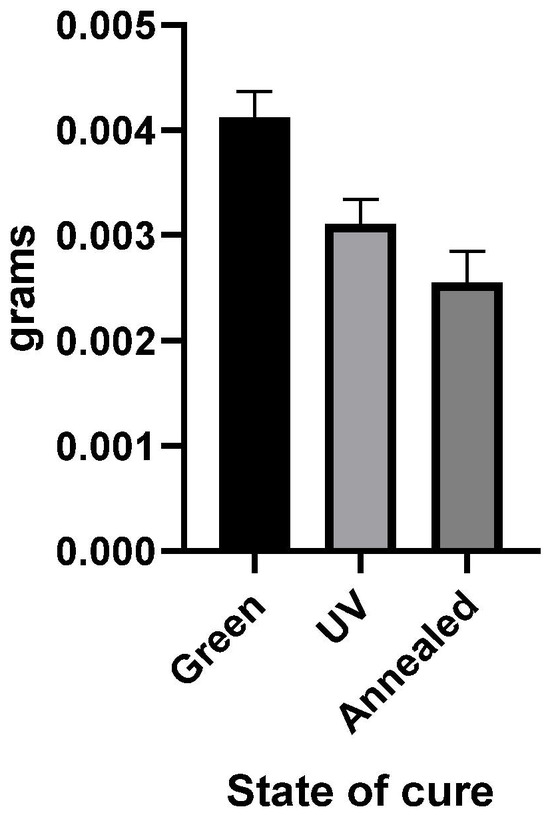
Figure 10.
Weight loss results from abrasive blasting procedures in green, UV, and annealed states of cure.
3.4. Surface Finishing Post-Process Results
The objective of this section was to evaluate and quantify the efficacy of abrasive post-processes methods in mitigating the stair-step effect induced by the fabrication of plaques at orientations of 10°, 45°, and 80°. Five plaques were employed for each orientation in the assessment of each post-processing method. The post-processing techniques were systematically categorised into equal time intervals enumerated as steps. Sanding procedures were executed over a duration of 20 s, while abrasive blasting was sustained for 1 min per step. Throughout each step, meticulous measurements of surface roughness, weight, and dimensional accuracy were conducted and documented to discern any potential correlation between surface roughness and geometric tolerances. Furthermore, microscopic imaging was undertaken to visually depict the extent of stair-step effect removal and its progression towards achieving a benchmark surface roughness (BM1 and BM2), comparable to a standard IM finish outlined in Table 1.
To facilitate comprehensive monitoring and documentation, dry and wet sanding procedures were subdivided into a 15-step sequence. The mean result and standard deviation for each step of dry sanding are listed on Table 2. Categories: A: steps 1–9 summarised coarse sanding results to remove the stair-step effect and attain benchmark BM2 and category; B: steps 10–15 concluded fine sanding results to reach BM1. Abrasive blasting was utilised to remove the stair-step effect and obtain a BM2 finish. The procedure was broken into 10 steps, equally timed at 1 min. Results are listed in Table 3 and compared with coarse sanding results from wet and dry sanding procedures.
Table 2.
Overview of A: coarse dry sanding and B: fine dry sanding on surface roughness, weight, and dimensional accuracy results on plaques printed at 10°, 45°, and 80°.
Table 3.
Overview of abrasive blasting effects on surface roughness, weight, and dimensional accuracy results on plaques printed at 10°, 45°, and 80°.
3.4.1. Observations from Sanding Techniques
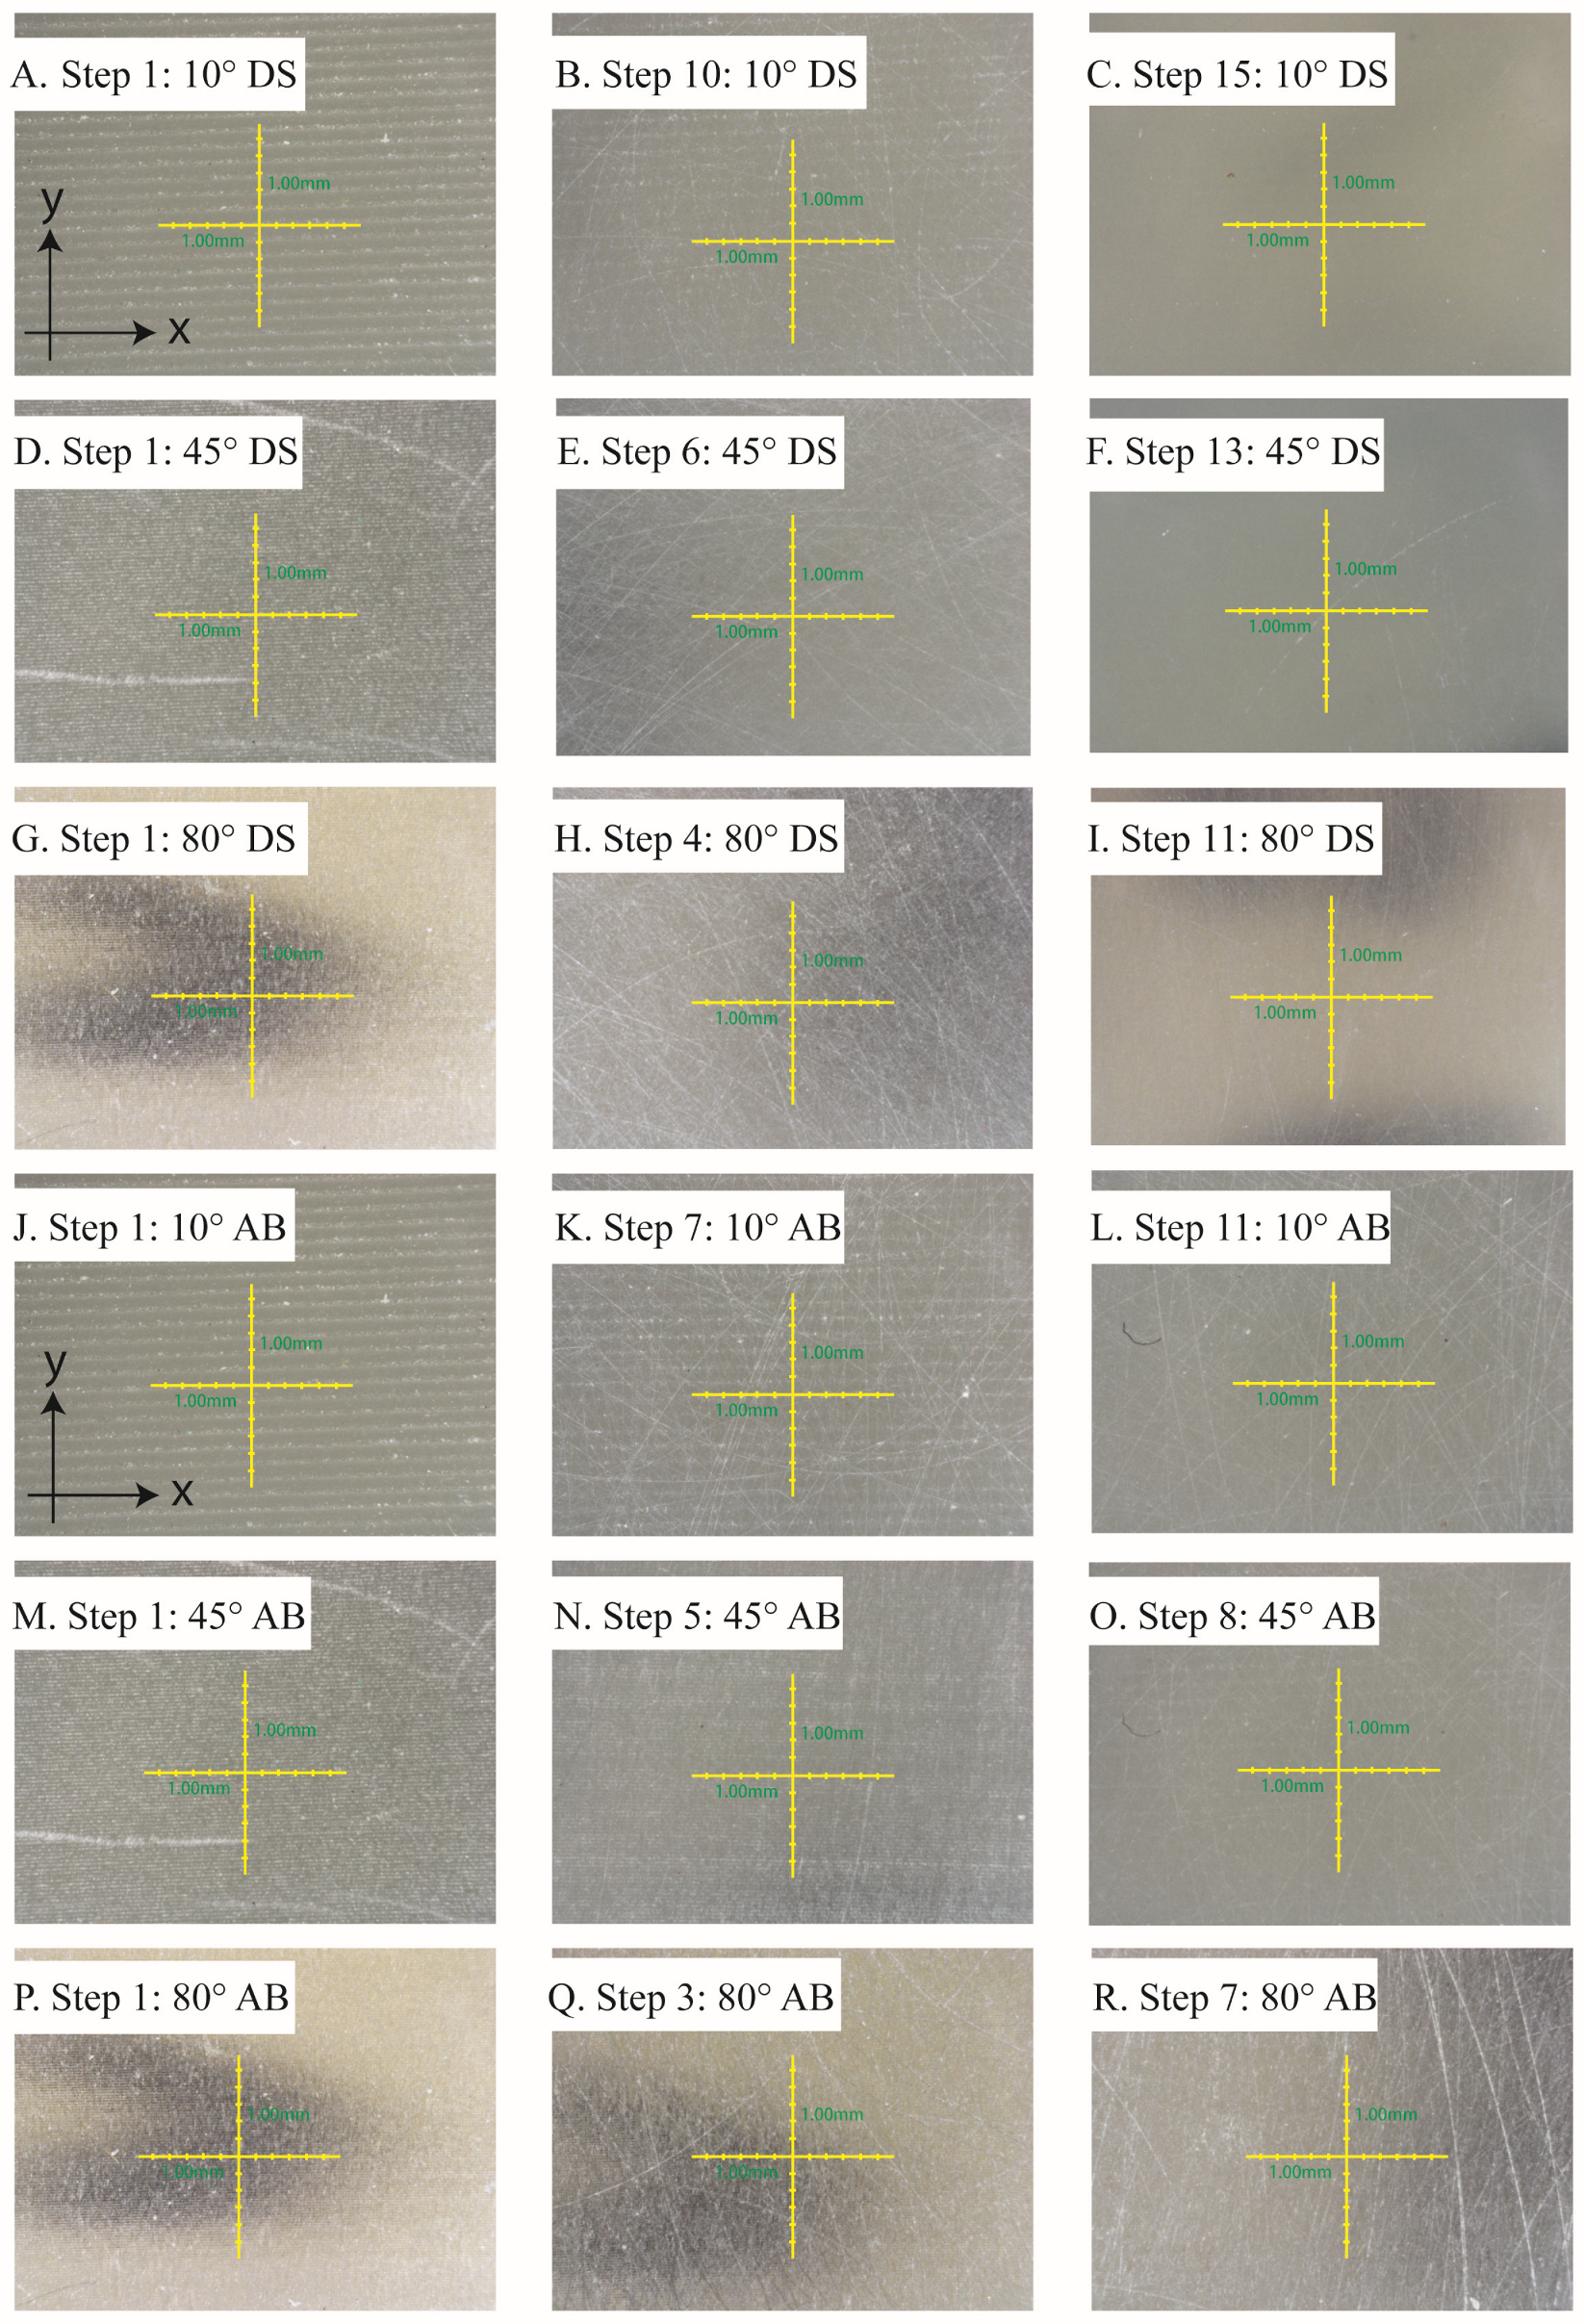
The stair-step structure was visually removed from all orientations, as confirmed by the RA values coinciding on the Y and X axis listed on Table 2. Noticeably, for each orientation utilised, the stair-step effect was removed at different steps during coarse sanding. Plaques fabricated at 10° orientations required all steps of coarse sanding before the stair-step effect began to fade, as evident in image B, Figure 11, whereas the stair-step effect was removed from 45° and 80° at steps 6 and 4, respectively, as illustrate in images E and H. Fine sanding, comprising steps 10 to 15 as detailed in Table 2, resulted in perceptible improvements to plaque surfaces. The plaques became noticeably smoother with each step, as scratches caused by coarse sanding were gradually removed. This improvement was visually evident as depicted in images C, F, and I, listing fine sanding steps 15, 13, and 11, respectively, where the surfaces appeared more translucent.
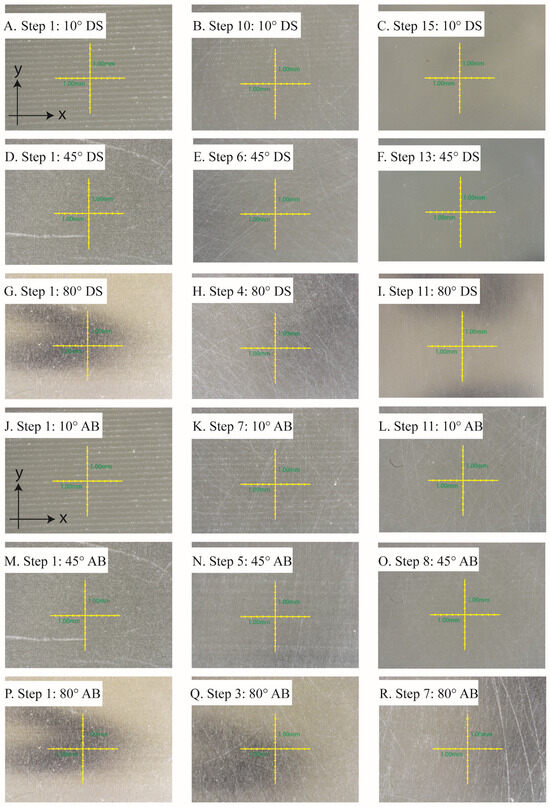
Figure 11.
Microscopic images show removal of the stair-step effect on 10°, 45°, and 80° orientations at steps before, during, and after dry sanding (DS) in image; (A–I), and abrasive blasting (AB) in images (J–R).
3.4.2. Course Sanding Surface Roughness Results
The data collected in the Y direction quantified the peaks and valleys attributed to the profile of the stair-step effect. The results in Table 2 reveal that plaques printed at a 10° orientation exhibited an average surface roughness exceeding 10 µm, which is likely due to the distance between layers required to fabricate a flat surface angled to 10°. On completion of coarse sanding (step 9), Ra values decreased across all orientations to an average of 1.05 μm, resulting in a surface roughness reduction of 93.3% for plaques printed at 10°. Plaques printed at a 45° orientation experienced a 75% reduction, while surfaces printed at 80° exhibited an average reduction of 45%.
3.4.3. Wet versus Dry Fine Sanding Surface Roughness Comparison
The surface roughness outcomes derived from fine dry sanding procedures, specifically steps 10 to 15 listed on Table 2, are compared with wet sanding and illustrated in Figure 12. No significant differences (p < 0.05) in surface roughness were revealed when comparing orientations within an individual step. Furthermore, the surface roughness measurements indicated a marginally higher roughness with wet sanding compared to dry sanding, albeit without a significant disparity in RA values (p < 0.05). This observation underscores the predominant influence of abrasive paper grit size on plaque surface roughness once the stair-step effect has been eliminated. As anticipated, a discernible and statistically significant reduction in surface roughness occurs from one step to the next in order to attain BM1 as listed on Table 1 which can be attributed to the variation in grit size of the abrasive paper.
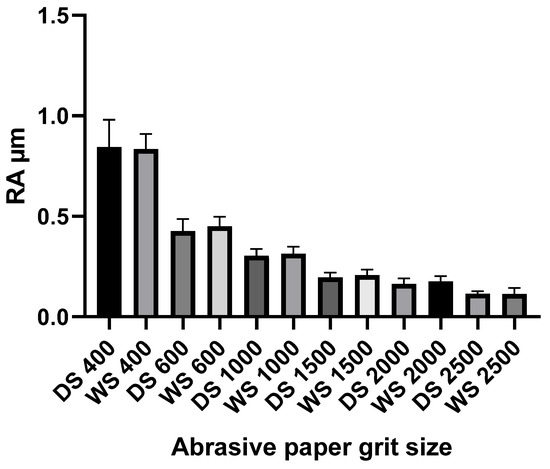
Figure 12.
Fine sanding surface roughness comparison of wet vs. dry procedure on grouped orientations.
3.4.4. Abrasive Blasting Post-Process Observations
In Figure 11, Image J–R demonstrates the eradication of the stair-step effect through abrasive blasting techniques applied to the specified orientations. Similar to coarse sanding, the number of steps or duration required for eliminating the stair-step effect is contingent upon the profile of the step. Notably, for orientations set at 10°, 45°, and 80°, the stair-step becomes visibly faint on steps 7, 5, and 3, respectively, as depicted in Images K, N, and Q in Figure 11. Visual inspection confirms the successful removal of the stair-step effect through post-process abrasive blasting procedures. Furthermore, Image L in Figure 11 showcases the attainment of a surface finish characterized by a matte, non-reflective, and uniformly textured appearance upon the culmination of the process, resembling the finish achieved with bead-blasted aluminium.
3.4.5. Abrasive Blasting Surface Roughness Comparison
Upon the elimination of the stair-step effect, the RA values, encompassing all orientations in both the X and Y directions at step 10 (refer to Table 3), exhibited an average surface roughness of 2.72 µm ± 0.39. A noteworthy reduction of 72%, deemed statistically significant (p < 0.05), is evident in plaques configured at a 10° orientation. Conversely, the treatment is observed to increase the surface roughness on plaques featuring a low-profile stair-step effect, exemplified by the 80° orientation. This outcome aligns with findings reported by Leong et al. [27].
3.5. Plaque Characterisation
To assess the impact of post-processes surface treatments on geometric tolerance, an examination of both dimensional accuracy and plaque weight uniformity was conducted before, during, and after treatment. All orientations surpassed the specified CAD geometry height of 7.50 mm, as depicted in Figure 3. Plaques printed at an 80° orientation exhibited an average height of 7.53 mm, while those printed at 45° and 10° averaged 7.67 mm and 7.93 mm, respectively. In the case of a 10° orientation, the plaque height is governed by the Z axis, maintained at a 50 µm resolution for all printing endeavours. While increasing the resolution to 25 µm will enhance Z axis accuracy, it was deemed unnecessary for this study due to the associated twofold increase in print time. These findings align with existing literature emphasising the significant impact of orientation on the accuracy of parts produced through resin-based printing [36,46,47].
The post-process characterisation findings, as depicted in Table 4, reveal significant distinctions in weight loss (p > 0.05) and dimensional variations resulting from abrasive post-processing techniques. Sanding procedures displayed a significant material removal across all orientations compared to abrasive blasting.
Table 4.
Characterisation results comparing the percentage of weight loss and dimensional difference in mm after abrasive blasting (AB), coarse wet sanding (WS), and dry sanding (DS) procedures on 10°, 45°, and 80° orientations.
While no significant difference in surface roughness was observed between dry and wet sanding procedures, as illustrated in Figure 12, wet sanding exhibited the highest and least predictable material loss. The introduction of water during coarse sanding posed challenges in maintaining traction and consistent pressure, leading to surface damage with prominent scrapes. Increasing pressure and reducing RPM proved effective in mitigating surface damage, although it is worth noting that the greater dimensional disparities and weight loss are likely attributed to the increased pressure.
Conversely, dry sanding emerged as a less aggressive and more controlled process, especially during coarse sanding procedures. Preliminary trials with 60, 80, and 120 grit caused deep cuts that remained evident after polishing. Moreover, if the stair-step effect was not fully removed before fine sanding commenced, its visibility persisted after polishing, although surface roughness values below 0.25 µm were still achievable.
To ensure the comprehensive removal of the stair-step effect without a significant loss of geometry across all orientations, each step in coarse sanding was repeated to establish a sufficient sequence. In contrast, abrasive blasting does not entail the removal of substantial material quantities. Instead, the process introduced a distinct modification that profiled the surface to conceal the stair-step effect. Consequently, the surface topography underwent deformation and restructuring through a peening effect.
4. Conclusions
In this experimental study, the focus was on evaluating post-processing techniques applied to photopolymer resins (specifically, FormLabs HighTemp resin) to fabricate 3D-printed plaques intended for injection moulding (IM) insert tooling applications. The study aimed to assess the effects of post-curing on mechanical and thermal properties, as well as to evaluate abrasive surface treatments for mitigating the stair-step effect and achieving desired IM surface finishes.
Results indicated a direct correlation between the orientation of 3D-printed parts and the severity of the stair-step effect: our observations outlined that a slight tilt of 10° resulted in a pronounced “step” compared to a steep angle of 80° used to produce smooth surfaces with steps that were barely discernible. Thermal analysis revealed that annealing after UV curing significantly increased part hardness and HDT, albeit with some trade-offs observed in mechanical properties, particularly a reduction in flexural modulus and strength.
The cutting rate of abrasive post-processes indicate that the optimal stage of cure to tackle the stair-step effect was after UV curing and prior to annealing. Characterisation of abrasive post-processing techniques highlighted variations in processing duration required to eliminate the stair-step effect that were proportional to the orientation of the print, while abrasive blasting proved effective in profiling the isotropic stair-step effect with a uniform anisotropic surface textures ideal for functional applications.
The combination of abrasive blasting and fine sanding emerged as a promising approach for maintaining dimensional accuracy while attaining desired surface finishes. These findings underscore thermal curing, offer insights into the optimal stage of cure for post-processing techniques, and outline the trade-offs in dimensional accuracy for addressing the stair-step effect and achieving conventional plastic surface finishes.
Future studies on SLA insert tooling for IM should focus on mould and surface finish durability. Further investigating heat treatments duration and temperature parameters will help identify sufficient properties between HDT and flexural strength. The performance of the surface finish attained in this study should be investigated with common IM polymers to determine if degradation on the surface occurs over short product runs and overall mould durability without the stair-step. Additionally, exploring CAD-applied textures may present advantages and present new manufacturing techniques to disrupt the conventional manufacturing process.
Fabricating IM insert moulds from photopolymers offers significant advantages in design flexibility, potentially reducing costs and time associated with conventional manufacturing processes. Moreover, early validation of design aesthetics and functionalities can lead to improved customer satisfaction and accelerated time-to-market.
In conclusion, this study represents a pivotal advancement in additive manufacturing, specifically in the realm of 3D-printed insert tooling for injection moulding applications. By rigorously evaluating post-processing techniques applied to photopolymer resins, we have not only uncovered valuable insights into enhancing mechanical and thermal properties but also addressed a pressing need for standardized methodologies in the industry. Our findings hold significant implications for injection moulding industries, where achieving high-quality moulds with precise surface finishes is paramount. Furthermore, our research points towards a broader shift in manufacturing paradigms, with implications for increased efficiency, improved product quality, and enhanced design flexibility. Looking ahead, future research endeavours should focus on exploring the durability of surface finishes, optimizing heat treatment parameters, and harnessing innovative CAD-applied textures to push the boundaries of mould design. By embracing these challenges, we can unlock the full potential of additive manufacturing, driving innovation and reshaping the landscape of modern manufacturing practices.
Author Contributions
Conceptualization, G.K. and D.M.D.; methodology, G.K.; software, G.K.; validation, G.K., D.M.D. and A.V.H.; formal analysis, G.K. and A.V.H.; investigation, G.K.; writing—original draft preparation, G.K.; writing—review and editing, G.K., D.M.D. and A.V.H.; supervision, D.M.D. and A.V.H.; funding acquisition, D.M.D. All authors have read and agreed to the published version of the manuscript.
Funding
Emanated from research carried out under the support the Technological University of the Shannon.
Data Availability Statement
All data necessary to reproduce the results and support the conclusions are included within this paper.
Conflicts of Interest
The authors declare no conflict of interest.
References
- Terry, J.K.; Wohlers, T.; Campbell, I.; Diegel, O.; Huff, R. Wohlers Report 2022: 3D Printing and Additive Manufacturing Global State of the Industry; Wohlers Associates: Fort Collins, CO, USA, 2022. [Google Scholar]
- Zguris, Z. How Mechanical Properties of Stereolithography 3D Prints are Affected by UV Curing. Formlabs White Pap. 2016, 1–11. [Google Scholar]
- Cosmi, F.; Maso, A.D. A mechanical characterization of SLA 3D-printed specimens for low-budget applications. Mater. Today Proc. 2019, 32, 194–201. [Google Scholar] [CrossRef]
- Formlabs Inc. A Guide to Post-Curing Formlabs Resins; Formlabs Inc.: Somerville, MA, USA, 2018. [Google Scholar]
- Formlabs Inc. Low-Volume Rapid Injection Molding with 3D Printed Molds; Formlabs Inc.: Somerville, MA, USA, 2020; p. 23. [Google Scholar]
- Gim, J.; Turng, L.-S. A review of current advancements in high surface quality injection molding: Measurement, influencing factors, prediction, and control. Polym. Test. 2022, 115, 107718. [Google Scholar] [CrossRef]
- Singh, G.; Verma, A. A Brief Review on injection moulding manufacturing process. Mater. Today Proc. 2017, 4, 1423–1433. [Google Scholar] [CrossRef]
- Fuh, J.Y.H.; Fu, M.W.; Nee, A.Y.C.; Fu, M.W. Computer-Aided Injection Mold Design and Manufacture; CRC Press: Boca Raton, FL, USA, 2004. [Google Scholar]
- Dizon, J.R.C.; Valino, A.D.; Souza, L.R.; Espera, A.H.; Chen, Q.; Advincula, R.C. Three-dimensional-printed molds and materials for injection molding and rapid tooling applications. MRS Commun. 2019, 9, 1267–1283. [Google Scholar] [CrossRef]
- Bartlett, L.; Grunden, E.; Mulyana, R.; Castro, J. A preliminary study on the performance of additive manufacturing tooling for injection molding. In Proceedings of the SPE ANTEC, Anaheim, CA, USA, 8–10 May 2017. [Google Scholar]
- Attaran, M. The rise of 3-D printing: The advantages of additive manufacturing over traditional manufacturing. Bus. Horiz. 2017, 60, 677–688. [Google Scholar] [CrossRef]
- Rahmati, S.; Dickens, P. Rapid tooling analysis of Stereolithography injection mould tooling. Int. J. Mach. Tools Manuf. 2007, 47, 740–747. [Google Scholar] [CrossRef]
- Jnr, M.H.; Gunbay, S.; Hayes, C.; Moritz, V.F.; Fuenmayor, E.; Lyons, J.G.; Devine, D.M. Stereolithography (SLA) utilised to print injection mould tooling in order to evaluate thermal and mechanical properties of commercial polypropylene. Procedia Manuf. 2021, 55, 205–212. [Google Scholar]
- Moritz, V.F.; Bezerra, G.S.; Hopkins Jnr, M.; Fuenmayor, E.; Günbay, S.; Hayes, C.; Lyons, J.G.; Devine, D.M. Heat Dissipation Plays Critical Role for Longevity of Polymer-Based 3D-Printed Inserts for Plastics Injection Moulding. J. Manuf. Mater. Process. 2022, 6, 117. [Google Scholar] [CrossRef]
- Spencer, J.D.; Cobb, R.C.; Dickens, P.M. Vibratory Finishing of Stereolithography Parts. In Proceedings of the 1993 International Solid Freeform Fabrication Symposium, Austin, TX, USA, 9–11 August 1993; pp. 27–39. [Google Scholar]
- Udroiu, R.; Braga, I.C.; Nedelcu, A. Evaluating the quality surface performance of additive manufacturing systems: Methodology and a material jetting case study. Materials 2019, 12, 995. [Google Scholar] [CrossRef]
- Keane, G.; Healy, A.; Devine, D. Post-Processing Methods for 3D Printed Biopolymers; Elsevier Inc.: Amsterdam, The Netherlands, 2023. [Google Scholar]
- Bhandari, S.; Lopez-Anido, R.A.; Gardner, D.J. Enhancing the interlayer tensile strength of 3D printed short carbon fiber reinforced PETG and PLA composites via annealing. Addit. Manuf. 2019, 30, 100922. [Google Scholar] [CrossRef]
- Ngo, T.D.; Kashani, A.; Imbalzano, G.; Nguyen, K.T.Q.; Hui, D. Additive manufacturing (3D printing): A review of materials, methods, applications and challenges. Compos. Part B Eng. 2018, 143, 172–196. [Google Scholar] [CrossRef]
- Tamburrino, F.; Barone, S.; Paoli, A.; Razionale, A.V. Post-processing treatments to enhance additively manufactured polymeric parts: A review. Virtual Phys. Prototyp. 2021, 16, 218–251. [Google Scholar] [CrossRef]
- Hardiman, K. Post-processing Considerations for Biomedical 3D Printing of Polymers. In Polymer-Based Additive Manufacturing; Springer: Berlin/Heidelberg, Germany, 2019. [Google Scholar]
- Lim, J.X.-Y.; Pham, Q.-C. Automated post-processing of 3D-printed parts: Artificial powdering for deep classification and localization. Virtual Phys. Prototyp. 2021, 16, 333–346. [Google Scholar] [CrossRef]
- Automated Post-Processing in 3D Printing—The Final Piece of the Puzzle—3D Insider. Available online: https://3dinsider.com/automated-post-processing-3d-printing/ (accessed on 13 May 2022).
- Schmid, M.; Simon, C.; Levy, G.N. Finishing of SLS-parts for rapid manufacturing (RM)—A comprehensive approach. In Proceedings of the 20th Annual International Solid Freeform Fabrication Symposium, SFF 2009, Austin, TX, USA, 3–5 August 2009; pp. 1–10. [Google Scholar]
- Jiang, J.; Xu, X.; Stringer, J. Support structures for additive manufacturing: A review. J. Manuf. Mater. Process. 2018, 2, 64. [Google Scholar] [CrossRef]
- Alharbi, N. Factors Influencing the Dimensional Accuracy of 3D-Printed Full-Coverage Dental Restorations Using Stereolithography Technology. Int. J. Prosthodont. 2016, 29, 503–510. [Google Scholar] [CrossRef] [PubMed]
- Leong, K.F.; Chua, C.K.; Chua, G.S.; Tan, C.H. Abrasive jet deburring of jewellery models built by stereolithography apparatus (SLA). J. Mater. Process. Technol. 1998, 83, 36–47. [Google Scholar] [CrossRef]
- Hu, G.; Cao, Z.; Hopkins, M.; Hayes, C.; Daly, M.; Zhou, H.; Devine, D.M. Optimizing the hardness of SLA printed objects by using the neural network and genetic algorithm. Procedia Manuf. 2019, 38, 117–124. [Google Scholar] [CrossRef]
- 3D Printing Materials: Engineering Resins|Formlabs. Available online: https://formlabs.com/eu/store/high-temp-resin/ (accessed on 1 May 2020).
- Injection Mold Surface Finish Standard, Injection Molding Surface Roughness. Available online: https://upmold.com/resource/injection-mold-surface-finish/ (accessed on 26 February 2024).
- Mennig, G.; Stoeckhert, K.; Mennig, G.; Stoeckhert, K. Mold-Making Handbook; Carl Hanser Verlag: Munich, Germany, 2013. [Google Scholar]
- ISO 21920-2: 2021 Geometrical Product Specifications (GPS)—Surface Texture: Profile—Part 2: Terms, Definitions and Surface Texture Parameters. 2021. Available online: https://www.iso.org/standard/72226.html (accessed on 11 April 2024).
- SPI Surface Finish Standards. Available online: https://upmold.com/spi-surface-finish-standards/ (accessed on 11 April 2024).
- VDI/VDE 2602-04:2014 Surface Measurement—Surface Measurement Using Contact (Stylus) Instruments—Calibration, Uncertainty of Measurement. Available online: https://www.vdi.de/en/home/vdi-standards/details/vdivde-2602-blatt-2-roughness-measurement-roughness-measurement-using-contact-stylus-instruments-profile-method-set-up-measurement-conditions-procedure (accessed on 11 April 2024).
- Model Orientation Best Practices for SLA Printing. Available online: https://support.formlabs.com/s/article/Model-Orientation?language=en_US (accessed on 5 August 2022).
- America Makes & ANSI Additive Manufacturing Standardization Collaborative (AMSC). Standardization Roadmap for Additive Manufacturing; AMSC: Devens, MA, USA, 2017. [Google Scholar]
- Štaffová, M.; Ondreáš, F.; Svatík, J.; Zbončák, M.; Jančář, J.; Lepcio, P. 3D printing and post-curing optimization of photopolymerized structures: Basic concepts and effective tools for improved thermomechanical properties. Polym. Test. 2022, 108, 107499. [Google Scholar] [CrossRef]
- Post Processing for SLA Printed Parts|Hubs. Available online: https://www.hubs.com/knowledge-base/post-processing-sla-printed-parts/ (accessed on 26 July 2022).
- Guide to Post-Processing and Finishing SLA 3D Prints. Available online: https://formlabs.com/eu/blog/post-processing-and-finishing-sla-prints/ (accessed on 26 July 2022).
- Akiyama, T.; Yagi, J. High Temp. Mater. Proc. 2016. Available online: https://formlabs.com/store/materials/high-temp-resin/ (accessed on 11 April 2024).
- Benwood, C.; Anstey, A.; Andrzejewski, J.; Misra, M.; Mohanty, A.K. Improving the Impact Strength and Heat Resistance of 3D Printed Models: Structure, Property, and Processing Correlationships during Fused Deposition Modeling (FDM) of Poly(Lactic Acid). ACS Omega 2018, 3, 4400–4411. [Google Scholar] [CrossRef]
- Basgul, C.; Yu, T.; MacDonald, D.W.; Siskey, R.; Marcolongo, M.; Kurtz, S.M. Does annealing improve the interlayer adhesion and structural integrity of FFF 3D printed PEEK lumbar spinal cages? J. Mech. Behav. Biomed. Mater. 2020, 102, 103455. [Google Scholar] [CrossRef] [PubMed]
- What Is Hardness in Plastics? An In-Depth Guide—PlasticRanger. Available online: https://plasticranger.com/what-is-hardness-in-plastics/ (accessed on 21 July 2022).
- Hu, G.; Cao, Z.; Hopkins, M.; Lyons, J.G.; Brennan-Fournet, M.; Devine, D.M. Nanofillers can be used to enhance the thermal conductivity of commercially available SLA resins. Procedia Manuf. 2019, 38, 1236–1243. [Google Scholar] [CrossRef]
- Van der Steen, D. Post Processing for SLA Printed Parts|3D Hubs. Available online: https://www.3dhubs.com/knowledge-base/post-processing-sla-printed-parts (accessed on 13 June 2019).
- Luo, Z.; Yang, F.; Dong, G.; Tang, Y.; Zhao, Y.F. Orientation Optimization in Layer-Based Additive Manufacturing Process. In Proceedings of the 36th Computers and Information in Engineering Conference, Charlotte, NC, USA, 21–24 August 2016; ASME: New York, NY, USA, 2016; Volume 1A. [Google Scholar]
- Pham, D.T.; Dimov, S.S.; Gault, R.S. Part Orientation in Stereolithography. Int. J. Adv. Manuf. Technol. 1999, 15, 674–682. [Google Scholar] [CrossRef]


Disclaimer/Publisher’s Note: The statements, opinions and data contained in all publications are solely those of the individual author(s) and contributor(s) and not of MDPI and/or the editor(s). MDPI and/or the editor(s) disclaim responsibility for any injury to people or property resulting from any ideas, methods, instructions or products referred to in the content. |
© 2024 by the authors. Licensee MDPI, Basel, Switzerland. This article is an open access article distributed under the terms and conditions of the Creative Commons Attribution (CC BY) license (https://creativecommons.org/licenses/by/4.0/).