Abstract
New and innovative technologies have expanded the quality and applications of aluminum welding in the maritime, aerospace, and automotive industries. One such technology is the addition of nanoparticles to aluminum matrices, resulting in improved strength, operating temperature, and stiffness. Furthermore, researchers continue to assess pertinent factors that improve the microstructure and mechanical characteristics of aluminum welding by enabling the optimization of the manufacturing process. Hence, this research explores alternatives, namely cost-effective aluminum welding fillers reinforced with niobium diboride nanoparticles. The goal has been to improve weld quality by employing multi-objective optimization, attained through a central composite design with a response surface model. The model considered three factors: the amount (weight percent) of nanoparticles, melt stirring speed, and melt stirring time. Filler hardness and porosity percentage served as response variables. The optimal parameters for manufacturing this novel filler for the processing conditions studied are 2% nanoparticles present in a melt stirred at 750 rpm for 35.2 s. The resulting filler possessed a 687.4 MPA Brinell hardness and low porosity, i.e., 3.9%. Overall, the results prove that the proposed experimental design successfully identified the optimal processing factors for manufacturing novel nanoparticle-reinforced fillers with improved mechanical properties for potential innovative applications across diverse industries.
1. Introduction
The global aluminum welding wire market yielded USD 573.09 million in 2024 and is predicted to reach USD 758.44 million by 2030 [1]. Furthermore, investment in research and development will increase due to the adoption of innovative technologies that expand the quality and uses of aluminum welding in the maritime, aerospace, and automotive industries [1]. Several techniques are available for aluminum welding. Tungsten inert gas (TIG) welding is a popular choice for high-quality welds [2,3,4,5]. TIG welding advantages, such as small deformations due to heat concentration, uniformity, and purity (due to the inert gas cover), ensure the melting effectiveness of the joining materials [2,5]. Various test methods are employed to evaluate weld quality and characteristics based on the compatibility of the joined materials. Metallographic analyses are standard techniques for assessing weld quality and determining the resulting porosity and weld uniformity [2,3,4,5,6,7]. In addition, destructive test methods are standard quality tests that confirm weld effectiveness [8]. Experimental design and statistical modeling are implemented to assess welding process quality better [9].
Furthermore, incorporating nanoparticles has raised a given metal’s mechanical strength [10,11,12]. For instance, the addition of niobium diboride (NbB2) nanoparticles strengthens a pure aluminum matrix used in wire fabrication [6,13,14,15,16], showing improvements in strength, oxidation resistance, operating temperature, stiffness, wear resistance, and increasing the electrical conductivity [2,6,15,17]. A high strength-to-weight ratio makes these nanocomposite materials apt for structural applications [9,17,18]. Other materials that increase weld strength are titanium diborides, carbon nanotubes, and graphene nanosheets [2,17,19]. Additional studies are required to understand the critical tenets of fillers for Al TIG welding based on statistical underpinnings.
In the present study, we explore a cost-effective alternative of aluminum welding fillers reinforced with nanoparticles to improve quality welding through multi-objective optimization for increased safety and efficiency in repairing lightweight structures. A central composite design (CCD) permitted the study of the factors in manufacturing the proposed nanoparticle-reinforced fillers. The main factors studied are nanoparticle amount (weight percent), stirring speed, and stirring time. Each factor was evaluated at two levels, six axials, and four center points. The response variables for the experiment were the filler hardness and the porosity percentage.
2. Materials and Methods
Applying a statistical design of experiments (DOE) represents a viable alternative to optimize the processes under study [20]. Aside from being an expeditious and inexpensive methodology, a DOE also allows for building a predictive system model. For those reasons, DOE was selected as the centerpiece of this study.
2.1. Optimization Process
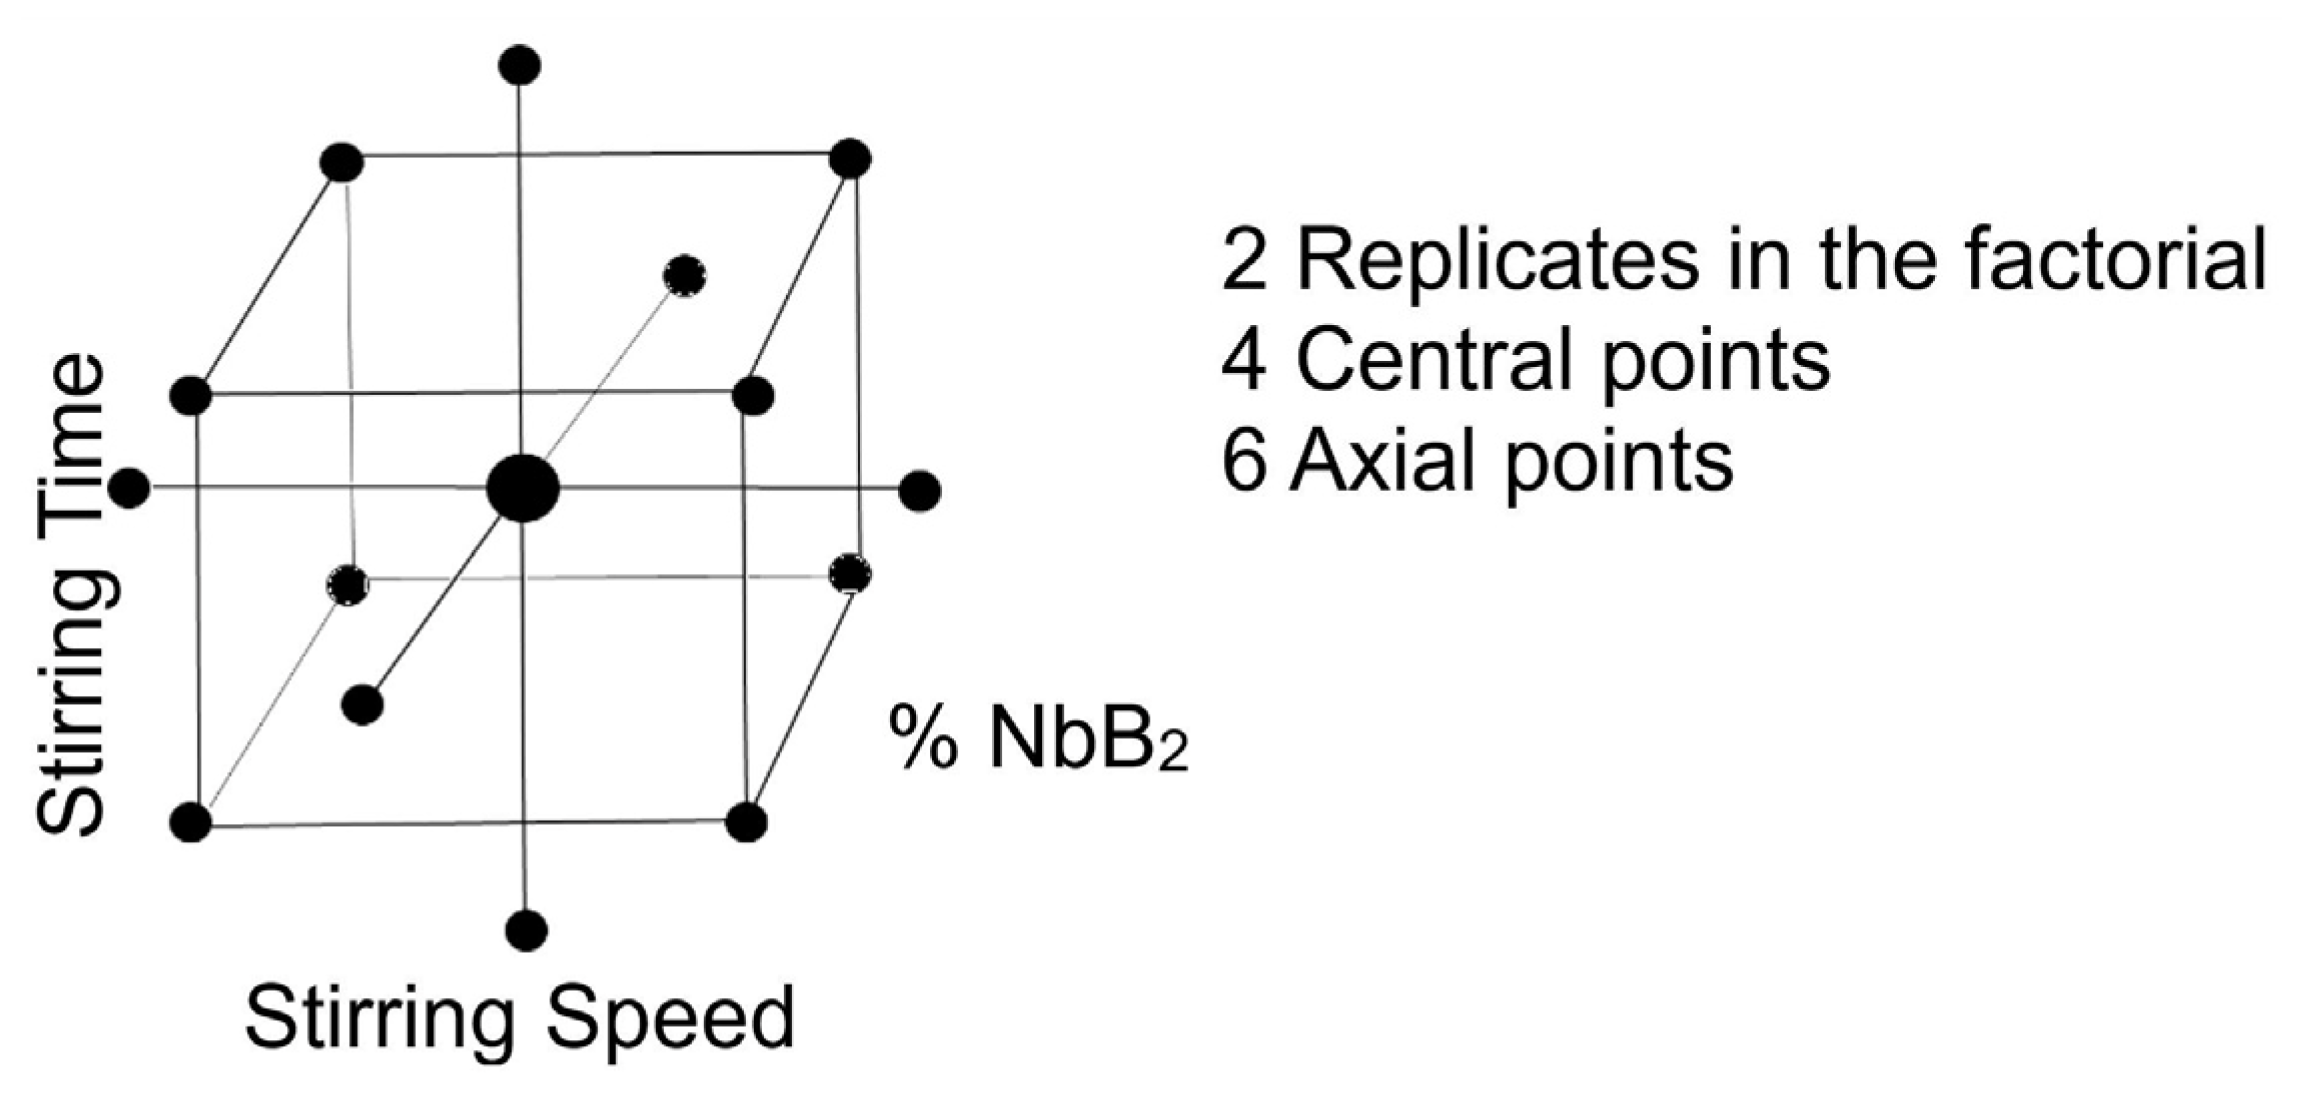
A central composite design (CCD) can help develop an empirical model of the stir-casting process by estimating a second-degree polynomial model, enabling manufacturing process optimization [20]. In our case, the CCD is a 32 factorial, with two replicates in the factorial, six axials, and four center points. Figure 1 shows the central composite design applied to this methodology. Implementing the axial executions would allow the addition of quadratic terms into the model to help build second-order response surface models. The factors associated with the distribution of the reinforcement were evaluated at two levels: a weight percent of nanoparticles at 0.5 and 1.5 wt.%, a melt stirring speed at 300 and 600 rpm, and a melt stirring time at 20–40 s, as preliminary research permitted to establish as operating procedures available in our laboratory setting.
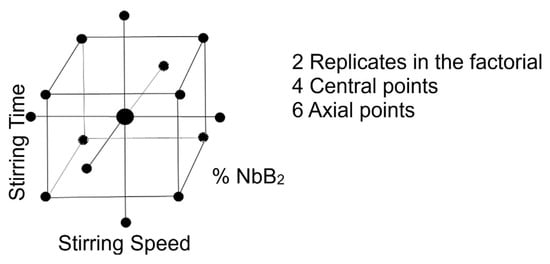
Figure 1.
Central composite design for the stir casting components.
2.2. Filler Manufacturing
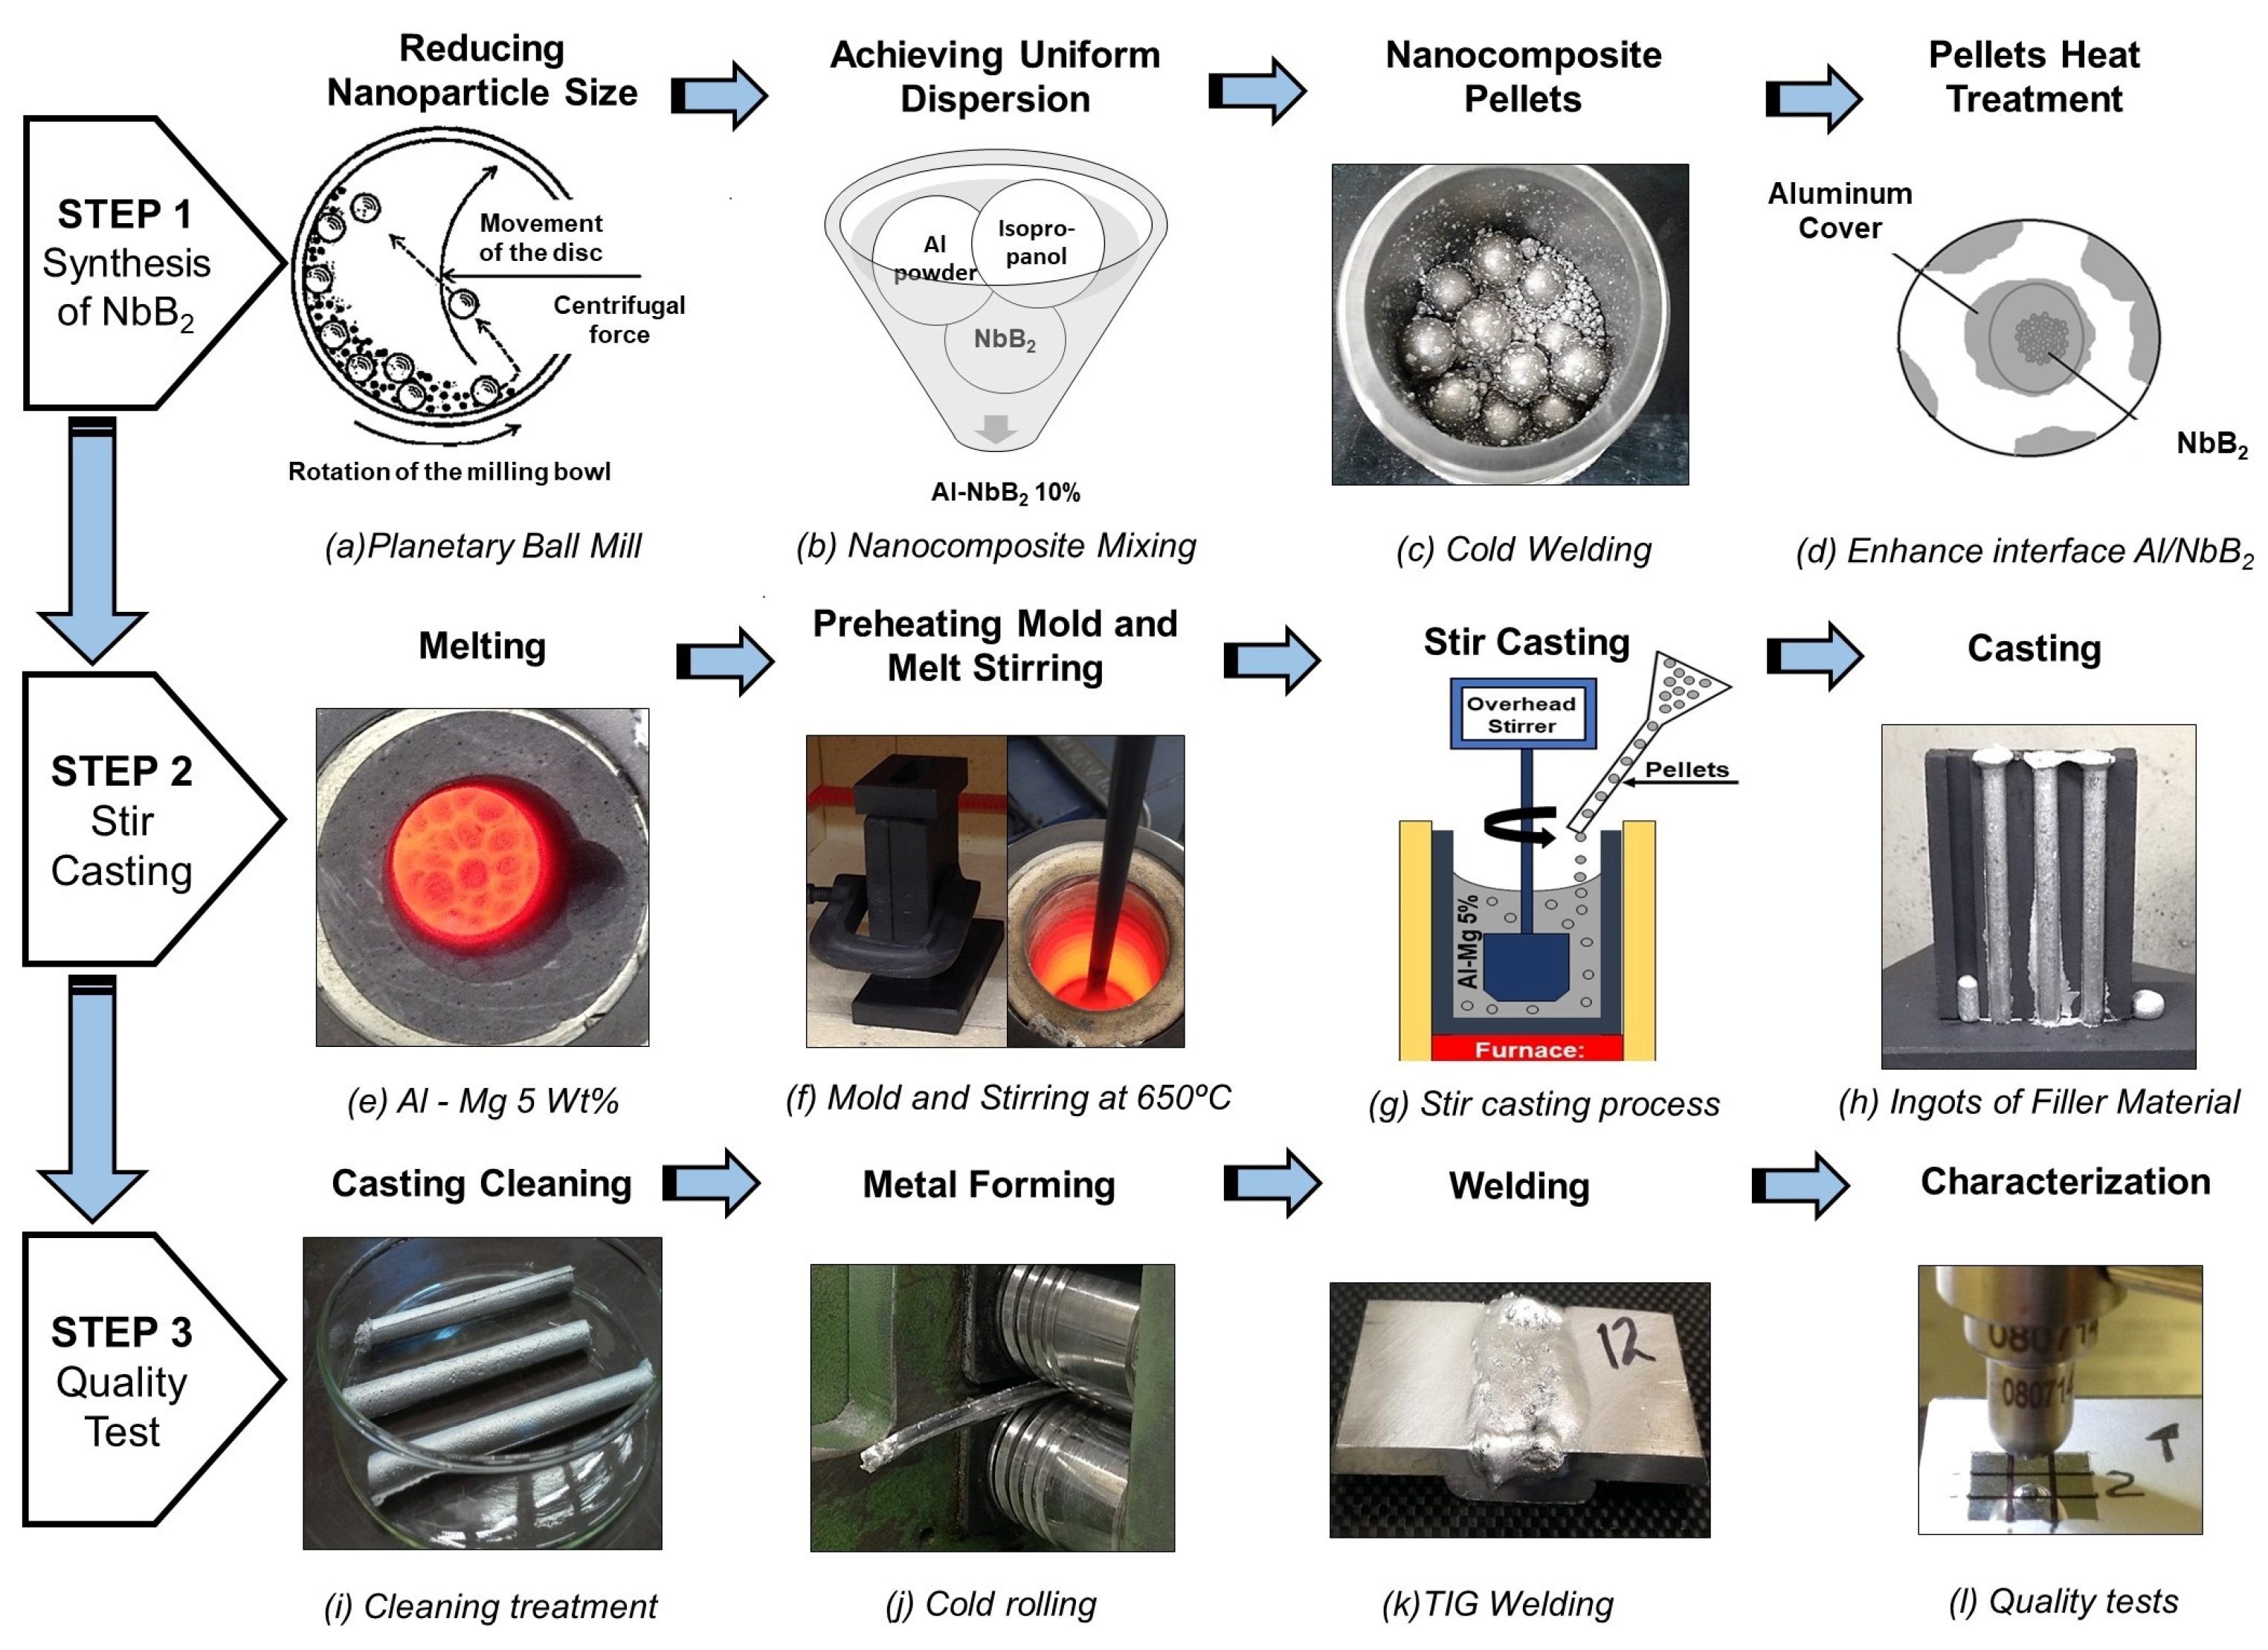
Before manufacturing the proposed experimental filler, NbB2 particles must be prepared and embedded into an aluminum matrix through cold welding [6,10,13,14,15,16]. Stir casting then further improves the bonding of the reinforcing particles due to melt agitation [21]. Then, weld quality is assessed through hardness and porosity tests [2,3,5]. Figure 2 shows the filler manufacturing steps, i.e., NbB2 particle manufacturing, stir casting, and quality testing.
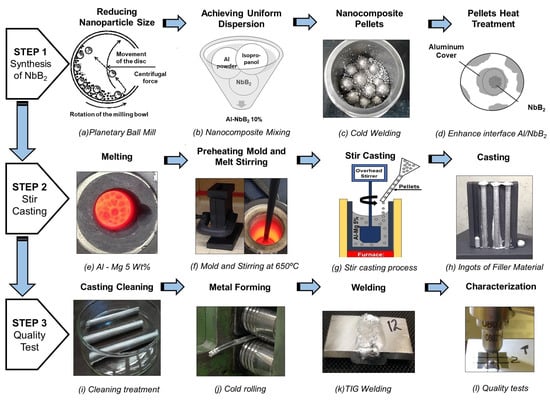
Figure 2.
Manufacturing process employed in the present research.
2.2.1. Step 1—Synthesis of NbB2 Pellets
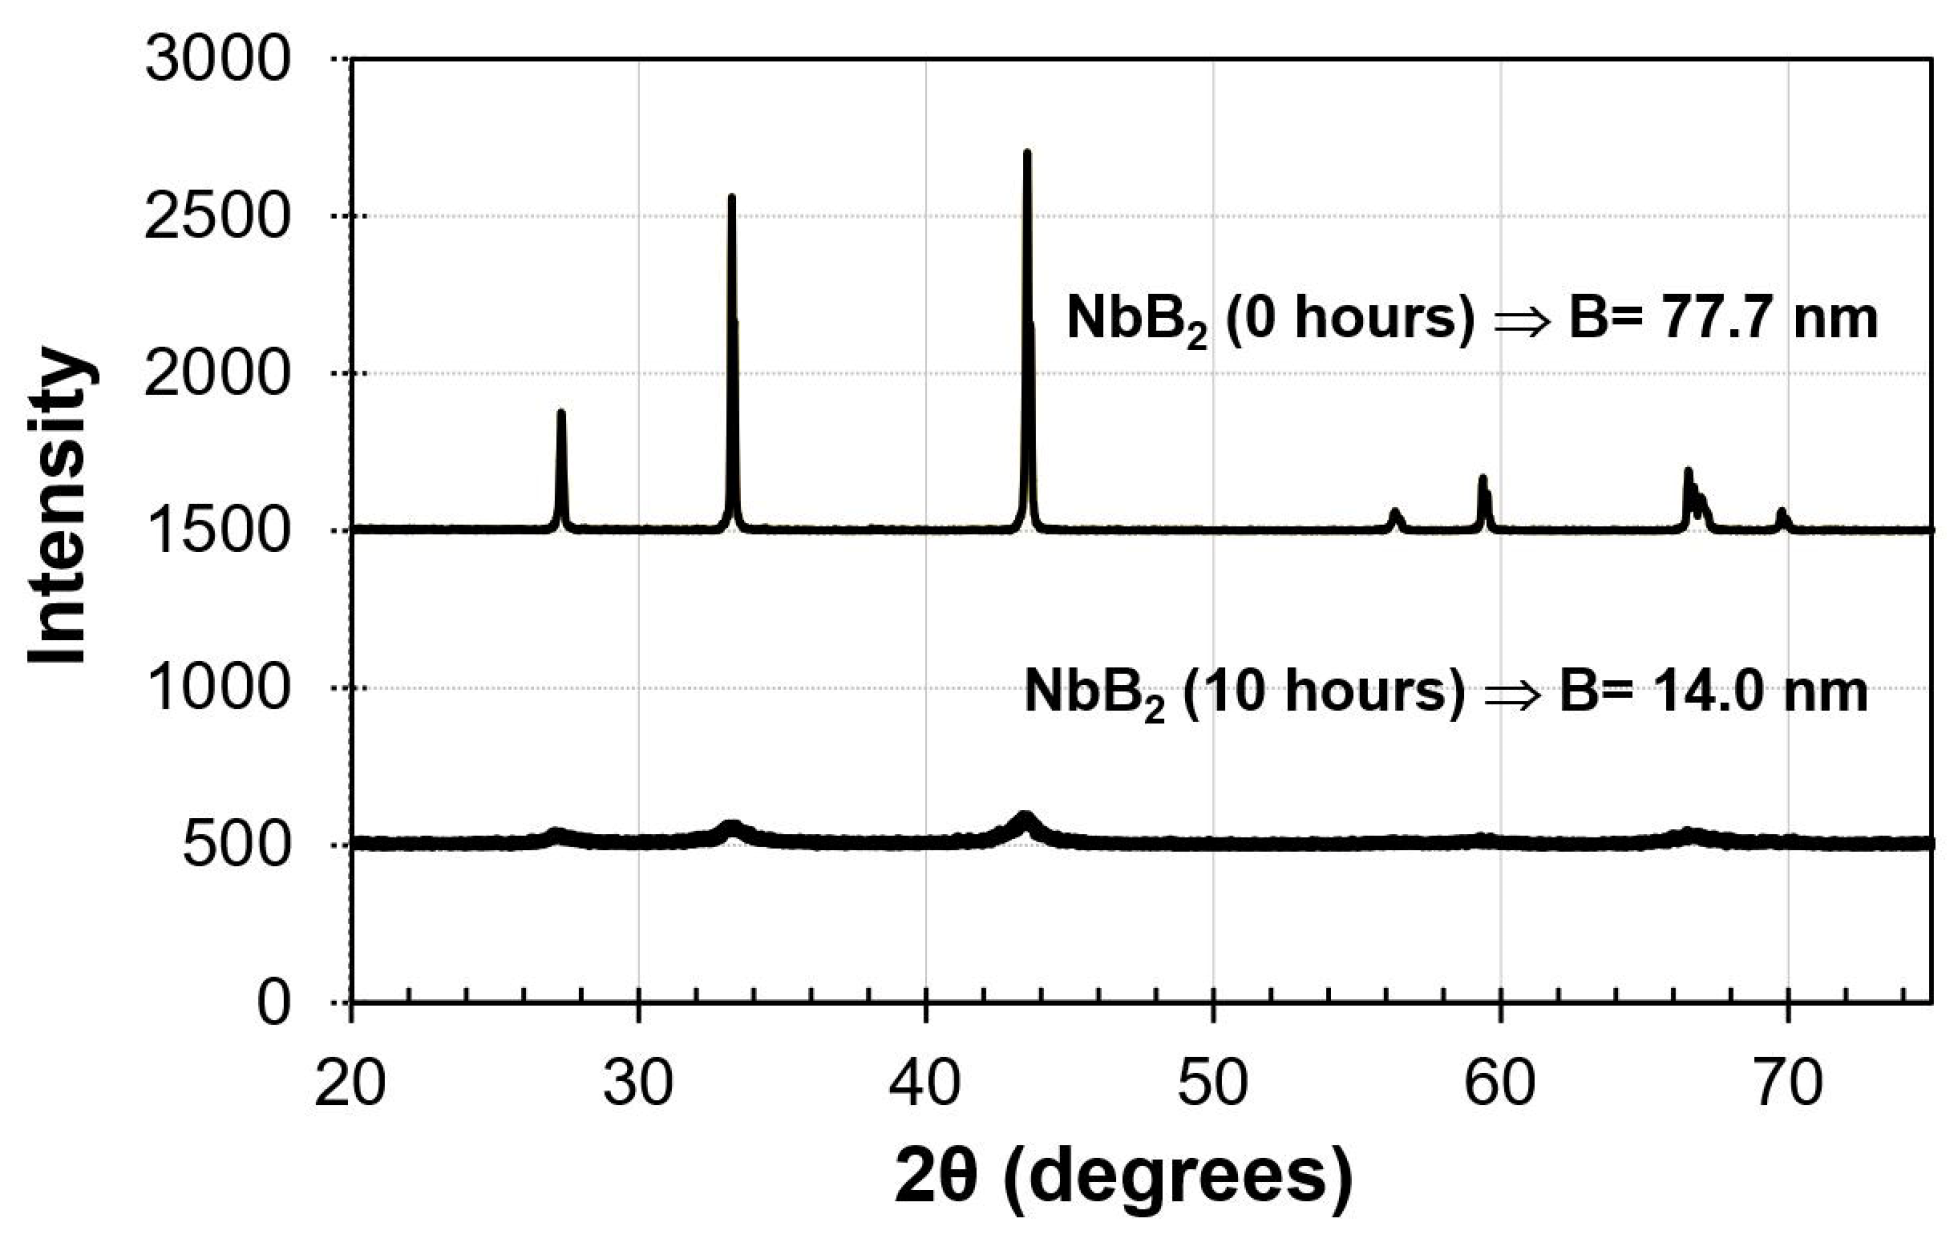
A vario-planetary high-energy ball mill (Pulverisette 4, manufactured by Fritsch GmbH, Idar-Oberstein, Germany) operated at 1600 rpm for 10 h allowed the fragmenting of the as-received NbB2 (Alfa Aesar, Ward Hill, MA, USA) pieces to the nanoscale with a 1:10 ball-to-power ratio (BPR) (Figure 2a) [22]. This procedure rendered NbB2 nanoparticles with an average crystallite size of 14 nm, as illustrated in Figure 3. This size was estimated with Scherrer’s equation [23] using a Siemens® (Princeton, NJ, USA) D500 X-ray diffractometer to scan the fragmented specimens within a 15–75° 2θ range with Cu Kα radiation (i.e., λ = 0.154178 nm, Figure 3).
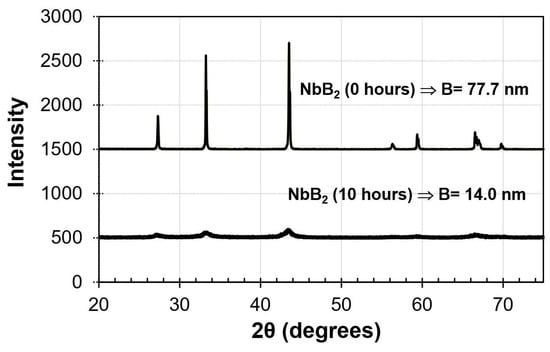
Figure 3.
XRD pattern of NbB2: as received, i.e., without ball milling (upper spectrum) and NbB2 particles after 10 h of milling (lower spectrum).
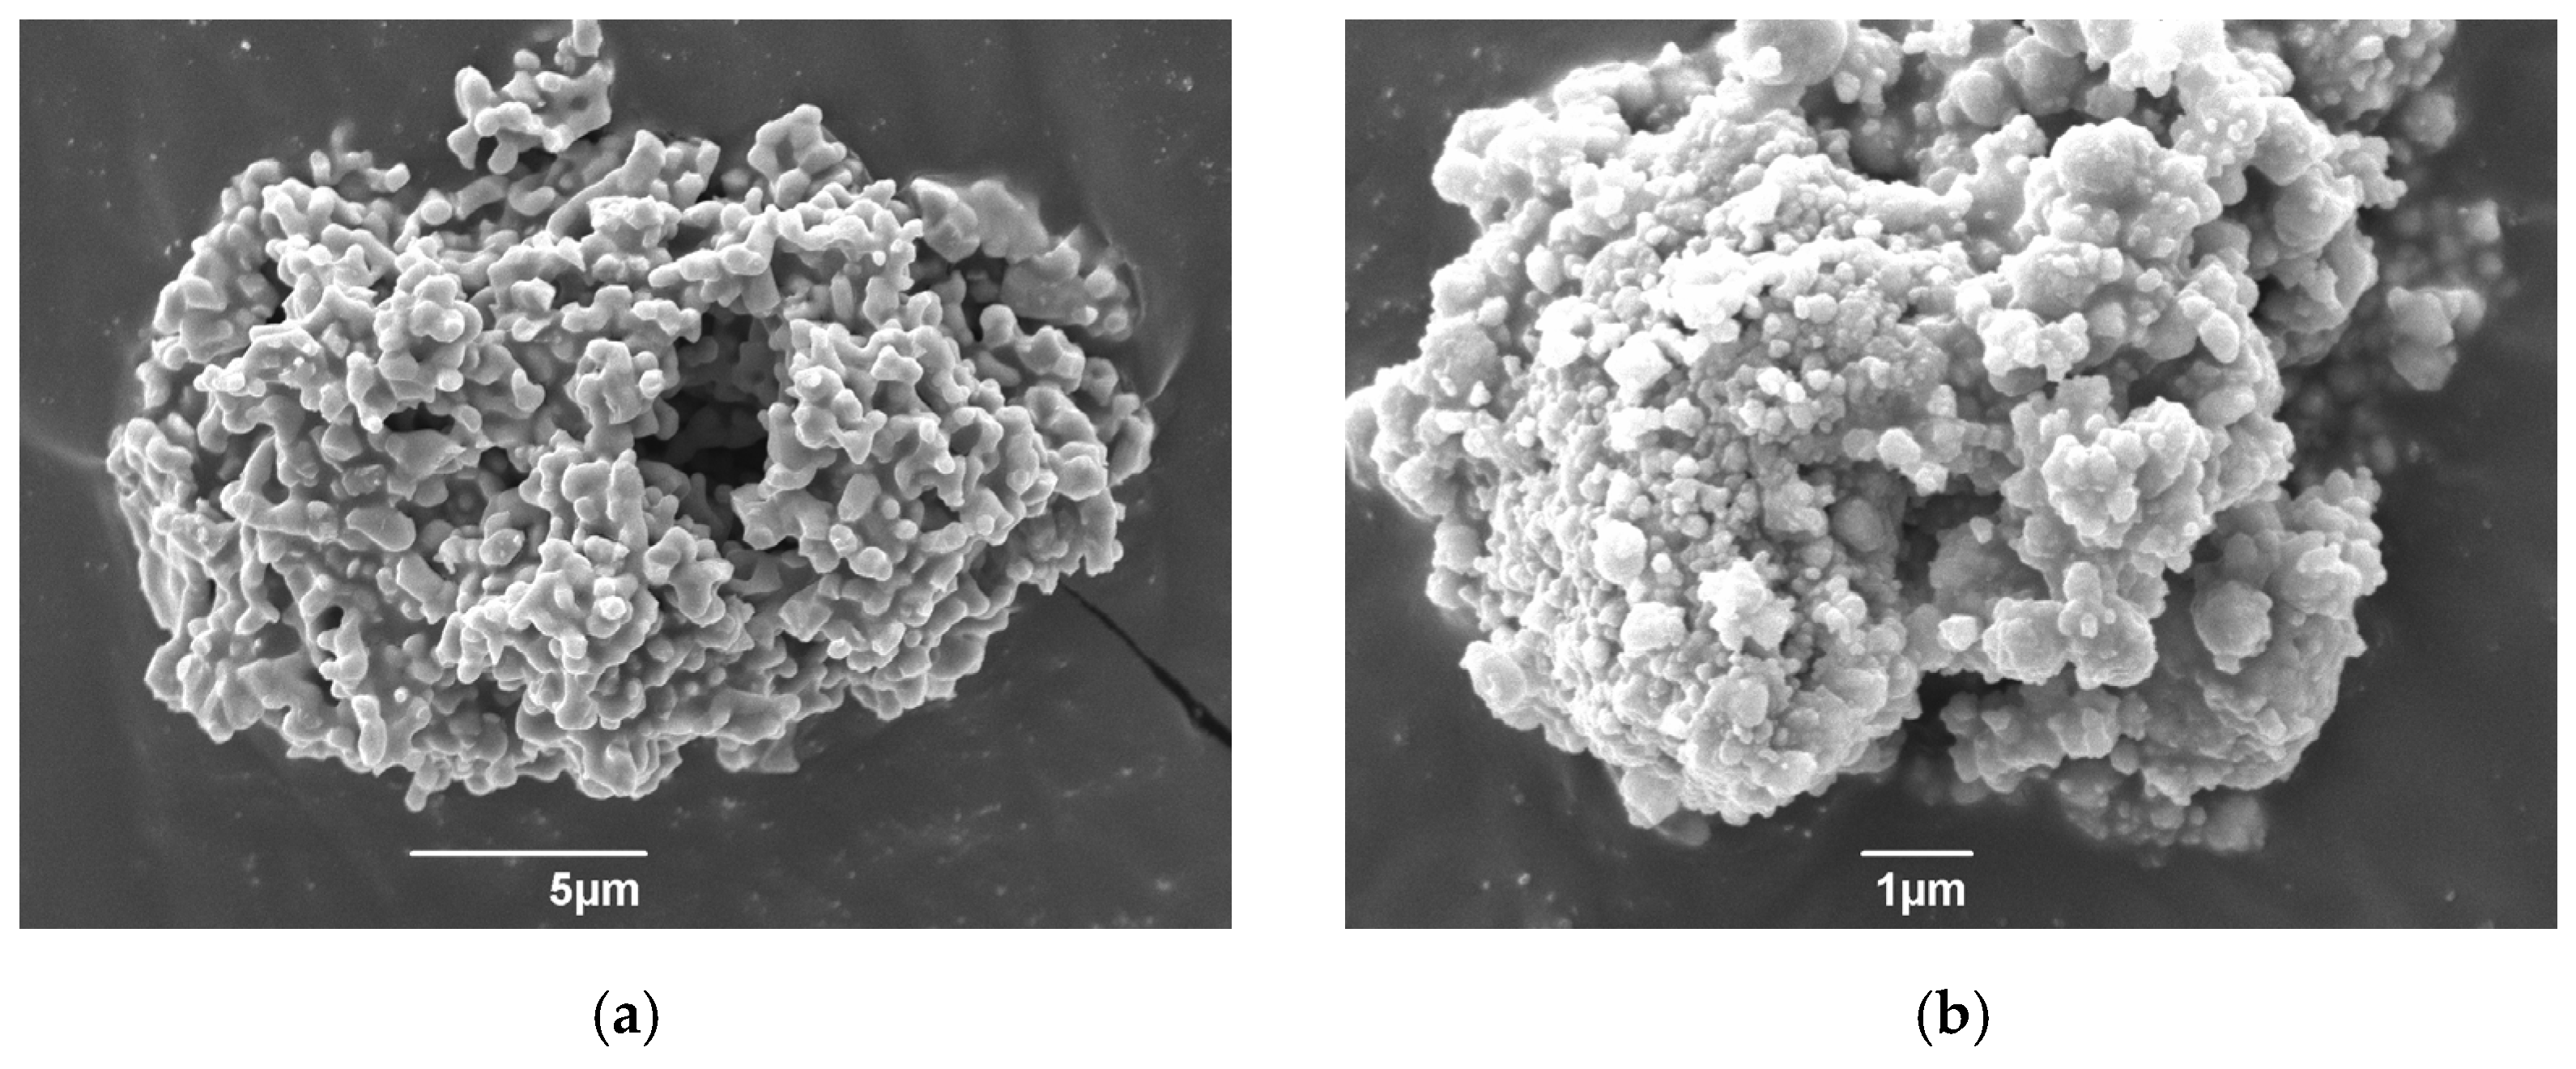
The scanning electron microscope (SEM) images in Figure 4 correspond to clusters of NbB2 particles before the ball milling process and after 10 milling hours, respectively; the reduction in the particle size of the diboride is evident. The obtained NbB2 particles, which were milled for 10 h, had an approximate size of 14 nm, which was deemed appropriate to proceed with the planned experiments. Since the number of diboride nanoparticles in the aluminum–magnesium matrix is too low for detection in the SEM, the authors opted to assess only the reduction in particle size of the diborides in the SEM, based on techniques developed in successful prior research [6].

Figure 4.
Secondary electron images of the NbB2 particles: (a) as-received NbB2 (without ball milling), and (b) clusters of NbB2 particles after 10 milling hours.
To ensure proper particle dispersion during pellet fabrication, we used a hot plate stirrer to mix an isopropanol solution with the NbB2 and pure Al powder, with an Al-to-NbB2 mass ratio of 90:10 (Figure 2b). The solution was stirred at 250 rpm for approximately 72 h at 60 °C inside a fume hood until the liquid evaporated. To prepare the Al/NbB2 nanocomposite pellets via mechanical alloying, we first furbished the planetary ball mill (PBM) with two sets of grinding bowls and support disks, each working independently, rotating in the same direction. Then, the resulting diboride powder was milled along with 99.5% pure aluminum powder (Acros Organics, Morris Plains, NJ, USA). During milling, the jar’s inner walls and the milling balls striking the Al-NbB2 mix induced cold welding. The rotational speed was set at 1020 rpm for 1 h, with a BPR of 10:1 [24] (Figure 2c). After cold welding, we sintered the pellets to enhance the aluminum/diboride interface to reduce porosity [6,10,13,14,15,16]. A 200 °C annealing for 30 min in a reduced vacuum atmosphere (4 kPa) permitted the enhancement of the aluminum/diboride interface by removing residual stresses in the Al/NbB2 composite produced during the intense plastic deformation caused by ball milling (Figure 2d).
2.2.2. Step 2—Stir Casting
Pure aluminum pellets, along with an Al-Mg (5 wt.% Mg) master alloy, were melted at 700 °C in a graphite crucible (Figure 2e). We inoculated the melt with the Al/NbB2 pellets and mechanically stirred the molten material to improve the nanoparticle distribution (Figure 2e). Meanwhile, the mold and the stirrer were preheated at 650 °C to avoid abrupt temperature changes during the stir-casting process (Figure 2f). The filler was prepared with different nanoparticle weight percentages and an Al—5 wt.% Mg binary alloy through a stir casting process (Figure 2g). The treated melt was poured into a mold to produce 6 mm diameter cylindrical ingots (Figure 2h).
2.2.3. Step 3—Quality Test
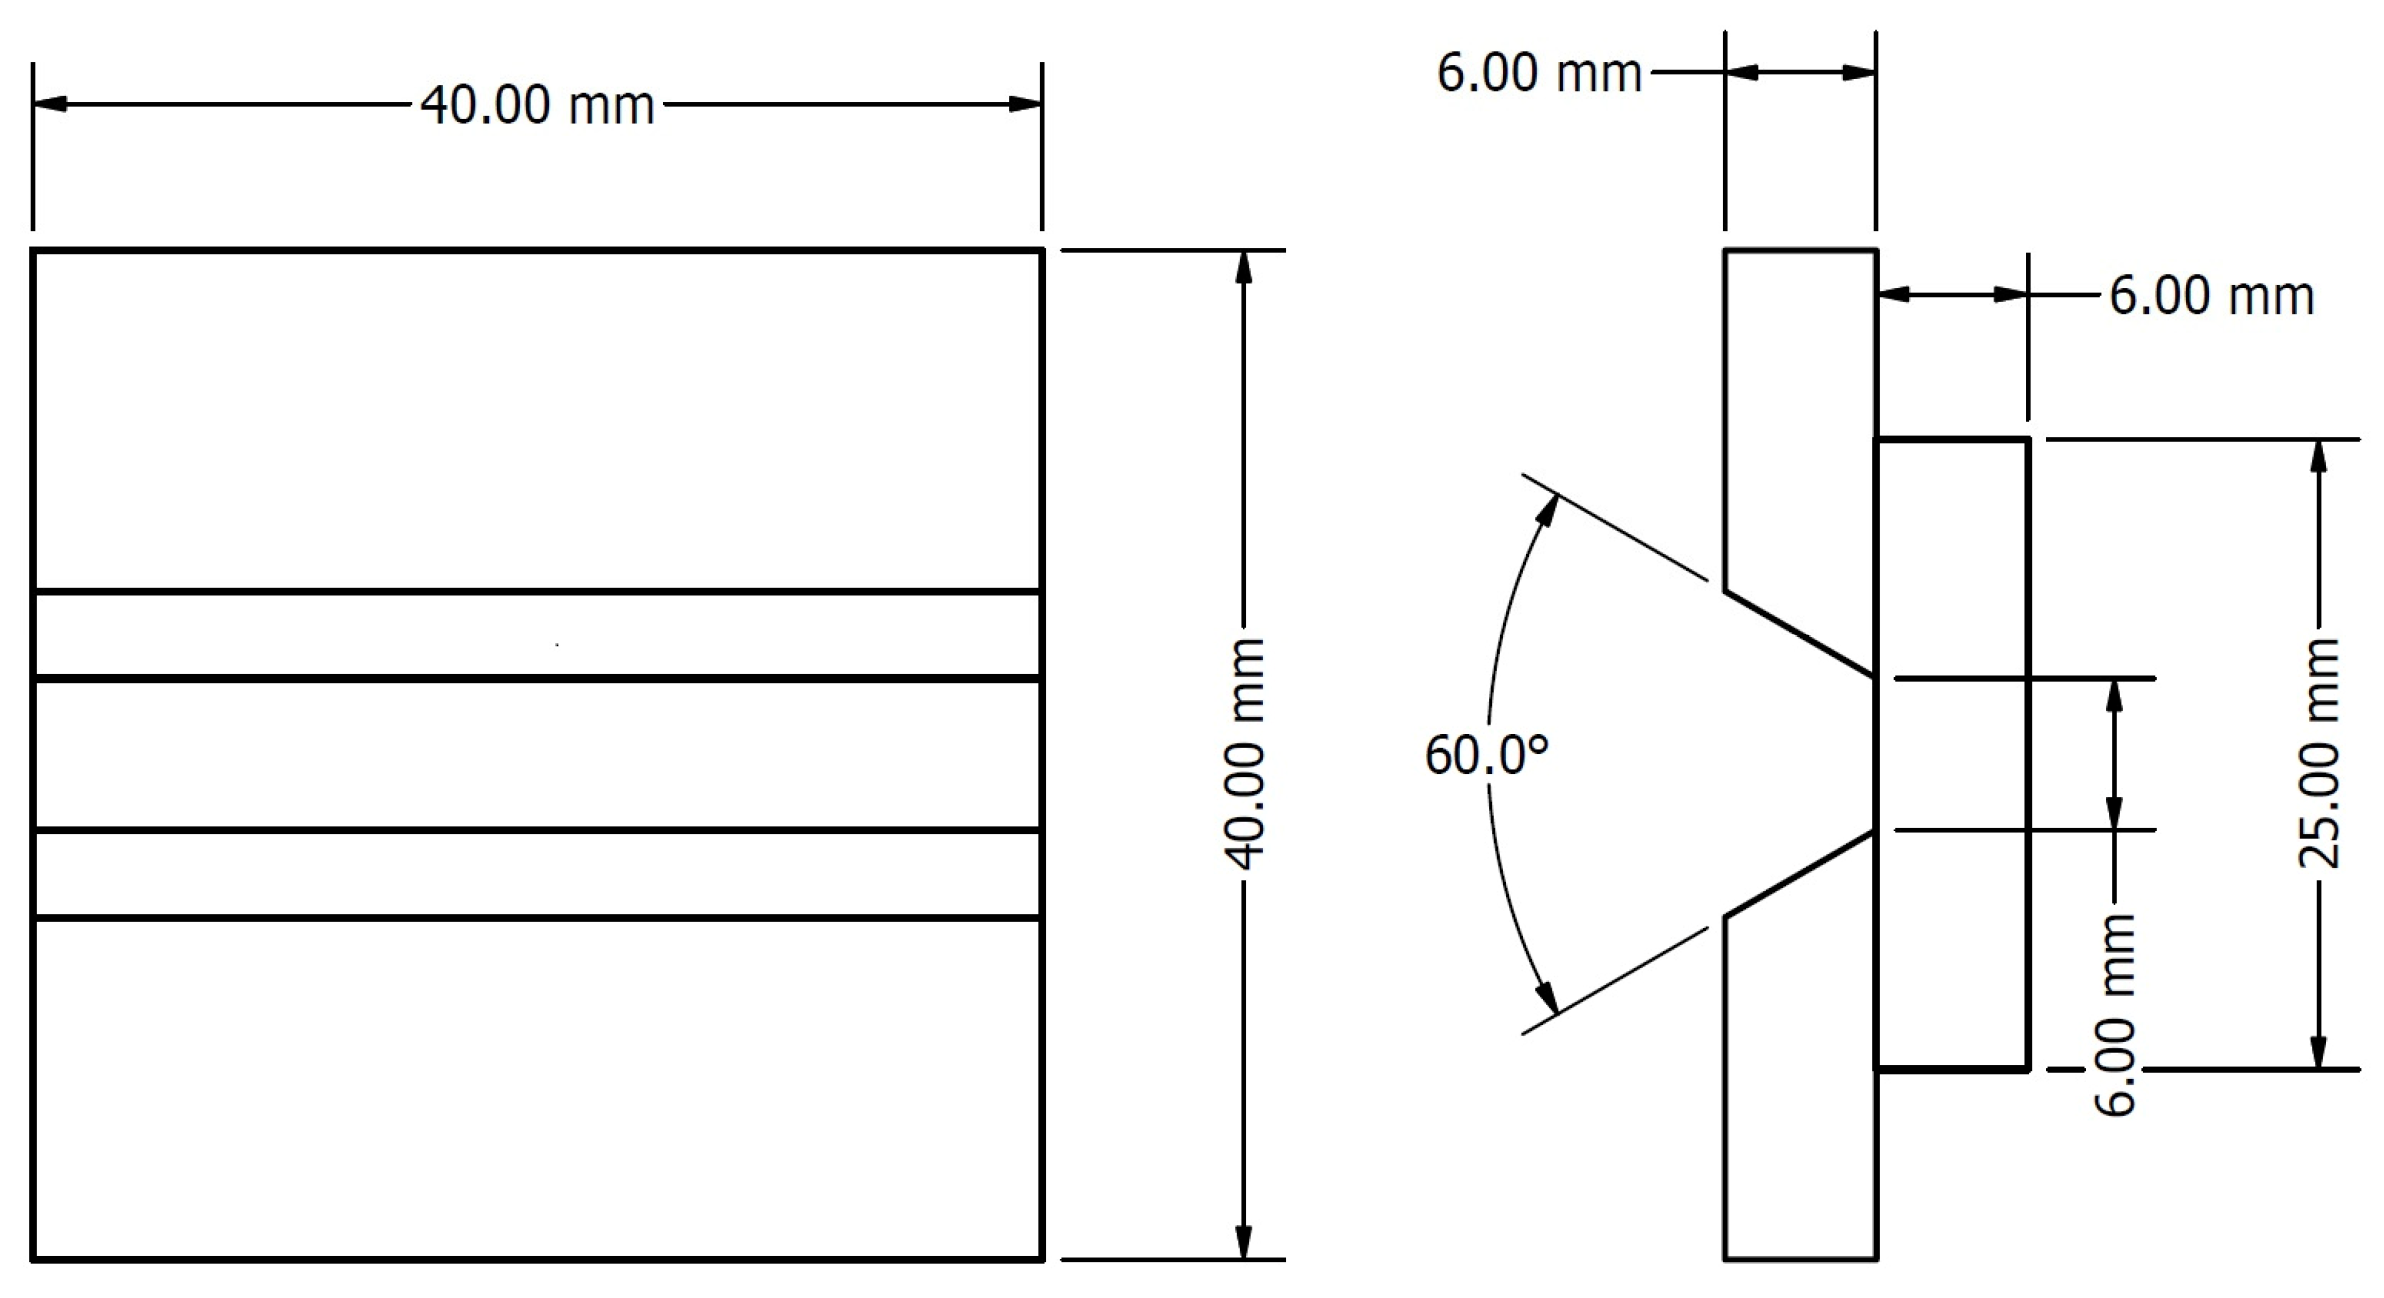
The ingots were cleaned and cold rolled in a manual rolling machine until the rods reached about 2.4 mm, as recommended by AWS, to achieve better joints between the base plate metal (i.e., AA6061) and the filler (Figure 2i,j). A machined single V-groove (60° angle) was used to test the weld made from the nanoparticle-reinforced filler material [7]. AA6061 commercial aluminum alloy plates served as the welding test’s base material, following the AWS 5–10 standard (Figure 5) [25]. We removed oxide layers before welding with a steel wire brush and acetone to ensure weld quality. Additionally, the following weld parameters were considered to achieve better weld quality: peak current, base current, and pulse rate [26]. These welding parameters were controlled by the TIG welding unit, a Lincoln Electric Precision TIG 225 230V AC/DC TIG machine manufactured by Lincoln Electric (Cleveland, OH, USA). Table 1 provides the range of the parameters employed and the constant settings used. Since the manufacturing process took place at a laboratory scale, the amount of materials necessary for a statistically significant number of tensile test specimens was out of reach; therefore, the authors opted to assess only the materials’ hardness, as a representative mechanical property. An LCR-500 hardness tester manufactured by LECO (St. Joseph, MI, USA) helped measure Brinell hardness on the welds, following the ASTM E10-18 [27] and ASTM B647—10 [28] standards by indenting the material with a 3.175 mm diameter steel ball with 15 kg of Force (Figure 2l). The welded sample was cut transversely to the weld direction and polished. Then, the porosity was observed in an optical microscope Nikon® (Melville, NY, USA) model Epiphot 200. ImageJ 1.49r, an open-source image processing package, was used to quantify weld porosity. At this point, one must underscore that AWS establishes a 4% porosity upper limit for quality welds.
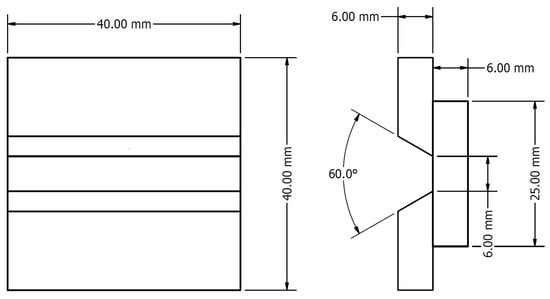
Figure 5.
Groove weld test assembly dimensions.

Table 1.
TIG welding parameters.
3. Results
3.1. Response Variable Analysis: Brinell Hardness
The data normal distribution was verified through a probability plot of the Brinell hardness tests. Since the p-value was 0.073, i.e., >0.05, there is enough evidence to conclude that the results do not follow a normal distribution. Hence, data transformation was necessary to improve the normalization and equalization of variance for skewed variables [29]. A Box–Cox transformation via Minitab was used to correct the error distribution and unequal variance bias by obtaining a λ = 0.5. The deleted residuals permitted the identification of outliers; the assumption of independence error terms was not violated. The analysis of variance (ANOVA) in Table 2 reveals that the ‘percentage of nanoparticles’ with an F-value = 117.8 (p < 0.001) is the most significant factor in filler production and weld hardness. Moreover, the ‘stirring speed’ showed an F-value = 20.56 (p < 0.001), while the ‘stirring time’ had an F-value = 19.67. These results suggest that the latter factors did not influence the hardness but did affect the reinforcement distribution and weld quality. The main effects’ variance inflation factor (VIF) is 1, i.e., the predictors are not correlated. Using a regression model for Brinell hardness (Equation (1)), we can find the factor that maximizes the performance of the stir casting process, with a prediction percentage of 58.52%.
Table 2.
Analysis of variance for the transformed response of the Brinell hardness.
Equation (1): Regression Equation of Brinell Hardness
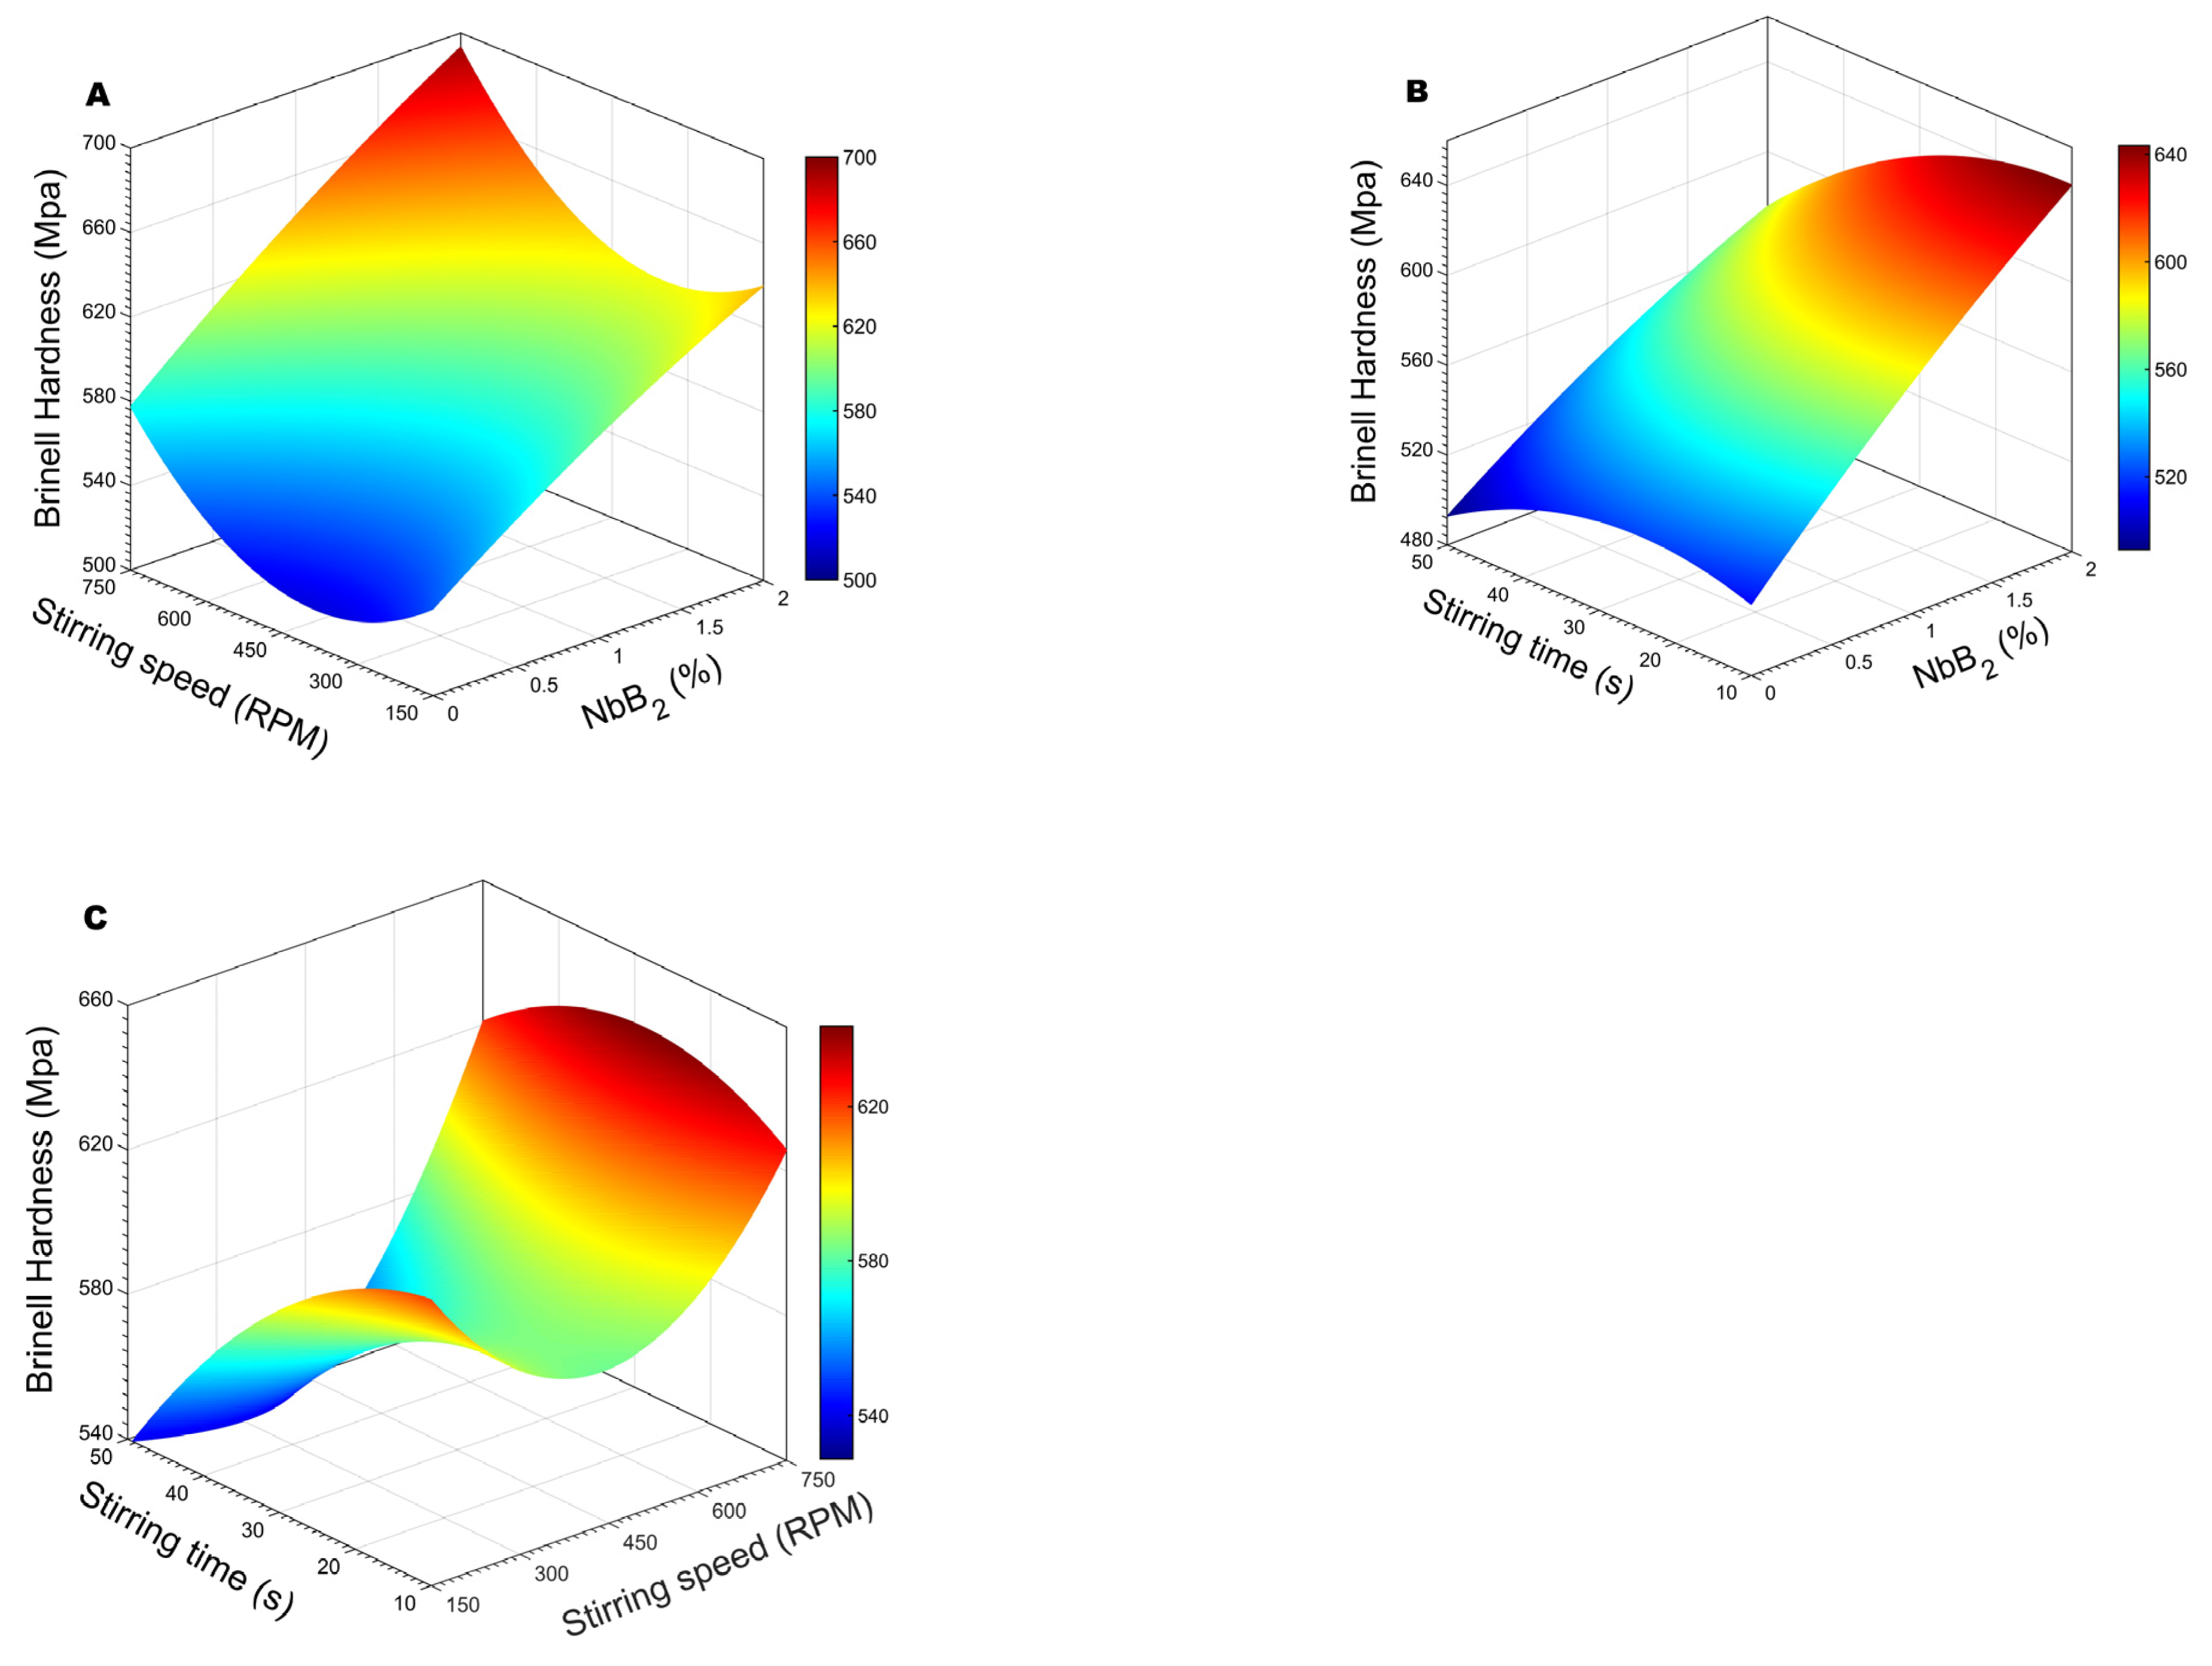
The regression equation for the Brinell hardness can help build a response surface that is able to predict the response at the factor’s intermediate levels. Figure 6A shows the Brinell hardness surface plot with the stirring speed and the percentage of nanoparticles as factors. It illustrates that the material could increase hardness for higher speeds (~750 rpm) and nanoparticle percentages (~2%). The curvature in the stirring speed is more apparent at shorter times. Figure 6B presents the effects of stirring time and NbB2%. It reveals how a stirring time between 10 and 20 s and 2% percent nanoparticles could render higher hardness. Figure 6C shows the stirring time and speed effects. Evidently, increasing or reducing both factors simultaneously leads to lower hardness values. However, such a combination leads to a more significant response when one factor increases and the other decreases. For example, high hardness results were observed with 10 and 20 s of stirring time at 750 rpm; also, the stirring time did not influence the hardness at speeds higher than 700 rpm. Moreover, the plot shows an unexpected behavior: a slight increase in hardness at 150 rpm. Yet, every time the stirring time increases at this speed, a steep decrease in hardness is noticeable. The Minitab 17® response optimizer tool allowed for the computing of an optimal response variable, as we assigned the same weight and importance to both factors. Such weight indicates the distribution of the desirability between the lower or upper limit and the goal [30]. With the optimal hardness, we completed an optimal multiple response prediction. The optimal parameter levels for this regression model rendering a maximum Brinell hardness are 2% NbB2, 750 RPM, and 21.7 s of stirring time; this leads to a Brinell hardness of 698.5 MPa. The prediction’s confidence interval (CI) is 653.5, 745.0 MPa for a 95% CI. As mentioned, the desirability estimates how the variables’ combination satisfies a set of responses in general. The range of CCD desirability is between zero and one, where zero indicates that some of the responses are outside the acceptable limits, and one represents the ideal case. Our optimal response had a desirability of 1.
Regression Equation of Brinell Hardness (MPa)^0.5 = 24.37 + 1.683 Percentage (%) − 0.00874 Speed (RPM) + 0.0166 Time (S) − 0.147 Percentage (%) × Percentage (%) + 0.000009 Speed (RPM) × Speed (RPM) − 0.000939 Time (S) × Time (S) + 0.000225 Percentage (%) × Speed (RPM) − 0.0126 Percentage (%) × Time (S) + 0.000066 Speed (RPM) × Time (S)

Figure 6.
Response surface of the Brinell hardness: (A) as a function of stirring speed and NbB2%, (B) as a function of stirring time and NbB2%, and (C) as a function of stirring time and stirring speed.
3.2. Response Variable Analysis: Porosity
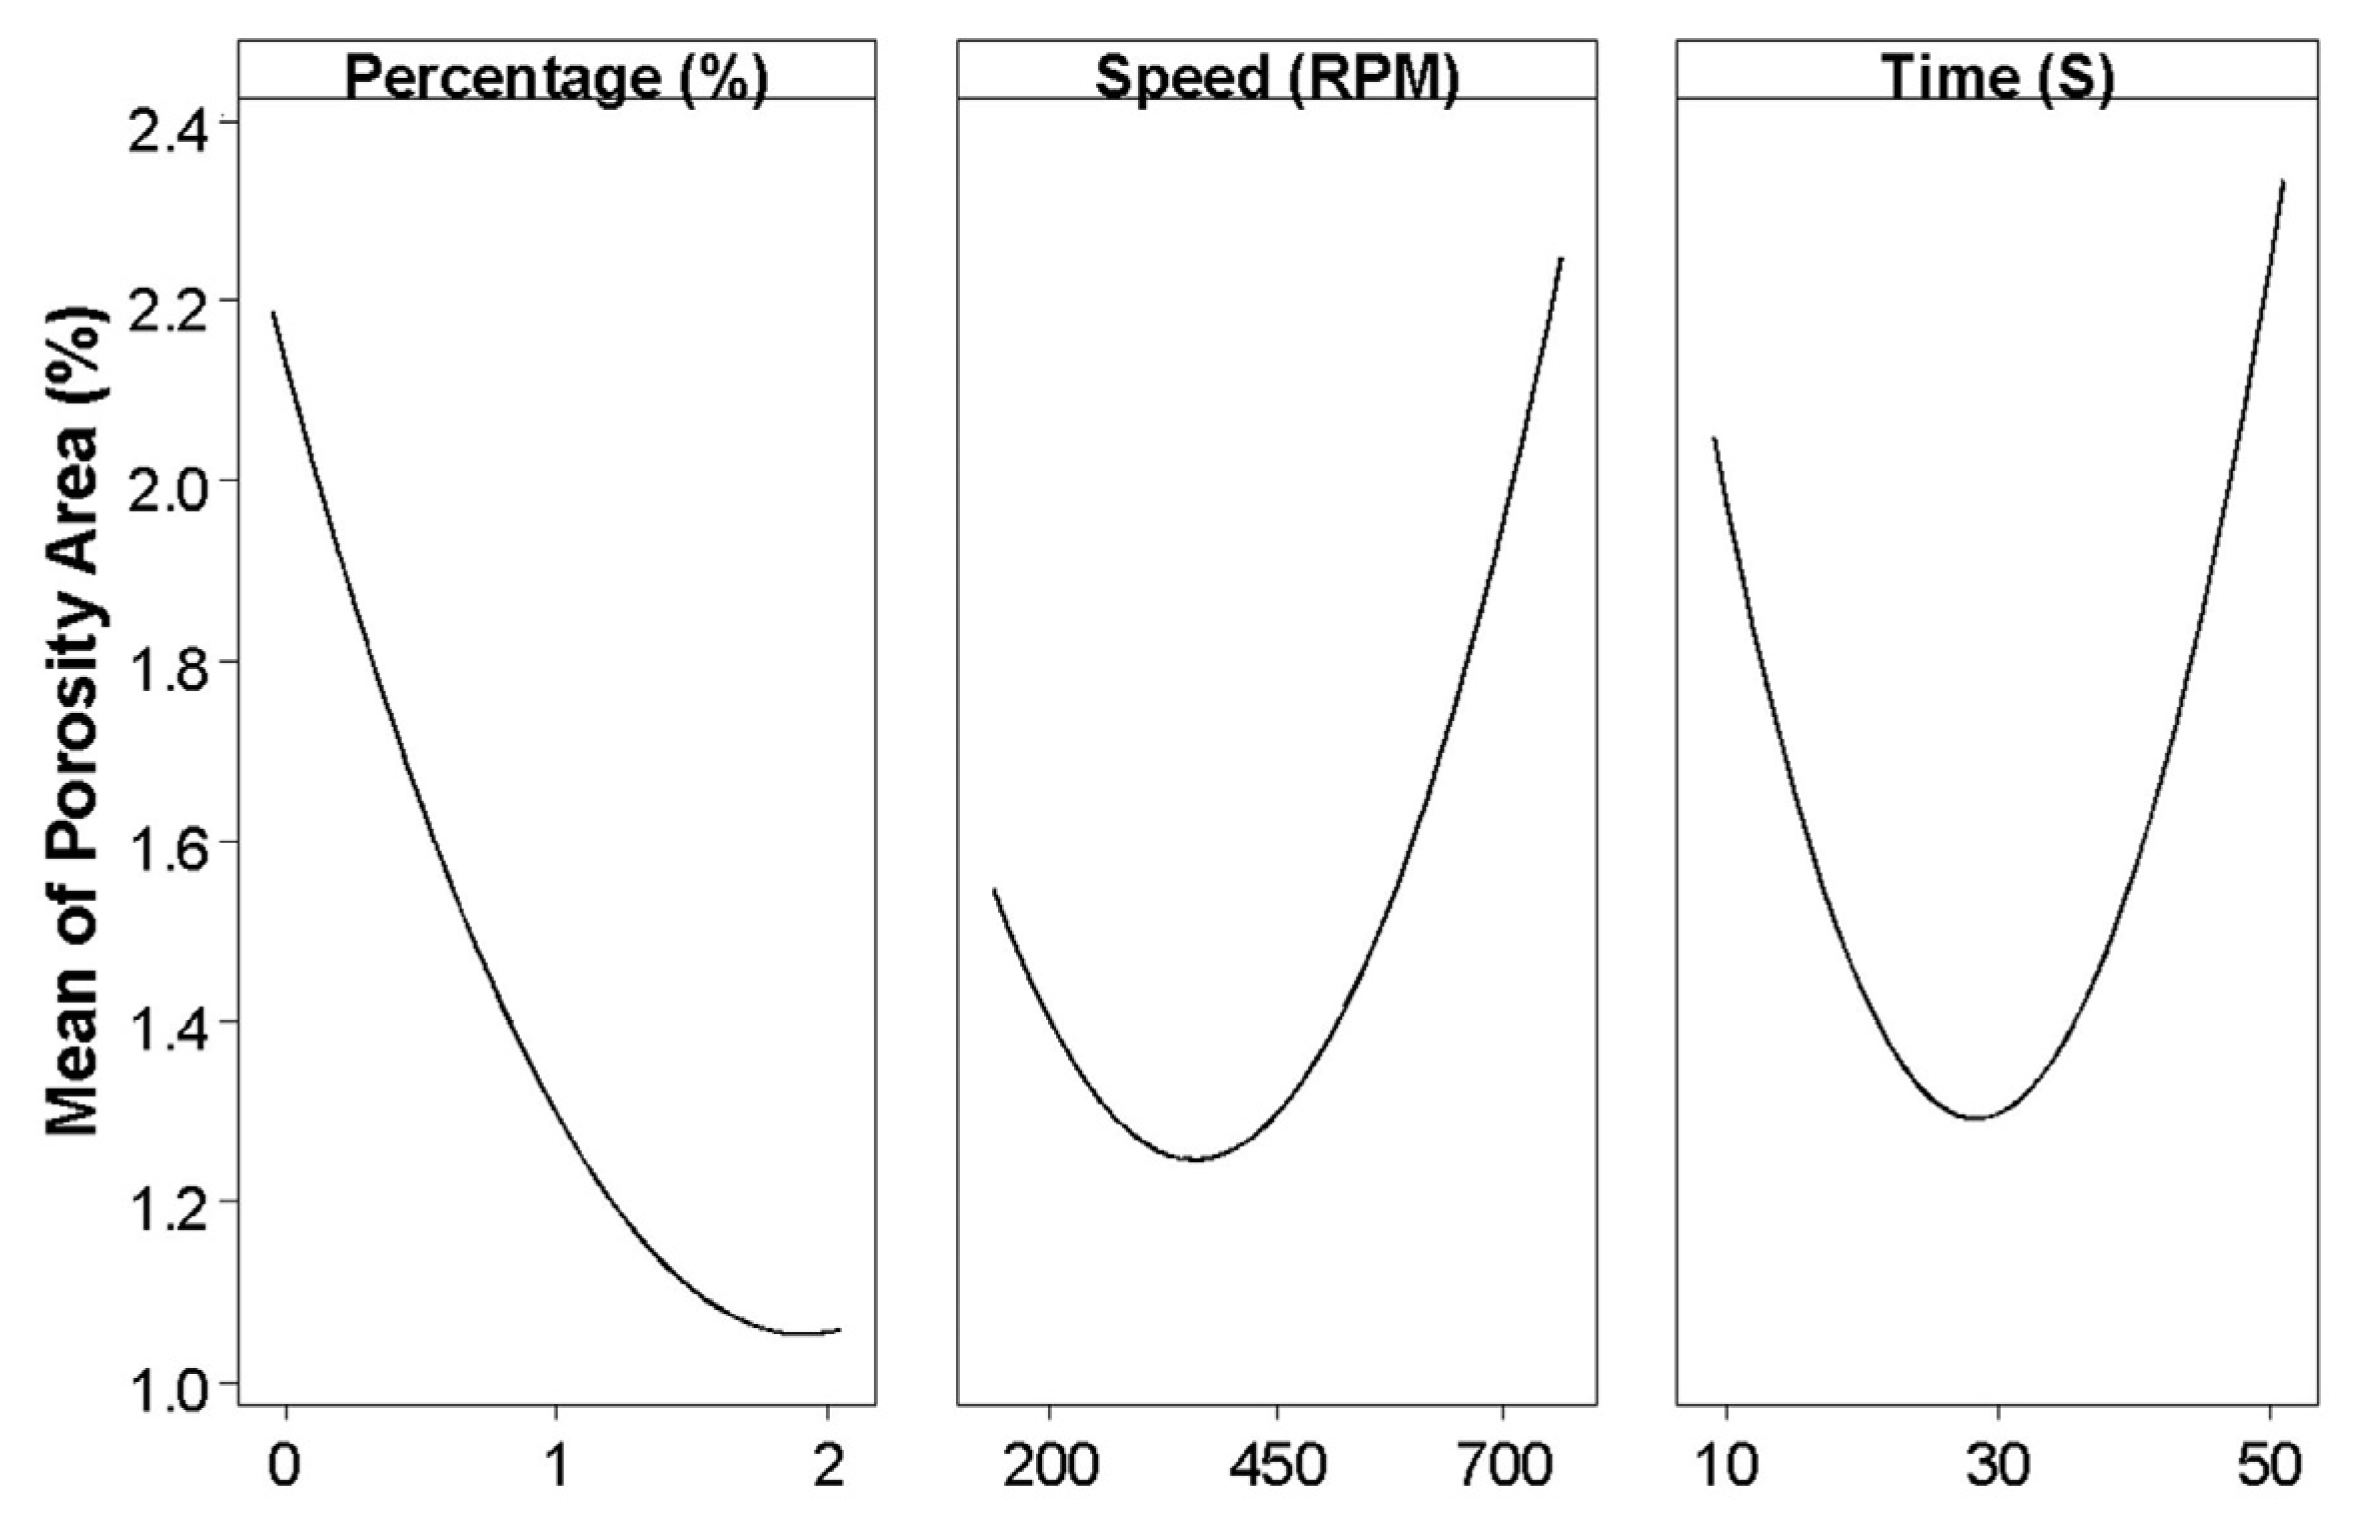
The normal probability test for porosity revealed a typical problem: a sharp curve up and down at both ends, indicating that the tails of this distribution may question the normality assumption. Yet, since the p-value was 0.010, the results do not follow a normal distribution. Hence, a Box–Cox transformation was used to help correct the curves in the distribution and enhance the normality. In effect, the transformation helped to improve the distribution of the data on the centerline and to decrease the p-value to 0.079 with an estimated λ of 1.046. In the deleted residual order plot, the residuals fall randomly around the centerline. No apparent pattern indicates that residuals are not correlated. The ANOVA in Table 3, again, reveals that the nanoparticle percent, with an F-value of 54.74, is the most statistically significant factor. In addition, the interaction between NbB2 percentage and stirring speed strongly influenced porosity. The next step was to analyze the main effects individually to determine the factor levels that would yield an optimum result. Figure 7 corresponds to the main effects plot for porosity. This tool uncovers that a high percentage of NbB2 and a stirring time that remains at the central point value minimize the porosity. In Equation (2), the porosity-transformed response variable resulted in a prediction percentage of 69.11%. The main effects’ VIF is 1, revealing that the predictors were not correlated.
Table 3.
Analysis of variance for the transformed response of the porosity area.
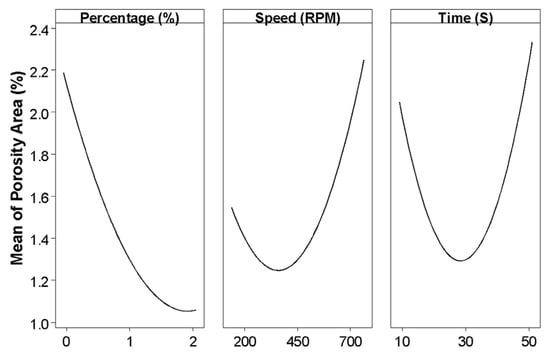
Figure 7.
Main effects plot for porosity (%).
Equation (2): Regression Equation of Porosity
Using the regression equation for porosity prediction, we can represent the relationship between the independent variables and the response one via a regression model. Then, the corresponding response surface helps to better understand the influence of the three factors studied during welding, as presented in Figure 7. Figure 8A shows the surface plot generated via the predictive porosity equation with the stirring speed factor and the nanoparticle percent as factors. The welds exhibited a minimum porosity of 0.39% at 150 RPM and 2% of nanoparticles. Less porosity is present as the percentage of nanoparticles increases within the 150–450 rpm range. However, in the absence of NbB2 nanoparticles, porosity levels increase for similar values of stirring speed. Figure 8B shows the response surface plotted as a function of the stirring time and NbB2%. It is apparent that a stirring time longer than 40 s leads to high porosity. In addition, the graph shows that the presence of nanoparticles at medium stirring time levels reduced the porosity. Figure 8C shows the surface plot of porosity as a function of the stirring time and stirring speed. The apparent ellipsis results from a significant interaction between the independent variables [31]. The minimum point is assumed to be approximately at the intersection of the major and minor axes of the ellipse. Moreover, Figure 8C confirms that high stirring speeds with prolonged mixing times significantly increase the porosity. Thus far, we have sought parameters that minimize weld porosity to increase weld quality. The optimal multiple response prediction was computed with the Minitab 17® response optimizer tool. Our results revealed that 2% NbB2, 150 rpm stirring speed, and 35 s of stirring time are optimal for achieving minimum porosity. Our desirability value is 1 for the optimal response.
Porosity (%) = 8.934 − 3.879 Percentage (%) − 0.01351 Speed (rpm) − 0.1827 Time (s) + 0.295 Percentage (%) × Percentage (%) + 0.000006 Speed (rpm) × Speed (rpm) + 0.002027 Time (s) × Time (s) + 0.005378 Percentage (%) × Speed (RPM) + 0.01101 Percentage (%) × Time (s) + 0.000126 Speed (rpm) × Time (s).
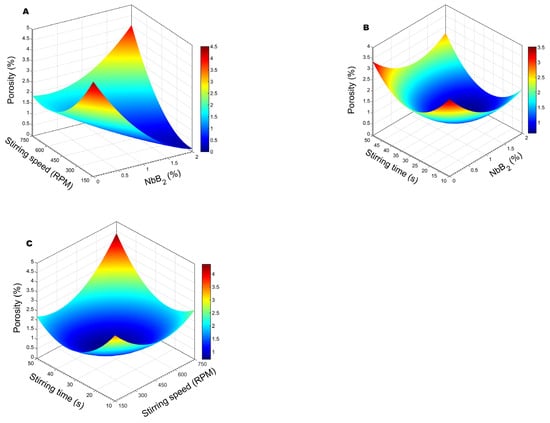
Figure 8.
Response surface of porosity: (A) as a function of stirring speed and NbB2%, (B) as a function of stirring time and NbB2%, and (C) as a function of stirring time and stirring speed.
3.3. Optimal Multi-Objective Optimization Solution for Brinell Hardness and Porosity
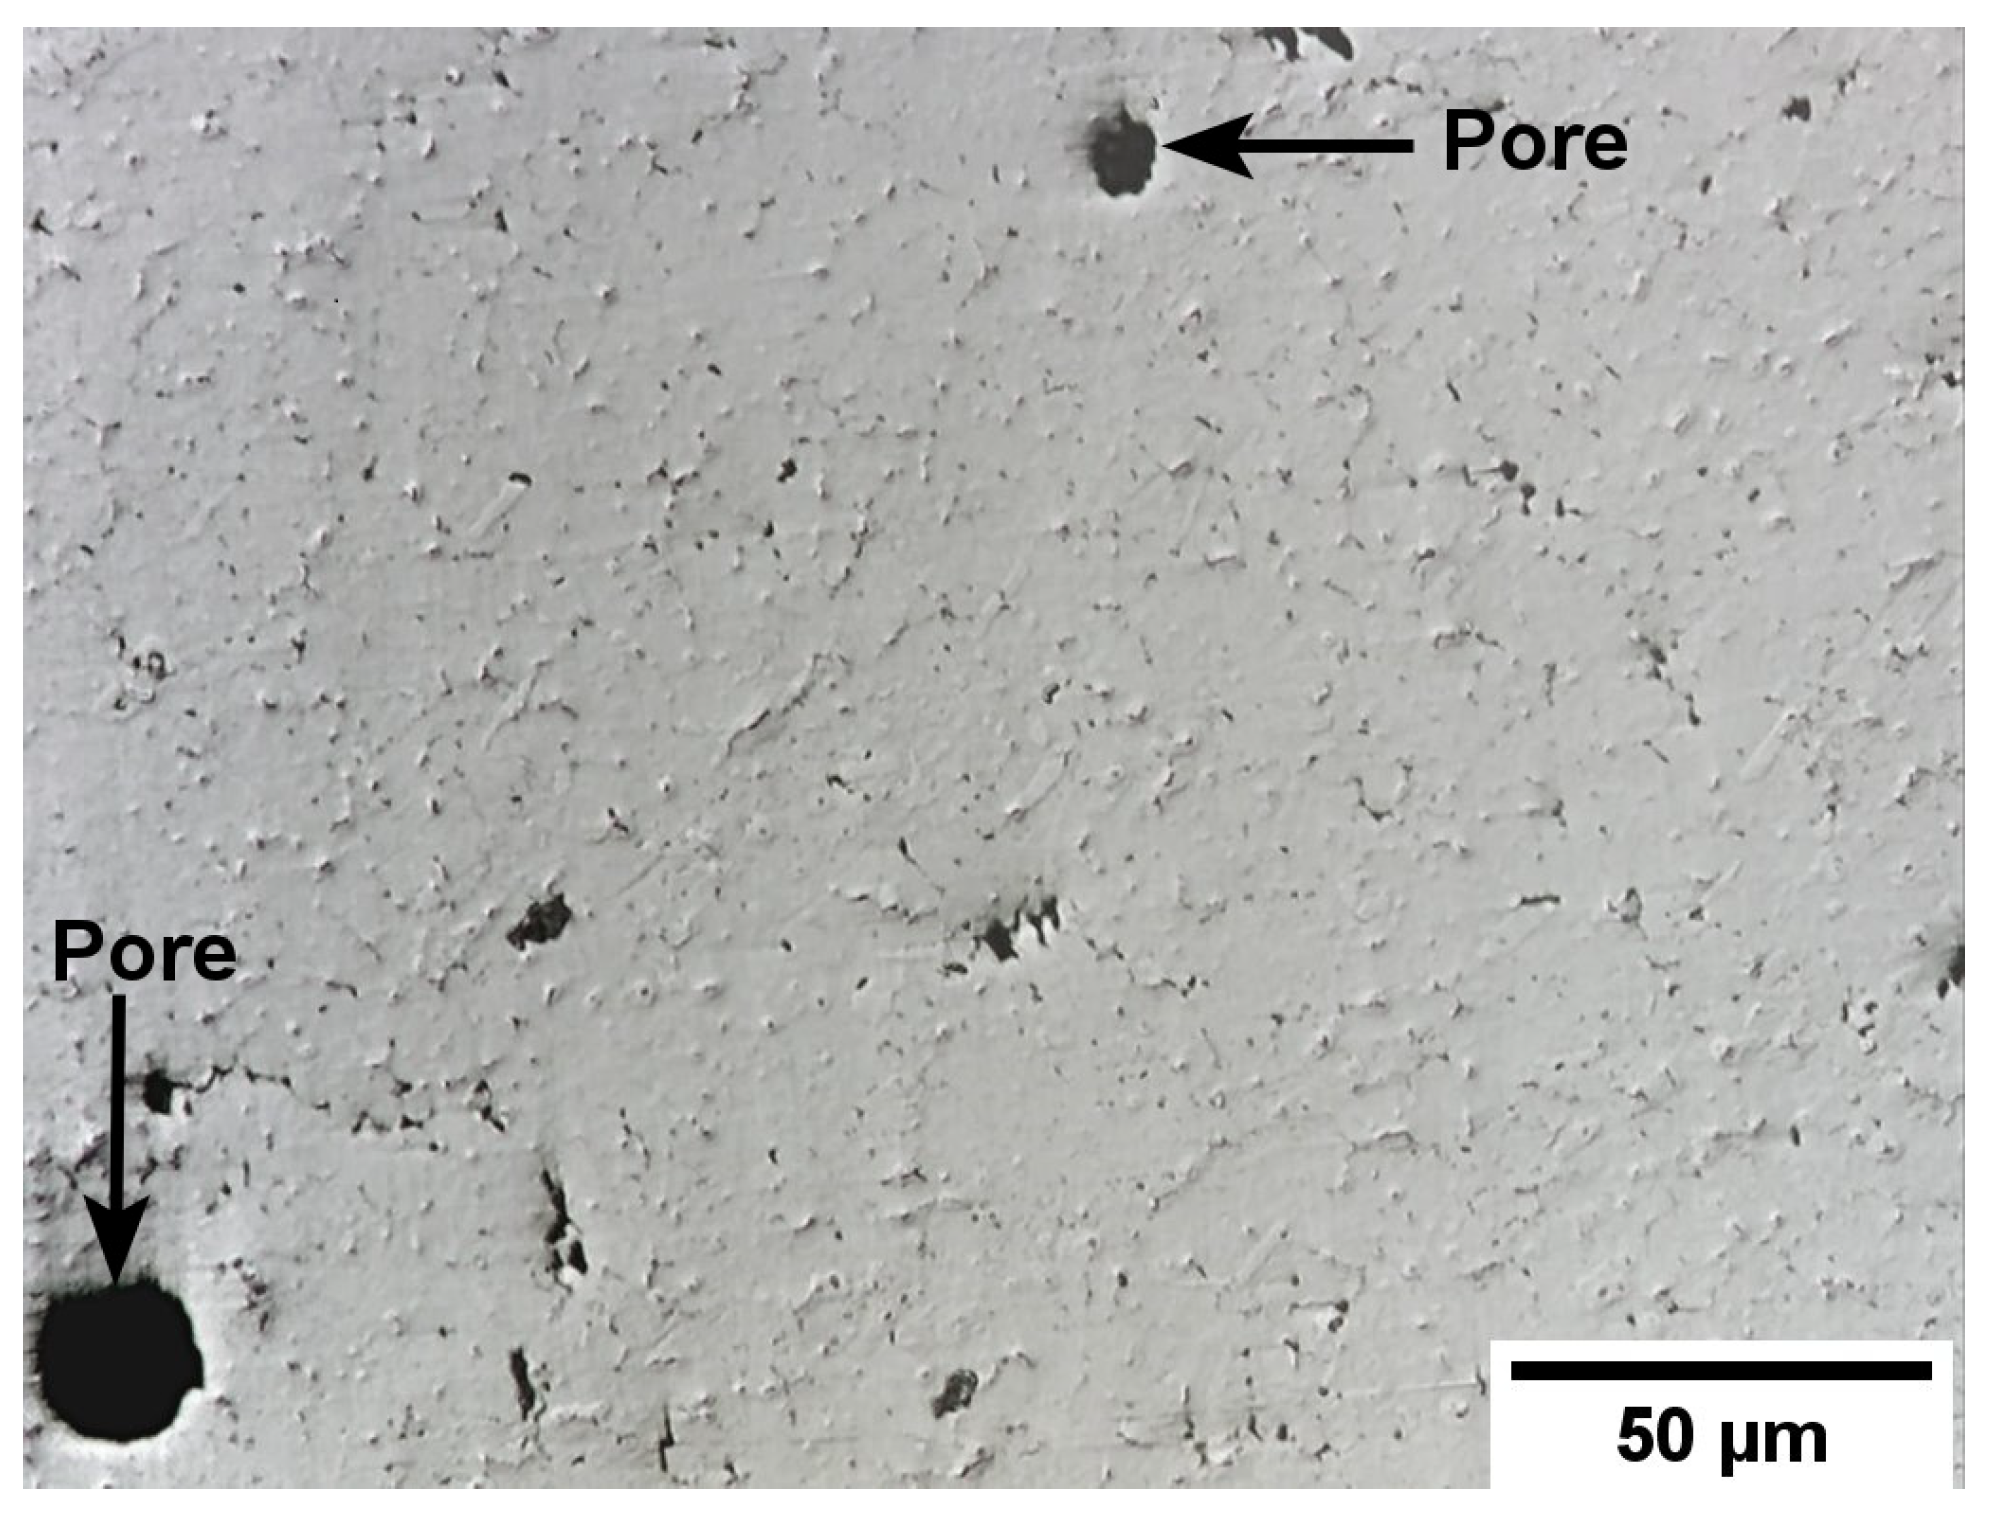
After developing an equation for each response variable and analyzing the optimal solutions, we optimized both variables using the desirability function. We calculated levels that maximize hardness while retaining a 4% maximum porosity; welding quality is deemed inadequate for above this percent. The response optimizer tool allowed for the computing of an optimal response variable, thereby rendering the best welding quality, as shown in Table 4. For the analysis, we assigned the same weight and importance to both factors to the parameters to calculate said optimal level. The as-computed optimal levels rendering the best weld with our experimental filler were 2% NbB2, a 750 rpm stirring speed, and a 35.3 s stirring time, which led to a Brinell hardness of 687 MPa. Figure 9 shows the welded sample’s representative microstructure and resulting measured porosity. The images allowed for the corroboration that a 3.9% porosity is present in the optimal sample using Image J, an open-source image processing package, to quantify the porosity percent along the weld. The standard error of the fits (SE fits) for such porosity was 0.3, and the confidence interval (CI) for a 95% prediction was 2.92% and 4.88%. The SE fit for Brinell hardness was 20 and the 95% prediction CI was 620.8 to 754.1 MPa.
Table 4.
Parameters to calculate the optimal Brinell hardness (MPa) and porosity (%).
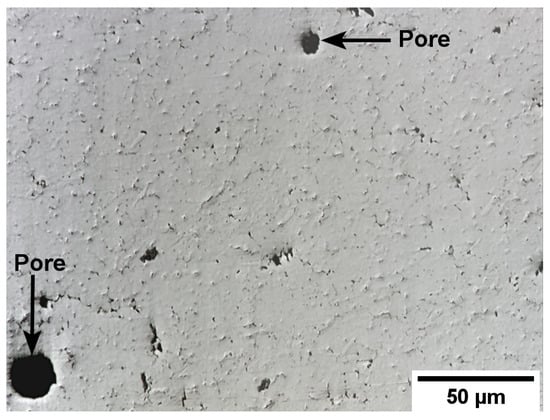
Figure 9.
Sample filler with 2% NbB2, a 750 rpm stirring speed, a 35.3 s stirring time, and 3.9% of porosity.
4. Discussion
A central composite design analysis was conducted for Brinell hardness and porosity, considering stirring speed, stirring time, and NbB2% to study the parameters that can affect weld quality.
4.1. Central Composite Design Analysis: Brinell Hardness
Regarding the CCD for Brinell hardness in Figure 6, our results show that for higher speeds (~750 rpm) and nanoparticle percentages (~2%), the material achieved higher hardness (Figure 6A). The literature revealed a similar behavior with B4C particles at 700 rpm; in such cases, the composite microstructure improved for higher amounts of reinforcement [32]. Concerning stirring time and NbB2% (Figure 6B), Li Yu presented a study on the titanium effect and stirring time of an Al-B4C composite. This work obtained greater tensile strength with 3.5 wt.% titanium and a shorter stirring time. On the other hand, with the same amount of titanium, lower tensile strength was obtained with prolonged stirring time [21]. This is like our findings: a stirring time between 10 and 20 s and 2% percent of nanoparticles rendered higher hardness. This explains the importance of stirring time in manufacturing nanocomposites. For stirring speed and stirring time (Figure 6C), we observed higher hardness between 10 and 20 s of stirring time at 750 rpm. These results agree with those by S. Balasivanandha [33], who worked on the influence of stirring speed and stirring time on the particle’s distribution in the stir-casting process. This study concluded that both factors affect the production of metal matrix composites and that the higher speeds and reinforcement percentages favor a more homogeneous reinforcement distribution in the filler material.
4.2. Central Composite Design Analysis: Porosity
The CCD results for porosity (Figure 8) revealed that the material exhibited its minimum porosity at 150 rpm (2% NbB2), but it increases as the stirring speed increases (Figure 8A). Previous studies corroborate that high-speed stir casting renders turbulence-trapping gases in the Al-Mg melt due to pressure differences [34]. As a result, porosity is inherited by the casting. Moreover, the reinforcement distribution becomes poor and heterogeneous for slower stirring speeds, but the porosity reduction is significant [34]. Regarding stirring time and NbB2% (Figure 8B), our results show that stirring times longer than 40 s render higher porosity. In contrast, the presence of nanoparticles at medium stirring time levels reduced the porosity. Different studies have concluded that to attain a uniform distribution through the stir-casting process, the particles need to be dispersed throughout the aluminum melt at the same time [33,34,35]. This is achieved by forcing the particles into rotational currents for a specified time while the vortex pulls the reinforcement particles well into the aluminum melt [33,34,35]. However, prolonged agitation causes the vortex to entrap air into the molten aluminum, increasing porosity. As mentioned in the porosity versus stirring time and rotational speed plot (Figure 8C), an apparent elliptical zone exists. This region occurs because of a significant interaction between the independent variables [31]. The minimum point is assumed to be approximately at the intersection of the major and minor axes of the ellipse. Moreover, the porosity response surfaces as a function of the stirring time, and the stirring speed confirms that high stirring speed with prolonged mixing time significantly augments the porosity. Once again, we attribute this result to the turbulence and the amount of air trapped into the melt by the vortex.
5. Conclusions
This study has successfully demonstrated the effectiveness of using niobium diboride (NbB2) nanoparticles to enhance the properties of aluminum welding fillers. Through the application of a central composite design and response surface methodology, the research identifies optimal processing conditions that minimize porosity and maximize the hardness of the welding filler, significantly improving weld quality. The main conclusions are summarized as follows:
- The analysis of variance (ANOVA) conducted for the transformed response for hardness reveals that the percentage of nanoparticles with an F-value = 117.8 (p < 0.001) was the most significant factor in filler production and weld hardness.
- Increasing the levels of NbB2 nanoparticles up to 2% into the Al-4wt.%Mg alloy successfully increased the weld hardness by 21%, compared to unreinforced welds.
- The optimal parameters for manufacturing this novel filler are 2% NbB2 nanoparticles at 750 rpm and 35.3 s of stirring. These conditions yield a material bearing a 687. 4 MPa Brinell hardness and only 3.9% porosity.
- The ANOVA conducted for the transformed response for porosity reveals that the nanoparticle percent, with an F-value of 54.74, is the most statistically significant factor. In addition, the interaction between NbB2 percentage and stirring speed strongly influenced porosity.
- Our results revealed that 2% NbB2, a 150 rpm stirring speed, and 35 s of stirring time are optimal for achieving a minimum porosity of 0.39%.
- A 50 s stirring time produced a porosity greater than 2.8%, the highest percentage obtained during the study with 0.5% NbB2 nanoparticles at a stirring speed greater than 700 rpm. This is attributed to the high amount of air taken by the vortex and trapped in the melt.
- The standard error of the fits (SE fits) for such porosity was 0.3, and the confidence interval (CI) for a 95% prediction was 2.92% and 4.88%. The SE fit for Brinell hardness was 20, and the 95% prediction CI was 620.8 to 754.1 MPa.
- Our experimental design successfully identified the optimal processing parameters for manufacturing nanoparticle-reinforced fillers. Additionally, we developed a multi-objective model to predict the future behavior of the material for the three manufacturing factors. Moreover, one can conclude that stirring speed, stirring time, and NbB2 nanoparticle percent significantly influence the Brinell hardness of the weld.
Author Contributions
Conceptualization, A.F.C.-H. and O.M.S.; methodology, A.F.C.-H.; software, A.F.C.-H.; validation, O.M.S., A.F.C.-H. and N.A.B.-L.; formal analysis, A.F.C.-H., C.V.R. and J.D.D.J.-S.; investigation, A.F.C.-H., N.A.B.-L., C.V.R. and J.D.D.J.-S.; resources, O.M.S., D.F.-A. and A.F.C.-H.; data curation, A.F.C.-H., C.V.R. and J.D.D.J.-S.; writing—original draft preparation, A.F.C.-H., N.A.B.-L. and L.I.F.-C.; writing—review and editing, O.M.S., A.F.C.-H., N.A.B.-L. and L.I.F.-C.; visualization, A.F.C.-H., N.A.B.-L. and L.I.F.-C.; supervision, O.M.S.; project administration, O.M.S.; funding acquisition, O.M.S. All authors have read and agreed to the published version of the manuscript.
Funding
This material is based upon work supported by the National Science Foundation under Grants 1345156 (CREST program) and 1531755 (MRI program). Lastly, this research was partly funded by NASA Cooperative Agreement 80NSSC20M0052 (PR Space Grant) and UPRM Ph.D. Enrichment Program (G-2018-11025).
Data Availability Statement
The data that support the findings of this study are available upon request from the corresponding author.
Acknowledgments
The authors would like to thank Boris Renteria and Carlos Rivera, who assisted in the technical support of this project, as well as all the undergraduate students in O. M. Suárez’s group. Further assistance by Ulpiano Almodovar, a Mechanical Engineering technician, upon welding is greatly appreciated. The Puerto Rico Space Grant Consortium funded by NASA Cooperative Agreement 80NSSC20M0052, and the Alfred P. Sloan Foundation supported co-author Norman Burgos through the UPRM Ph.D. Enrichment Program (G-2018-11025).
Conflicts of Interest
The authors declare no conflicts of interest.
References
- Research and Markets. Global Aluminum Welding Wires Market by Type (Al-Si Alloy Welding Wire, Aluminum Magnesium Alloy Welding Wire, Pure Aluminum Welding Wire), End-Use (Aerospace & Defense, Automotive & Transportation, Marine)—Forecast 2024–2030; Research and Markets: Dublin, Ireland, 2024; Available online: https://www.researchandmarkets.com/report/aluminum-welding-wires (accessed on 6 February 2024).
- Shen, Z.; Wu, Z.; Wang, T.; Jia, T.; Liu, C. Research on Technology of 7075 Aluminum Alloy Processed by Variable Polarity TIG Additive Manufacturing Utilizing Nanoparticle-Reinforced Welding Wire with TiB2. Crystals 2023, 13, 399. [Google Scholar] [CrossRef]
- Wang, J.J.; Lin, T.; Chen, S.B. Obtaining weld pool vision information during aluminium alloy TIG welding. Int. J. Adv. Manuf. Technol. 2005, 26, 219–227. [Google Scholar] [CrossRef]
- Ahmed, M.M.Z.; El-Sayed Seleman, M.M.; Fydrych, D.; Çam, G. Friction Stir Welding of Aluminum in the Aerospace Industry: The Current Progress and State-of-the-Art Review. Materials 2023, 16, 2971. [Google Scholar] [CrossRef]
- Kumar, P.; Arif, A.; Prasad, A.C.V.S.; Danajah, P.; Singh, A.K.; Patro, M.; Kishore, K.S.; Murugan, M. Study of Welding process parameter in TIG joining of Aluminum Alloy (6061). Mater. Today Proc. 2021, 47, 4020–4025. [Google Scholar] [CrossRef]
- Florián-Algarín, D.; Padilla, A.; López, N.N.; Suárez, O.M. Fabrication of aluminum wires treated with nanocomposite pellets. Sci. Eng. Compos. Mater. 2014, 22, 485–490. [Google Scholar] [CrossRef]
- Gadallah, E.A.; El Aal, M.I.; Mohamed, A.Y.; El-Fahhar, H.H. Effects of filler on the microstructure and corrosion of similar and dissimilar gas inert tungsten arc welding aluminum alloys joints. Sci. Rep. 2023, 13, 19011. [Google Scholar] [CrossRef] [PubMed]
- Zhu, Q.; Yu, H.; Zhang, J.; Li, M.; Hu, X. Experimental study on Tig welding properties of 6061 and 7003 aluminum Alloys. IOP Conf. Ser. Earth Environ. Sci. 2021, 621, 012060. [Google Scholar] [CrossRef]
- Ramezanalizadeh, H. Fabrication and characterization of an Al-based nanocomposite with high specific strength and good elongation using large amount CMA nanoparticles. J. Alloys Compd. 2020, 822, 153667. [Google Scholar] [CrossRef]
- Florián-Algarín, D.; Li, X.; Choi, H.; Suárez, O.M. Study of the Effect of the A206/1.0 wt. % γAl2O3 Nanocomposites Content on the Portevin-Le Chatelier Phenomenon in Al/0.5 wt. % Mg Alloys. J. Compos. Sci. 2021, 5, 163. [Google Scholar] [CrossRef]
- Barajas-Valdes, U.; Suárez, O.M. Morphological and Structural Characterization of Magnetron-Sputtered Aluminum and Aluminum-Boron Thin Films. Crystals 2021, 11, 492. [Google Scholar] [CrossRef]
- Barajas-Valdes, U.; Suárez, O.M. Nanomechanical properties of thin films manufactured via magnetron sputtering from pure aluminum and aluminum-boron targets. Thin Solid Films 2020, 693, 137670. [Google Scholar] [CrossRef]
- Florián-Algarín, D.; Marrero-García, M.; Martínez-Santos, J.J.; Montejo Valencia, L.; Suárez, O.M. Al/Niobium Diboride Nanocomposite’s Effect on the Portevin-Le Chatelier Phenomenon in Al-Mg Alloys. J. Compos. Sci. 2019, 3, 70. [Google Scholar] [CrossRef]
- Florián-Algarín, D.; Marrero, R.; Li, X.; Choi, H.; Suárez, O.M. Strengthening of aluminum wires treated with A206/Alumina Nanocomposites. Materials 2018, 11, 413. [Google Scholar] [CrossRef] [PubMed]
- Florián-Algarín, D.; Marrero, R.; Padilla, A.; Suárez, O.M. Strengthening of Al and Al-Mg alloy wires by melt inoculation with Al/MgB2. J. Mech. Behav. Mater. 2015, 24, 207–212. [Google Scholar] [CrossRef]
- Florián-Algarín, D.; Ramos-Morales, A.; Marrero-García, M.; Suárez, O.M. Study of aluminum wires treated with MoB2 nanoparticles. J. Compos. Sci. 2018, 2, 50. [Google Scholar] [CrossRef]
- Liu, Z.; Xiao, B.; Wang, W.; Ma, Z.Y. Tensile Strength and Electrical Conductivity of Carbon Nanotube Reinforced Aluminum Matrix Composites Fabricated by Powder Metallurgy Combined with Friction Stir Processing. J. Mater. Sci. Technol. 2014, 30, 649–655. [Google Scholar] [CrossRef]
- Chidambaram, P.S.; Srinivasan, R.; Ramamoorthi, V. Optimization of pulsed current TIG welding parameters on Al-SiC metal matrix composite to achieve maximum bending strength. Adv. Nat. Appl. Sci. 2017, 11, 416–422. [Google Scholar]
- Fattahi, M.; Gholami, A.R.; Eynalvandpour, A.; Ahmadi, E.; Fattahi, Y.; Akhavan, S. Improved microstructure and mechanical properties in gas tungsten arc welded aluminum joints by using graphene nanosheets/aluminum composite filler wires. Micron 2014, 64, 20–27. [Google Scholar] [CrossRef] [PubMed]
- Montgomery, D.C. Design and Analysis of Experiments, 10th ed.; Wiley Global Education: Hoboken, NJ, USA, 2020; pp. 408–453. [Google Scholar]
- Li, Y.; Li, Q.; Liu, W.; Shu, G. Effect of Ti content and stirring time on microstructure and mechanical behavior of Al-B4C composites. J. Alloys Compd. 2016, 684, 496–503. [Google Scholar] [CrossRef]
- De Castro, C.L.; Mitchell, B.S. Nanoparticles from Mechanical Attrition. In Synthesis, Functionalization and Surface Treatment of Nanoparticles, 1st ed.; American Scientific Publishers: Stevenson Ranch, CA, USA, 2002; pp. 1–15. [Google Scholar]
- Cullity, B.D.; Stock, S.R. Elements of X-ray Diffraction, 3rd ed.; Pearson: London, UK, 2014; pp. 191–270. [Google Scholar]
- Suárez, O.M.; Vazquez, J.; Reyes-Russi, L. Synthesis and characterization of mechanically alloyed Al/AlxMg1−xB2 composites. Sci. Eng. Compos. Mater. 2009, 16, 267–276. [Google Scholar] [CrossRef]
- American Welding Society. Specification for Bare Aluminum and Aluminum-Alloy Welding Electrodes and Rods, AWS A5.10/A5.10M:2021; American Welding Society: Miami, FL, USA, 2021. [Google Scholar]
- Varshney, D.; Kumar, K. Application and Use of Different Aluminium Alloys with Respect to Workability, Strength, and Welding Parameter Optimization. Ain Shams Eng. J. 2021, 12, 1143–1152. [Google Scholar] [CrossRef]
- ASTM E10-18; Standard Test Method for Brinell Hardness of Metallic Materials. ASTM International: West Conshohocken, PA, USA, 2018.
- ASTM B647-10 (2016); Standard Test Method for Indentation Hardness of Aluminum Alloys by Means of a Webster Hardness Gage. ASTM International: West Conshohocken, PA, USA, 2016.
- Osborne, J.W. Best Practices in Data Cleaning, 1st ed.; Sage Publications: Los Angeles, CA, USA, 2013; pp. 169–188. [Google Scholar]
- Anderson-Cook, C.M.; Myers, R.H.; Montgomery, D.C. Response Surface Methodology: Process and Product Optimization Using Designed Experiments, 4th ed.; John Wiley & Sons: Hoboken, NJ, USA, 2016; pp. 543–650. [Google Scholar]
- Singh, A.; Kumar, V.; Grover, N. Effect of process parameters on friction stir welding of aluminium alloy AA6082-T6 with an interlayer using response surface methodology. Eng. Res. Express 2023, 5, 045047. [Google Scholar] [CrossRef]
- Raei, M.; Panjepour, M.; Meratian, M. Effect of stirring speed and time on microstructure and mechanical properties of cast Al-Ti-Zr-B4C composite produced by stir casting. Russ. J. Non-Ferrous Met. 2016, 57, 347–360. [Google Scholar] [CrossRef]
- Senapati, A.K.; Panda, S.S.; Dutta, B.K.; Mishra, S. Effect of Stirring Speed During Casting on Mechanical Properties of Al-Si Based MMCs. In Intelligent Manufacturing and Energy Sustainability; Reddy, A., Marla, D., Simic, M., Favorskaya, M.N., Satapathy, S.C., Eds.; Springer: Singapore, 2020; pp. 703–710. [Google Scholar]
- Moses, J.J.; Dinaharan, I.; Sekhar, S.J. Prediction of influence of process parameters on tensile strength of AA6061/TiC aluminum matrix composites produced using stir casting. Trans. Nonferrous Met. Soc. China 2016, 26, 1498–1511. [Google Scholar] [CrossRef]
- Annigeri, U.K.; Veeresh Kumar, G.B. Method of stir casting of aluminum metal matrix composites: A review. Mater. Today Proc. 2017, 4, 1140–1146. [Google Scholar] [CrossRef]

Disclaimer/Publisher’s Note: The statements, opinions and data contained in all publications are solely those of the individual author(s) and contributor(s) and not of MDPI and/or the editor(s). MDPI and/or the editor(s) disclaim responsibility for any injury to people or property resulting from any ideas, methods, instructions or products referred to in the content. |
© 2024 by the authors. Licensee MDPI, Basel, Switzerland. This article is an open access article distributed under the terms and conditions of the Creative Commons Attribution (CC BY) license (https://creativecommons.org/licenses/by/4.0/).