Abstract
Cement-based thermoelectric materials are gaining popularity among materials scientists due to their robust mechanical characteristics and suitability for thermal energy harvesting in building applications. However, despite advancements in the development of these materials, a significant knowledge gap persists regarding their mechanical characterisation. This research aimed to enhance the thermoelectric performance of cement composites through the incorporation of graphene oxide (GO) and manganese dioxide (MnO2), while ensuring adequate compressive strength was maintained. An experimental investigation was conducted to simultaneously assess both properties of cement composites using identical specimens. Additionally, microstructural analysis of the samples was performed to further understand the integrated development of these two properties. To evaluate the integrative properties, a Pareto analysis was performed to identify the Pareto-optimal solutions for specific applications. Additionally, a new index, termed the Thermoelectric Strength Index (TSI), was developed to compare materials in applications where both thermoelectric efficiency and mechanical robustness are important. The findings indicated that while both GO and MnO2 enhanced the thermoelectric properties of cement, their reactions with the cement phases produced distinct relationships with compressive strength, especially when GO and MnO2 were added together. The TSI demonstrated that MnO2 was superior for simultaneously enhancing mechanical strength and thermoelectric performance, with the 7.5 wt.% formulation yielding the best results. This study demonstrates the complex interrelationship between the mechanical strength and thermoelectric properties of the investigated fillers, underscoring the necessity for a holistic approach in the development of thermoelectric cement composites.
1. Introduction
Due to rising greenhouse gas emissions and a warming climate, there is growing interest in renewable energy technologies that harvest solar energy, including light, heat, waves, and wind. Over 60% of urban surfaces are occupied by pavements and roofs that are generally covered by grey infrastructures (engineering structures or measures constructed by concrete or metals) [1]. In cities, infrastructure absorbs and re-emits the sun’s heat, resulting in a warmer-than-average environment that can easily reach 4–5 °C and may exceed 7–8 °C in many cases [2,3,4]. This phenomenon is referred to as the urban heat island effect. Also, to maintain the temperature inside buildings, a significant amount of energy is consumed in the cooling systems [3]. This variation in the temperature inside and outside of buildings results in a thermal gradient within building materials and leads to heat loss through convection [5].
The thermoelectric (TE) effect describes the generation of energy when there is a thermal gradient. There are thermoelectric modules in the market utilising the TE effect and developing heat from electricity and electricity by heat. These modules are commonly made of Bismuth Telluride (Bi2Te3) and Titanium Zirconate (TiZrO3), which are toxic and expensive to use on a large scale [6]. Also, current TE modules available on the market are targeted at smaller applications, like those of computers, or high temperature devices such as automotive or industrial cooling systems. Due to their high costs and limited material stability and durability, they are unsuitable for large-scale use in buildings [6,7]. Furthermore, even if the modules were embedded into buildings, incorporating them would compromise the overall structural integrity of the concrete [8].
Although cement-based materials have inherently poor electrical conductivity and TE properties, research into cement composites with conductive fillers began in the late 1990s, notably with Sun et al. [9] discovering that the addition of carbon fibre increases the thermoelectric potential of cement. This spurred further investigations into the TE properties of cement with carbon fibre and steel fibre fillers, which even led to the development of cement-based thermocouples [10,11,12]. However, much of this research focused on utilising concrete itself as a sensor, with thermoelectric properties playing an important role for engineering applications such as non-destructive health monitoring and temperature sensing. With the abundance of concrete in urban settings and with building surface temperatures reaching up to 65 °C compared to the inside temperatures that must be kept at 24–25 °C, concrete presents an ideal substrate for TE energy harvesting [13].
The growing green energy transition has sparked a new surge in studies on TE cement-based composite materials. Researchers are increasingly utilising conductive carbon-based materials and transition metal oxide-based nanomaterials to enhance the TE properties of cement. The addition of fine particles, up to 125 microns in size, can improve the mechanical properties of concrete through several mechanisms. These include creating compactness by filling the intergranular voids between cement particles, enhancing hydration by acting as nucleation sites (becoming an integrated part of the cement paste), and reacting with a cement component, like calcium hydroxide, forming cement gel [14]. In contrast, ionic, electronic, and hole conduction all have an effect on the TE properties of concrete [15,16].
The percolation phenomenon occurs when a high concentration of a conductive substance in a composite creates a network of fibres, allowing conduction to occur through this network, rather than the cement itself [9]. If the functional filler does not reach the percolation threshold required, conduction then occurs through the pores of the cement matrix rather than a conductive network of fibres [16]. While extensive research has explored the potential of fillers to increase the TE properties in cement paste, very little research has investigated the mechanical properties in parallel. Recognising this gap, this paper focuses on exploring the practicality of thermoelectric cement composites in a structural engineering setting. This will be achieved by experimentally testing cement composites with varying graphene oxide (GO) and manganese dioxide (MnO2) additive concentrations.
Graphene, first isolated in 2004, is available in various forms, including graphene nanoplatelets (GNPs), graphene oxide (GO) and reduced graphene oxide (rGO). Research has demonstrated that incorporating GNP into cement composites at different concentrations can significantly enhance electrical conductivity, reaching a maximum of 1620 S/m for the 20 wt.% composite. The Seebeck coefficient remained nearly constant across all composites, with a peak value of 34 µV/°C at 70 °C for the 15 wt.% composite [17]. Further investigation revealed that combining Zinc Oxide (ZnO) with GNP resulted in 141 µV/°C at 70 °C for the 10 wt.% ZnO and 10% GNP composite [18]. In another study, rGO was used to enhance the thermoelectric properties of cement composite and a reading of 1800 μV/°C at ΔT = 56 °C was obtained by adding as little as 0.15 wt.% rGO [19]. In this test, a higher Seebeck coefficient was achieved when the sample was tested with free water. However, there are conflicting results in the literature regarding whether the thermoelectric properties of cement-based composites are significantly influenced by the free water in the cement matrix. Early research indicated that ion movement played a small, role, if any, in the Seebeck effect [20]. More recently, studies have shown that the presence of free water in the cement matrix significantly impacts the thermoelectric properties of cement-based composites due to the thermal diffusion of free-moving ions like Ca2+, Na+, K+, and OH− within the pore solution, which is known as the ionic thermoelectric effect [19].
More recent studies have identified metal oxides as a cost-effective additive that significantly enhances the Seebeck coefficient of cement composites when used as conductive fillers. Fe2O3, Bi2O3, ZnO, and MnO2 are some of the transition metal oxides that have been added to cement to enhance its thermoelectric properties [21,22,23]. Recent research shows that MnO2 can be used as a supplementary material to achieve a high TE potential, even at lower concentrations [22,24]. In one study, synthesised MnO2 powder with a nanorod structure (diameter of approximately 50 nm, length of up to 1.4 μm) was replaced with cement at 5 wt.% and a Seebeck coefficient of 3085 μV/°C was achieved [25]. In another study by Ji et al. [22], a hybrid concrete composite incorporating MnO2 and carbon fibre (with a diameter of 8 μm and a length of 4–6 mm) was examined. This composite achieved a remarkable Seebeck coefficient of 2880 µV/°C−1 with just 0.8 wt.% of synthesised MnO2/carbon fibre relative to the cement content. This value was 100 times higher than that of pure carbon fibre-reinforced concrete, indicating that the substantial improvement was largely attributable to the inclusion of the metal oxide. However, in another study by a different researcher, MnO2 was combined with Surface Enhanced Flake Graphite (SEFG), and the results showed that at 75 °C, a composite containing 5 wt.% MnO2 (average diameter of 50 nm) and 10 wt.% SEFG (specific surface area of 27 m2/g and a size of 8 μm) achieved a Seebeck coefficient of only 16.74 μV/°C [24]. It is important to note that the above testing results were obtained using different mixtures and different preparation methods, which could all affect the measured properties.
It is clear, from the scale of the research, that considerably higher thermoelectric properties have been achieved with cement composites. However, current immature technology and low thermoelectric conversion efficiency have limited the large-scale application of cement-based composites. Current research is concentrated on identifying materials with the highest Seebeck voltage or figure of merit, with less attention given to the mechanical properties of the cement composite, as well as the sample preparation method. Only Choi et al. and J. Wei et al. [26,27] measured both the compressive strength and thermoelectric properties of cement composite in a single study. However, because the testing procedures for mechanical and thermoelectric properties differed greatly, these results were obtained on separate samples. Consequently, in addition to utilising GO and MnO2 in the same thermoelectric testing environment, this study expanded testing to examine the mechanical properties of the cement composite, making it appropriate for structural applications outside of the lab. First, cement composite samples were tested for their Seebeck coefficient, which indicated the magnitude of the voltage output as a result of a temperature difference across the material. Then, each of the samples was tested for the compressive strength to determine their suitability for use as a construction material. Finally, the microstructure of the two composites was studied for further understanding of the material. The objective of this study was to identify a thermoelectric cement composite that maximised its thermoelectric potential while maintaining structural integrity.
2. Methodology
2.1. Material
Portland cement was used in this study to serve as the base of the cement samples. The properties and chemical composition of the Portland cement are shown in Table 1.

Table 1.
Chemical composition of Portland cement.
The standard filler concentration of steel fibres in cement used in the preparation of ultra-high-performance concrete (UHPC) typically range from 1 wt.% to 1.5 wt.%, as concentrations exceeding this range can lead to a reduction in strength [28]. If the filler is used as a supplementary cementitious material, such as fly ash or silica fume, the concentration can reach up to 30 wt.% and 25 wt.%, respectively, with optimal performance typically achieved at 10 wt.% and 15 wt.%, respectively [29,30,31].
Studies have found that incorporating GO into cement at concentrations of up to 0.08 wt.% can significantly increase compressive strength; however, the addition of a polycarboxylic ether-based superplasticiser (PCE) is essential to maintain workability [32,33]. In other studies, compressive strength was increased by GO concentrations up to 0.02–0.03; however, due to inadequate dispersion, compressive strength decreased as GO concentrations increased beyond this limit [34,35]. To the best of the author’s knowledge, no prior studies have investigated the use of graphene oxide (GO) in thermoelectric applications. In contrast, reduced graphene oxide (rGO) has been employed in such applications at relatively low concentrations, typically ranging from 0 to 0.15 wt.%, whereas graphene nanoplatelets (GNPs) are incorporated at significantly higher concentrations, generally between 5 and 20 wt.% [17,19]. This is due to the fact that rGO has a higher surface area (approximately 137.2 m2/g) than GNPs (approximately 6.5 m2/g) [36]. It is also an expensive carbon compound in large quantities, and from an economic standpoint, using large amounts of carbon-based materials is hence not feasible.
A study evaluating the mechanical properties of anodic MnO2 nanoparticles found that increasing the filler percentage from 0%, 5%, and 10% gradually increased the compressive strength, especially with a 0.4 water–cement (w/c) ratio. In higher w/c ratios (0.45 and 0.50), the addition of MnO2 recorded a reduced strength [37]. In previous studies related to the thermoelectric properties of MnO2 cement composites, up to 5% MnO2 was investigated [24]. In the study by X. Liu et al. [24], in addition to MnO2, 10% of surface-enhanced flake graphite was used, totalling 15% filler. There are also other studies which have used metal oxides at up to 15% of the weight of cement [17,18,38]. At present, MnO2 is significantly less expensive, costing more than 10 times less compared to the graphene-based materials, and hence usages of up to 10% are economically justifiable.
In this study, GO and MnO2 were introduced into the cement mixture at three different ratios. Graphene oxide was added in amounts of 0.025%, 0.05%, and 0.075% of the cement mass (wt.%). To achieve the required percentages, commercially available GO in a water dispersion with a concentration of 4 g/L was used and diluted. Chem-supply Pty Ltd. (Gillman, Australia) supplied the MnO2 in the form of brown–black powder. The powder contained more than 74% manganese dioxide, 0–15% cryptomelane, 0–7% geothite, and 0–4% quartz (crystalline silica). The powder was a chemically synthesised form of manganese dioxide (MnO2) designed for use in laboratory and industrial chemical processes, including depolarizers for dry cell batteries, paint, and building materials. The MnO2 used in this study had a specific gravity of 5.026 g/cm3 at 20 °C. This powder was first ultrasonically dispersed in water before being used to make cement composite. This study used three different weight ratios (2.5, 5.0, and 7.5 wt.%) of MnO2. Table 2 shows the composition of materials used in each mixture. To determine the combined effect of GO and MnO2, the highest ratios of each material were combined in a single sample, denoted as “GO 0.075 wt.% + MnO2 7.5 wt.%” in Table 2.
Table 2.
Cement and mortar mixture compositions.
A higher water–cement ratio increases the porosity and overall surface area of the composite and thus promotes charge carrier interaction. It also increases pore connectivity, which aids in electron transfer across the composite, suggesting that a higher water–cement ratio (w/c) is preferable in terms of the thermoelectric properties (Cui & Wei) [39]. In contrast, it is known that increasing w/c has a negative effect on compressive strength; thus, a typical 0.4 water–cement ratio is used in this study.
2.2. Sample Preparation
The dimensions of the mould used to fabricate the composites play a pivotal role in improving the TE properties. This is because the increased distance between electrodes can enhance the temperature gradient (ΔT), which directly increases the thermoelectric voltage () according to the Seebeck effect equation (. However, increasing the distance between electrodes can increase the electrical resistance (R) of the material, which may reduce the power output ) even if the voltage increases [40]. A study by Gandía-Romero et al. [41] determined that a rectangular composite experiences higher and more linear electrical resistance due to the longer distance electrons are required to travel. The optimal distance between electrodes depends on the thermoelectric properties (Seebeck coefficient, thermal conductivity, and electrical conductivity) and the specific application. In most studies which seek to determine the feasibility of different carbon-based additives in enhancing the TE potential of cement composites, a rectangular bar is used [17,22,27]. Several studies have also used cubic-shaped composites, with the most common dimension being 50 × 50 × 50 mm [42,43,44]. In the study by Choi et al. [26], different moulds were used to test for specific properties: a rectangular bar for electrical properties, a coin for thermal conductivity, and a cube to measure compressive strength. Since the feasibility of TE cement-based materials has been extensively tested over the past two decades with promising results, this paper aims to also study the practicality of such materials in the built environment. Hence, in this study, cubic samples were used for both thermoelectric and mechanical property testing.
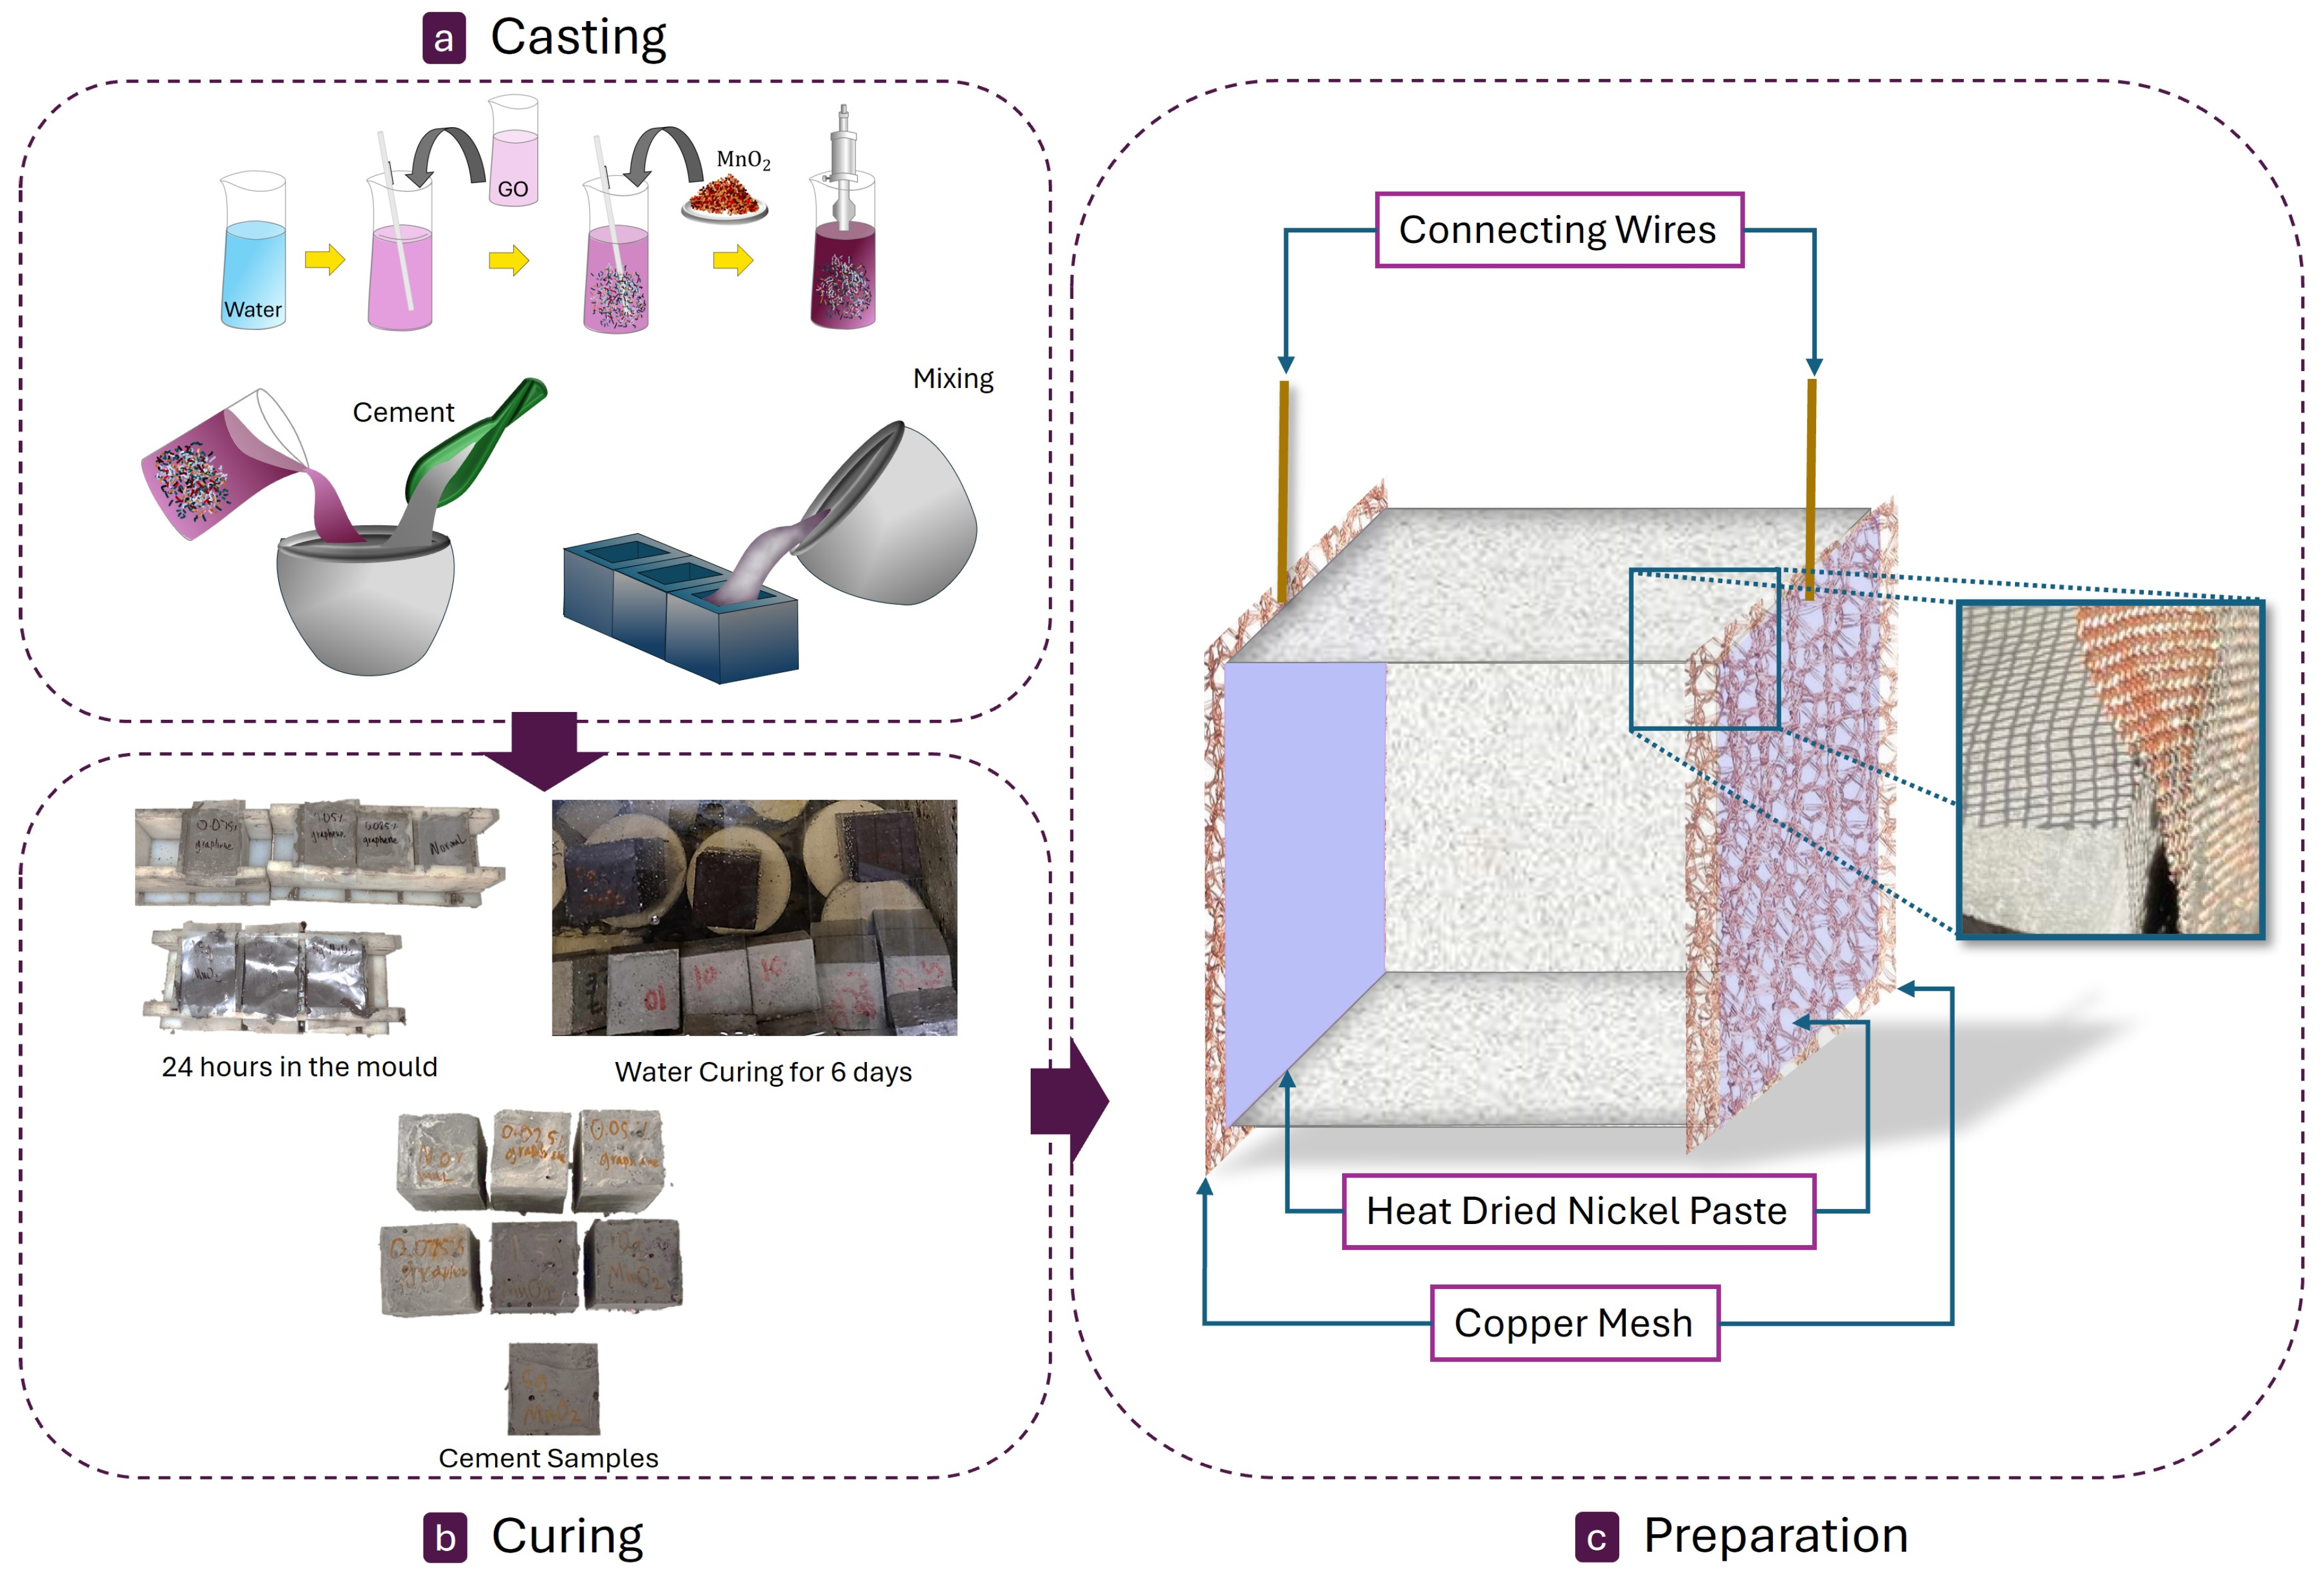
Both GO and MnO2 were pre-dispersed in the rest of the water required for the mix design. To create the aqueous solution, additives and water were combined and mixed at high speed (2000 rpm) for 30 min. To minimise other variables, GO and MnO2 were mixed using the same technique. After all dry materials were mixed with a Polymix mixer at a speed of 600 r/min for 2 min, dispersed water was added. Due to the small sample sizes, the mixer exhibited difficulties in mixing the material sufficiently. To reduce these difficulties, after the initial 2 min of mixing, a spatula was used to hand-mix and re-arrange the materials for easier mixing. Then, the mixture was mixed for another 2 min at a speed of 800 r/min. The prepared mixtures were poured into the moulds and vibrated with a vibrating table for 30 s. All samples were cured for 24 h in the moulds under room temperature conditions. The laboratory storing the cement samples had a room temperature of 21 ± 3 °C. After the initial 24 h, the samples were removed from the moulds and placed in a water curing tank and cured for 6 days. Note that this curing tank was used for other purposes as well, and hence the water had a higher alkalinity value of PH 10. Water curing with higher ion concentration was chosen as it would introduce more ionic thermoelectric properties into the sample, improving readings of the Seebeck coefficient. The process for preparing the samples is illustrated in Figure 1.

Figure 1.
Casting, curing, and preparation stages of the samples.
After 6 days of water curing (a total of 7 days), the samples were removed from the curing tank and dried on paper towels. The two opposite surfaces of specimen were then sanded with 80 and 240 grit aluminium oxide sandpaper to create a scabbled edge for mesh adhesion preparation. Copper mesh was cut to fit the size of the cement blocks, with an extra overhang for testing, and was adhered to the cement sample with high-performance nickel paste, which had a thermal conductivity of 2.6 W/mK. Nickel paste was then exposed to a heat gun for 2 min on each side to solidify and improve adhesion. In the experiment, using an embedded mesh would have required extending the specimen in one direction to accommodate the mesh, then trimming and resizing to produce standard 50 mm cubic samples for compression testing. Hence, an externally applied copper mesh was selected as the preferred option to simplify the preparation process while ensuring compatibility with the testing stages.
2.3. Seebeck Coefficient Testing
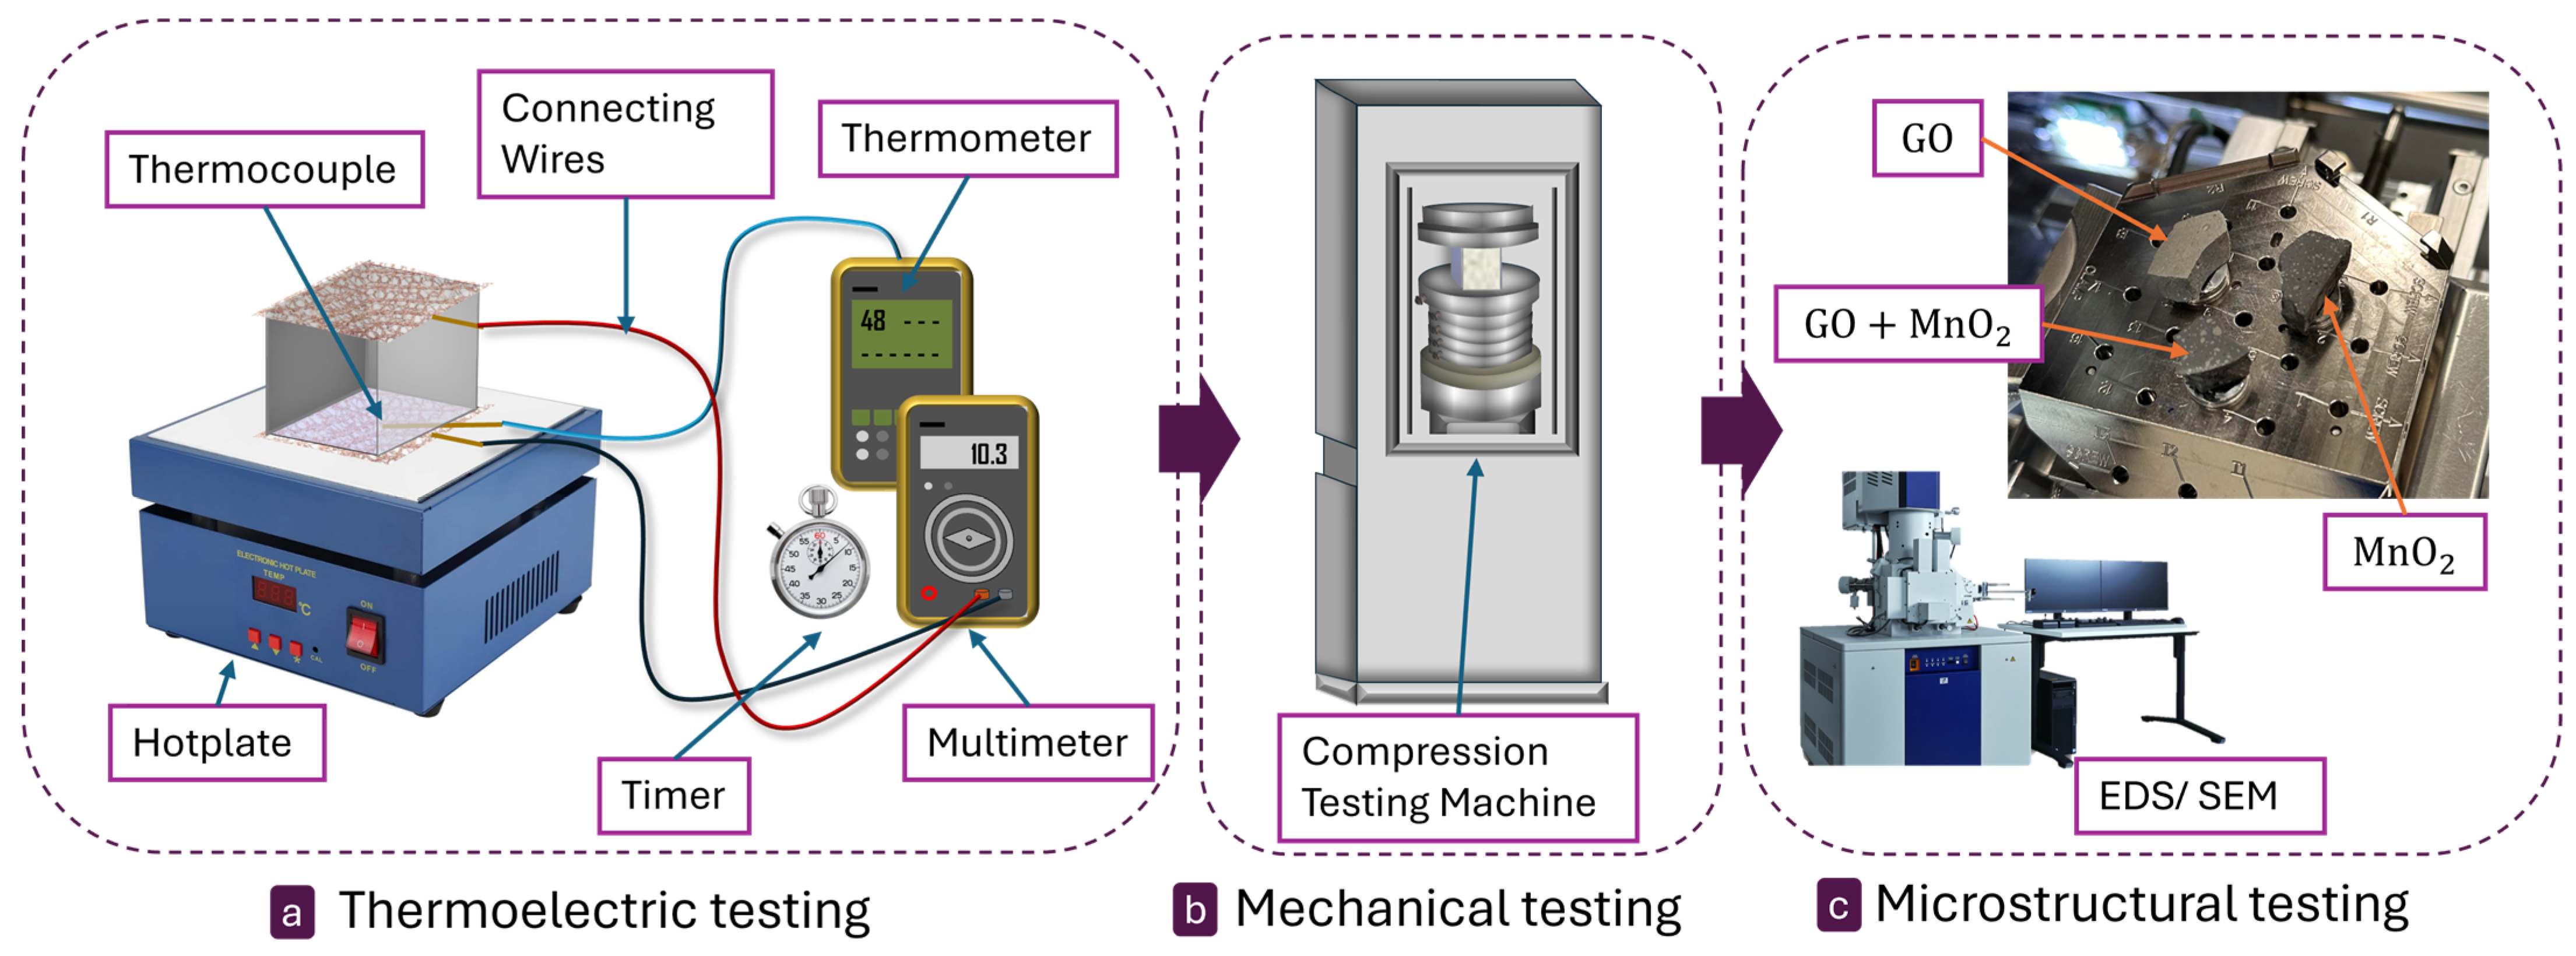
A hotplate with a variable temperature was used to simulate unidirectional heat ranging from room temperature (21 ± 2 °C) to 65 °C. The specimen was placed on the hotplate with one copper mesh side directly in contact with the plate. One K-type thermocouple was used in between the composite samples to measure the real temperature at the surface without depending on the results of the hotplate. Readings from the thermocouple were connected to a 12-channel temperature recorder by Lutron (BTM-4208SD), sourced from Taiwan. A digital multimeter (Micron Q1134A, sourced from Altronics, Perth, Australia) was connected to each copper mesh through connecting wires. Since the measurements were taken from different devices, a timer was used to record the readings. The test setup used for the thermoelectric testing is shown in Figure 2a. Readings were taken every 10 s until the hotplate surface temperature reached 65 °C or more. The hotplate was provided sufficient time to return to room temperature before testing another sample to maintain consistency. These results were used to calculate the Seebeck coefficient of the material. During the experiment, the temperature on one side of the sample was measured with a thermocouple, while the temperature on the other side was not directly measured and was assumed to be room temperature. It was identified that thermal convection from the heated side may have caused the temperature at the opposite end to increase above room temperature over time. However, assuming this end to be at room temperature resulted in a higher calculated thermal gradient and, consequently, a lower Seebeck coefficient than the actual value, which represented a conservative estimate.

Figure 2.
Schematic representation of the three-stage testing sequence, illustrating the detailed setup for each stage.
2.4. Compression Testing
After the completion of the thermoelectric testing, the same samples were further prepared for compression testing. In this way, the need for multiple samples of each proportion to average out the variations in the two separate tests were not needed. Attached copper sheets were first removed from the heat-dried nickel paste and the nickel paste was scraped out. Though the sample could have been tested in the same direction as the thermoelectric test, it was tested in another direction, as removing the nickel paste developed an uneven surface. Compression testing of the samples was carried out 28 days after the initial casting. A Technotest compression machine with a load capacity of 3000 kN, as shown in Figure 2b, was used for compression testing.
2.5. Microstructral Analysis
The surface morphology and elemental composition of the cement-based composites after 28 days of ageing were analysed using Hitachi SU7000, a scanning electron microscope (SEM) sourced from Tokyo, Japan equipped with AZtecOne electron dispersive spectroscopy (EDS) system sourced from Oxford instruments, High Wycombe, UK. Only the GO 0.075 wt.%, MnO2 7.5 wt.%, and GO 0.075 wt.% + MnO2 7.5 wt.% samples were used in these characterisations. The selection of these samples was based on the results of the Seebeck coefficient and compression testing results. These techniques allowed for the observation of the hydration characteristics of the three mixtures within their hydrated matrix. The observation surface of each specimen was polished to eliminate any irregularities that could interfere with the spectroscopy analysis. This was performed by sequentially polishing the surface with sandpaper grits of 120, 200, 400, 800, 1000, 1500, and 2000, followed by diamond 1 µm polishing paper with a compatible 1 µm lubricant. To prevent interference from surface charge accumulation during Scanning Electron Microscopy, each sample surface was then made conductive by applying a 5 nm carbon coating. Specimens prepared for the chemical characterisation are shown in Figure 2c.
Backscattered electron imaging (BSE) in SEM detects electrons that are deflected after elastic collisions with atoms, making it more sensitive to the atomic number of the elements involved in the interaction volume. In this study, BSE imaging was used for qualitative identification, visualisation of microphase distribution, and porosity quantification at each hydration stage, with a working distance of 10 mm, an accelerating voltage of 15 kV, and a beam current of 78 µA. Electron Dispersive Spectroscopy (EDS) imaging allows for the qualitative identification of elemental distribution using the X-rays emitted from elements across a defined planar area. A beam calibration was conducted using polished copper (Cu) to ensure the stability of the current. Chemical elemental maps were obtained using the AZtecOne system, which was equipped with a 100 mm2 X-Max silicon drift detector. The resolution for acquiring the EDS hypermaps was set to 365 × 319, and the scanning time for each location was approximately 30 min, with a dwell time of 100 s. The maps were configured to display the atomic concentration of the specimen. To minimise noise during the data acquisition process, it was essential to optimise the signal at the information level, as shorter acquisition times could result in elevated noise levels. To address this, the binning function was utilised during the map scanning process, combining signals from adjacent points to generate an averaged signal, thereby reducing the overall noise.
3. Results and Discussion
3.1. Thermoelectric Power Generation
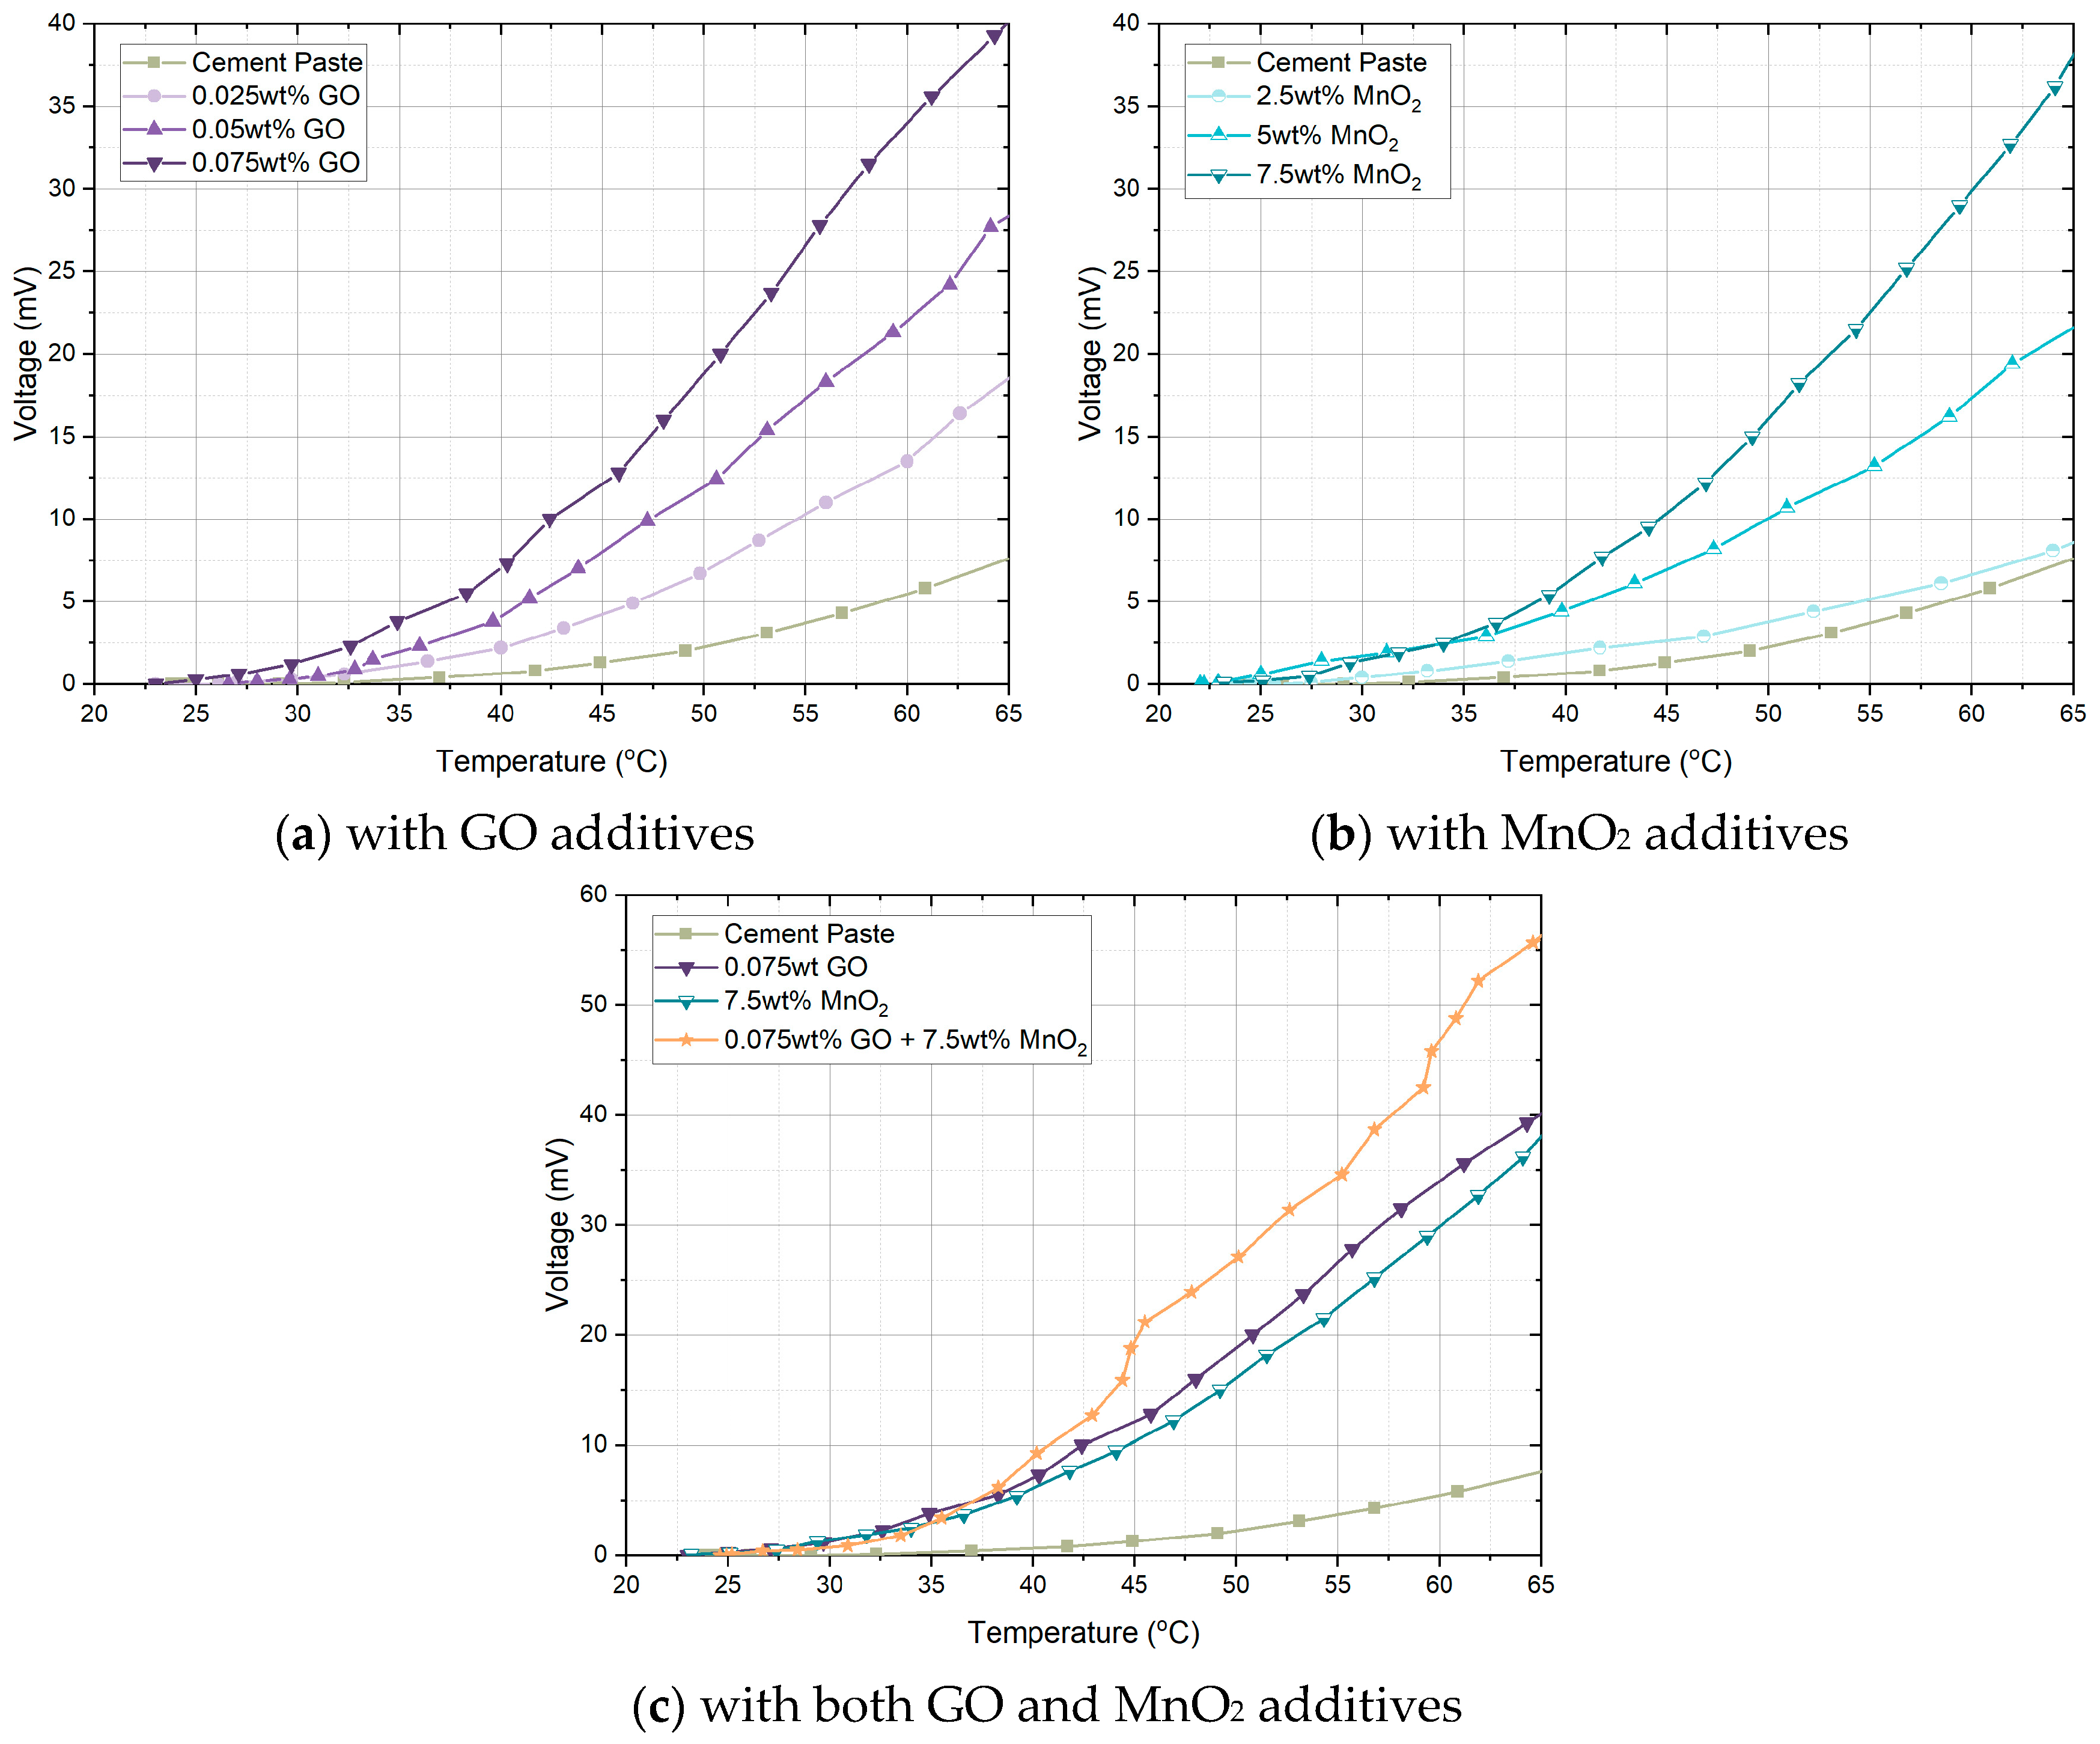
As the first stage of testing, all seven composites underwent testing to measure their ability to generate voltage when supplied with a thermal gradient. Each sample was tested separately at the same room temperature and all thermal and electrical measurements were recorded at given time intervals. The results of the voltage and the temperature at the surface touching the hot plate are illustrated in Figure 3. In every sample, the amount of thermoelectricity generated increased with the increasing temperature gradient. The control sample, which was not dried before testing, was expected to produce a certain amount of thermoelectricity, resulting in a thermoelectric voltage of 7.5 mV at 65 °C.
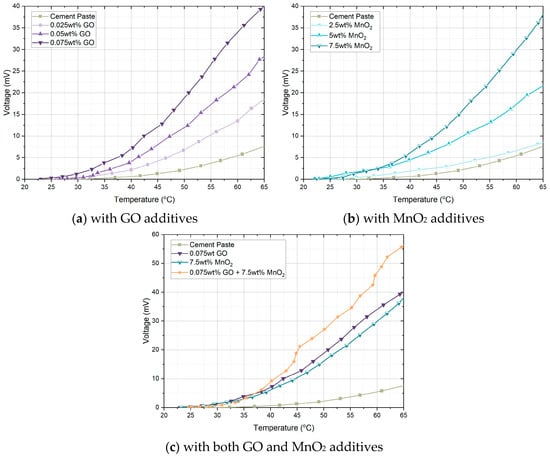
Figure 3.
Thermoelectric voltage of composites.
As shown in Figure 3a, increasing the GO content resulted in a higher voltage at all temperatures. The 0.075 wt.% GO sample generated the highest amount of voltage at 65 °C with a value of 40 mV. As shown in Figure 3b, increasing the MnO2 content also resulted in a higher voltage at all temperatures. The highest voltage of 37 mV was recorded with the 7.5 wt.% replacement of MnO2 with cement. The sample containing both materials (GO 0.075 wt.% and MnO2 7.5 wt.%) achieved the highest thermoelectric voltage of 56 mV at 65 °C, as shown in Figure 3c. More than 7.5 mV is considered to be a usable amount of voltage in IoT-related applications [45]. With GO, MnO2, and GO+MnO2 this was achieved at surface temperatures of 41 °C, 43 °C, and 38 °C, which are common in the surface of concrete that is exposed to the sun during a summer month.
3.2. Seebeck Coefficient
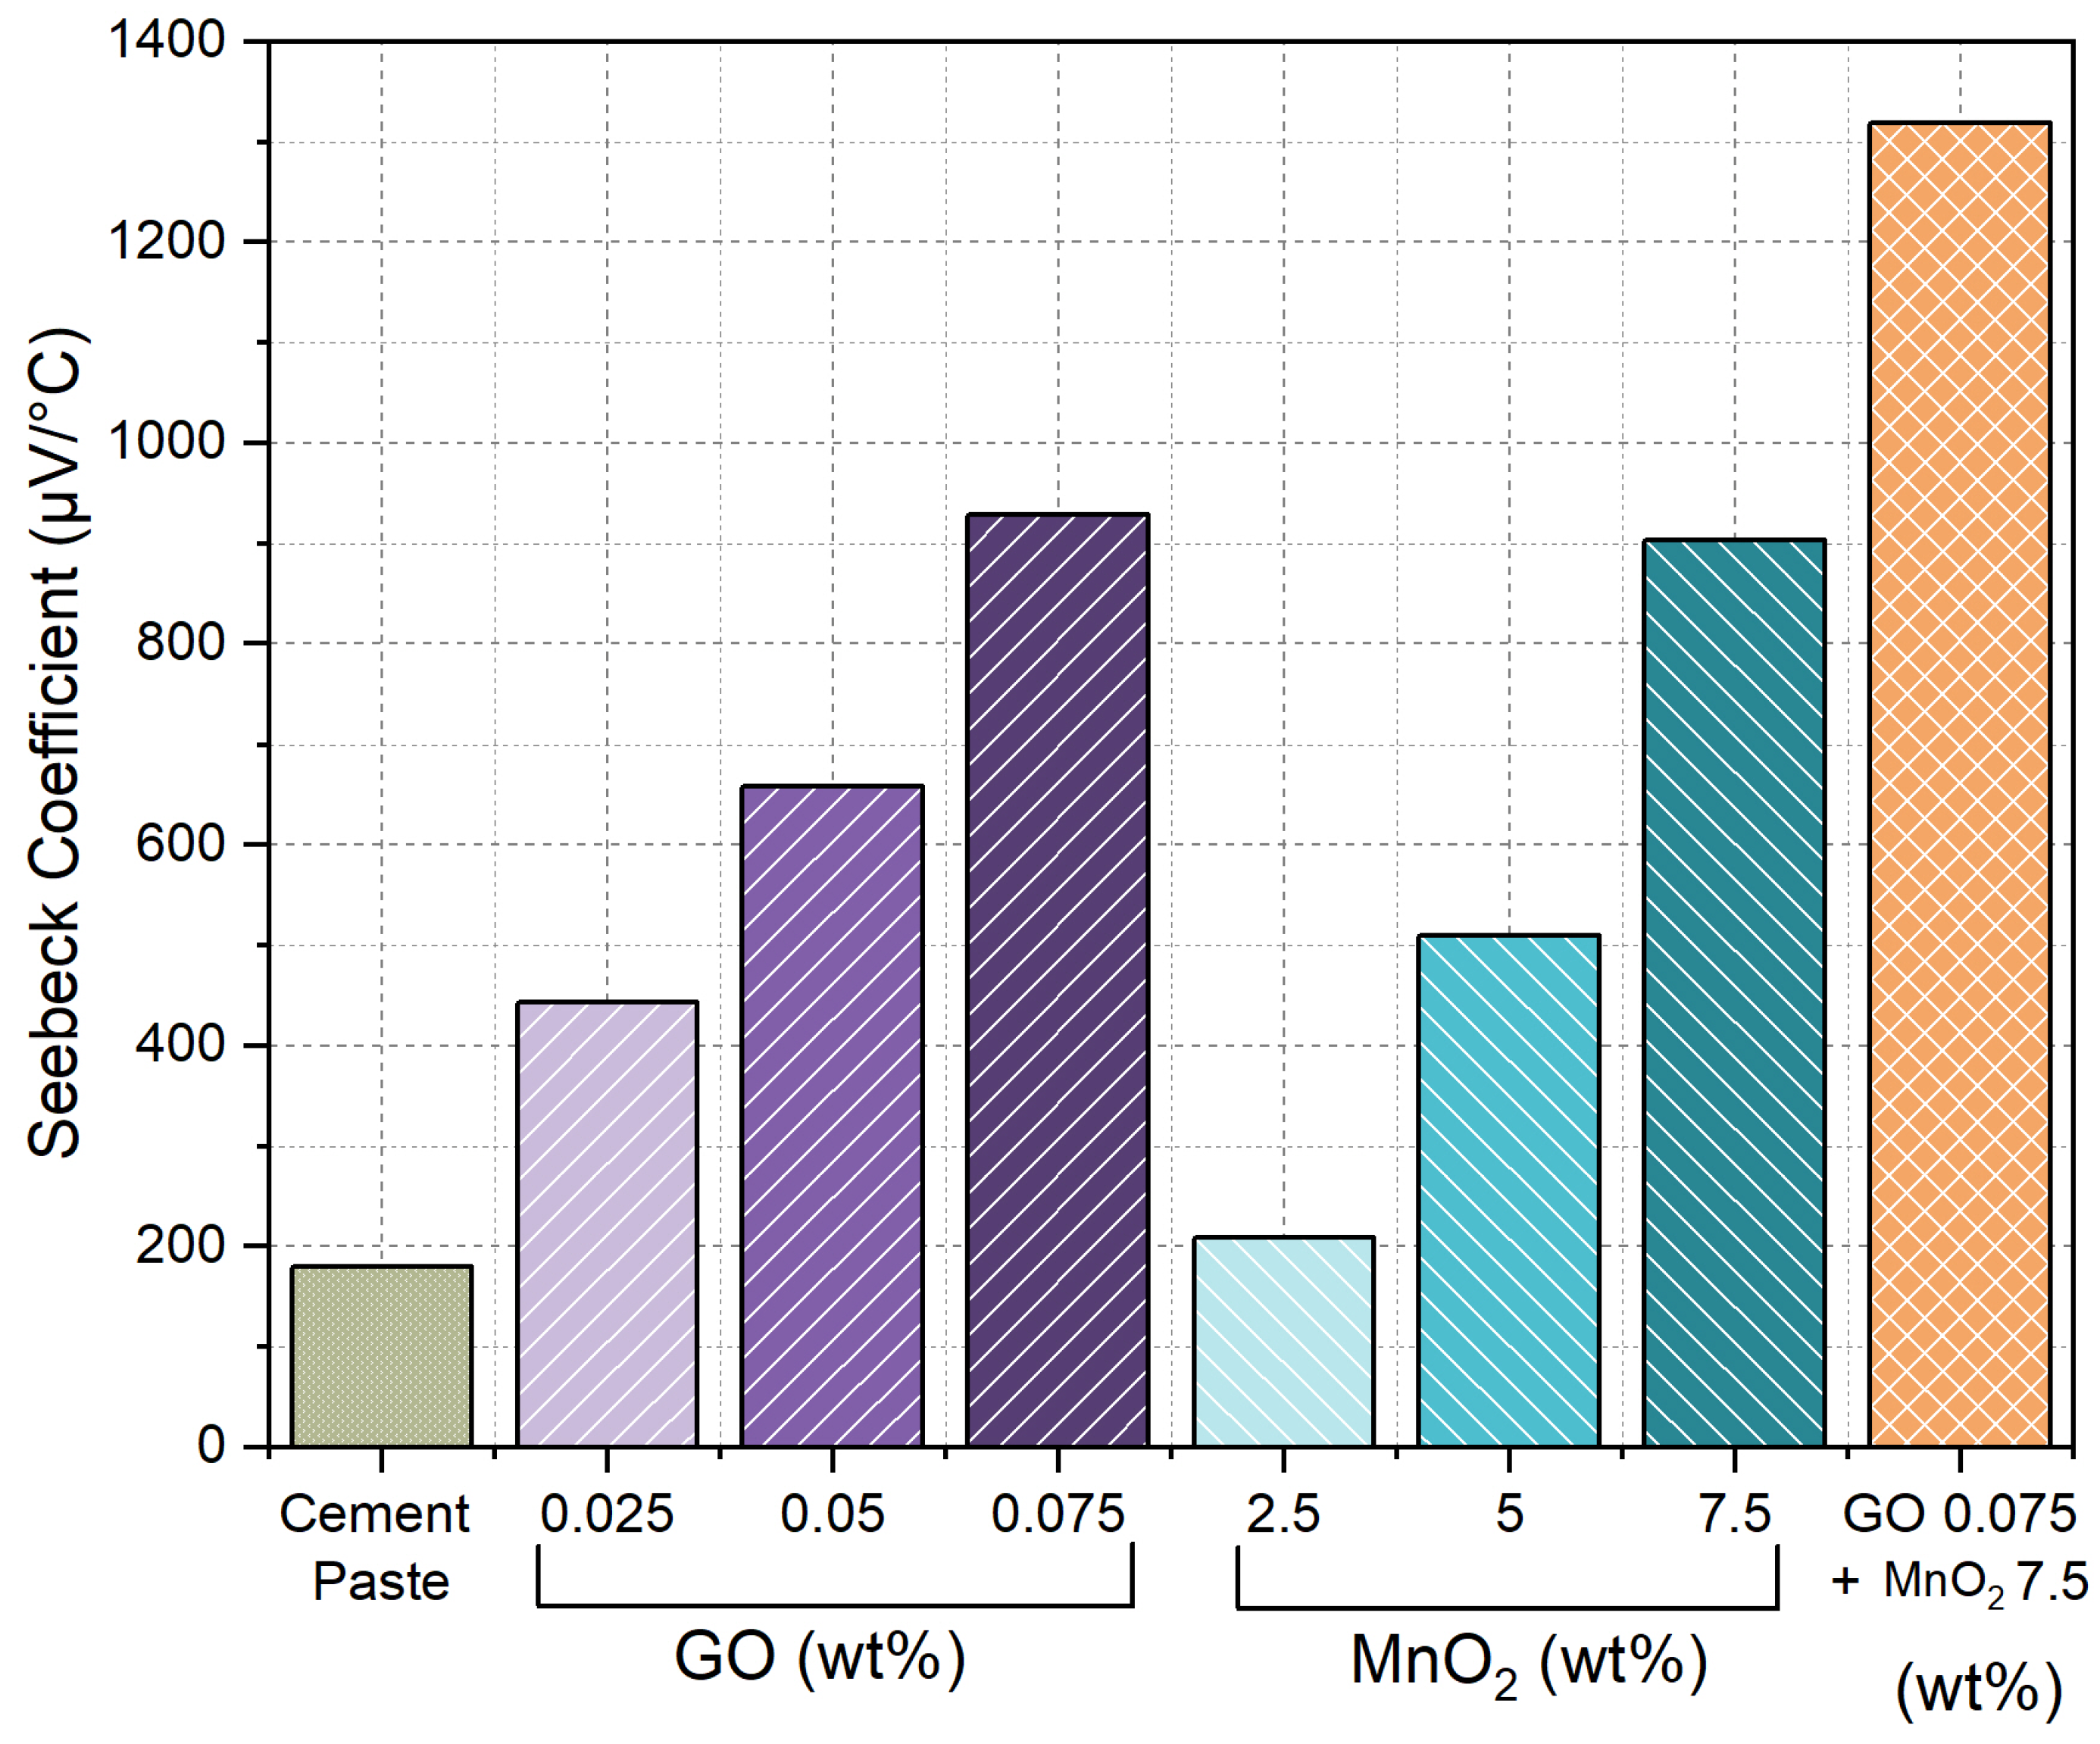
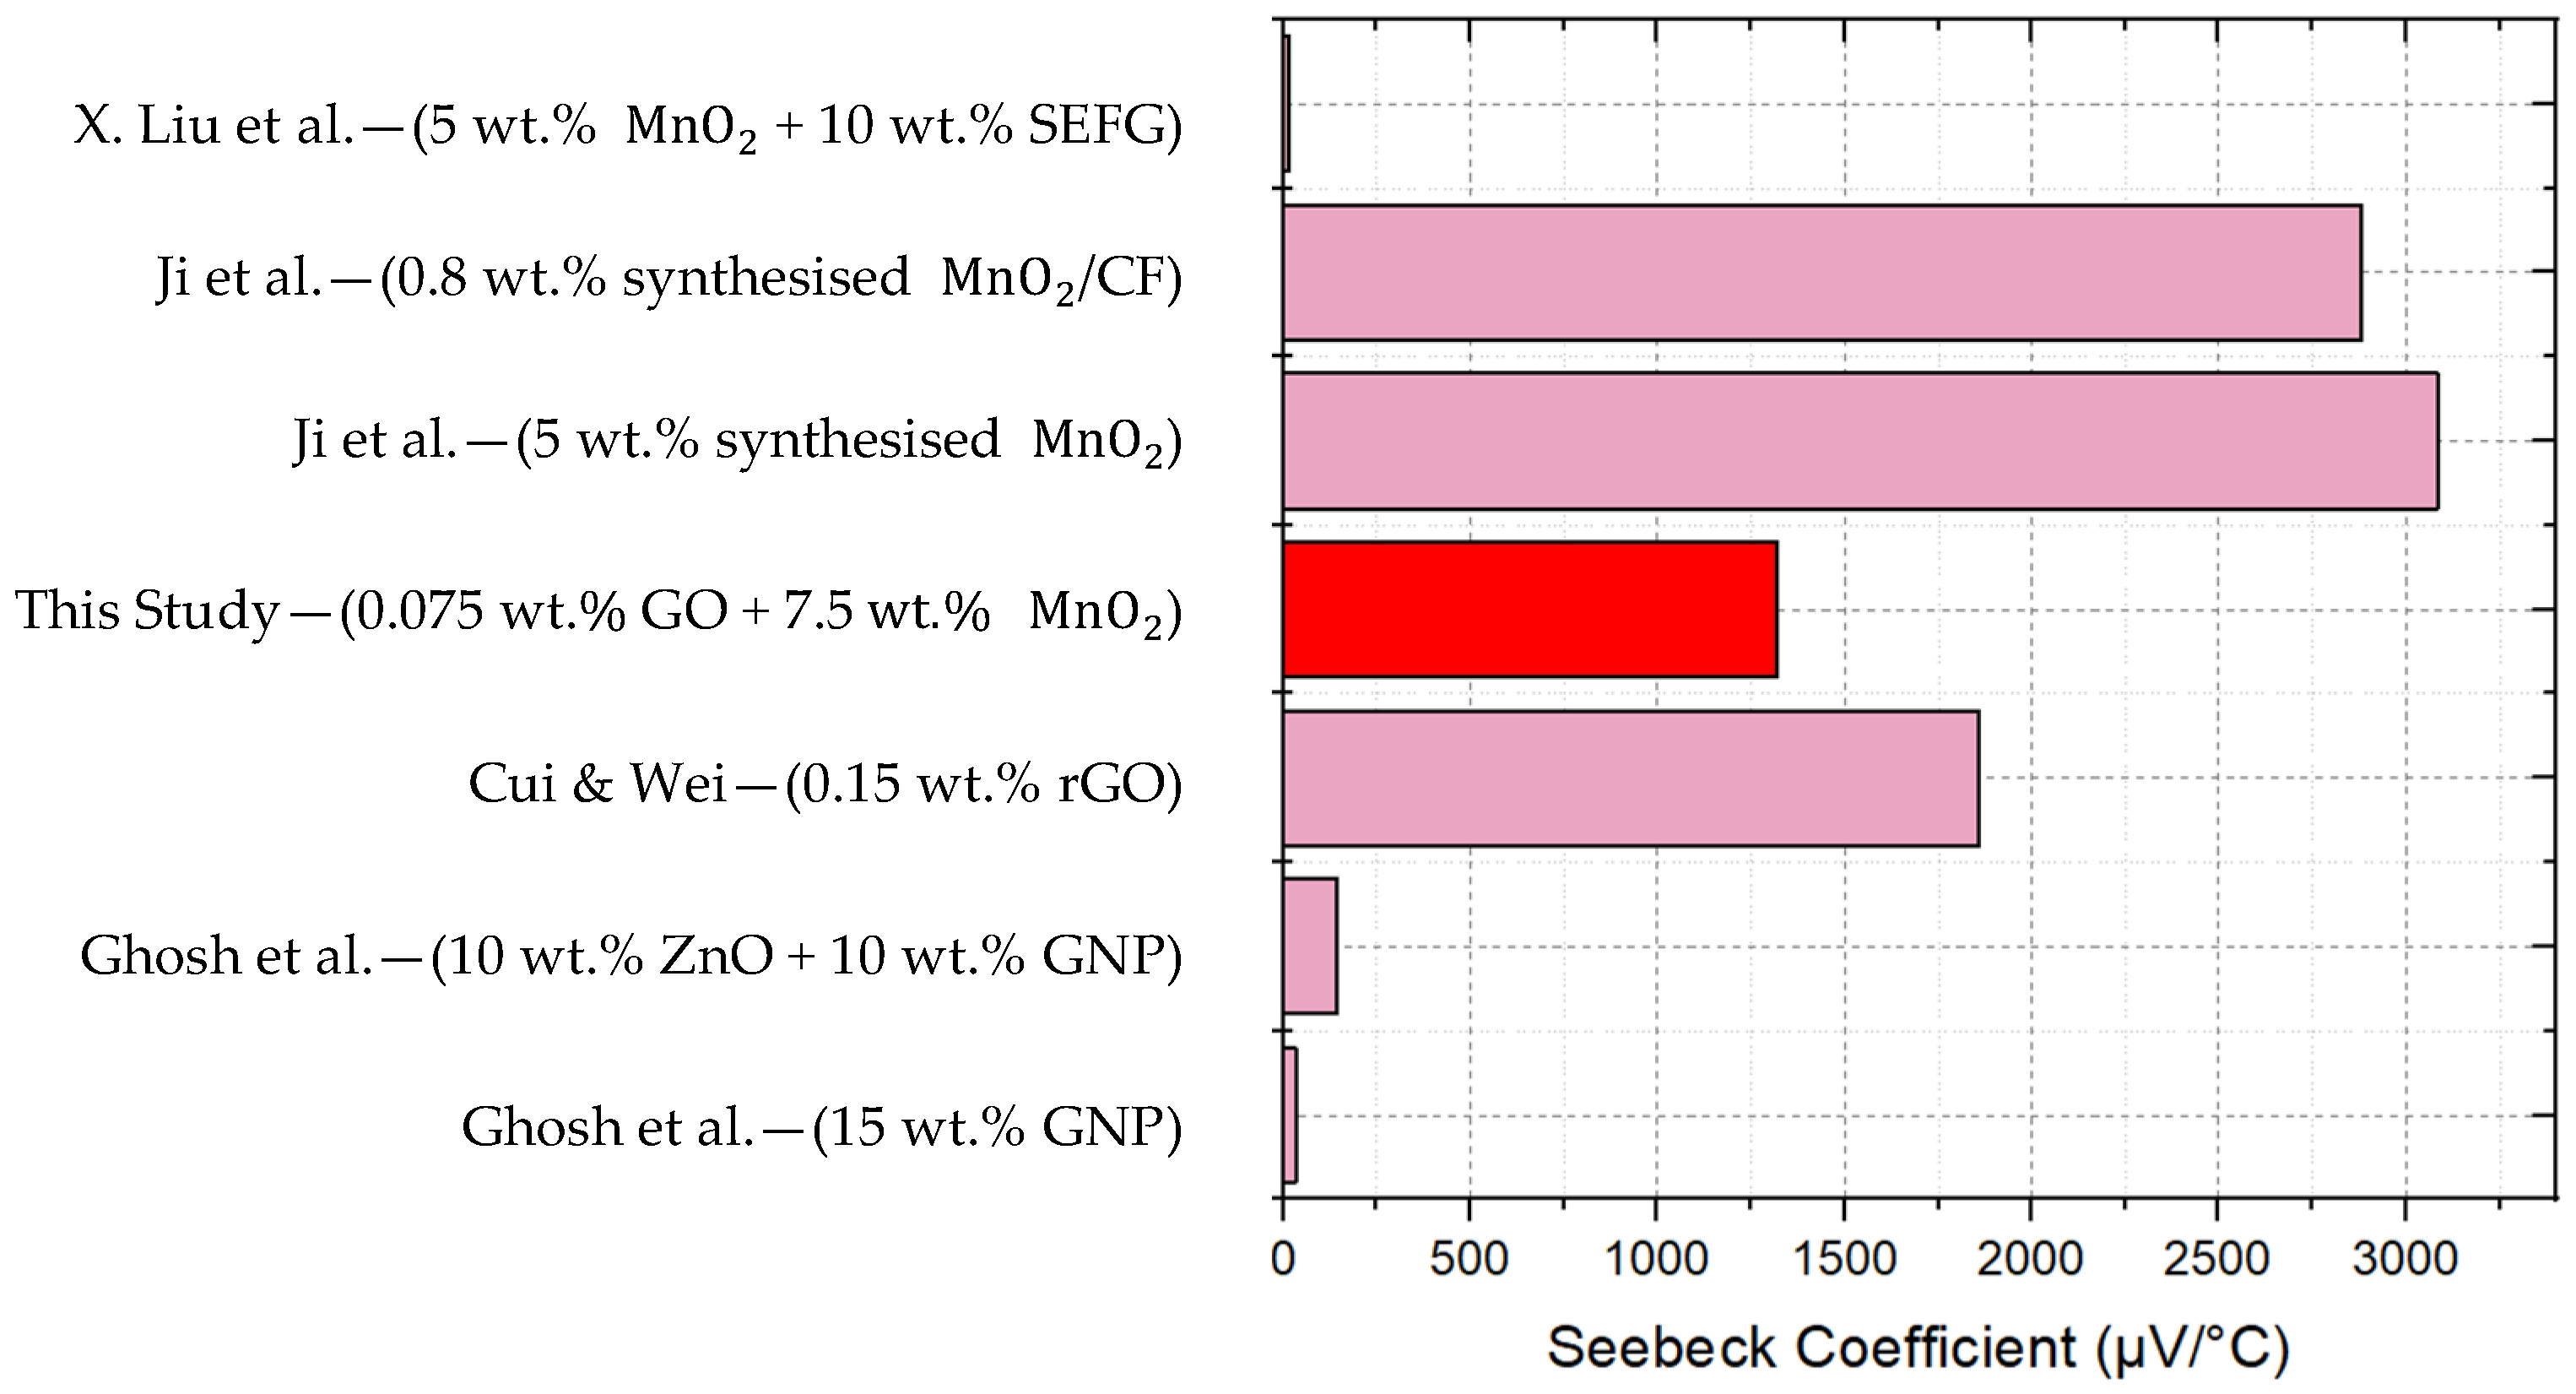
The Seeback coefficient changes with the thermal gradient and the results shown in Figure 4 are calculated at the hotplate temperature of 65 °C or a thermal difference of 44 °C. The results found that GO and MnO2 both increased the Seebeck coefficient of the samples with increasing weight percentages. A maximum Seebeck coefficient of 903μV/°C was achieved with 7.5 wt.% MnO2. This was comparable to the maximum coefficient of 929 μV/°C achieved by 0.075 wt.% of GO. The addition of MnO2 and GO together in the same sample improved the Seebeck coefficient of the cement composite up to 1320 μV/°C. This represents a 45% increase compared to the highest values observed in the GO-only or MnO2-only composite samples, indicating that neither GO nor MnO2 reached the percolation threshold at their individual maximum additive concentrations. This verifies that the inclusion of cheaper alternative metal oxides like MnO2 to graphene-enhanced concrete can achieve efficient thermoelectric properties while reducing total costs. A comparison of the results achieved in the current study with relevant studies from the literature is presented in Figure 5, highlighting the comparatively significant thermoelectric performance observed in this work. Notably, this study with 0.075 wt.% GO and 7.5 wt.% MnO2 demonstrated a 7765% improvement in thermoelectric performance compared to the study by X. Liu et al., 2021 [24], which combined 5 wt.% MnO2 with 10% SEFG. Additionally, it showed a 916% improvement compared to the study by Ghosh et al., 2020 [18], which combined 10 wt.% ZnO with 10% GNP. However, the comparison of these studies should be approached with caution, as the experimental conditions employed in the respective studies differ significantly.
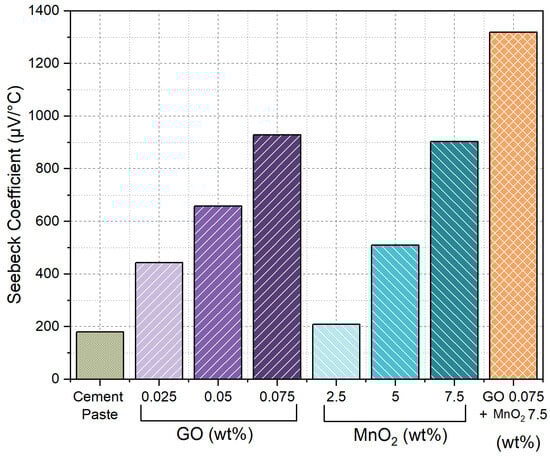
Figure 4.
Seebeck coefficient of composites.
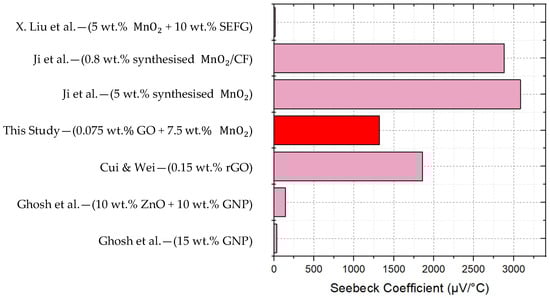
Figure 5.
Comparison of Seebeck coefficient results [17,18,19,22,24,25].
3.3. Strength Testing
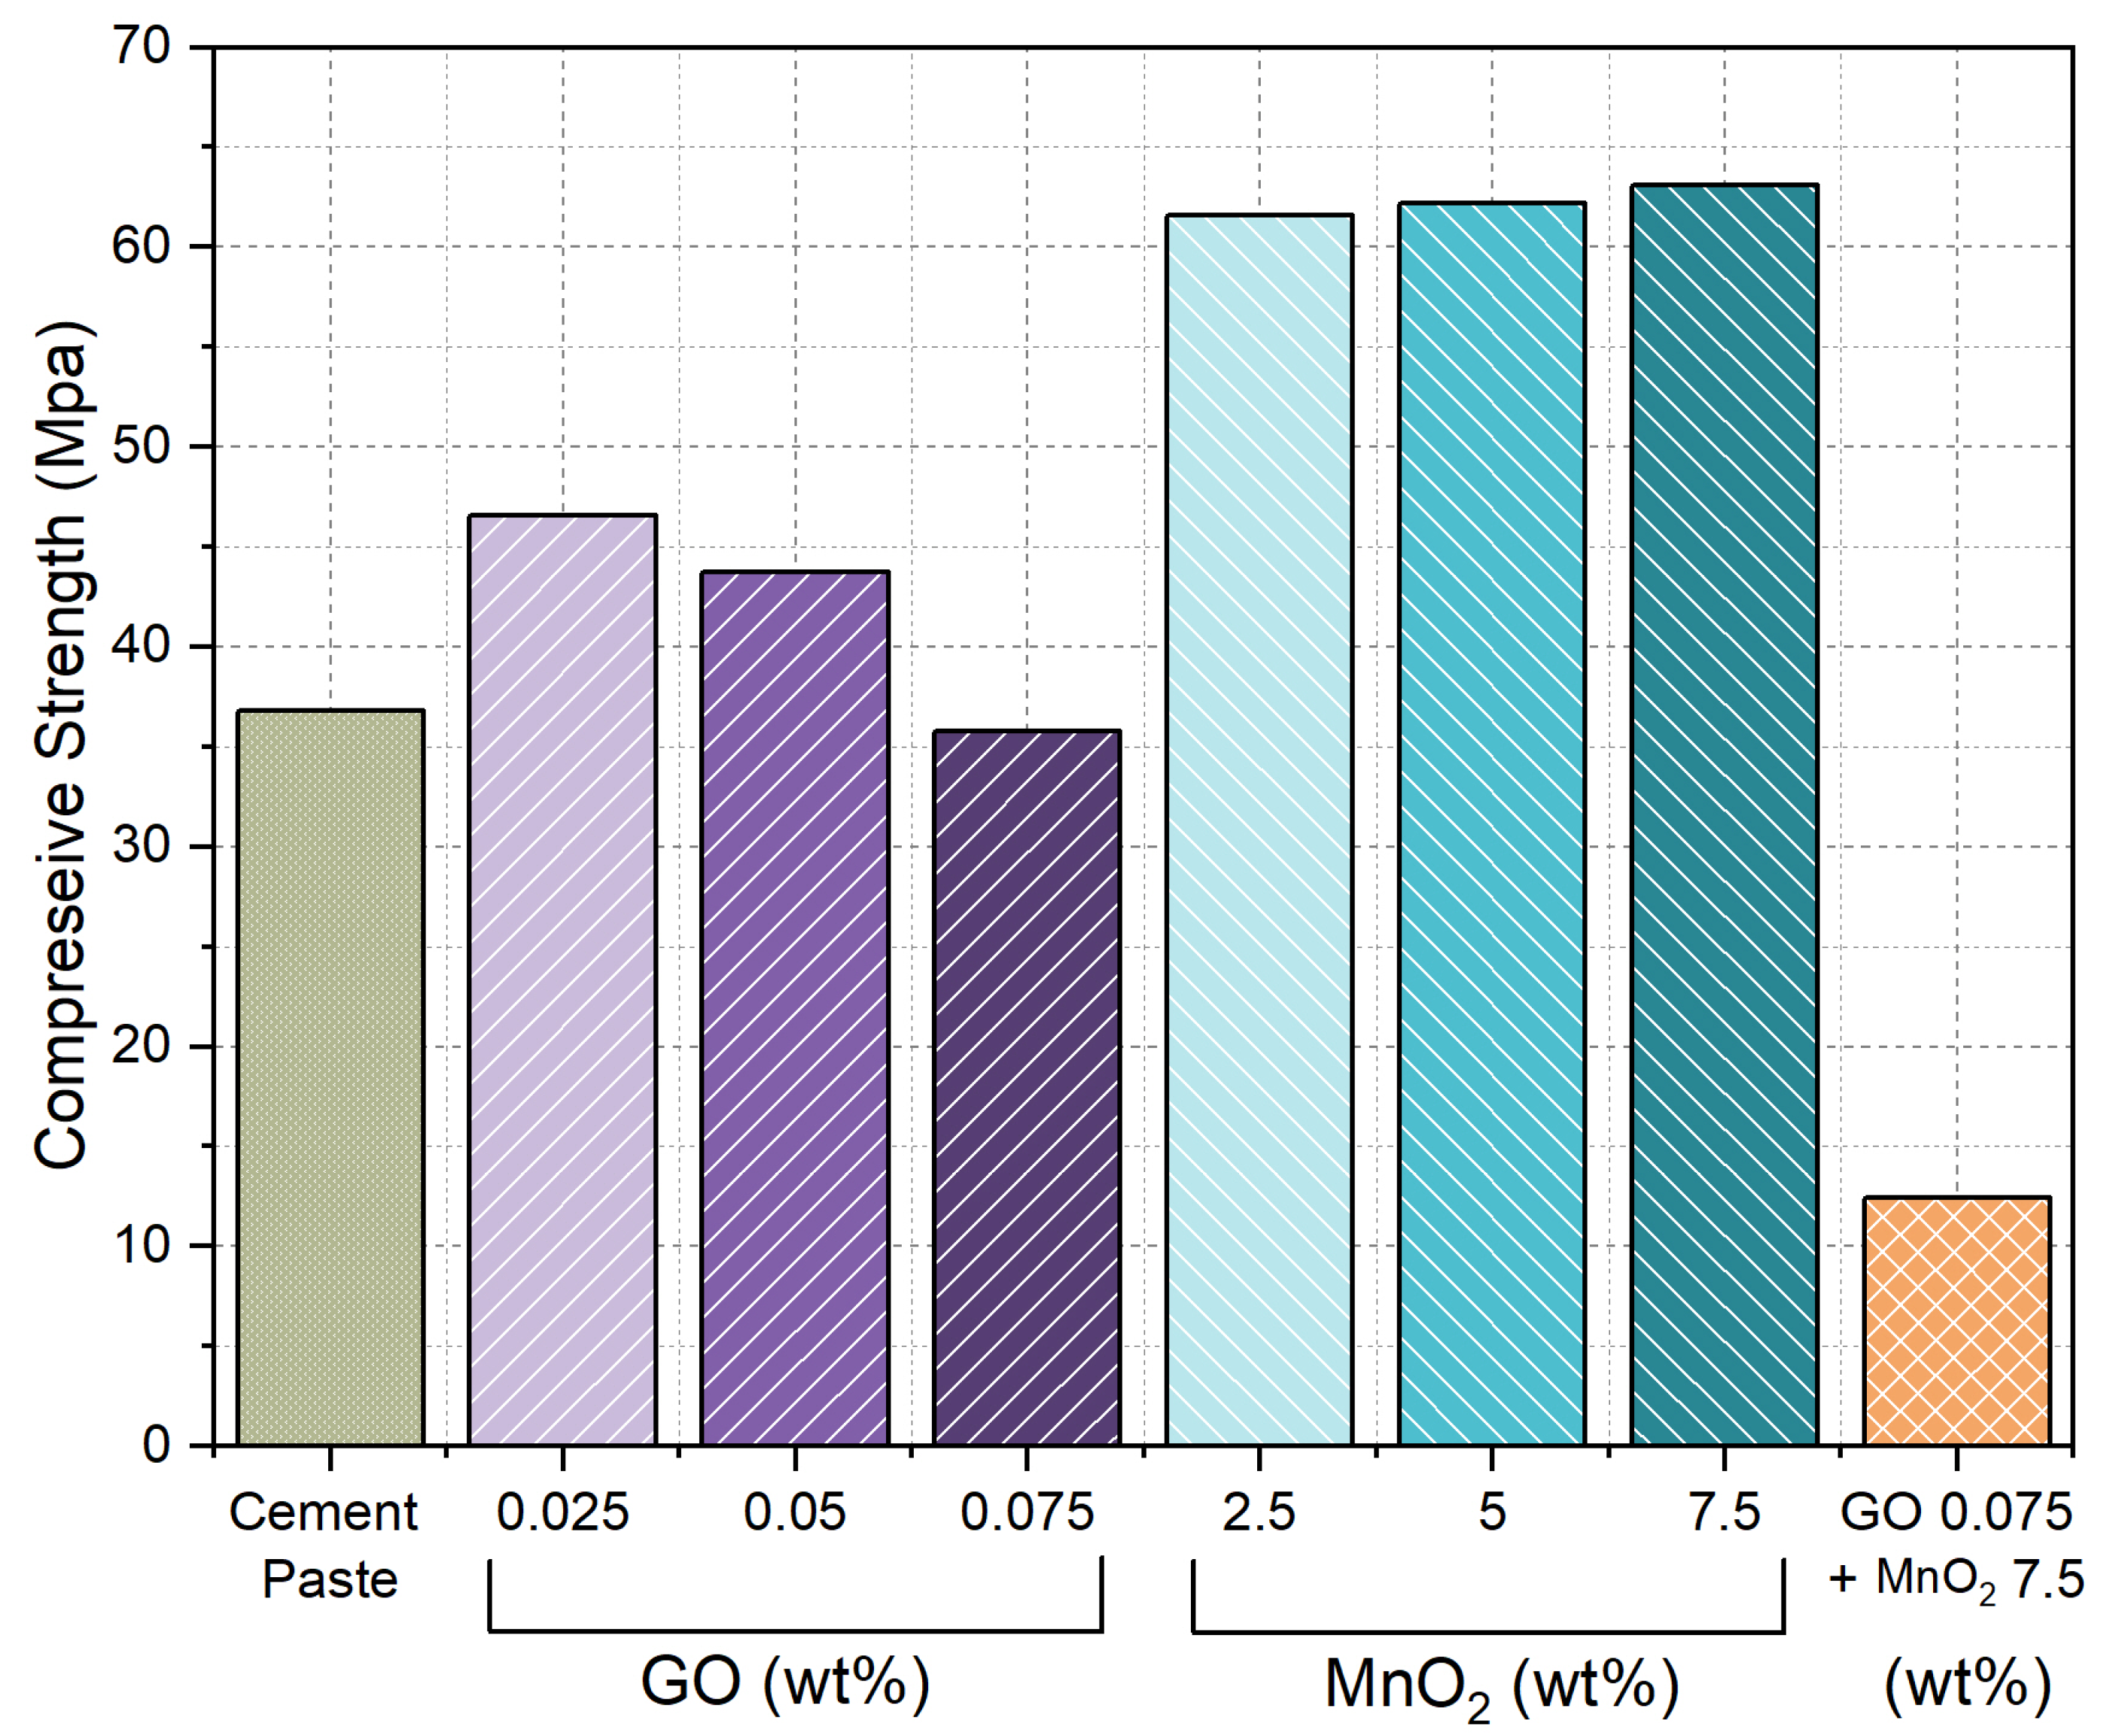
The compressive strengths of the composites are presented in Figure 6. The control sample demonstrated a compressive strength of 37 MPa. The addition of 0.025 wt.% GO increased the compressive strength to 46.5 MPa; however, further increases in GO content led to a reduction in compressive strength. This trend is similar to the findings of other researchers, who observed an increase in compressive strength with GO additions up to 0.02–0.03 wt.% and then a decrease [34,35]. During the preparation of samples incorporating GO, significant agglomeration of the material was observed during the mixing stage. As a result, the sample may have been set with increased porosity and non-uniform dispersion of GO within the matrix, weakening its overall structure and making it more susceptible to failing under compressive forces. The effects of admixtures, such as PCE-based superplasticisers, on the thermoelectric properties of cementitious materials have not yet been investigated in the literature, hence no plasticiser or admixture was used in this study.

Figure 6.
Compressive strength of composites.
The compressive strength of the cement composite improved significantly with the addition of MnO2, though further increases resulted in only minor enhancements. The strength increment observed in this study aligned with findings from the literature for a 0.4 w/c ratio [37]. When preparing the samples, the incorporation of MnO2 had the opposite effect of GO, resulting in a very fluid mixture with no agglomeration. This facilitated easier sample moulding and likely reduced porosity, resulting in a higher compressive strength up to 63 MPa. Surprisingly, the sample with combined GO and MnO2 resulted in poor compressive strength properties, though it recorded the highest thermoelectric properties. The compressive strength result of this sample was lower than those of the control sample, with a recorded value of 12.5 MPa.
As discussed, the effect of GO and MnO2 on the workability of the mixture played a significant role in the compressive strength results. However, the workability comparison between mixtures is not quantitatively discussed in this paper, as only two main parameters (strength and Seebeck coefficient) are considered within the scope of this multi-objective analysis. It is acknowledged that maintaining the other parameters as closely as possible would lead to a better comparison; however, achieving identical workability is challenging with two distinct types of fillers and could result in differing w/c ratios, which are far more critical to keeping constant. Interested readers can refer to Torre et al. [37] for additional comparisons involving the addition of MnO2 and to Fonseka et al. [46] for comparisons involving the addition of GO.
3.4. Comparision of Multifuctional Properties
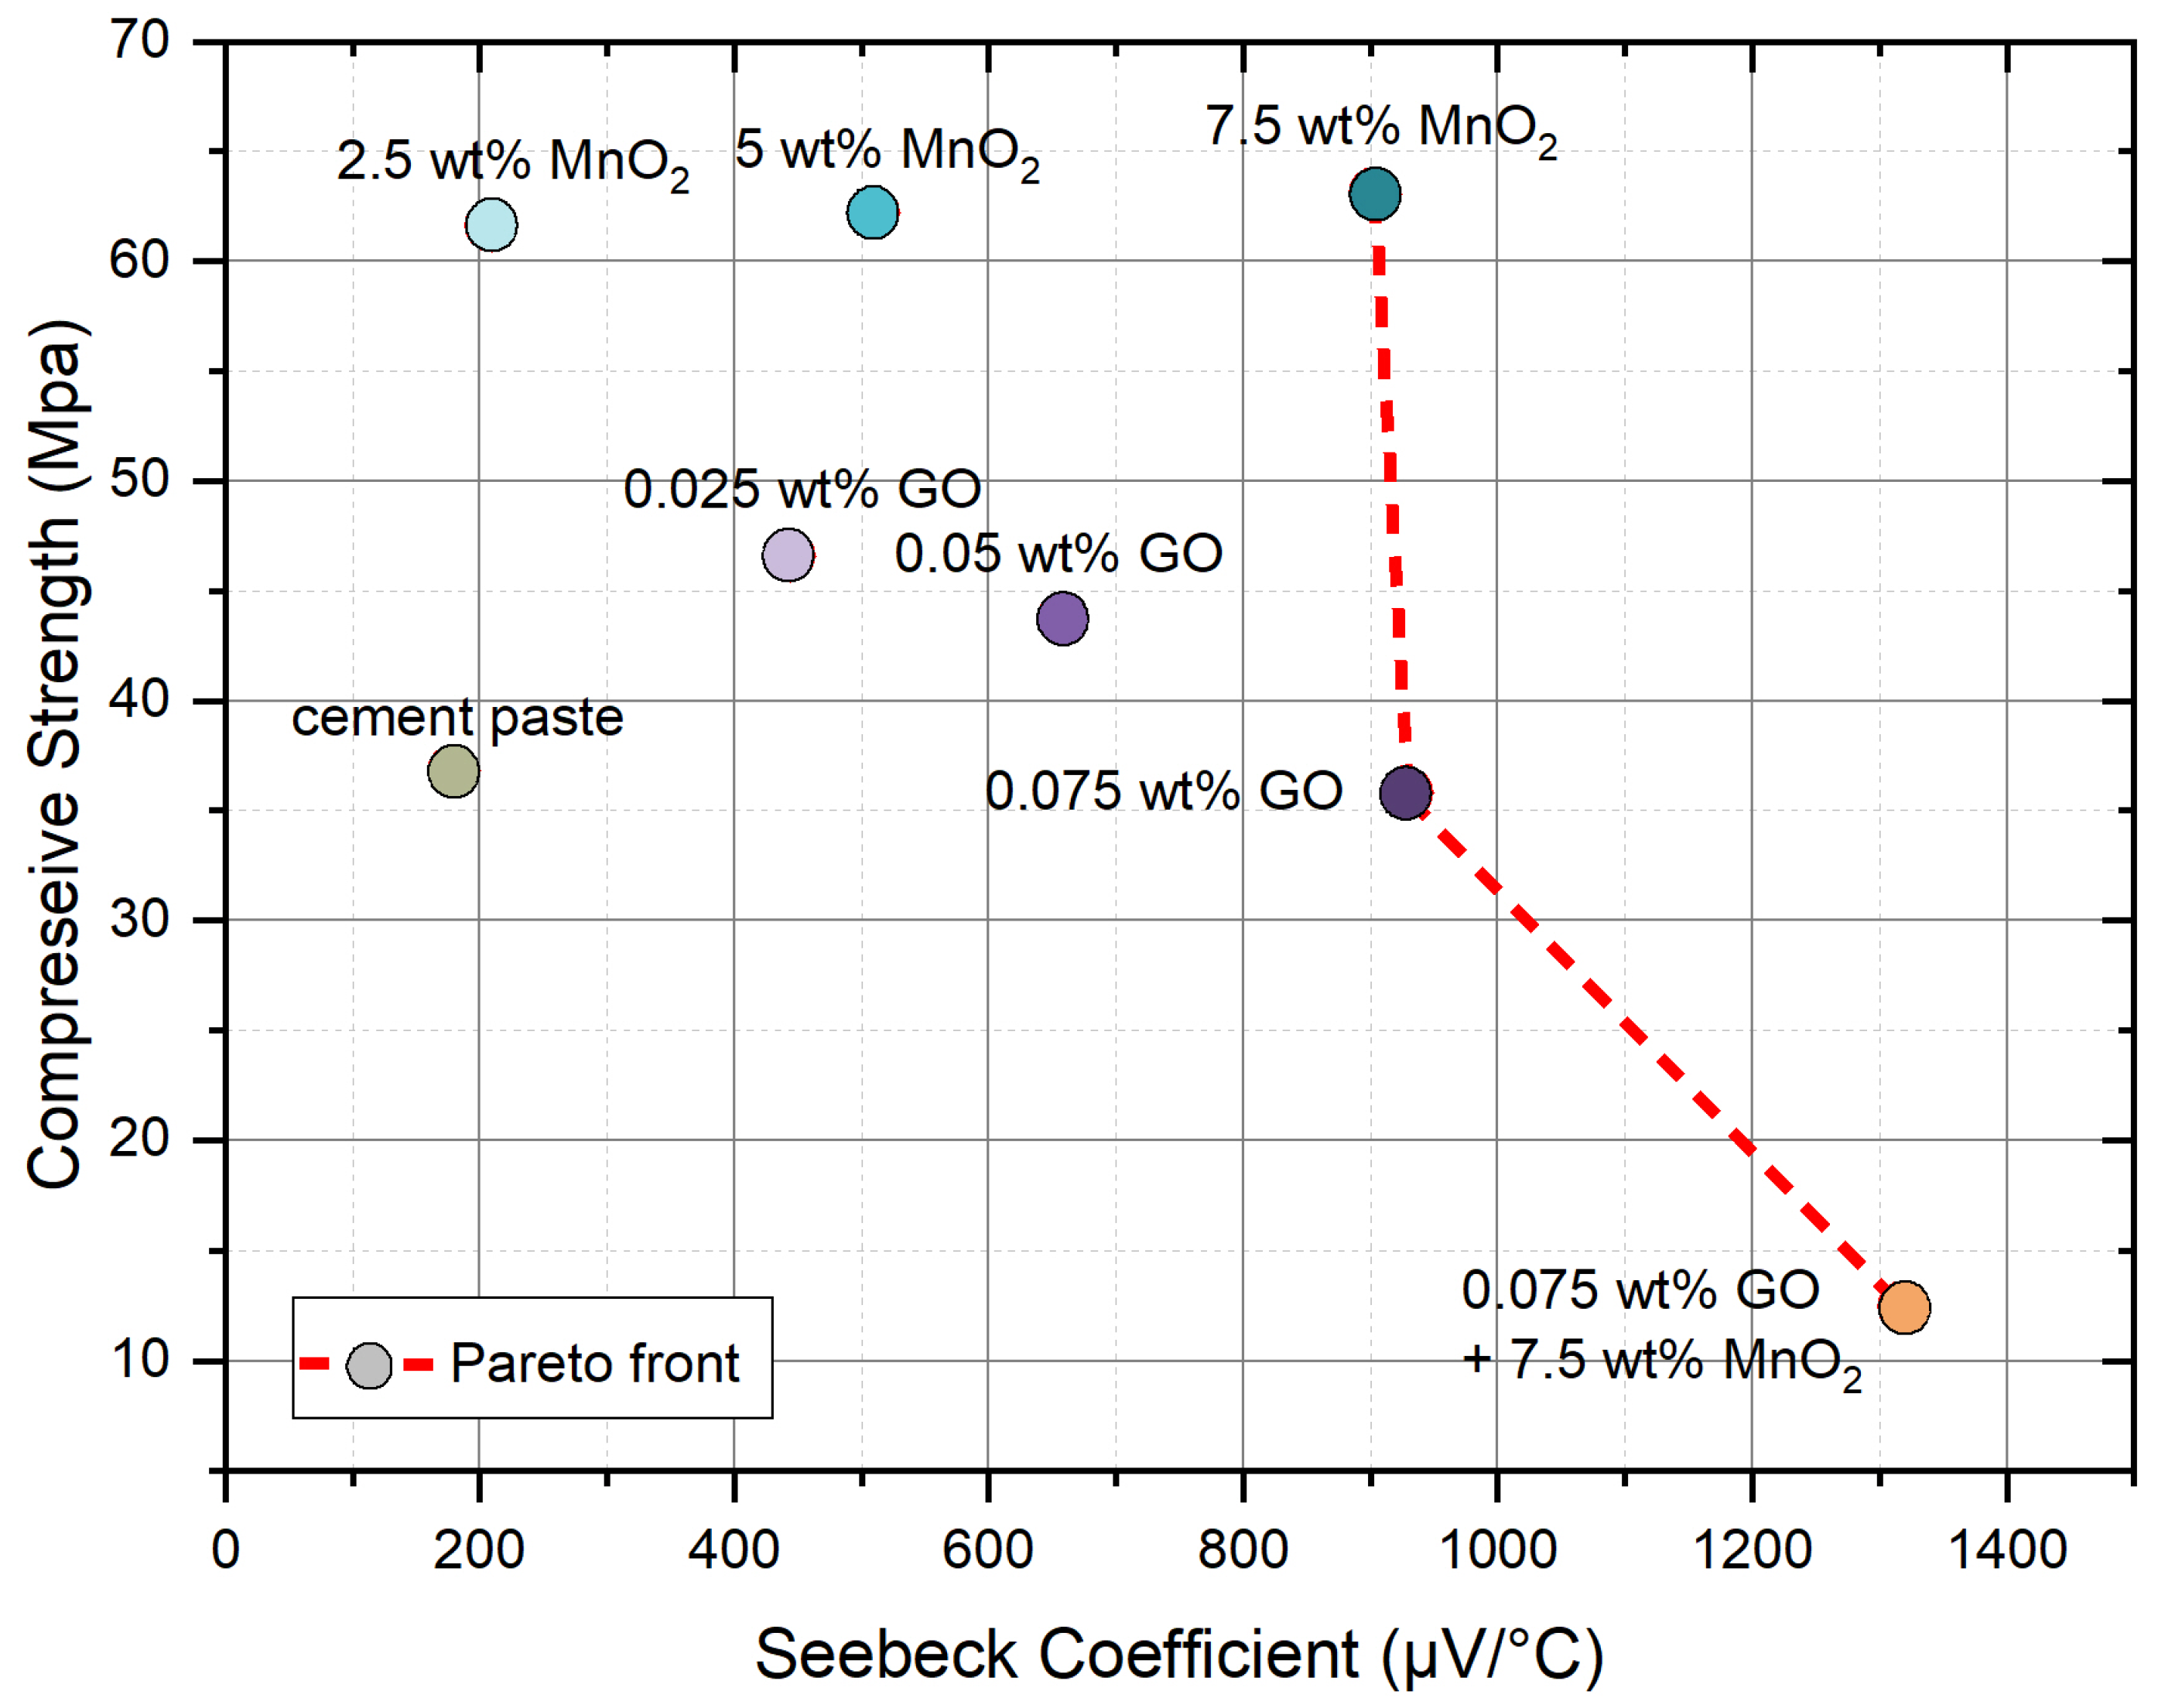
A Pareto analysis, as illustrated in Figure 7, was performed to identify the non-dominated solutions among the eight formulations based on the two key objectives: Seebeck coefficient and compressive strength. Three samples emerged as Pareto-optimal: (i) 7.5 wt.% MnO2, (ii) 0.075 wt.% GO, and (iii) 0.075 wt.% GO + 7.5 wt.% MnO2. The 7.5 wt.% MnO2 sample offered the highest compressive strength (63.07 MPa) while maintaining a relatively high Seebeck value (903.67 μV/K). In contrast, the 0.075 wt.% GO + 7.5 wt.% MnO2 sample maximised the Seebeck coefficient (1319.20 μV/K) but exhibited substantially lower compressive strength (12.43 MPa). The 0.075 wt.% GO sample provided an intermediate balance, featuring a Seebeck coefficient of 929.08 μV/K and a compressive strength of 35.8 MPa. These non-dominated points demonstrate that no single composition can achieve both thermoelectric and strength merits optimally. Hence, it is recommended that researchers and practitioners prioritise thermoelectrical versus mechanical performance when selecting Pareto-optimal solutions for their specific applications.
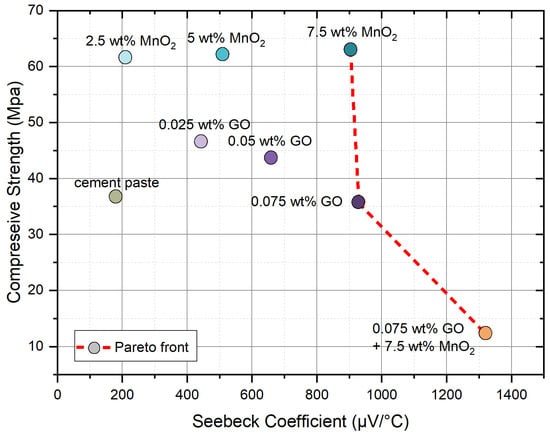
Figure 7.
Pareto front for Seebeck coefficient and compressive strength.
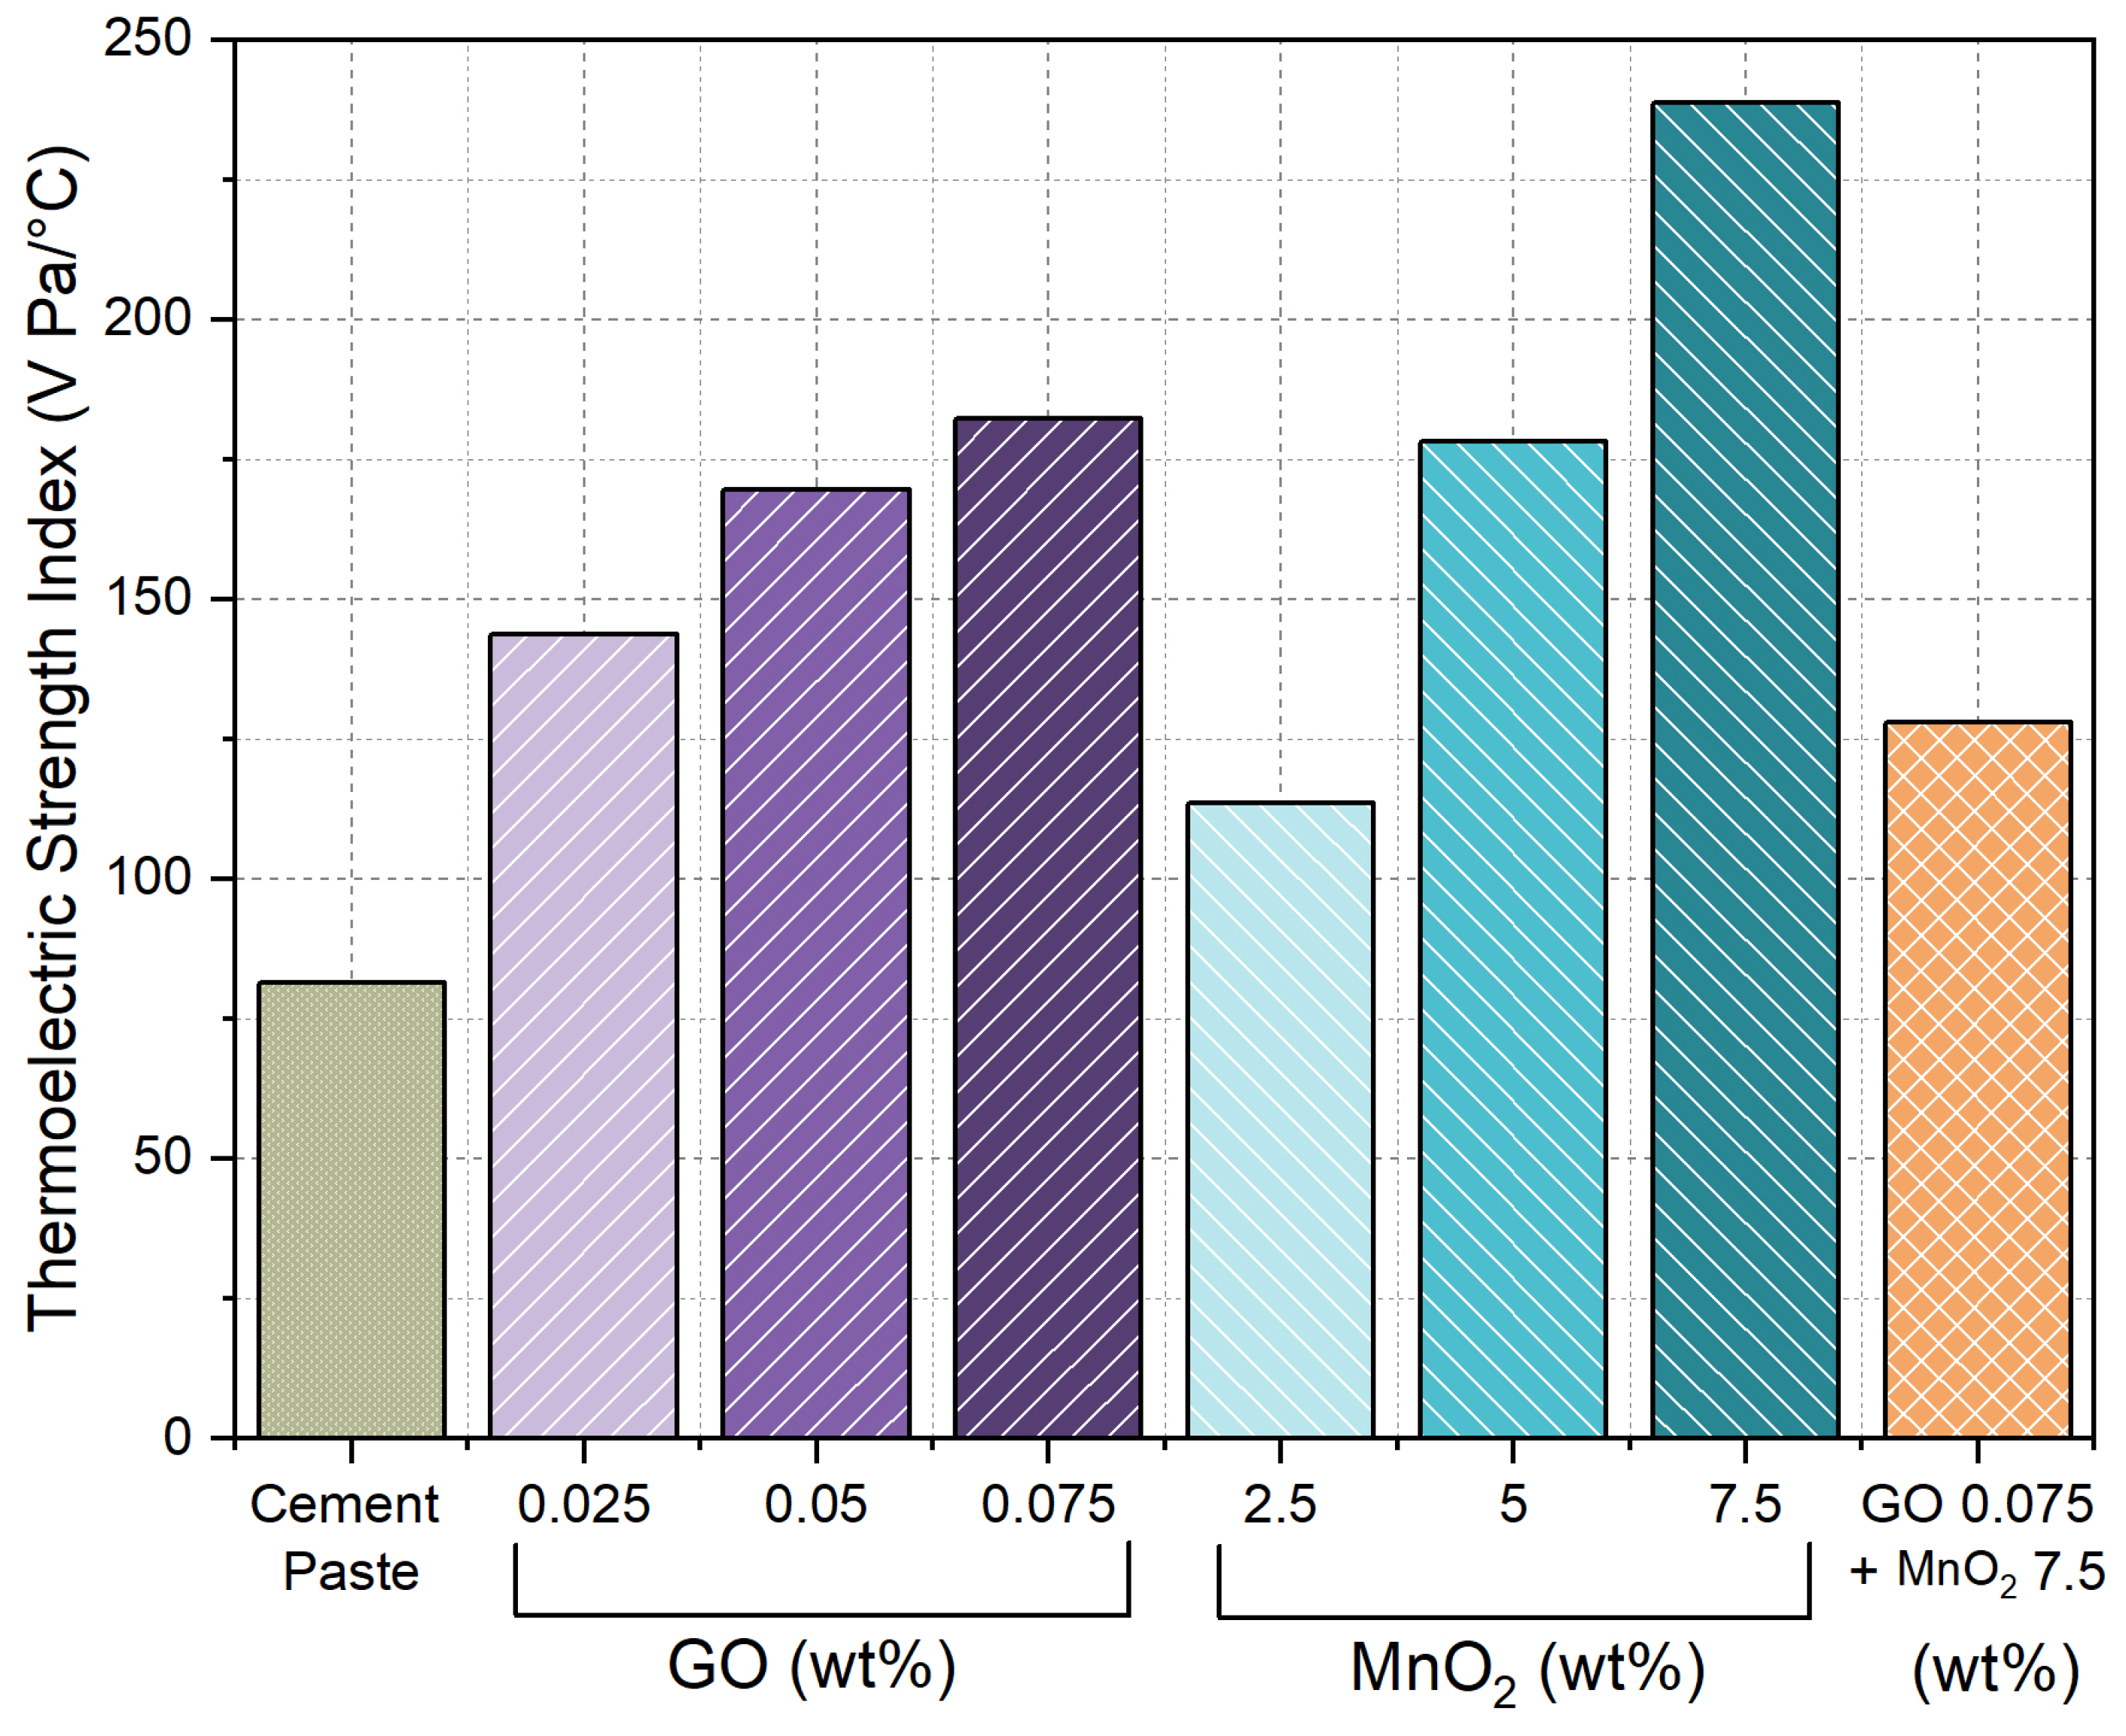
Figure of merit (ZT) and Power Factor (PF) are used to find new superior thermoelectric materials or to compare thermoelectric materials dimensionlessly. Similarly, in this paper, we introduce the Thermoelectric Strength Index (TSI) as given in Equation (1) for the evaluation of the material in terms of both thermoelectric and strength properties, considering equal weights. In this equation, is the compressive strength of the material, is the voltage difference, and is the temperature difference between the samples. Calculated TSI factors for all seven samples are shown in Figure 8, from which it is evident that the MnO2 7.5 wt.% composite is the best for thermoelectric modules in structural applications, offering both structural viability and efficiency.
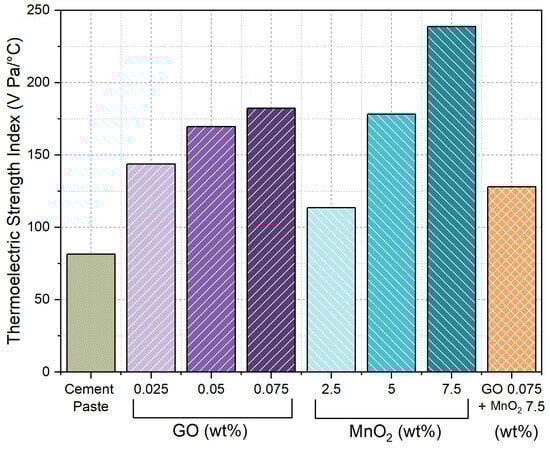
Figure 8.
Thermoelectric Strength Index of the composite.
3.5. Microstructral Properties
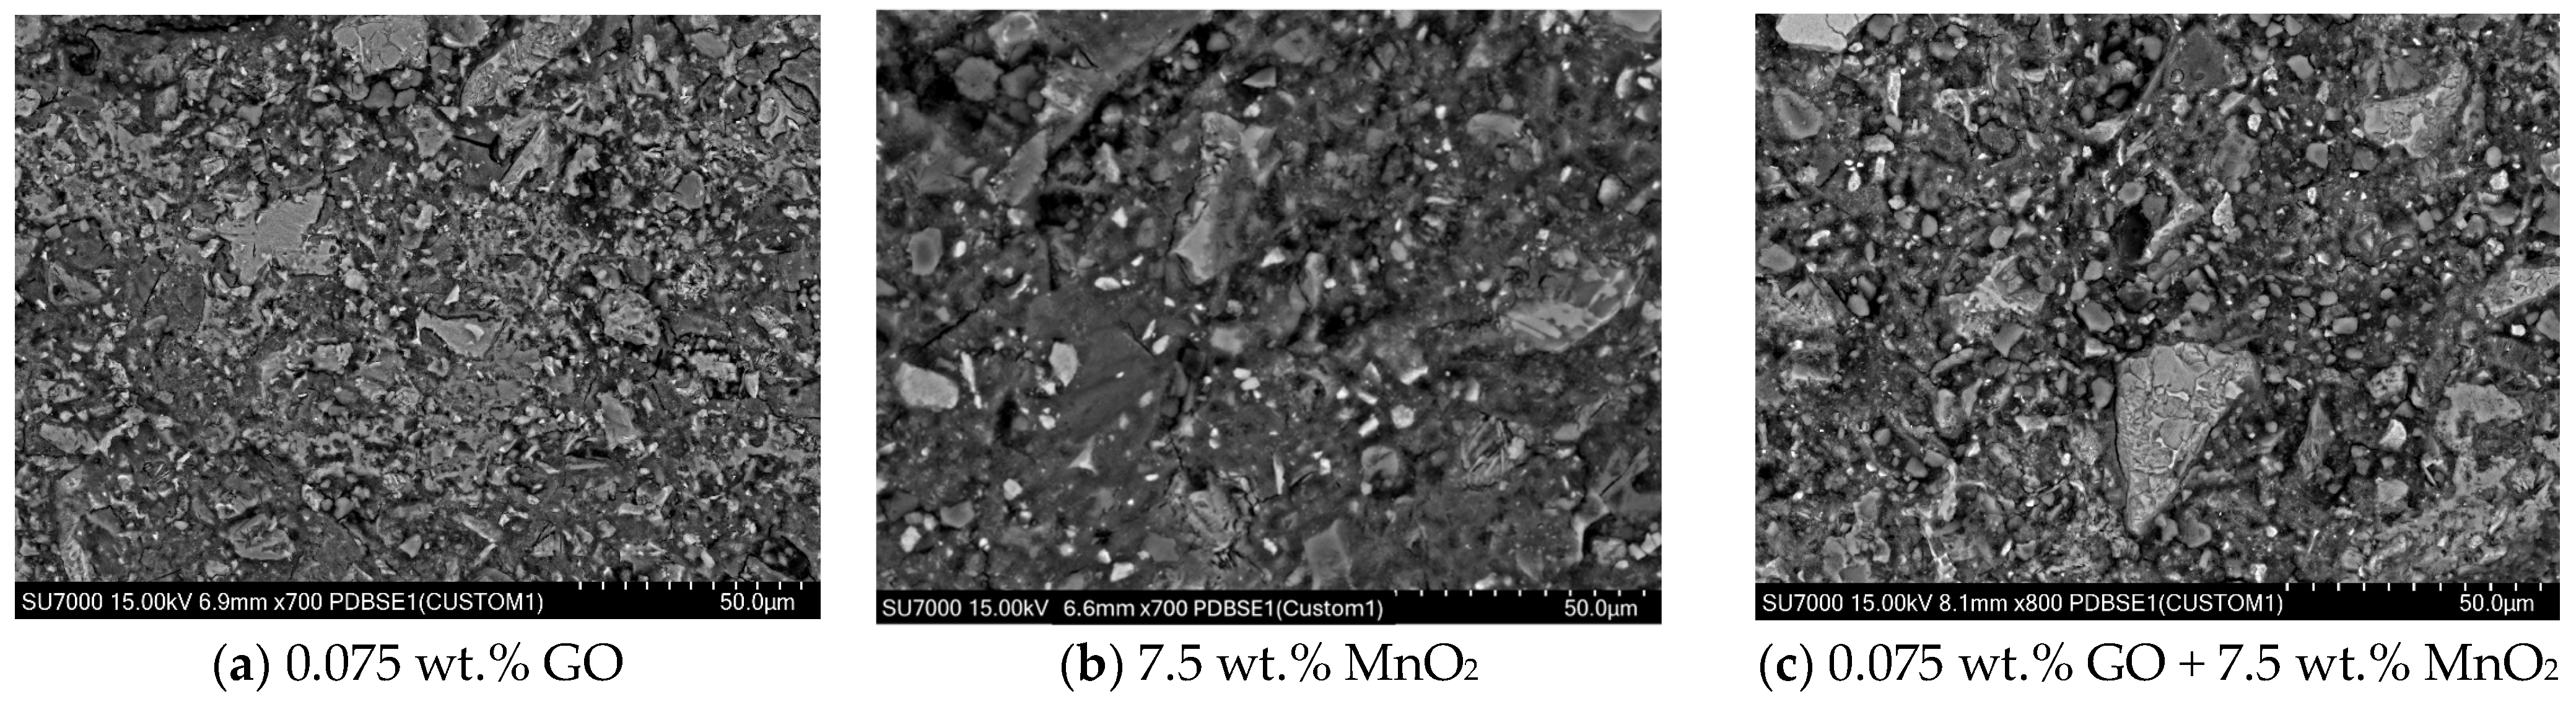
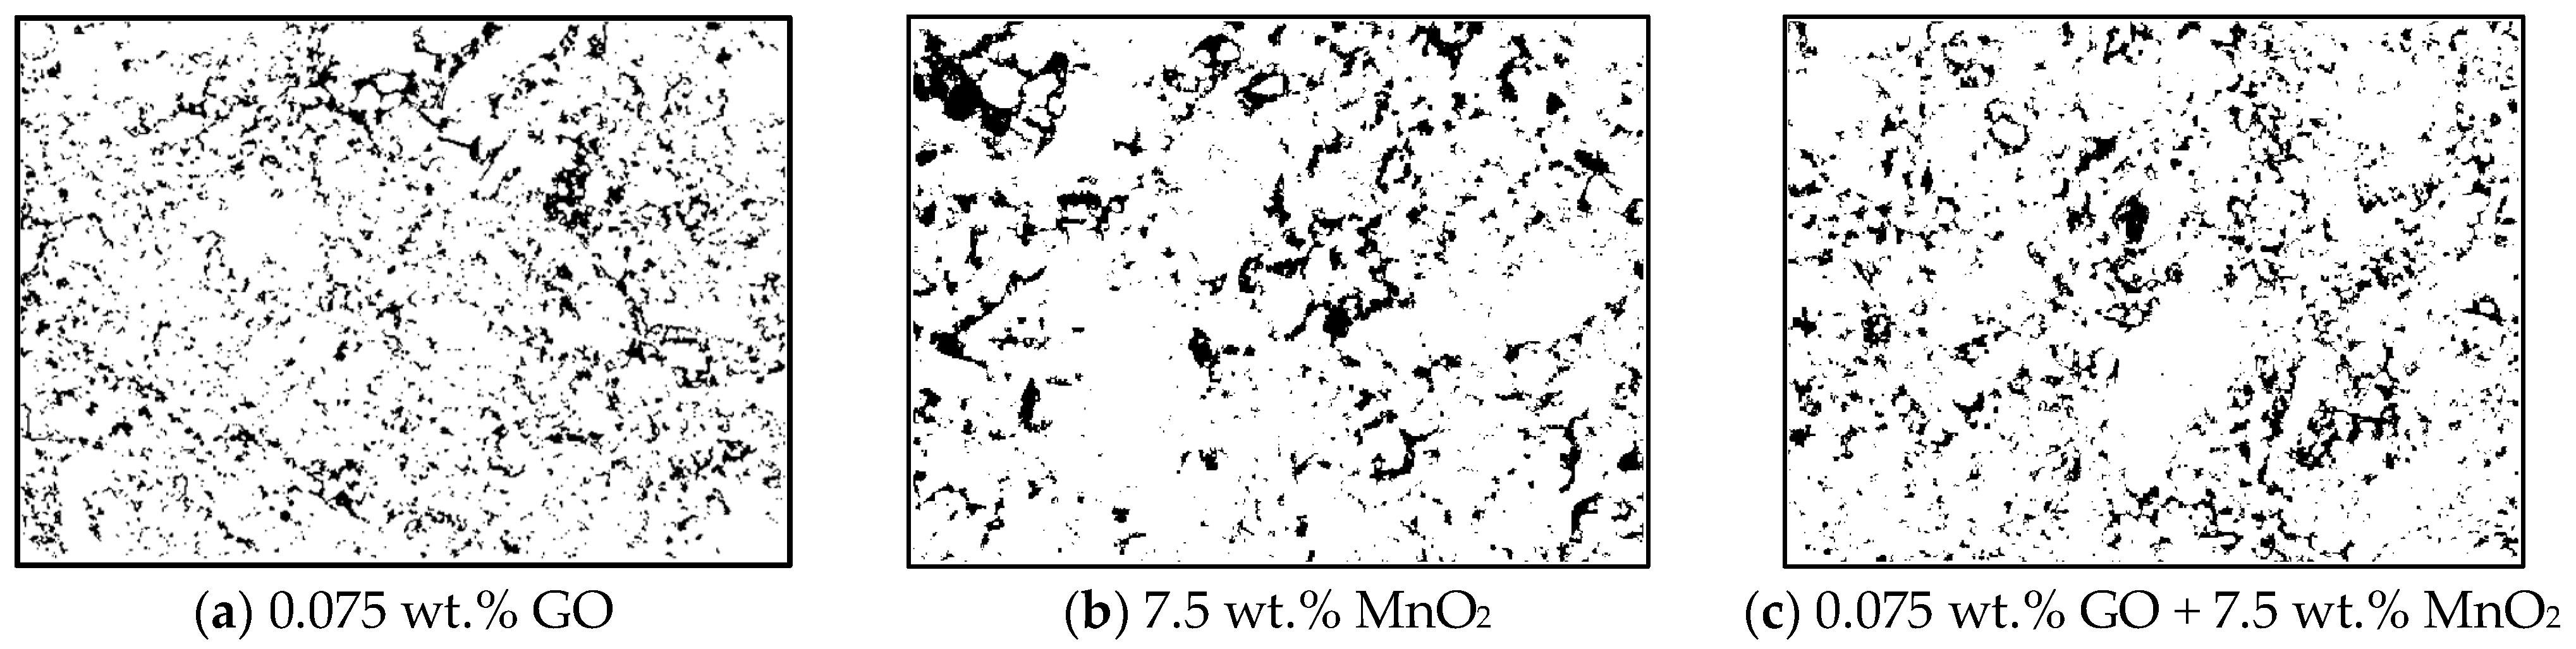
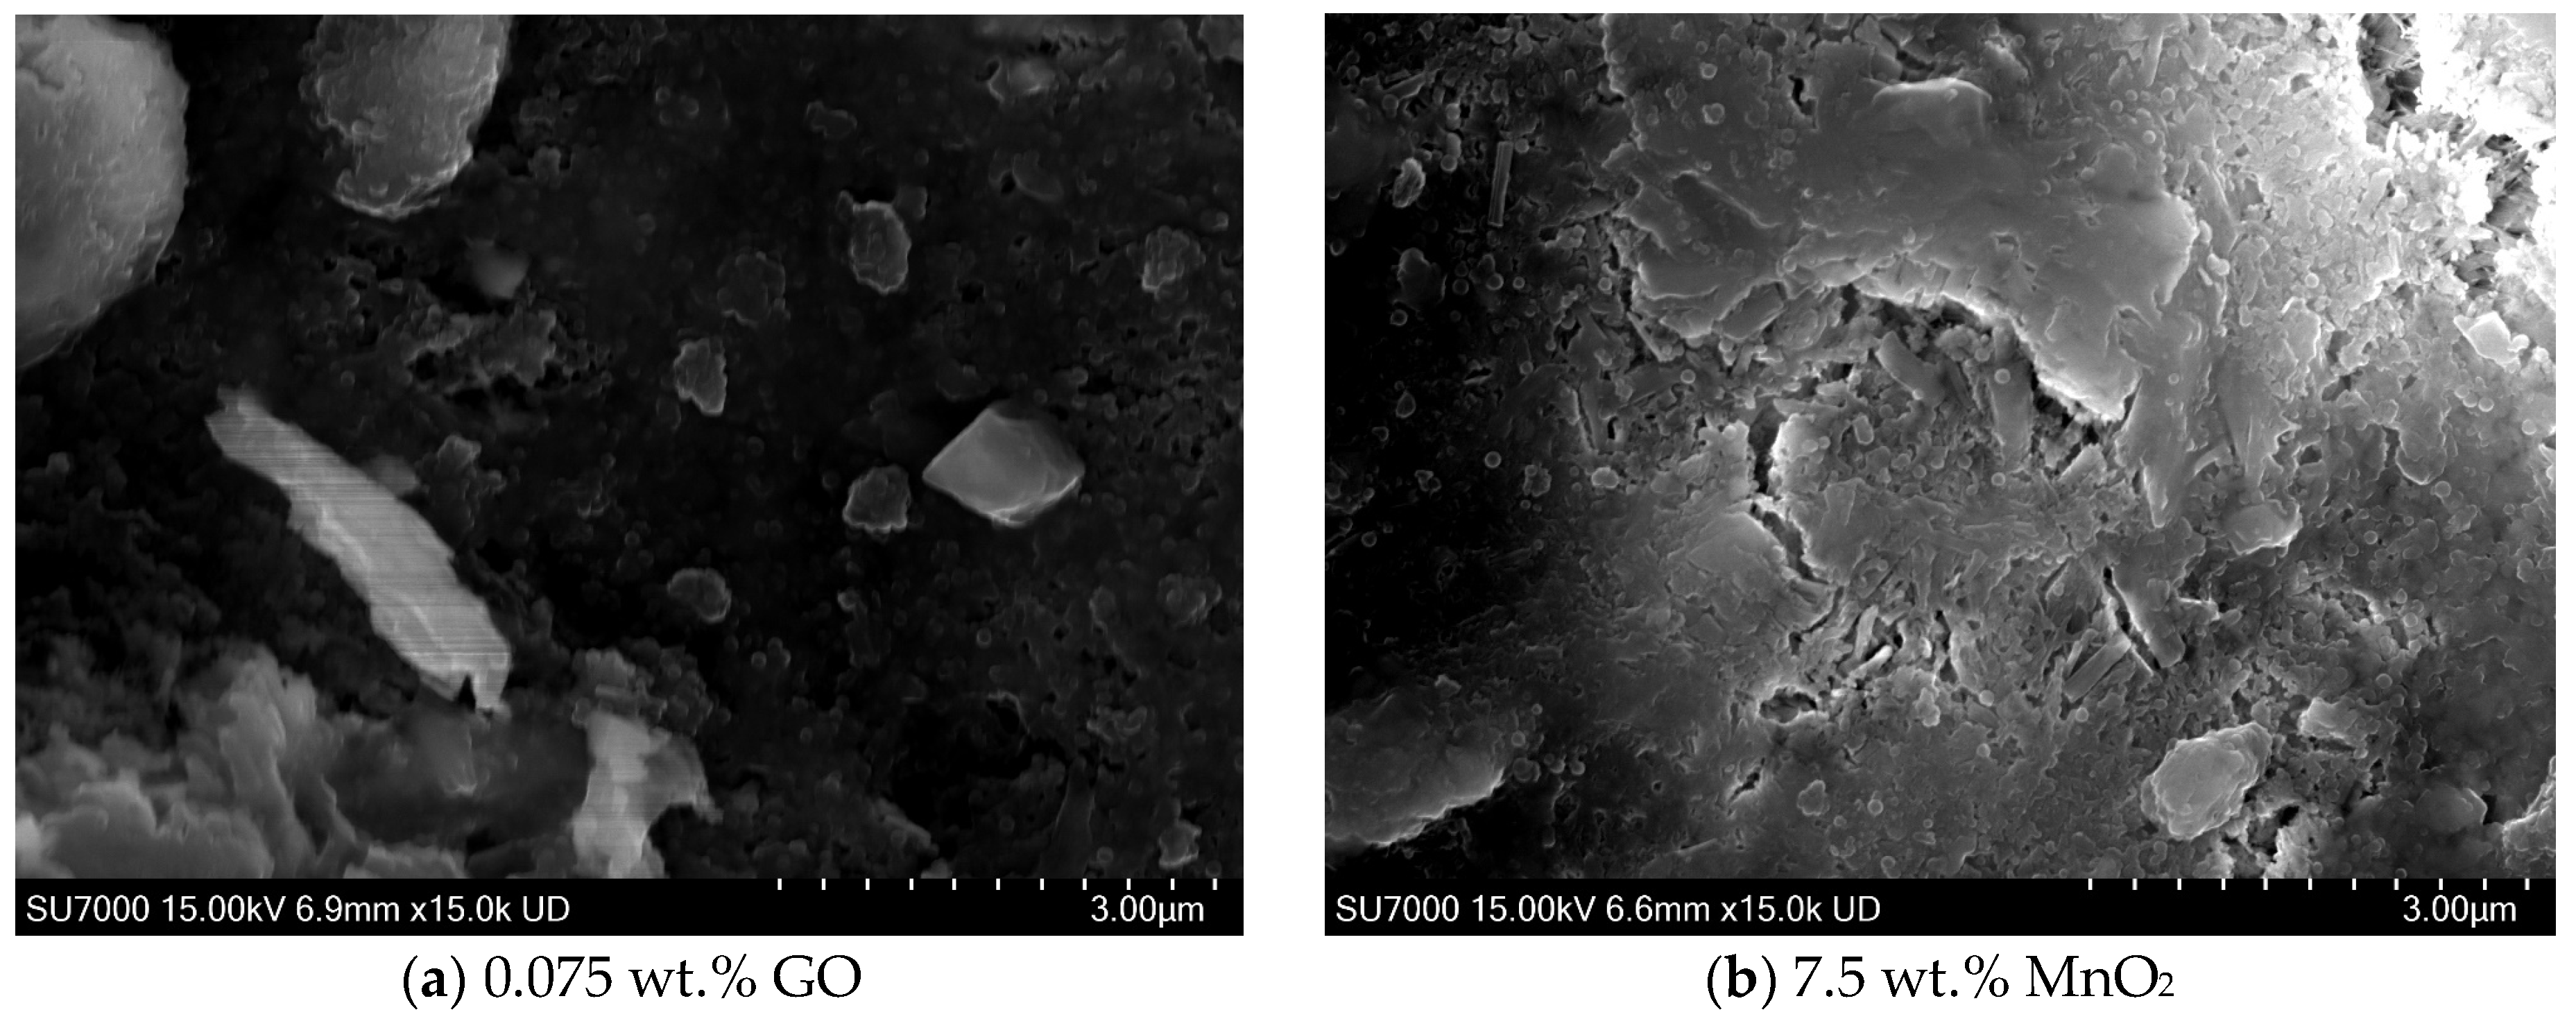
The backscattered electron (BSE) imaging results, as depicted in Figure 9, provide a visual representation of the specimens under investigation. Analysis revealed that the specimen containing 0.075 wt.% GO exhibited a lower degree of hydration and increased porosity in comparison to the sample with 7.5 wt.% MnO2 (Figure 9a,b). This was associated with the rapid water adsorption in the GO during the preparation phase, which reduced the free water availability for cement hydration and increased porosity during the casting process without any additional water-retarding admixtures. When analysing the microstructure of the 0.075 wt.% GO + 7.5 wt.% MnO2 specimen, a higher porosity and loose particles were visible on the surface (Figure 9c). During the polishing process for microstructural analysis, it was observed that the surface of the specimen exhibited significant particle loss. These increased porosities and loose particles further validated the low compressive strength observation in this sample. Micro-porosity was segmented using BSE imaging in conjunction with specifically developed MATLAB (R2021b) programmes, as demonstrated in Figure 10. From Figure 10b, microscale porosity is evident in the cement matrix containing 7.5 wt.% MnO2, whereas the matrix incorporating 0.075 wt.% GO exhibits comparatively reduced micro-porosity (Figure 10a). This is due to the GO nucleation site distribution throughout the matrix, and these sites reducing the formation of microscale capillary pores.

Figure 9.
Visualisation of hydration using BSE imaging.

Figure 10.
Microphase distribution of micro-porosity.
Since the surface of the specimen was polished to facilitate accurate elemental analysis using EDS, qualitative information on the undisturbed crystallography and surface topography of microphases on the specimen surface were observed by scanning larger air void areas using secondary electron imaging (Figure 11). The morphology of the hydrated region in the 0.075 wt.% GO and 7.5 wt.% MnO2 specimens is shown in Figure 11a,b. The hydrated matrix in the 7.5 wt.% MnO2 specimen formed a densely packed calcium silicate hydrate structure compared to the hydrated region in the 0.075 wt.% GO specimen, which exhibited comparatively higher nano-porosity.
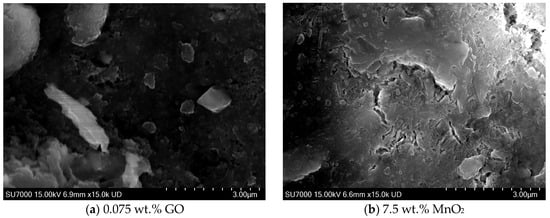
Figure 11.
Morphology of hydration at higher magnification.
The thermoelectric conductivity of concrete is related to the interconnection between the conductive filler and the porous matrix. The micro-porosity in the 0.075 wt.% GO + 7.5 wt.% MnO2 mixture (Figure 10c) is more evenly distributed throughout the material compared to that of the 7.5 wt.% MnO2 mixture (Figure 10b), which is attributed to the addition of GO providing nucleation sites for calcium silicate hydrate (C-S-H) formation. This enhanced distribution of interconnected micro-porosity and resulting ionic thermoelectricity can be identified as the contributing factor for the improved thermoelectricity in the 0.075 wt.% GO + 7.5 wt.% MnO2 sample. Furthermore, the strength variation in three specimen types is also linked to the porosity distribution. The number of pores in the hydrated region of both the 0.075 wt.% GO and 0.075 wt.% GO + 7.5 wt.% MnO2 specimens is higher, whereas the hydrated matrix in the 7.5 wt.% MnO2 specimen has low number of pores (Figure 9b).
Micro-porosity significantly affects both thermoelectric conductivity and strength. Interconnected micro-porosity can beneficially contribute to the conductivity of the concrete [47]. However, excessive porosity can lead to a reduction in mechanical strength, as the presence of voids weakens the structure and makes it more susceptible to cracks. This, in turn, can negatively impact the durability. Therefore, a balanced level of micro-porosity is crucial to optimise both thermoelectric conductivity and strength, ensuring the long-term performance and stability of the material in various applications.
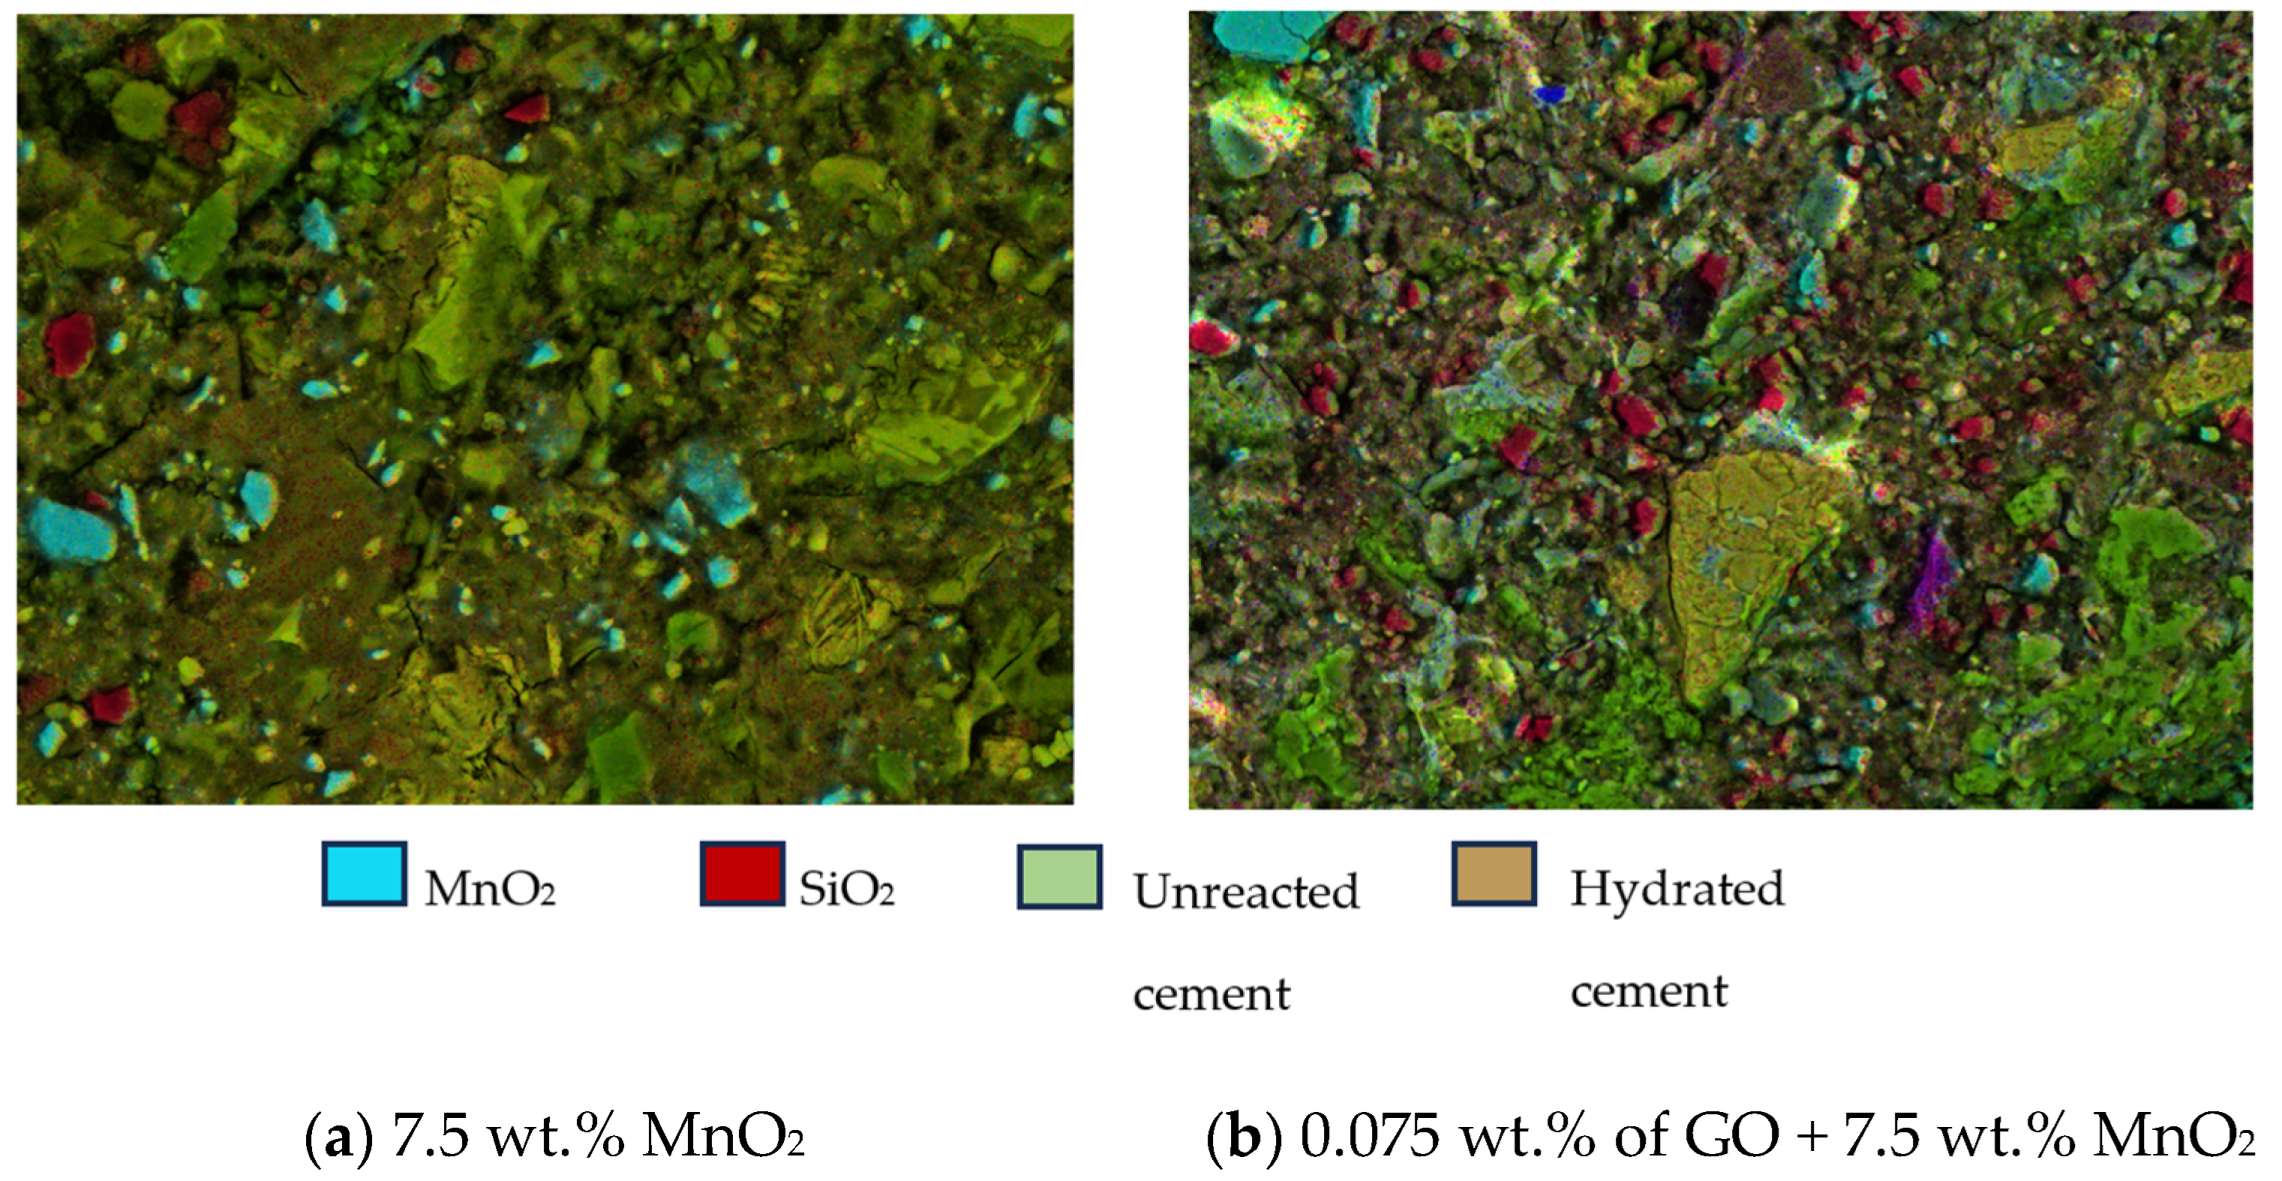
When observing the manganese (Mn) elemental map of the 7.5 wt.% MnO2 specimen, unreacted Mn particles were visible, and Mn concentrations were visible in the hydrated areas in lower pixel intensities (Figure 12). This indicated that MnO2 had contributed to densifying the hydrated matrix. Although many studies suggest that MnO2 mostly stays as a filler with less reactivity, it has been observed that manganese dioxide with nanometric-sized particles absorbs water, forming nucleation sites in cement hydration and contributing to improving concrete in terms of compressive and flexural strength. In order to visualise the unreacted particle distribution, phases were segmented separately using EDS elemental mapping, as shown in Figure 12. The 0.075 wt.% GO + 7.5 wt.% MnO2 specimen exhibited low mechanical strength and was prone to abrasion during polishing, which prevented the surface from achieving a level of smoothness comparable to that of the other two specimens. This observation is evident in Figure 12b, where many unreacted cement particles, SiO2, and MnO2 particles are visible on the surface as a result of damage to the hydrated matrix caused by the polishing process. In contrast, the 7.5 wt.% MnO2 specimen maintained its structural integrity in the hydrated matrix during polishing, resulting in a smoother surface.
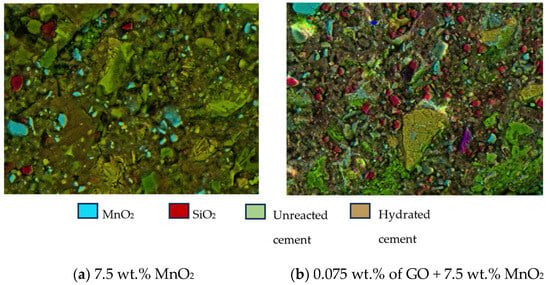
Figure 12.
Manganese (Mn) elemental distribution.
3.6. Testing Limitations
During the Seebeck coefficient testing, slight inconsistencies in heating rates were observed across the experiments. Achieving accurate voltage readings as a function of temperature requires a constant rate of temperature increase [38,43]. However, this condition could not be maintained in our study due to the limitation of the hotplate. Therefore, for the calculation, variations in the temperature and voltage were measured at fixed time intervals.
The samples were heated only until the hotplate reached the 65 °C limit, under the assumption that the opposite end of the sample remained at room temperature. This was practically achieved by heating the samples at a rapid rate, reaching 65 °C within a 2–3 min time window. Additionally, this study did not assess the effect of the heating rate on the Seebeck coefficient readings, which could also influence the results. Utilising a Peltier thermal system could have allowed for precise control over the heating rate, potentially improving the reliability and consistency of the measurements.
Another limitation of this study was the use of nickel paste instead of silver paste to enhance the thermal contact between the hotplate and the cement composites. Although silver paste, known for its superior thermal conductivity, has been widely used in previous studies [11,19,22], its significantly higher cost hindered its use. While nickel paste is a viable alternative, its lower thermal conductivity (2.61 W/m·K) compared to silver paste (9.61 W/m·K) could have influenced the test results, particularly given the low magnitude of the readings obtained.
In this study, the Seebeck coefficient was used to compare the thermoelectric properties of the material, in the same way that compressive strength was used to compare mechanical strength. In the future, other parameters, such as thermoelectric efficiency as measured by the figure of merit and tensile strength, should be considered in the optimisation analysis.
To accurately measure compressive strength, it is standard practice to test multiple samples of the same composite and average the results. However, this study was limited to a single sample for compressive strength testing. To supplement this limitation, microstructural analysis was conducted to evaluate the consistency of the composite. The small volume of material used in this study also compromised the mixing process, which may have affected the results.
Also, this study employed the traditional lower limit of the water–cement ratio, 0.4, to maximise the strength properties, but future research could investigate the effect of the water–cement ratio and the effect of water-retarding admixtures in enhancing the thermoelectric properties of cement composites along with their mechanical properties by using the developed Thermoelectric Strength Index parameter.
Furthermore, the development of compressive strength for GO and MnO2 may differ from that of standard cement paste, but this aspect was not investigated in the current study. Notably, MnO2 has been observed to provide high early strength compared to ordinary cement, suggesting that compressive strength testing should be conducted at different time intervals to capture these variations.
4. Conclusions
Both MnO2 and GO substantially improved thermoelectric properties compared to the control sample, with increased filler concentrations leading to better performance. The combination of GO and MnO2 yielded superior thermoelectric results, achieving a 40% higher voltage output than either filler alone, with a Seebeck coefficient of 1320 μV/°C and a maximum voltage of 56 mV. A trade-off between thermoelectric performance and compressive strength was observed, particularly in samples combining GO and MnO2. Pareto analysis revealed that no single composition could optimally achieve both thermoelectric and strength merits simultaneously. The newly developed Thermoelectric Strength Index (TSI) identified 7.5 wt.% MnO2 as the optimal composition for balancing thermoelectric efficiency and mechanical robustness.
When investigating microstructural characteristics through conventional SEM/EDS characterisation, it was observed that the GO batch used in this study appeared to adsorb free water from the mix, because the hydrated matrix seemed to be less porous compared to the other mixes. However, MnO2 seemed to be hydrated in the cement matrix along with the cement hydration, and the unreacted MnO2 seemed to be acting as a filler, and at the same time, contributing to the formation of a denser hydrated matrix. When MnO2 and GO were combined, the matrix formation was weak, and it is recommended to determine the optimum GO dosage to increase the mechanical performance of the MnO2 and GO combined composite to retain the strength while increasing the thermoelectric properties.
These findings significantly contribute to the field of cement-based thermoelectric materials by providing a comprehensive understanding of the interplay between thermoelectric efficiency and mechanical strength. The novel Thermoelectric Strength Index (TSI) offers a valuable tool for evaluating materials where both properties are crucial. By identifying optimal filler compositions, particularly the superior performance of 7.5 wt.% MnO2, this study lays the groundwork for developing more efficient and structurally viable thermoelectric cement composites. The research underscores the importance of a holistic approach to developing multifunctional construction materials, opening new avenues for practical applications in building energy harvesting. As such, this study serves as a stepping-stone towards integrating thermoelectric capabilities into structural materials, advancing sustainable construction practices and energy-efficient building design.
Author Contributions
Conceptualization, J.S.P.; Formal analysis, J.S.P., A.S., A.K., L.H. and P.T.; Investigation, A.S., A.K., L.H. and P.T.; Methodology, J.S.P., S.K.B., A.K., L.H. and P.T.; Project administration, P.M. and S.K.B.; Resources, J.S.P., P.M. and S.K.B.; Supervision, J.S.P., P.M. and S.K.B.; Validation, A.K., L.H. and P.T.; Visualisation, A.S.; Writing—original draft, J.S.P. and A.S. All authors have read and agreed to the published version of the manuscript.
Funding
This research was funded by the University of Melbourne through capstone budget allocation.
Data Availability Statement
The dataset is available on request from the authors. The raw data supporting the conclusions of this article will be made available by the authors on request.
Conflicts of Interest
The authors declare no conflict of interest.
References
- Akbari, H.; Levinson, R. Evolution of Cool-Roof Standards in the US. Adv. Build. Energy Res. 2008, 2, 1–32. [Google Scholar] [CrossRef]
- Nichol, J.; Wong, M.S. Modeling Urban Environmental Quality in a Tropical City. Landsc. Urban Plan. 2005, 73, 49–58. [Google Scholar] [CrossRef]
- Santamouris, M.; Papanikolaou, N.; Livada, I.; Koronakis, I.; Georgakis, C.; Argiriou, A.; Assimakopoulos, D.N. On the Impact of Urban Climate on the Energy Consumption of Buildings. Sol. Energy 2001, 70, 201–216. [Google Scholar] [CrossRef]
- Santamouris, M.; Ding, L.; Fiorito, F.; Oldfield, P.; Osmond, P.; Paolini, R.; Prasad, D.; Synnefa, A. Passive and Active Cooling for the Outdoor Built Environment—Analysis and Assessment of the Cooling Potential of Mitigation Technologies Using Performance Data from 220 Large Scale Projects. Sol. Energy 2017, 154, 14–33. [Google Scholar] [CrossRef]
- Reilly, A.; Kinnane, O. The Impact of Thermal Mass on Building Energy Consumption. Appl. Energy 2017, 198, 108–121. [Google Scholar] [CrossRef]
- Goldsmid, H.J. Bismuth Telluride and Its Alloys as Materials for Thermoelectric Generation. Materials 2014, 7, 2577–2592. [Google Scholar] [CrossRef]
- Jaldurgam, F.F.; Ahmad, Z.; Touati, F.; Ashraf, A.A.; Bhadra, J.; Altahtamouni, T.; Al-Thani, N.J. Thermal and Mechanical Stability of Microwave Sintered Cold Compact Bismuth Telluride Thermoelectric Material. Mater. Today Commun. 2022, 31, 103345. [Google Scholar] [CrossRef]
- Wang, X.; Dong, S.; Ashour, A.; Han, B. Energy-Harvesting Concrete for Smart and Sustainable Infrastructures. J. Mater. Sci. 2021, 56, 16243–16277. [Google Scholar] [CrossRef]
- Sun, M.; Li, Z.; Mao, Q.; Shen, D. Thermoelectric Percolation Phenomena in Carbon Fiber-Reinforced Concrete. Cem. Concr. Res. 1998, 28, 1707–1712. [Google Scholar] [CrossRef]
- Wen, S.; Chung, D.D.L. Seebeck Effect in Carbon Fiber-Reinforced Cement. Cem. Concr. Res. 1999, 29, 1989–1993. [Google Scholar] [CrossRef]
- Wen, S.; Chung, D.D.L. Seebeck Effect in Steel Fiber Reinforced Cement. Cem. Concr. Res. 2000, 30, 661–664. [Google Scholar] [CrossRef]
- Wen, S.; Chung, D.D.L. Cement-Based Thermocouples. Cem. Concr. Res. 2001, 31, 507–510. [Google Scholar] [CrossRef]
- Senevirathne, D.M.; Jayasooriya, V.M.; Dassanayake, S.M.; Muthukumaran, S. Effects of Pavement Texture and Colour on Urban Heat Islands: An Experimental Study in Tropical Climate. Urban Clim. 2021, 40, 101024. [Google Scholar] [CrossRef]
- Moosberg-Bustnes, H.; Lagerblad, B.; Forssberg, E. The Function of Fillers in Concrete. Mat. Struct. 2004, 37, 74–81. [Google Scholar] [CrossRef]
- Sun, M.; Li, Z.; Mao, Q.; Shen, D. Study on the Hole Conduction Phenomenon in Carbon Fiber-Reinforced Concrete. Cem. Concr. Res. 1998, 28, 549–554. [Google Scholar] [CrossRef]
- Wei, Y.; Cui, Y.; Wang, Y. Ionic Thermoelectric Effect of Pure Cement Paste and Its Temperature Sensing Performance. Constr. Build. Mater. 2023, 364, 129898. [Google Scholar] [CrossRef]
- Ghosh, S.; Harish, S.; Rocky, K.A.; Ohtaki, M.; Saha, B.B. Graphene Enhanced Thermoelectric Properties of Cement Based Composites for Building Energy Harvesting. Energy Build. 2019, 202, 109419. [Google Scholar] [CrossRef]
- Ghosh, S.; Harish, S.; Ohtaki, M.; Saha, B.B. Enhanced Figure of Merit of Cement Composites with Graphene and ZnO Nanoinclusions for Efficient Energy Harvesting in Buildings. Energy 2020, 198, 117396. [Google Scholar] [CrossRef]
- Cui, Y.; Wei, Y. Mixed “Ionic-Electronic” Thermoelectric Effect of Reduced Graphene Oxide Reinforced Cement-Based Composites. Cem. Concr. Compos. 2022, 128, 104442. [Google Scholar] [CrossRef]
- Cao, J.; Chung, D.D.L. Role of Moisture in the Seebeck Effect in Cement-Based Materials. Cem. Concr. Res. 2005, 35, 810–812. [Google Scholar] [CrossRef]
- Ji, T.; Zhang, X.; Li, W. Enhanced Thermoelectric Effect of Cement Composite by Addition of Metallic Oxide Nanopowders for Energy Harvesting in Buildings. Constr. Build. Mater. 2016, 115, 576–581. [Google Scholar] [CrossRef]
- Ji, T.; Zhang, S.; He, Y.; Zhang, X.; Zhang, X.; Li, W. Enhanced Thermoelectric Property of Cement-Based Materials with the Synthesized MnO2/Carbon Fiber Composite. J. Build. Eng. 2021, 43, 103190. [Google Scholar] [CrossRef]
- Wei, J.; Hao, L.; He, G.; Yang, C. Enhanced Thermoelectric Effect of Carbon Fiber Reinforced Cement Composites by Metallic Oxide/Cement Interface. Ceram. Int. 2014, 40, 8261–8263. [Google Scholar] [CrossRef]
- Liu, X.; Qu, M.; Nguyen, A.P.T.; Dilley, N.R.; Yazawa, K. Characteristics of New Cement-Based Thermoelectric Composites for Low-Temperature Applications. Constr. Build. Mater. 2021, 304, 124635. [Google Scholar] [CrossRef]
- Ji, T.; Zhang, X.; Zhang, Y.; Li, W. Effect of Manganese Dioxide Nanorods on the Thermoelectric Properties of Cement Composites. J. Mater. Civ. Eng. 2018, 30, 04018224. [Google Scholar] [CrossRef]
- Choi, K.; Kim, D.; Chung, W.; Cho, C.; Kang, S.-W. Nanostructured Thermoelectric Composites for Efficient Energy Harvesting in Infrastructure Construction Applications. Cem. Concr. Compos. 2022, 128, 104452. [Google Scholar] [CrossRef]
- Wei, J.; Zhao, L.; Zhang, Q.; Nie, Z.; Hao, L. Enhanced Thermoelectric Properties of Cement-Based Composites with Expanded Graphite for Climate Adaptation and Large-Scale Energy Harvesting. Energy Build. 2018, 159, 66–74. [Google Scholar] [CrossRef]
- Song, P.S.; Hwang, S. Mechanical Properties of High-Strength Steel Fiber-Reinforced Concrete. Constr. Build. Mater. 2004, 18, 669–673. [Google Scholar] [CrossRef]
- Fantu, T.; Alemayehu, G.; Kebede, G.; Abebe, Y.; Selvaraj, S.K.; Paramasivam, V. Experimental Investigation of Compressive Strength for Fly Ash on High Strength Concrete C-55 Grade. Mater. Today Proc. 2021, 46, 7507–7517. [Google Scholar] [CrossRef]
- Mazloom, M.; Ramezanianpour, A.A.; Brooks, J.J. Effect of Silica Fume on Mechanical Properties of High-Strength Concrete. Cem. Concr. Compos. 2004, 26, 347–357. [Google Scholar] [CrossRef]
- Sarıdemir, M. Effect of Silica Fume and Ground Pumice on Compressive Strength and Modulus of Elasticity of High Strength Concrete. Constr. Build. Mater. 2013, 49, 484–489. [Google Scholar] [CrossRef]
- Ginigaddara, T.; Ekanayake, J.; Mendis, P.; Devapura, P.; Liyanage, A.; Vaz-Serra, P. An Introduction to High Performance Graphene Concrete. Electron. J. Struct. Eng. 2022, 22, 11–18. [Google Scholar] [CrossRef]
- Mohotti, D.; Mendis, P.; Wijesooriya, K.; Fonseka, I.; Weerasinghe, D.; Lee, C.-K. Abrasion and Strength of High Percentage Graphene Oxide (GO) Incorporated Concrete. Electron. J. Struct. Eng. 2022, 22, 37–43. [Google Scholar] [CrossRef]
- Maizuar, M.; Fithra, H.; Yusuf, K.; Usrina, N.; Bahri, S.; Senin, S.F. Mechanical Properties of High-Volume Fly Ash Mortar Modified by Hybrid Carbon Nano Tube and Graphene Oxide. Electron. J. Struct. Eng. 2024, 24, 23–27. [Google Scholar] [CrossRef]
- Prasad, R.; Nirmala, D.D.B.; Venkatesh, S.; Aili, M.; NN, S.C. Enhancement of Concrete Microstructure Using Graphene Oxide as a Cement Additive: An Experimental Study. Electron. J. Struct. Eng. 2024, 24, 38–42. [Google Scholar] [CrossRef]
- Liu, M.; Lin, K.; Zhou, M.; Wallwork, A.; Bissett, M.A.; Young, R.J.; Kinloch, I.A. Mechanism of Gas Barrier Improvement of Graphene/Polypropylene Nanocomposites for New-Generation Light-Weight Hydrogen Storage. Compos. Sci. Technol. 2024, 249, 110483. [Google Scholar] [CrossRef]
- Torre, A.; Shuan, L.; Quintana, N.; Moromi, I.; Basurto, J.; Mosquera, L.; Cortez, N. Effect of the Addition of Manganese Dioxide Nanoparticles on the Mechanical Properties of Concrete against Carbonation and Sulfate Attack. Buildings 2024, 14, 3094. [Google Scholar] [CrossRef]
- Wei, J.; Zhou, Y.; Wang, Y.; Miao, Z.; Guo, Y.; Zhang, H.; Li, X.; Wang, Z.; Shi, Z. A Large-Sized Thermoelectric Module Composed of Cement-Based Composite Blocks for Pavement Energy Harvesting and Surface Temperature Reducing. Energy 2023, 265, 126398. [Google Scholar] [CrossRef]
- Cui, Y.; Wei, Y. Effect of Pore Structure on the Ionic Thermoelectric Effect of Pure Cement Paste. Ceram. Int. 2024, 50, 26558–26568. [Google Scholar] [CrossRef]
- Hong, C.-H.; Chong, S.-H.; Cho, G.-C. Theoretical Study on Geometries of Electrodes in Laboratory Electrical Resistivity Measurement. Appl. Sci. 2019, 9, 4167. [Google Scholar] [CrossRef]
- Gandía-Romero, J.M.; Ramón, J.E.; Bataller, R.; Palací, D.G.; Valcuende, M.; Soto, J. Influence of the Area and Distance between Electrodes on Resistivity Measurements of Concrete. Mater. Struct. 2016, 50, 71. [Google Scholar] [CrossRef]
- Dong, W.; Li, W.; Long, G.; Tao, Z.; Li, J.; Wang, K. Electrical Resistivity and Mechanical Properties of Cementitious Composite Incorporating Conductive Rubber Fibres. Smart Mater. Struct. 2019, 28, 085013. [Google Scholar] [CrossRef]
- Ghahari, S.; Ghafari, E.; Lu, N. Effect of ZnO Nanoparticles on Thermoelectric Properties of Cement Composite for Waste Heat Harvesting. Constr. Build. Mater. 2017, 146, 755–763. [Google Scholar] [CrossRef]
- Zuo, J.Q.; Yao, W.; Qin, J.J.; Cao, H.Y. Measurements of Thermoelectric Behavior and Microstructure of Carbon Nanotubes/Carbon Fiber-Cement Based Composite. Key Eng. Mater. 2012, 492, 242–245. [Google Scholar] [CrossRef]
- Wu, C.; Zhang, J.; Zhang, Y.; Zeng, Y. A 7.5-mV Input and 88%-Efficiency Single-Inductor Boost Converter with Self-Startup and MPPT for Thermoelectric Energy Harvesting. Micromachines 2023, 14, 60. [Google Scholar] [CrossRef]
- Fonseka, I.; Mohotti, D.; Wijesooriya, K.; Lee, C.-K.; Mendis, P. Influence of Graphene Oxide Properties, Superplasticiser Type, and Dispersion Technique on Mechanical Performance of Graphene Oxide-Added Concrete. Constr. Build. Mater. 2024, 428, 136415. [Google Scholar] [CrossRef]
- Wei, J.; Wang, Y.; Li, X.; Jia, Z.; Qiao, S.; Zhang, Q.; Du, J. Effect of Porosity and Crack on the Thermoelectric Properties of Expanded Graphite/Carbon Fiber Reinforced Cement-Based Composites. Int. J. Energy Res. 2020, 44, 6885–6893. [Google Scholar] [CrossRef]
Disclaimer/Publisher’s Note: The statements, opinions and data contained in all publications are solely those of the individual author(s) and contributor(s) and not of MDPI and/or the editor(s). MDPI and/or the editor(s) disclaim responsibility for any injury to people or property resulting from any ideas, methods, instructions or products referred to in the content. |
© 2025 by the authors. Licensee MDPI, Basel, Switzerland. This article is an open access article distributed under the terms and conditions of the Creative Commons Attribution (CC BY) license (https://creativecommons.org/licenses/by/4.0/).