Article

Effect of Thermal Cycling or Simulated Gastric Acid on the Surface Characteristics of Dental Ceramic Materials

by
Panagiotis Pandoleon
1,
Katia Sarafidou
1,
Georgia K. Pouroutzidou
2,
Anna Theocharidou
1,
George A. Zachariadis
3 and
Eleana Kontonasaki
1,*
1
Section of Prosthodontics, Department of Dentistry, School of Health Sciences, Aristotle University of Thessaloniki (A.U.Th), GR-54124 Thessaloniki, Greece
2
Department of Physics, School of Sciences, Aristotle University of Thessaloniki (A.U.Th), GR-54124 Thessaloniki, Greece
3
Department of Chemistry, School of Sciences, Aristotle University of Thessaloniki (A.U.Th), GR-54124 Thessaloniki, Greece
*
Author to whom correspondence should be addressed.
Ceramics 2024, 7(2), 530-546; https://doi.org/10.3390/ceramics7020035
Submission received: 16 February 2024 / Revised: 9 April 2024 / Accepted: 10 April 2024 / Published: 15 April 2024

Abstract

:
(1) Background: The presence of various dental ceramic materials with different chemical compositions complicates clinicians’ decision making, especially in cases with a highly acidic environment appearing in patients suffering from gastroesophageal reflux disease or other eating disorders. Thermal alterations in the oral cavity can also affect surface structure and roughness, resulting in variations in both degradation mechanisms and/or bacteria adhesion. The aim of the present in vitro study was to evaluate the effect of thermal cycling and exposure to simulated gastric acid on the surface roughness of different ceramics; (2) Methods: Five groups of different ceramics were utilized, and twenty specimens were fabricated for each group. Specimens were either thermocycled for 10,000 cycles in distilled water or immersed in simulated gastric acid for 91 h. The evaluation of surface roughness was performed with optical profilometry, while scanning electron microscopy, X-ray diffraction analysis and inductively coupled plasma atomic emission spectroscopy were also performed; (4) Conclusions: Based on the combination of the surface roughness profile and structural integrity, zirconia specimens presented the smallest changes after immersion in simulated gastric acid followed by lithium disilicate materials. Zirconia-reinforced lithium silicate ceramic presented the most notable changes in microstructure and roughness after both treatments.

1. Introduction

Esthetics and durability are the main factors a clinician should consider when choosing an appropriate ceramic dental material. Nowadays, a wide range of dental ceramics are available on the market, introduced to meet increased esthetic expectations. Recent experimental investigations aimed to improve the mechanical properties and long-term behavior of all-ceramics, and thus novel materials with an alternated chemical structure, such as CAD/CAM full-contour monolithic zirconia, zirconia-reinforced lithium disilicate, hybrid ceramic polymers, and lithium disilicate with high-density micronization, have been introduced [1,2]. It has already been demonstrated that their long-term performance may be affected by factors such as thermal and pH fluctuations in the oral cavity and long-lasting occlusal forces. The effect of aging has been widely discussed in the literature and most of the protocols include the application of thermal or chewing cycling [3,4,5,6,7,8]. Recently, research focused on the effect of corrosive factors on ceramics’ durability, surface roughness and surface microstructure. Gastric acid is one of the most corrosive body fluids, which could cause an acidic pH in the oral cavity for a prolonged time in patients suffering from gastroesophageal reflux disease (GERD). The acidic environment becomes even worse during their sleep [9]. Moreover, patients with eating disorders such as anorexia or bulimia nervosa suffer from the influence of frequent vomiting, which may lead to oral complications [10]. In addition, pregnant women experience alterations in their gastrointestinal motility, which can contribute to vomiting and GERD [11]. In the abovementioned cases, teeth and dental restorations are exposed to gastric acid for a prolonged period, which could lead to erosion. Although the effect of the acidic treatment of ceramics on their color properties has been investigated, the effect of acid exposure on the surface characteristics of contemporary dental ceramics has not been thoroughly investigated yet.
There are a wide range of ceramic materials with different compositions and crystalline structures that have recently been introduced in the dental field. The shortcomings of ceramic restorations, such as chipping, delamination, or low-temperature degradation, in combination with the high esthetic and functional demands of patients have led dental ceramic manufacturers to present novel ceramic materials with an altered composition to meet the abovementioned needs. However, there are a lot of studies showing that chemical attack on ceramic restorations in cases of highly acidic environments may affect the surface roughness and the material’s strength, while the degree of this effect differs depending on ceramics’ composition and structure [12,13,14,15,16,17,18,19,20,21,22,23,24]. The latter complicates the decision making of clinicians when choosing which ceramic material should be applied in each patient’s case.
Cruz et al. reported that simulated gastric acid significantly influenced the surface roughness of all-ceramic materials [18]. Al Thobity et al. also concluded that the mechanical properties and surface characteristics of zirconia and lithium disilicate were affected by acidic aging [19]. It has also been reported that lithium disilicate is more prone to ion leaching after acidic treatment, while a zirconia core material was reported to be more stable under the acidic circumstances, presenting low ion release after storage in simulated gastric fluid [20]. Moreover, little evidence exists in the literature concerning the surface roughness or microstructural alterations of newly promoted dental ceramic materials, such as zirconia-reinforced lithium disilicate ceramics or different brands of lithium disilicate materials under situations simulating the oral cavity conditions with temperature variations. Furthermore, the comparison of alterations to the surface properties and microstructure among the most popular ceramic systems could enable clinicians to choose the most appropriate system in everyday clinical practice. Information about the surface characteristics and long-term effects of simulated gastric acid is essential for dental practitioners to decide on the preferred type of restoration when treating patients with GERD or eating disorders. The aim of the present in vitro study was to evaluate the impact of thermal artificial aging and exposure to simulated gastric acid on the surface roughness of different all-ceramic materials. The null hypothesis was that surface roughness will not be affected by thermal cycling or simulated gastric fluid.

2. Materials and Methods

2.1. Specimen’s Construction

Specimens of different CAD-CAM ceramic materials were fabricated according to the manufacturers’ instructions. Five groups of specimens were included (Table 1): Group 1—Katana High Translucent—Kuraray (K); Group 2—Suprinity-Vita (S); Group 3—Enamic-Vita (E); Group 4—IPS e-max CAD-Ivoclar-Vivadent AG (I); and Group 5—LiSi Press-GC Dental Products (L).
The CAD/CAM blocks were sectioned into slabs using a water-cooled diamond saw and twenty specimens were fabricated from each group with dimensions of 10 × 10 × 1.5 mm after sintering. The sintering of specimens for group K was performed with the Ceramill Therm 3, for groups S and E it was performed with the Vita Zyrcomat T furnace, and for groups I and L it was performed with the Programmat EP3000 furnace, according to the sintering cycles recommended by the manufacturers. The specimens of group L were pressed after waxing a rectangular specimen with the appropriate dimensions, and afterwards were sintered according to the manufacturer’s instructions. One side of all specimens was polished with a series of silicon carbide papers from P500 to P1200 up to P2000 under water cooling until a mirror-like surface was achieved [20,21]. The dimensions of specimens were recorded before and after polishing using a digital micrometer with ±0.05 mm accuracy. Polishing was performed by the same researcher for all specimens. After specimens’ fabrication and polishing, half of them underwent thermal artificial cycling, whilst the other half were immersed in simulated gastric acid [6].

2.2. Aging Treatment of Specimens

Thermal cycling (TC) was performed in distilled water. A total of 10,000 cycles at temperatures of 37 °C–55 °C–37 °C–5 °C, with a dwell time of 15 s at each temperature, was considered representative for 1 year of clinical time (presence in the oral cavity) [22]. The simulated gastric acid solution (SGA) consisted of 5% hydrochloric acid (pH = 2). Specimens were immersed and placed in an incubator at 37 °C for 91 h, equivalent to 1 year of clinical time in the oral cavity of a patient with bulimia [23,24].

2.3. Evaluation of Surface Roughness

The evaluation of surface roughness was performed with a 3D optical profilometer, conducting measurements in 5 regions per specimen (top left, top right, bottom left, bottom right and central areas). Vertical scanning of the surface was performed three times beginning from 5 different scattered spots and combined with interferometry mode (VSI) to compare values and evaluate surface roughness alterations. The Vision64 software was used at a magnification of ×10 of captured surface images. The surface roughness parameters measured were the arithmetic average of the absolute values of the surface height deviations measured from the best fitting plane (Sa); the standard deviation of the height distribution (Sq); and the 10-point height over the surface, representing the average difference between the five highest peaks and five lowest valleys (Sz). Sp represents the height of the highest peak, while Sv represents the absolute value of the height of the largest pit, within the defined area. Adding Sp to Sv gives Sz, while Sq is equivalent to the standard deviation of heights. Mean values were calculated from the measured areas of each specimen to characterize the overall roughness of the surface. For the descriptive analysis of the Sa, Sz, Sp, Sv, and Sq parameters, the mean value and the standard deviation were used. The Shapiro–Wilk test and parametric and non-parametric tests were also used, while the comparison of “baseline” and “after aging” measurements of the Sa, Sz, Sp, Sv, and Sq parameters among the five groups was performed with the analysis of variance (one-way ANOVA) or the Kruskal–Wallis test (independent samples). Pairwise comparisons were performed using Bonferroni correction. Moreover, t-test or the Wilcoxon signed-rank test were used to compare “baseline” and “after aging” measurements of the Sa, Sz, Sp, Sv, and Sq within each group (dependent samples). Analysis of data was performed with the statistical program “IBM SPSS Statistics 27”. The significance level was set at 5%.

2.4. Evaluation of Surface Morphology

Scanning electron microscopy analysis was performed on the surfaces of carbon- coated specimens before and after treatments with a scanning electron microscope supported by an energy dispersive X-ray spectroscopy (EDS) system. For EDS analyses, backscattered microphotographs were collected and chemical analyses were performed with a 15 kV accelerating voltage and a 0.4 mA probe current, revealing differences in the surface chemical synthesis of the tested groups. Further analysis of the crystalline phases of the surface (before and after thermal cycling and exposure to simulated gastric acid) was performed by means of X-ray diffraction analysis (XRD). XRD analysis was carried out using a diffractometer with Ni-filtered CuK radiation. Diffraction patterns were obtained from 0° to 75° at a scan speed of 0.008°/min.

2.5. Ion Release Investigation

Inductively coupled plasma atomic emission spectroscopy (ICP—AES) was used to quantify leachable ions and provide evidence concerning surface ceramic specimens’ degradation. High-purity double-distilled water was prepared using two ion exchanging columns and was used for all purposes of solution preparation and dilution. Concentrated nitric acid (65% m/m) was used for the preparation of working standards with proper dilutions of stock standards (1000 mg L−1) of Si, Zn, Ca, Al, Hf and P. All sample dilution glassware was soaked in 10% (v/v) nitric acid for 24 h before use and eventually washed extensively with double de-ionized water prior to all experiments. All sample extracts were analyzed without any other pretreatment, except for several ones that required a 10-fold dilution, to eliminate possible matrix effects on plasma stability. For the determination of the analytes, an axial viewing ICP-AES system was employed. The plasma atomizer was attached to a cyclonic spray chamber and a crossflow nebulizer. The following analytical wavelengths were monitored for measuring the emission of the chemical elements: Si, 251.611 and 212.412 nm; Zn, 213.857 and 202.548 nm; Ca, 317.933 and 396.847 nm; Al, 308.215 and 237.313 nm; Hf, 277.336 and 232.247 nm; and P, 213.617 and 214.914 nm. The final sample concentrations were calculated based on the calibration curves at the optimum emission line for each element. Regression analysis was employed to construct the calibration curves, including five multi-element and singe-element solutions at a concentration of 0, 0.2, 0.5, 1, and 5 mg/L.

2.6. Evaluation of Biological Behavior

Human fibroblasts cultures were established from human biopsies of a healthy donor during routine third molar extraction using the enzymatic separation technique. The Institutional Ethical Committee approved the protocol (#35/07-05-2018) and volunteer patients signed the informed consent form before extraction. Cell cultures were developed in flasks with 5 mL of DMEM supplemented with 10% fetal bovine serum (FBS, Invitrogen) and antibiotics (100 U/mL medium of penicillin, 100 mg/mL streptomycin, Invitrogen). When 80% confluence was achieved, fibroblasts were detached by means of trypsinization (using 0.25% trypsin/1 mM EDTA) and then subcultured in 75 mL flasks at 37 °C in an incubator in an air atmosphere with 95% humidity and 5% CO2. Passage 5 was used during the experiments of this in vitro study.
Cytotoxicity evaluation of tested groups was performed using the MTT assay. Cells were seeded in 24-well plates (1 × 10⁴ cells/well) in direct contact with the ceramic specimens. A total of 135 specimens were used, with 27 per ceramic group (K, S, E, L and I) divided into 9 per treatment (no treatment, TC, SGA) and 3 per incubation time point (1, 3 and 5 days). Wells with only cells, without specimens, served as the positive controls. Evaluation of mitochondrial activity, and thus cell viability, was performed by measuring the mitochondrial dehydrogenase activity of living cells, which was verified by the transformation of the yellow tetrazolium measured via spectrophotometry at a wavelength of 545 nm and a reference filter of 630 nm using a microplate reader (Epoch, Biotek, Biotek instruments, Inc., Winooski, VT, USA) at each time point. MTT assay values were presented as an average percentage of the positive control values. Statistical analysis was performed with the paired-sample t-test. The level of statistical significance was set at 0.05. One-way analysis of variance (one-way ANOVA) was used to compare %OD between the different materials (K, S, E, L, I, C) within each group (No treatment, TC and SGA) at each day (day 1, day 3 and day 5) separately. Two-way repeated measures ANOVA was used to compare the %OD between times (day 1, day 3 and day 5) and within each material. Bonferroni corrections were performed to adjust for multiple comparisons. Statistical analysis was performed using “IBM SPSS Statistics 28”.

3. Results

3.1. Surface Roughness

The mean values of different surface roughness parameters are presented in Table 2 and Table 3. Sa values provide an arithmetical evaluation of surface texture, with high values indicating a rough surface.
Sa parameter: Baseline mean values of Sa presented statistically significant differences among the tested groups (p < 0.001). Regarding the change in Sa within each group after SGA exposure, there were no statistically significant differences in any of the tested groups, while after TC, the only significant difference was recorded for the S group, which presented significantly higher mean Sa values after TC (p = 0.047).
Sz parameter: The baseline Sz mean value of all groups before immersion in SGA or TC presented significant differences (p < 0.001). Regarding the change in Sz within each group after SGA exposure, there were statistically significant differences only for the I and L groups, which presented a significant decrease (p = 0.014 for I and p = 0.017 for L). After TC, a significant increase was recorded for the E, K and S groups, a significant decrease was recorded for the L group and no difference was recorded for the I group.
Sv parameter: The baseline Sv mean value of all groups before immersion in SGA or TC presented significant differences (p < 0.001). Within each group, after SGA, the S and I groups presented a significant increase in mean Sv and group L displayed a significant decrease, while after TC, a significant decrease was recorded for only the I and L groups.
Sq parameter: The baseline Sq mean value of all groups before immersion in SGA or TC presented significant differences (p < 0.001). Within each group, the Sq parameter presented a statistically significant decrease after SGA for the I group and a significant increase after TC for the S group.
Sp parameter: The baseline Sp mean value of all groups before immersion in SGA or TC presented significant differences (p = 0.006 for SGA and p < 0.001 for TC). Within each group, the Sp parameter did not present significant differences for any of the tested groups after SGA, but presented a significant increase after TC for the E, K and S groups.
In conclusion, simulated SGA and especially TC affected t esurface roughness parameters, increasing the roughness of the specimens from the zirconia, dual-network ceramic-polymer and zirconia-reinforced lithium silicate ceramic groups (K, E and S) and decreasing the roughness of the specimens from the lithium disilicate groups (I and L). Zirconia specimens presented the lowest surface roughness at baseline and after both TC and SGA. In contrast, the dual-network ceramics presented the highest surface roughness values.

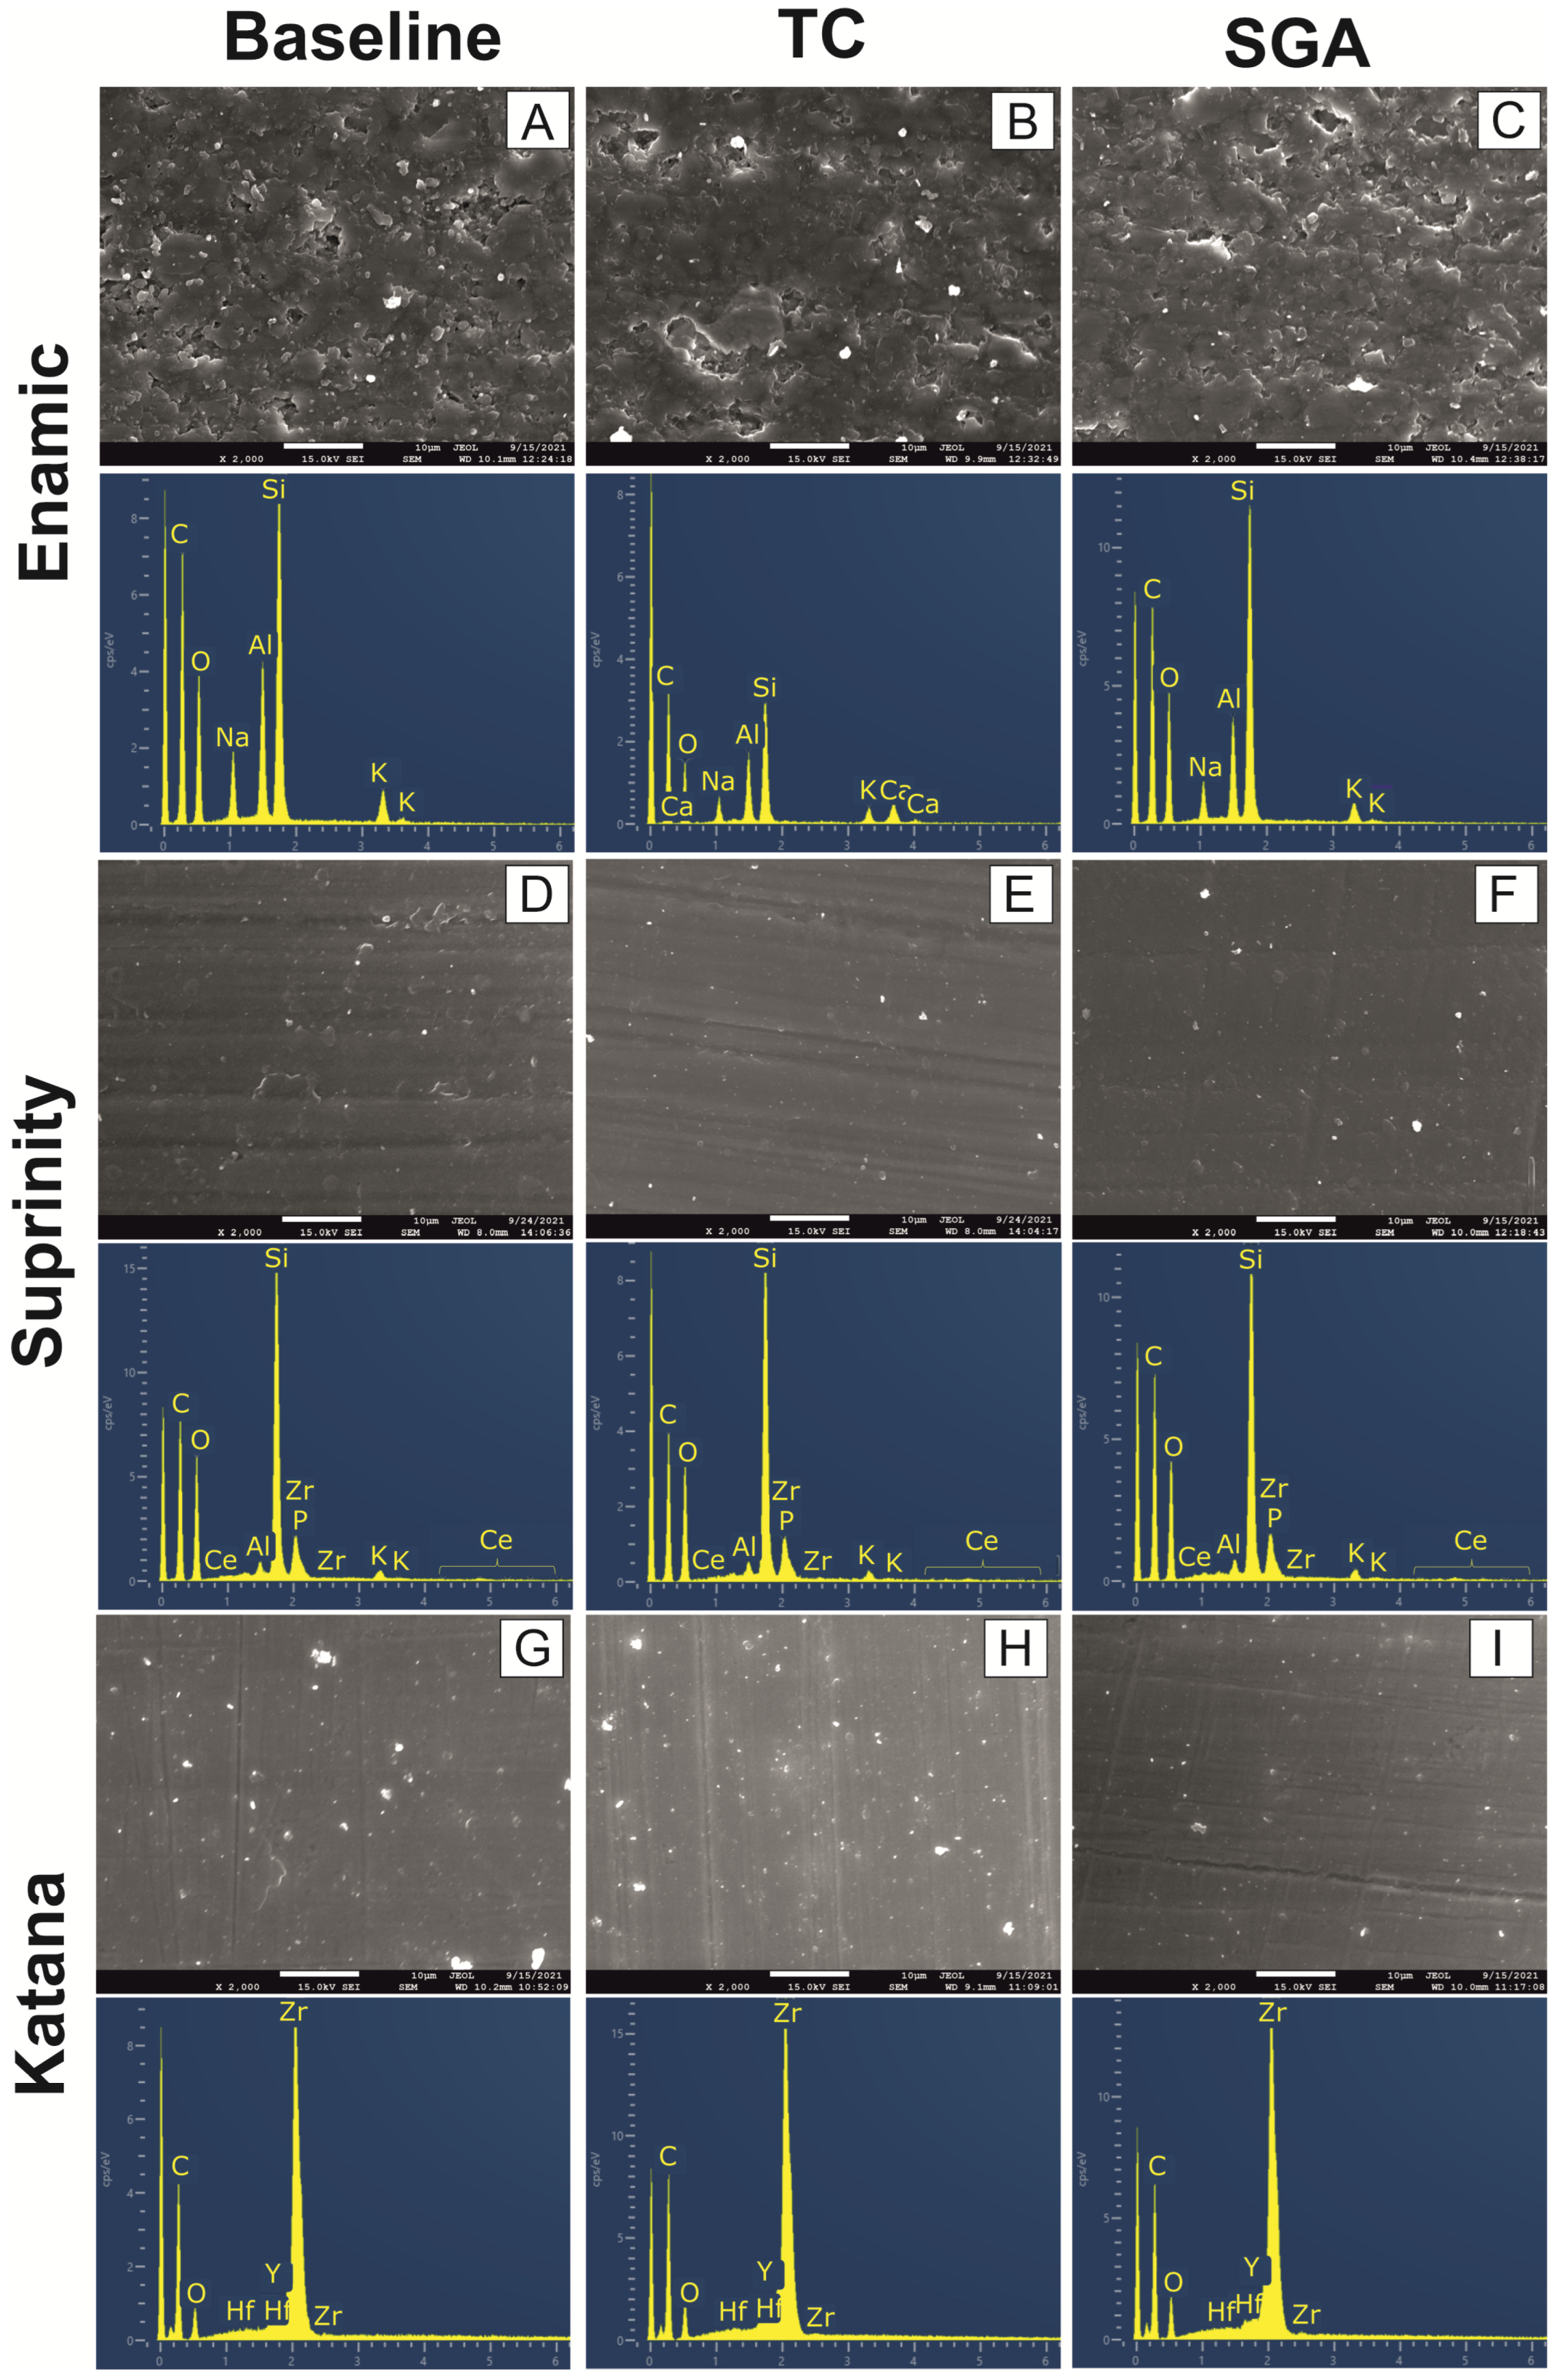
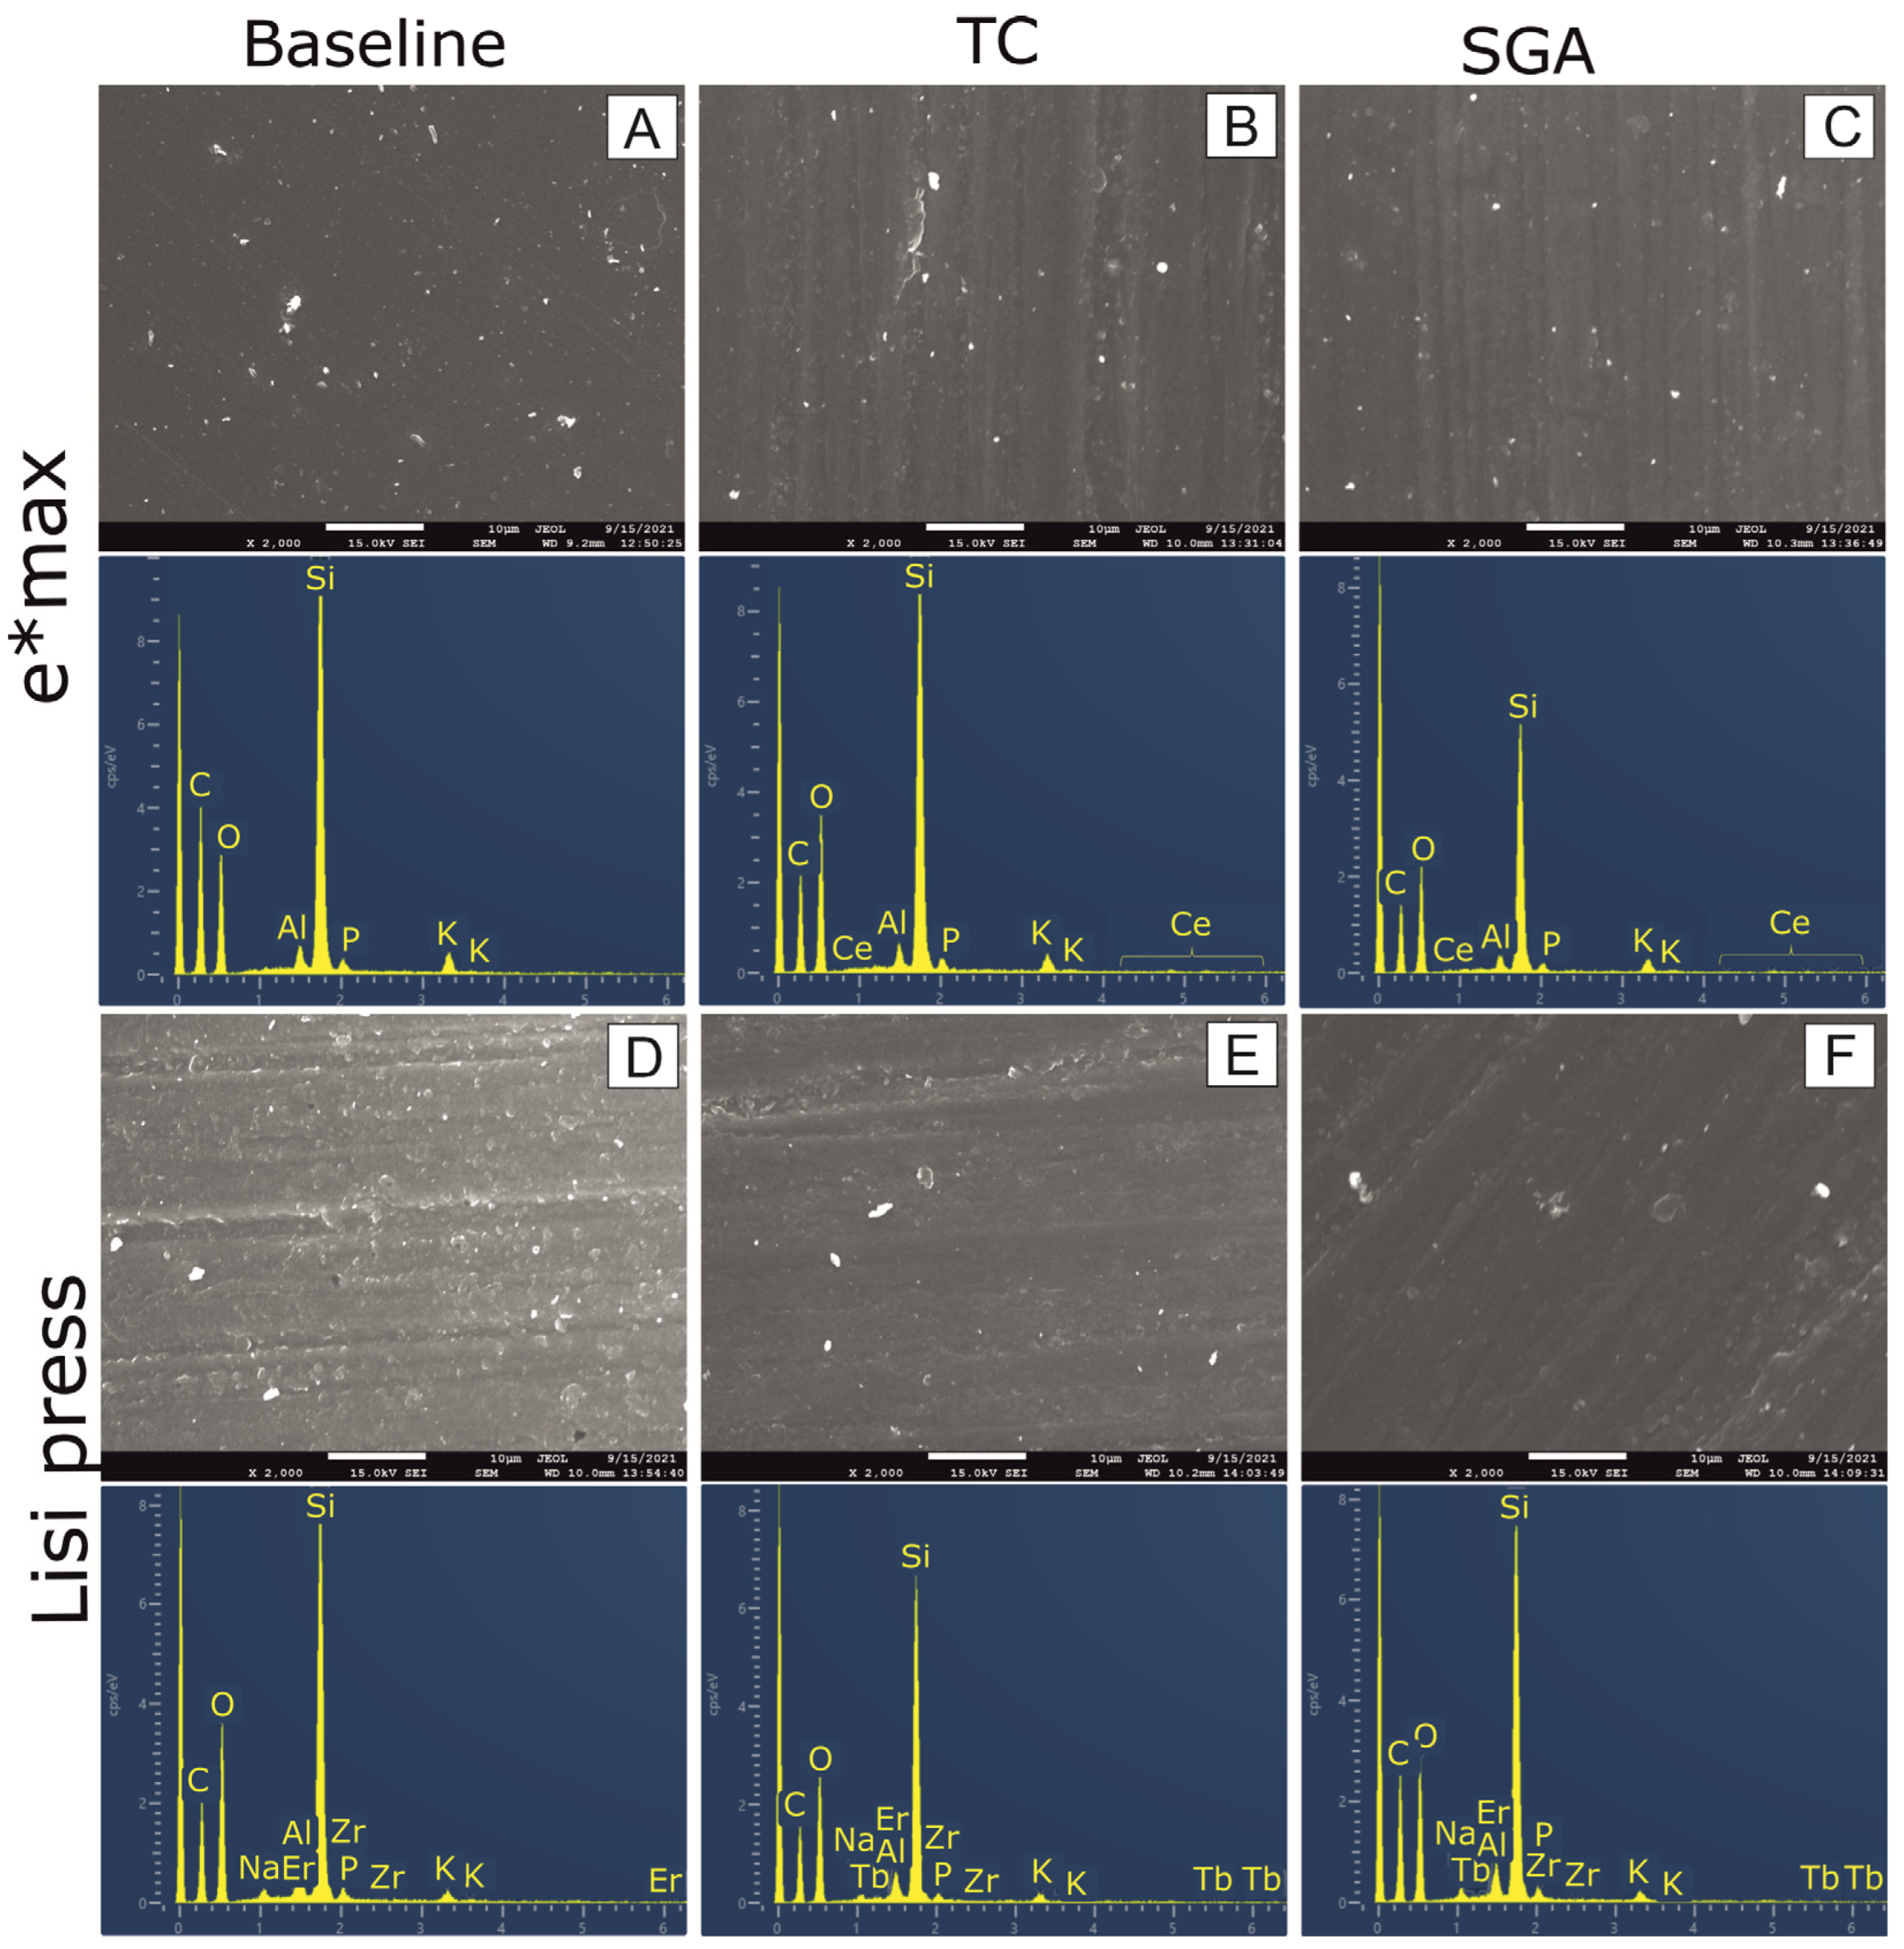
3.2. Evaluation of Surface Morphology

Representative SEM micrographs of specimens from each group before and after TC and SGA are presented in Figure 1 and Figure 2.
Polishing lines were detected in all cases, except for the specimens in group E. The surface of the K, S, L and I specimens appeared to be smooth, presenting spatially located pores and rarely observed peaks. The micrographs of E and L specimens presented peaks and valleys, showing that the surface is not as smooth as in the other tested groups. Furthermore, boundaries enhancing the connection between ceramic and polymer ingredients were observed on the surface of E specimens. In addition to the SEM micrographs, back scattered micrographs were also combined with EDS analysis, as all materials presented different compositions, and TC or SGA might have caused alterations due to ion leaching or crystalline phase transformations. EDS analysis is a qualitative method used to evaluate composition, and in the present study, it did not indicate any remarkable alterations to the basic elements located on the surface of all specimens.

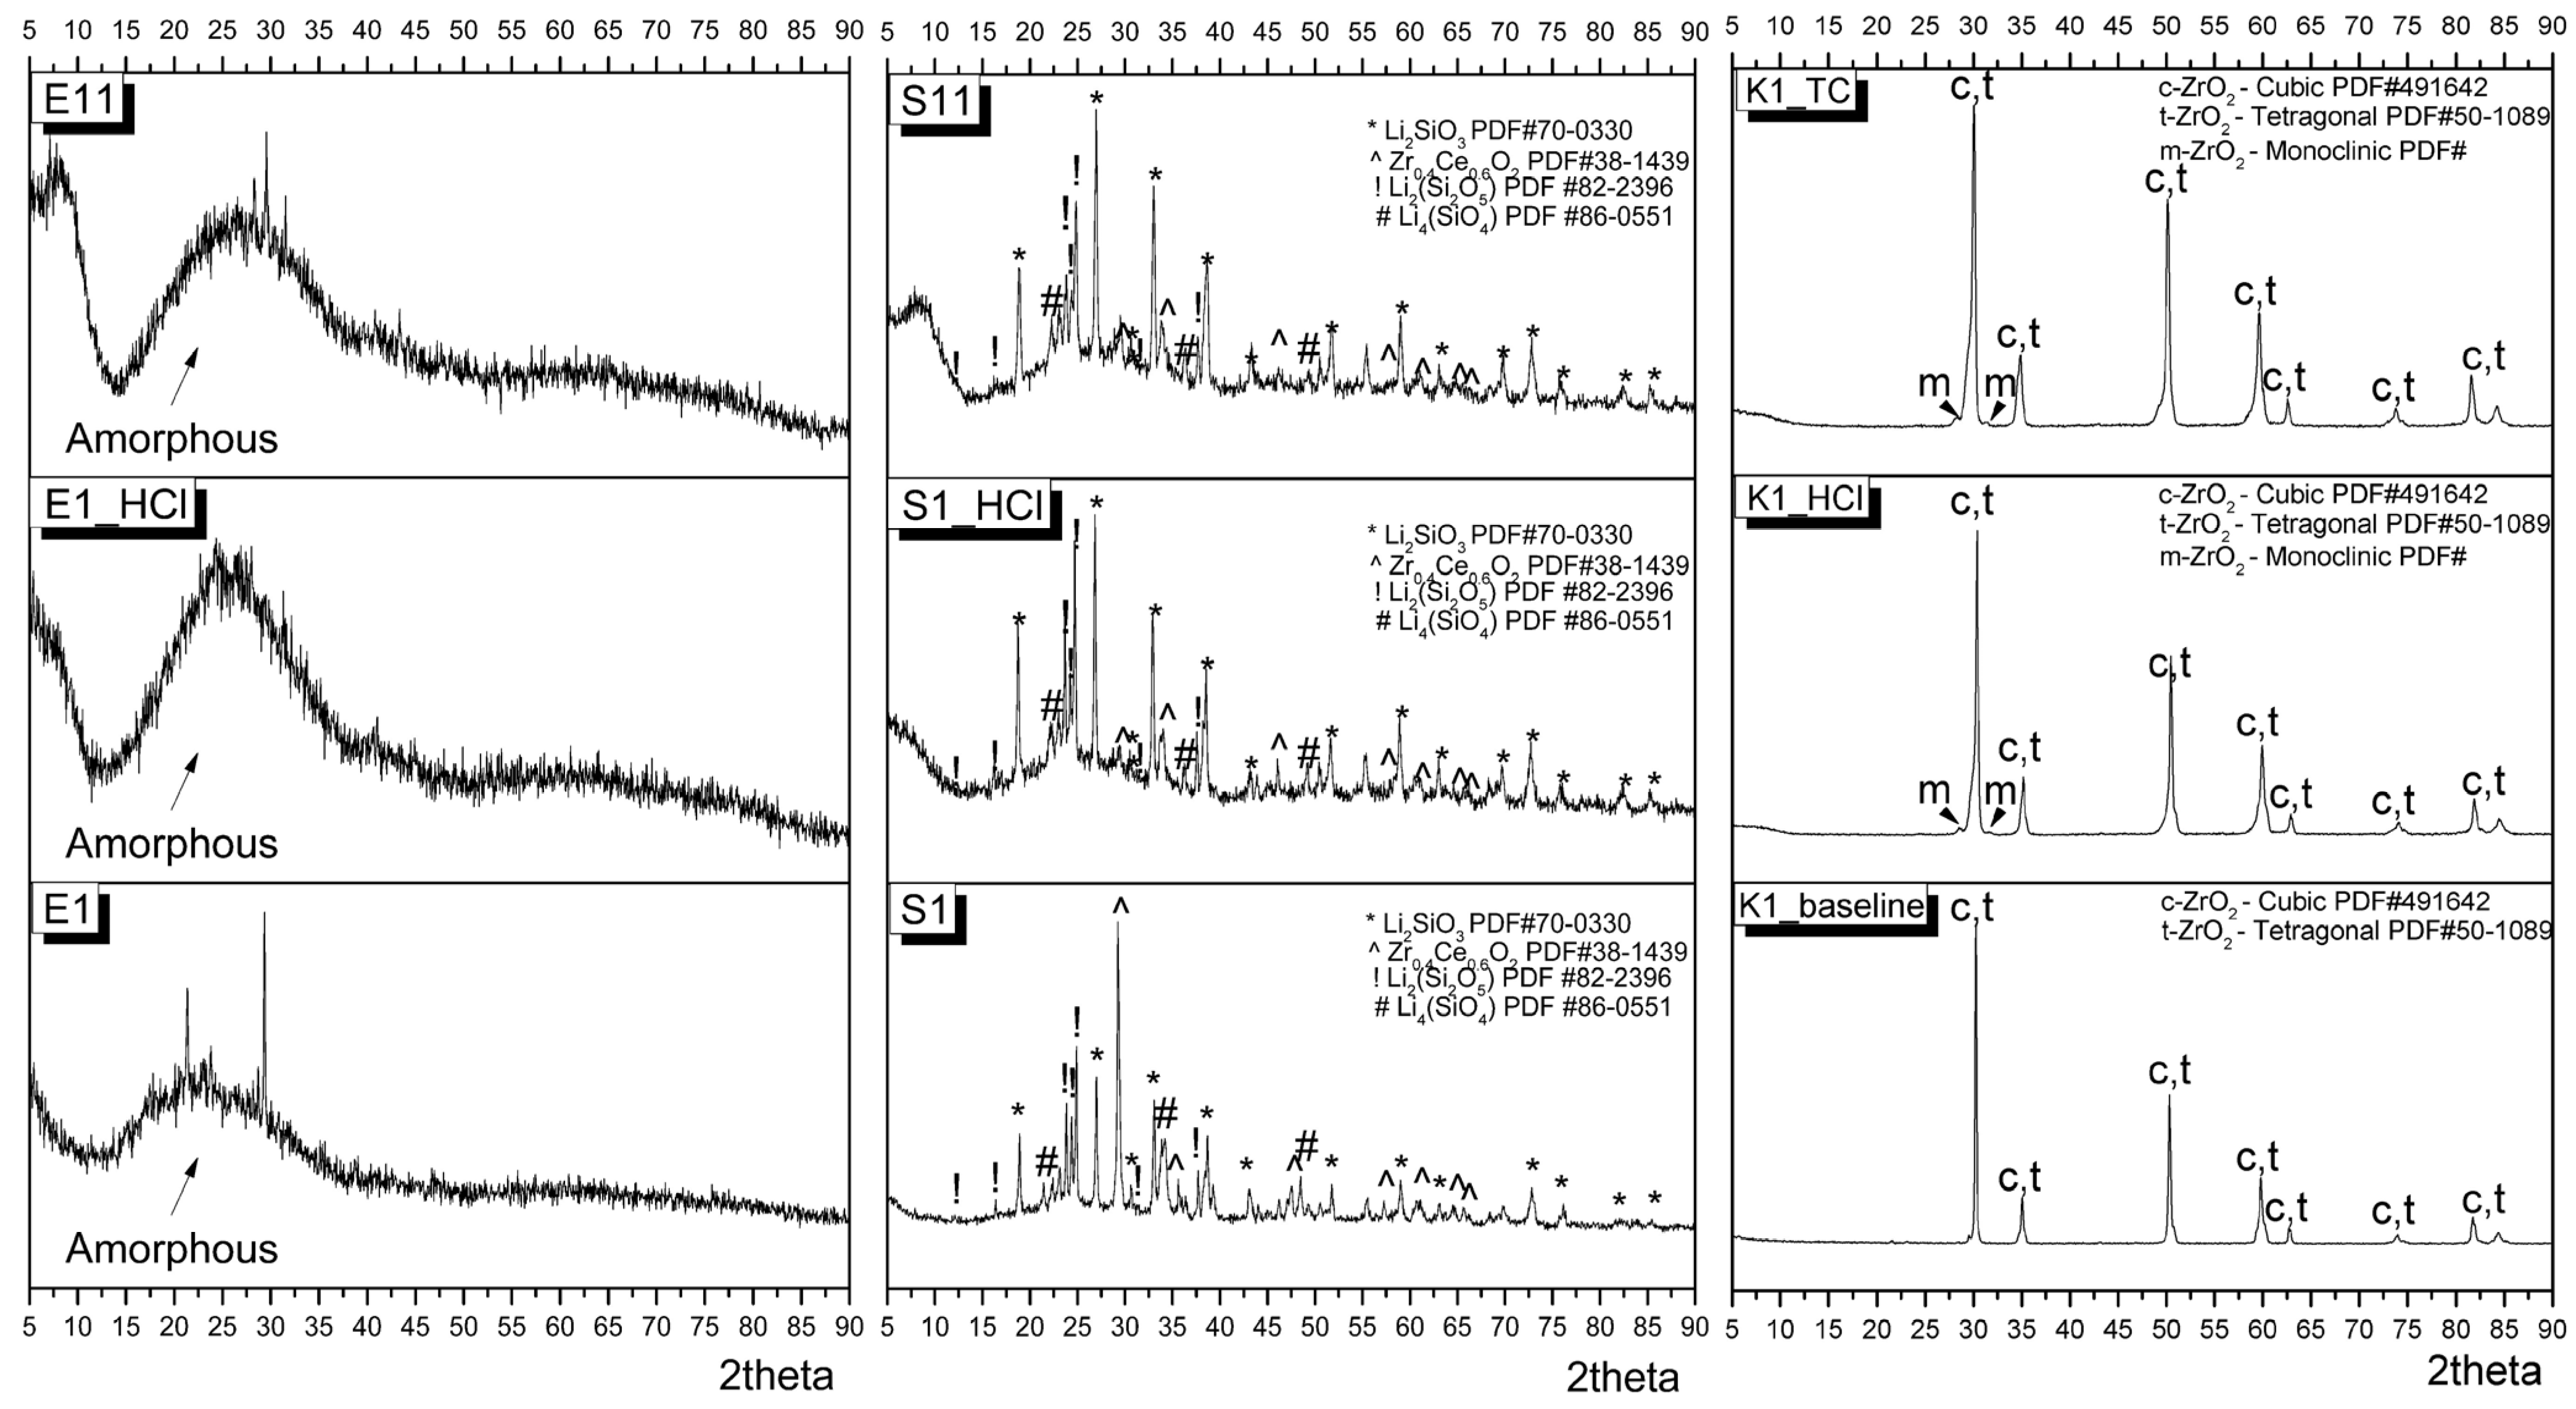
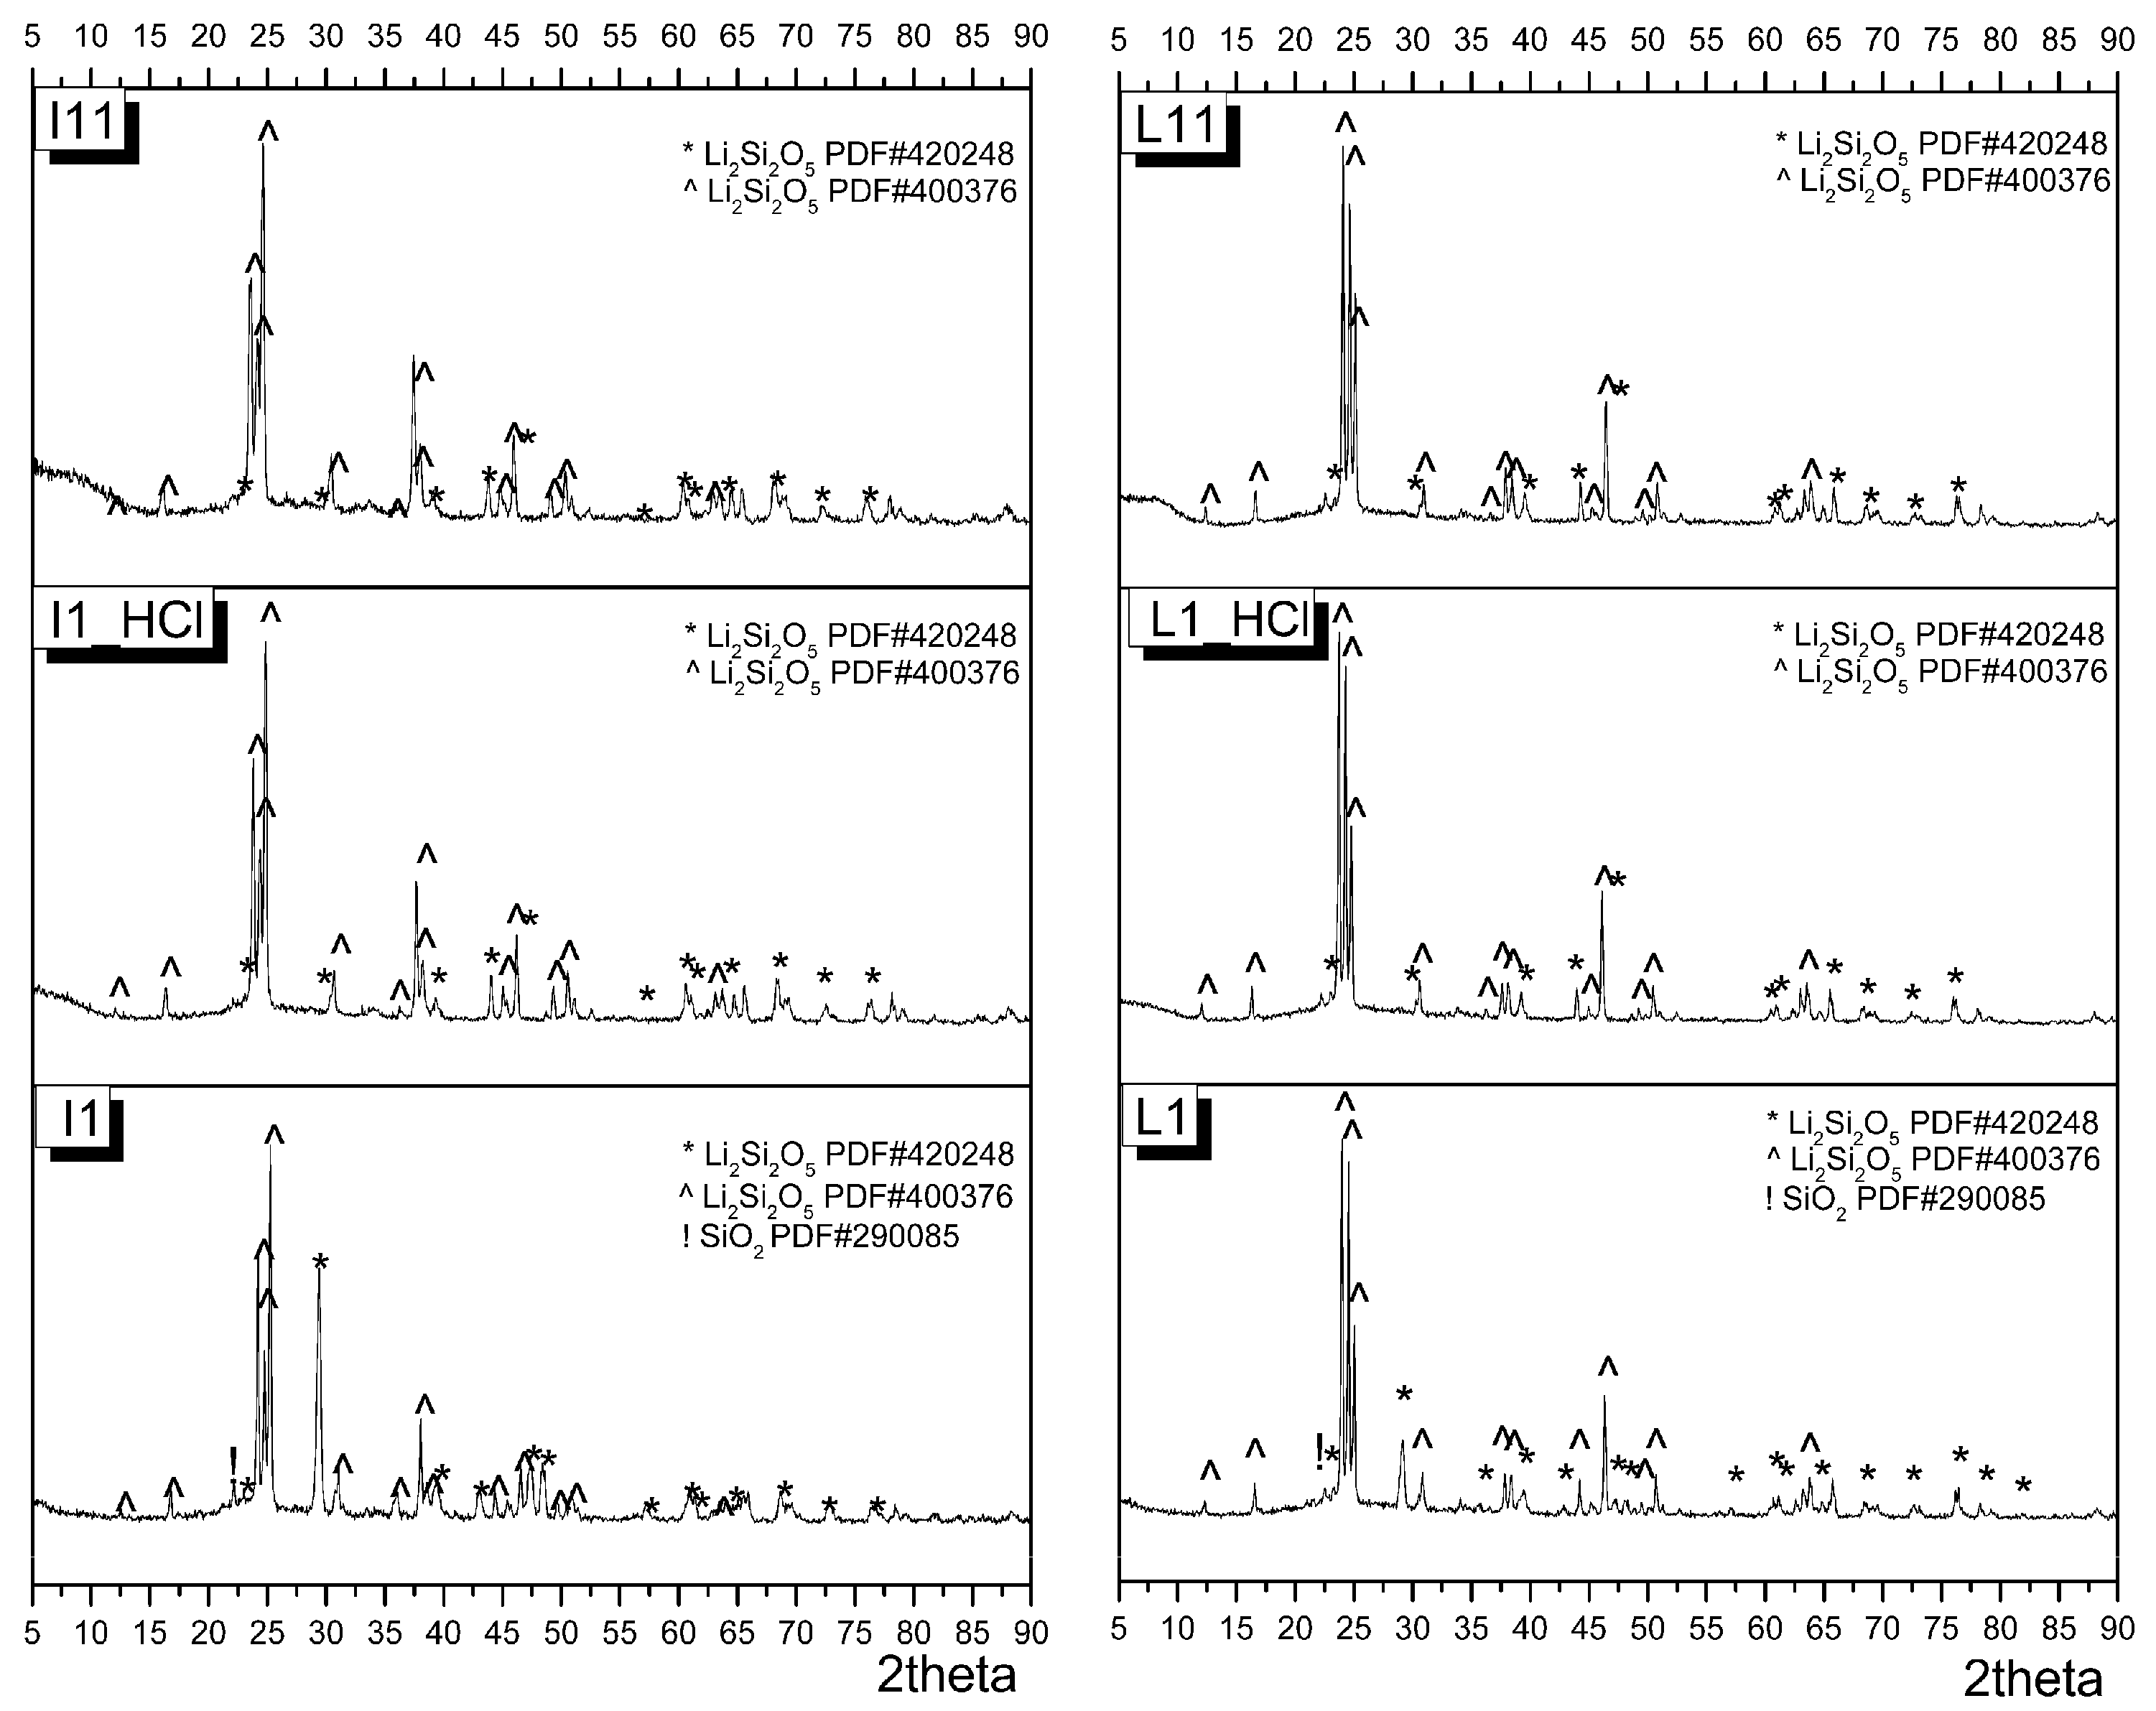
3.3. X-ray Diffraction Analysis

To determine the crystallographic structure of the materials, and to provide information about chemical composition before and after thermocycling and immersion in artificial gastric acid, X-ray diffraction was applied. XRD patterns for all groups are given in Figure 3 and Figure 4, whereas analysis of the results is given in Table 4.
For specimens in group K, the t→m transformation after both treatments led to an increase in the monoclinic phase content. After acidic storage, a slight broadening of the main peaks suggests lattice distortion for this group. The surfaces of specimens of group E appeared 100% amorphous after acidic aging. Lithium disilicate specimens (Groups L and I) showed a slight increase in the amorphous content after both thermocycling and acidic aging, while SiO2 was not detected after both treatments. The main crystalline phases detected for group S were lithium metasilicate (Li2SiO3), lithium disilicate (Li2(Si2O5)), lithium orthosilicate (Li4(SiO4)) and a cerium-rich phase (Zr0.4Ce0.6O2). These phases were retained after treatments, while a slight increase in the amorphous content was observed after acidic storage.

3.4. Ions’ Release Investigation (ICP/AES)

ICP—AES results are presented in Table 5. Ions such as Ca, P, Al, Zn, Hf and Si were detected. Si was detected at the highest concentration values, while Hf was detected at the lowest concentration values. All materials presented Si ion leaching except for K specimens due to their composition and microstructure. Furthermore, Al ions were released at higher concentrations in the case of E specimens, probably due to the dissolution of the aluminum containing NaAlSiO4 and KAlSiO4 crystalline phases, as verified by XRD, while P ions were measured at higher concentrations in L specimens, followed by S, I and E specimens.
The lowest ion leaching and consequently the lowest degradation were reported for zirconia (Katana), which also presented the lowest values of surface roughness before and after SGA. However, no details on zirconium or yttrium release could be obtained with ICP in the present study.

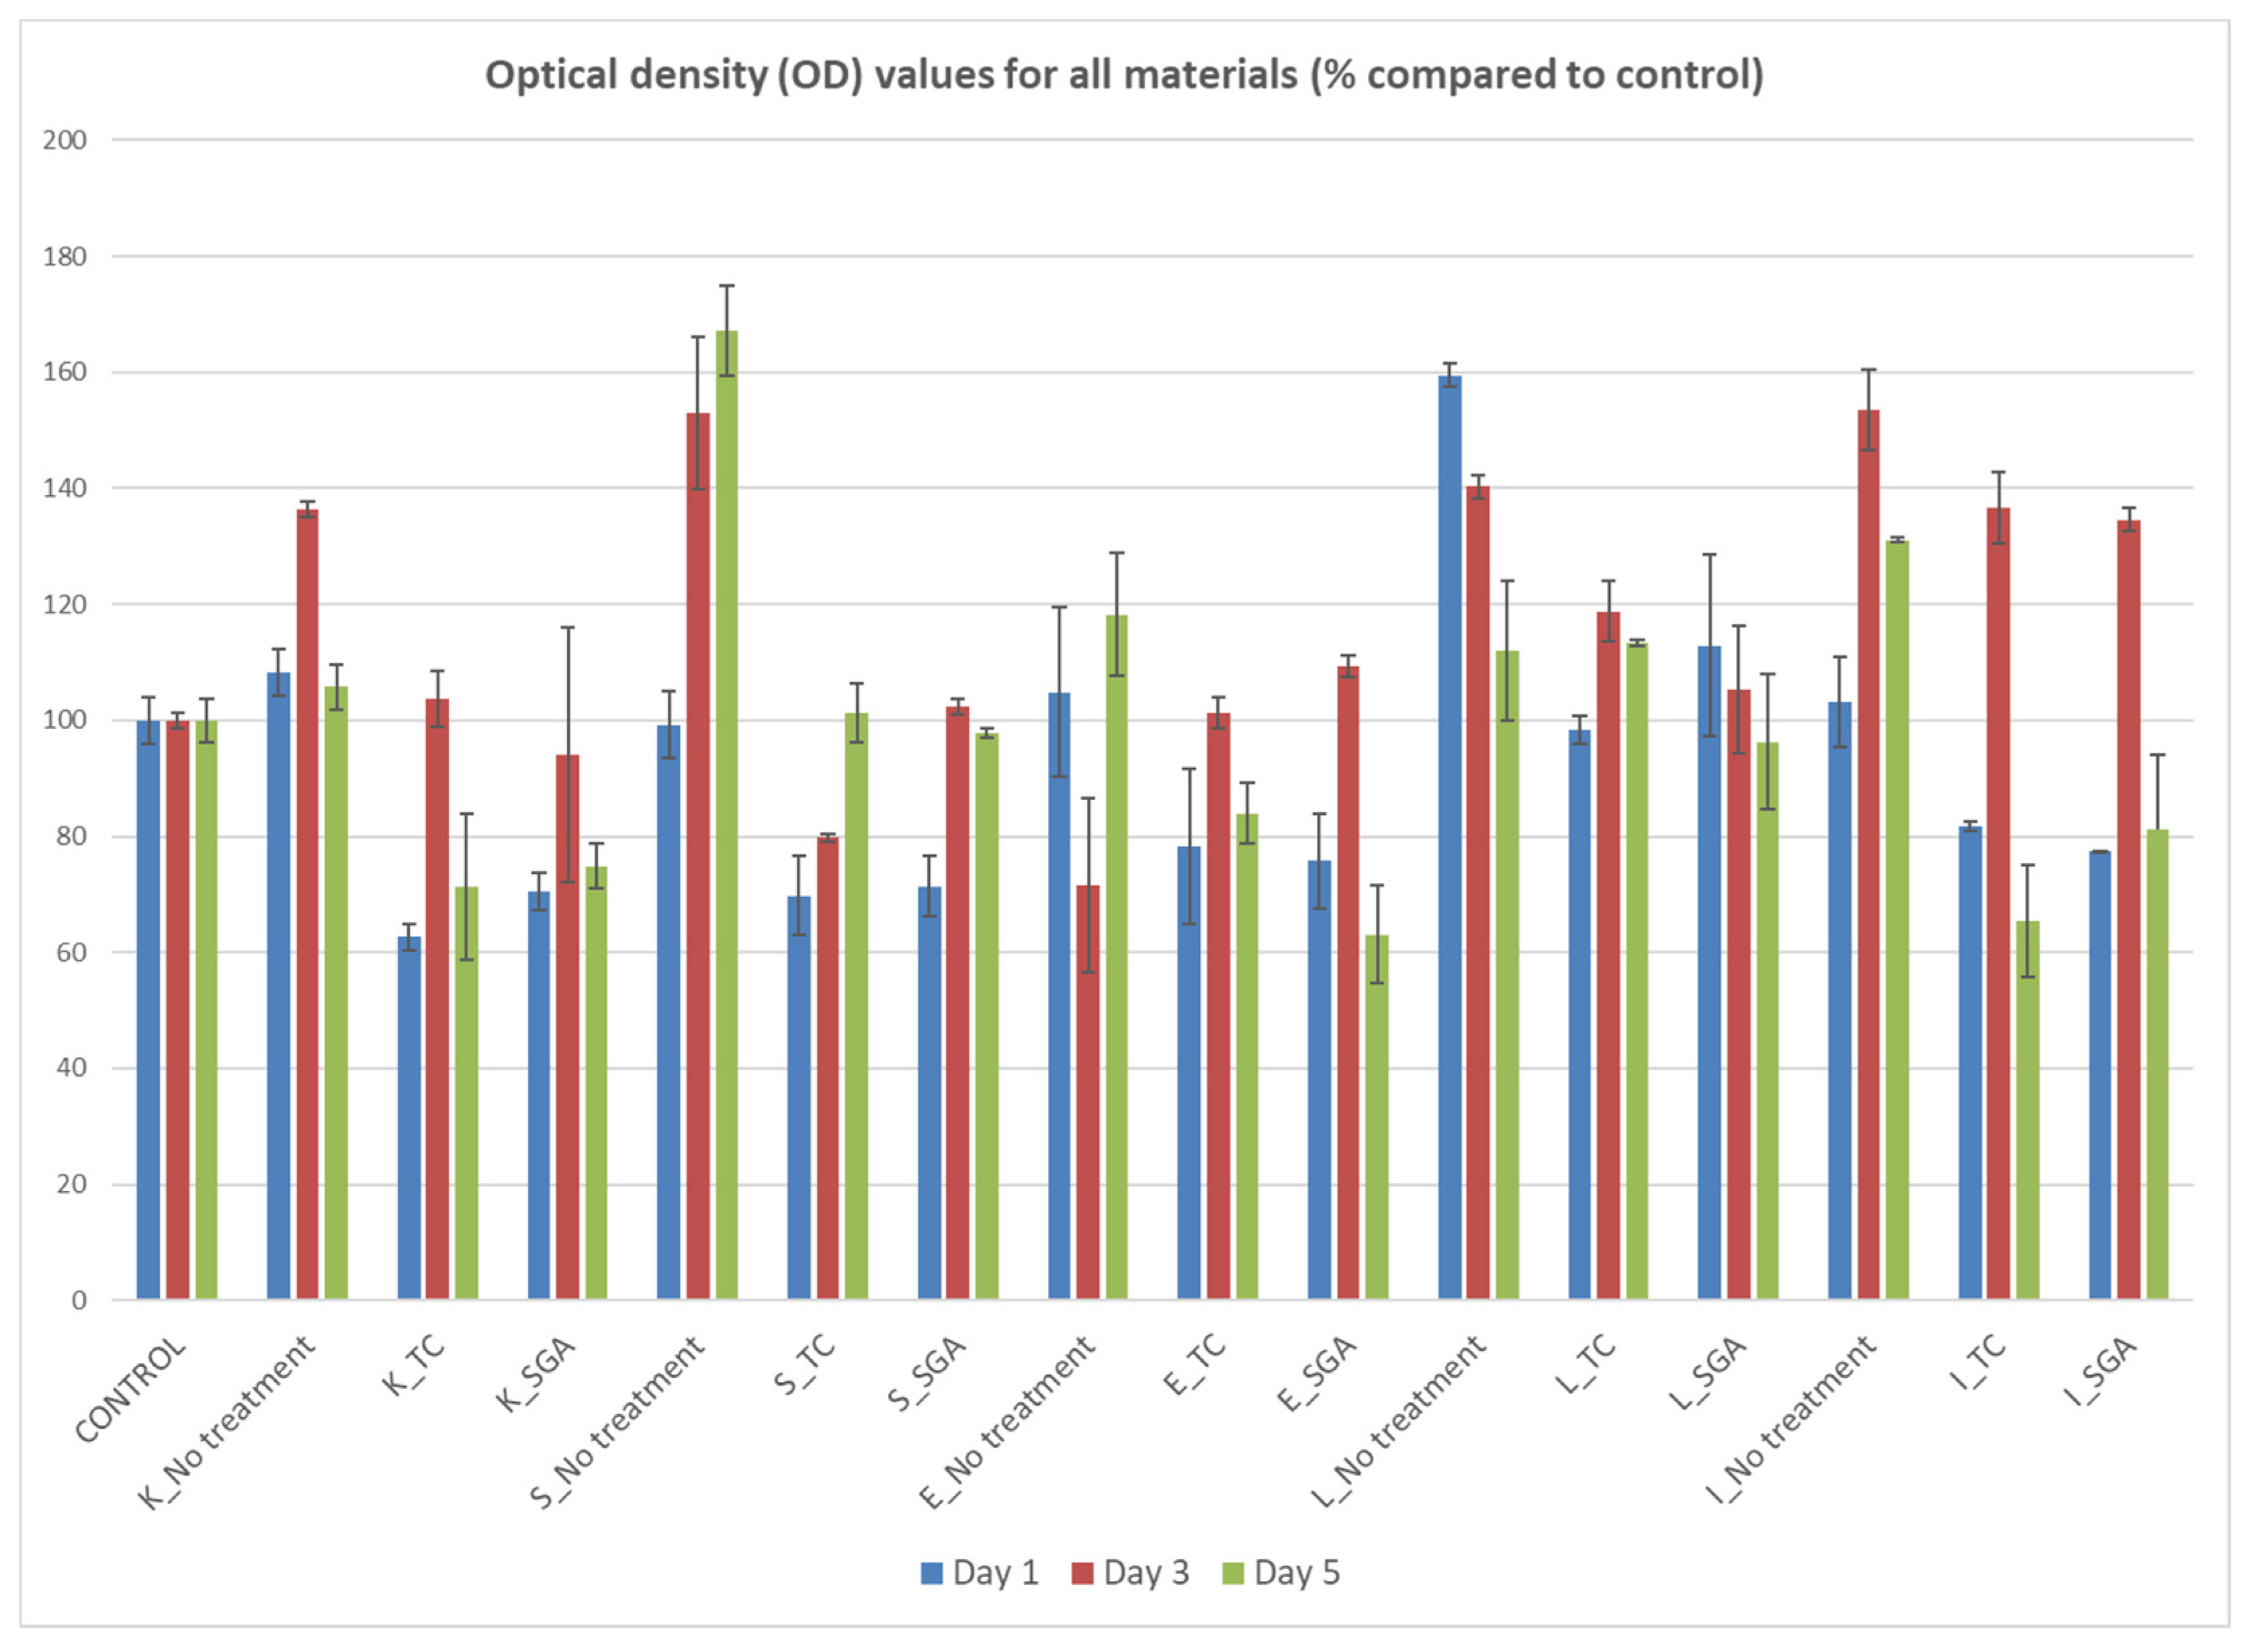
3.5. Evaluation of Cell Metabolic Activity/Viability after Direct Metabolic-Based Tests (MTT Assay)

All control groups without any treatment presented non-cytotoxicity and even higher mitochondrial activity rates compared to cells alone (Figure 5). Group S presented a remarkable time-dependent increase in %OD values, while groups I and L presented higher values compared to the control group at all of the examined time points.
In Table 6, the mean %OD values with the standard deviation for each combination of group (No treatment, TC and SGA) and material (K, S, E, L, I, C) at each day are presented.
There were significant differences in %OD between the 6 groups on all days (Supplementary Materials). Without any treatment, on day 1, the highest %OD values were recorded for group L, which presented a greater %OD than groups K, S, E, and I and the control (p-value < 0.05). On day 3, group E presented a lower %OD than groups K, S, L, and I and the control (p-value < 0.05), and the control group displayed a lower %OD than groups K (p-value < 0.05), S (p-value < 0.05), L (p-value < 0.05) and I (p-value < 0.05). The greatest %OD values were recorded for group S on day 5, which presented a greater %OD than groups K, E, and L, the control (p-value < 0.05), and group I (p-value < 0.05).
For groups K, I and S, after TC or SGA, a statistically significant reduction in %OD values were recorded on all days. For group E, a statistically significant reduction in %OD values was recorded on days 3 and 5. For group L, a statistically significant reduction in %OD values was recorded on days 1 and 3, but not on day 5.
After treatment with simulated acidic gastric fluid, a decrease in %OD values for groups K, S, E and I was reported compared both to the non-treated and control groups initially, at day 1. All groups presented an increase in cell metabolic activity during the experiment, but only in the lithium disilicate (L) group were the values approaching or even higher than the values of control group. On day 5, group E presented lower %OD than groups S (p-value = 0.003), L (p-value < 0.05) and I (p-value < 0.05).
For the tested ceramic materials, after exposure to TC, %OD values were significantly lower for groups K, S, and E compared both to the non-treated groups and the control group at all time points, especially on day 1. On day 3, group L presented significantly higher %OD values compared to the control, while on day 5, groups K, E and I presented significantly lower %OD values compared to the control. Although all tested groups proved not to be cytotoxic either before or after treatments, the lithium disilicate group and especially group L presented the most beneficial biological behavior.

4. Discussion

In the present study, different novel ceramics were included with the aim being to include the most widely applied materials in restorative and prosthetic dentistry: Katana High Translucent—Kuraray (K) is a pure polycrystalline material consisting of highly translucent zirconia, Suprinity-Vita (S) is a zirconia-reinforced lithium silicate material, IPS e-max CAD-Ivoclar-Vivadent AG (I) is a pure glass ceramic consisting of lithium disilicate, Enamic-Vita (E) consists of a ceramic glassy matrix filled with polymer, and LiSi Press-GC Dental Products (L) is a high-strength lithium disilicate ingot produced with high-density micronization technology.
To extract data concerning surface morphology and surface roughness, optical or stylus profilometry is commonly used. Quantitative measurements include the recording of Sa, Sz, Sp, Sv and Sq values. According to the roughness analysis results in the present investigation, most of the specimens showed a specific stability of Sa values with regard to TC. These results are in accordance with a recent metanalysis which stated that the surface roughness of a Y-TZP ceramic remained unchanged after low-temperature degradation, with the duration and type of aging protocol contributing to changes in surface roughness [25]. Sa values were significantly higher only for S specimens after TC. This may be attributed to differences in crystalline phases, and in particular lithium metasilicate (Li2SiO3), as verified through XRD (Table 4). In the present study, the identified crystalline phases differ compared to those reported in the literature, which can be explained by the significant effect on firing parameters in the crystallinity of this material, as slight deviations may result in differences in the crystal structure [26,27]. Zirconia-reinforced lithium silicate ceramic has been reported in the literature to present more microstructural changes on the surface morphology after thermocycling when compared to other ceramics [28]. Moreover, statistically significant changes were recorded for the Sz (Enamic, Katana, Suprinity, and Lisi specimens), Sp (Enamic, Katana, and Suprinity specimens), and Sv values (Enamic and Lisi specimens) for the materials tested in the present investigation. This finding can be explained by the definition of these parameters. They are based on the highest peaks and valleys, and clearly show that although both treatments can create either high peaks or deep valleys in the materials, the overall mean Sa may not be affected. Further research with atomic force microscopy at higher magnification could reveal how each treatment can affect the shape or type of surface uplifts or erosive lesions, as neither profilometry nor SEM analysis could provide significant information in this respect. However, the slight morphological changes which occur under the thermal fluctuations in the oral cavity may accelerate the degradation of the materials and thus should be taken into consideration with respect to the biological long-term behavior of dental ceramics. The latter impact on a microscopic level was also supported by our XRD analysis, since changes in the chemical composition of the surface were recorded after thermocycling for all groups. Furthermore, Sa values were statistically significantly lower for the K, S and I specimens when compared with the L and E specimens, before and after TC. Enamic is a hybrid ceramic–polymer material and is thus expected to present a rougher surface due to its dual network structure. SEM analysis also proved E specimens to demonstrate rougher surface. On the other hand, the micronization performed on the lithium disilicate glass structure of S specimens appears to be unfavorable with regard to the material’s surface roughness.
As far as SGA is concerned, Sa values were statistically lower before treatment for the zirconia (K) and the zirconia-reinforced lithium silicate ceramic (S) specimens when compared to lithium disilicate (L) and dual-network ceramic (E) specimens. Pure zirconia and zirconia-reinforced materials showed a smoother texture when compared to tye polymer or lithium disilicate materials. A rougher surface may induce plaque accumulation [29], while increased surface roughness affects the amount of wear. When comparing baseline Sa values to Sa after immersion in simulated gastric acid, no statistically significant difference was recorded within groups. All surface parameters (Sa, Sq, Sz, Sp, and Sv) remained unchanged for the zirconia (K) and dual-network ceramic (E) specimens after SGA. Statistically significant changes were recorded for Sv (for the S, Ι, and L (lithium silicate) specimens), Sz (for the Ι and L specimens) and Sq values (for the Ι and lithium disilicate specimens) after SGA. Fluctuations in pH appear to have a slight impact on the microtopography of lithium disilicate materials, which is also supported by our XRD analysis. Kulkarni et al. also reported zirconia to be more stable with regard to surface roughness when compared to I specimens [20]. Moreover, other investigators also found lithium disilicate samples to be affected by acidic aging [8,14]. An interesting finding was the complete amorphization of the E specimen, which initially presented the crystalline phases of NaAlSiO4, KAlSiO4, and Na2SiO3, which completely disappeared in the XRD spectrum after SGA. Different studies have shown different microstructures of the dual-network ceramic (E) materials [30,31] due to variations in sintering or polishing procedures, without, however, being able to identify specific crystalline phases due to the polymeric network of the material. However, the disappearance of the various sodium silicate crystalline phases after immersion in HCl has previously been reported not to affect its roughness [32] or its optical properties [18,33]. IPS analysis was applied to evaluate ion release after chemical aging, and the concentration of ions such as Ca, Zn, P, Al, Hf and Si was recorded in the present investigation. For K specimens, Zr and Y release could not be detected, while they also presented the lowest ion leaching, especially of Ca, Al, and P. These findings are in accordance with data found in the literature, suggesting that a Zr core material is more stable with regard to ion leaching compared to lithium disilicate or feldspathic porcelain [16,34,35,36]. Furthermore, zirconia restorations have been reported to be superior to other ceramics with regard to parameters such as color and translucency after immersion in artificial gastric fluids [6]. These findings indicate that zirconia materials may be favorable as far as their surface characteristics are concerned for patients with a highly acidic oral environment. Despite this, a slight increase in monoclinic zirconia phases (m-ZrO2) was calculated after both treatments, suggesting that mild transformations might take place due to the presence of water in both treatments. Different amounts of m-ZrO2 have been recorded after the thermal cycling of zirconia, depending on the type, duration of experiments and the presence or not of additional mechanical stresses [37,38], but not after acidic treatment with hydrochloric acid.
Ceramic treatment either with TC or SGA seemed to affect cell viability and their mitochondrial activity at all tested groups. Decreased MTT values on day 1 revealed that surface changes or even minor ion exchanges could affect cell viability. The increase in OD values during the MTT assay indicates that the effect of examined treatments did not exert a permanent effect on the biological behavior of the materials in the long term, and thus all tested groups can be considered non-cytotoxic.
The present study was performed as an in vitro experiment and the following limitations should be noted. Since there is no established protocol for specimens’ preparation, polishing techniques were applied according to the manufacturer’s instructions. The polishing of ceramic materials may further affect the surface micromorphology, and thus this factor should be taken into consideration when preparing experimental specimens. Furthermore, the impact of acidic aging has been introduced in the investigating protocols only in recent years. To the authors’ knowledge, there is no ISO with regard to the preparation of experimental simulated gastric fluids. Thus, the preparation technique for simulated gastric acid followed by most investigators in the literature was applied in the present study [23,24]. In this protocol, dental ceramics constantly remained in the acidic solution, while in real clinical conditions fluctuations in the pH and the severity of acidic attacks resulting from immediate water consumption, antacid drugs, the flow rate, saliva’s buffering capacity, brushing immediately after acidic beverage drinking or regurgitation episodes, etc., may probably minimize disastrous effects. Another limitation is that in the present study, cells from only one donor were included, so the generalization of the results should be performed with caution. Several factors, such as donor age, medical history, race, and sex, can potentially introduce parameters that may influence the results.

5. Conclusions

Under the limitations of the present study, the following conclusions can be drawn:
  • Thermocycling did not significantly affect the mean surface roughness of the investigated ceramic materials, although it did affect other surface parameters to a greater extent compared to immersion in simulated gastric acid.
  • Structural changes do occur after treatments, but are not able to significantly affect the mean surface roughness in most materials, except for zirconia-reinforced lithium silicate ceramic after immersion in simulated gastric acid.
  • Immersion in simulated gastric acid seemed to mostly affect the surface roughness parameters of the silica-containing dental ceramics, without being able to significantly affect the mean surface roughness in any of the investigated materials.
  • The investigated zirconia and dual-network ceramic specimens presented the smallest changes after immersion in simulated gastric acid or thermocycling, although they presented lower mitochondrial activity after TC or SGA.
  • The zirconia-reinforced lithium silicate ceramics presented the most notable changes in microstructure and roughness after both treatments, which significantly affected their biological behavior.
  • Lithium disilicate materials in general presented similar crystalline phases but differences in their percentages, and despite the significant changes in some of the surface roughness parameters, they did not present significant changes in mean surface roughness or surface microstructure after either treatment. However, these changes were enough to affect the cell metabolic activity of one brand of this type of material (I).

Supplementary Materials

The following supporting information can be downloaded at: https://www.mdpi.com/article/10.3390/ceramics7020035/s1, Table S1. Mean %OD with standard deviation for each combination of group (No treatment, Thermocycling and Acidic Storage) and material (K, S, E, L, I, C) at each day.

Author Contributions

Conceptualization, P.P. and E.K.; methodology, G.K.P., A.T., P.P. and G.A.Z.; formal analysis, G.K.P., A.T., P.P., K.S. and G.A.Z.; investigation, P.P., G.A.Z., G.K.P., A.T. and P.P.; resources, E.K.; data curation, P.P., A.T., G.K.P. and E.K.; writing—original draft preparation, P.P. and K.S.; writing—review and editing, A.T. and E.K.; supervision, E.K.; project administration, E.K. and P.P.; funding acquisition, E.K. All authors have read and agreed to the published version of the manuscript.

Funding

This research is co-financed by Greece and the European Union (European Social Fund—ESF) through the Operational Programme “Human Resources Development, Education and Lifelong Learning” in the context of the project “Reinforcement of Postdoctoral Researchers—2nd Cycle” (MIS-5033021), implemented by the State Scholarships Foundation (IKΥ). Ceramics 07 00035 i001

Institutional Review Board Statement

This study was conducted in accordance with the Declaration of Helsinki and approved by the Ethics Committee of the Department of Dentistry, Aristotle University of Thessaloniki, Greece (#35/07-05-2018).

Informed Consent Statement

Not applicable.

Data Availability Statement

All data are presented in the manuscript.

Acknowledgments

The authors want to acknowledge Chrysanthi Papoulidou and Lambinri Papadopoulou for their assistance in obtaining the SEM micrographs at the Laboratory of Advanced Materials and Devices (AMDeLab), School of Physics, Aristotle University of Thessaloniki. Roughness measurements were performed at the Department of Basic Dental Sciences, Division of Dental Tissues Pathology and Therapeutics, School of Dentistry, Faculty of Health Sciences, Aristotle University of Thessaloniki, Greece.

Conflicts of Interest

The authors declare no conflicts of interest.

References

  1. Sorrentino, R.; Ruggiero, G.; Di Mauro, M.I.; Breschi, L.; Leuci, S.; Zarone, F. Optical Behaviors, Surface Treatment, Adhesion, and Clinical Indications of Zirconia-Reinforced Lithium Silicate (ZLS): A Narrative Review. J. Dent. 2021, 112, 103722. [Google Scholar] [CrossRef]
  2. Win, L.C.; Sands, P.; Bonsor, S.J.; Burke, F.T. Ceramics in Dentistry: Which Material Is Appropriate for the Anterior or Posterior Dentition? Part 1: Materials Science. Dent. Update 2021, 48, 680–688. [Google Scholar] [CrossRef]
  3. Nawafleh, N.; Hatamleh, M.; Elshiyab, S.; Mack, F. Lithium Disilicate Restorations Fatigue Testing Parameters: A Systematic Review. J. Prosthodont. 2016, 25, 116–126. [Google Scholar] [CrossRef]
  4. Kou, W.; Garbrielsson, K.; Borhani, A.; Carlborg, M.; Molin Thorén, M. The Effects of Artificial Aging on High Translucent Zirconia. Biomater. Investig. Dent. 2019, 6, 54–60. [Google Scholar] [CrossRef]
  5. Sarafidou, K.; Stiesch, M.; Dittmer, M.P.; Jörn, D.; Borchers, L.; Kohorst, P. Load-Bearing Capacity of Artificially Aged Zirconia Fixed Dental Prostheses with Heterogeneous Abutment Supports. Clin. Oral. Investig. 2012, 16, 961–968. [Google Scholar] [CrossRef]
  6. Theocharidou, A.; Kontonasaki, E.; Koukousaki, I.; Koumpouli, A.; Betsani, I.; Koidis, P. Effect of in Vitro Aging and Acidic Storage on Color, Translucency, and Contrast Ratio of Monolithic Zirconia and Lithium Disilicate Ceramics. J. Prosthet. Dent. 2021, 127, 479–488. [Google Scholar] [CrossRef]
  7. Vatali, A.; Kontonasaki, E.; Kavouras, P.; Kantiranis, N.; Papadopoulou, L.; Paraskevopoulos, K.K.M.; Koidis, P. Effect of Heat Treatment and in Vitro Aging on the Microstructure and Mechanical Properties of Cold Isostatic-Pressed Zirconia Ceramics for Dental Restorations. Dent. Mater. 2014, 30, e272–e282. [Google Scholar] [CrossRef]
  8. Kontonasaki, E.; Giasimakopoulos, P.; Rigos, A.E. Strength and Aging Resistance of Monolithic Zirconia: An Update to Current Knowledge. Jpn. Dent. Sci. Rev. 2020, 56, 1–23. [Google Scholar] [CrossRef]
  9. Orr, W.C. Sleep and Gastroesophageal Reflux: What Are the Risks? Am. J. Med. 2003, 115 (Suppl. S1), 109–113. [Google Scholar] [CrossRef]
  10. Lourenço, M.; Azevedo, Á.; Brandão, I.; Gomes, P.S. Orofacial Manifestations in Outpatients with Anorexia Nervosa and Bulimia Nervosa Focusing on the Vomiting Behavior. Clin. Oral. Investig. 2018, 22, 1915–1922. [Google Scholar] [CrossRef]
  11. Body, C.; Christie, J.A. Gastrointestinal Diseases in Pregnancy: Nausea, Vomiting, Hyperemesis Gravidarum, Gastroesophageal Reflux Disease, Constipation, and Diarrhea. Gastroenterol. Clin. N. Am. 2016, 45, 267–283. [Google Scholar] [CrossRef]
  12. Kukiattrakoon, B.; Hengtrakool, C.; Kedjarune-Leggat, U. Effect of Acidic Agents on Surface Roughness of Dental Ceramics. Dent. Res. J. 2011, 8, 6–15. [Google Scholar]
  13. Junpoom, P.; Kukiattrakoon, B.; Hengtrakool, C. Surface Characteristic Changes of Dental Ceramics after Cyclic Immersion in Acidic Agents and Titratable Acidity. Eur. J. Prosthodont. Restor. Dent. 2010, 18, 177–184. [Google Scholar]
  14. Farhadi, E.; Kermanshah, H.; Rafizadeh, S.; Saeedi, R.; Ranjbar Omrani, L. In Vitro Effect of Acidic Solutions and Sodium Fluoride on Surface Roughness of Two Types of CAD-CAM Dental Ceramics. Int. J. Dent. 2021, 2021, 9977993. [Google Scholar] [CrossRef]
  15. Scotti, N.; Ionescu, A.; Comba, A.; Baldi, A.; Brambilla, E.; Vichi, A.; Goracci, C.; Ciardiello, R.; Tridello, A.; Paolino, D.; et al. Influence of Low-Ph Beverages on the Two-Body Wear of Cad/Cam Monolithic Materials. Polymers 2021, 13, 2915. [Google Scholar] [CrossRef]
  16. Habib, A.W.; Aboushelib, M.N.; Habib, N.A. Effect of Chemical Aging on Color Stability and Surface Properties of Stained All-Ceramic Restorations. J. Esthet. Restor. Dent. 2021, 33, 636–647. [Google Scholar] [CrossRef]
  17. Yang, H.; Xu, Y.L.; Hong, G.; Yu, H. Effects of Low-Temperature Degradation on the Surface Roughness of Yttria-Stabilized Tetragonal Zirconia Polycrystal Ceramics: A Systematic Review and Meta-Analysis. J. Prosthet. Dent. 2021, 125, 222–230. [Google Scholar] [CrossRef]
  18. Cruz, M.E.M.; Simões, R.; Martins, S.B.; Trindade, F.Z.; Dovigo, L.N.; Fonseca, R.G. Influence of Simulated Gastric Juice on Surface Characteristics of CAD-CAM Monolithic Materials. J. Prosthet. Dent. 2020, 123, 483–490. [Google Scholar] [CrossRef]
  19. Al-Thobity, A.M.; Gad, M.M.; Farooq, I.; Alshahrani, A.S.; Al-Dulaijan, Y.A. Acid Effects on the Physical Properties of Different CAD/CAM Ceramic Materials: An in Vitro Analysis. J. Prosthodont. 2021, 30, 135–141. [Google Scholar] [CrossRef]
  20. Kulkarni, A.; Rothrock, J.; Thompson, J. Impact of Gastric Acid Induced Surface Changes on Mechanical Behavior and Optical Characteristics of Dental Ceramics. J. Prosthodont. 2020, 29, 207–218. [Google Scholar] [CrossRef]
  21. Hampe, R.; Theelke, B.; Lümkemann, N.; Stawarczyk, B. Impact of Artificial Aging by Thermocycling on Edge Chipping Resistance and Martens Hardness of Different Dental CAD-CAM Restorative Materials. J. Prosthet. Dent. 2021, 125, 326–333. [Google Scholar] [CrossRef] [PubMed]
  22. Palla, E.-S.; Kontonasaki, E.; Kantiranis, N.; Papadopoulou, L.; Zorba, T.; Paraskevopoulos, K.M.; Koidis, P. Color Stability of Lithium Disilicate Ceramics after Aging and Immersion in Common Beverages. J. Prosthet. Dent. 2017, 19, 632–642. [Google Scholar] [CrossRef] [PubMed]
  23. Alnasser, M.; Finkelman, M.; Papathanasiou, A.; Suzuki, M.; Ghaffari, R.; Ali, A. Effect of Acidic PH on Surface Roughness of Esthetic Dental Materials. J. Prosthet. Dent. 2019, 122, 567.e1–567.e8. [Google Scholar] [CrossRef] [PubMed]
  24. Harryparsad, A.; Dullabh, H.; Sykes, L.; Herbst, D. The Effects of Hydrochloric Acid on All-Ceramic Restorative Materials: An in-Vitro Study. S. Afr. Dent. J. 2014, 69, 106–111. [Google Scholar] [PubMed]
  25. Riquieri, H.; Monteiro, J.B.; Viegas, D.C.; Campos, T.M.B.; de Melo, R.M.; de Siqueira Ferreira Anzaloni Saavedra, G. Impact of Crystallization Firing Process on the Microstructure and Flexural Strength of Zirconia-Reinforced Lithium Silicate Glass-Ceramics. Dent. Mater. 2018, 34, 1483–1491. [Google Scholar] [CrossRef]
  26. Juntavee, N.; Uasuwan, P. Influence of Thermal Tempering Processes on Color Characteristics of Different Monolithic Computer-Assisted Design and Computer-Assisted Manufacturing Ceramic Materials. J. Clin. Exp. Dent. 2019, 11, e614–e624. [Google Scholar] [CrossRef]
  27. Vasiliu, R.D.; Porojan, S.D.; Bîrdeanu, M.I.; Porojan, L. Effect of Thermocycling, Surface Treatments and Microstructure on the Optical Properties and Roughness of CAD-CAM and Heat-Pressed Glass Ceramics. Materials 2020, 13, 381. [Google Scholar] [CrossRef] [PubMed]
  28. Quirynen, M.; Marechal, M.; Busscher, H.J.; Weerkamp, A.H.; Darius, P.L.; van Steenberghe, D. The Influence of Surface Free Energy and Surface Roughness on Early Plaque Formation. An in Vivo Study in Man. J. Clin. Periodontol. 1990, 17, 138–144. [Google Scholar] [CrossRef] [PubMed]
  29. Sonmez, N.; Gultekin, P.; Turp, V.; Akgungor, G.; Sen, D.; Mijiritsky, E. Evaluation of Five CAD/CAM Materials by Microstructural Characterization and Mechanical Tests: A Comparative in Vitro Study. BMC Oral. Health 2018, 18, 1–13. [Google Scholar] [CrossRef]
  30. Dobrzynski, M.; Pajaczkowska, M.; Nowicka, I.; Jaworski, A.; Kosior, P.; Szymonowicz, M.; Kuropka, P.; Rybak, Z.; Bogucki, Z.A.; Filipiak, J.; et al. Study of Surface Structure Changes for Selected Ceramics Used in the CAD/CAM System on the Degree of Microbial Colonization, in Vitro Tests. Biomed. Res. Int. 2019, 2019, 9130806. [Google Scholar] [CrossRef]
  31. Dubrovo, S.K.; Shmidt, Y.A. Reactions of Vitreous Silicates and Aluminosilicates with Aqueous Solutions Communication I. Reactions of Vitreous Sodium Silicates with Water and with Hydrochloric Acid Solutions. Bull. Acad. Sci. USSR Div. Chem. Sci. 1953, 2, 535–543. [Google Scholar] [CrossRef]
  32. Pîrvulescu, I.L.; Pop, D.; Moacă, E.A.; Mihali, C.V.; Ille, C.; Jivănescu, A. Effects of Simulated Gastric Acid Exposure on Surface Topography, Mechanical and Optical Features of Commercial Cad/Cam Ceramic Blocks. Appl. Sci. 2021, 11, 8703. [Google Scholar] [CrossRef]
  33. Karaokutan, I.; Aykent, F. Effect of a Home Bleaching Agent on the Ion Elution of Different Esthetic Materials. J. Prosthodont. 2020, 29, 805–813. [Google Scholar] [CrossRef] [PubMed]
  34. Esquivel-Upshaw, J.F.; Dieng, F.Y.; Clark, A.E.; Neal, D.; Anusavice, K.J. Surface Degradation of Dental Ceramics as a Function of Environmental PH. J. Dent. Res. 2013, 92, 467–471. [Google Scholar] [CrossRef]
  35. Hu, P.; Yao, L.; Lue, Q.; Ji, E.; Nie, Z.; He, Z. The Surface Denaturation Analysis of Lithium Disilicate Glass Ceramics Milled by Ultraviolet Picosecond Laser. J. Phys. Conf. Ser. 2020, 1549, 032150. [Google Scholar] [CrossRef]
  36. Mota, Y.A.; Cotes, C.; Carvalho, R.F.; Machado, J.P.B.; Leite, F.P.P.; Souza, R.O.A.; Özcan, M. Monoclinic Phase Transformation and Mechanical Durability of Zirconia Ceramic after Fatigue and Autoclave Aging. J. Biomed. Mater. Res. B Appl. Biomater. 2016, 105, 1972–1977. [Google Scholar] [CrossRef] [PubMed]
  37. Kelesi, M.; Kontonasaki, E.; Kantiranis, N.; Papadopoulou, L.; Zorba, T.; Paraskevopoulos, K.M.; Koidis, P. The Effect of Different Aging Protocols on the Flexural Strength and Phase Transformations of Two Monolithic Zirconia Ceramics. J. Appl. Biomater. Funct. Mater. 2020, 18, 2280800020982677. [Google Scholar] [CrossRef]
  38. Pereira, G.K.R.; Venturini, A.B.; Silvestri, T.; Dapieve, K.S.; Montagner, A.F.; Soares, F.Z.M.; Valandro, L.F. Low-Temperature Degradation of Y-TZP Ceramics: A Systematic Review and Meta-Analysis. J. Mech. Behav. Biomed. Mater. 2015, 55, 151–163. [Google Scholar] [CrossRef]
Figure 1. SEM micrographs of Enamic (AC), Suprinity (DF) and Katana (GI). Below each micrograph, a respective EDS spectrum is presented, received from backscattered micrographs.
Ceramics 07 00035 g001
Figure 2. SEM micrographs of e*max (AC) and Lisi Press (DF). Below each micrograph, a respective EDS spectrum is presented, received from backscattered micrographs.
Ceramics 07 00035 g002
Figure 3. XRD patterns of specimens from the Enamic (E), Suprinity (S) and Katana (K) groups before treatment (E1, S1 and K1), after TC (E11, S11 and K11) and after SGA (E1-HCl, S1-HCl and K1-HCl).
Ceramics 07 00035 g003
Figure 4. XRD patterns of specimens from the e*max (I) and Lisi press (L) group before treatment (I1 and L1), after TC (I11 and L11) and after SGA (I1-HCl and L1-HCl).
Ceramics 07 00035 g004
Figure 5. Results of cell metabolic activity/viability after direct metabolic-based tests (MTT assay). OD values were normalized compared to the control (cells without any material).
Ceramics 07 00035 g005
Table 1. Materials used in the present study, chemical composition, and manufacturer information.
CodeMaterialTypeProcessLOT/REF Number Composition
EEnamic
3M2-TEM-14
VITA Zahnfabrik H. Rauter GmbH & Co. KG
dual-network ceramicCAD/CAM7719086% ceramic (58–63% SiO2, 20–23% Al2O3, 9–11% Na2O, 4–6% K2O, 0.5–2% B2O3, 0–1% ZrO2, 0–1% CaO) 14% polymer (UDMA, TEGDMA)
SSuprinity
A3-T PC-14
VITA Zahnfabrik H. Rauter GmbH & Co. KG
Zirconia-reinforced lithium silicate ceramicCAD5890356–64% SiO2, 1–4% Al2O3, 15–21% Li2O, 8–12% ZrO2, 1–4% K2O, 3–8% P2O5, 0–4% CeO2, 0.1% La2O3, 0–6% other oxides
KKatana
12Z/STML A4
Kuraray Noritake Dental Inc.
Zirconia CeramicCAD/CAM125-5781ZrO2 + HfO2 88–93%,
Yttrium oxide (Y2O3) 7–10%,
Other oxides 0–2%
IIPS e-max CAD
LT A1/I 12
Ivoclar Vivadent
Lithium disilicate glass ceramicCAD/CAMY4559857–80% SiO2, 11–19% Li2O, 0–13% K2O, 0–11% P2O5, 0–8% ZrO2, 0–8% ZnO and 0–10% other oxides
LGC Initial® LiSi Press LT-C
GC Corporation
Lithium disilicate glass ceramicHeat-pressing1707071SiO2 71.9%, Al2O3 5.4%, Li2O 13%, K2O 2%, Na2O 1.4%, P2O5 2.6%, B2O3 0.007%, ZrO2 1.7%, CeO2 1.2%, V2O5 0.15%, Tb2O3 0.35%, Er2O3 0.4% and
HfO2 0.03%
Table 2. Mean values and standard deviation of all roughness parameters before and after SGA.
E Average (±SD)K Average (±SD)S Average (±SD)I Average (±SD)L Average (±SD)p-Value A
Sa (baseline)0.8 (±0.2) a0.3 (±0.1) b0.3 (±0.1) b0.6 (±0.2) a,b0.8 (±0.2) a<0.05
Sa (after SGA)0.8 (±0.1) a0.3 (±0.1) b0.3 (±0.0) b0.3 (±0.1) b0.7 (±0.2) a<0.05
p-value B>0.05>0.05>0.05>0.050.169
Sz (baseline)11.5 (±2.9) a6.1 (±2.0) b6.2 (±1.2) b13.8 (±6.9) a19.6 (±5.2) c<0.05
Sz (after SGA)11.4 (±1.9) a4.9 (±1.6) b7.7 (±3.5) b6.3 (±2.5) b14.9 (±4.4) a<0.05
p-value B>0.05>0.05>0.05<0.05<0.05
Sp (baseline)5.2 (±2.1) a,b4.0 (±1.9) a3.9 (±1.6) a6.3 (±2.4) a,b7.1 (±2.2) b<0.05
Sp (after SGA)5.2 (±1.48) a2.8 (±1.43) b4.6 (±3.02) a,b4.1 (±2.4) a,b5.1 (±1.8) a<0.05
p-value B>0.05>0.05>0.05>0.05>0.05
Sv (baseline)−6.3 (±1.97) a−2.2 (±0.52) b−2.5 (±0.42) c−5.9 (±2.86) a,b,c−11.2 (±3.61) b<0.05
Sv (after SGA)−6.2 (±0.8) a−2.0 (±0.5) b−3.0 (±0.8) b−2.3 (±0.3) b−9.7 (±3.4) c<0.05
p-value B>0.05>0.05<0.05<0.05<0.05
Sq (baseline)1.2 (±0.6) a0.4 (±0.22b0.4 (±0.1) c0.8 (±0.3) a,b,c1.1 (±0.4) b<0.05
Sq (after SGA)1.1 (±0.3) a0.4 (±0.1) b0.4 (±0.1) b0.4 (±0.1) b1.0 (±0.3) c<0.05
p-value b>0.05>0.05>0.05<0.05>0.05
Mean value (SD: standard deviation). A One-way ANOVA or Kruskal–Wallis test (independent specimens). B t test or Wilcoxon signed-rank analysis (dependent specimens). The p values in the right-hand column indicate the differences of each parameter among the specimens of the different ceramic groups, while the p values within the rows indicate the differences before and after each treatment within each specimen group. Same lower-case letters within each row suggests not statistically significant differences.
Table 3. Mean values and standard deviation of all roughness parameters before and after TC.
E Average (±SD)K Average (±SD)S Average (±SD)I Average (±SD)L Average (±SD)p-Value A
Sa (baseline)0.9 (±0.2) a0.4 (±0.1) b0.3 (±0.1) b0.4 (±0.1) b0.7 (±0.2) c<0.05
Sa (after TC)0.9 (±0.2) a0.4 (±0.2) b0.442 (±0.1) b0.4 (±0.11) b0.8 (±0.2) c<0.05
p-value B>0.05>0.05<0.05>0.05>0.05
Sz (baseline)11.9(±1.5) a5.0 (±1.7) b7.1 (±3.1) b8.2 (±1.7) b23.5 (±4.0) c<0.05
Sz (after TC)15.1 (±4.5) a7.0 (±1.4) b14.2 (±5.6) a8.2 (±3.2) b17.5 (±3.3) a<0.05
p-value B<0.05<0.05<0.05>0.05<0.05
Sp (baseline)5.3 (±1.0) a2.5 (±0.7) b3.7 (±1.1) b5.5 (±1.6) a,b10.7 (±3.6) c<0.05
Sp (after TC)8.4 (±3.8) a4.3 (±1.1) b8.00 (±3.9) a,b5.2 (±2.9) a,b7.0 (±3.0) a,b<0.05
p-value B<0.05<0.05<0.05>0.05>0.05
Sv (baseline)−6.6 (±1.0) a−2.5 (±1.2) b−3.4 (±2.4) b−2.7 (±0.4) b−12.8 (±2.5) c<0.05
Sv (after TC)−6.7 (±1.5) a−2.7 (±1.0) b−4.8 (±2.1) b−3.1 (±0.5) b−10.5 (1.4) c<0.05
p-value B>0.05>0.05>0.05<0.05<0.05
Sq (baseline)1.1 (±0.2) a0.5 (±0.2) b0.4 (±0.1) b0.5 (±0.1) b1.1 (±0.4) a<0.05
Sq (after TC)1.2 (±0.3) a0.5 (±0.2) b0.7 (±0.4) a,b0.5 (±0.1) b1.0 (±0.2) a<0.05
p-value B>0.05>0.05<0.05>0.05>0.05
Mean value (SD: standard deviation). A One-way ANOVA or Kruskal–Wallis (independent specimens). B t test or Wilcoxon signed-rank analysis (dependent specimens). The p values in the right columns indicate the differences in each parameter among the specimens of the different ceramic groups, while the p values within the rows indicate the differences before and after each treatment within each specimen group. The same lower-case letters within each row suggest not statistically significant differences.
Table 4. XRD analysis of the results of specimens of all groups before and after thermal cycling (TC), as well as before and after immersion in artificial gastric acid (HCl).
SpecimenQuantification of Composition
Amorphousm-ZrO2
#65-1025
t-ZrO2
#50-1089
c-ZrO2 #491642 Total
K1_baseline--58.641.4 100
K1_HCl-3.557.738.8 100
K1_TC-3.757.239.1 100
AmorphousNaAlSiO4 #110220KAlSiO4 #330989Na2SiO3 #160818K1+xAl1+xSi1−xO4
#320732
NaAlSi2O6
#221338
E176.25.33.415.1--100
E1_HCl100-----100
E1_TC84.4--7.52.85.3100
AmorphousLi2SiO3
#30-0766
Li2Si3O5
#49-0803
Zr0.4Ce0.6O2 #38-1439Li3PO4
#15-0760
S19.218.810.440.720.9 100
S1_HCl22.135.611.4-30.9 100
S1_TC30.141.29.6-19.1 100
AmorphousLi2Si2O5 #400376Li2Si2O5 #420248SiO2 #290085
I15.786.25.32.8 100
I1_HCl7.287.94.9- 100
I1_TC7.4884.6- 100
AmorphousLi2Si2O5 #400376Li2Si2O5 #420248SiO2 #290085
L13.183.710.82.4 100
L1_HCl3.684.711.7- 100
L1_TC4.184.111.8- 100
Table 5. Chemical analysis of solution of IPS for all groups after immersion in artificial gastric acid.
Detected Ions’ Concentrations in mg/L
MaterialSiCaPZnAlHf
I11114.513.54,813.8<0.1
K<0.10.05<0.1<0.10.20.8
E11712.51.51.0567.5<0.1
L13424.567.50.7512.5<0.1
S1022031.53.3515.7<0.1
Table 6. Mean %OD with standard deviation for each combination of group (No treatment, Thermocycling and Acidic Storage) and material (K, S, E, L, I, C) at each day.
GroupMaterialDay 1Day 3Day 5p-Value
No treatmentK108.2 (±2.3)136.4 (±4.8)105.7 (±12.7)p > 0.05
S99.3 (±5.6)153.1 (±13.15)167.1 (±7.7)p < 0.05 *
E104.9 (±14.5)71.5 (±15.0)118.3 (±10.5)p < 0.05 *
L159.5 (±1.9)140.3 (±2.0)111.9 (±12.1)p < 0.05 *
I103.1 (±7.8)153.6 (±7.0)131.1 (±0.4)p < 0.05 *
C100.0 (±4.0)100.0 (±1.3)100.0 (±3.8)p > 0.05
p-valuep < 0.05 *p < 0.05 *p < 0.05 *
Thermocycling K62.7 (±5.9)103.8 (±12.2)71.3 (±0.1)p < 0.05 *
S69.7 (±6.8)79.8 (±0.7)101.3 (±5.2)p < 0.05 *
E78.2 (±13.5)101.4 (±2.6)84.0 (±5.2)p > 0.05
L98.2 (±2.4)118.8 (±5.2)113.3 (±0.6)p < 0.05 *
I81.8 (±0.8)136.7 (±6.1)65.4 (±9.7)p < 0.05 *
C100.0 (±4.0)100.0 (±1.3)100.0 (±3.8)p > 0.05
p-valuep < 0.05 *p < 0.05 *p < 0.05 *
Acidic StorageK70.5 (±3.2)94.1 (±22.0)74.8 (±3.9)p > 0.05
S71.4 (±5.2)102.3 (±1.4)97.9 (±0.8)p < 0.05 *
E75.8 (±8.2)109.3 (±1.9)63.1 (±8.4)p < 0.05 *
L112.9 (±15.6)105.4 (±11.0)96.3 (±11.7)p > 0.05
I77.3 (±0.2)134.6 (±1.9)81.3 (±12.6)p < 0.05 *
C100.0 (±4.0)100.0 (±1.3)100.0 (±3.8)p > 0.05
p-valuep < 0.05 *p > 0.05p < 0.05 *
* Statistically significant at the level of 0.05.
Disclaimer/Publisher’s Note: The statements, opinions and data contained in all publications are solely those of the individual author(s) and contributor(s) and not of MDPI and/or the editor(s). MDPI and/or the editor(s) disclaim responsibility for any injury to people or property resulting from any ideas, methods, instructions or products referred to in the content.

