
Effect of B2O3 and Basic Oxides on Network Structure and Chemical Stability of Borosilicate Glass


Abstract
1. Introduction
2. Materials and Methods
2.1. Material Preparation
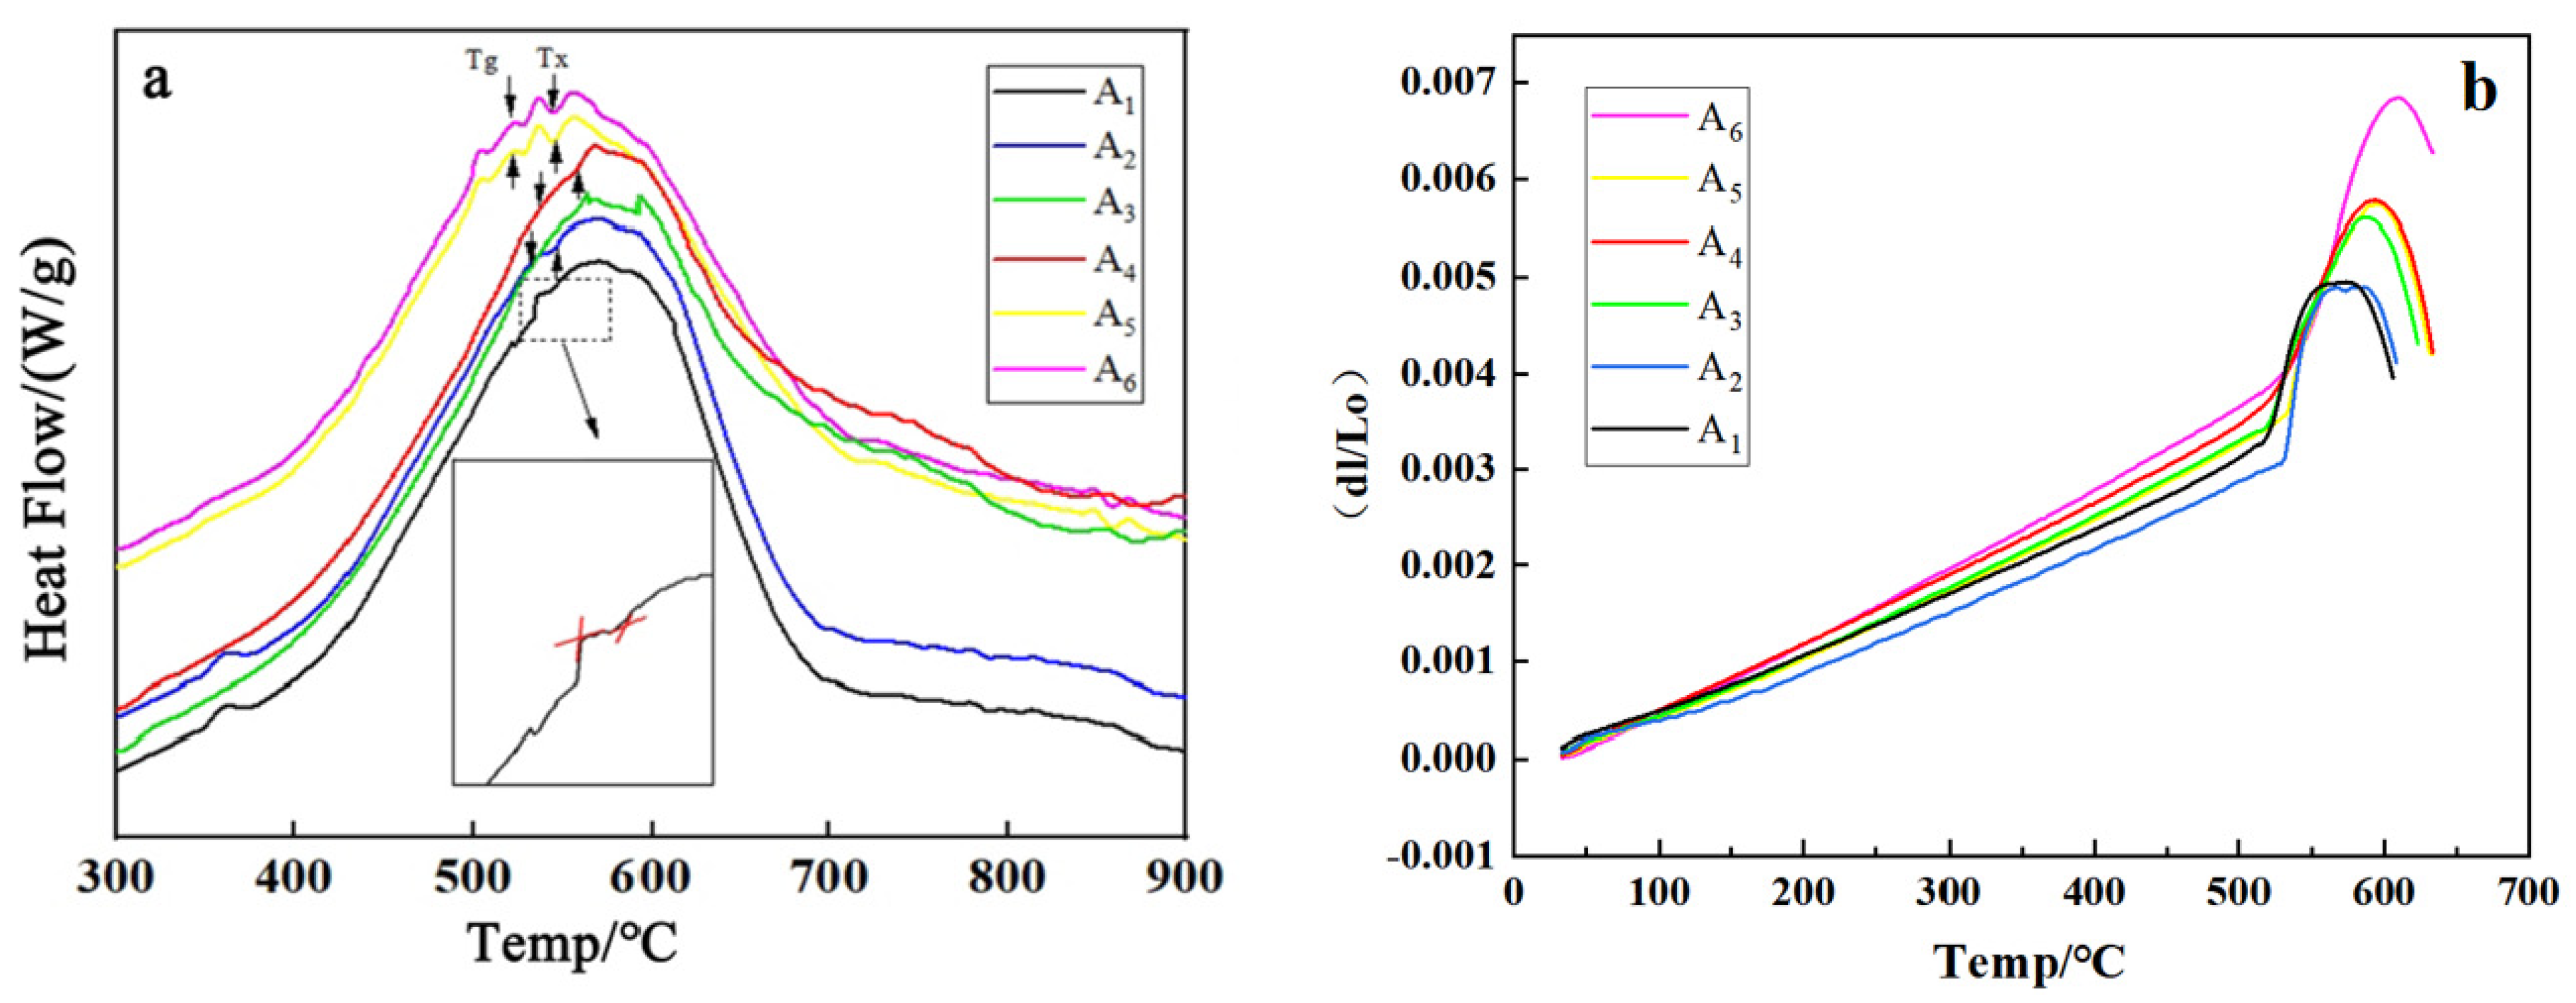
2.2. Differential Thermal Analysis (DTA)
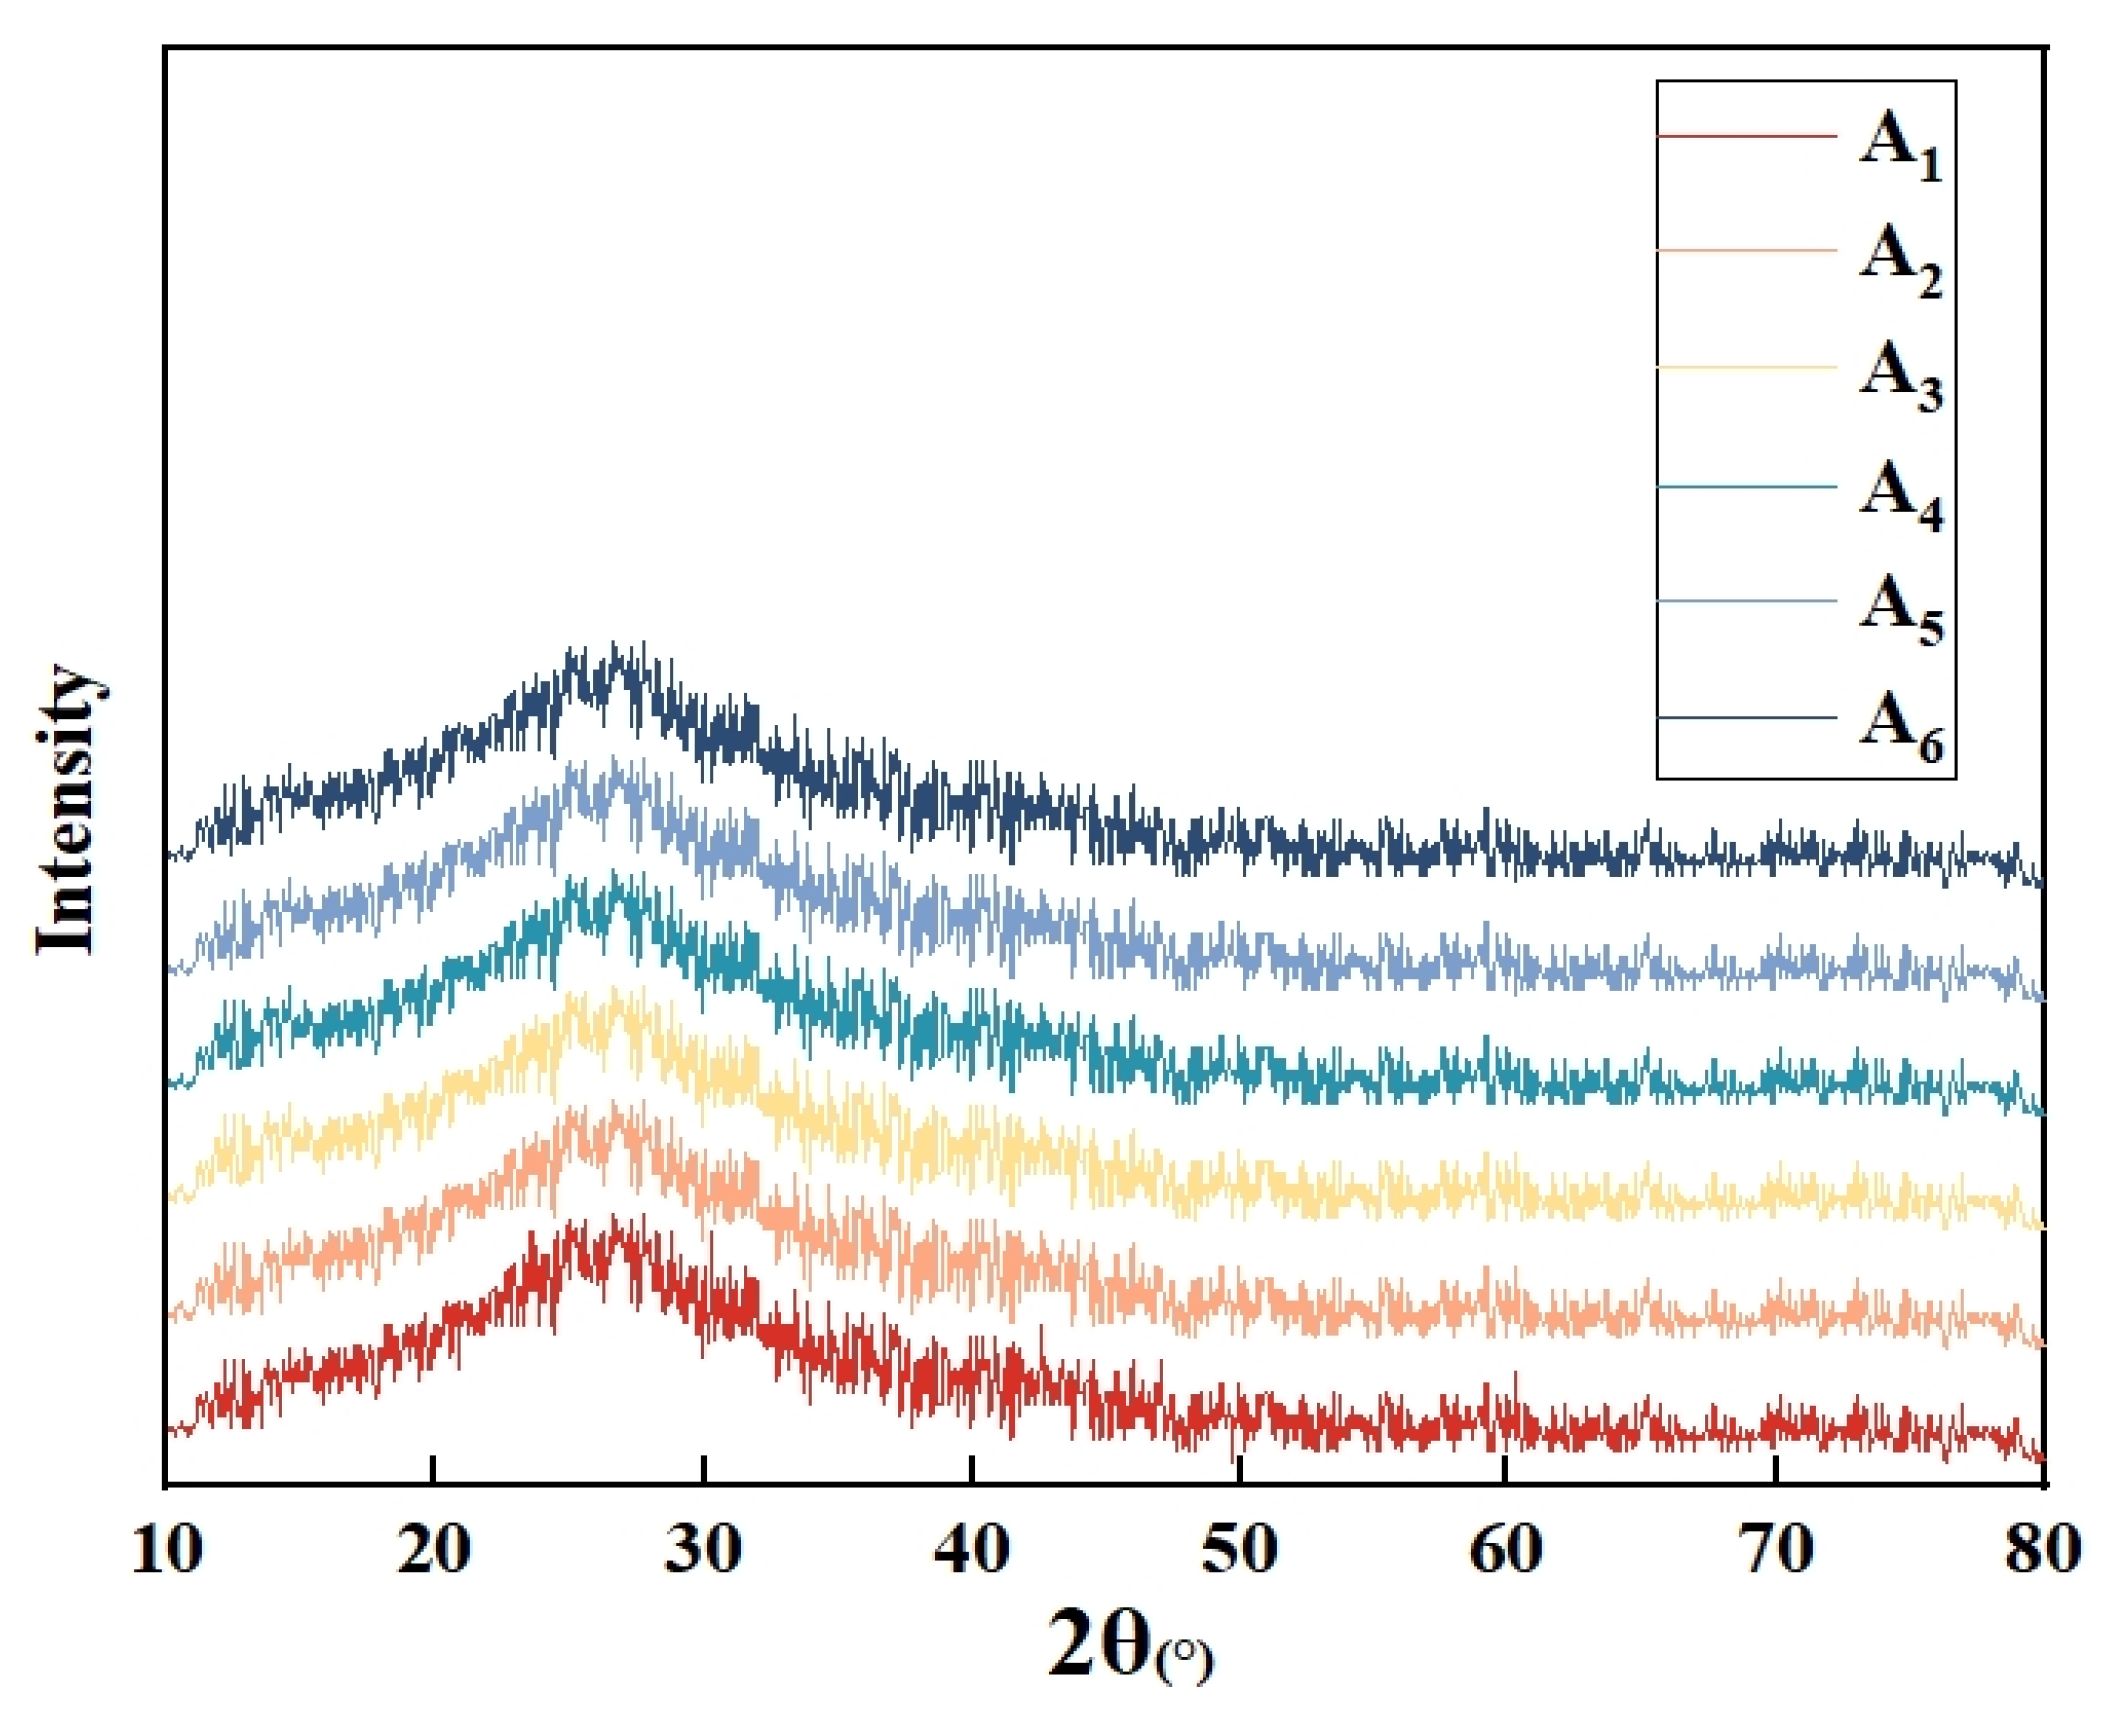
2.3. X-ray Diffraction Analysis (XRD)
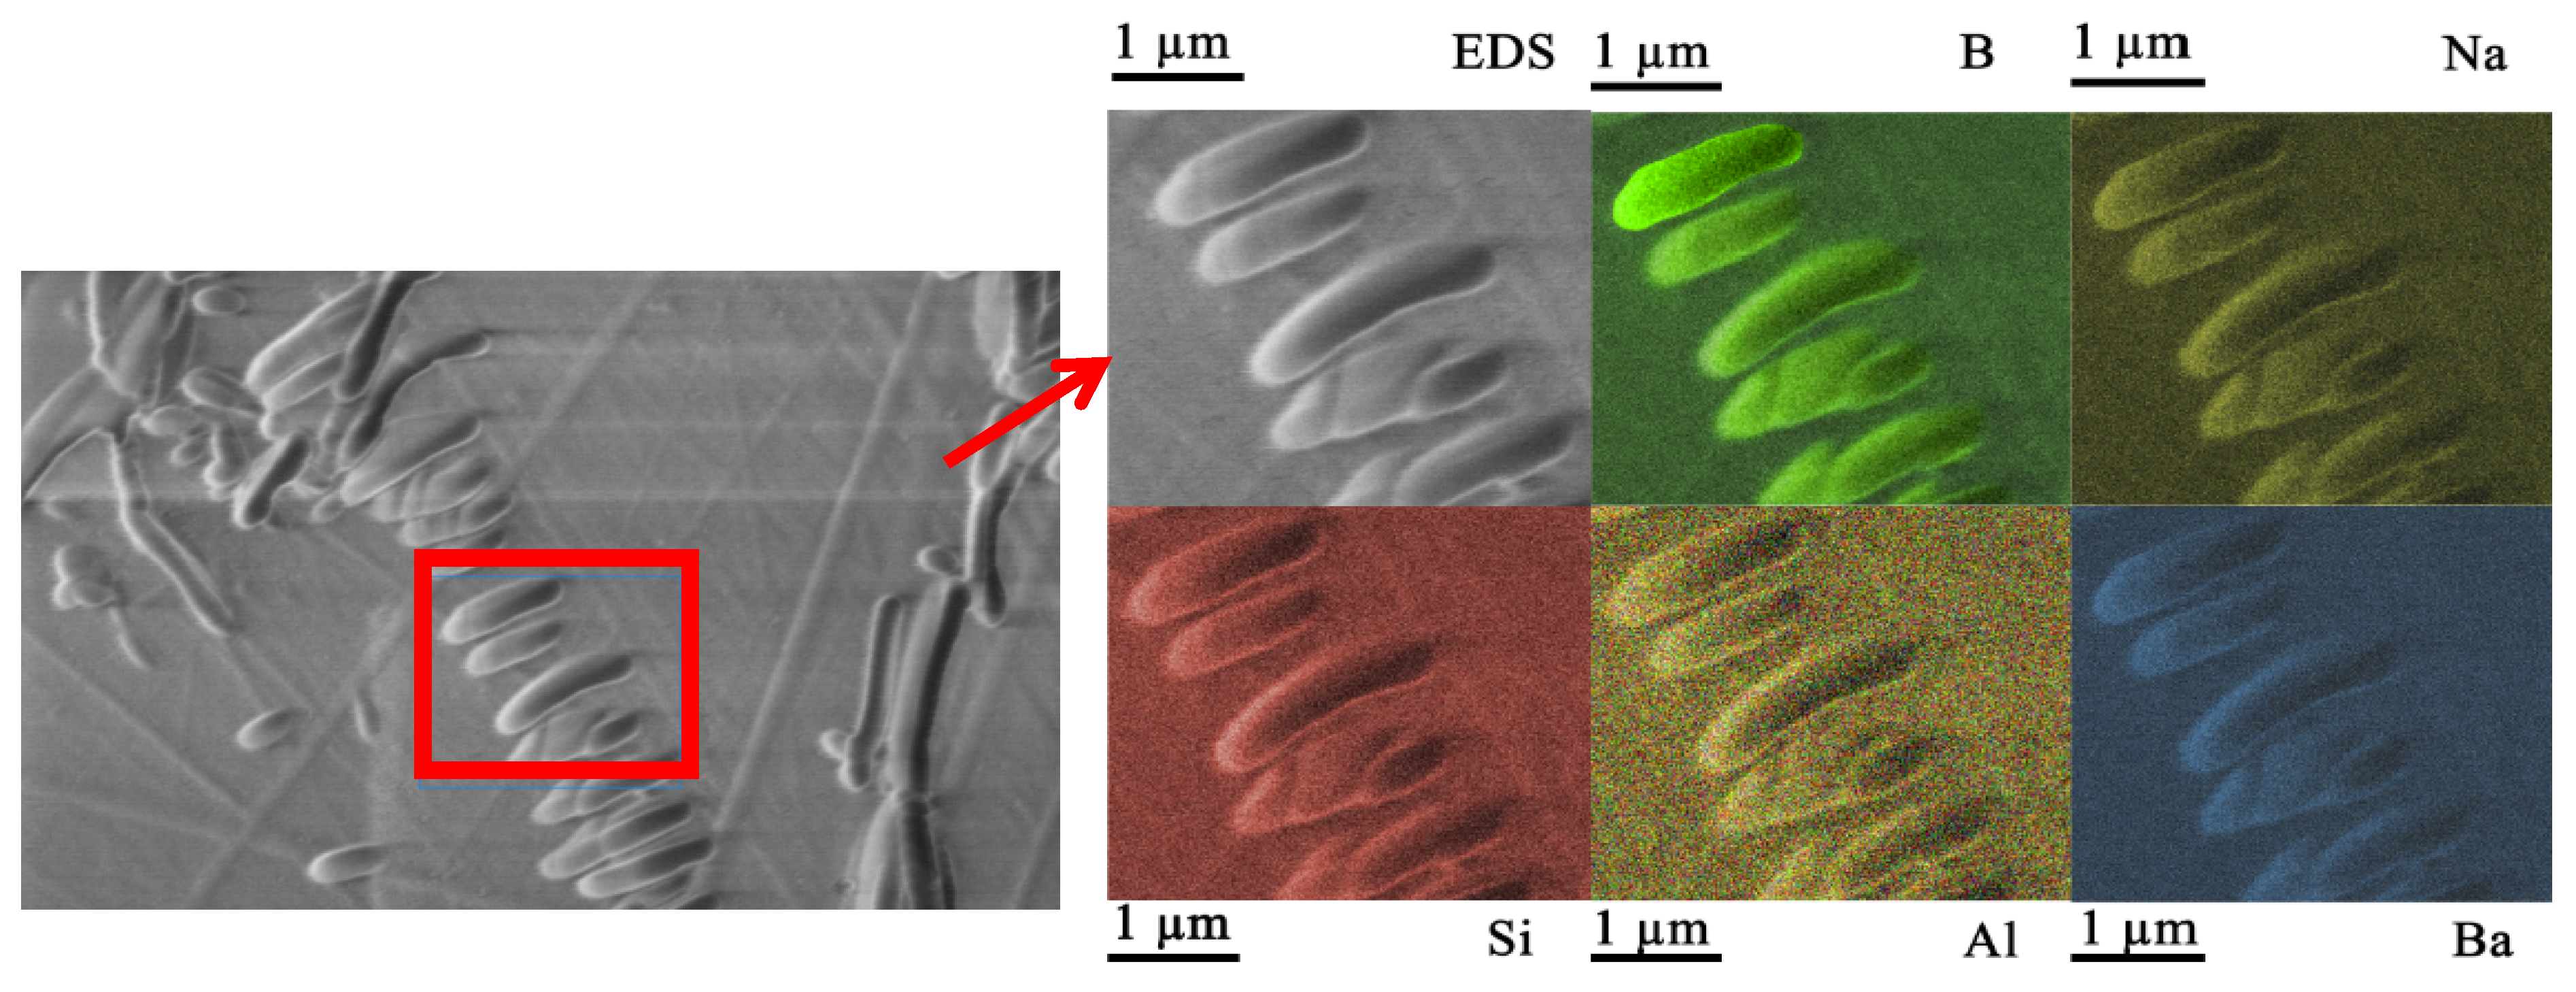
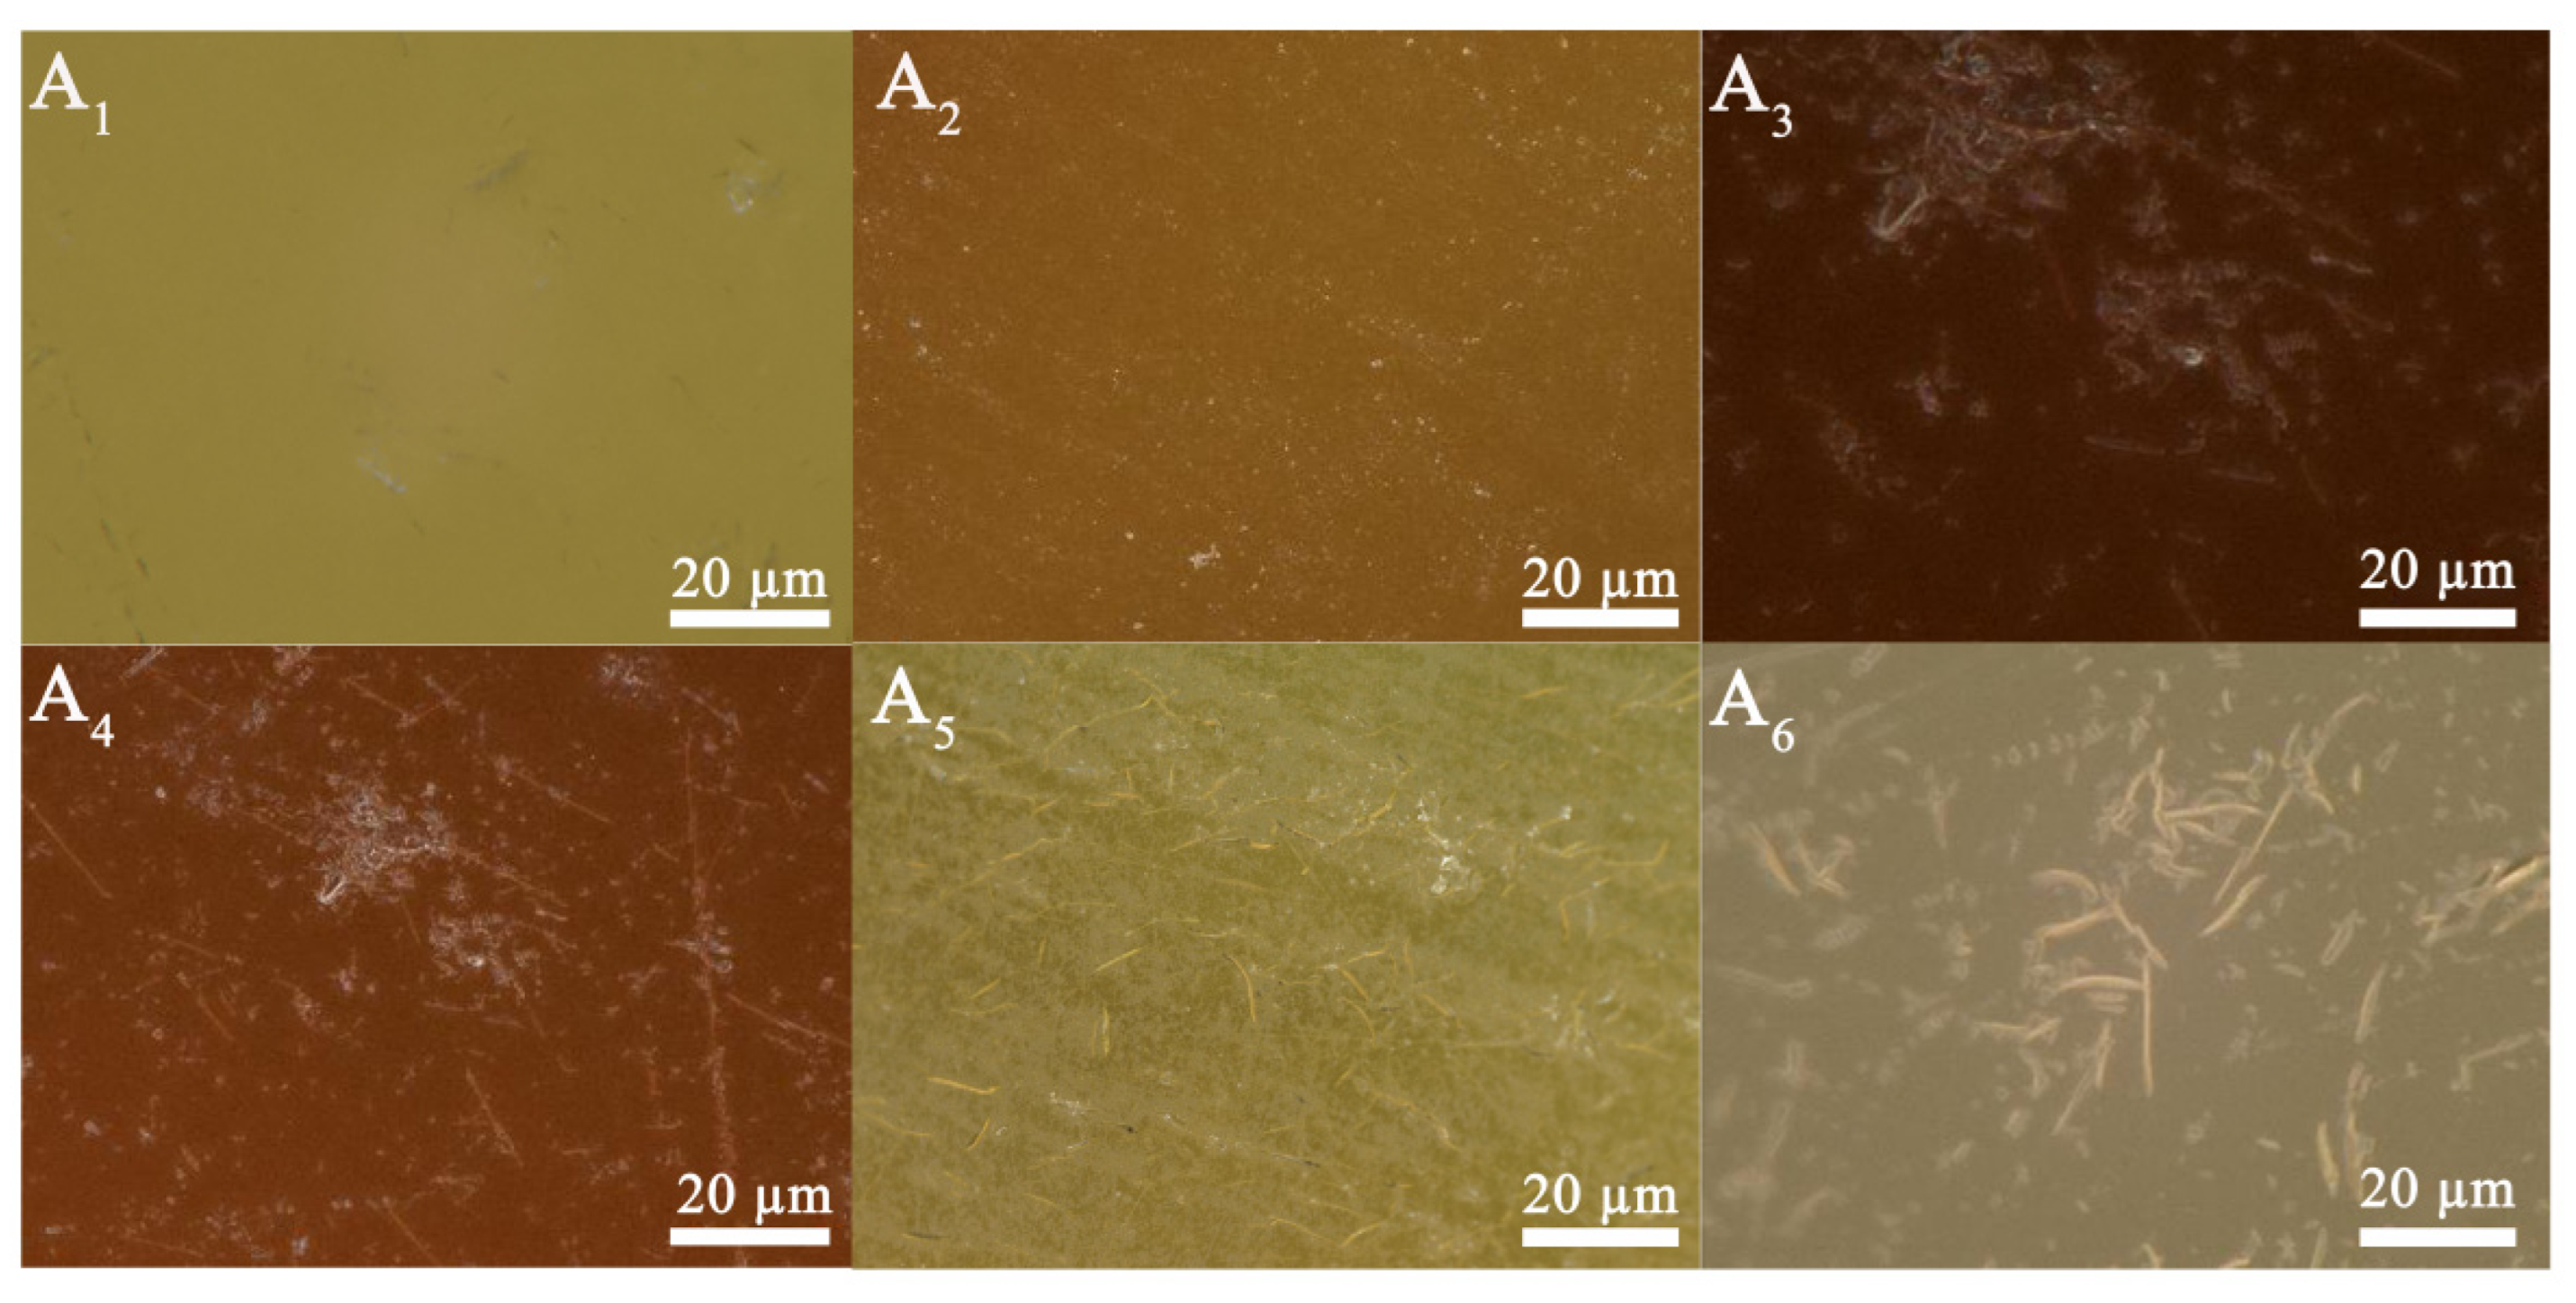
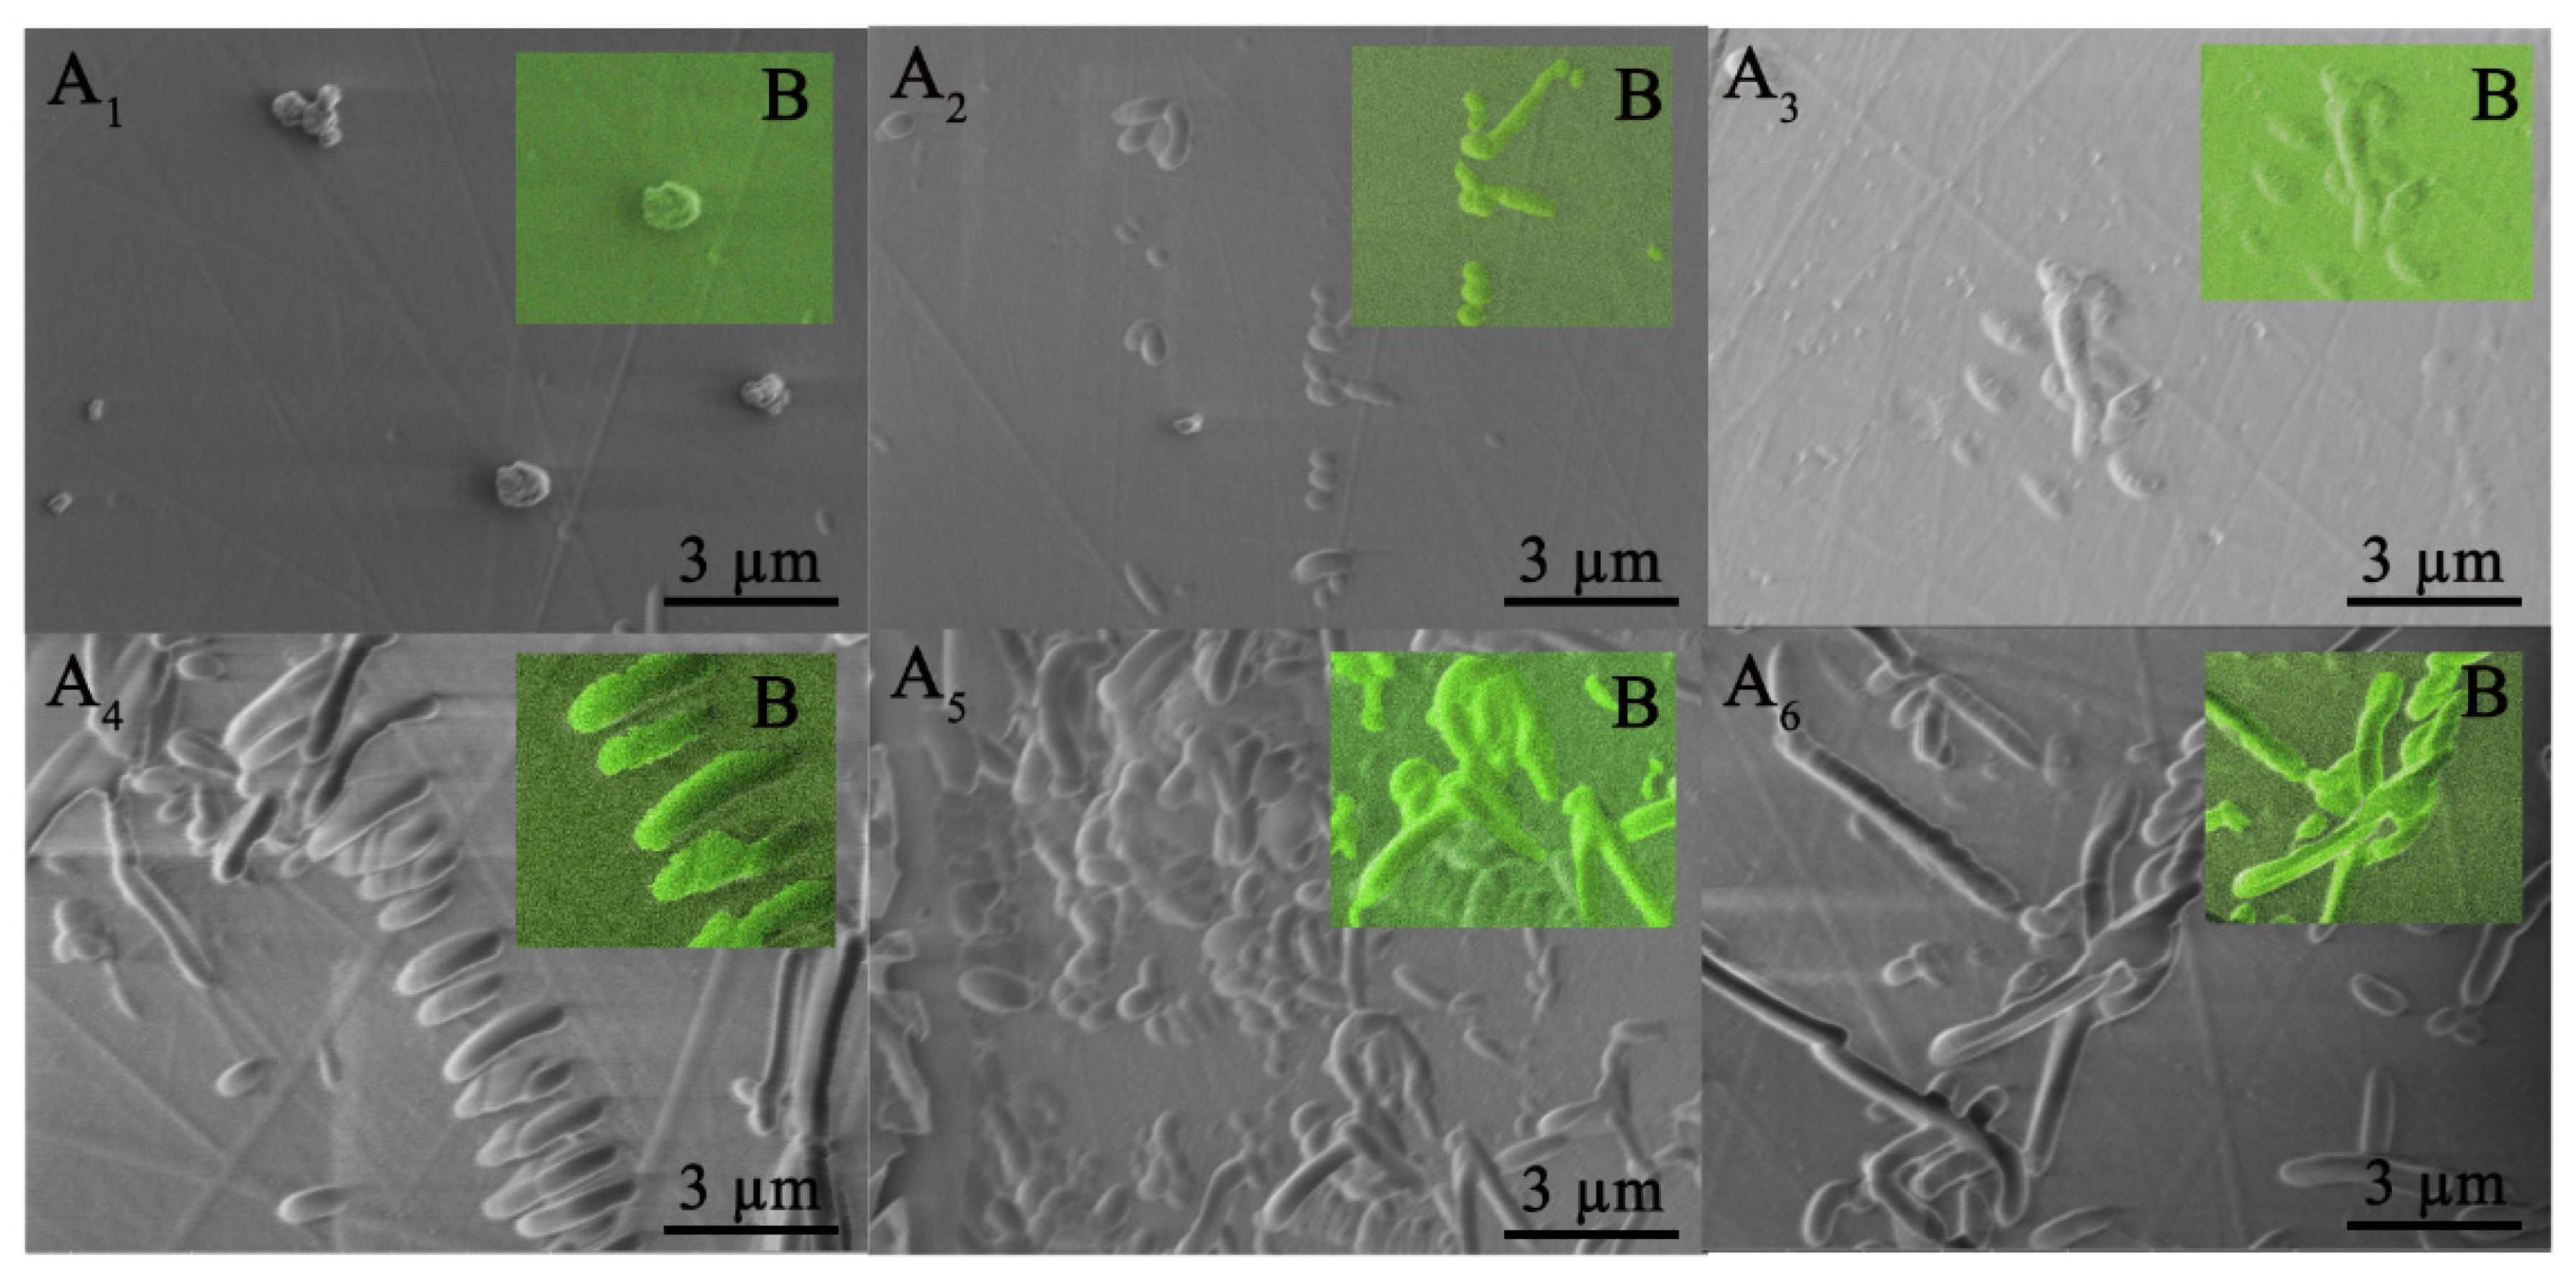
2.4. Scanning Electron Microscope (SEM)
2.5. Thermal Expansion Coefficient
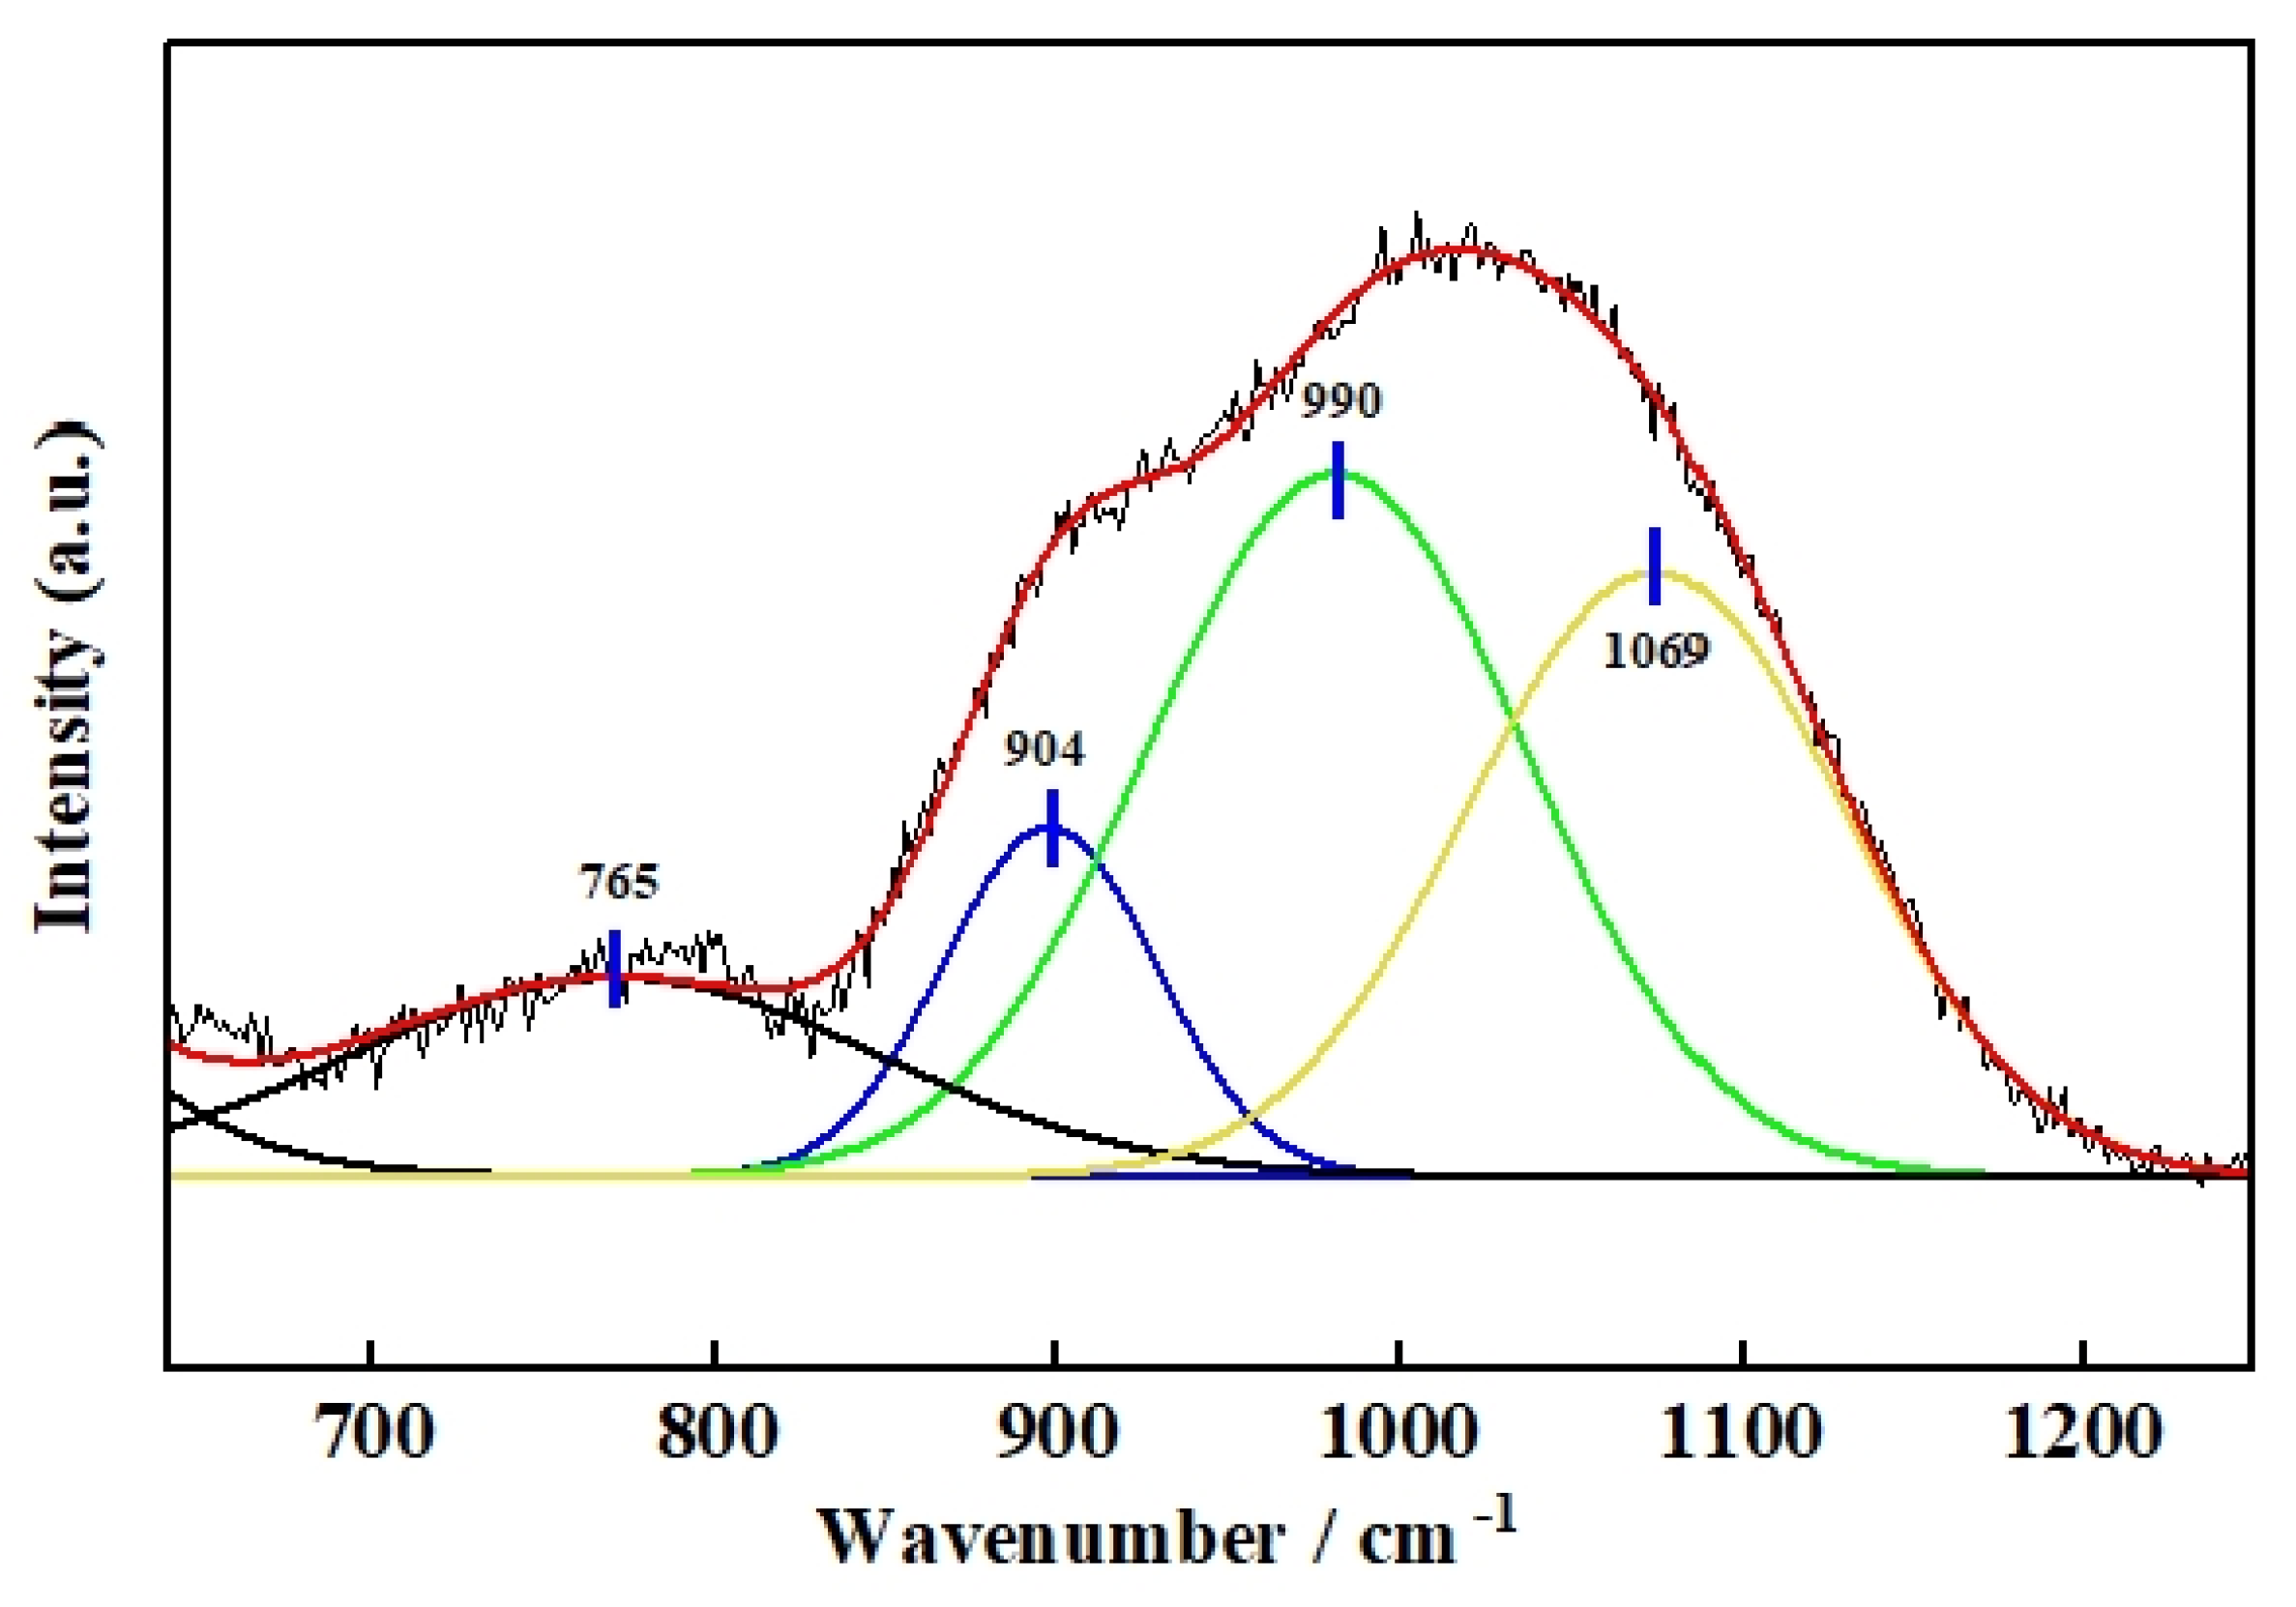
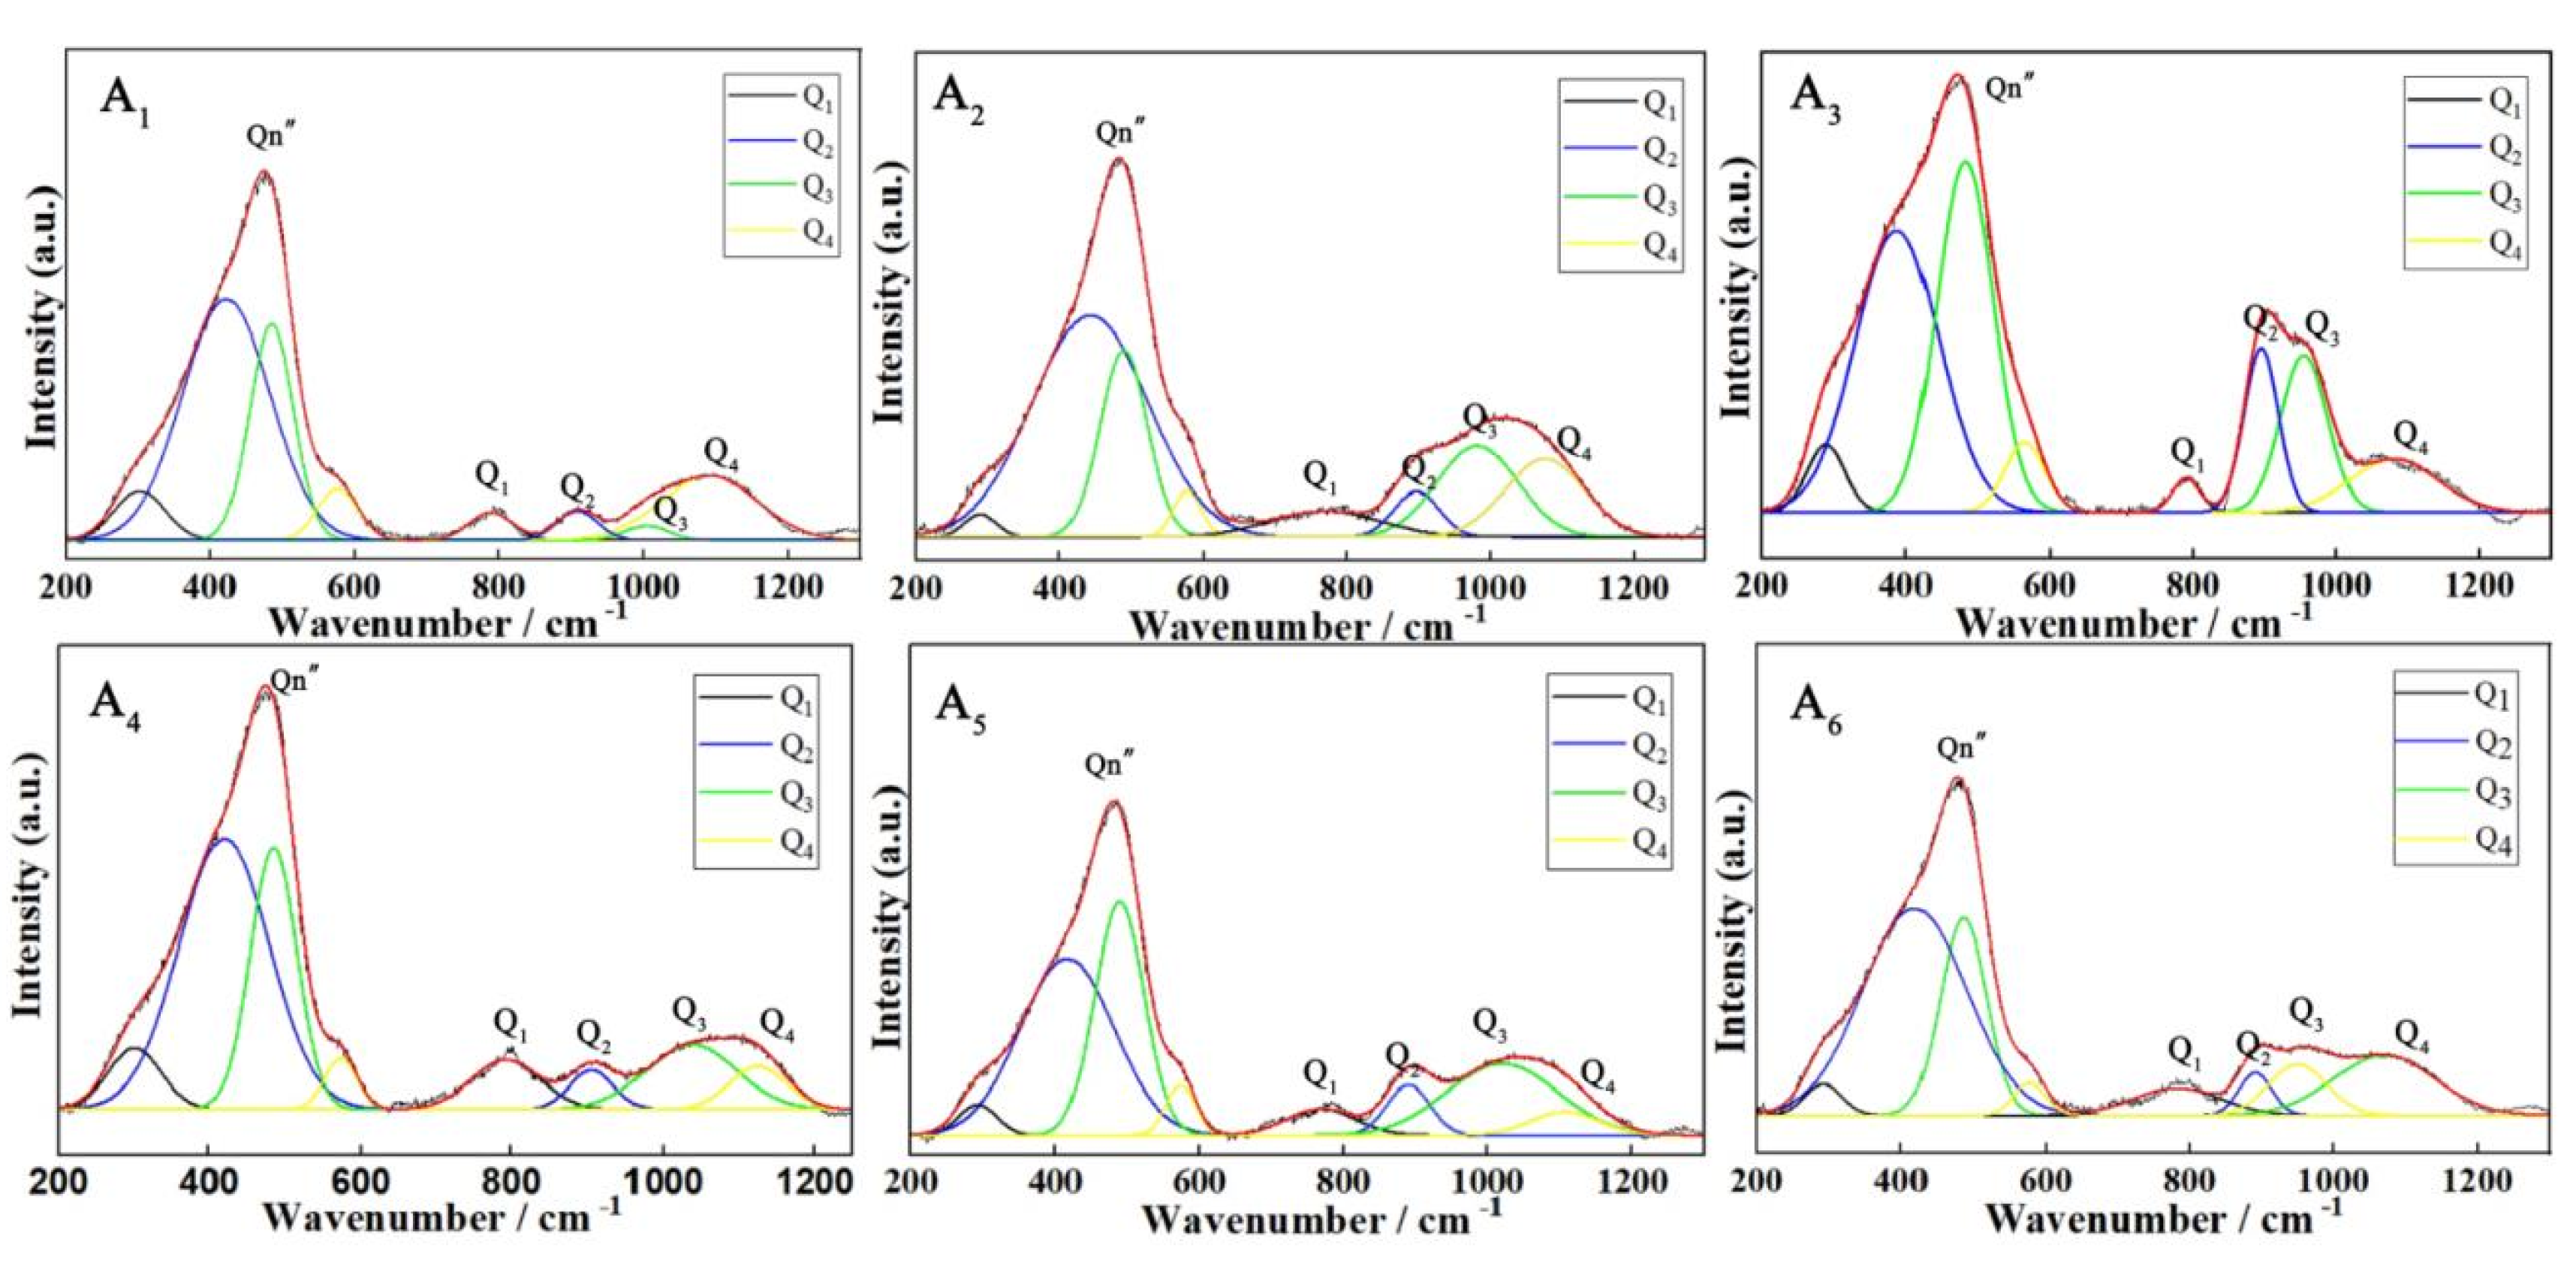
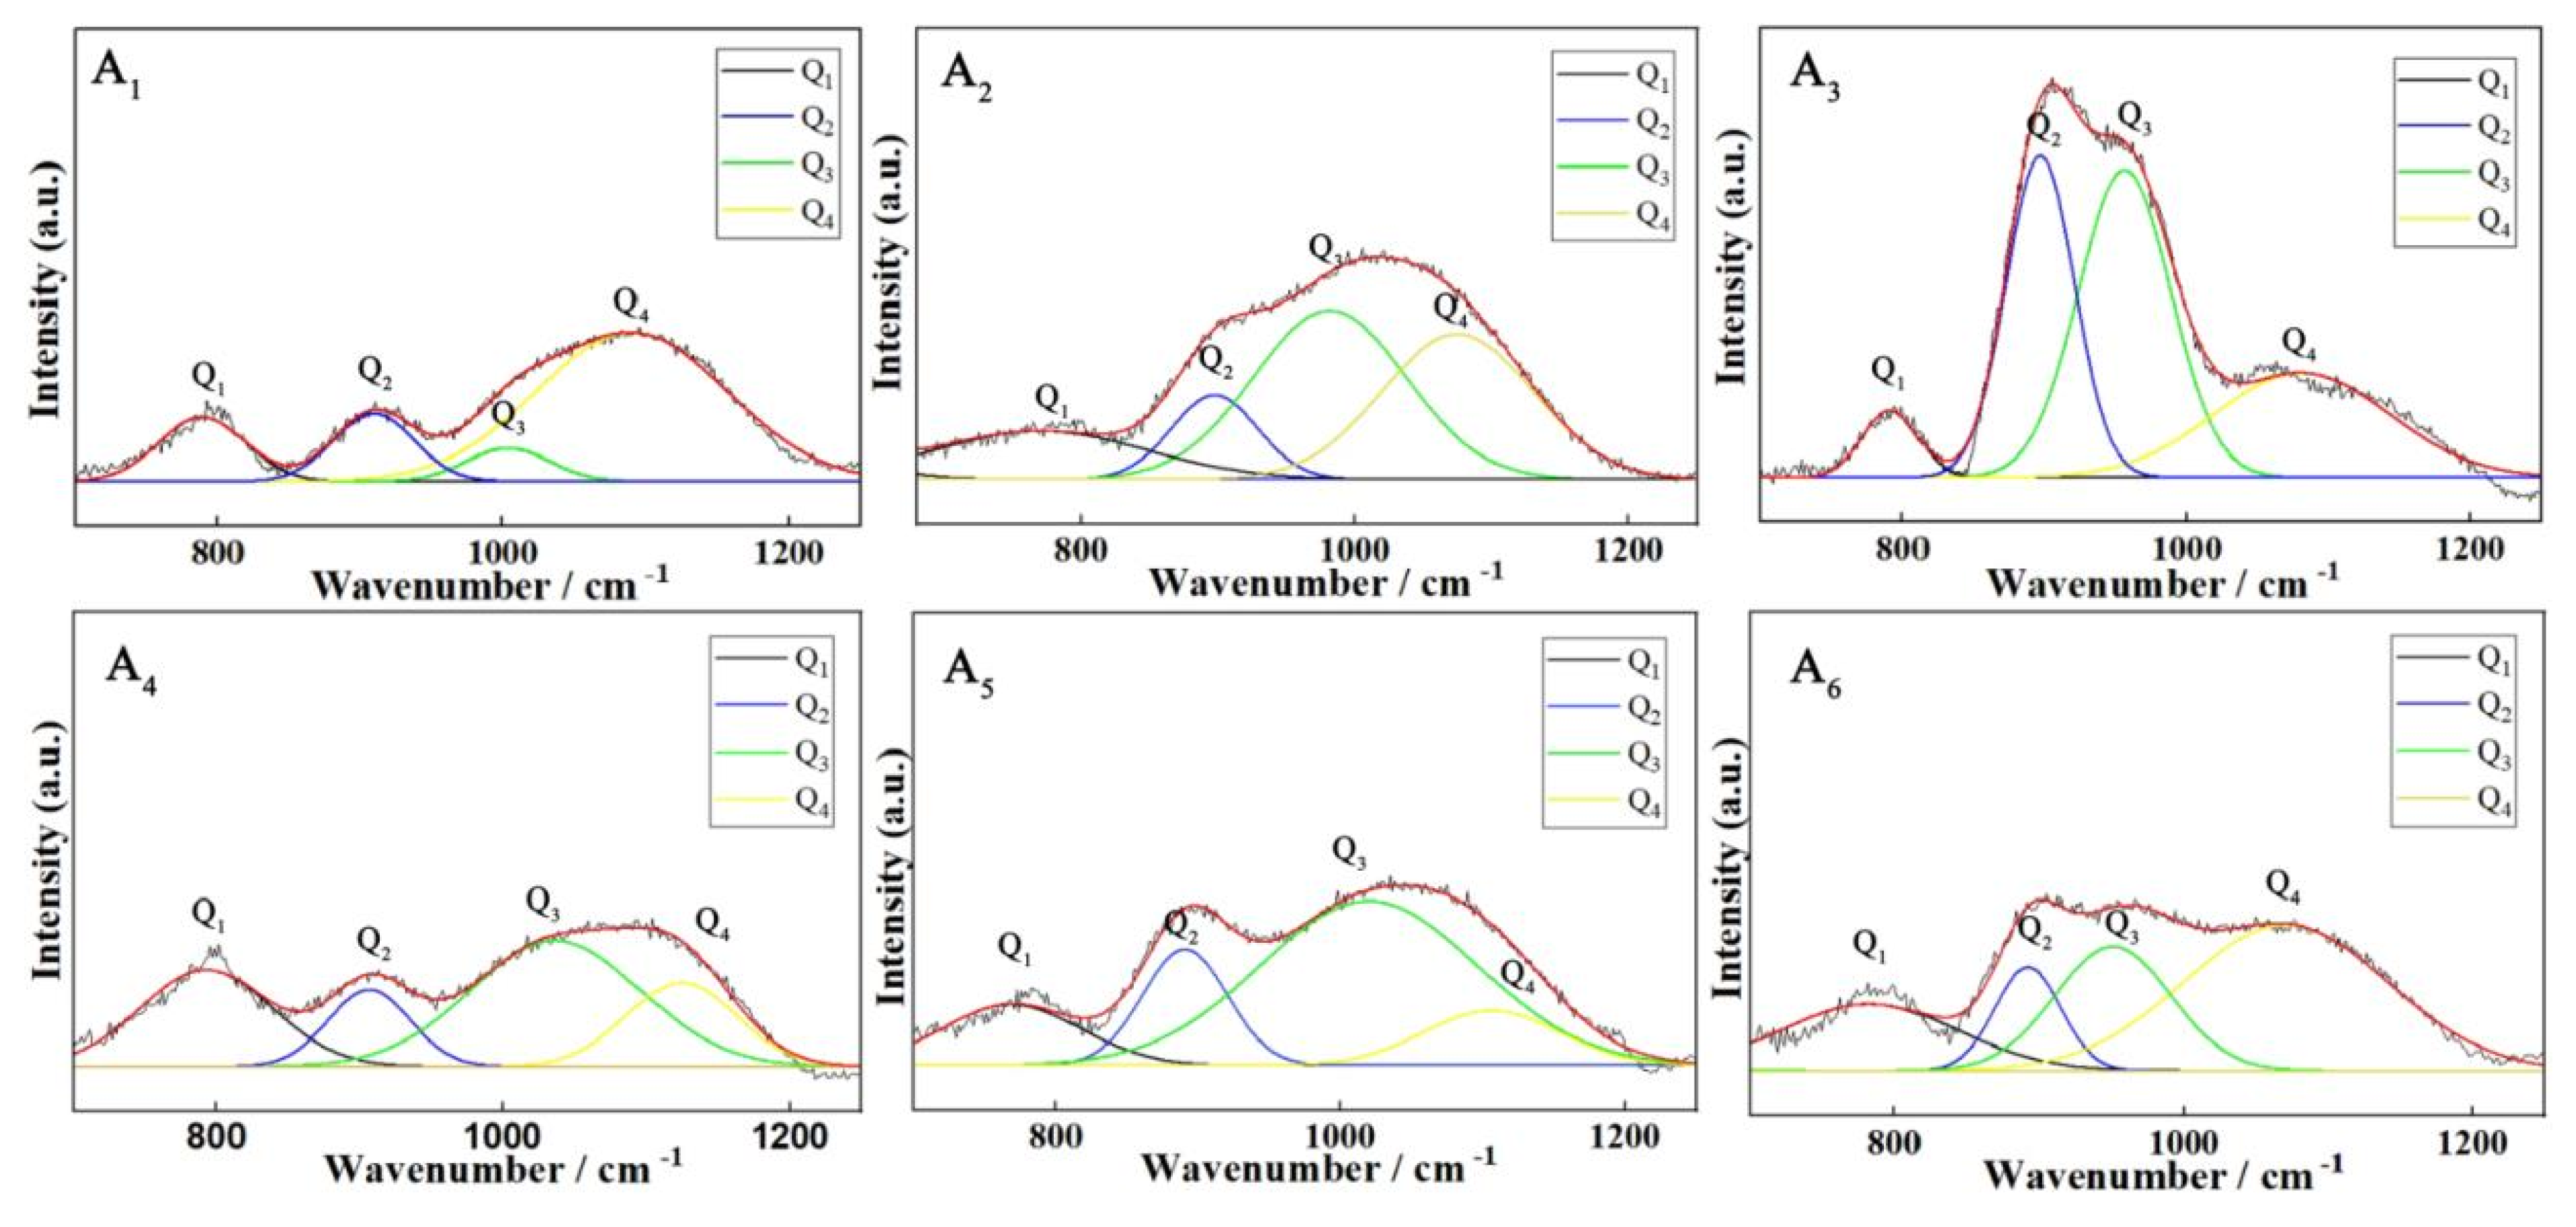
2.6. Raman Spectroscopy
3. An Analysis of the Intrinsic and Corrosion Resistance Properties of Glass
3.1. Dynamics and Microstructure Analysis
3.2. Analysis of Acid Resistance Performance
4. Conclusions
Author Contributions
Funding
Data Availability Statement
Conflicts of Interest
References
- Munmun, A.; Singh, K.K.; Randhir, S. Hydrometallurgical recovery of manganese and nickel and isolation of tantalum from obsolete tantalum capacitor. J. Environ. Chem. Eng. 2022, 10, 108887. [Google Scholar]
- Freeman, Y.; Lessner, P. Evolution of Polymer Tantalum Capacitors. Appl. Sci. 2021, 11, 5514. [Google Scholar] [CrossRef]
- Susan, D.F.; Van Den Avyle, J.A.; Monroe, S.L.; Sorensen, N.R.; McKenzie, B.B.; Christensen, J.E.; Michael, J.R.; Walker, C.A. The Effects of Pre-Oxidation and Alloy Chemistry of Austenitic Stainless Steels on Glass/Metal Sealing. Oxid. Met. 2009, 73, 311–335. [Google Scholar] [CrossRef]
- Yates, P.M.; Mallinson, C.F.; Mallinson, P.M.; Whiting, M.J.; Yeomans, J.A. An Investigation into the Nature of the Oxide Layer Formed on Kovar (Fe–29Ni–17Co) Wires Following Oxidation in Air at 700 and 800 °C. Oxid. Met. 2017, 88, 733–747. [Google Scholar] [CrossRef]
- Donald, I.W.; Mallinson, P.M.; Metcalfe, B.L.; Gerrard, L.A.; Fernie, J.A. Recent developments in the preparation, characterization and applications of glass- and glass–ceramic-to-metal seals and coatings. J. Mater. Sci. 2011, 46, 1975–2000. [Google Scholar] [CrossRef]
- Li, X.; Yazhenskikh, E.; Groß-Barsnick, S.M.; Baumann, S.; Behr, P.; Deibert, W.; Koppitz, T.; Müller, M.; Meulenberg, W.A.; Natour, G. Crystallization behavior of BaO–CaO–SiO2–B2O3 glass sealant and adjusting its thermal properties for oxygen transport membrane joining application. J. Eur. Ceram. Soc. 2023, 43, 2541–2552. [Google Scholar] [CrossRef]
- Salman, S.M.; Salama, S.N.; Abo-Mosallam, H.A. Crystallization characteristics and physico-chemical properties of glass–ceramics based on Li2O–ZnO–SiO2 system. Boletín Soc. Española Cerámica Vidr. 2017, 56, 205–214. [Google Scholar] [CrossRef]
- Li, G.; Fu, R.; Agathopoulos, S.; Su, X.; He, Q.; Ji, Y.; Liu, X. Ultra-low thermal expansion coefficient of PZB/β-eucryptite composite glass for MEMS packaging. Ceram. Int. 2020, 46, 8385–8390. [Google Scholar] [CrossRef]
- Dai, S.; Elisberg, B.; Calderone, J.; Lyon, N. Sealing glass-ceramics with near-linear thermal strain, part III: Stress modeling of strain and strain rate matched glass-ceramic to metal seals. J. Am. Ceram. Soc. 2017, 100, 3652–3661. [Google Scholar] [CrossRef]
- Guo, M.; Jin, Y.; Zhang, R.; Yang, Z.; Peng, S. Low leakage rate of silicate glass modified with Al2O3 for solid oxide fuel cell. J. Eur. Ceram. Soc. 2022, 42, 3264–3270. [Google Scholar] [CrossRef]
- Madheshiya, A.; Singh, A.K.; Shweta; Mishra, R.K.; Dey, K.K.; Ghosh, M.; Srivastava, K.K.; Garg, P.; Gautam, C. Synthesis, physical, optical and structural properties of SrTiO3 borosilicate glasses with addition of CrO3. Bull. Mater. Sci. 2023, 46, 34. [Google Scholar] [CrossRef]
- Singh, K.; Walia, T. Review on silicate and borosilicate-based glass sealants and their interaction with components of solid oxide fuel cell. Int. J. Energy Res. 2021, 45, 20559–20582. [Google Scholar] [CrossRef]
- Wan, J.; Cheng, J.; Lu, P. Effect of Al3O3 on the thermal expansion and phase separation of borosilicate glass. J. Chin. Ceram. Soc. 2008, 36, 544. [Google Scholar]
- Hordieiev, Y.S.; Zaichuk, A.V. Study of the Influence of R2O3 (R = Al, La, Y) on the Structure, Thermal and some Physical Properties of Magnesium Borosilicate Glasses. J. Inorg. Organomet. Polym. Mater. 2023, 33, 591–598. [Google Scholar] [CrossRef]
- He, F.; Fang, Y.; Liu, J.; Cheng, J.S. Effect of B2O3 on structure and properties of borosilicate glass. J. Wuhan Univ. Technol. 2012, 34, 1–4. [Google Scholar]
- Bengtsson, F.; Pehlivan, I.B.; Österlund, L.; Karlsson, S. Alkali ion diffusion and structure of chemically strengthened TiO2 doped soda-lime silicate glass. J. Non-Cryst. Solids 2022, 586, 121564. [Google Scholar] [CrossRef]
- Gu, Q.B.; Ni, J.M. Preparation and Analysis of Doped TiO2 in the Bi2O3-SiO2-ZnO-B2O3 Low-Melting Sealing Glasses. Key Eng. Mater. 2012, 509, 308–313. [Google Scholar] [CrossRef]
- Chen, Y.; Yang, S.; Wang, Q.; He, S. Effect of (BaO + CaO)/Al2O3 ratio (1.7~2.0) on the structure and Al-Li association of BaO-CaO-Al2O3-CaF2-Li2O mold flux. J. Non-Cryst. Solids 2022, 584, 121522. [Google Scholar] [CrossRef]
- Chung, S.-Y.; Kim, Y.-M.; Kim, J.-G.; Kim, Y.-J. Multiphase transformation and Ostwald’s rule of stages during crystallization of a metal phosphate. Nat. Phys. 2008, 5, 68–73. [Google Scholar] [CrossRef]
- Colomban, P.; Tournie, A.; Bellot-Gurlet, L. Raman identification of glassy silicates used in ceramics, glass and jewellery: A tentative differentiation guide. J. Raman Spectrosc. 2006, 37, 841–852. [Google Scholar] [CrossRef]
- Deng, L.; Zhang, X.; Zhang, M.; Jia, X.; Zhang, Z.; Li, B. Structure and properties of in situ synthesized FeSi2-diopside glass ceramic composites from Bayan Obo tailings, blast furnace slag, and fly ash. J. Alloys Compd. 2019, 785, 932–943. [Google Scholar] [CrossRef]
- Zhang, M.-X.; Kelly, P.M. Crystallographic features of phase transformations in solids. Prog. Mater. Sci. 2009, 54, 1101–1170. [Google Scholar] [CrossRef]
- Zhang, Y.; Li, H.; Liu, S.; Wu, N.; OuYang, S. Raman spectroscopic study of irregular network in the process of glass conversion to CaO-MgO-Al2O3-SiO2 glass-ceramics. J. Non-Cryst. Solids 2021, 563, 120701. [Google Scholar] [CrossRef]
- Santos, A.G.; Moulton, B.J.; Cabral, A.A. Discoveries about the structure of alkaline earth-bearing borosilicate glasses doped with TiO2 revealed by Raman spectroscopy. J. Non-Cryst. Solids 2022, 578, 121349. [Google Scholar] [CrossRef]
- Kaur, M.; Singh, S.P.; Mudahar, D.S.; Mudahar, G.S. Structural investigation of B2O3-Li2CO3-Al2O3 glasses by molar volume measurements and FTIR spectroscopy. Mater. Phys. Mech. 2012, 15, 66–73. [Google Scholar]


| Composition (wt %) | Example | |||||
|---|---|---|---|---|---|---|
| A1 | A2 | A3 | A4 | A5 | A6 | |
| SiO2 | 59.7 | 58.7 | 58.2 | 55.2 | 55.7 | 56.7 |
| B2O3 | 12 | 12 | 12 | 15 | 15 | 15 |
| Al2O3 | 7 | 7 | 7 | 7 | 7 | 7 |
| BaO | 6 | 6 | 6 | 6 | 6 | 6 |
| K2O | 5 | 4 | 5.5 | 4 | 5 | 3 |
| Na2O | 3 | 5 | 4 | 5.5 | 4 | 5 |
| Fe2O3 | 0.3 | 0.3 | 0.3 | 0.3 | 0.3 | 0.3 |
| TiO2 | 3 | 3 | 3 | 3 | 3 | 3 |
| ZrO | 2 | 2 | 2 | 2 | 2 | 2 |
| Li2O | 1 | 1 | 1 | 1 | 1 | 1 |
| High-entropy oxide | 1 | 1 | 1 | 1 | 1 | 1 |
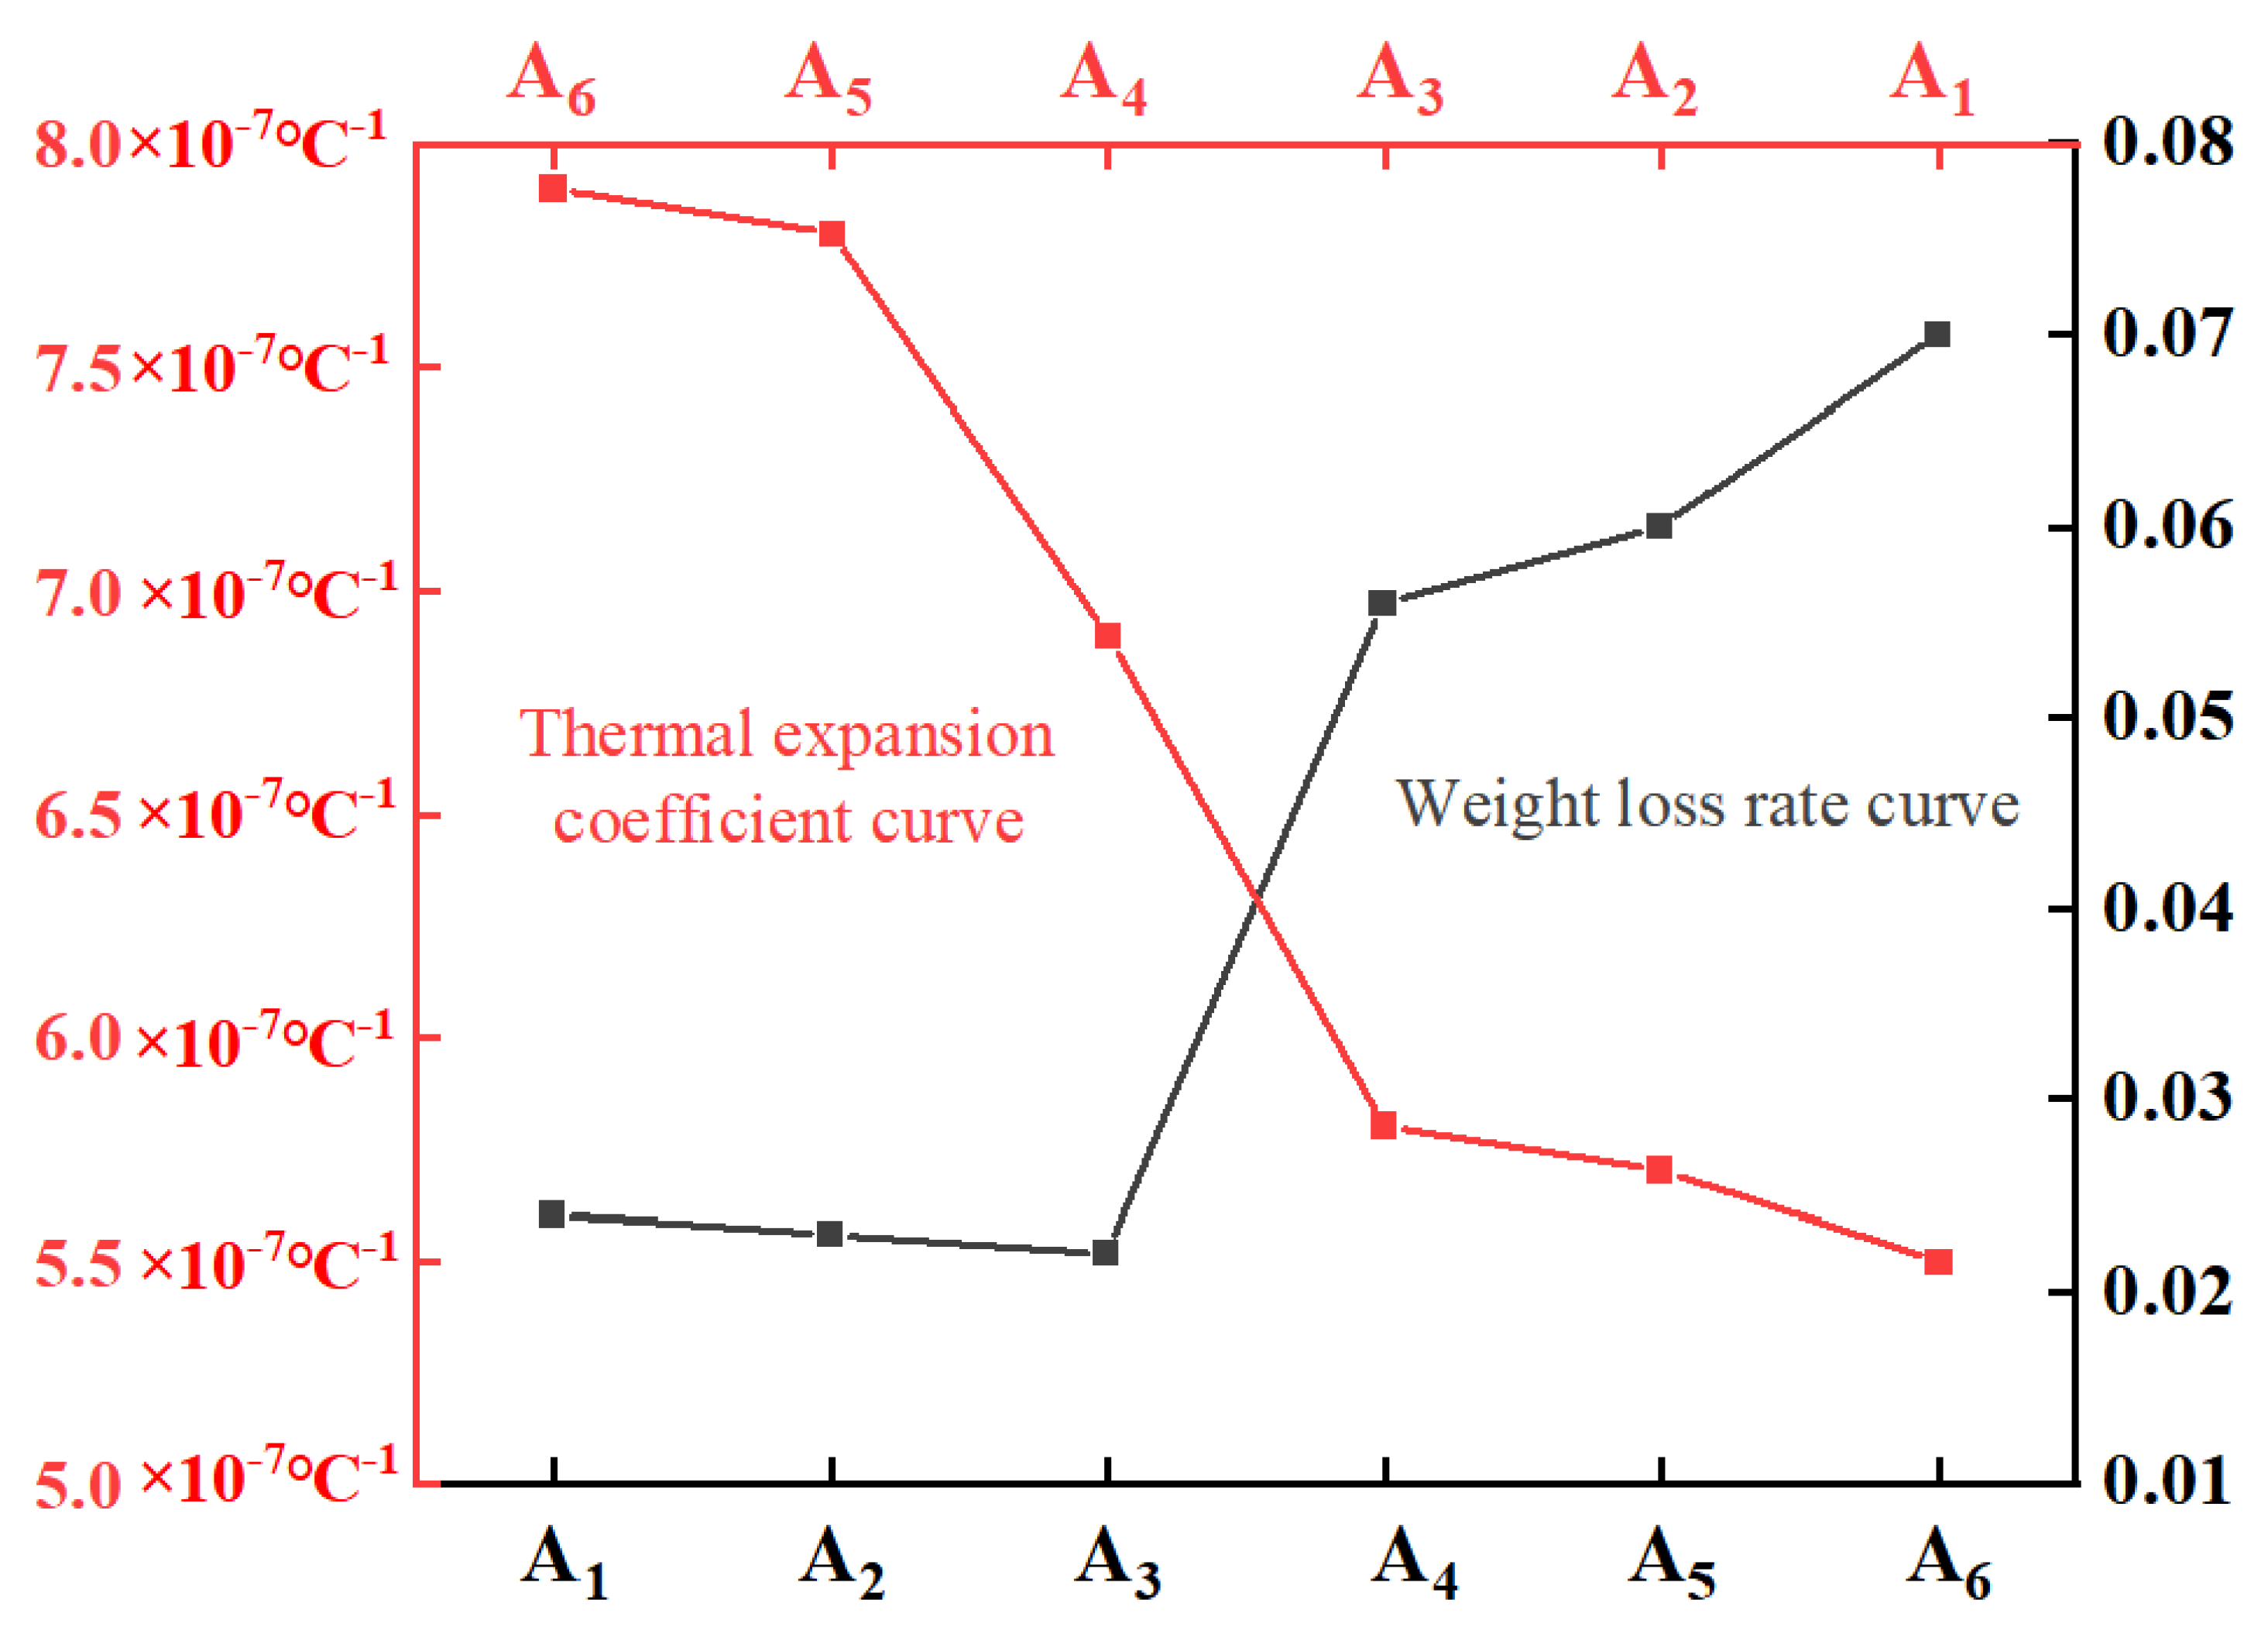
| Linear expansion coefficient (10−7 °C−1) | 7.9 | 7.8 | 6.9 | 5.8 | 5.7 | 5.5 |
| Softening temperature (°C) | 570 °C | 574 °C | 569 °C | 570 °C | 609 °C | 630 °C |
| A1 | A2 | A3 | A4 | A5 | A6 | |
|---|---|---|---|---|---|---|
| Q1Peak position | 781 cm−1 | 765 cm−1 | 782 cm−1 | 780 cm−1 | 759 cm−1 | 784 cm−1 |
| Q2Peak position | 920 cm−1 | 904 cm−1 | 880 cm−1 | 880 cm−1 | 894 cm−1 | 887 cm−1 |
| Q3Peak position | 1012 cm−1 | 990 cm−1 | 981 cm−1 | 1025 cm−1 | 1011 cm−1 | 970 cm−1 |
| Q4Peak position | 1090 cm−1 | 1069 cm−1 | 1036 cm−1 | 1136 cm−1 | 1121 cm−1 | 1090 cm−1 |
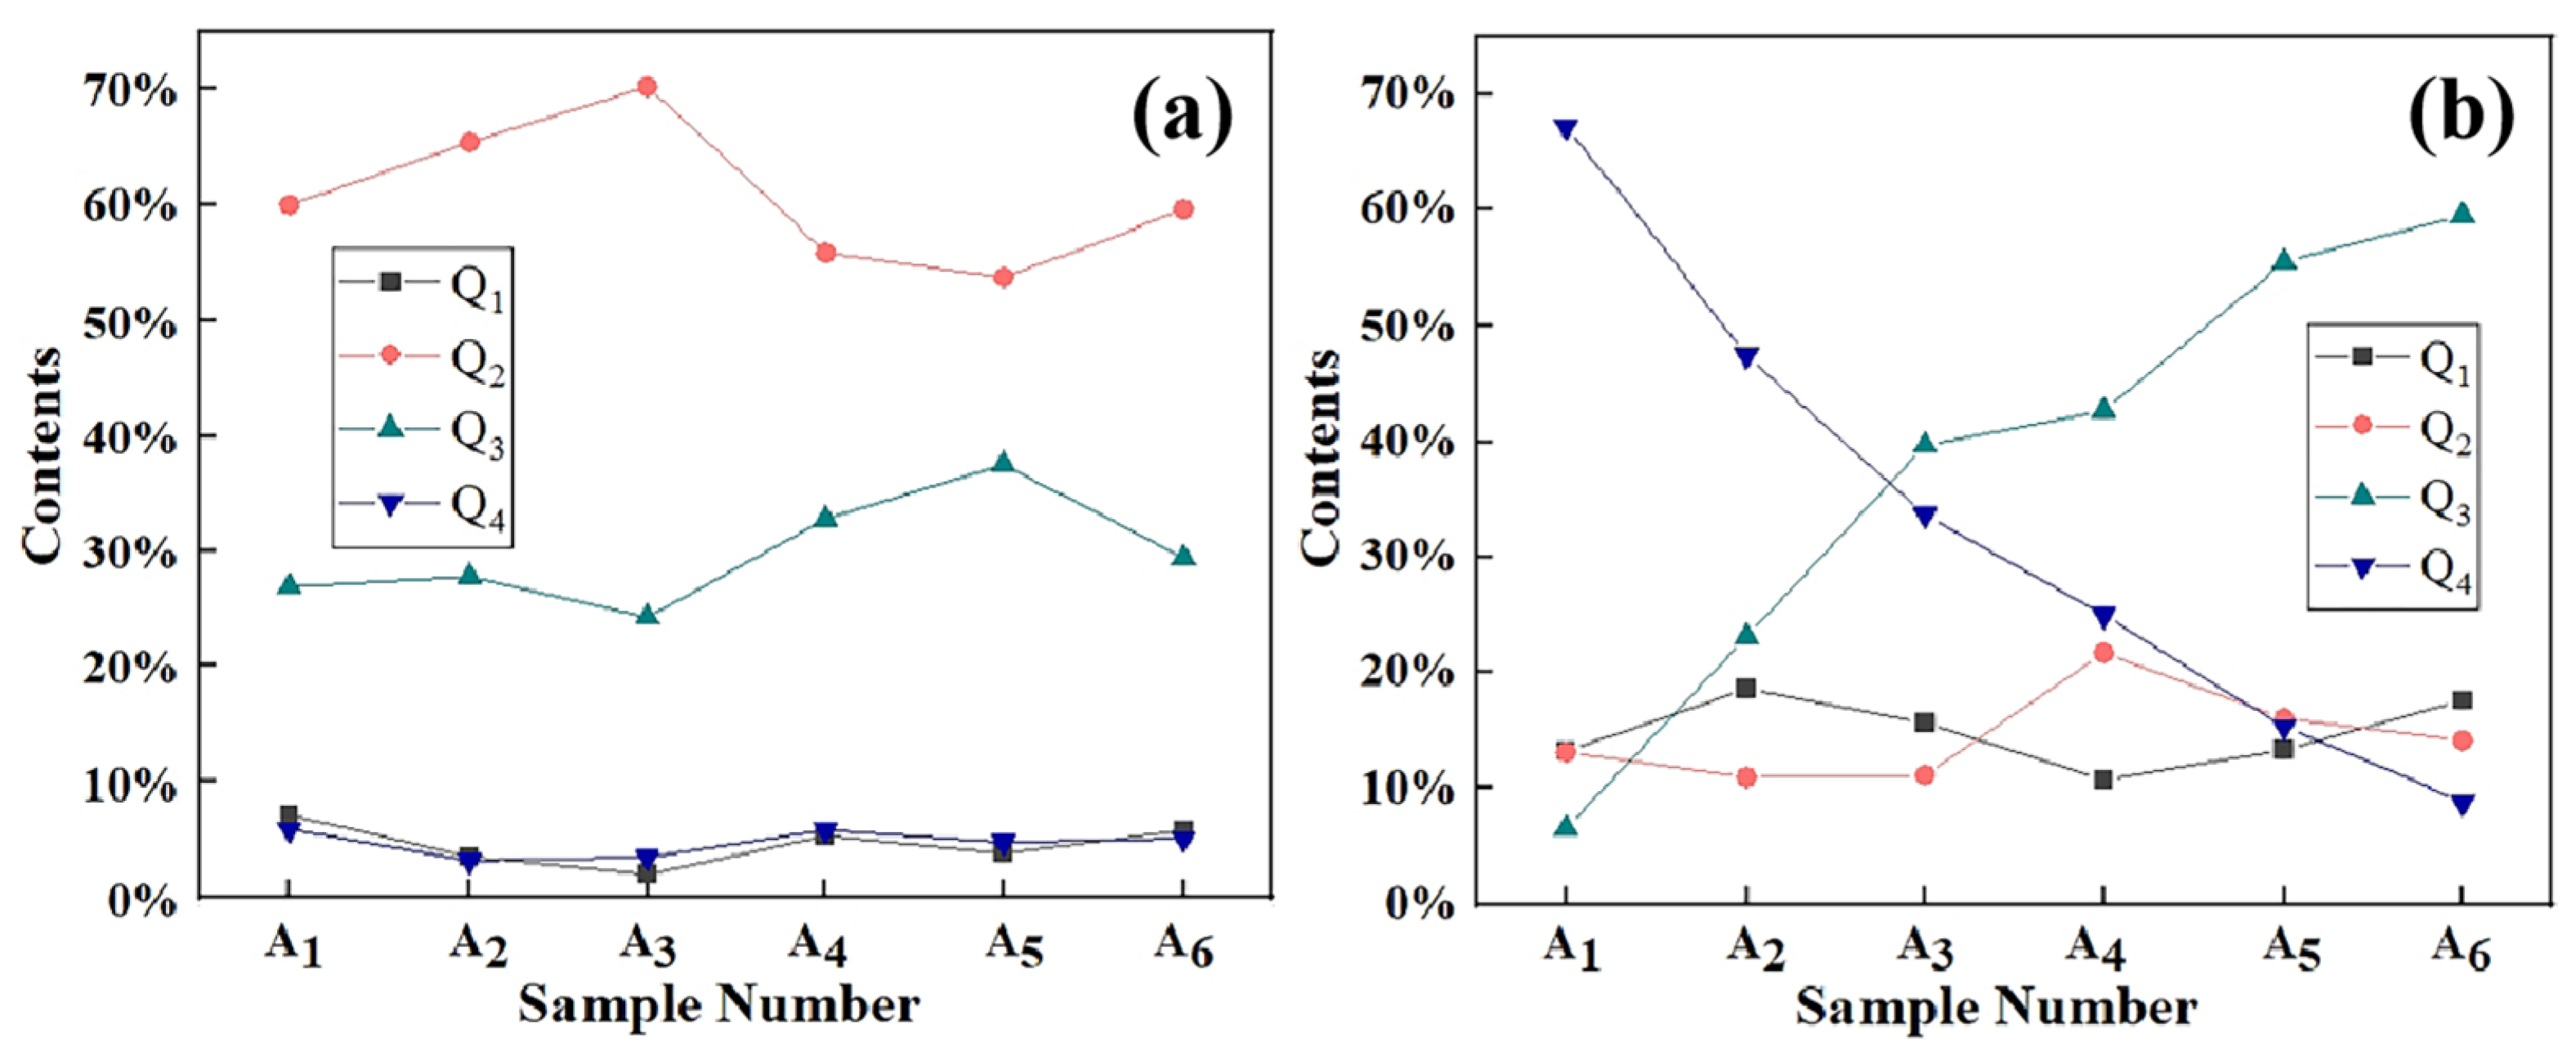
| AQ1 | 13.14% | 18.54% | 15.58% | 10.65% | 13.24% | 17.55% |
| AQ2 | 13.05% | 10.88% | 11.07% | 21.67% | 16.01% | 14.06% |
| AQ3 | 13.58% | 23.06% | 39.68% | 42.70% | 55.49% | 59.53% |
| AQ4 | 60.22% | 47.50% | 33.65% | 24.97% | 15.25% | 8.84% |
| A500 | 3.09 × 10⁶ | 3.05 × 10⁶ | 2.70 × 10⁶ | 3.66 × 10⁶ | 2.98 × 10⁶ | 2.61 × 10⁶ |
| A1000 | 8.10 × 10⁵ | 8.62 × 10⁵ | 1.19 × 10⁶ | 1.42 × 10⁶ | 1.18 × 10⁶ | 1.32 × 10⁶ |
| Ip | 3.82 | 3.51 | 2.58 | 2.26 | 2.21 | 1.98 |
| NBO/(NBO + BO) | 0.21 | 0.27 | 0.29 | 0.33 | 0.34 | 0.37 |
| Tg | 538 | 544 | 536 | 530 | 553 | 537 |
| Tx | 507 | 521 | 516 | 551 | 549 | 557 |
Disclaimer/Publisher’s Note: The statements, opinions and data contained in all publications are solely those of the individual author(s) and contributor(s) and not of MDPI and/or the editor(s). MDPI and/or the editor(s) disclaim responsibility for any injury to people or property resulting from any ideas, methods, instructions or products referred to in the content. |
© 2024 by the authors. Licensee MDPI, Basel, Switzerland. This article is an open access article distributed under the terms and conditions of the Creative Commons Attribution (CC BY) license (https://creativecommons.org/licenses/by/4.0/).
Share and Cite
Lian, M.; Wang, T.; Wei, C. Effect of B2O3 and Basic Oxides on Network Structure and Chemical Stability of Borosilicate Glass. Ceramics 2024, 7, 516-529. https://doi.org/10.3390/ceramics7020034
Lian M, Wang T, Wei C. Effect of B2O3 and Basic Oxides on Network Structure and Chemical Stability of Borosilicate Glass. Ceramics. 2024; 7(2):516-529. https://doi.org/10.3390/ceramics7020034
Chicago/Turabian StyleLian, Ming, Tian Wang, and Chong Wei. 2024. "Effect of B2O3 and Basic Oxides on Network Structure and Chemical Stability of Borosilicate Glass" Ceramics 7, no. 2: 516-529. https://doi.org/10.3390/ceramics7020034
APA StyleLian, M., Wang, T., & Wei, C. (2024). Effect of B2O3 and Basic Oxides on Network Structure and Chemical Stability of Borosilicate Glass. Ceramics, 7(2), 516-529. https://doi.org/10.3390/ceramics7020034