Article

0.98(K0.5Na0.5)NbO3–0.02(Bi0.5Na0.5)(Zr0.85Sn0.15)O3 Single Crystals Grown by the Seed-Free Solid-State Crystal Growth Method and Their Characterization

1
School of Materials Science and Engineering, Chonnam National University, 77 Yongbong-ro, Buk-gu, Gwangju 61186, Republic of Korea
2
School of Semiconductor & Display Technology, Hallym University, 1 Hallymdaehak-gil, Chuncheon City 24252, Republic of Korea
*
Authors to whom correspondence should be addressed.
Current address: Department of Mechanical and Energy Engineering, University of Rwanda-College of Science and Technology, Kigali P.O. Box 3900, Rwanda.
Ceramics 2024, 7(3), 840-857; https://doi.org/10.3390/ceramics7030055
Submission received: 3 June 2024 / Revised: 17 June 2024 / Accepted: 17 June 2024 / Published: 21 June 2024
(This article belongs to the Special Issue Advances in Ceramics, 2nd Edition)

Abstract

:
(K0.5Na0.5)NbO3-based single crystals are of interest as high-performance lead-free piezoelectric materials, but conventional crystal growth methods have some disadvantages such as the requirement for expensive Pt crucibles and difficulty in controlling the composition of the crystals. Recently, (K0.5Na0.5)NbO3-based single crystals have been grown by the seed-free solid-state crystal growth method, which can avoid these problems. In the present work, 0.98(K0.5Na0.5)NbO3–0.02(Bi0.5Na0.5)(Zr0.85Sn0.15)O3 single crystals were grown by the seed-free solid-state crystal growth method. Sintering aids of 0.15 mol% Li2CO3 and 0.15 mol% Bi2O3 were added to promote single crystal growth. Pellets were sintered at 1150 °C for 15–50 h. Single crystals started to appear from 20 h. The single crystals grown for 50 h were studied in detail. Single crystal microstructure was studied by scanning electron microscopy of the as-grown surface and cross-section of the sample and revealed porosity in the crystals. Electron probe microanalysis indicated a slight reduction in K and Na content of a single crystal as compared to the nominal composition. X-ray diffraction shows that the single crystals contain mixed orthorhombic and tetragonal phases at room temperature. Raman scattering and impedance spectroscopy at different temperatures observed rhombohedral–orthorhombic, orthorhombic–tetragonal and tetragonal–cubic phase transitions. Polarization–electric field (P–E) hysteresis loops show that the single crystal is a normal ferroelectric material with a remanent polarization (Pr) of 18.5 μC/cm2 and a coercive electrical field (Ec) of 10.7 kV/cm. A single crystal presents d33 = 362 pC/N as measured by a d33 meter. Such a single crystal with a large d33 and high Curie temperature (~370 °C) can be a promising candidate for piezoelectric devices.

1. Introduction

Due to the toxicity of PbO, which is present in large amounts in Pb(Zr,Ti)O3 (PZT)-based piezoelectric ceramics, extensive research has been carried out to find lead-free systems that will replace PZT-based ones [1,2,3,4,5,6]. Among the lead-free systems that have been studied, (K0.5Na0.5)NbO3 (KNN)-based materials are one of the best candidates due to their strong ferroelectricity and large piezoresponse. Although KNN-based lead-free ceramics are considered promising candidates, their performance is not yet as good as that of lead-based ceramics [5,7,8].
Ways of improving the performance of KNN-based materials include preparing textured ceramics [9,10] and single crystals [11]. Generally, the piezoelectric properties of KNN-based lead-free single crystals are better than that of their polycrystalline ceramic counterparts since the crystal can be oriented with respect to the poling electrical field in a way that facilitates domain orientation [12,13,14,15]. On the other hand, single crystals are more expensive to prepare, limited in size and have inferior mechanical properties due to the absence of grain boundaries to inhibit crack growth. Hence their use may be limited to high-performance applications such as medical ultrasound [16]. Conventional methods such as the floating zone method [17,18], top-seeded solution growth method [15,19] and flux method [20,21] have been used to grow single crystals of KNN-based compositions. However, these methods present some disadvantages including compositional inhomogeneity due to the incongruent melting of KNN and volatility of the Na2O and K2O species due to the high-temperature and long-time processing, which results in poor-quality single crystals, increased energy consumption and high cost [11,22]. Solid-state crystal growth (SSCG) technology was developed to eliminate the compositional inhomogeneity problem in the above-mentioned methods [23]. In SSCG, a single crystal template called a seed crystal is embedded in ceramic powder of the future crystal composition, pressed into a pellet, sintered and then a single crystal with similar composition as the ceramic powder grows on the seed crystal. On the other hand, the cost of the KTaO3 seed crystal, which is the only seed crystal that can be used in KNN-based systems, is expensive [24]. Therefore, a solid-state single-crystal growth method without using a seed crystal was used in this paper. This method is known as seed-free solid-state crystal growth (SFSSCG). By using this method, a pre-embedded costly seed crystal is not needed. As a result, the method is simple and low cost. Recently, research has been carried out on SFSSCG, and KNN-based single crystals from millimeter size up to the level of centimeter size have been obtained [25,26,27,28,29,30,31,32]. The SFSSCG method is generally based on the abnormal grain growth (AGG) phenomenon, whereby during the sintering process there is exaggerated growth of some grains compared to others in the material. AGG is commonly found in perovskite-based materials such as BaTiO3, SrTiO3 and (K0.5Na0.5)NbO3 (KNN) [26,33,34,35]. Formation of a liquid phase during sintering and angular grains are common characteristics in materials showing AGG [36,37,38]. By adjusting the amount of the liquid-phase sintering aid, single crystal growth can be promoted [39,40]. Bi2O3 and Li2CO3 were used as liquid-phase sintering aids specifically because of their low melting temperatures (817 °C and 723 °C, respectively) and their use in growing single crystals of KNN by seed-free solid-state single crystal growth [25,27,31].
In the present work, single crystals of composition 0.98(K0.5Na0.5)NbO3–0.02(Bi0.5Na0.5)(Zr0.85Sn0.15)O3 are prepared via the seed-free solid-state crystal growth (SFSSCG) method with the addition of 0.15 mol% Li2CO3 and 0.15 mol% Bi2O3. Single crystal growth of this composition has not previously been studied. Polycrystalline ceramics of the (K0.5Na0.5)NbO3–(Bi0.5Na0.5)(Zr0.85Sn0.15)O3 system have improved piezoelectric properties compared to KNN and good thermal stability [41]. By growing single crystal counterparts, the properties can be improved further. The microstructure, crystal structure, chemical composition, dielectric, piezoelectric and ferroelectric properties of the single crystals grown in this work are studied.

2. Materials and Methods

Single crystals were prepared by the seed-free solid-state crystal growth method from a powder of 0.98(K0.5Na0.5)NbO3–0.02(Bi0.5Na0.5)(Zr0.85Sn0.15)O3 (98KNN–2BNZS) composition. The powder was synthesized by the mixed oxide method. The raw materials were K2CO3 (Alfa Aesar, Ward Hill, MA, USA, 99%), Na2CO3 (Acros Organics, Geel, Belgium, 99.5%), Nb2O5 (CEPA, Korea, 99.9%), SnO2 (Alfa Aesar, 99.9%), ZrO2 (Alfa Aesar, 99.5%) and Bi2O3 (Alfa Aesar, 99.9%) powders. Before using the powders, the adsorbed moisture was removed by drying them in an oven at 250 °C for 5 h. Powders were then weighed following the stoichiometric formula and ball-milled for 24 h with zirconia ball media and high-purity (99.9%) ethanol in a polypropylene bottle. To evaporate ethanol from the slurry, a hot plate/magnetic stirrer was used, and then the leftover paste was dried in an oven at 80 °C for 24 h. The powder obtained after crushing using an agate mortar and pestle and sieving through a 180 µm mesh was calcined at 1000 °C for 5 h with heating and cooling rates of 5 °C/min. Analysis of the calcined powder was carried out by X-ray diffraction using Cu Kα radiation (XRD, X’Pert PRO, PANalytical, Almelo, The Netherlands) to verify if it was single-phase. Optimized amounts of 0.15 mol% of Li2CO3 (Alfa Aesar, 99%) and 0.15 mol% of Bi2O3 (Alfa Aesar, 99.9%) were added as sintering aids to the single-phase calcined powder and the mixture was ball-milled, dried and sieved as before.
A mass of 0.5 g of powder was hand-pressed in a stainless-steel die of 10 mm diameter to make pellets, which were then pressed by a cold isostatic press (CIP) at 50 MPa for 20 min. The pellets were put in double alumina crucibles with lids. To avoid the sample sticking to the crucible, a powder of the same composition as the samples was put on the bottom of the crucible. Finally, the pellets were sintered in static air at 1150 °C for 15 h, 20 h, 30 h and 50 h with heating and cooling rates of 5 °C/min.
The single crystals grown for 50 h were used for further analysis. To determine the crystalline structure, X-ray diffraction (XRD, X’Pert PRO, PANalytical, Almelo, The Netherlands) analysis was performed on a bulk single crystal that was separated from the surrounding matrix. The natural surface and cross-section of as-sintered samples were polished, thermally etched at 1100 °C for 1 h and Pt-coated for microstructural analysis by Scanning Electron Microscopy (SEM, Hitachi S-4700, Tokyo, Japan). The single crystal and the surrounding matrix were sectioned and polished to a 1 µm finish and carbon-coated to analyze their chemical composition by Electron Probe Microanalysis (EPMA, JXA-8530F PLUS, JEOL, Tokyo, Japan). Wavelength Dispersive Spectroscopy (WDS) was used with an accelerating voltage of 15 keV, beam current of 20 nA and beam size of 3.0 μm. Sn, Ta, ZrO2, Bi4Ge3O12, NaAlSi2O6 and KNbO3 were used as standards for Sn, Ta, Zr, Bi, Na, K and Nb, respectively. It should be noted that EPMA is not able to detect Li. To conduct Raman scattering experiments, a single crystal was polished to a 1 µm finish and annealed at 400 °C for 1 h with a heating rate of 5 °C/min and cooling rate of 1 °C/min to remove strains generated during polishing. Experiments were carried out at a wavelength of 532 nm by using a conventional Raman spectrometer (LabRam HR800, Horiba, Co., Kyoto, Japan) at 10 °C intervals from −196 °C to 600 °C. An optical microscope (BX41, Olympus, Tokyo, Japan) was used for acquiring the Raman spectra in backscattering geometry, and the sample temperature was controlled by using a compact cryostat (THMS600, Linkam, Tadworth, UK).
For electrical property measurements, a single crystal was removed from the surrounding matrix, polished on both sides to a #4000 SiC paper finish, and Ag paste electrodes were applied. Impedance spectroscopy was conducted using a HP4284A impedance analyzer (Hewlett-Packard, Kobe, Japan) and a hot stage (TS1500, Linkam, Tadworth, UK) within a frequency range from 1 MHz to 31.6 Hz and a temperature range from 600 °C to RT in flowing air with a heating and cooling rate of 1 °C/min. A cryostat (CCR-400/200, Janis, Woburn, MA, USA) was used for low-temperature measurements from 200 °C to −223 °C under vacuum with a heating and cooling rate of 1 °C/min. A compact cryostat (THMS600, Linkam, Tadworth, UK) was also used to measure the sample in a temperature range from −190 °C to 590 °C in air with a heating and cooling rate of 1 °C/min. Note that all of the impedance spectroscopy measurements were carried out on the same sample. After applying Ag electrodes and poling a single crystal at room temperature with an electric field of 4.5 kV/mm and a current of 0.5 mA for 20 min and aging for 24 h, the d33 value was measured by a d33 meter (YE2730A d33 meter, Sinoceramics Inc., Shanghai, China). A Multiferroic tester (Radiant, Albuquerque, NM, USA) was used to measure the polarization–electric field (P–E) hysteresis loops. A single crystal was coated with Ag electrodes, immersed in silicon oil and then measured at a frequency of 10 Hz at room temperature.

3. Results and Discussion

Figure 1 shows the X-ray diffraction patterns of the calcined powder and bulk single crystal of 98KNN–2BNZS. It should be noted that the XRD pattern of the calcined powder was taken before addition of the sintering aids. The pattern of the calcined powder can be indexed using Crystallography Open Database pattern #96-156-3481 for (K0.5Na0.5)NbO3 (cubic, P m 3 ¯ m ). The peaks are quite broad, indicating local variations in composition in the powder [42]. A small amount of a secondary phase (K3Nb7O19) is visible. The XRD pattern of the bulk single crystal can be indexed using Crystallography Open Database pattern #96-721-2941 for (K0.7Na0.3)NbO3 (orthorhombic, Amm2). Small peaks, possibly belonging to K3Nb8O21 and K3Nb7O9 second phases, are also visible. The pattern of the bulk single crystal shows intense 0kl and h00 peaks, indicating that it is a single crystal [43]. The peak splitting into 0kl and h00 peaks is evidence of the presence of non-180° domains [44,45,46]. The insets in Figure 1b show the peaks of the bulk single crystal in more detail. Extra peaks are present at 22.3 and 45.5°. These peaks could be indexed using Crystallography Open Database pattern #96-156-3443 for (K0.5Na0.5)NbO3 (tetragonal, P4mm). The single crystal 98KNN–2BNZS may, therefore, contain both orthorhombic and tetragonal phases. Note that the chemical compositions of the various phases are those listed in the patterns’ entries, not the actual composition of the calcined powder and single crystal.
Figure 2 shows the photographs of 98KNN–2BNZS single crystals with 0.15 mol% Li2CO3 and 0.15 mol% Bi2O3 as sintering aids grown by SFSSCG at 20 h, 30 h and 50 h. The sample sintered for 15 h did not show any single crystal growth and so is not shown. The single crystal from the sample sintered for 50 h was removed from the matrix and its photograph is presented on the right-hand side of the figure as well. It was observed that during 20 h of sintering, a single crystal started to grow on the edge of the pellet. Therefore, single crystal growth was initiated at the edge of the pellet and grew towards the center. The single crystals are translucent. Single crystal size increases with an increase in sintering time. Although the single crystal from the sample sintered for 20 h is not large, it can be easily seen that it has a rectangular shape while the crystal grown for 50 h has a triangular shape. On the other hand, the sample sintered for 30 h gave single crystals of both rectangular shape and triangular shape. All the single crystals have faceted surfaces.
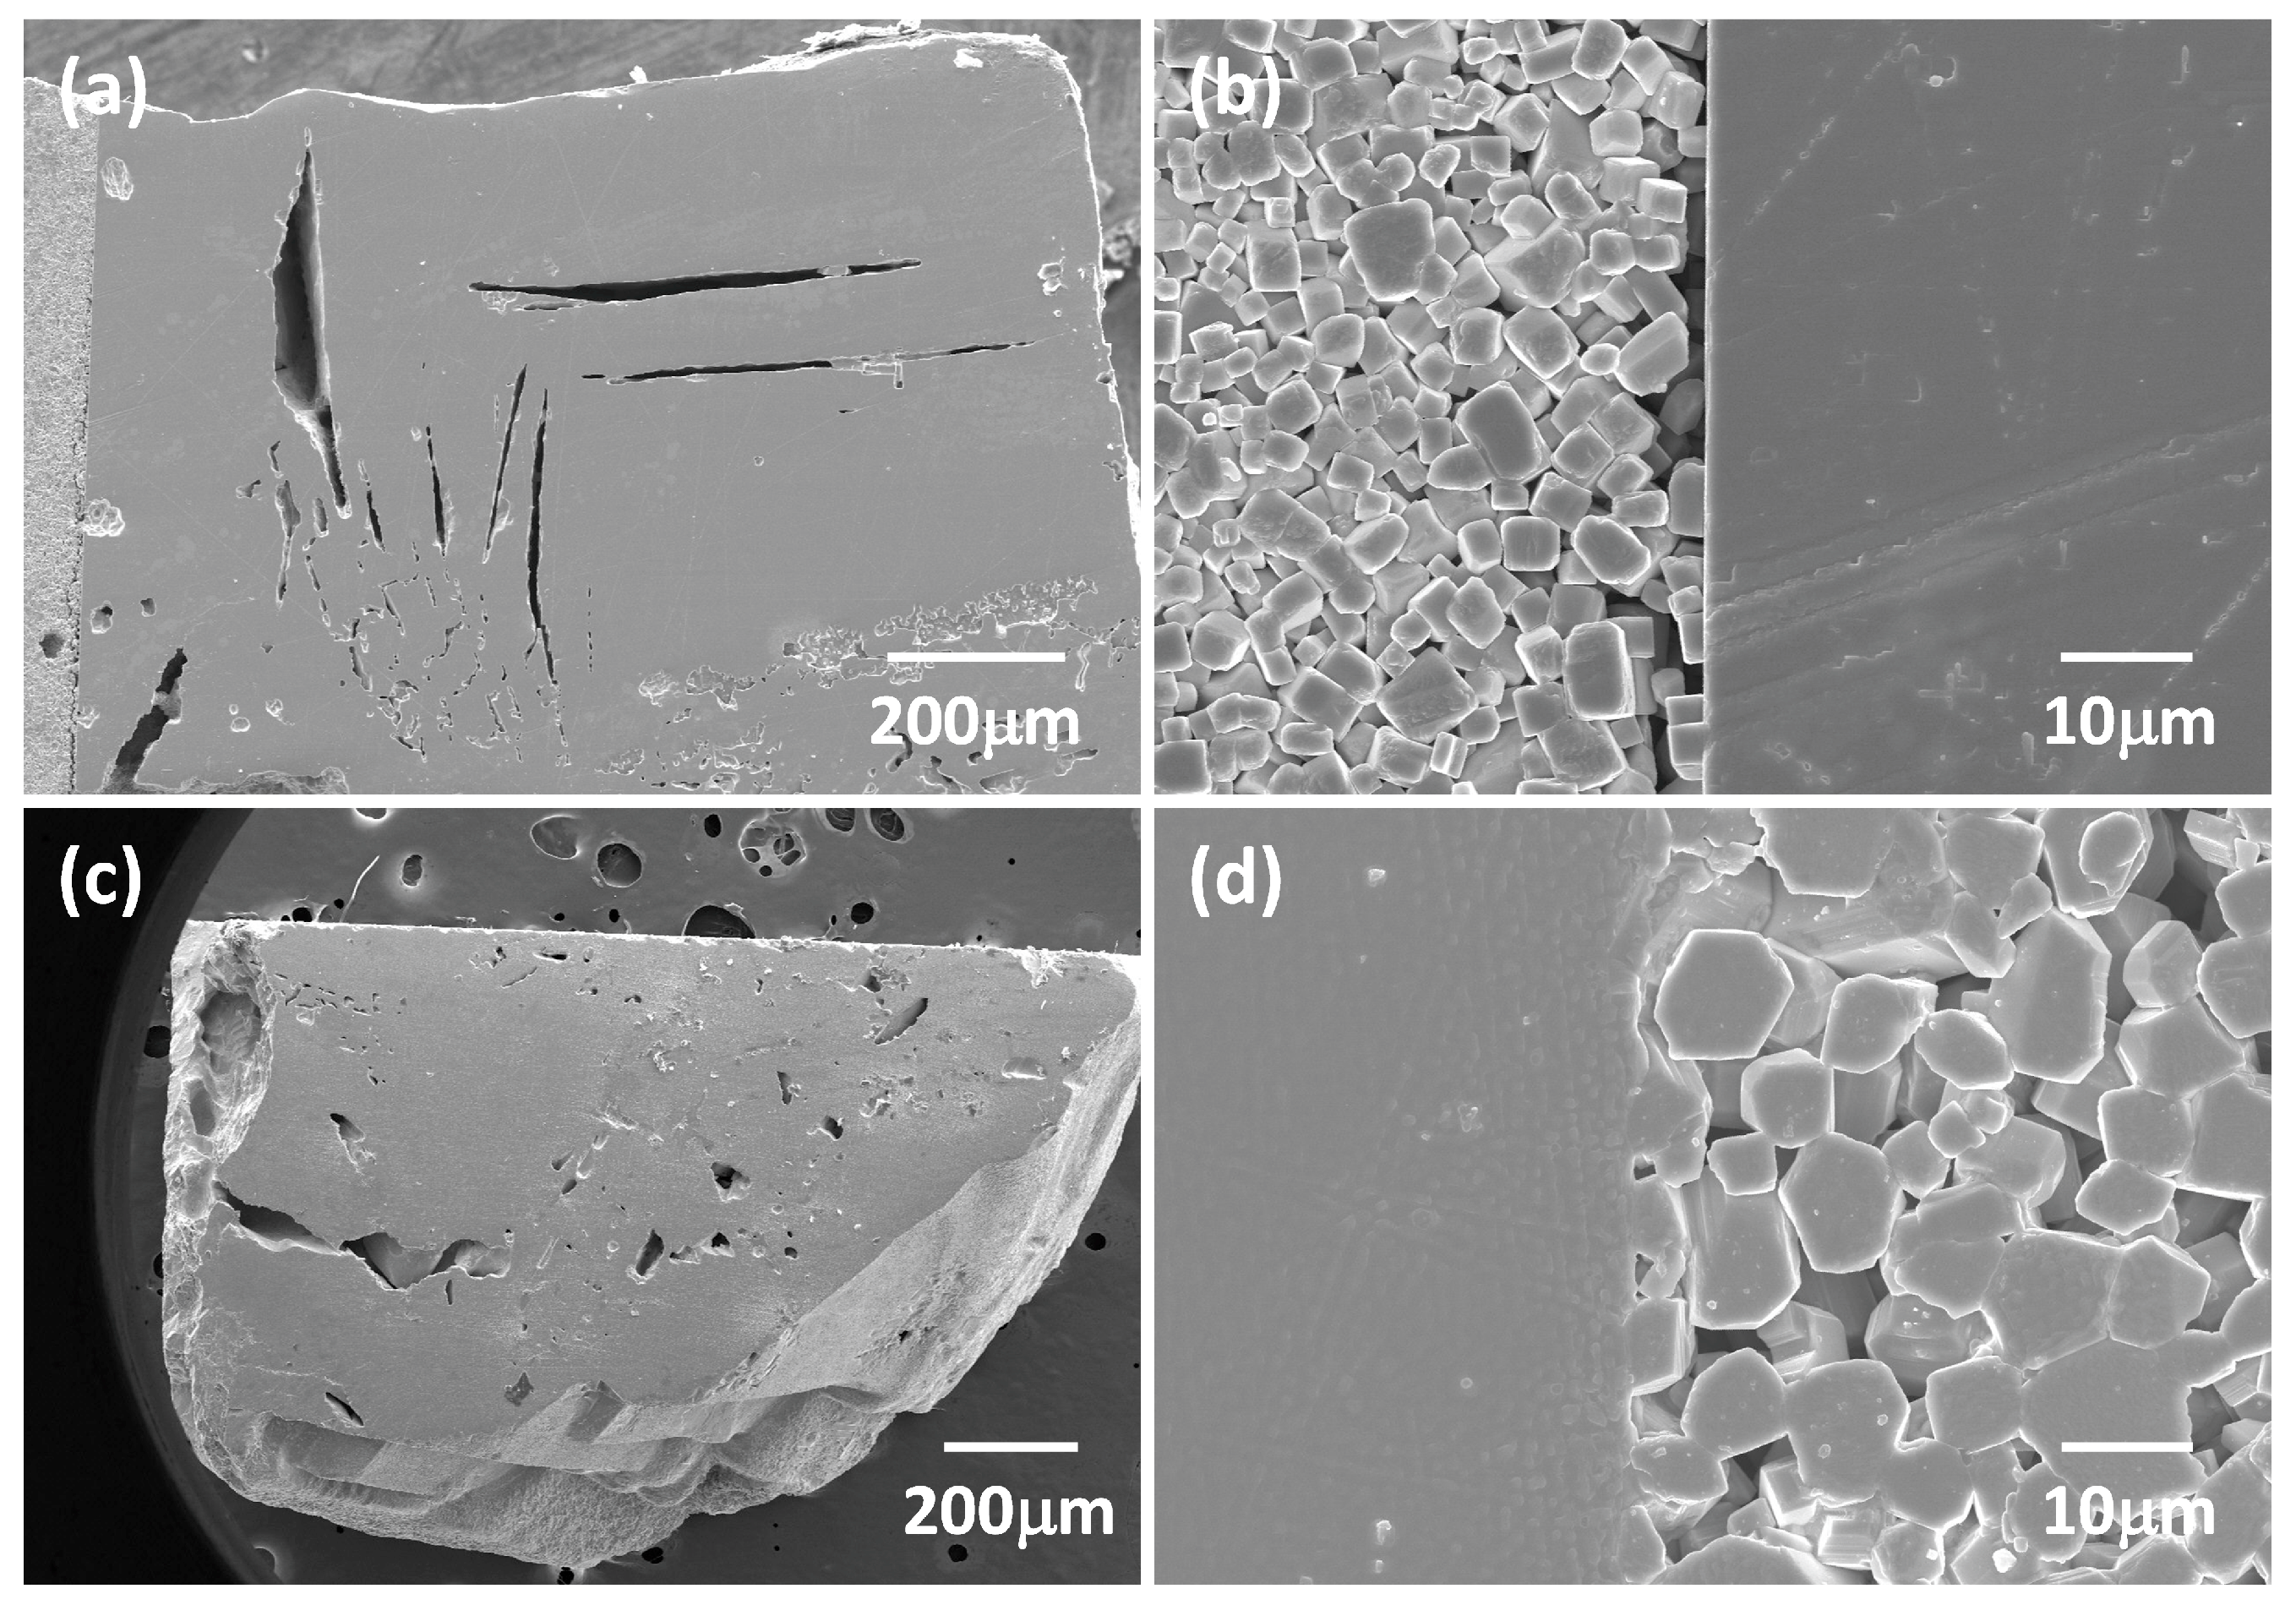
To check the microstructure of the grown single crystals, scanning electron micrographs of the cross-section of the 98KNN–2BNZS single crystal grown for 20 h and of the natural surface and cross-section of 98KNN–2BNZS single crystals grown for 50 h are shown in Figure 3. It should be noted that the sample presented in Figure 3c,d is a different sample than the sample shown in Figure 2. The single crystals contain both small and large pores (Figure 3a,c), and the boundary between the single crystal and matrix grains is clearly identified (Figure 3b,d). The single crystals and the matrix grains have faceted interfaces, indicating that single crystal growth took place via the mixed control mechanism of grain growth (Figure 3b,d) [23,47,48]. Matrix grain size increased slightly with an increase in sintering time (Figure 3b,d), indicating that matrix grain growth is stagnant.
Table 1 indicates the chemical composition of a 98KNN–2BNZS single crystal grown for 50 h and its matrix as measured by EPMA. The presented values are the average of ten measurements each of the single crystal and matrix areas with their standard deviation. For analysis, the nominal composition values were presented as well. The chemical composition in both the single crystal and matrix are similar to the nominal chemical composition, indicating that there is no major loss of elements during sintering. However, it can be seen that the amounts of alkali cations were reduced during sintering compared to the nominal composition, and the loss was higher for K compared to Na in both the single crystal and matrix. This alkali volatilization was also observed during calcination and sintering of (K0.5Na0.5)NbO3-based ceramics or single crystals [41,49]. The higher K loss is due to its higher partial pressure compared to Na [22]. The results show a small excess of Bi2O3 in both the single crystal and matrix. Probably, some sintering aid of Bi2O3 has entered into solid solution in the 98KNN–2BNZS lattice.
The Raman spectrum of the 98KNN–2BNZS single crystal taken at 30 °C (Figure 4) reveals characteristic features of (K0.5Na0.5)NbO3 [50,51,52]. The space groups and optical phonon modes are considered to be similar to those of KNN and KNbO3 [53,54]. The phase transitions in KNN are rhombohedral (R3m, C 3 v 5 ) to orthorhombic (Amm2, C 2 v 14 ), orthorhombic to tetragonal (P4mm, C 4 v 1 ) and lastly tetragonal to cubic (Pm3m, O h 1 ). Group theory indicates 7 Raman active modes (3A1 + 4E) for the rhombohedral phase, 12 Raman active modes (4A1 + A2 + 4B1 + 3B2) for the orthorhombic phase, 8 Raman active modes (3A1 + B1 + 4E) for the tetragonal phase and 4 Raman inactive modes (3F1u + F2u) for the cubic phase [51,53,54]. There is an additional A2 mode in the rhombohedral phase, which is both infrared and Raman inactive. The Raman spectrum in Figure 4 could belong to either the orthorhombic or tetragonal phase as it is not easy to distinguish spectra of the two phases, especially at temperatures close to the orthorhombic–tetragonal phase transition. This mirrors the possible appearance of a tetragonal phase in the XRD pattern of the single crystal (Figure 1b). Compared with the Raman spectra of a (K1−xNax)NbO3 single crystal and a (K0.5Na0.5)NbO3 ceramic, the spectral changes at the phase transitions are much less obvious [54,55]. This is probably due to increased disorder on the lattice caused by the incorporation of (Bi0.5Na0.5)(Zr0.85Sn0.15)O3.
The modes can also be analyzed in terms of internal or local mode vibrations of the NbO6 octahedra, in which the octahedra suffer internal distortions, and external vibrations, in which the NbO6 octahedra rotate or translate without suffering a distortion [56,57]. There are also external translational modes of Na+/K+ cations relative to the NbO6 octahedra [51,58]. An NbO6 octahedron with O h point group has six internal modes: 1A1g1) + 1Eg2) + 2F1u3, ν4) + 1F2g5) + 1F2u6) [51,57,58]. The 1A1g1) + 1Eg2) + 1F1u3) modes are stretching modes and the + 1F1u4) + F2g5) + F2u6) modes are bending modes. Only the 1A1g1) + 1Eg2) + F2g5) modes are Raman active when the NbO6 octahedron has the O h point group [57], but if the symmetry of the octahedron is lowered then the 1F1u4) + F2g5) + F2u6) modes can become Raman active. A lowering of symmetry can also cause a degenerate mode to split into several non-degenerate modes [58,59].
The spectrum in Figure 4 is mainly represented by four peaks at ~110 cm−1, ~260 cm−1, ~614 cm−1 and ~865 cm−1. The peak at ~614 cm−1 has a shoulder at ~560 cm−1. The shoulder at ~45 cm−1 and the peak at ~110 cm−1 are assigned to the translational modes of Na+/K+ cations. The peak at ~260 cm−1 is assigned to the ν5 NbO6 bending mode. The broad shoulder at ~200 cm−1 on the low wavenumber side of the ν5 peak is assigned to the ν6 NbO6 bending mode. The small peak at ~425 cm−1 is assigned to the ν4 bending mode. The peak at ~614 cm−1 is assigned to the ν1 NbO6 stretching mode and the shoulder at ~560 cm−1 to the ν2 NbO6 stretching mode. The broad shoulder to the right of the ν1 peak at ~720 cm−1 is assigned to the ν3 stretching mode. The ν1 + ν5 mode at ~865 cm−1 is assigned to the combination tone of the ν1 and ν5 modes [51,52].
A contour plot of normalized intensity of Raman spectra taken at 10 °C intervals from −196 °C to 600 °C is shown in Figure 5a. Distinct changes in the position and/or width of the major peaks at ~260 cm−1 and ~614 cm−1 are clearly seen at ~−80 °C, ~40 °C, ~140 °C, ~180 °C, ~210 °C and ~350 °C. In addition, the major peak at ~260 cm−1 decreases in intensity between ~80 °C and ~130 °C. The individual spectra are shown in Figure 5b. Changes in color mark the temperatures where considerable changes in the spectra take place. The changes in position, width and intensity of the major peaks seen in the contour plot are also clearly visible.
Each spectrum was fitted with Lorentzian peaks using OriginPro (OriginLab, Northampton, MA, USA). Selected spectra with their fitted peaks are shown in Figure S1. The black curves are the raw data, the blue curves are the fitted peaks and the red curves are the cumulative fit of the peaks. Note that due to its small size, the peak for mode ν4 at ~425 cm−1 was covered by the wings of the Lorentzian peaks at low temperatures and so was not fitted. At low temperatures, the major peak at ~260 cm−1 has a pronounced shoulder on the high-wavenumber side. This shoulder is assigned to the ν4 mode [51]. Figure 6 shows the positions of the Raman modes versus temperature. The modes are labeled with their wavenumbers at −196 °C in the legend. The error bars show the standard error. The dashed lines indicate temperatures where distinct changes in the spectra can be seen in Figure 5b. Distinct changes in mode position can be seen at or close to these temperatures. In some cases, modes appear or disappear. The FWHM and area of the modes are shown in Figures S2 and S3, respectively. Although not as clear due to the larger standard error bars, anomalous changes in FWHM and area can also be seen at or close to the temperatures marked by the dashed lines. These changes are consistent with phase transitions. The changes at −80 °C are assigned to the rhombohedral–orthorhombic phase transition. The changes at 40 °C are assigned to the orthorhombic–tetragonal phase transition. The changes at 350 °C are assigned to the tetragonal–cubic phase transition. The persistence of the ν1 + ν5 combination mode at ~865 cm−1 up to 600 °C is unusual, as the disappearance of this mode is usually associated with the tetragonal–cubic phase transition [60]. This, along with the persistence of the ν1 and ν5 modes, indicates that even above the Curie temperature, the structure contains local non-cubic distortions [50], as commonly found in perovskite ferroelectric materials [61,62,63,64]. The Raman spectra of the 98KNN–2BNZS single crystal are similar to those of 0.95(K0.5Na0.5)NbO3–0.05(Bi0.5Na0.5)(Zr0.85Sn0.15)O3 (95KNN–5BNZS) [40]. However, the phase transitions are more clearly visible than in the 95KNN–5BNZS single crystal. This could be because the rhombohedral–orthorhombic and orthorhombic–tetragonal phase transitions are more widely separated.
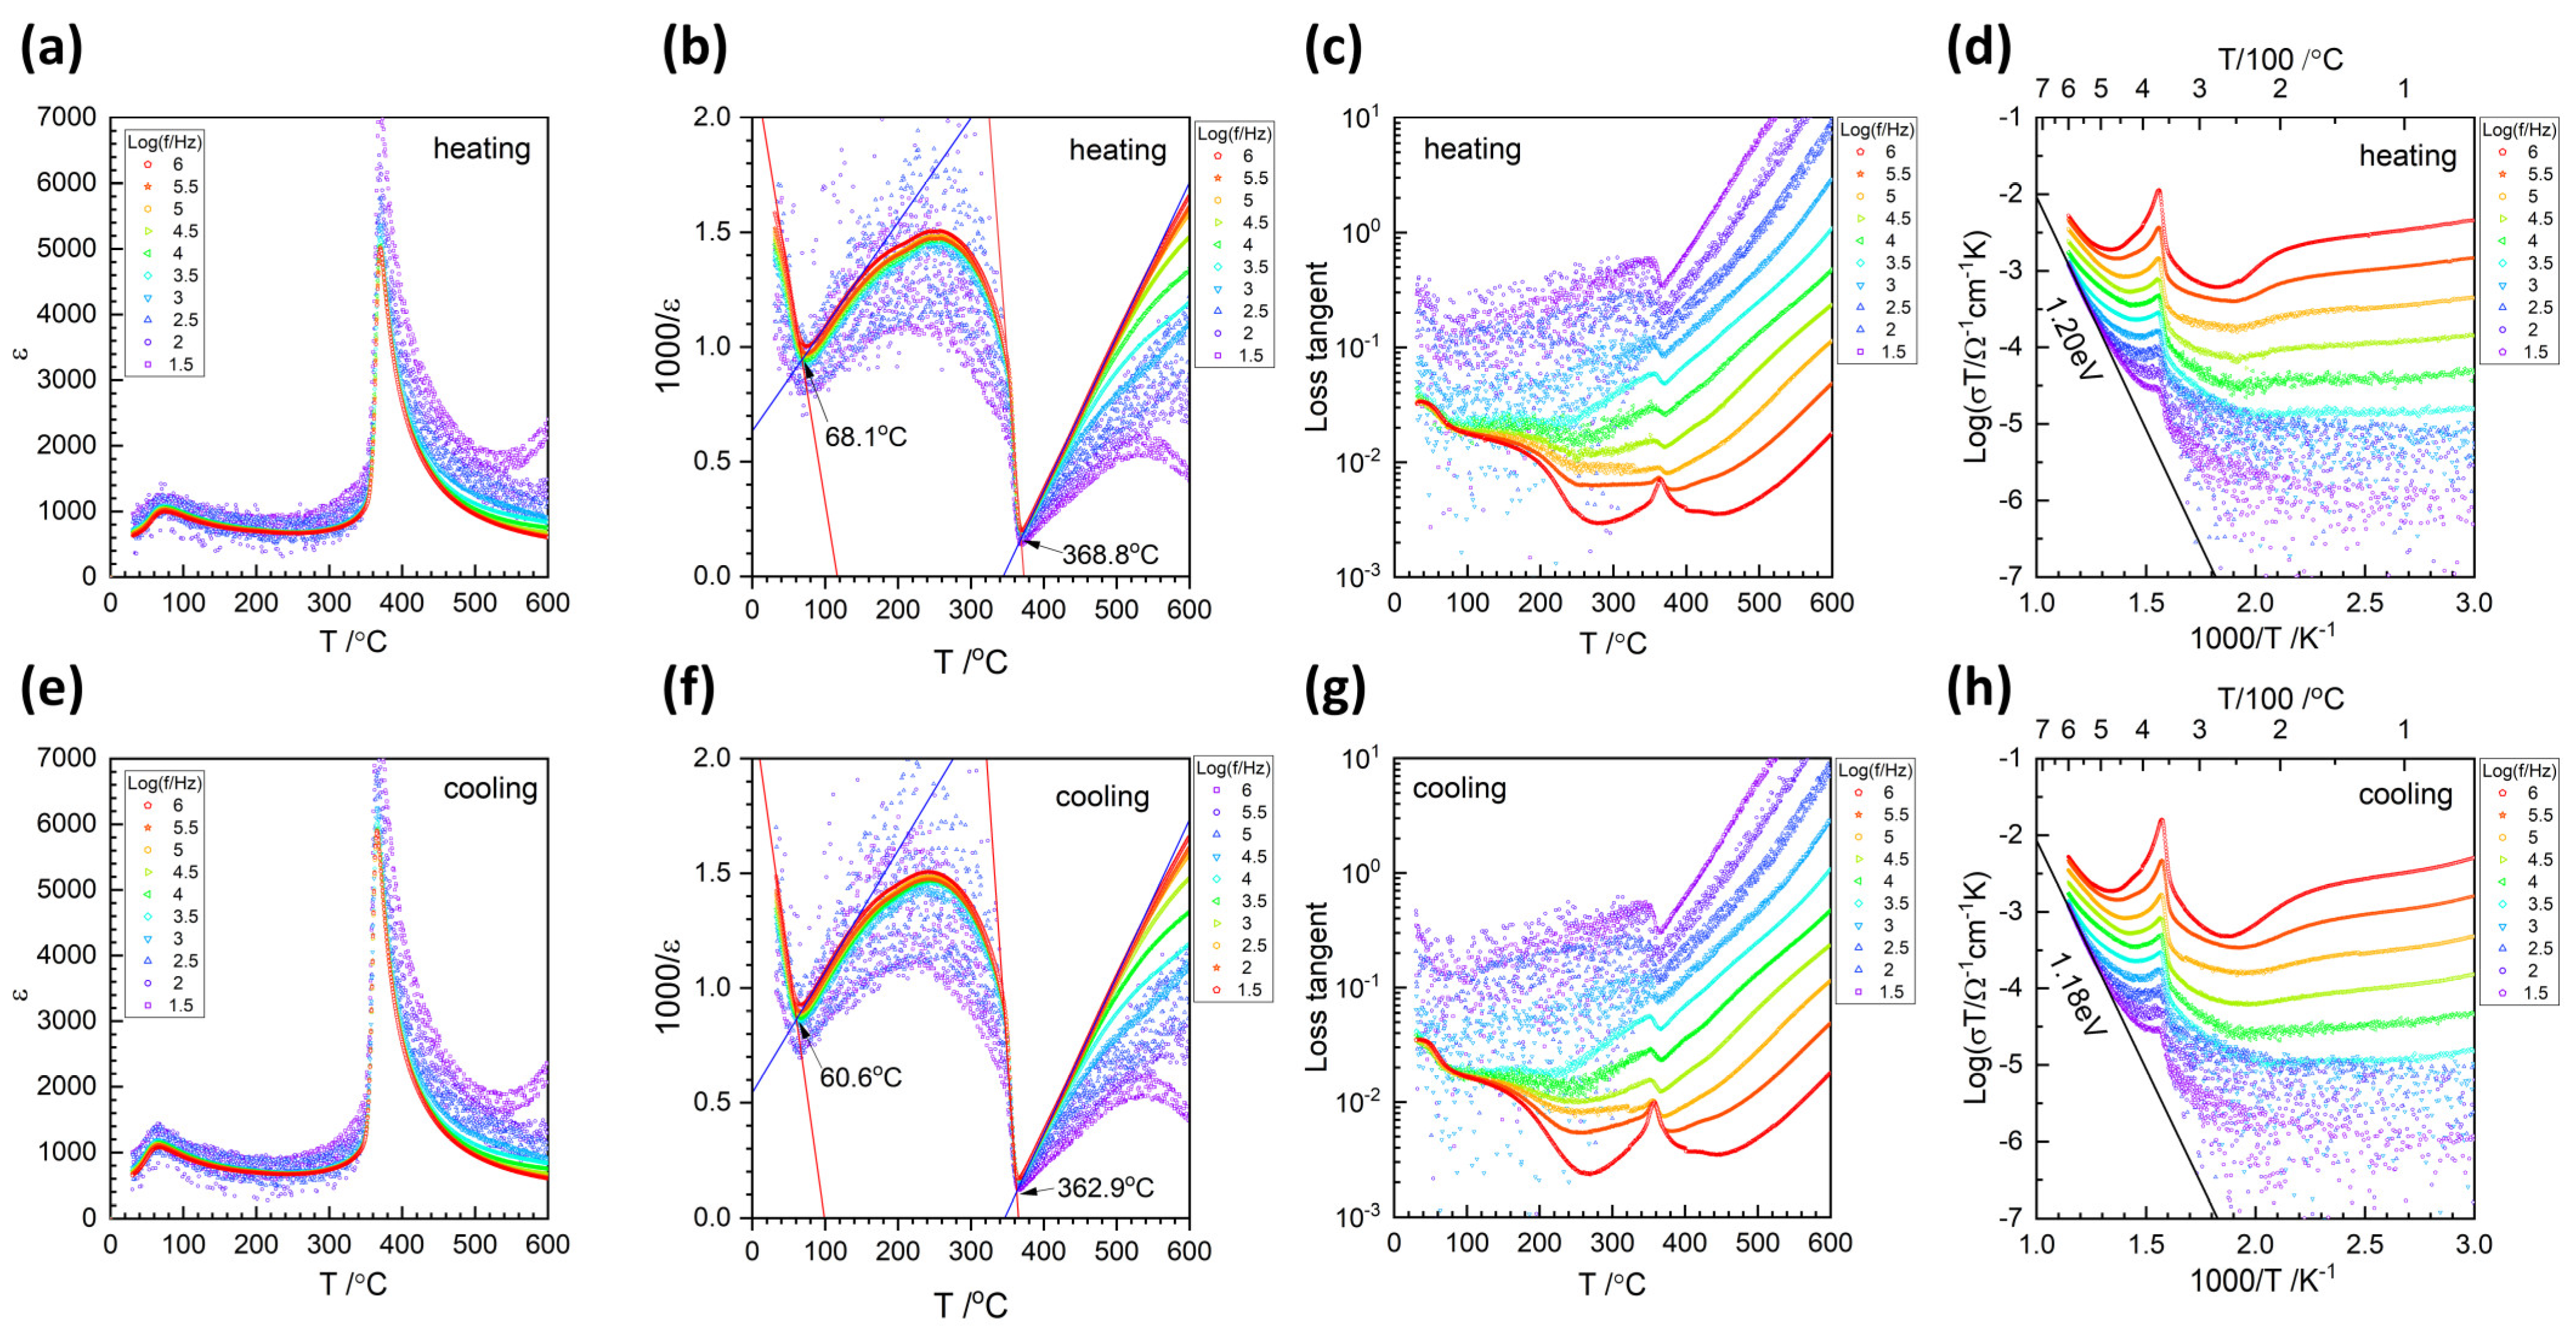
Figure 7a–d shows the relative permittivity, inverse relative permittivity, loss tangent and conductivity of a 98KNN–2BNZS single crystal on heating from room temperature to 600 °C in the TS1500 hot stage. The numbers in the legends represent the logarithm of the measurement frequency, i.e., 6 for 106 Hz, 5.5 for 105.5 Hz or 316,227 Hz, etc. Two peaks are clearly displayed in the relative permittivity data at ~70 °C and ~370 °C (Figure 7a). The broad peak at ~70 °C corresponds to the orthorhombic–tetragonal phase transition. This phase transition was also confirmed by Raman spectroscopy at 40 °C as discussed earlier. This temperature is considerably lower than the value of ~120 °C measured by Guo et al. for a polycrystalline ceramic of the same composition [41]. The sharp peak at ~370 °C is assigned to the tetragonal to cubic phase transition, similar to that displayed by Raman spectroscopy at ~350 °C. This temperature matches well with the value of ~370 °C measured by Guo et al. [41]. The lower phase transition temperatures, as measured by Raman scattering compared to impedance spectroscopy in the present work, have previously been observed in a KNN-based single crystal grown by the solid-state crystal growth method [65]. A plot of inverse relative permittivity vs. temperature shows the phase transition at ~70 °C more clearly (Figure 7b). Linear fitting of the data (106 measurement frequency) in the regions near the phase transitions was carried out. The results are shown in the figures as red and blue lines. The temperature at which the two linear fits cross each other can give the phase transition temperature, as marked with arrows. The sharp decrease in inverse permittivity at the Curie temperature is characteristic of a first-order phase transition [66,67]. The plots of loss tangent vs. temperature also shows visible peaks corresponding to the tetragonal–cubic phase transition at 355–365 °C (Figure 7c). Loss tangent vs. temperature plots also show a shoulder at ~50 °C corresponding to the orthorhombic–tetragonal phase transition. Conductivity plots show peaks at the tetragonal to cubic phase transition (Figure 7d). An activation energy of 1.20 eV is estimated from the Arrhenius region of the low-frequency (31.6 Hz) plot. This value is similar to those measured in other KNN-based single crystals [40,65]. Cooling plots show similar behavior (Figure 7e–h). Thermal hysteresis is visible between heating and cooling (Figure 7b,f), which also indicates that the phase transitions are first-order.
Figure 8a–d shows the relative permittivity, inverse relative permittivity, loss tangent and conductivity of a 98KNN–2BNZS single crystal on heating from −223 °C to 200 °C in the CCR-400/200 cryostat. Peaks in the relative permittivity vs. temperature plots are visible at ~−75 °C and ~90 °C (Figure 8a). The peak at ~−75 °C corresponds to the rhombohedral–orthorhombic phase transition, as also detected by Raman scattering at ~−80 °C. This temperature matches well with the rhombohedral–orthorhombic phase transition temperature of ~−75 °C to −80 °C measured by Gou et al. for the same composition [41]. The peak at ~90 °C corresponds to the orthorhombic–tetragonal phase transition, as also detected by Raman spectroscopy at 40 °C (Figure 6, Figures S2 and S3). The peak at ~90 °C is broader than the corresponding peak on cooling (Figure 8e) and has a high temperature shoulder at lower frequencies. Plots of inverse relative permittivity show the phase transitions at −76 °C and 81 °C, as well as an inflexion in the curves at −165 °C and 39 °C (Figure 8b). The inflexion at 39 °C corresponds to changes in the Raman spectra at 40 °C and may mark the beginning of the orthorhombic–tetragonal phase transition.
A shoulder in the loss tangent plot at ~−100 °C corresponds to the rhombohedral–orthorhombic phase transition while a broad and shallow peak at ~55–60 °C corresponds to the orthorhombic–tetragonal phase transition (Figure 8c). A broad and shallow peak also appears at ~140 °C, which is not present during cooling (Figure 8g). A peak corresponding to the orthorhombic–tetragonal phase transition is also visible in the ac conductivity plots (Figure 8d). Again, this peak is broader than the corresponding peak on cooling (Figure 8h). In the relative permittivity cooling plots, peaks corresponding to tetragonal–orthorhombic and orthorhombic–rhombohedral phase transitions appear at ~73 °C and ~−120 °C, respectively (Figure 8e). A small peak, only visible in the cooling plots, is visible at ~−205 °C. A shoulder in the loss tangent plot at ~−120 °C corresponds to the orthorhombic–rhombohedral phase transition while a broad and shallow peak at ~45 °C corresponds to the tetragonal–orthorhombic phase transition (Figure 8g). A shoulder is also visible at ~−205 °C. A peak corresponding to the orthorhombic–tetragonal phase transition is visible in the ac conductivity plots (Figure 8h), along with a shoulder corresponding to the orthorhombic–rhombohedral phase transition and a shoulder at ~−200 °C.
Figure 9a–d shows the relative permittivity, inverse relative permittivity, loss tangent and conductivity of a 98KNN–2BNZS single crystal on heating from −190 °C to 590 °C in a THMS600 cryostat. A shoulder at ~−80 °C corresponding to the rhombohedral–orthorhombic phase transition and peaks at ~90 °C and ~420 °C corresponding to the orthorhombic–tetragonal and tetragonal–cubic phase transitions can be seen in the relative permittivity plots (Figure 9a). There is also a broad peak between ~−10 °C and 0 °C, which is more clearly visible at lower measurement frequencies. The orthorhombic–tetragonal and tetragonal–cubic phase transitions take place at higher temperatures than when the sample was measured in the TS1500 hot stage. This is particularly pronounced for the tetragonal–cubic phase transition. The rhombohedral–orthorhombic phase transition is more clearly visible in plots of inverse relative permittivity, as is the peak between ~−10 °C and 0 °C (Figure 9b). The rhombohedral–orthorhombic, orthorhombic–tetragonal and tetragonal–cubic phase transitions appear at −76 °C, 79 °C and 412 °C, respectively. Similar to the measurements in the TS1500 hot stage, inverse relative permittivity shows a discontinuous decrease in the vicinity of the Curie temperature, although the decrease is not as pronounced. Loss tangent plots show a peak at ~35 °C corresponding to the orthorhombic–tetragonal phase transition and a broad peak corresponding to the tetragonal–cubic phase transition at ~400–410 °C (Figure 9c). There is a shallow peak at ~−100 °C corresponding to the rhombohedral–orthorhombic phase transition visible at higher frequencies. There is also a large peak at ~−10 °C. Conductivity plots show the tetragonal–cubic phase transition at ~410 °C, as well as broad peaks at ~−10 °C and ~35 °C (Figure 9d). An activation energy of 0.85 eV is estimated from the Arrhenius region of the low-frequency (31.6 Hz) plot. On cooling, the cubic–tetragonal phase transition takes place at 402 °C, the tetragonal–orthorhombic phase transition at 66.5 °C and the orthorhombic–rhombohedral phase transition at −130 °C (Figure 9f). The peak visible between ~−10 °C and 0 °C on heating almost disappears on cooling (Figure 9e,f). On cooling, loss tangent plots show peaks at ~390–405 °C, ~−30 °C and ~−140–145 °C corresponding to the three phase transitions (Figure 9g). The peak visible at ~−10 °C on heating disappears. Conductivity plots on cooling show broad and shallow peaks at ~−30 °C and ~57 °C (Figure 9h). The peaks that appear on heating between ~−10 °C and 0 °C are probably a measurement artefact caused by water vapor in the sample chamber freezing on cooling and melting on heating.
The phase transitions take place at noticeably different temperatures depending on the temperature range of measurement. This is particularly true for the tetragonal–cubic phase transition, whose temperature varies by 39~43 °C between the TS1500 hot stage and THMS600 cryostat. The same heating and cooling rate of 1 °C/min was used in all experiments, so this is not a factor. The phase transition temperatures appear to depend on the temperature range covered during the measurement. Factors such as domain structure, existence of nanopolar regions and degree of polarization may affect the transition temperatures.
The Raman spectra showed distinct changes in the temperature region between 100 and 200 °C, which were not clearly visible in relative permittivity, loss tangent and conductivity plots. Therefore, Raman measurements were repeated on the same sample in the region between 100 and 200 °C. The normalized spectra and an intensity contour plot are shown in Figure S4b,d. The original measurements are shown in Figure S4a,c. In the repeated measurements, the relative intensity of the ν6 and ν2 modes are lower than in the original measurements, while the relative intensity of the ν5 mode is generally higher. In the original measurements, the intensity of the ν6 and ν2 modes decreases between 150 and 170 °C, before increasing again, and the peak at ~110 cm−1 temporarily becomes visible. In the repeat measurements, the ν2 mode intensity changes between 170 and 200 °C, while the peak at ~110cm−1 becomes visible at 160 °C and remains visible. A contour plot of the repeat measurements also shows changes in the width of the ν6 and ν5 modes between 160 and 180 °C, although not as pronounced as in the original measurements. The repeat measurements confirm that changes are happening in the Raman spectra between 100 and 200 °C. These changes may be related to the orthorhombic–tetragonal phase transition. The difference in the appearance of the original and repeat spectra may be due to measurements being carried out on different regions of the sample with different domain orientations [68].
Room temperature values (measured on heating at a frequency of 104 Hz) of relative permittivity and loss tangent for the 98KNN–2BNZS single crystal are shown in Table 2. The values vary between the measurement equipment, particularly for the CCR-400/200. Similar behavior was noted in single crystals of KNbO3 [69] and may be caused by surface conductivity effects or different measurement atmospheres. Relative permittivity and loss tangent values are similar to those of the corresponding polycrystalline 98KNN–2BNZS ceramic prepared by Gou et al. [41]. Values of relative permittivity are lower than those of KNN single crystals grown by seed–free solid-state crystal growth by Jiang et al. [25,31] but similar to or higher than those of KNN single crystals grown by seed-free solid-state crystal growth by other workers [16,26,27,28,29,32]. The loss tangent is higher than that of KNN single crystals grown by Ahn et al. [26] and Hao et al. [29] but similar to or lower than that of KNN single crystals grown by other workers [16,25,27]. The loss tangent could be further reduced by reducing porosity in the single crystals [26].
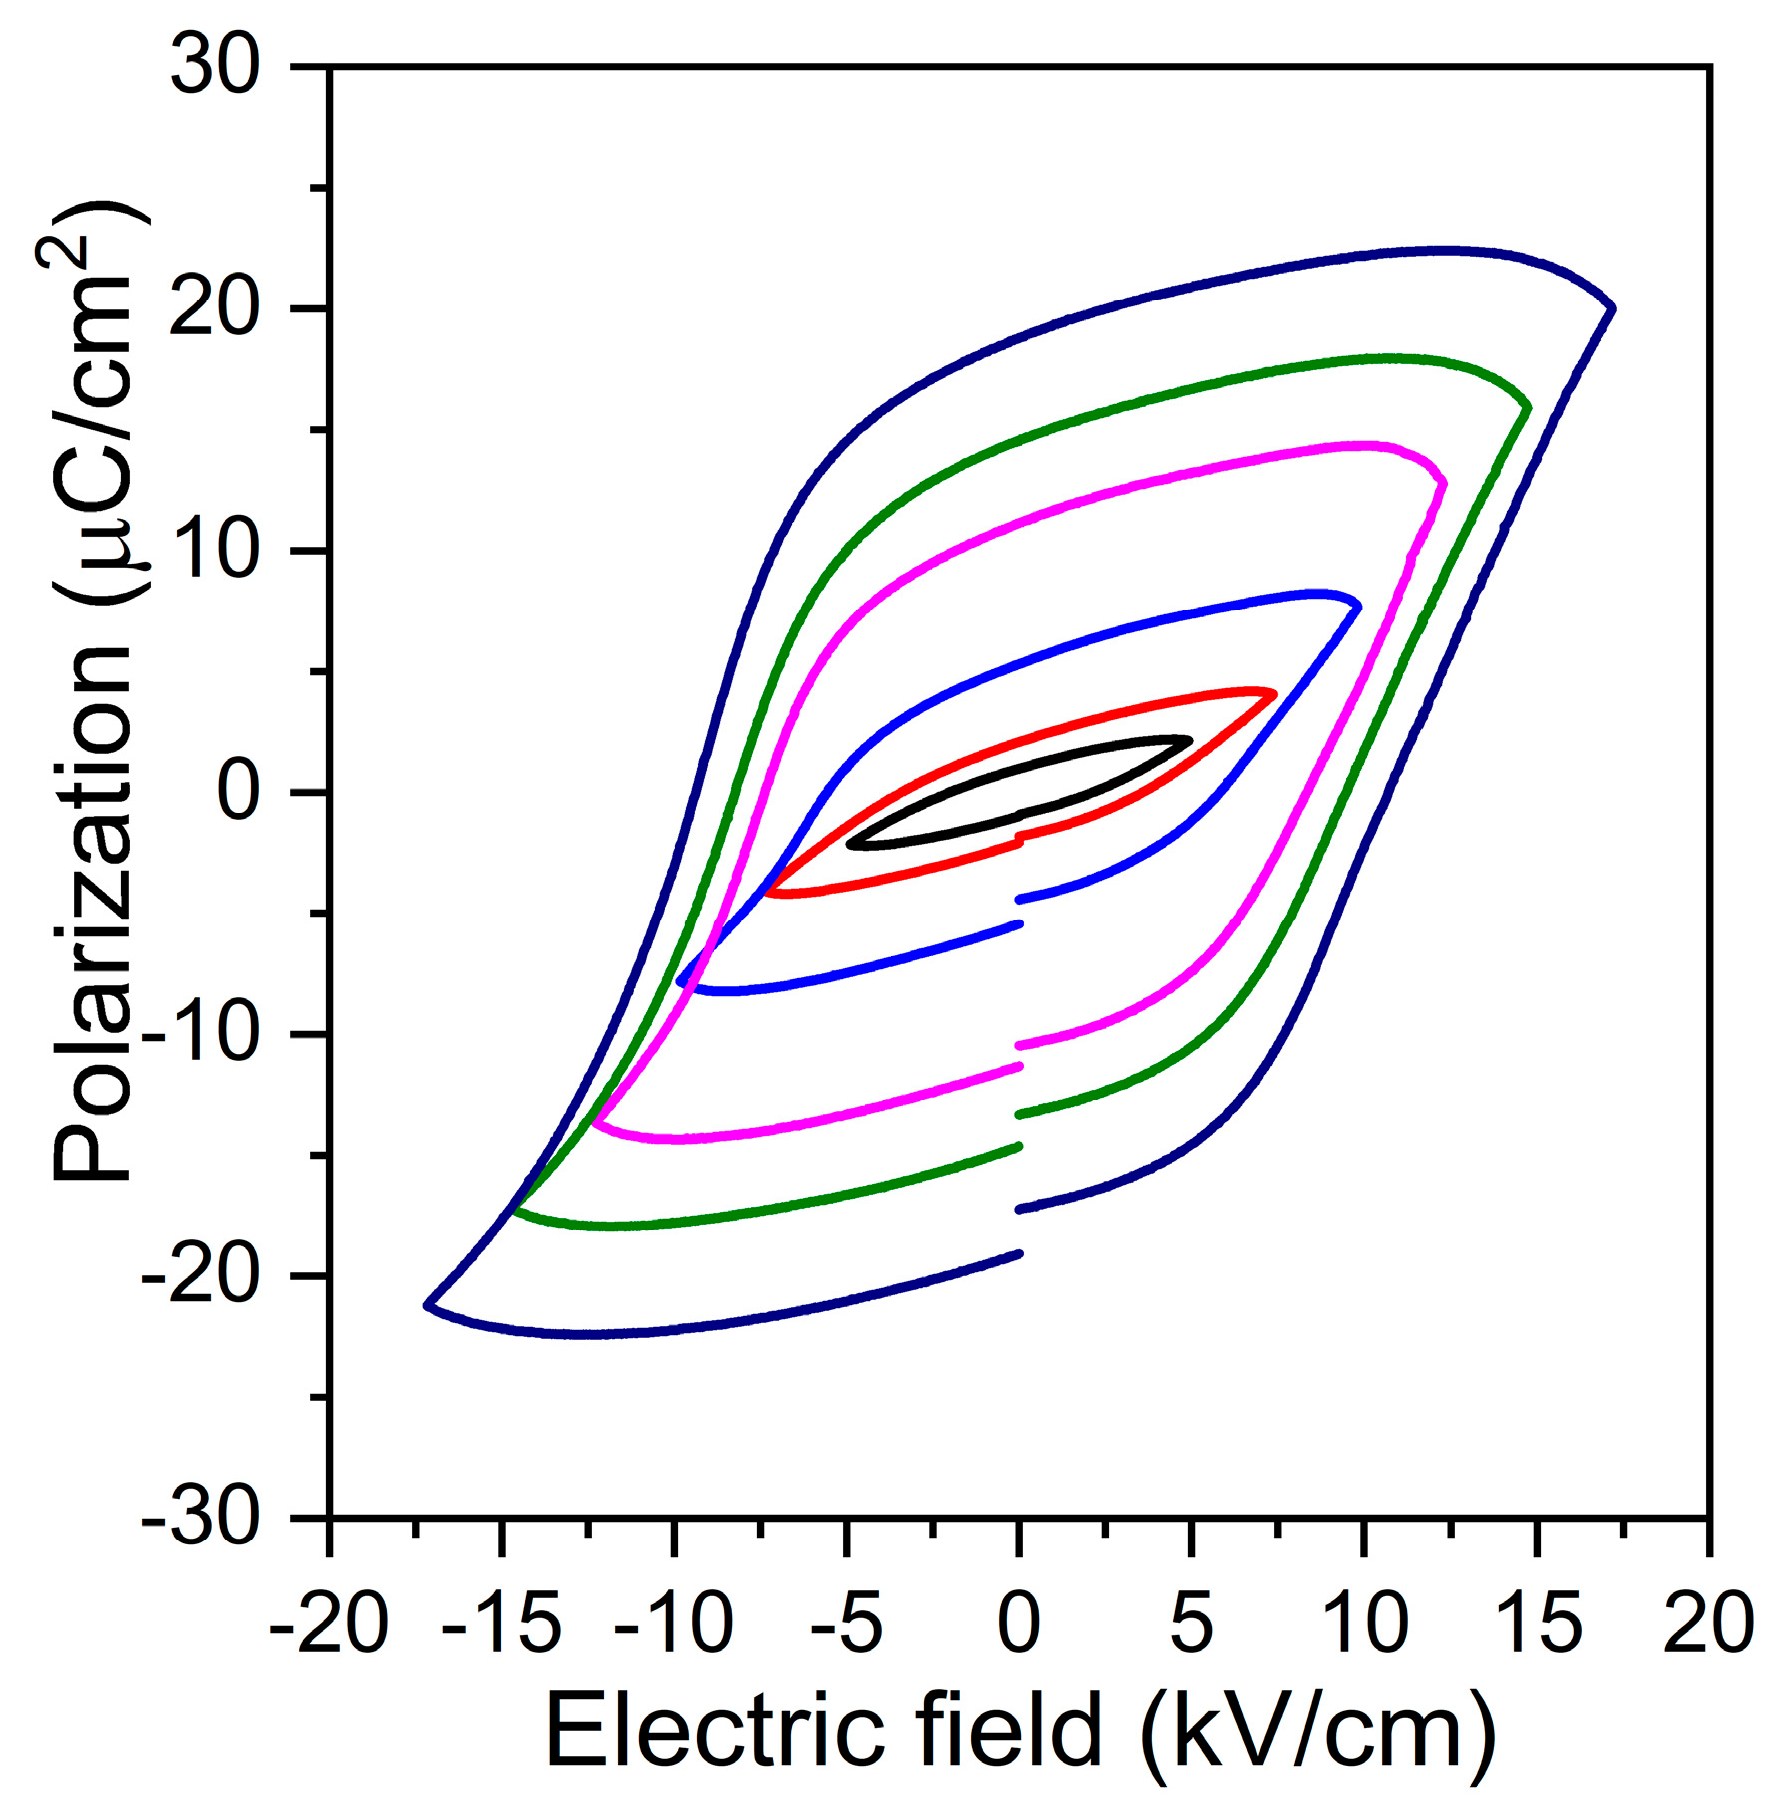
Figure 10 shows room temperature polarization–electric field (P–E) hysteresis behavior for a 98KNN–2BNZS single crystal after applying an electrical field from 1 kV to 3.5 kV with 0.5 kV intervals. The crystal exhibits well-saturated hysteresis loops, which increase with increasing electric field, and the loops display a shape that looks like that of a lossy normal ferroelectric material [70]. The maximum polarization, remnant polarization (Pr) and coercive field (Ec) are ~22 μC/cm2, ~19 μC/cm2 and 11 kV/cm, respectively. Maximum polarization and Pr values are larger than those for a polycrystalline ceramic of the same composition (~15 and 12 μC/cm2, respectively) [41]. The discontinuity between the start and finish of each loop also indicates that the material has relatively high conductivity [70]. A piezoelectric charge constant d33 of 362 pC/N was obtained for the 98KNN–2BNZS single crystal at room temperature (Figure S5). The value is higher than the value of ~120 pC/N for a polycrystalline ceramic of the same composition [41]. This is due to improved alignment of the ferroelectric domains in the poling field and also to reduction of the orthorhombic–tetragonal phase transition temperature in the single crystal. The value of d33 is relatively high compared to values of 150 pC/N [26], 103 pC/N [29] and 209 pC/N [71] for KNN-based single crystals prepared by the seed-free solid-state crystal growth method. Due to the small size and irregular shape of the single crystal, we did not try to measure kt or kp.
In order to develop the 98KNN–2BNZS single crystals further, several problems need to be overcome. These are the small size of the single crystals, the high porosity and the poor repeatability of the crystal growth experiments. Often, no single crystals grew in the samples during sintering. The reason for this poor repeatability is not currently known. The size of the single crystals may be improved by choice and optimization of different sintering additives, as carried out for KNN [32,72,73]. In recent work in our laboratory, it has been found that use of a Ba(Cu0.13Nb0.66)O3 additive and a [001]-oriented KTaO3 seed crystal allowed growth of a large and dense single crystal of (K0.5Na0.5)NbO3, although problems with repeatability persisted [49]. Figure S6 shows an SEM micrograph of a 98KNN–2BNZS single crystal (with the addition of 0.15 mol% Li2CO3 and 0.15 mol% Bi2O3 sintering aids as before) grown at 1150 °C for 20 h using a [001]-oriented KTaO3 seed crystal. A single crystal grew on the top and side faces of the seed crystal. The matrix appears to have separated from the seed and single crystal on the bottom and right-hand faces during sintering. As for the case of (K0.5Na0.5)NbO3, the growth distance is unusually high for the [001] growth direction (compared with a growth distance of several 10s of microns in previous experiments [40,65]), although the crystal contains a lot of porosity. With further experiments, it may be possible to improve the growth rate and decrease porosity in the single crystals. Porosity may also be decreased by pre-densifying the sample by hot-pressing [74] or by growing the single crystal in a hot press [75].

4. Conclusions

Using the seed-free solid-state crystal growth method, single crystals were successfully grown from a 0.98(K0.5Na0.5)NbO3–0.02(Bi0.5Na0.5)(Zr0.85Sn0.15)O3 composition with the addition of 0.15 mol% of Li2CO3 and 0.15 mol% of Bi2O3 as sintering aids. Single crystals started to grow between 15 and 20 h of sintering and the large crystals were obtained from 30 h. The crystal grown for 50 h was studied in detail and contains some porosity. The chemical composition of the 98KNN–2BNZ single crystals is similar to the nominal composition. X-ray diffraction and Raman scattering show that the single crystal has an orthorhombic structure at room temperature, with a tetragonal phase possibly also present. Impedance spectroscopy and Raman scattering indicated that the single crystal undergoes three phase transitions. These are rhombohedral–orthorhombic, orthorhombic–tetragonal and tetragonal–cubic phase transitions at −76 °C, between 70 and 80 °C, and at ~370 °C, respectively. The single crystal is a normal ferroelectric material with a piezoelectric constant d33 of 362 pC/N, which is approximately three times higher than the value of the corresponding ceramic.

Supplementary Materials

The following supporting information can be downloaded at https://www.mdpi.com/article/10.3390/ceramics7030055/s1: Figure S1: Raman spectra with fitted Lorentzian peaks at selected temperatures. The black curves are the raw data; the blue curves are the fitted peaks and the red curves are the cumulative fit of the peaks; Figure S2: Raman mode FWHM versus temperature for a 0.98(K0.5Na0.5)NbO3–0.02(Bi0.5Na0.5)(Zr0.85Sn0.15)O3 single crystal grown at 1150 °C for 50 h. Spectra are taken at temperatures between −196 °C and 600 °C; Figure S3: Raman mode peak area versus temperature for a 0.98(K0.5Na0.5)NbO3–0.02(Bi0.5Na0.5)(Zr0.85Sn0.15)O3 single crystal grown at 1150 °C for 50 h. Spectra are taken at temperatures between −196 °C and 600 °C; Figure S4: (a, c) original and (b, d) repeat Raman spectra taken between 100 and 200 °C; Figure S5: d33 measurement of a 0.98(K0.5Na0.5)NbO3–0.02(Bi0.5Na0.5)(Zr0.85Sn0.15)O3 single crystal grown at 1150 °C for 50 h; Figure S6: SEM micrograph of a 0.98(K0.5Na0.5)NbO3–0.02(Bi0.5Na0.5)(Zr0.85Sn0.15)O3 single crystal grown at 1150 °C for 20 h using a [001]-oriented KTaO3 seed crystal.

Author Contributions

Conceptualization, J.G.F.; methodology, J.G.F. and J.-S.L.; validation, E.U. and T.L.P.; formal analysis, E.U., T.L.P. and J.G.F.; investigation, E.U., T.L.P. and B.-W.L.; resources, J.G.F., J.-S.L. and J.-H.K.; data curation, E.U., J.G.F. and J.-S.L.; writing—original draft preparation, E.U. and J.G.F.; writing—review and editing, J.G.F., J.-S.L. and J.-H.K.; visualization, E.U. and J.G.F.; supervision, J.G.F., J.-S.L. and J.-H.K.; project administration, J.G.F.; funding acquisition, J.G.F., J.-S.L. and J.-H.K. All authors have read and agreed to the published version of the manuscript.

Funding

This work was supported by the Basic Science Research Program through the National Research Foundation of Korea (NRF), funded by the Ministry of Education under grant number 2018R1D1A1B07041485. Jong-Sook Lee was supported by a National Research Foundation of Korea (NRF) grant funded by the Ministry of Science and ICT (MSIT) (Grant no. 2018R1A5A1025224). Jae-Hyeon Ko was supported by a National Research Foundation of Korea (NRF) grant funded by the Ministry of Science and ICT (MSIT) (Grant no. 2020R1A2C101083111).

Institutional Review Board Statement

Not applicable.

Informed Consent Statement

Not applicable.

Data Availability Statement

The data presented in this study are available in this article and Supplementary Materials.

Acknowledgments

The authors would like to thank Kyeong-Kap Jeong and Jung-Yeol Park (Centre for Research Facilities, Chonnam National University) for operating the XRD and EPMA, respectively, and Hey-Jeong Kim (Centre for Development of Fine Chemicals, Chonnam National University) for operating the SEM.

Conflicts of Interest

The authors declare no conflicts of interest. The funders had no role in the design of the study; in the collection, analyses, or interpretation of data; in the writing of the manuscript; or in the decision to publish the results.

References

  1. EU-Directive 2002/95/EC: Restriction of the Use of Certain Hazardous Substances in Electrical and Electronic Equipment (RoHS). Off. J. Eur. Union 2003, 46, 19–23.
  2. Rödel, J.; Jo, W.; Seifert, K.T.; Anton, E.M.; Granzow, T.; Damjanovic, D. Perspective on the development of lead-free piezoceramics. J. Am. Ceram. Soc. 2009, 96, 1153–1177. [Google Scholar] [CrossRef]
  3. Bell, A.J.; Deubzer, O. Lead-free piezoelectrics—The environmental and regulatory issues. MRS Bull. 2018, 43, 581–587. [Google Scholar] [CrossRef]
  4. Lv, X.; Zhu, J.; Xiao, D.; Zhang, X.-X.; Wu, J. Emerging new phase boundary in potassium sodium-niobate based ceramics. Chem. Soc. Rev. 2020, 49, 671–707. [Google Scholar] [CrossRef] [PubMed]
  5. Wu, J. Perovskite lead-free piezoelectric ceramics. J. Appl. Phys. 2020, 127, 190901. [Google Scholar] [CrossRef]
  6. Zhou, X.; Xue, G.; Luo, H.; Bowen, C.R.; Zhang, D. Phase structure and properties of sodium bismuth titanate lead-free piezoelectric ceramics. Prog. Mater. Sci. 2021, 122, 100836. [Google Scholar] [CrossRef]
  7. Hong, C.-H.; Kim, H.-P.; Choi, B.-Y.; Han, H.-S.; Son, J.S.; Ahn, C.W.; Jo, W. Lead-free piezoceramics—Where to move on? J. Mater. 2016, 2, 1–24. [Google Scholar] [CrossRef]
  8. Wang, X.; Wu, J.; Xiao, D.; Cheng, X.; Zheng, T.; Zhang, B.; Lou, X.; Zhu, J. Large d33 in (K,Na)(Nb,Ta,Sb)O3-(Bi,Na,K)ZrO3 lead-free ceramics. J. Mater. Chem. A 2014, 2, 4122–4126. [Google Scholar] [CrossRef]
  9. Zhang, H.; Zhu, Y.; Fan, P.; Marwat, M.A.; Ma, W.; Liu, K.; Liu, H.; Xie, B.; Wang, K.; Koruza, J. Temperature-insensitive electric-field-induced strain and enhanced piezoelectric properties of <001> textured (K,Na)NbO3-based lead-free piezoceramics. Acta Mater. 2018, 156, 389–398. [Google Scholar] [CrossRef]
  10. Gao, L.; Dursun, S.; Gurdal, A.E.; Hennig, E.; Zhang, S.; Randall, C.A. Atmospheric controlled processing enabling highly textured NKN with enhanced piezoelectric performance. J. Eur. Ceram. Soc. 2019, 39, 963–972. [Google Scholar] [CrossRef]
  11. Koruza, J.; Liu, H.; Höfling, M.; Zhang, M.-H.; Veber, P. (K,Na)NbO3-based piezoelectric single crystals: Growth methods, properties, and applications. J. Mater. Res. 2020, 35, 990–1016. [Google Scholar] [CrossRef]
  12. Chen, K.; Xu, G.; Yang, D.; Wang, X.; Li, J. Dielectric and piezoelectric properties of lead-free 0.95(Na0.5K0.5)NbO3–0.05LiNbO3 crystals grown by the Bridgman method. J. Appl. Phys. 2007, 101, 044103. [Google Scholar] [CrossRef]
  13. Tian, H.; Hu, C.; Meng, X.; Tan, P.; Zhou, Z.; Li, J.; Yang, B. Top-Seeded Solution Growth and Properties of K1–xNaxNbO3 Crystals. Cryst. Growth Des. 2015, 15, 1180–1185. [Google Scholar] [CrossRef]
  14. Liu, H.; Koruza, J.; Veber, P.; Rytz, D.; Maglione, M.; Rödel, J. Orientation-dependent electromechanical properties of Mn-doped (Li,Na,K)(Nb,Ta)O3 single crystals. Appl. Phys. Lett. 2016, 109, 152902. [Google Scholar] [CrossRef]
  15. Tian, H.; Hu, C.; Meng, X.; Zhou, Z.; Shi, G. Dielectric, piezoelectric, and elastic properties of K0.8Na0.2NbO3 single crystals. J. Mater. Chem. C 2015, 3, 9609–9614. [Google Scholar] [CrossRef]
  16. Zhu, B.P.; Zhu, Y.H.; Yang, J.; Ou-Yang, J.; Yang, X.F.; Li, Y.X.; Wei, W. New Potassium Sodium Niobate Single Crystal with Thickness-independent High-performance for Photoacoustic Angiography of Atherosclerotic Lesion. Sci. Rep. 2016, 6, 8. [Google Scholar] [CrossRef]
  17. Tsuchida, K.; Kakimoto, K.-i.; Kagomiya, I. Effect of Crystal Growth Direction on Domain Structure of Mn-Doped (Na,K)NbO3 Crystal. Jpn. J. Appl. Phy. 2013, 52, 09KD02. [Google Scholar] [CrossRef]
  18. Inagaki, Y.; Kakimoto, K.-i.; Kagomiya, I. Crystal growth and ferroelectric property of Na0.5K0.5NbO3 and Mn-doped Na0.5K0.5NbO3 crystals grown by floating zone method. J. Eur. Ceram. Soc. 2010, 30, 301–306. [Google Scholar] [CrossRef]
  19. Zhou, H.; Deng, H.; Liu, X.; Yan, H.; Zhao, X.; Luo, H.; Xu, J. Dielectric and piezoelectric properties of lead-free (K0.44Na0.46)NbO3-0.5%MnO2 single crystals grown by the TSSG method. Ceram. Int. 2016, 42, 15327–15331. [Google Scholar] [CrossRef]
  20. Saravanan, R.; Rajesh, D.; Rajasekaran, S.V.; Perumal, R.; Chitra, M.; Jayavel, R. Crystal structure, dielectric properties of (K0.5Na0.5)NbO3 single crystal grown by flux method using B2O3 flux. Cryst. Res. Technol. 2013, 48, 22–28. [Google Scholar] [CrossRef]
  21. Xu, L.P.; Jiang, K.; Zhang, J.Z.; Xu, G.S.; Hu, Z.G.; Chu, J.H. Phase transitions and thermotropic phase boundaries in MnO2-doped (K0.5Na0.5)NbO3-0.05LiNbO3 single crystals: Raman scattering evidence at elevated temperatures. Appl. Phys. Lett. 2015, 106, 122901. [Google Scholar] [CrossRef]
  22. Popovič, A.; Bencze, L.; Koruza, J.; Malič, B. Vapour pressure and mixing thermodynamic properties of the KNbO3–NaNbO3 system. RSC Adv. 2015, 5, 76249–76256. [Google Scholar] [CrossRef]
  23. Kang, S.J.L.; Park, J.H.; Ko, S.Y.; Lee, H.Y. Solid-State Conversion of Single Crystals: The Principle and the State-of-the-Art. J. Am. Ceram. Soc. 2015, 98, 347–360. [Google Scholar] [CrossRef]
  24. Yang, J.; Fu, Z.; Yang, Q.; Li, Y.; Liu, Y. Effect of seeds and sintering additives on (K,Na,Li)NbO3 lead-free single crystals grown by a solid-state crystal growth method. J. Ceram. Soc. Jpn. 2016, 124, 365–369. [Google Scholar] [CrossRef]
  25. Jiang, M.; Randall, C.A.; Guo, H.; Rao, G.; Tu, R.; Gu, Z.; Cheng, G.; Liu, X.; Zhang, J.; Li, Y. Seed-Free Solid-State Growth of Large Lead-Free Piezoelectric Single Crystals: (Na1/2K1/2)NbO3. J. Am. Ceram. Soc. 2015, 98, 2988–2996. [Google Scholar] [CrossRef]
  26. Ahn, C.-W.; Lee, H.-Y.; Han, G.; Zhang, S.; Choi, S.-Y.; Choi, J.-J.; Kim, J.-W.; Yoon, W.-H.; Choi, J.-H.; Park, D.-S.; et al. Self-Growth of Centimeter-Scale Single Crystals by Normal Sintering Process in Modified Potassium Sodium Niobate Ceramics. Sci. Rep. 2015, 5, 17656. [Google Scholar] [CrossRef] [PubMed]
  27. Yang, J.; Zhang, F.; Yang, Q.; Liu, Z.; Li, Y.; Liu, Y.; Zhang, Q. Large piezoelectric properties in KNN-based lead-free single crystals grown by a seed-free solid-state crystal growth method. Appl. Phys. Lett. 2016, 108, 182904. [Google Scholar] [CrossRef]
  28. Ahn, C.-W.; Rahman, A.; Ryu, J.; Choi, J.-J.; Kim, J.-W.; Yoon, W.-H.; Choi, J.-H.; Park, D.-S.; Hahn, B.-D. Composition Design for Growth of Single Crystal by Abnormal Grain Growth in Modified Potassium Sodium Niobate Ceramics. Cryst. Growth Des. 2016, 16, 6586–6592. [Google Scholar] [CrossRef]
  29. Hao, C.Y.; Gu, Z.F.; Cheng, G.; Li, L.; Zhang, J.W.; Song, J.G.; Yan, Y.F.; Jiang, M.H. Composition design and electrical property of a pure KxNa1−xNbO3 single crystal fabricated by the seed-free solid-state crystal growth. J. Mater. Sci. Mater. Electron. 2017, 28, 18357–18365. [Google Scholar] [CrossRef]
  30. Rahman, A.; Cho, K.-H.; Ahn, C.-W.; Ryu, J.; Choi, J.-J.; Kim, J.-W.; Yoon, W.-H.; Choi, J.-H.; Park, D.-S.; Hahn, B.-D. A composition design rule for crystal growth of centimeter scale by normal sintering process in modified potassium sodium niobate ceramics. J. Eur. Ceram. Soc. 2018, 38, 1416–1420. [Google Scholar] [CrossRef]
  31. Jiang, M.; Zhang, J.; Rao, G.; Li, D.; Randall, C.A.; Li, T.; Peng, B.; Li, L.; Gu, Z.; Liu, X.; et al. Ultrahigh piezoelectric coefficient of a lead-free K0.5Na0.5NbO3-based single crystal fabricated by a simple seed-free solid-state growth method. J. Mater. Chem. C 2019, 7, 14845–14854. [Google Scholar] [CrossRef]
  32. Morimoto, T.; Shimono, S.; Ishii, K. Growth of large unitary (K,Na)NbO3 single crystals using a seed-free solid-state crystal growth method by adjusting the B-site excess ratios and additional Bi2O3. Jpn. J. Appl. Phy. 2020, 59, SP1001. [Google Scholar] [CrossRef]
  33. Chung, S.Y.; Yoon, D.Y.; Kang, S.J.L. Effects of donor concentration and oxygen partial pressure on interface morphology and grain growth behavior in SrTiO3. Acta Mater. 2002, 50, 3361–3371. [Google Scholar] [CrossRef]
  34. Fisher, J.G.; Kang, S.J.L. Microstructural changes in (Na0.5K0.5)NbO3 ceramics sintered in various atmospheres. J. Eur. Ceram. Soc. 2009, 29, 2581–2588. [Google Scholar] [CrossRef]
  35. Heo, Y.H.; Jeon, S.C.; Fisher, J.G.; Choi, S.Y.; Hur, K.H.; Kang, S.J.L. Effect of step free energy on delayed abnormal grain growth in a liquid phase-sintered BaTiO3 model system. J. Eur. Ceram. Soc. 2011, 31, 755–762. [Google Scholar] [CrossRef]
  36. Ahn, C.W.; Nahm, S.; Karmarkar, M.; Viehland, D.; Kang, D.H.; Bae, K.S.; Priya, S. Effect of CuO and MnO2 on sintering temperature, microstructure, and piezoelectric properties of 0.95(K0.5Na0.5)NbO3–0.05BaTiO3 ceramics. Mater. Lett. 2008, 62, 3594–3596. [Google Scholar]
  37. Jo, W.; Hwang, N.M.; Kim, D.Y. Effect of Crystal Shape on the Grain Growth during Liquid Phase Sintering of Ceramics. J. Korean Ceram. Soc. 2006, 43, 728–733. [Google Scholar]
  38. Fisher, J.G.; Kang, S.J.L. Strategies and practices for suppressing abnormal grain growth during liquid phase sintering. J. Am. Ceram. Soc. 2019, 102, 717–735. [Google Scholar] [CrossRef]
  39. Fisher, J.G.; Benčan, A.; Godnjavec, J.; Kosec, M. Growth behaviour of potassium sodium niobate single crystals grown by solid-state crystal growth using K4CuNb8O23 as a sintering aid. J. Eur. Ceram. Soc. 2008, 28, 1657–1663. [Google Scholar] [CrossRef]
  40. Uwiragiye, E.; Pham, T.L.; Fisher, J.G.; Lee, J.S.; Lee, B.W.; Ko, J.H.; Kim, H.P.; Jo, W. Sintering Aid-Assisted Growth of 0.95(K0.5Na0.5)NbO3–0.05(Bi0.5Na0.5)(Zr0.85Sn0.15)O3 Single Crystals by the Solid-State Crystal Growth Method and Their Characterization. Phys. Status Solidi A 2022, 219, 2100875. [Google Scholar] [CrossRef]
  41. Gou, Q.; Zhu, J.; Wu, J.; Li, F.; Jiang, L.; Xiao, D. Microstructure and electrical properties of (1−x)K0.5Na0.5NbO3–xBi0.5Na0.5Zr0.85Sn0.15O3 lead-free ceramics. J. Alloys Compd. 2018, 730, 311–317. [Google Scholar] [CrossRef]
  42. Malic, B.; Jenko, D.; Bernard, J.; Cilensek, J.; Kosec, M. Synthesis and Sintering of (K,Na)NbO3 Based Ceramics. Mat. Res. Soc. Proc. 2002, 755, 83–88. [Google Scholar] [CrossRef]
  43. Lee, M. Characterization of Thin Films by X-Ray Diffraction. In X-ray Diffraction for Materials Research: From Fundamentals to Applications; Apple Academic Press Inc.: New York, NY, USA, 2016; pp. 182–223. [Google Scholar]
  44. Iamsasri, T.; Tutuncu, G.; Uthaisar, C.; Pojprapai, S.; Jones, J.L. Analysis methods for characterizing ferroelectric/ferroelastic domain reorientation in orthorhombic perovskite materials and application to Li-doped Na0.5K0.5NbO3. J. Mater. Sci. 2013, 48, 6905–6910. [Google Scholar] [CrossRef]
  45. Rubio-Marcos, F.; Fernandez, J.F.; Ochoa, D.A.; García, J.E.; Rojas-Hernandez, R.E.; Castro, M.; Ramajo, L. Understanding the piezoelectric properties in potassium-sodium niobate-based lead-free piezoceramics: Interrelationship between intrinsic and extrinsic factors. J. Eur. Ceram. Soc. 2017, 37, 3501–3509. [Google Scholar] [CrossRef]
  46. Ochoa, D.A.; Esteves, G.; Iamsasri, T.; Rubio-Marcos, F.; Fernández, J.F.; García, J.E.; Jones, J.L. Extensive domain wall contribution to strain in a (K,Na)NbO3-based lead-free piezoceramics quantified from high energy X-ray diffraction. J. Eur. Ceram. Soc. 2016, 36, 2489–2494. [Google Scholar] [CrossRef]
  47. Kang, S.J.L.; Lee, M.G.; An, S.M. Microstructural Evolution During Sintering with Control of the Interface Structure. J. Am. Ceram. Soc. 2009, 92, 1464–1471. [Google Scholar] [CrossRef]
  48. Kang, S.J.L.; Ko, S.Y.; Moon, S.Y. Mixed control of boundary migration and the principle of microstructural evolution. J. Ceram. Soc. Jpn. 2016, 124, 259–267. [Google Scholar] [CrossRef]
  49. Fisher, J.G.; Sim, S.-H.; Ðoàn, T.T.; Uwiragiye, E.; Mok, J.; Lee, J. Comparison of (K0.5Na0.5)NbO3 Single Crystals Grown by Seed-Free and Seeded Solid-State Single Crystal Growth. Materials 2023, 16, 3638. [Google Scholar] [CrossRef] [PubMed]
  50. Trodahl, H.J.; Klein, N.; Damjanovic, D.; Setter, N.; Ludbrook, B.; Rytz, D.; Kuball, M. Raman spectroscopy of (K,Na)NbO3 and (K,Na)1−xLixNbO3. Appl. Phys. Lett. 2008, 93, 262901. [Google Scholar] [CrossRef]
  51. Kakimoto, K.; Akao, K.; Guo, Y.P.; Ohsato, H. Raman scattering study of piezoelectric (Na0.5K0.5)NbO3-LiNbO3 ceramics. Jpn. J. Appl. Phy. 2005, 44, 7064–7067. [Google Scholar] [CrossRef]
  52. Zhou, Z.; Fang, L.; Xiong, Z.; Zhang, Y.; Liu, Y.; Liu, G.; Liu, Y.; He, R.; Han, T.; Li, J.; et al. Phase transition of potassium sodium niobate under high pressures. Appl. Phys. Lett. 2023, 123, 012904. [Google Scholar] [CrossRef]
  53. Baier-Saip, J.A.; Ramos-Moor, E.; Cabrera, A.L. Raman study of phase transitions in KNbO3. Solid State Commun. 2005, 135, 367–372. [Google Scholar] [CrossRef]
  54. Buixaderas, E.; Nuzhnyy, D.; Gregora, I.; Kamba, S.; Berta, M.; Malic, B.; Kosec, M. Lattice Dynamics and Phase Transitions in KNbO3 and K0.5Na0.5NbO3 Ceramics. IEEE Trans. Ultrason. Ferroelectr. Freq. Control 2009, 56, 1843–1849. [Google Scholar] [CrossRef]
  55. Trung, D.T.; Uwiragiye, E.; Lan, T.T.; Fisher, J.G.; Lee, J.-S.; Mok, J.; Lee, J.; Naqvi, F.U.H.; Ko, J.-H. Growth of single crystals of (K1−xNax)NbO3 by the self-flux method and characterization of their phase transitions. Materials 2024. to be submitted. [Google Scholar]
  56. Hayes, W.; Loudon, R. Polar Vibrational Scattering. In Scattering of Light by Crystals; Dover Publications: Mineola, NY, USA, 2004; pp. 227–311. [Google Scholar]
  57. Powell, R.C. Symmetry and Lattice Vibrations. In Symmetry, Group Theory, and the Physical Properties of Crystals; Springer: New York, NY, USA, 2010; pp. 165–199. [Google Scholar]
  58. Sang, S.; Yuan, Z.; Zheng, L.; Sun, E.; Qi, X.; Zhang, R.; Jiang, X.; Li, S.; Du, J. Raman spectra of (K, Na)(Nb, Ta)O3 single crystal. J. Alloys Compd. 2017, 704, 804–808. [Google Scholar] [CrossRef]
  59. Xia, H.R.; Xia, H.R.; Chen, H.C.; Yu, H.; Wang, K.X.; Zhao, B.Y. Vibrational Spectra of a K0.30Na0.10Sr0.48Ba0.32Nb0.2O0.6 Single Crystal Studied by Raman and Infrared Reflectivity Spectroscopy. Phys. Status Solidi B 1998, 210, 47–59. [Google Scholar] [CrossRef]
  60. Klein, N.; Hollenstein, E.; Damjanovic, D.; Trodahl, H.J.; Setter, N.; Kuball, M. A study of the phase diagram of (K,Na,Li)NbO3 determined by dielectric and piezoelectric measurements, and Raman spectroscopy. J. Appl. Phys. 2007, 102, 014112. [Google Scholar] [CrossRef]
  61. Kodre, A.; Tellier, J.; Arčon, I.; Malič, B.; Kosec, M. Extended x-ray absorption fine structure study of phase transitions in the piezoelectric perovskite K0.5Na0.5NbO3. J. Appl. Phys. 2009, 105, 113528. [Google Scholar] [CrossRef]
  62. Tsuda, K.; Tanaka, M. Nanometer-scale local structural study of the paraelectric cubic phase of KNbO3 by convergent-beam electron diffraction. Jpn. J. Appl. Phy. 2017, 56, 10PB09. [Google Scholar] [CrossRef]
  63. Yoneda, Y.; Ohara, K.; Nagata, H. Local structure and phase transitions of KNbO3. Jpn. J. Appl. Phy. 2018, 57, 11UB07. [Google Scholar] [CrossRef]
  64. Bencan, A.; Oveisi, E.; Hashemizadeh, S.; Veerapandiyan, V.K.; Hoshina, T.; Rojac, T.; Deluca, M.; Drazic, G.; Damjanovic, D. Atomic scale symmetry and polar nanoclusters in the paraelectric phase of ferroelectric materials. Nat. Commun. 2021, 12, 3509. [Google Scholar] [CrossRef] [PubMed]
  65. Uwiragiye, E.; Farooq, M.U.; Moon, S.H.; Pham, T.L.; Nguyen, D.T.; Lee, J.S.; Fisher, J.G. High performance lead-free piezoelectric 0.96(K0.48Na0.52)NbO3-0.03[Bi0.5(Na0.7K0.2Li0.1)0.5]ZrO3-0.01(Bi0.5Na0.5)TiO3 single crystals grown by solid state crystal growth and their phase relations. J. Eur. Ceram. Soc. 2017, 37, 4597–4607. [Google Scholar] [CrossRef]
  66. Fridkin, V.M. Thermodynamics of Ferroelectric Semiconductors. In Ferroelectric Semiconductors; Consultants Bureau: New York, NY, USA, 1980; pp. 1–21. [Google Scholar]
  67. Lines, M.E.; Glass, A.M. Macroscopics and Phenomenology. In Principles and Applications of Ferroelectrics and Related Materials; Oxford University Press: Oxford, UK, 2001; pp. 59–86. [Google Scholar]
  68. Rubio-Marcos, F.; Del Campo, A.; López-Juárez, R.; Romero, J.J.; Fernández, J.F. High spatial resolution structure of (K,Na)NbO3 lead-free ferroelectric domains. J. Mater. Chem. 2012, 22, 9714–9720. [Google Scholar] [CrossRef]
  69. Doan, T.T.; Fisher, J.G.; Lee, J.-S.; Tran, H.T.; Gao, J.; Mok, J.; Lee, J.; Benčan, A.; Dražić, G.; Junaid, S.B.; et al. Growth of KNbO3 Single Crystals by the Flux Method Using KBO2 as a Flux. Inorganics 2024, 12, 151. [Google Scholar] [CrossRef]
  70. Jin, L.; Li, F.; Zhang, S. Decoding the Fingerprint of Ferroelectric Loops: Comprehension of the Material Properties and Structures. J. Am. Ceram. Soc. 2014, 97, 1–27. [Google Scholar] [CrossRef]
  71. Yao, X.; Jiang, M.; Li, W.; Lu, H.; Li, L.; Rao, G. Effects of the calcined temperature of ingredients on the growth, structure and electrical properties of (K0.5Na0.5)NbO3-based single crystals. J. Mater. Sci. Mater. Electron. 2020, 31, 21971–21980. [Google Scholar] [CrossRef]
  72. Morimoto, T.; Shimono, S.; Yoshiichi, Y.; Kishimura, H.; Ishii, K. Conditions of large unitary (K, Na)NbO3 system single crystals for rapid solid-state crystal growth method. Jpn. J. Appl. Phys. 2023, 62, 035501. [Google Scholar] [CrossRef]
  73. Morimoto, T.; Shimono, S.; Yoshiichi, Y.; Kishimura, H.; Ishii, K. Effects of Cu addition on rapid solid-state crystal growth of (K,Na)NbO3 single crystals. Jpn. J. Appl. Phys. 2022, 61, SN1015. [Google Scholar] [CrossRef]
  74. Fisher, J.G.; Benčan, A.; Holc, J.; Kosec, M.; Vernay, S.; Rytz, D. Growth of potassium sodium niobate single crystals by solid state crystal growth. J. Cryst. Growth 2007, 303, 487–492. [Google Scholar] [CrossRef]
  75. Fisher, J.G.; Bencan, A.; Kosec, M.; Vernay, S.; Rytz, D. Growth of dense single crystals of potassium sodium niobate by a combination of solid-state crystal growth and hot pressing. J. Am. Ceram. Soc. 2008, 91, 1503–1507. [Google Scholar] [CrossRef]
Figure 1. XRD patterns of (a) 0.98(K0.5Na0.5)NbO3–0.02(Bi0.5Na0.5)(Zr0.85Sn0.15)O3 powder calcined at 1000 °C for 5 h (pattern taken before sintering aid addition); (b) 0.98(K0.5Na0.5)NbO3–0.02(Bi0.5Na0.5)(Zr0.85Sn0.15)O3 bulk single crystal grown at 1150 °C for 50 h.
Ceramics 07 00055 g001
Figure 2. Photographs of 0.98(K0.5Na0.5)NbO3–0.02(Bi0.5Na0.5)(Zr0.85Sn0.15)O3 specimens after sintering at 1150 °C for 20–50 h, and a single crystal after removal from the matrix of a sample sintered at 1150 °C for 50 h.
Ceramics 07 00055 g002
Figure 3. SEM micrographs of (a,b) polished and etched cross-section of a 0.98(K0.5Na0.5)NbO3–0.02(Bi0.5Na0.5)(Zr0.85Sn0.15)O3 single crystal grown at 1150 °C for 20 h; (c) as-grown surface of a 0.98(K0.5Na0.5)NbO3–0.02(Bi0.5Na0.5)(Zr0.85Sn0.15)O3 single crystal grown at 1150 °C for 50 h; (d) polished and etched cross-section of a 0.98(K0.5Na0.5)NbO3–0.02(Bi0.5Na0.5)(Zr0.85Sn0.15)O3 single crystal grown at 1150 °C for 50 h.
Ceramics 07 00055 g003
Figure 4. Raman spectrum of a 0.98(K0.5Na0.5)NbO3–0.02(Bi0.5Na0.5)(Zr0.85Sn0.15)O3 single crystal grown at 1150 °C for 50 h.
Ceramics 07 00055 g004
Figure 5. (a) Contour plot of normalized intensity of Raman spectra of a 0.98(K0.5Na0.5)NbO3–0.02(Bi0.5Na0.5)(Zr0.85Sn0.15)O3 single crystal grown at 1150 °C for 50 h. Spectra are taken at temperatures between −196 °C and 600 °C; (b) individual spectra.
Ceramics 07 00055 g005
Figure 6. Raman mode position versus temperature for a 0.98(K0.5Na0.5)NbO3–0.02(Bi0.5Na0.5)(Zr0.85Sn0.15)O3 single crystal grown at 1150 °C for 50 h. Spectra are taken at temperatures between −196 °C and 600 °C.
Ceramics 07 00055 g006
Figure 7. Relative permittivity, inverse relative permittivity, loss tangent and conductivity of a 0.98(K0.5Na0.5)NbO3–0.02(Bi0.5Na0.5)(Zr0.85Sn0.15)O3 single crystal grown at 1150 °C for 50 h, displayed as functions of temperature between room temperature and 600 °C (ad) on heating and (eh) on cooling.
Ceramics 07 00055 g007
Figure 8. Low-temperature relative permittivity, inverse relative permittivity, loss tangent and conductivity of a 0.98(K0.5Na0.5)NbO3–0.02(Bi0.5Na0.5)(Zr0.85Sn0.15)O3 single crystal grown at 1150 °C for 50 h, displayed as functions of temperature between −223 °C and 200 °C (ad) on heating and (eh) on cooling.
Ceramics 07 00055 g008
Figure 9. Relative permittivity, loss tangent and conductivity of a 0.98(K0.5Na0.5)NbO3–0.02(Bi0.5Na0.5)(Zr0.85Sn0.15)O3 single crystal grown at 1150 °C for 50 h, displayed as functions of temperature between −190 °C and 590 °C (ad) on heating and (eh) on cooling.
Ceramics 07 00055 g009
Figure 10. Polarization vs. electric field hysteresis loops of a 0.98(K0.5Na0.5)NbO3–0.02(Bi0.5Na0.5)(Zr0.85Sn0.15)O3 single crystal grown at 1150 °C for 50 h.
Ceramics 07 00055 g010
Table 1. Chemical composition of a 0.98(K0.5Na0.5)NbO3–0.02(Bi0.5Na0.5)(Zr0.85Sn0.15)O3 single crystal grown at 1150 °C for 50 h and its matrix measured by EPMA.
OxideSingle Crystal (mol %)Matrix (mol %)Nominal (mol %)
K2O22.16 ± 0.3222.40 ± 0.4324.26
Na2O23.44 ± 0.3424.09 ± 0.9124.75
Nb2O551.58 ± 0.2350.83 ± 0.9148.51
Bi2O30.81 ± 0.070.72 ± 0.100.50
ZrO21.69 ± 0.041.62 ± 0.161.68
SnO20.32 ± 0.100.34 ± 0.050.30
Table 2. Room temperature values of relative permittivity and loss tangent measured on heating at a frequency of 104 Hz.
Measurement EquipmentMeasurement Temperature (°C)Relative PermittivityLoss Tangent
TS1500 hot stage316910.044
CCR-400/200 cryostat254480.049
THMS600 cryostat256190.028
Disclaimer/Publisher’s Note: The statements, opinions and data contained in all publications are solely those of the individual author(s) and contributor(s) and not of MDPI and/or the editor(s). MDPI and/or the editor(s) disclaim responsibility for any injury to people or property resulting from any ideas, methods, instructions or products referred to in the content.