Abstract
In this work, the development of Al-based metal matrix composites (MMCs) is achieved using hybrid SiC and ZrO2 reinforcement particles for automotive applications. Powder metallurgy (PM) is employed with various combinations of important process parameters for the fabrication of MMCs. MMCs were characterized using scanning electron microscopy (SEM), X-ray diffractometry (XRD), and a microhardness study. All XRD graphs adequately exhibit Al, SiC, and ZrO2 peaks, indicating that the hybrid MMC products were satisfactorily fabricated with appropriate mixing and sintering at all the considered fabrication conditions. Also, no impurity peaks were observed, confirming high composite purity. MMC products in all the XRD patterns, suitable for the desired applications. According to the SEM investigation, SiC and ZrO2 reinforcement components are uniformly scattered throughout Al matrix in all produced MMC products. The occurrence of Al, Si, C, Zr, and O in EDS spectra demonstrates the effectiveness of composite ball milling and sintering under all manufacturing conditions. Moreover, an increase in interfacial bonding of fabricated composites at a higher sintering temperature indicated improved physical properties of the developed MMCs. The highest microhardness value is 86.6 HVN amid all the fabricated composites at 7% silica, 14% zirconium dioxide, 500° sintering temperature, 90 min sintering time, and 60 min milling time. An integrated Particle Swarm Optimization–Support Vector Machine (PSO-SVM) model was developed to predict microhardness based on the input parameters. The model demonstrated strong predictive performance, as evidenced by low values of various statistical metrics for both training and testing datasets, highlighting the PSO-SVM model’s robustness and generalization capability. Specifically, the model achieved a coefficient of determination of 0.995 and a root mean square error of 0.920 on the training set, while on the testing set, it attained a coefficient of determination of 0.982 and a root mean square error of 1.557. These results underscore the potential of the PSO-SVM framework, which can be effectively leveraged to optimize process parameters for achieving targeted microhardness levels for the developed Al-SiC-ZrO2 Composites.
1. Introduction
Aluminum-based hybrid MMCs are very advanced materials that combine aluminum with various reinforcements to improve mechanical, thermal, and electrical performance. Because of their greater performance than standard metal alloys, these composites are becoming more popular in the aerospace, automotive, and defense industries [1]. Aluminum-based hybrid MMCs are typically formed using two techniques: solid-state and liquid-state methods. Powder metallurgy (PM) is a commonly used solid-state manufacturing technology. In PM, the metal (aluminum, magnesium, or copper) matrix and reinforcement materials (such as SiC, TiC, or graphite) are mixed in desired proportions, compressed into the desired shape, and sintered at a temperature just below the materials’ melting points [2,3,4]. This procedure ensures that reinforcements are distributed uniformly throughout the matrix. PM provides acceptable control over the composition and distribution of reinforcements, resulting in better mechanical qualities like hardness, tensile strength, and wear resistance. Fabricated MMCs through PM methods have much greater hardness and tensile strength than liquid-state MMCs due to homogeneous reinforcement distribution and a smaller amount of interfacial reactivity [5].
PM enables the customization of composite qualities by modifying the type, size, and volume proportion of reinforcements. This adaptability enables the creation of materials that are suited to specific application needs. Aluminum-based hybrid MMCs made with PM methods have several advantages, including superior mechanical, thermal, and electrical conductivity, lightweight qualities, a high strength-to-weight proportion, and higher corrosion resistance. As material science and production methods progress, these composites are increasingly being used in a variety of high-performance applications [6,7,8]. Porosity remains a serious issue in PM-based MMCs, compromising their structural integrity and performance. Porosity in MMCs made by PM techniques results from a variety of factors, including irregular particle morphologies, low packing density, and surface oxides, which can impede full densification [9]. The non-uniform mixing of matrix and reinforcement powders can result in agglomerates and voids, while insufficient compaction pressure leads to trapped air and inefficient particle bonding. Inadequate sintering temperature or time causes incomplete diffusion and neck development between particles, hence maintaining pores [10]. Al-based hybrid MMCs provide substantial advantages in both aerospace and automotive applications. The utilization of these composites in high-performance applications is projected to grow significantly with the progress of materials science and manufacturing engineering.
Al-based hybrid MMCs are utilized in engine parts such as pistons, cylinder heads, and connecting rods [11]. These composites have better wear resistance, higher thermal conductivity, and lower weight, all of which contribute to improved engine performance and fuel efficiency. High-performance braking discs and pads in automobiles are made of aluminum MMCs reinforced with ceramic materials such as SiC. These materials have outstanding thermal stability and wear resistance, ensuring consistent braking performance in high-temperature environments [12]. These MMCs are employed in a diversity of automotive structural components, like chassis and suspension systems. These composites help to reduce the vehicle’s overall weight while retaining structural integrity and safety. Al-based MMCs are also used in the manufacture of heat exchangers due to their great thermal conductivity [13]. These composites are used in radiators and other cooling systems to effectively regulate heat and increase the vehicle’s thermal efficiency. With the rise of electric vehicles (EVs), AI-based MMCs are being employed in battery housings and thermal management systems. These materials have the strength, thermal conductivity, and lightweight qualities needed for optimal EV operation. The incorporation of ceramic reinforcements, for example, SiC and TiC, into Al matrices improves wear resistance, making them suitable for high-stress applications [14]. Aluminum-based MMCs possess higher thermal conductivity, which is critical for heat sinks and electronic packaging use. The inclusion of specific reinforcements can also improve the electrical conductivity of composites and corrosion resistance, making them valuable for electrical and electronic applications [15,16]. Al-based MMCs are lighter than standard metal alloys, which is a key benefit in automotive and aerospace areas, where weight reduction results in increased fuel efficiency and lower emissions. Thermal management applications make use of hybrid Al-based MMCs reinforced with high-thermal-conductivity materials like SiC and diamond [17]. These materials are ideal for heat sinks and electronic packaging in aeronautical systems because they dissipate heat efficiently and maintain operating temperatures at appropriate levels. The analysis of aluminum-based composites reinforced with SiC, graphite, and ZrO2 showed that the 3% reinforced composite had the lowest corrosion current density (0.4 μA) and rate (0.23 mpy) compared to pure Al [18]. The 3 wt.% micro/nano-hybrid aluminum composite has the least void content (1.7%). The Al-15%Mg2Si-9%YSZ has excellent wear resistance, with a wear rate of 0.46 mm3/km under a 25 N load [19]. The average COF was 0.42, lower than YSZ-containing composites at 3 and 6 wt.%. Additionally, the Al-15%Mg2Si-9%YSZ has superior corrosion resistance. The corrosion rate is 0.080 mmpy, similar to the 0.164 mmpy rate in the in situ composite.
SiC particles considerably boost the hardness and wear resistance of Al-based MMCs. This makes them ideal for applications that require exceptional durability, such as brake systems and aeroplane engine components. The inclusion of SiC can significantly increase the tensile strength of the composites. SiC has strong thermal conductivity, which improves the composite’s heat dissipation properties, making it especially useful in thermal management applications. SiC has a low thermal expansion coefficient, lowering the composite’s overall thermal expansion [20]. This allows the material to remain dimensionally stable at high temperatures, making it appropriate for high-temperature applications. ZrO2 particles increase the hardness and strength of Al-based MMCs. This is especially beneficial in applications that demand both impact resistance and high strength. The addition of ZrO2 particles increases the composite’s wear resistance, making it appropriate for high-wear conditions. ZrO2 has strong thermal stability, which aids in the mechanical integrity of the composite at high temperatures. This makes it ideal for high-temperature applications in the aerospace and automotive industries. ZrO2-reinforced AMCs are employed in high-temperature applications including engine parts and exhaust systems, where thermal stability and mechanical strength are crucial [21]. The microstructure and shape of SiC and ZrO2 particles are critical factors in determining the performance of aluminum-based MMCs. Uniform distribution, appropriate particle size, and strong interfacial bonding are required to maximize mechanical and thermal properties of these composites [22]. These factors ensure that the composites have high hardness, tensile strength, resistance to wear, and thermal stability, making them ideal for a variety of high-performance applications.
A review of some of the important and relevant past studies referred to is given here as under.
Muralidharan et al. [23] utilized a stir casting method to produce AA6061 reinforced with varied wt.% of ZrO2 particles (0, 3, 6, 9, and 12%). With a rise in wt.% of ZrO2 elements from 0 to 12 wt.%, hardness and UTS enhanced from 46 to 79 BHN and 95 to 228 MPa, respectively. The wear rate reduced as the wt.% of ZrO2 reinforcements in the Al matrix increased, as seen by the wear rate at 3–12% being 0.7–0.1 mm3/min. In another important study, composites were made using varied amounts of micro-sized ZrO2 reinforcements, specifically 0.5, 1, and 3 wt% [24]. The addition of ZrO2 improves wear resistance significantly, which is an important property for composites based on Al-12 wt.% Si Alloy. The best wear-resistant combination is discovered at 3 wt.% ZrO2, which is due to strong micro-coring and interstitial metal oxygen bonding assisted by the Si component in the Al-12%Si matrix. Al was mixed with 3 wt.% of Si3N4 and ZrO2 of 0, 1.5, 3, and 4.5 wt.% [25]. An equal dispersion of Si3N4/ZrO2 particles within the matrix was observed with more wt.% of nano-ZrO2 compressed at 500 MPa. A maximum hardness value of 72 VHN was obtained for the combination having Al with 3 wt.% Si3N4 and 4.5 wt.% ZrO2. The stir casting method was utilized to manufacture Al-6061 reinforced MMCs with ZrO2 concentrations of 3%, 6%, and 9% [26]. The composites showed a 14.93% and 17.47% increase in tensile strength and hardness.
Titanium metal matrix composites (TMMCs) were produced using PM methods by Gemeda et al. [27]. They found that the materials combination B4C of 5%, ZrO2 of 7.5%, SiC of 12.5%, and Ti of 75% had greater hardness, yielding, and ultimate strength. In another investigation, Khan et al. manufactured Al-SiC-ZrO2 with a fixed 5 wt.% of SiC and changing wt.% of ZrO2 and discovered that Al-5%SiC-9%ZrO2 composites had 119% and 56% higher yield strength than Al and Al-5%SiC composites, respectively [28]. This improvement was attributed to the dispersion hardening of ZrO2 and SiC particles. An important work made use of a conventional stir-casting process to fabricate Al 6061 based on two types of composites: I (Al with SiC particles) and II (Al with ZrO2 and SiC particles) [29]. The experimental results showed that composite II provided a higher hardness and tensile strength of 53.6 HRC and 96.43 N/mm2 as compared to composite I, having hardness and tensile strength of 45.8 HRC and 67.229 N/mm2.
The review of past work indicates that SiC reinforcement imparts hardness and wear resistance to the composites, consequently equipping them for high-temperature and stress applications. On the other hand, ZrO2 greatly assisted in increasing hardness, strength, and thermal stability, making composites appropriate for high-impact and temperature applications. These reinforcements can be combined to develop advanced metal matrix composites as adaptable materials for usage in a variety of applications in the aerospace and automotive industries. From previous studies, it can be inferred that there is a scarcity of research on the investigation of SiC and ZrO2 Al-based MMCs. Specifically, the mixing of SiC and ZrO2 particles together for the Al-based MMCs is not reported exhaustively. Moreover, the consideration of various fabrication parameters of ball milling as well as sintering together was limitedly taken into account to study their effects on final MMC products.
Optimizing process parameters is a key challenge in experimental work, essential for conserving manpower, materials, and costs while achieving improved outcomes. Therefore, it is crucial to employ intelligent statistical and soft computing techniques within the defined boundary conditions of the investigation [30]. Furthermore, the traditional modeling methods, such as response surface methodology (RSM) and physics-based models, often struggle to capture the complex, non-linear interactions between fabrication parameters and material properties [30,31]. Azad et al. [30] demonstrated the effectiveness of both response surface methodology (RSM) and the machine learning technique artificial neural networks (ANNs) in predicting the microhardness of Al/SiC composites and optimizing their composition. Among the two, the ANN model outperformed RSM, achieving higher accuracy and closer alignment with experimental results. This underscores ML’s superior ability to model complex, non-linear relationships in material behavior. Ipakchi et al. [32] studied the diameter of polyvinyl butyral (PVB) nanofibers using both RSM and a machine learning approach, i.e., PSO-optimized Least Squares Support Vector Machine (PSO-LSSVM). PSO-LSSVM outperformed RSM, achieving a higher prediction accuracy, demonstrating its superior capability in capturing complex relationships. Khan et al. [33] evaluated the impact of colloidal nano-silica (CNS) dosage and surface area on mortar compressive strength, using both RSM and ANN for modeling and optimization. ANN outperformed RSM with higher accuracy and lower prediction errors, effectively capturing the complex behavior of nano-modified mixes. Hamzat et al. [34] study applied ML models to predict the flexural strength of fiber-reinforced polymer composites. Five ML algorithms were trained on both in-house and literature data to improve model robustness and generalization. The Extra Trees Regressor delivered the best performance, achieving R2 values up to 0.99 on in-house data and 0.94 on the combined dataset. The results demonstrate the effectiveness of ensemble ML models in accurately predicting composite flexural properties. Collectively, these studies highlight that the limitations of conventional modeling methodologies have been effectively addressed in recent years by machine learning (ML) techniques. The expanding capabilities of ML techniques have positioned them at the forefront of various industries, unlocking transformative potential for modeling, analyzing, and optimizing complex systems. With advancements in computational power and data acquisition technologies, industries now have access to vast amounts of process and performance data, enabling the development of more accurate and reliable predictive models [35]. These models not only facilitate the prediction of material properties but also enable further optimization of manufacturing processes. Among ML techniques, Support Vector Machines (SVMs) have demonstrated exceptional performance in solving nonlinear regression problems, particularly in scenarios involving small datasets [36,37]. SVMs leverage an ε-insensitive loss function to construct robust predictive models, making them well-suited for various applications like materials science and manufacturing [36]. The performance of the SVM relies on the proper tuning of its hyperparameters, including the ε-insensitivity parameter, the regularization parameter C, and the kernel parameters [38]. However, like other ML models, SVMs have limitations, including long training times, challenges in tuning hyperparameters, and complexities in handling highly non-linear problems. To overcome these challenges, an integrated approach combining SVMs with optimization algorithms, such as Particle Swarm Optimization (PSO), has been proposed. Inspired by the social behavior of biological groups, PSO offers excellent robustness and global search capabilities, enabling efficient hyperparameter tuning and enhanced generalization of SVM models [39].
In this work, the powder metallurgy method is employed to produce hybrid Al-SiC-ZrO2 composites where aluminum has been used as a base matrix and enriched with SiC and ZrO2 as reinforcement particles. Various wt.% of reinforcement particles, ball milling, and sintering parameters are considered simultaneously to study their effects on the final manufactured MMC products. Following the successful fabrication of SiC and ZrO2 Al-based MMCs, XRD, morphological, and microhardness analyses are performed. Additionally, an integrated Particle Swarm Optimization–Support Vector Machine (PSO-SVM) model was developed to predict microhardness based on the input parameters. The model’s performance was evaluated using various statistical metrics on both training and testing datasets to assess its robustness and ability to capture the complex influence of input parameters on microhardness.
2. Materials and Methods
Aluminum and its alloys are well-known materials for various industrial and commercial applications. Their low density and good mechanical properties make them suitable for various applications. MMC fabrication from Al matrix is possible and requires appropriate types and combinations of reinforcements. The metal matrix in this work is pure Al powder (purity > 99%, typical particle size 75 µm), which was provided by Zimco Aluminum Company (Benoni, South Africa). SiC and ZrO2 of 16 and 5 microns in sizes respectively have been utilized as reinforcement elements in the hybridization of MMCs with an Al-based matrix supplied by Merck Life Science (Pty) Ltd. (Johannesburg, South Africa). Powder metallurgy is one of the most preferred solid-state MMC production methods due to its low cost and versatility in making composites with improved properties. For this study, MMCs have been fabricated using a powder metallurgy route.
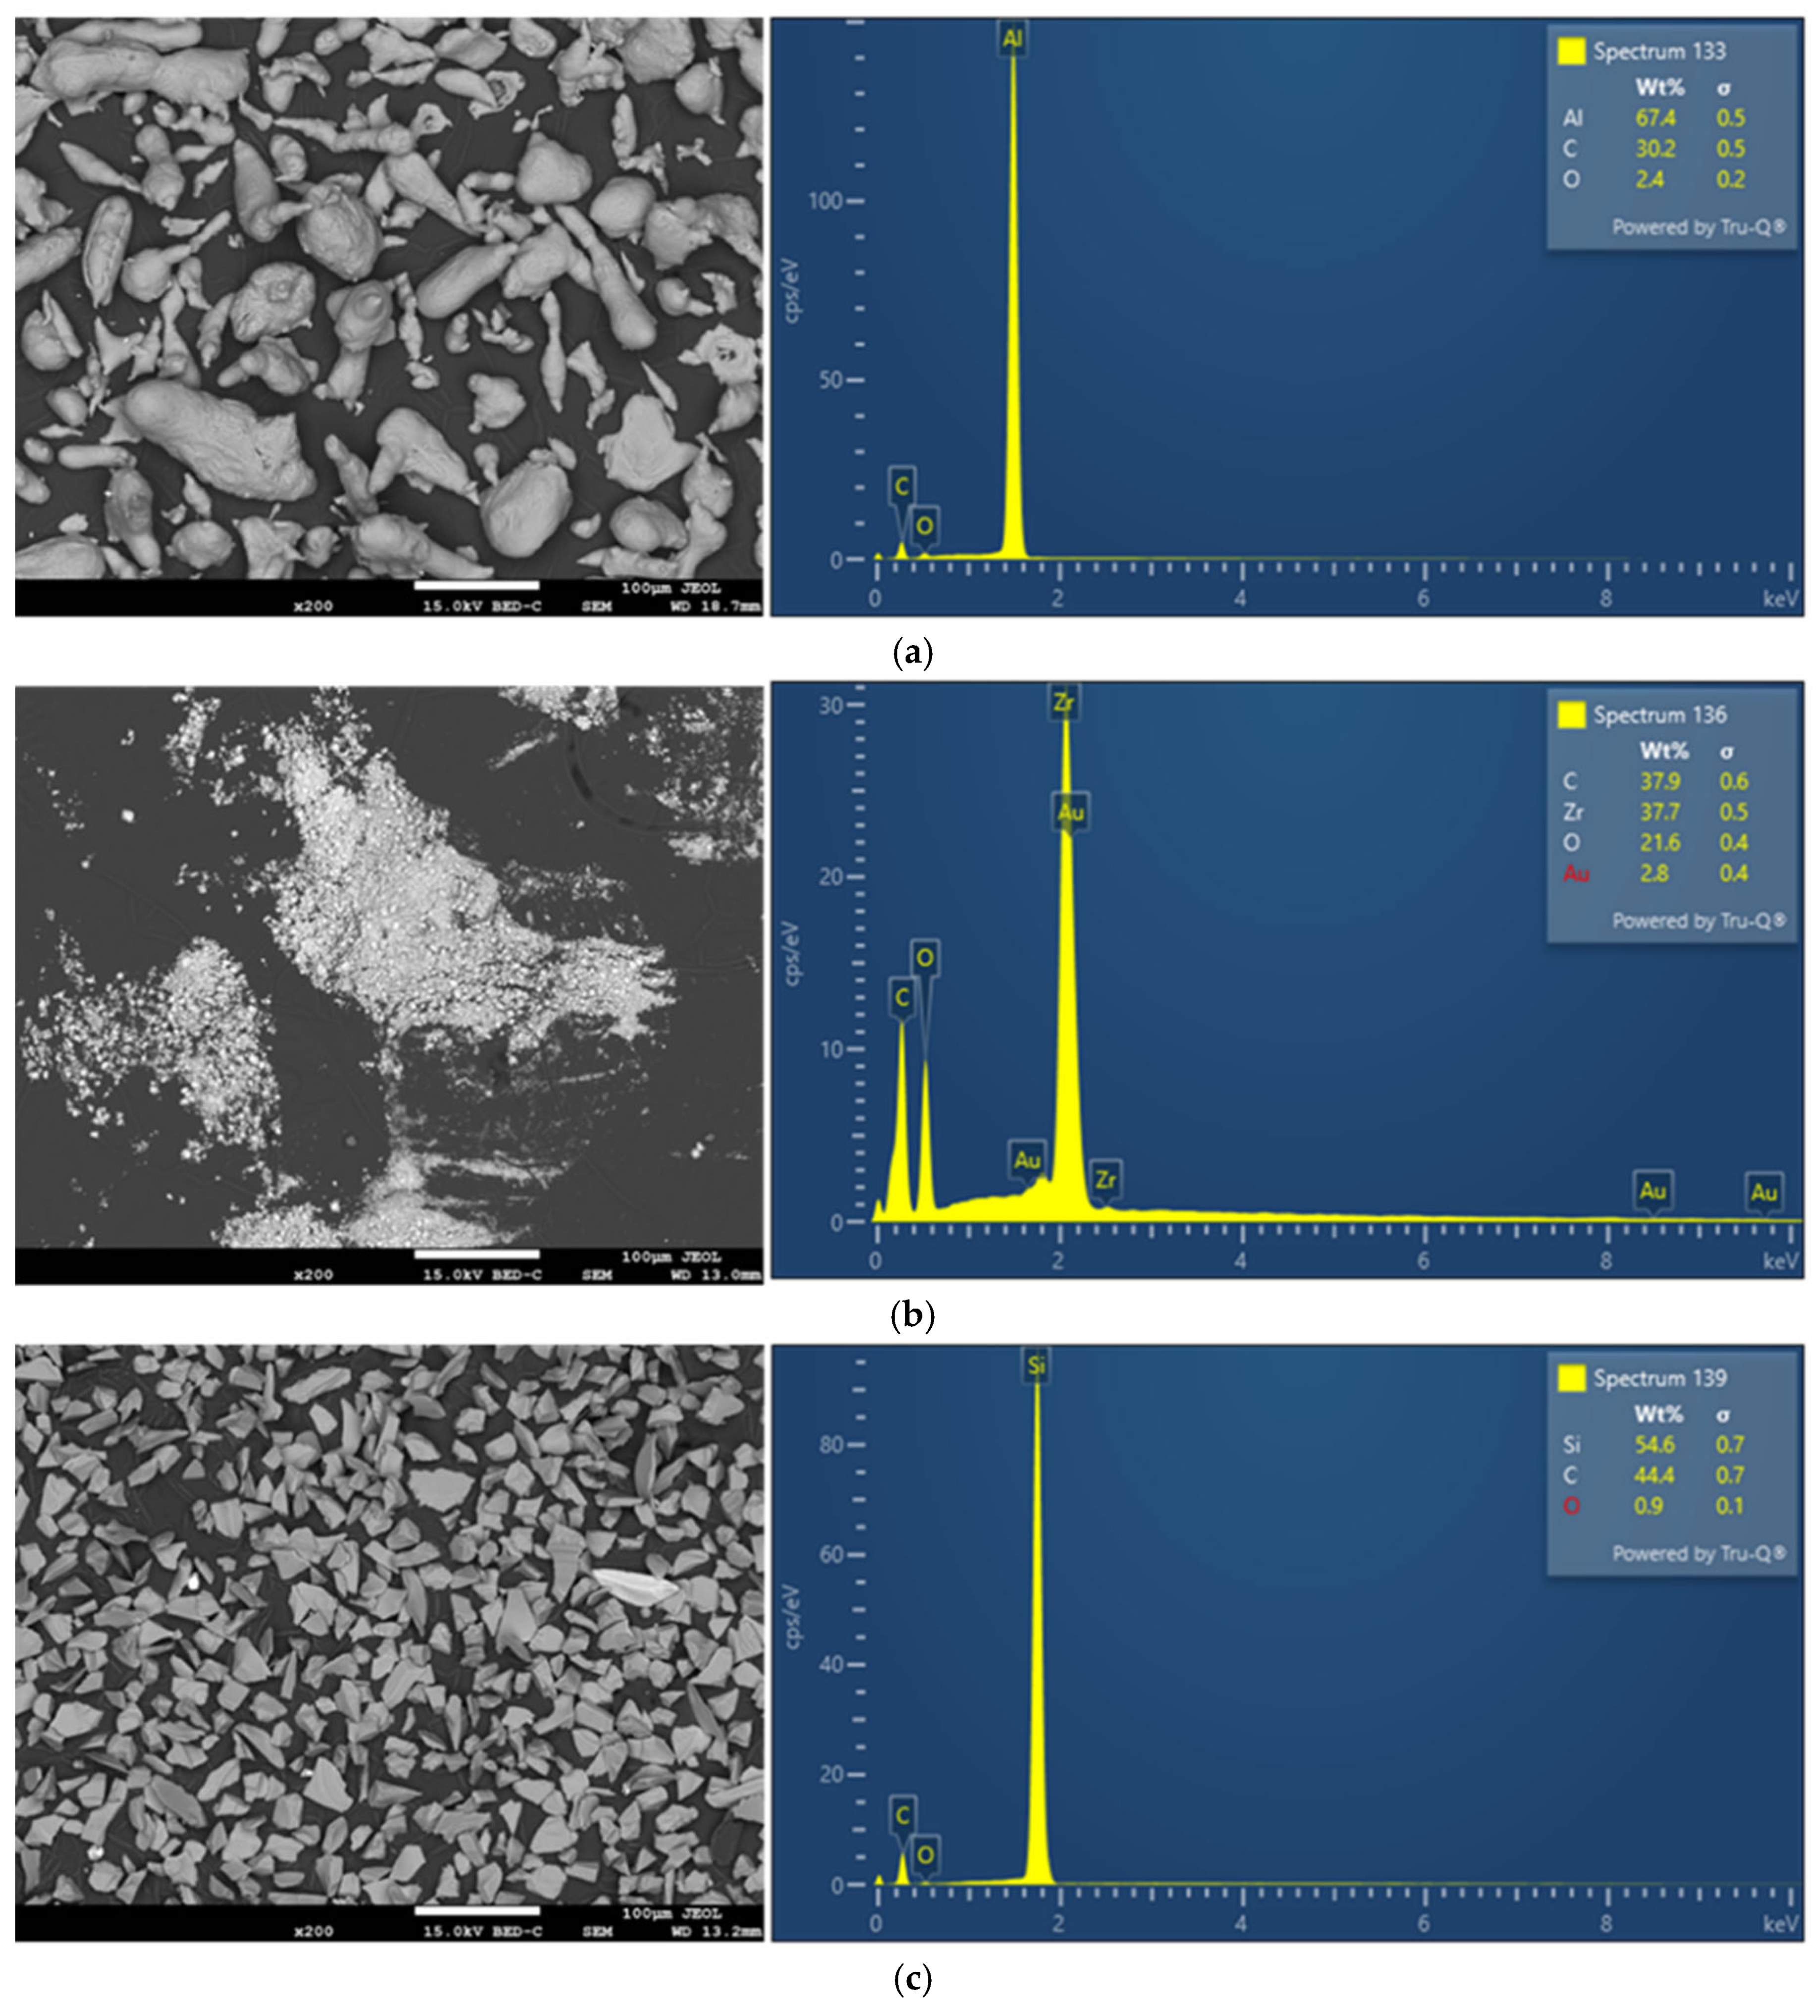
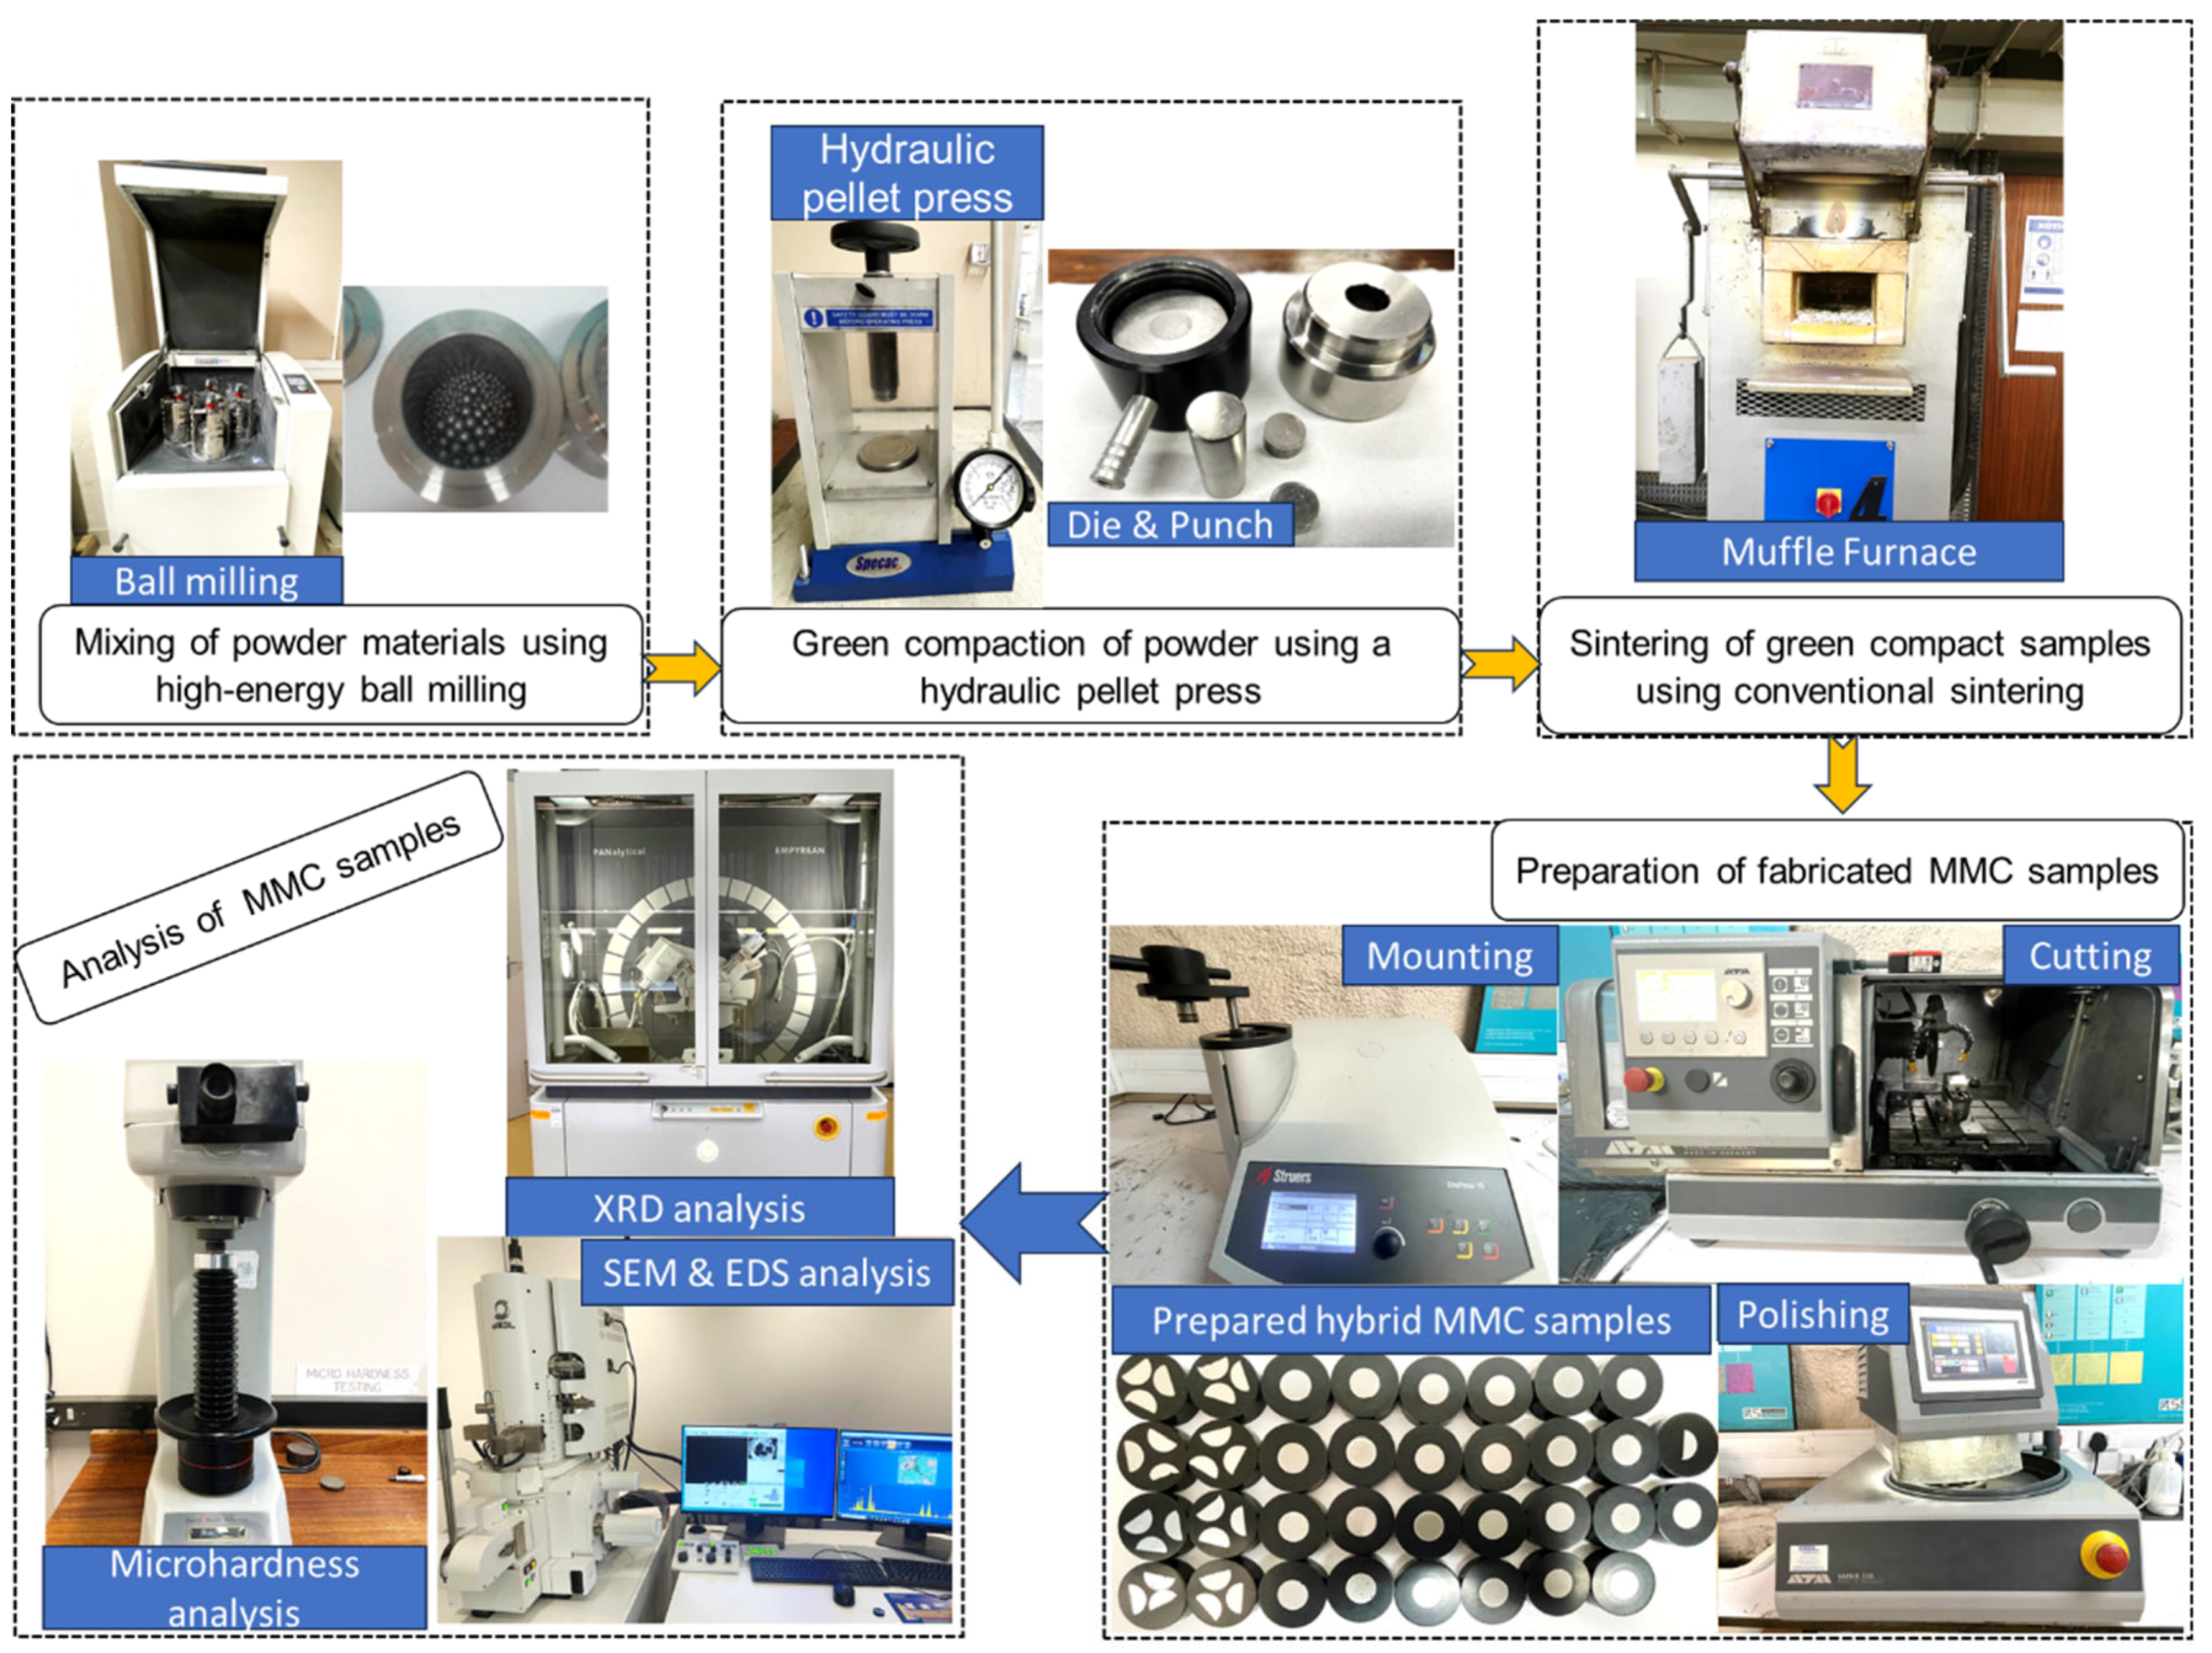
Figure 1 and Figure 2 depict the SEM with EDS analysis and elemental XRD analysis of the raw base matrix and reinforcement particles, respectively. Powder materials were mixed in a high-energy ball mill (Make: Retsch, Germany; Model: PM 400), followed by green compaction using a hydraulic pellet press at an applied pressure of 10 tons. Table 1 shows the fixed ball milling parameters used for the mixing of reinforcement particles with Al matrix materials. After the cold compression process, all the green compact samples underwent a sintering process. The conventional sintering process is more economical than the microwave and plasma arc sintering processes. The sintering operation was carried out using a muffle furnace, as indicated in Figure 3. Initially, all of the green compaction samples were kept inside the furnace at room temperature before turning on the furnace at a continuous heating rate of 10 °C per minute. After attaining the requisite temperature, the time was recorded, and the furnace was turned off according to the considered sintering timing. The samples were left inside the furnace to cool normally. The steps followed in this research work for the fabrication of MMCs are illustrated in Figure 3.
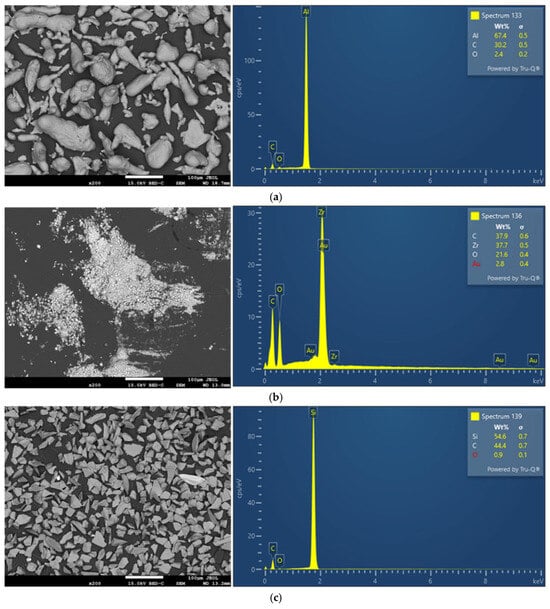
Figure 1.
SEM and EDS analysis of raw materials before fabrication of MMCs: (a) pure aluminum powder; (b) ZrO2; (c) SiC.
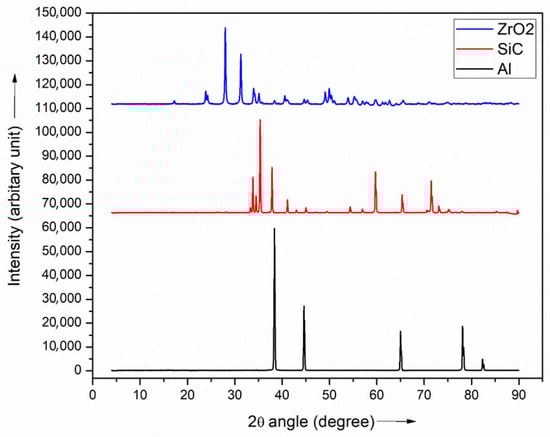
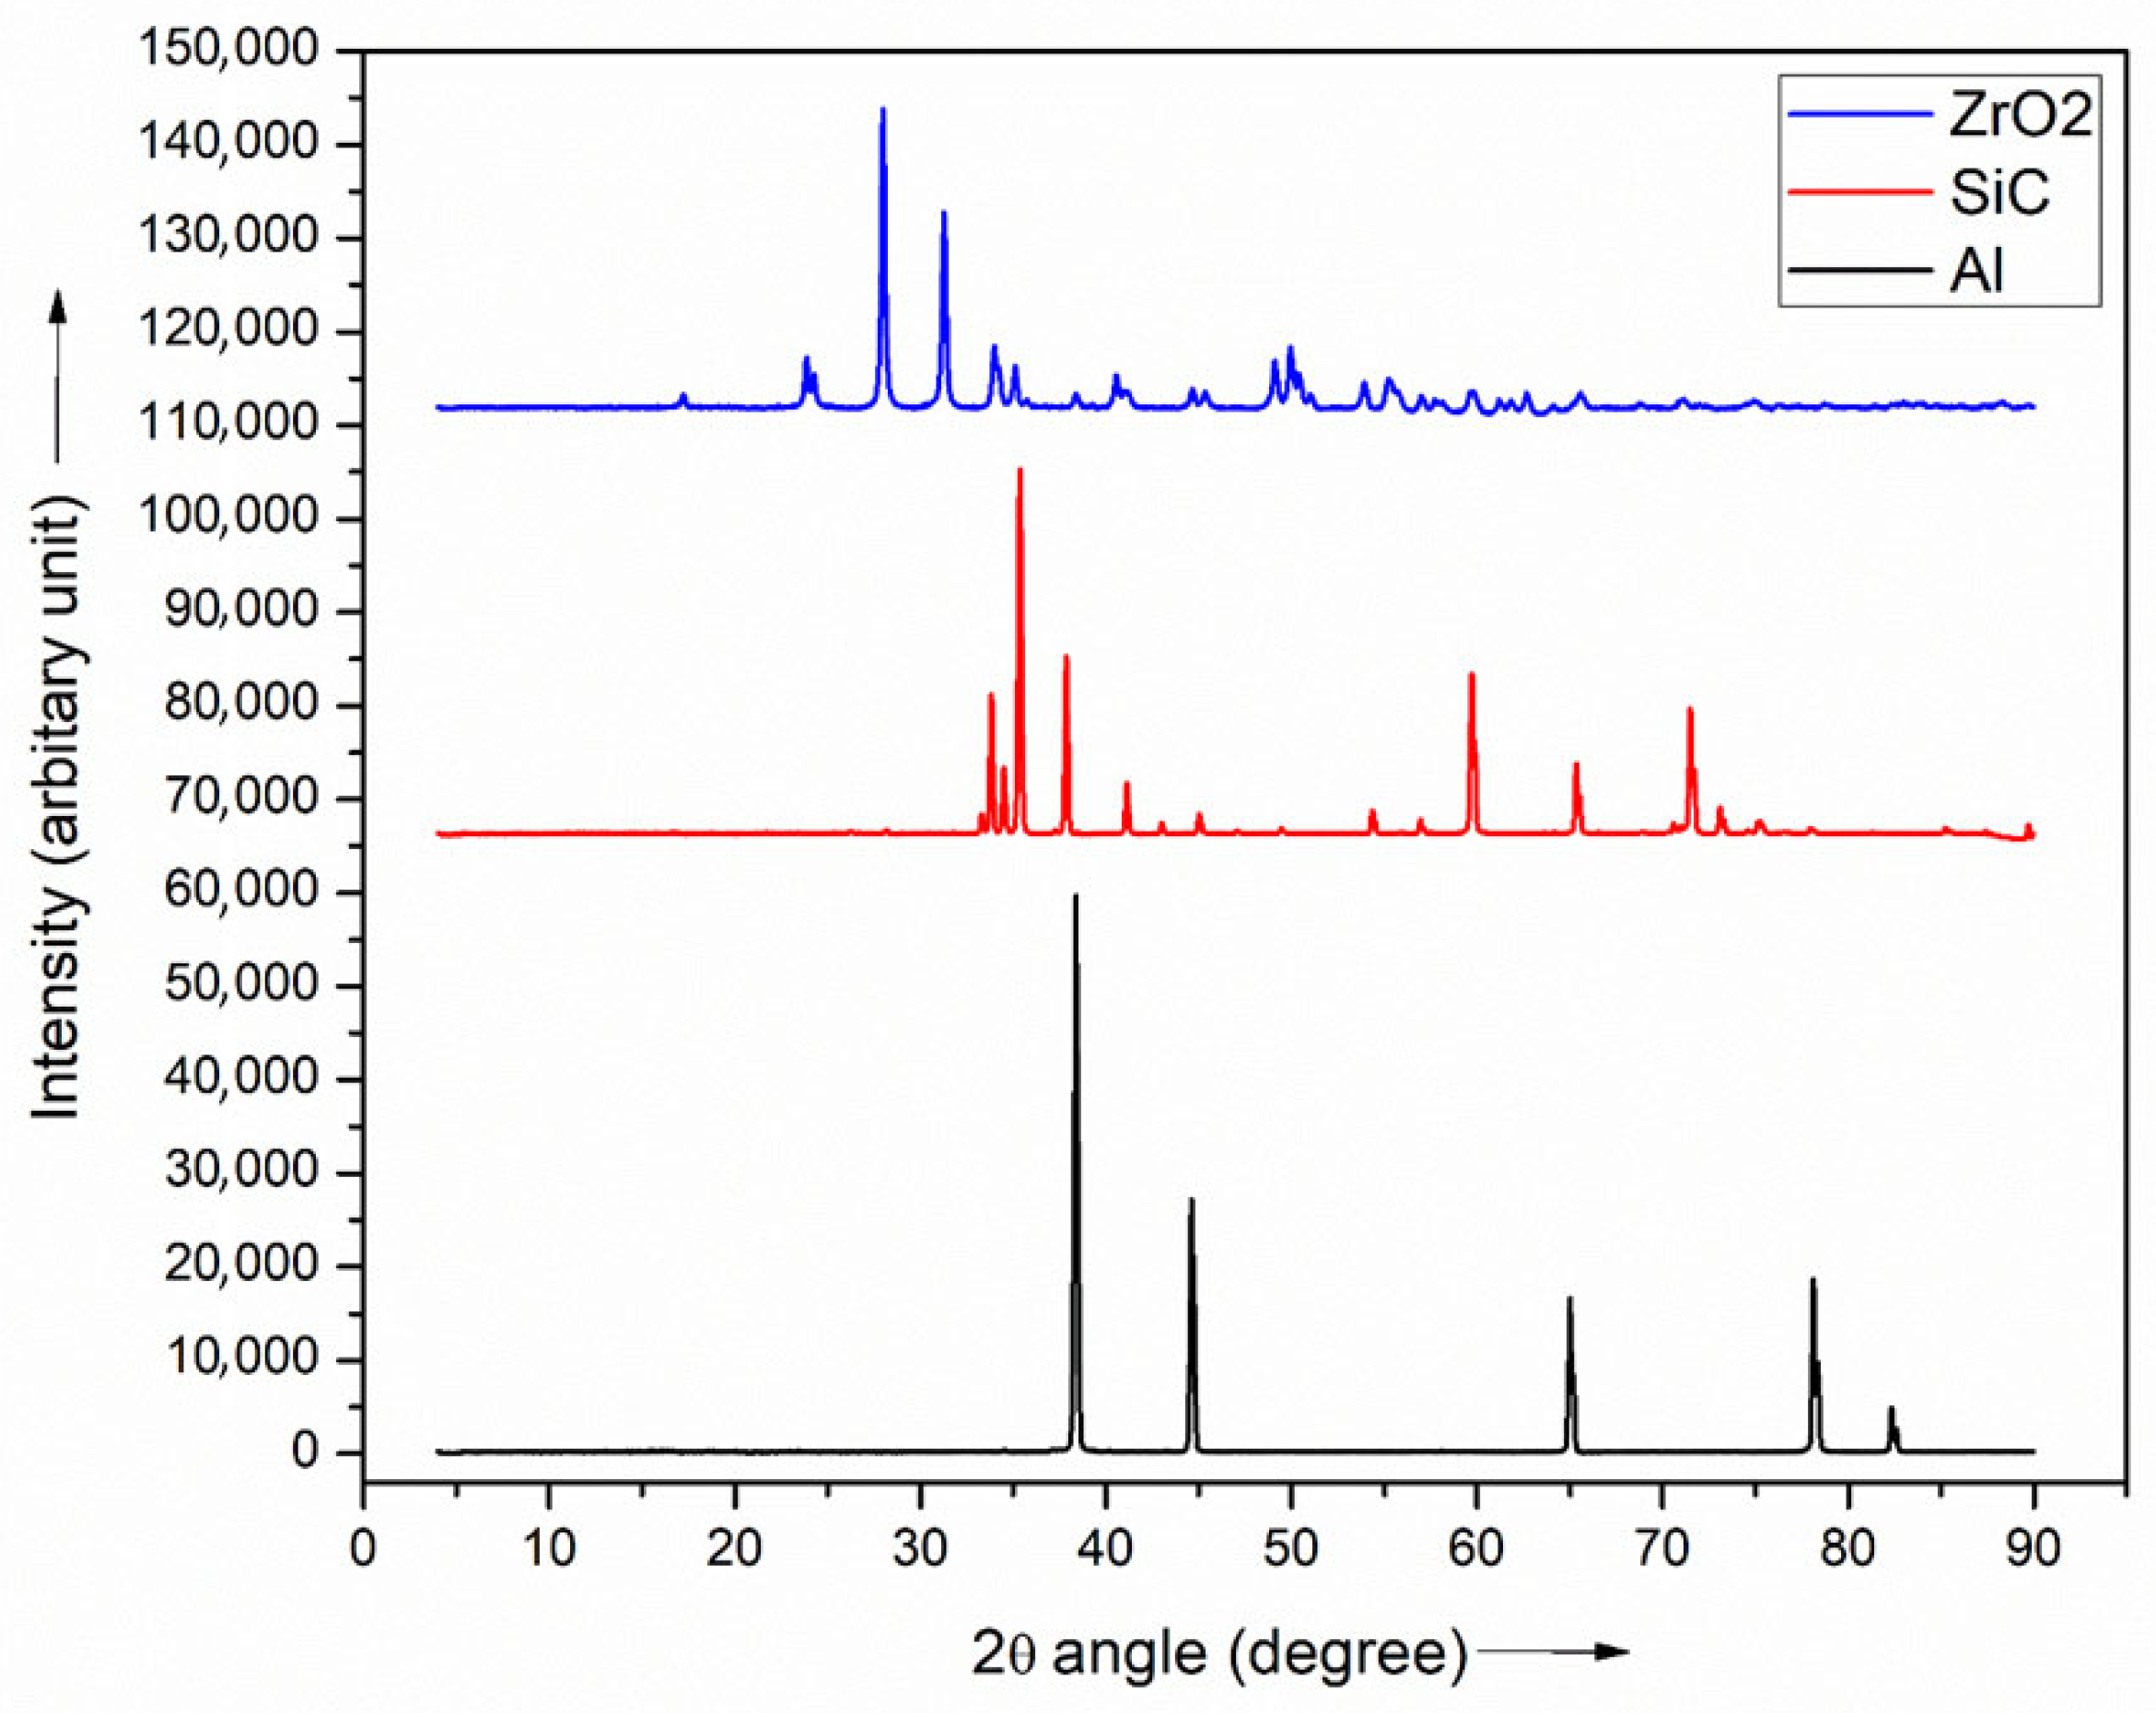
Figure 2.
XRD analysis of raw materials, pure aluminum powder, ZrO2, and SiC before fabrication of MMCs.

Table 1.
Constraints of the ball milling procedure.
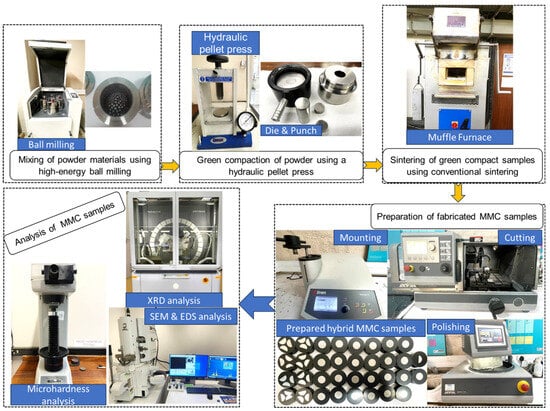
Figure 3.
Steps followed for fabrication of Al-SiC-ZrO2 MMCs.
The MMCs were fabricated by varying weight percentages (wt.%) of reinforcing particles for both SiC and ZrO2, milling time, conventional sintering temperature, and sintering time. Each varied at five levels. The selected process parameters with their levels as given in Table 2, were based on some preliminary experiments, review of past work, machine and equipment settings etc. Taguchi’s robust design of the experiment technique with L25 orthogonal array has been adopted. Table 3 presents 25 experimental combinations of the process parameters designed as per Taguchi technique.
Table 2.
Fabrication parameters for Al-based hybrid composites.
Table 3.
Experimental combinations for fabrication of Al-SiC-ZrO2 MMCs and corresponding values of microhardness.
The fabricated MMCs have dimensions of 15 mm in length and 13 mm in diameter. After their successful fabrication, MMCs were tested and characterized using a scanning electron microscope (SEM), X-ray diffractometer (XRD), and Vickers microhardness testing machine. To escalate the fabricated MMCs to characterization and testing, sample preparation was performed first. The fabricated MMC parts were first mounted in a hot mount machine (Make: Struers, Copenhagen, Denmark, Model: CitoPress-15) and then polished with abrasive papers and polishing cloths mounted on a grinding and polishing machine (ATM Saphir 500, Mammelzen, Germany) to attain a smooth and mirror-like surface finish. After polishing, MMCs were etched with Keller reagent for approximately 20 s to enhance the visibility of grains and grain boundaries. To stop the etching process, the samples were immersed in alcohol and then distilled water. The polished and fractured surfaces were next investigated using an SEM (Make: JEOL Ltd., Tokyo, Japan; Model:7900F) equipped with EDS. An X-ray diffractometer (Malvern Panalytical Empyrean, Malvern Panalytical Ltd., Malvern, UK) was used to analyze the elements in all raw and manufactured materials.
Hardness testing is a non-destructive approach utilized to examine consequences of fabrication parameters on the hardness of the fabricated composites. It is performed by applying a steady load through a diamond indenter on the polished surface of the specimen to generate an indentation on the surface. The Vickers hardness testing equipment, which has a 100 kgf load capacity with a diamond pyramid indenter, is employed to assess microhardness of the manufactured composites using the ASTM E 92 Standard [40]. The microhardness of the developed composites is determined with a 10 N applied load for a 10-s dwell time. An average value of five readings was recorded for each sample to reduce inaccuracies.
3. Results and Discussion
3.1. XRD Analysis
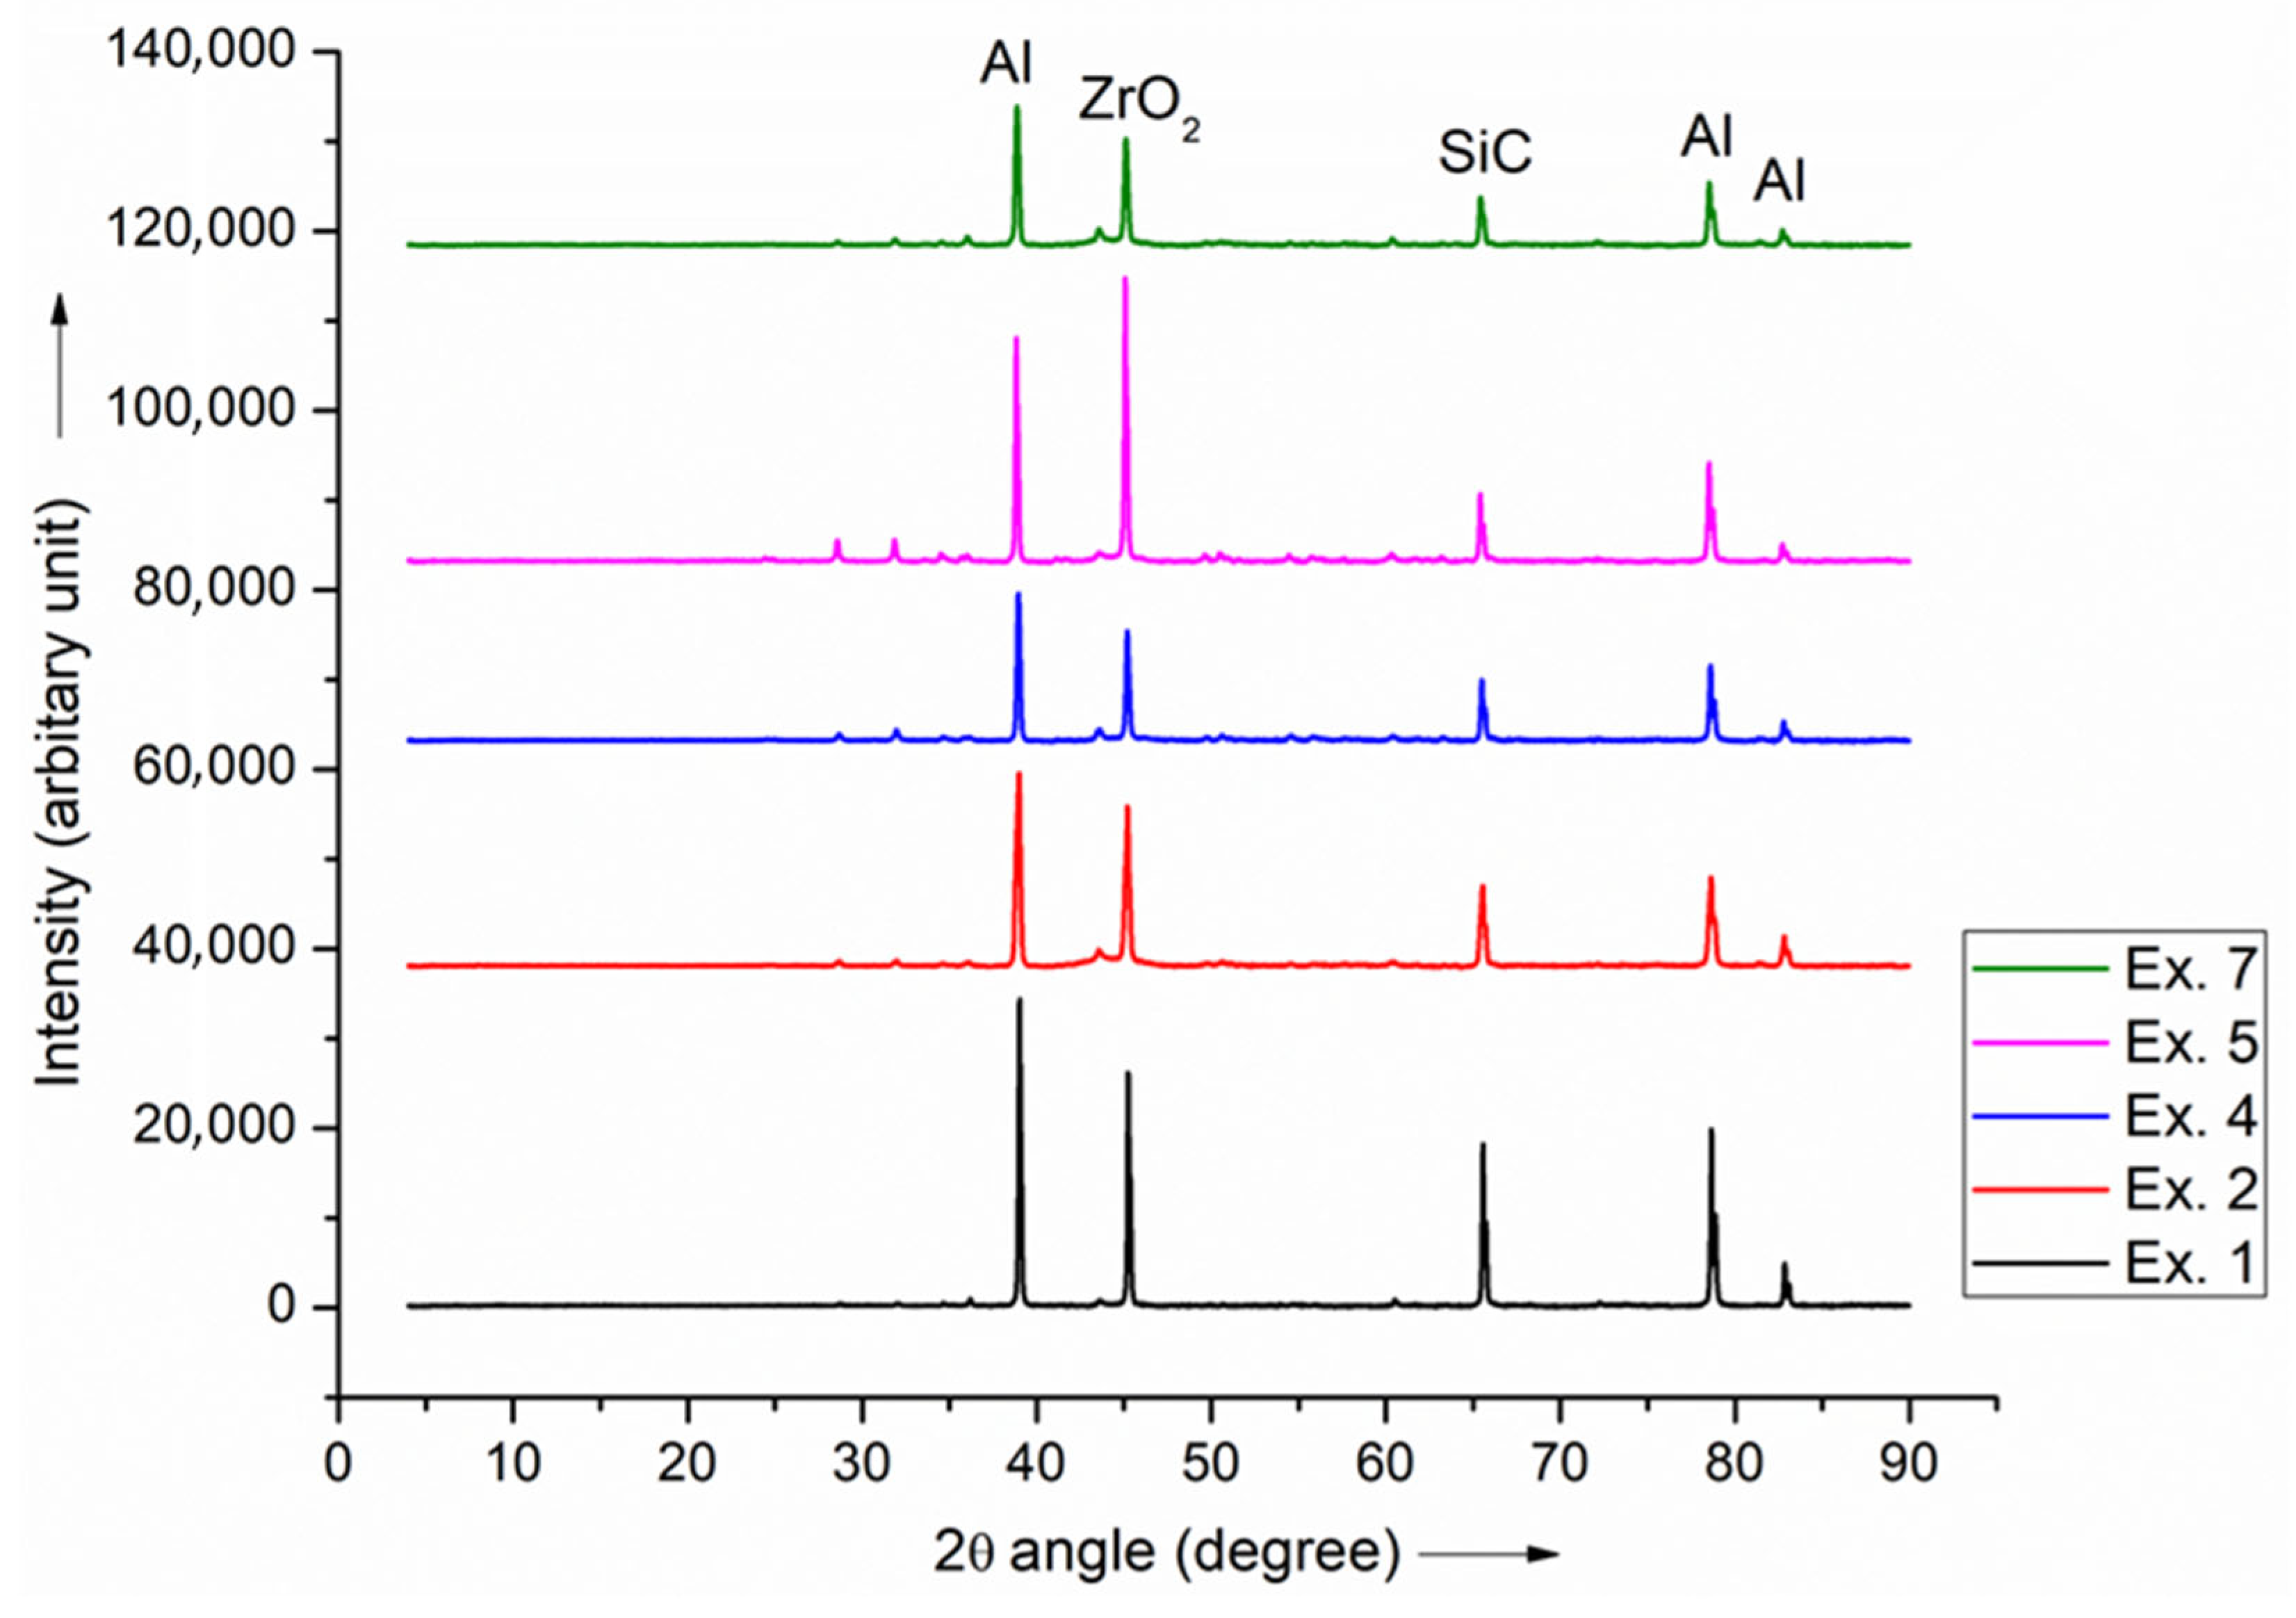
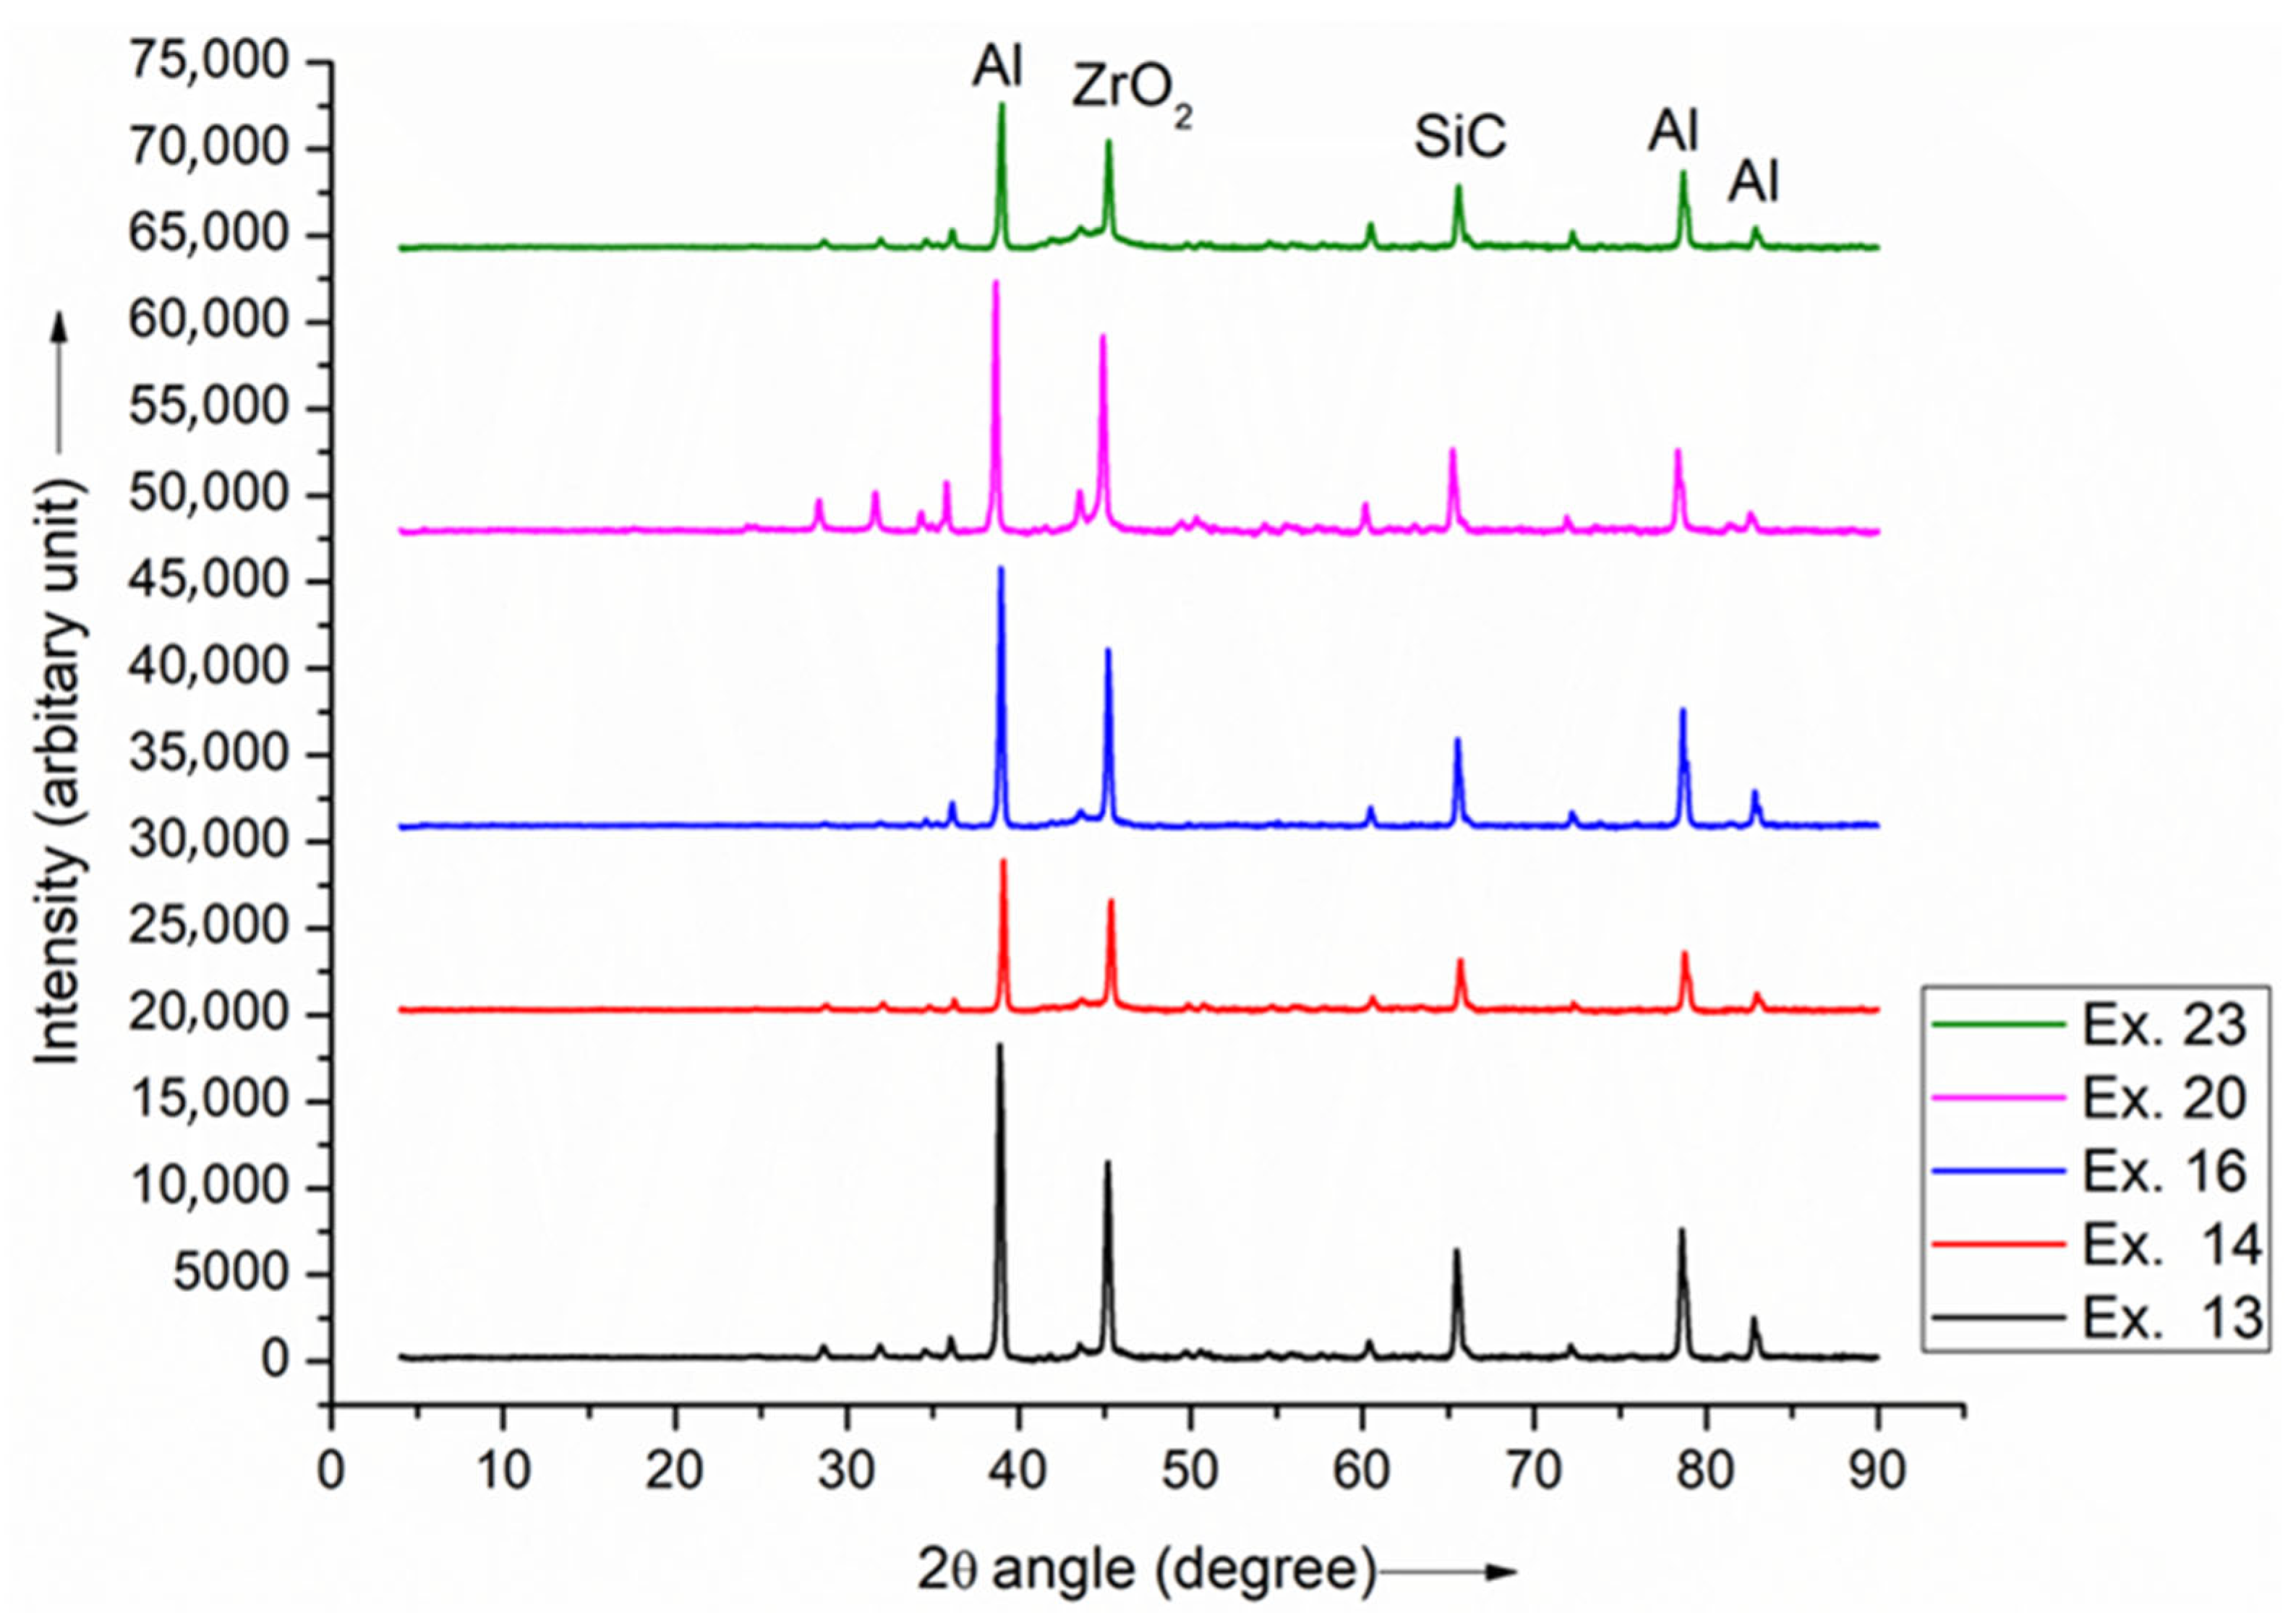
The elemental phases contained in the manufactured composites are examined with XRD on a fully hi-tech X-ray diffractometer (Malvern Panalytical, Malvern, UK). Three degrees per minute for 0.40 s is used to generate XRD spectrum at a two-degree angle between 5 and 90 degrees. Figure 4 depicts the XRD patterns of the fabricated MMC samples at various fabrication conditions. A similar type of XRD plot is observed, as illustrated in Figure 4, for all the fabrication conditions. The graph reveals that the aluminum matrix peaks dominate, and all the XRD plots satisfactorily show Al, SiC, and ZrO2 peaks, which reveals the acceptable fabrication with proper mixing and sintering of hybrid MMC products. It is found that the Al, SiC, and ZrO2 phases correlate to different peak angles as verified by using X’Pert High-Score software (Version 3.0, 2009) and from literature. To identify the existence of major and minor phases indicated by the diffraction pattern, using the software’s JCPDS cards and manually linked to the diffraction outline of all composites. The XRD patterns show that there are no additional phases or impurities, confirming the high purity of the manufactured composites under all fabrication conditions. Therefore, in Figure 4, the peaks corresponding to different phases are identified as SiC and ZrO2. The existence of SiC and ZrO2 in the Al-based MMCs is strongly connected with the occurrence of SiC and ZrO2 peaks in the XRD pattern.
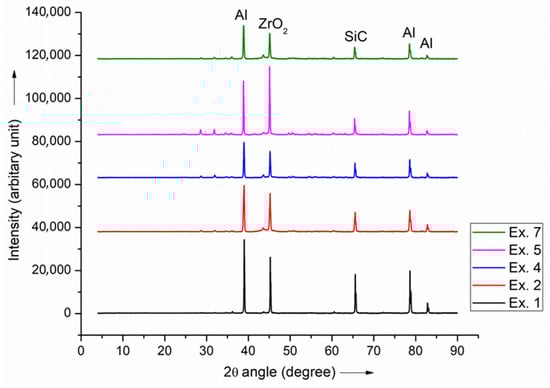
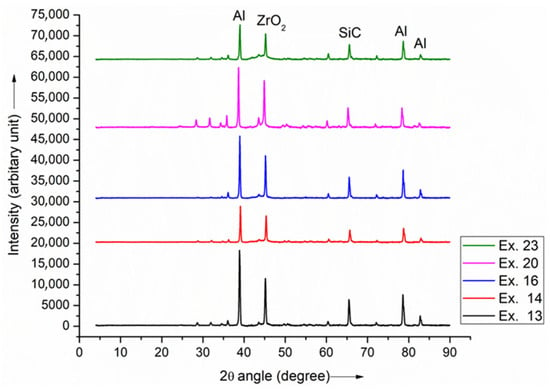
Figure 4.
XRD analysis of the fabricated hybrid MMCs under various fabrication conditions.
3.2. Morphological Analysis
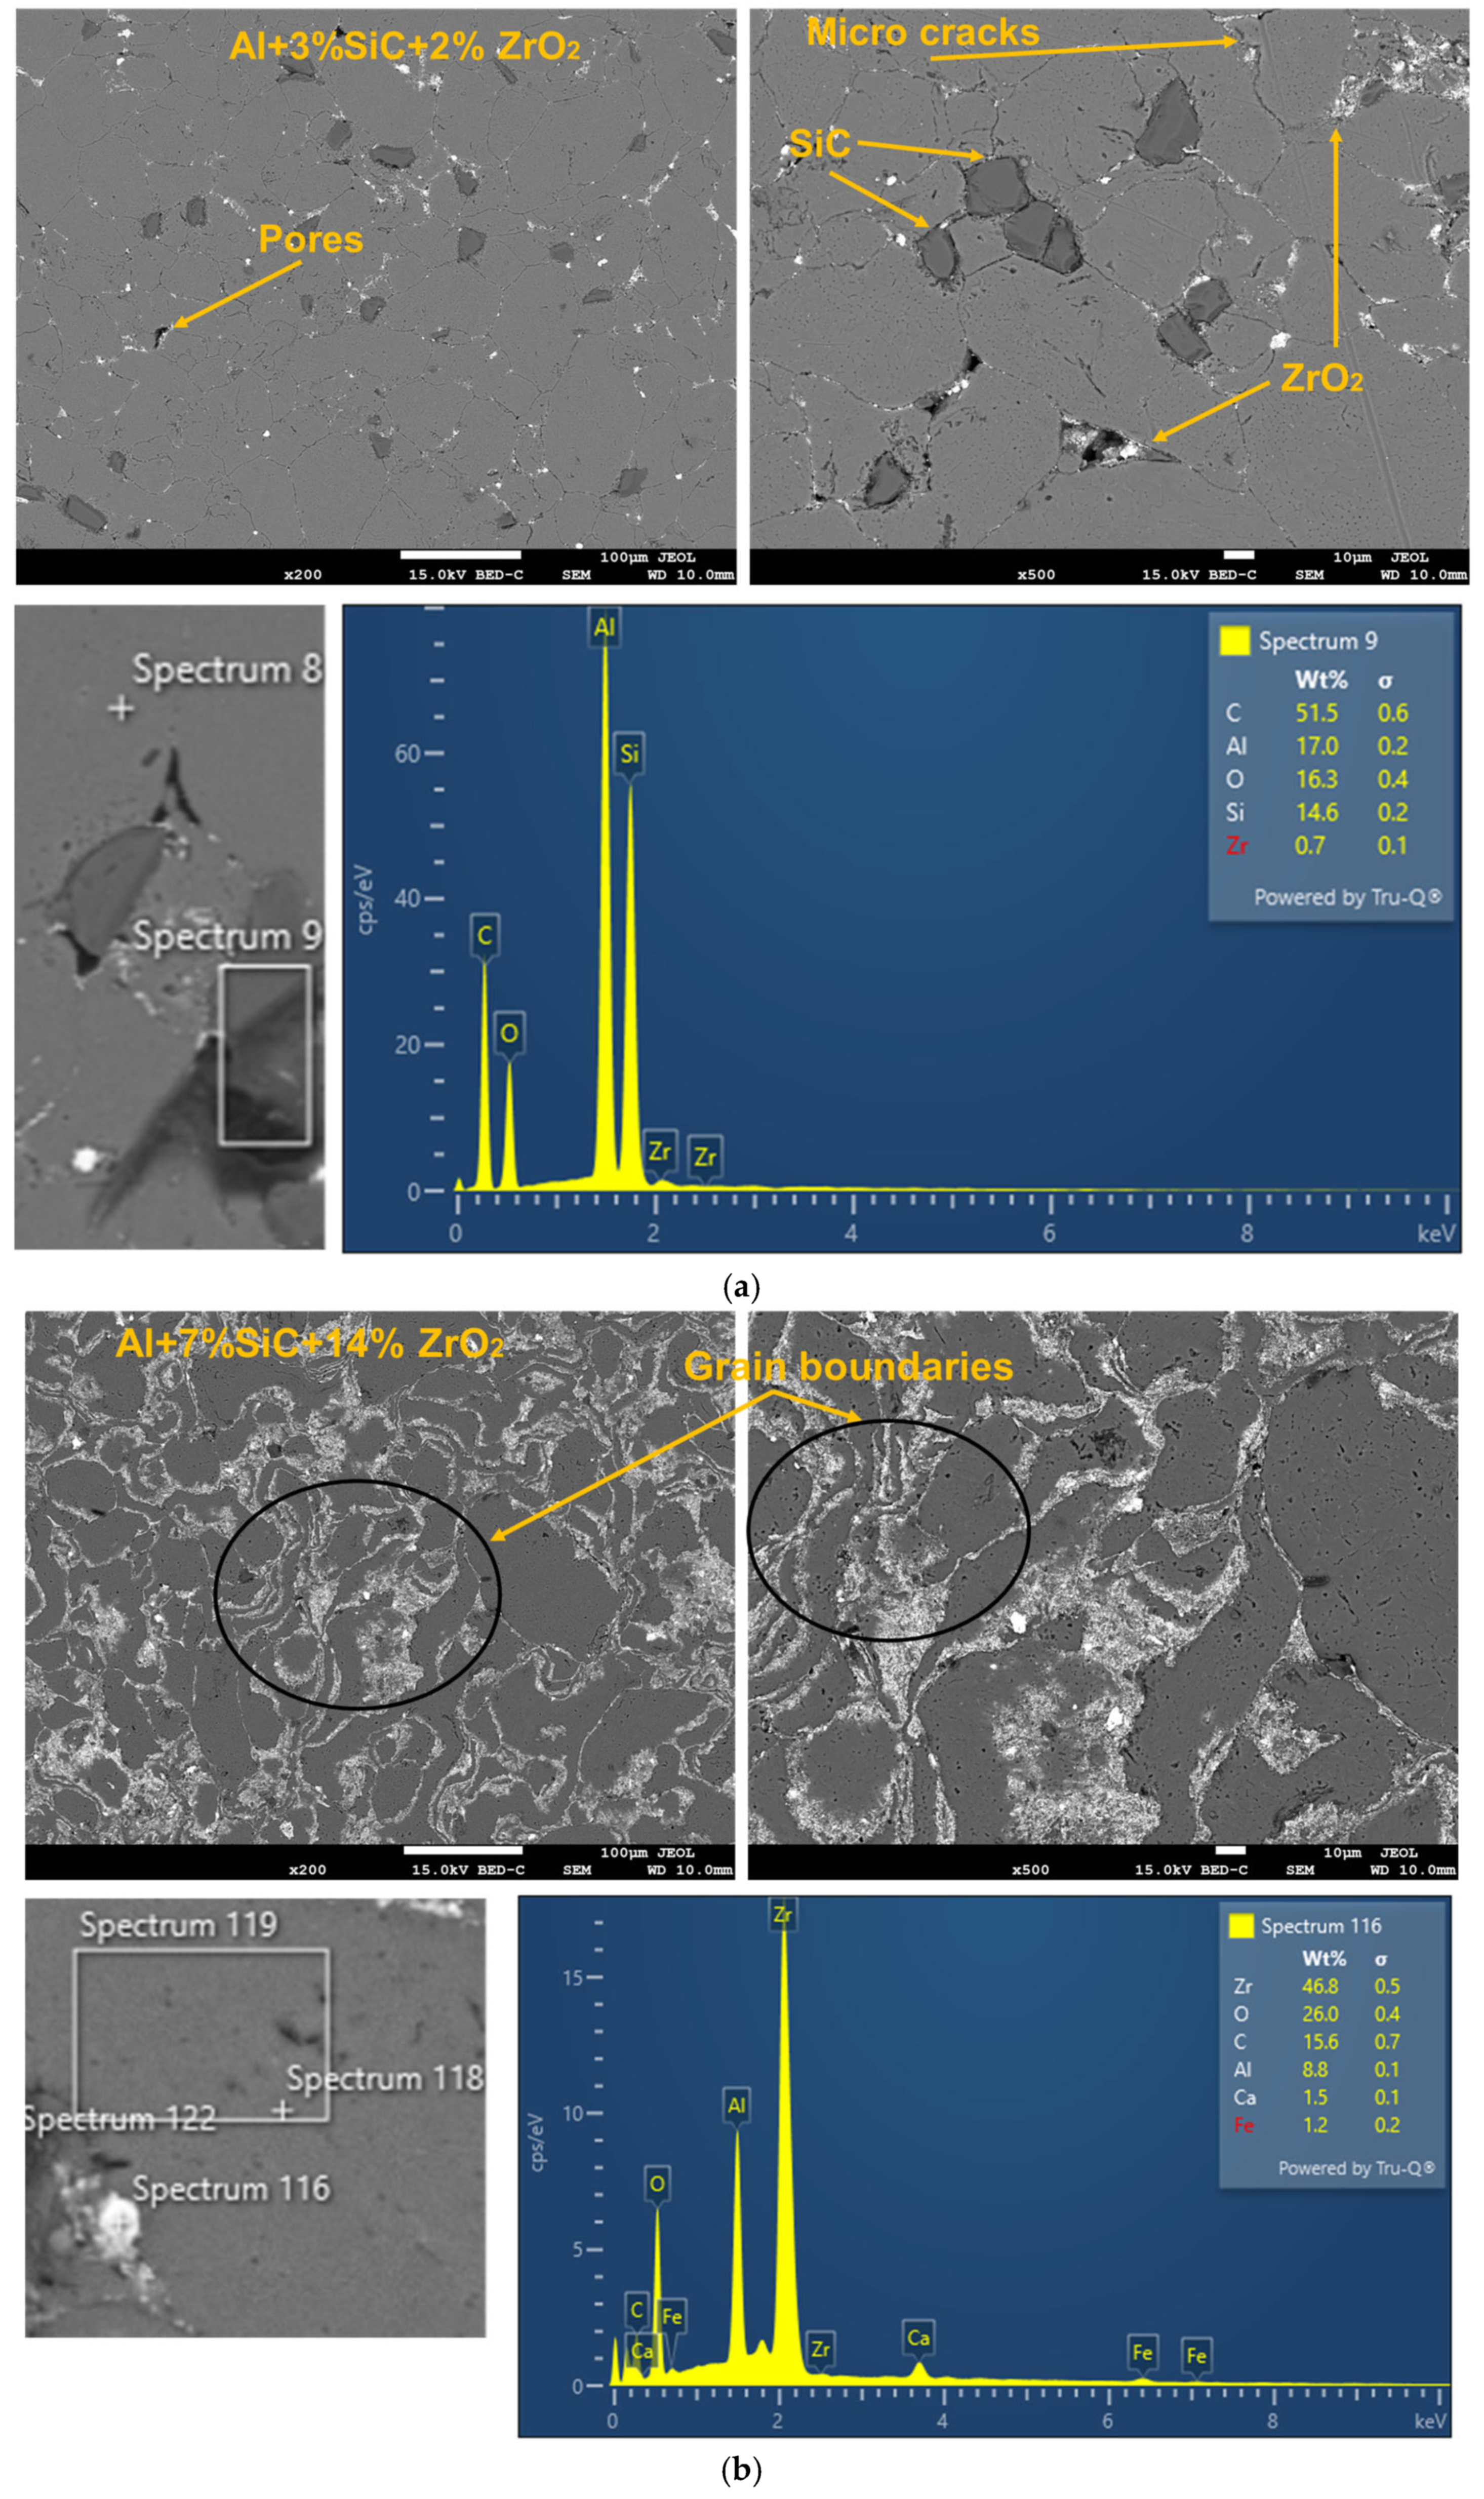
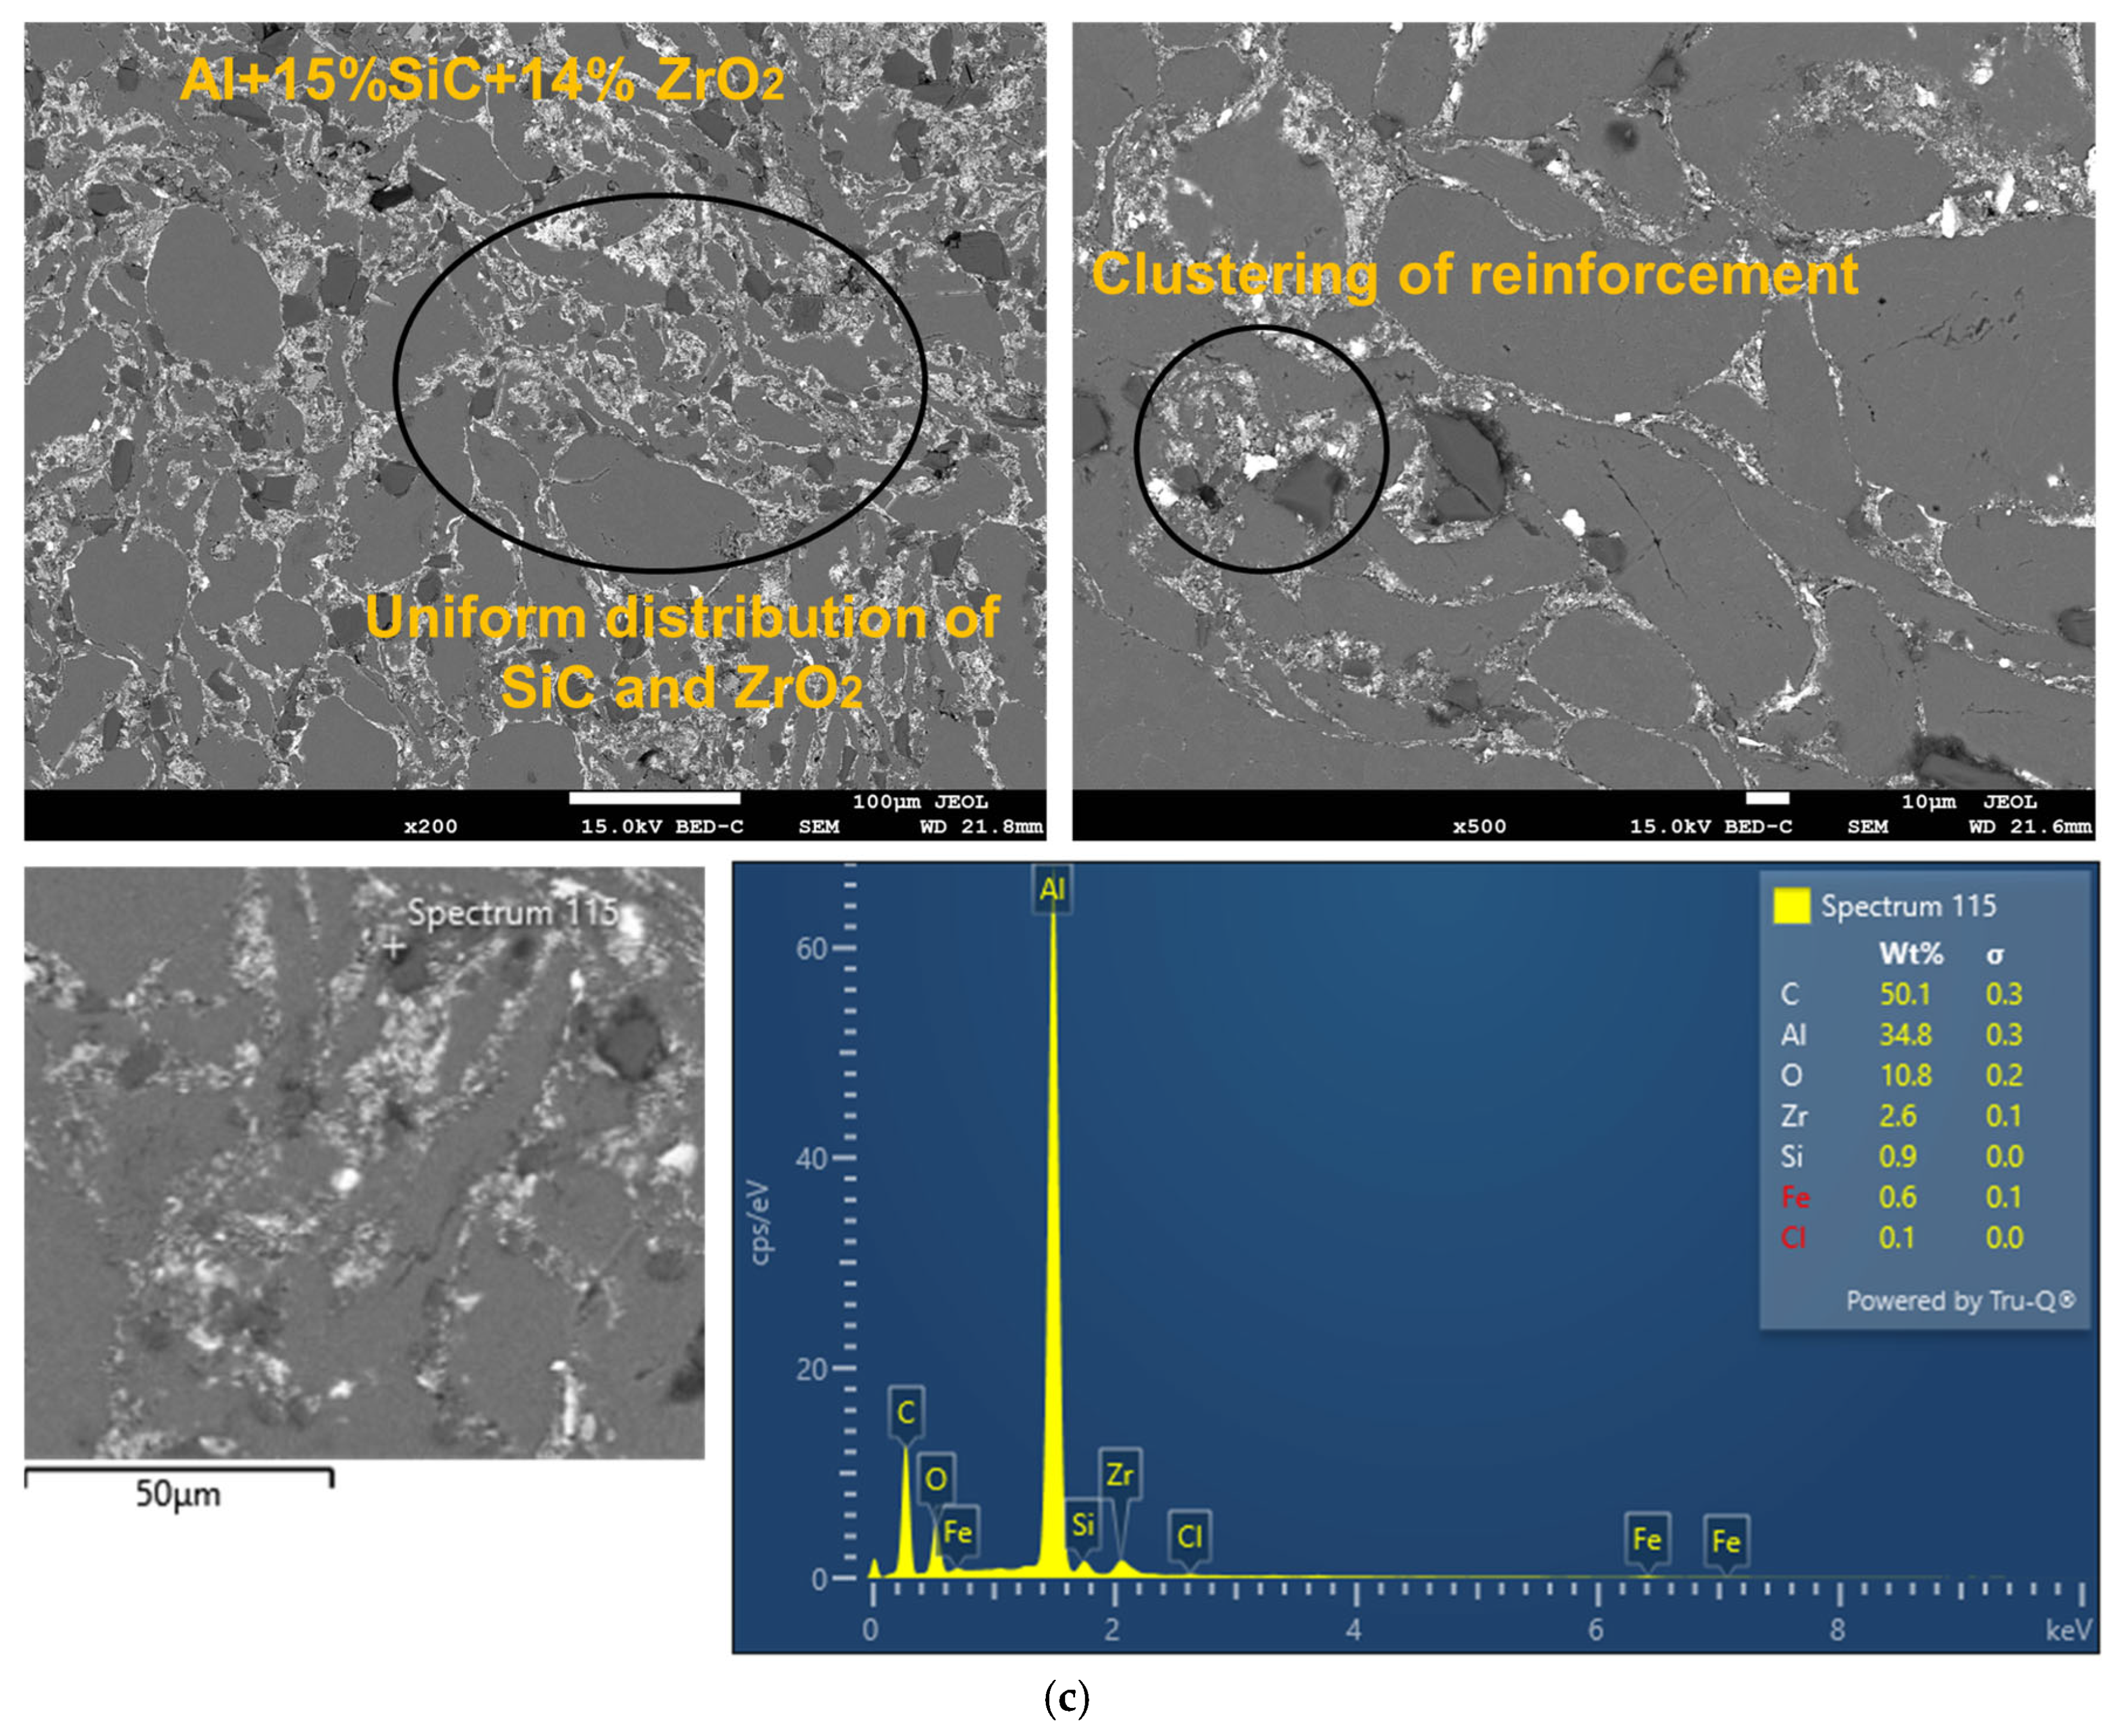
Microstructural studies of all fabricated MMCs are carried out after applying an etchant to polished samples. SEM analysis with EDS spectra is analyzed for 25 numbers of MMC samples fabricated under various conditions as mentioned in Table 3. Figure 5a–c depict SEM-EDS micrographs and grain size distributions of the manufactured hybrid Al-based composites, which were fabricated on various combinations of process parameters at two magnifications, i.e., 200× and 500×. Figure 5a presents the fabricated MMCs with 3wt.% of SiC and 2wt.% of ZrO2 at a milling time of 20 min, sintering temperature of 500 °C, and sintering time of 80 min, respectively. MMC with 7 wt.% of SiC and 14 wt.% of ZrO2 MMCs, fabricated at a milling time of 60 min, sintering temperature of 500 °C and 90 min sintering time is displayed in Figure 5b. At a milling time of 80 min, sintering temperature of 560 °C, and sintering time of 80 min, the MMC with 15wt.% of SiC and 14%ZrO2 is shown in Figure 5c. The SEM images demonstrate that the SiC and ZrO2 are equally dispersed across Al matrix, proving that high-energy ball milling is an effective way for milling powder mixtures. A homogeneous spreading of reinforcement elements over Al matrix composites is required for the enhanced characteristics of hybrid MMCs. The SEM investigation also reveals no significant agglomeration or other microstructural flaws. The presence of reinforcement particles with different colors, such as SiC (grey) and ZrO2 (white), as shown in Figure 5a is observed as homogeneous over the Al matrix for all the fabrication conditions. It was detected that the grains are properly aligned with grain borders and have been reinforced in such a way that dislocations cannot easily pass through. A larger region of grain boundaries can be seen in Figure 5b, indicating the occurrence of more interfacial precipitation. This strengthens the interfacial bonding and consequently enhances mechanical properties [2]. Higher sintering temperatures caused stronger consolidation of powder particles, as evident from Figure 5c. This consequently helps to achieve porosity levels [25]. However, greater sintering temperatures caused more interfacial precipitation, which is why the composite samples supplemented with higher wt.% of SiC and ZrO2 showed some agglomeration (Figure 5c). Porosity is a crucial factor in PM techniques, influencing composite mechanical characteristics and performance. Density, interfacial bonding, and metallographic defects such as porosity and microcracks all have an impact on the mechanical properties of hybrid composites. However, we observed relatively few microcracks and pores during the SEM study.
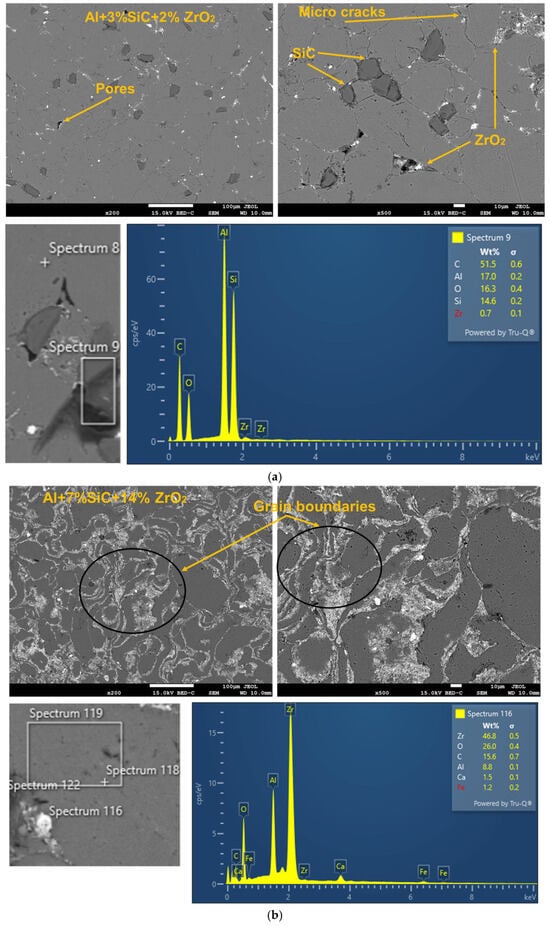
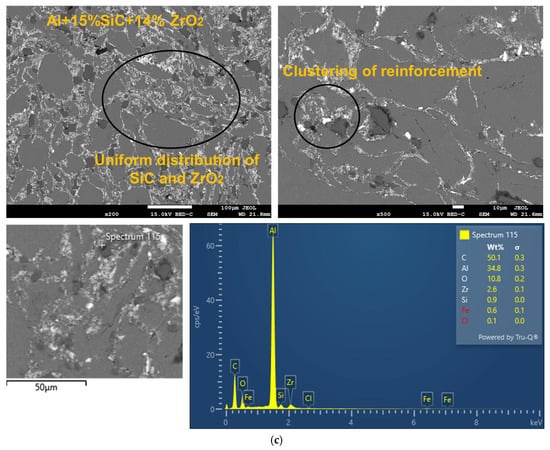
Figure 5.
SEM and EDS analysis of the fabricated MMCs at various fabrication conditions: (a) Expt. No. 1; (b) Expt. No. 10; (c) Expt. No. 20.
EDS spectra of all the fabricated MMCs are plotted as illustrated in Figure 5a–c. The inclusion of the Al matrix with SiC and ZrO2 reinforcement particles is confirmed at the EDS spectra of all the fabricated MMCs. According to the SEM-EDS and mapping in Figure 5, the precipitations are chemically composed of phases such as Al, Si, C, Zr, O, and Fe. In some of the EDS spectra, a smaller peak of Fe is present due to the normal washing of polished MMC samples after applying etchant to prevent the extra reaction. Apart from that, SEM-EDS results shown in Figure 5a–c prove the fabrication of favorable quality MMCs.
The reinforcement material and the degree of wettability between the aluminum matrix and the reinforcement particles have the greatest influence on the composites’ behavior. Therefore, from the morphological study of the fabricated MMCs in support of SEM-EDS spectra, it can be claimed that an effective hybridization of Al-based MMCs has been achieved by the PM route. The uniform spreading of reinforcement elements with an increase in wt.% of reinforcement is also observed in the SEM images in Figure 5a–c. Ball milling facilitates fine and mixed particle sizes, which contribute to the enhanced physical properties of hybrid Al-SiC-ZrO2 composites. During milling, high-energy balls impact powder particles, shattering bigger particles into smaller ones. Furthermore, the plastic deformation that happens during the ball milling process caused a shift in grain morphology (Figure 5b), strain hardening, and higher dislocation density. Overall, from the microstructure study, fine and mixed grain sizes were observed for all the fabricated MMCs which exhibit superior packing and alignment. This improves the physical characteristics of composites by making them stronger and more difficult for a dislocation to spread.
3.3. Microhardness Analysis
Table 3 presents the results of the Vickers hardness at various combinations of process parameters. As evident in Table 3, fabrication condition 10 produced the greatest microhardness value of 86.6 HVN, while fabrication condition 14 offers the lowest hardness of 30.6 HVN. The microhardness values of all MMCs at 25 fabrication conditions are shown in Figure 6. The hybrid Al-based composite that has the optimal hardness value was fabricated at 7 wt.% SiC and 14 wt.% ZrO2, milling time of 60 min, the sintering temperature of 500 °C, and sintering time of 90 min.
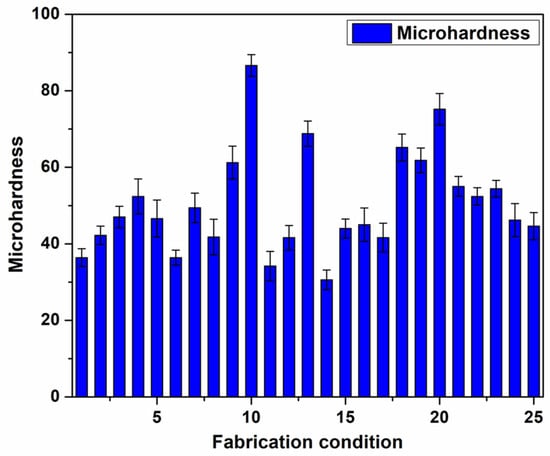
Figure 6.
Microhardness results for all fabrication conditions.
The hardness of the hybrid Al-based composites is significantly affected by the combination of properties of reinforcements and values of fabrication parameters. To achieve the desired mechanical properties, interparticle welding in the composites is required to be attained by optimal mixing and sintering [38,39,41,42]. When the reinforcing percentage was increased, reinforcement particles clustered together. This clustering can result in non-uniform reinforcement distribution and degradation of hybrid composites, altering the material’s mechanical properties. Fewer microcracks and pores were discovered in hybrid composites during SEM analysis. However, when the weight percentage grew, there were fewer cracks and pores. In the present work, ball milling ensured optimal refining and mixing of powder particles, which improved composite hardness as per Figure 5 and Figure 6. During milling, high-energy balls strike powder particles, fracturing larger particles into smaller ones. Stronger powder particle consolidation at a higher sintering temperature of 560 °C resulted in lower porosity levels, as evident in Figure 5c, which consequently improved the hardness of the composites. The SEM-EDS results shown in Figure 5b depict precipitate distribution across grain boundaries. The degree of wettability amid Al matrix and reinforcement determines the hardness of MMCs. The SEM images in Figure 5c show a consistent spreading of reinforcement elements over the Al matrix. The increased hardness is also related to the homogeneity of powder particles, which is achieved through high-energy ball milling. Particle agglomeration decreases hardness by widening pores, causing microcracks, and weakening interfacial bonding (Figure 5c). Particle agglomeration is unavoidable when large amounts of reinforcing particles are used.
Furthermore, plastic deformation occurred throughout the ball milling process, resulting in a shift in grain shape, strain hardening, and increased dislocation density as observed in the SEM image in Figure 5b. Fine and mixed grain sizes improved packing and alignment, making it more difficult for dislocations to spread and therefore enhancing hardness as observed in SEM images of Figure 5b,c.
4. Modeling for Microhardness
4.1. Integrated Particle Swarm Optimization–Support Vector Machine (PSO-SVM)
The Support Vector Machine (SVM) is a type of supervised machine learning technique that is commonly used for classification and regression problems. The SVM was initially developed to solve pattern recognition issues, but was later modified to handle non-linear regression by introducing the ε-insensitive loss function [38]. The core principle of SVMs is to find an optimal hyperplane that maximizes the margin between data points from different classes in classification or minimizes prediction errors within a specified tolerance in regression.
For regression tasks, the objective is to minimize the following cost function:
Theme to:
where:
: Weight vector defining the hyperplane.
: Bias term.
: The mapping function transforms input data into a higher-dimensional space.
: Tolerance level for prediction errors.
: Regularization parameter controlling the trade-off between model complexity and training error.
: Slack variables accounting for deviations beyond “ε”.
For non-linear problems, SVMs employ kernel functions such as linear, polynomial, radial basis function (RBF), or sigmoid kernels to map input data into higher-dimensional spaces where linear separation becomes feasible. The RBF kernel, commonly used for its flexibility, is defined as:
where controls the influence of individual training samples.
This ability to model complex, non-linear relationships makes SVMs particularly effective in small-sample scenarios [37]. Despite their strengths, SVMs face challenges, including long training times and sensitivity to hyperparameter selection. Hyperparameters are a predefined set of parameters or values established before a model’s training, guiding the learning process. Selecting the appropriate set of hyperparameters is crucial, as it directly influences the model’s accuracy and overall performance [43,44]. Key hyperparameters, such as the regularization parameter C, kernel type, and kernel-specific parameters (e.g., γ for RBF kernels), significantly influence model performance. Poorly chosen hyperparameters can lead to overfitting, underfitting, or suboptimal generalization.
To address the limitations of manual hyperparameter tuning in SVM, optimization algorithms like PSO have been integrated to automate and enhance the selection process. PSO is a population-based metaheuristic algorithm inspired by the social behavior of biological groups, such as bird flocking or fish schooling [37]. It operates by iteratively updating a population of candidate solutions, known as “particles,” in a multidimensional search space. Each particle adjusts its position based on its own experience (personal best, ) and the collective experience of the swarm (global best, ), enabling efficient exploration and exploitation of the solution space:
where:
: Velocity of particle “i” at iteration “t”.
: Position of particle “i” at iteration “t”.
: Inertia weight controlling exploration vs. exploitation.
: Cognitive and social acceleration coefficients.
: Random values between 0 and 1.
In the context of SVM, PSO is used to optimize hyperparameters such as C, γ, and the choice of kernel function. By formulating the hyperparameter selection problem as an optimization task, PSO seeks to minimize a predefined objective function, such as prediction error or cross-validation loss. This hybrid approach, referred to as integrated PSO-SVM, combines the robust modeling capabilities of SVMs with the global search efficiency of PSO, resulting in improved accuracy and generalization.
4.2. Implementation and Evaluation of PSO-SVM Model
Before applying soft computing techniques like PSO-SVM, experimental data is typically separated into two sets: a training dataset to develop the model and a testing dataset to evaluate its performance. Common training-to-testing ratios include 90:10, 85:15, and 80:20, ensuring the entire dataset is effectively utilized. To avoid potential biases associated with sequential data splitting, a mixed selection approach was adopted to partition the dataset into training (80%) and testing (20%) subsets. This method ensured that both subsets encompassed the full range of input parameter levels. Specifically, experimental runs 1, 7, 13, 19, and 25 were designated for testing (validation), while the remaining experiments were used for model training. This approach supports more robust model training and reliable performance evaluation. The key configuration settings for the PSO optimization and SVR model used in this study are summarized in Table 4 and Table 5, respectively.
Table 4.
PSO Configuration for SVR Hyperparameter Optimization.
Table 5.
SVM Model Settings.
Furthermore, the PSO algorithm optimized the hyperparameters, and found best values of C = 97.6576 and Epsilon = 1.7525, enhancing the model’s predictive accuracy and reliability.
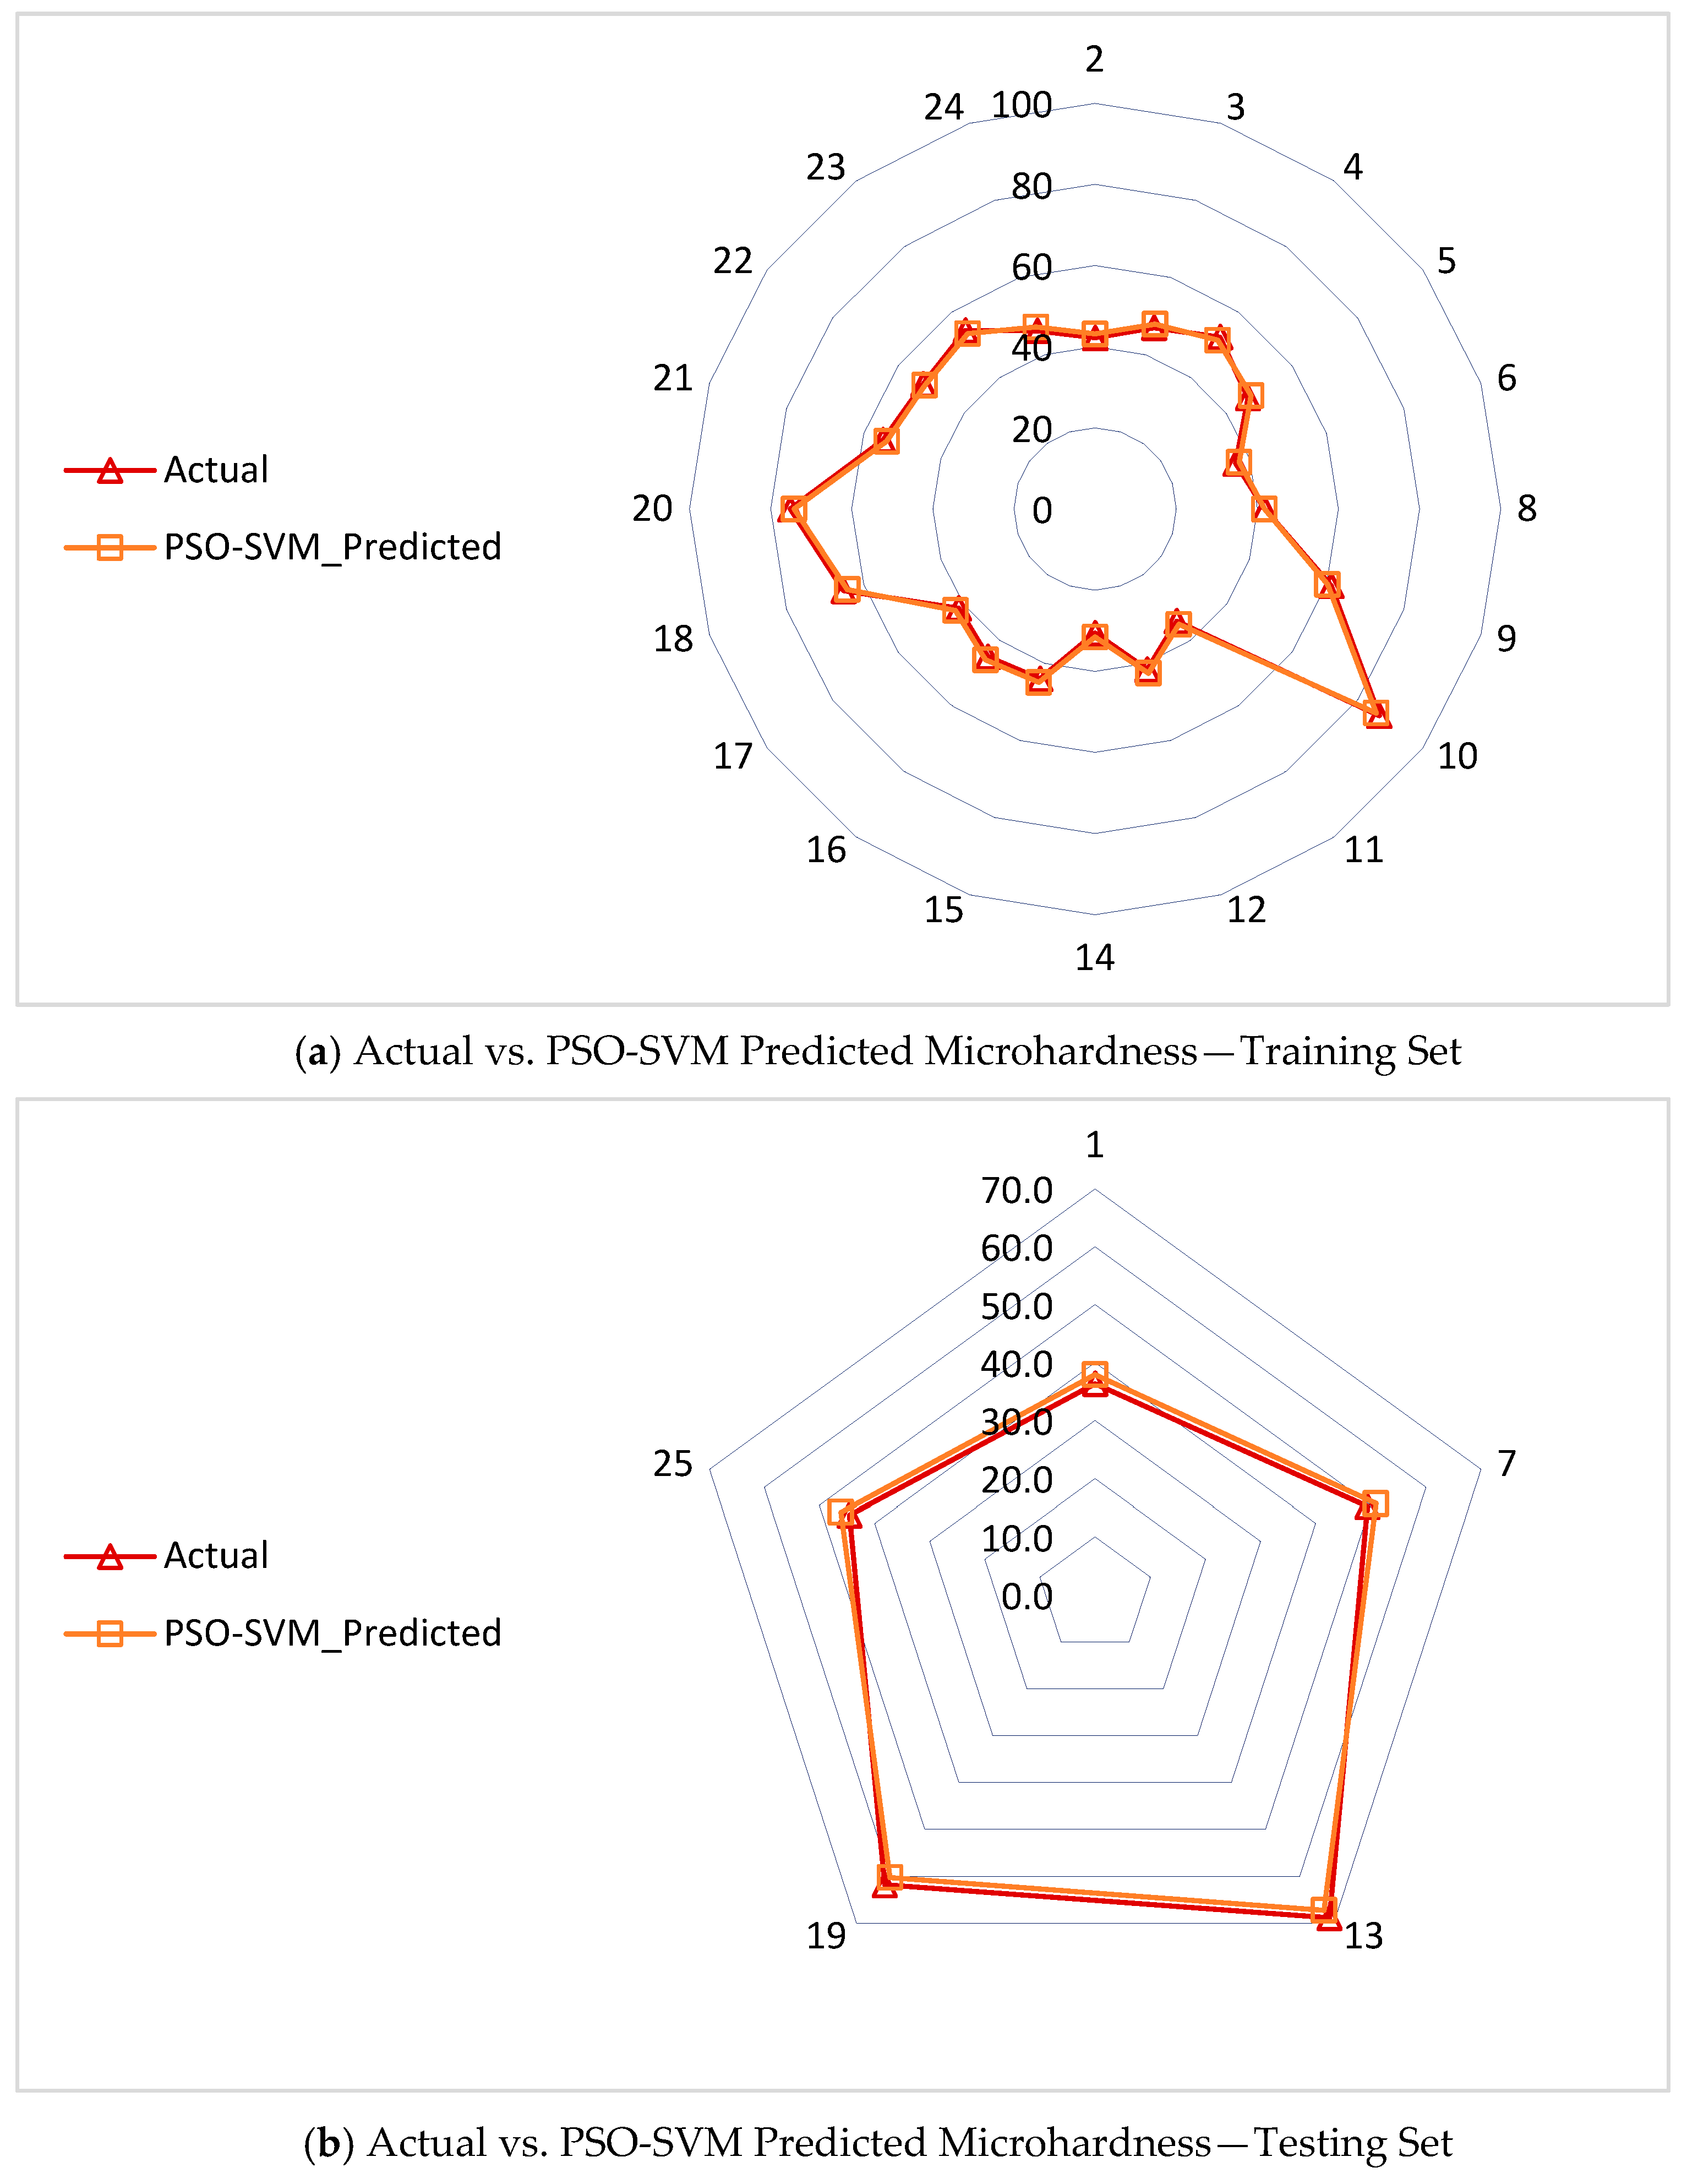
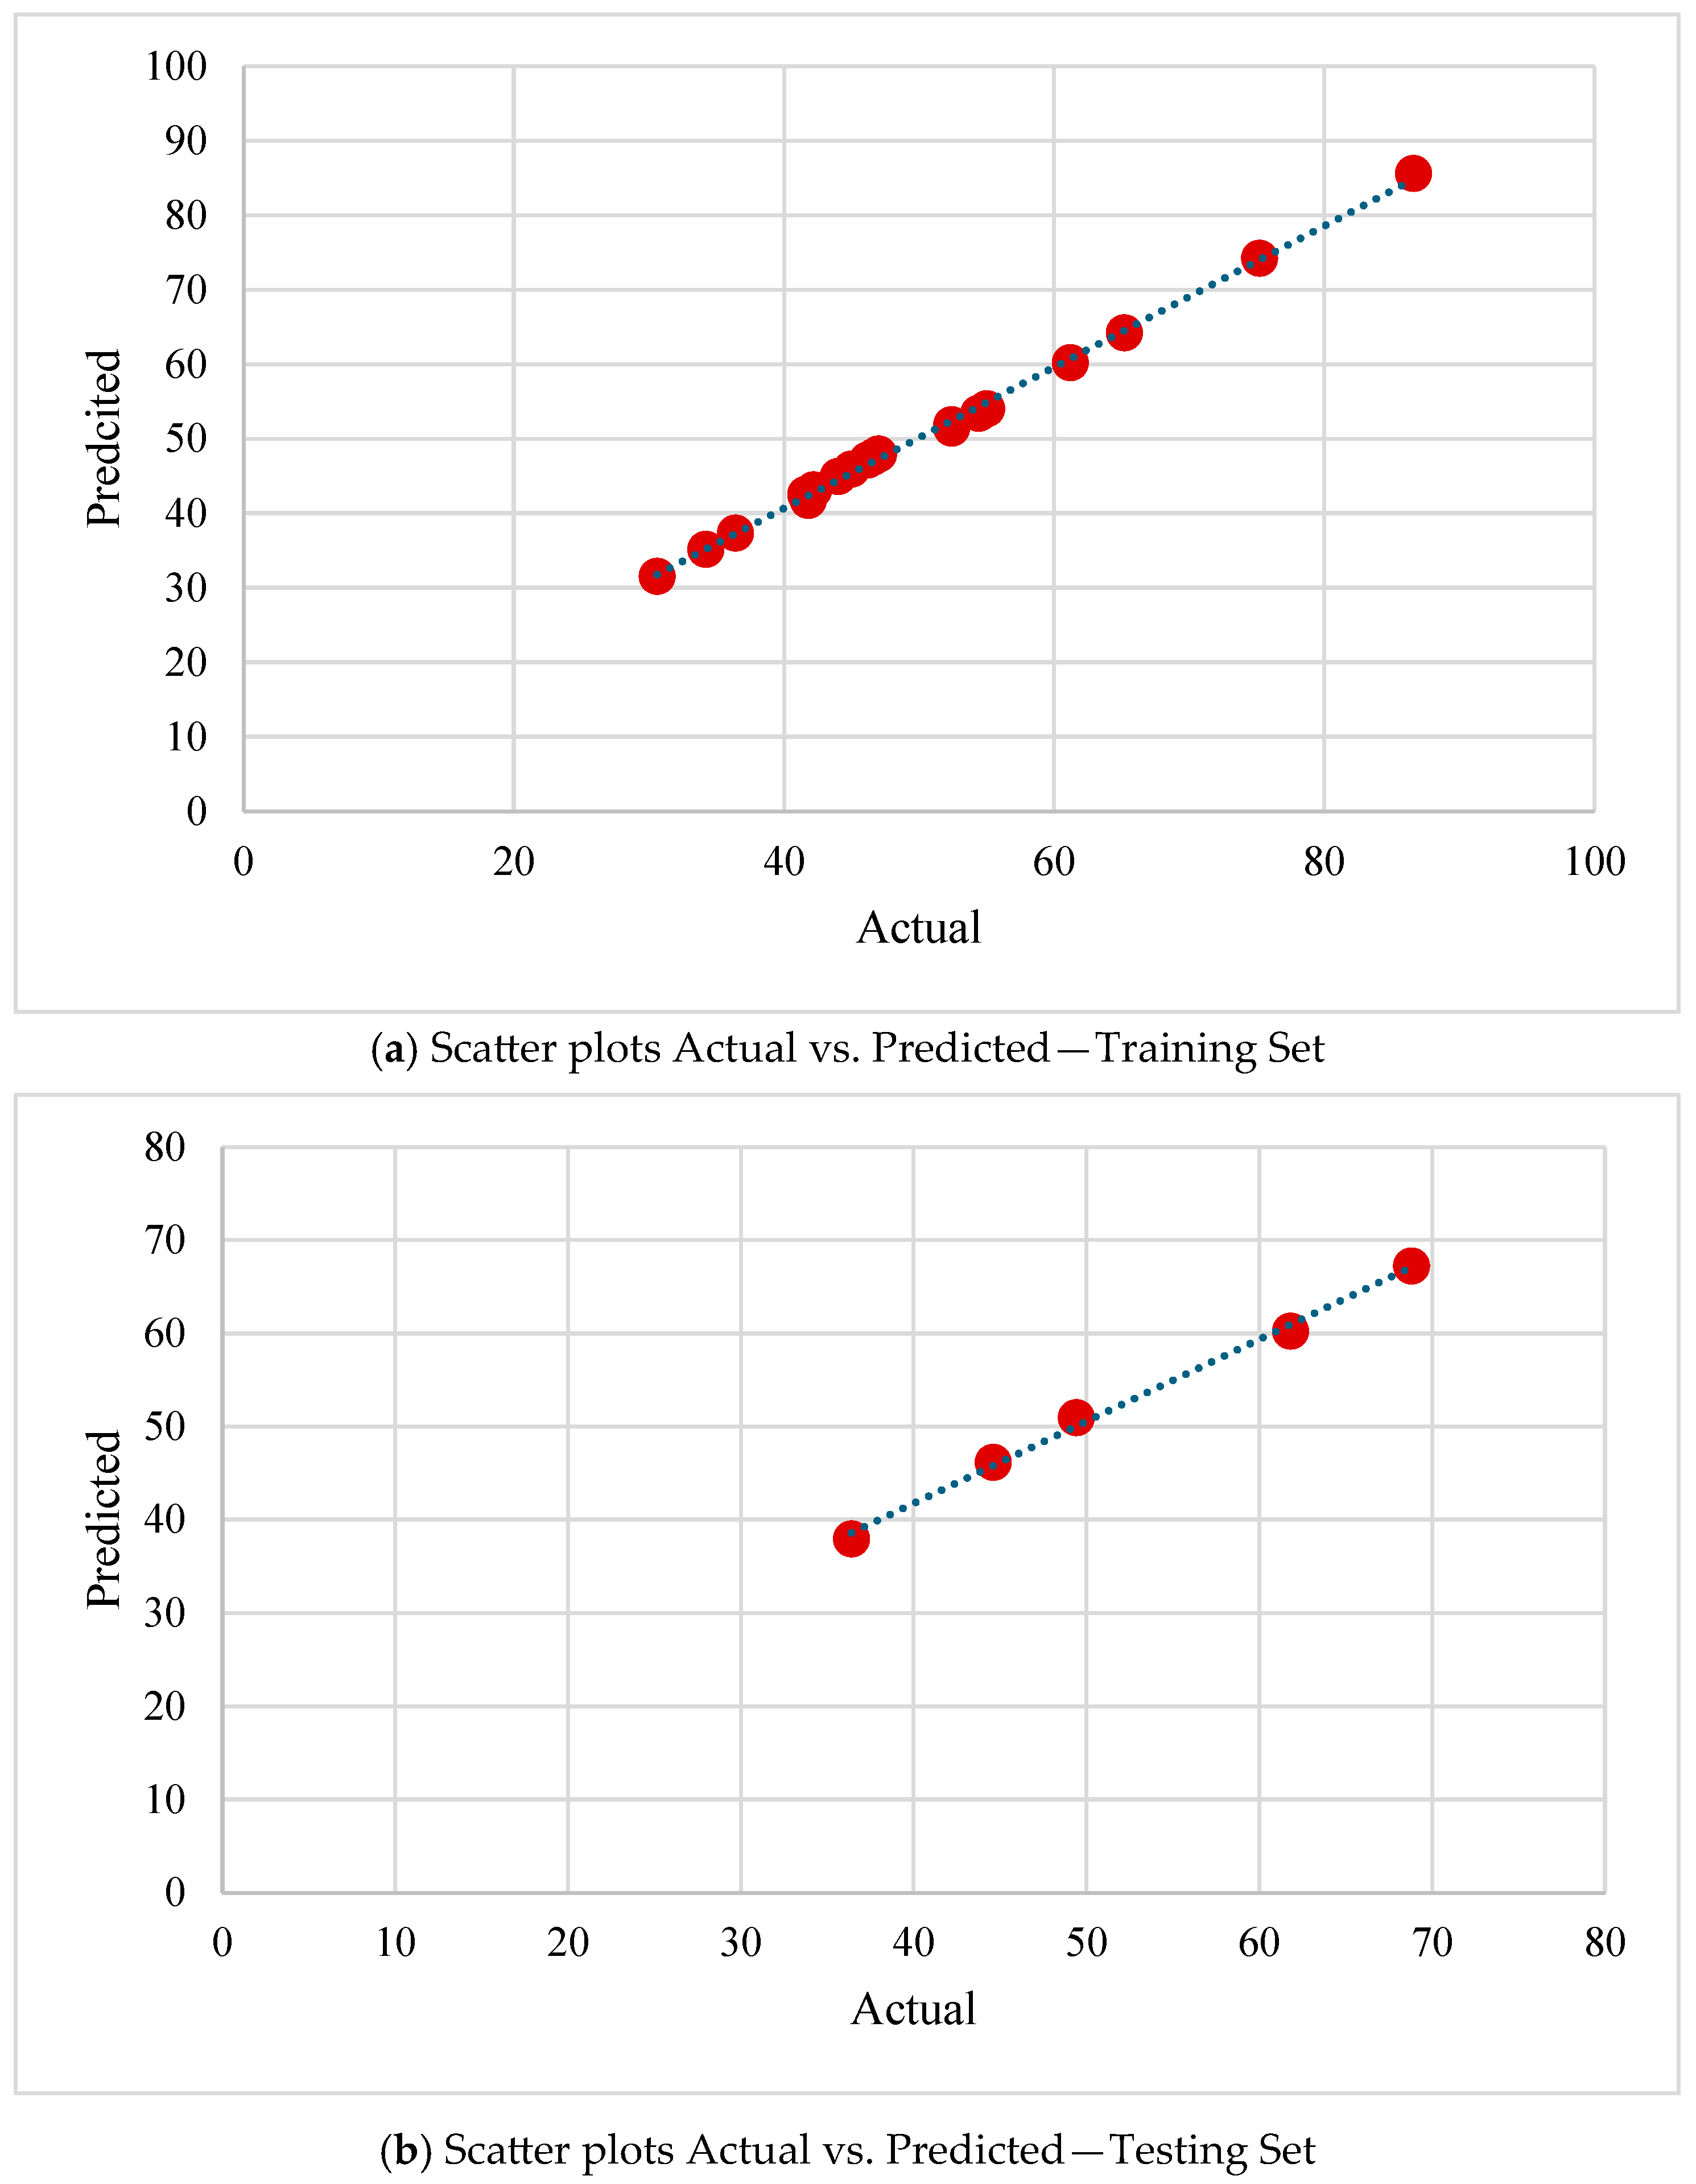
Figure 7 illustrates the comparison between the actual and predicted microhardness values generated by the PSO-SVM model for both the training (Figure 7a) and testing (Figure 7b) datasets. Additionally, scatter plots illustrating the correlation between actual and predicted values for the training and testing datasets are shown in Figure 8a and 8b, respectively. The strong alignment observed between the predicted and actual values across both datasets indicates that the model has successfully captured the underlying relationships between the input parameters and microhardness. This close agreement not only confirms the accuracy of the model during training but also validates its generalization capability on testing data. The results demonstrate the robustness and reliability of the PSO-SVM approach in modeling complex material behavior.
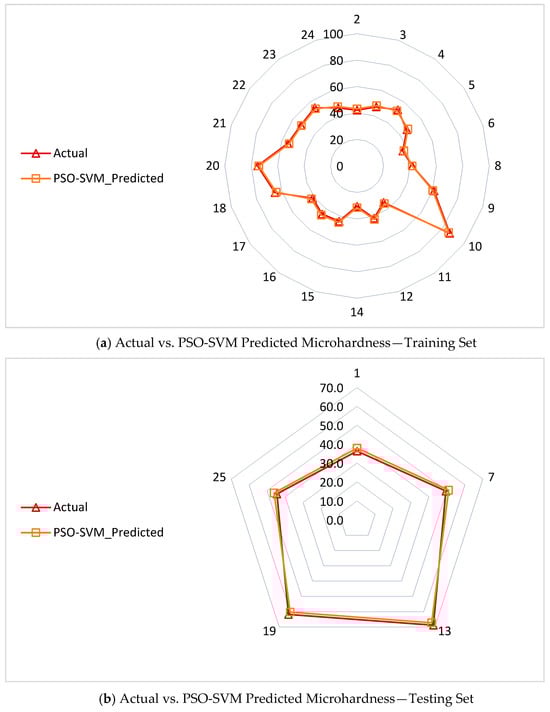
Figure 7.
Comparison of actual and PSO-SVM predicted microhardness values for (a) training and (b) testing.
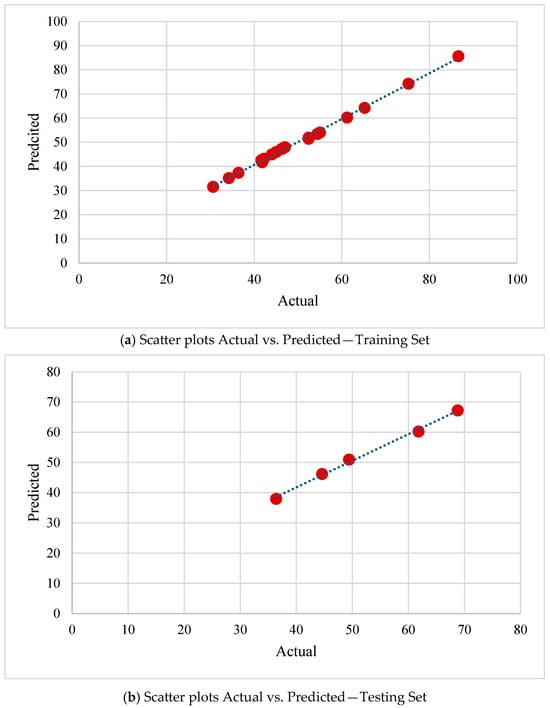
Figure 8.
Scatter plot of actual vs. predicted microhardness with perfect fit line (y = x) for (a) training and (b) testing.
To evaluate the robustness and predictive performance of machine learning (ML) techniques over conventional statistical approaches, the development of the response surface methodology (RSM)-based regression model was also conducted for the same experimental dataset. RSM is an empirical modeling technique based on polynomial regression, widely used for process optimization and identifying the influence and interactions of multiple input factors on a response variable [38]. While RSM is effective in handling moderately non-linear systems, its capacity to accurately capture complex, high-dimensional non-linear patterns is often limited [25].
The RSM model developed for predicting microhardness is expressed as follows:
where represents wt.% of SiC, represent wt.% of ZrO2, represents sintering temperature (°C), represents sintering time (min), and represents milling time (min).
The statistical significance and fit quality of the RSM model were evaluated through Analysis of Variance (ANOVA). The results are summarized in Table 6, indicating that while the overall model exhibits marginal significance (p = 0.076), several individual terms, particularly interaction terms, show statistically significant contributions.
Table 6.
Analysis of Variance for RSM model of Microhardness.
Despite an acceptable R2 of 0.812, the low adjusted and predicted R2 values reflect poor generalization and overfitting risks in the RSM model, further highlighting the limitations of relying on linear and second-order terms in complex non-linear systems.
The performance of both the integrated PSO-SVM model and the conventional RSM model is evaluated using four key evaluation metrics: the correlation coefficient (R2), root mean squared error (RMSE), mean absolute error (MAE), and mean absolute percentage error (MAPE). The mathematical expressions for these indices are provided below:
where represents the model-predicted value, denotes the experimental (actual) value, represents the mean of the experimental values, and is the number of experiments, i.e., sample size. These indices provide a comprehensive understanding of the model’s accuracy, reliability, and predictive capability, offering insights into how well the PSO-SVM model estimates microhardness values compared to the actual data. The calculated values of the various metrics are summarized in Table 7.
Table 7.
Summary of Statistical Metrics for PSO-SVM Model Performance on Training and Testing Datasets.
The low values obtained for key statistical performance metrics including R2, RMSE, MAE, and MAPE across both the training and testing datasets clearly indicate the strong predictive capability of the proposed PSO-SVM model in estimating microhardness. These consistently favorable results highlight the model’s generalization ability and accuracy in capturing the underlying relationships between input parameters and the target output. Consequently, the PSO-SVM framework demonstrates considerable potential as a reliable tool for modeling and can be effectively leveraged to optimize process parameters for achieving targeted microhardness levels. This underscores its applicability in advanced material design and process control.
Further, to evaluate the accuracy and reliability of the PSO-SVM model in predicting microhardness, hypothesis tests: paired t-tests and F-tests were conducted to compare the means and variances of actual and predicted values, respectively. These tests assess whether the models yield unbiased predictions and capture experimental variability. The results are summarized in Table 8.
Table 8.
Summary of the hypothesis tests (paired t-test and F-test).
The paired t-test yielded a t-statistic of −0.900 with a p-value of 0.377, indicating no significant difference between the means of actual and predicted microhardness values, suggesting the model produces unbiased estimates. Similarly, the F-test resulted in a statistic of 1.135 and a p-value of 0.379, confirming no significant difference in variances and indicating that the model captures the variability of the experimental data well. The high Pearson correlation coefficient (r = 0.999) further demonstrates a strong linear relationship between predicted and actual values. Overall, the model exhibits excellent predictive performance.
In contrast, while the RSM model provides a reasonable baseline with an R2 of 0.81, its higher MAE and MAPE values with lower adjusted and predicted R2 values reflect limitations in capturing the non-linear dynamics present in the experimental data. This comparative analysis emphasizes the superior performance and robustness of ML-based approaches like PSO-SVM in modeling complex material behavior.
5. Conclusions
Al-based MMCs with SiC and ZrO2 reinforcements have successfully been fabricated via the powder metallurgy route in this research work. From this investigation, the following findings can be summarized:
- The powder metallurgy route has been found effective good for the hybridization of Al-based MMCs with SiC and ZrO2 reinforcement elements.
- Optimal mixing and sintering of all composite samples have been achieved, as proved by XRD results that show peaks of Al, SiC, and ZrO2 particles for all the fabricated MMCs.
- No purities or other irreverent peaks are observed in the XRD pattern of any the fabricated composites, which confirms the good fabrication quality of MMC products with the proper distribution of SiC and ZrO2 reinforcement particles over the Al matrix material.
- Uniform spreading of both reinforcement elements SiC and ZrO2, in Al matrix has been observed.
- The appearance of Al, Si, C, Zr, and O in EDS spectra confirms the effectiveness of ball milling and sintering of composites for all fabrication conditions.
- The highest and lowest microhardness values of 86.6 HVN and 30.6 HVN, respectively, have been achieved.
- During the SEM investigation, fewer powder clusters, microcracks, and pores were identified, which have a direct impact on the microhardness values of the manufactured hybrid MMCs. Also, appropriate precautions were implemented during the PM route’s mixing, compaction, and sintering stages.
- The proposed PSO-SVM model demonstrates promising accuracy and reliability in predicting microhardness across both training and testing datasets, supported by high R2 values of 0.995 and 0.982, respectively. The model’s low error metrics in testing, including an RMSE of 1.557 and a MAPE of 3.141, confirm its effectiveness in capturing the complex, non-linear relationships inherent in powder metallurgy processes.
- By integrating PSO for hyperparameter tuning, the PSO-SVM model overcomes the limitations of traditional SVM. Its robust generalization capability, demonstrated by consistent performance across training and testing datasets, makes it a powerful tool for accurate predictions, even with limited data—ideal for small-sample scenarios in materials science research.
- While the RSM model offers a baseline with an R2 of 0.812, its higher MAE and MAPE, along with low adjusted and predicted R2 values, reveal its limitations in capturing non-linear patterns. This highlights the superior accuracy and robustness of the PSO-SVM model for modeling complex material behavior.
Future research directions of this work include the study of other mechanical properties and tribological analysis of the Al-SiC-ZrO2 MMC to further evaluate its capability for real-world application. Aluminium-based SiC/ZrO2 reinforced hybrid MMCs can be employed in a variety of applications, including automotive components such as pistons and connecting rods, due to their superior mechanical properties.
Author Contributions
Conceptualization, P.S., S.P. and K.G.; methodology and review, P.S., S.P. and K.G.; writing first draft, P.S. and S.P.; editing, supervision, and fund acquisition, K.G. All authors have read and agreed to the published version of the manuscript.
Funding
This research received no external funding.
Institutional Review Board Statement
Not applicable.
Informed Consent Statement
Not applicable.
Data Availability Statement
The original contributions presented in this study are included in the article. Further inquiries can be directed to the corresponding author(s).
Acknowledgments
The authors would like to acknowledge the technicians and lab staff of the Department of Mechanical and Industrial Engineering Technology and Department of Metallurgy at the University of Johannesburg.
Conflicts of Interest
The authors declare no conflicts of interest.
References
- Singh, L.; Singh, B.; Saxena, K.K. Manufacturing techniques for metal matrix composites (MMC): An overview. Adv. Mater. Process. Technol. 2020, 6, 441–457. [Google Scholar] [CrossRef]
- Tian, X.; Huang, Y.; Zhang, L.; Zhao, F.; Chen, Y.; Liu, X. Preparation of AlN–SiC Bonded Al2O3–C Refractory and Its Properties Evolution after Oxidation. Ceram. Int. 2024, 50, 446–451. [Google Scholar] [CrossRef]
- Hashim, A.; Ibrahim, H.; Hadi, A. Fabrication of SiC–Al2O3 Nanoceramic Doped Organic Polymer for Flexible Nanoelectronics and Optical Applications. Silicon 2024, 16, 6575–6587. [Google Scholar] [CrossRef]
- Sarmah, P.; Patowari, P.K. Mechanical and tribological analysis of the fabricated Al 6063-based MMCs with SiC reinforcement particles. Silicon 2023, 15, 2781–2796. [Google Scholar] [CrossRef]
- Li, P.; Chen, T.; Qin, H. Effects of pressure on microstructure and mechanical properties of SiC/2024 Al-based composites fabricated by powder thixoforming. J. Mater. Sci. 2017, 52, 2045–2059. [Google Scholar] [CrossRef]
- Jenczyk, P.; Grzywacz, H.; Milczarek, M.; Jarzabek, D.M. Mechanical and tribological properties of co-electrodeposited particulate-reinforced metal matrix composites: A critical review with interfacial aspects. Materials 2021, 14, 3181. [Google Scholar] [CrossRef] [PubMed]
- Madhukar, M.P.; Selvaraj, N.; Rao, C.S.P. Manufacturing of aluminium nano hybrid composites: A state of review. Mater. Sci. Eng. 2016, 149, 12114. [Google Scholar] [CrossRef]
- Nagasai, B.P.; Srikanth, S.; Babu, J.R. Mechanical properties of AA 7075-nano ZrO2 reinforced matrix composites. In Advances in Applied Mechanical Engineering; Springer: Singapore, 2020; pp. 921–928. [Google Scholar]
- Tosun, G.; Kurt, M. The Porosity, Microstructure, and Hardness of Al-Mg Composites Reinforced with Microparticle SiC/Al2O3 Produced Using Powder Metallurgy. Compos. Part B Eng. 2019, 174, 106965. [Google Scholar] [CrossRef]
- Sankhla, A.M.; Patel, K.M.; Makhesana, M.A.; Giasin, K.; Pimenov, D.Y.; Wojciechowski, S.; Khanna, N. Effect of Mixing Method and Particle Size on Hardness and Compressive Strength of Aluminium-Based Metal Matrix Composite Prepared through Powder Metallurgy Route. J. Mater. Res. Technol. 2022, 18, 282–292. [Google Scholar] [CrossRef]
- Garg, P.; Jamwal, A.; Kumar, D.; Sadasivuni, K.K.; Hussain, M.C.; Gupta, P. Advance research progresses in aluminium matrix composites: Manufacturing & applications. J. Mater. Res. Tech. 2019, 8, 4924–4939. [Google Scholar]
- Chatterjee, A.; Sen, S.; Paul, S.; Roy, P.; Seikh, A.H.; Alnaser, I.A.; Das, K.; Sutradhar, G.; Ghosh, M. Fabrication and Characterization of SiC-reinforced Aluminium Matrix Composite for Brake Pad Applications. Metals 2023, 13, 584. [Google Scholar] [CrossRef]
- Marmol, G.; Ferreira, D.P.; Fangueiro, R. Automotive and construction applications of fiber reinforced composites. In Fiber Reinforced Composites: Constituents, Compatibility, Perspectives, and Applications Woodhead Publishing Series in Composites Science and Engineering; Woodhead Publishing: Cambridge, UK, 2021; pp. 785–788. [Google Scholar]
- Zhou, M.Y.; Ren, L.B.; Fan, L.L.; Zhang, Y.W.X.; Lu, T.H.; Quan, G.F.; Gupta, M. Progress in research on hybrid metal matrix composites. J. Alloys Comp. 2020, 842, 155274. [Google Scholar] [CrossRef]
- Ravi Kumar, K.; Pridhar, T.; Sree Balaji, V.S. Mechanical properties and characterization of zirconium oxide (ZrO2) and coconut shell ash (CSA) reinforced aluminium (Al 6082) matrix hybrid composite. J. Alloys Compd. 2018, 765, 171–179. [Google Scholar] [CrossRef]
- Zare, R.; Sharifi, H.; Saeri, M.R. Investigating the effect of SiC particles on the physical and thermal properties of Al6061/SiC composite. J. Alloys Compd. 2019, 801, 520–528. [Google Scholar] [CrossRef]
- Kiran Kumar, G.K.; Bhavani Sankar, C. Mechanical behaviour of silicon carbide (SiC)/fly ash particles reinforced aluminium-7075 based metal matrix composite fabricated by stir casting method. IJSART 2019, 5, 527–534. [Google Scholar]
- Yadav, S.; Gangwar, S.; Yadav, P.C.; Pathak, V.K.; Sahu, S. Mechanical and Corrosion Behavior of SiC/Graphite/ZrO2 Hybrid Reinforced Aluminum-Based Composites for Marine Environment. Surf. Topogr. Metrol. Prop. 2021, 9, 045022. [Google Scholar] [CrossRef]
- Ghandvar, H.; Jabbar, M.A.; Petrů, M.; Bakar, T.A.A.; Ler, L.J.; Rahimian Koloor, S.S. Role of YSZ Particles on Microstructural, Wear, and Corrosion Behavior of Al-15%Mg2Si Hybrid Composite for Marine Applications. J. Mar. Sci. Eng. 2023, 11, 1050. [Google Scholar] [CrossRef]
- Dey, D.; Bhowmik, A.; Biswas, A. Effect of SiC content on mechanical and tribological properties of Al2024-SiC composites. Silicon 2022, 14, 1–11. [Google Scholar] [CrossRef]
- Shamim, F.A.; Dvivedi, A.; Kumar, P. Fabrication and characterization of Al6063/SiC composites using electromagnetic stir casting process. Proc. Inst. Mech. Eng. Part E J. Process. Mech. Eng. 2022, 236, 187–193. [Google Scholar] [CrossRef]
- Maji, P.; Ghosh, S.K.; Nath, R.K.; Karmakar, R. Microstructural, mechanical and wear characteristics of aluminum matrix composites fabricated by friction stir processing. J. Braz. Soc. Mech. Sci. Eng. 2020, 42, 191. [Google Scholar] [CrossRef]
- Muralidharan, N.; Chockalingam, K.; Kalaiselvan, K.; Nithyavathy, N. Investigation of ZrO2 reinforced aluminium metal matrix composites by liquid metallurgy route. Adv. Mater. Proces. Tech. 2023, 9, 593–607. [Google Scholar] [CrossRef]
- Nataraja, M.; Balakumar, G.; Santhosh, N.; Rudra Naik, M. Characterization of Wear Rate of Al-12wt%Si Alloy-Based MMC Reinforced with ZrO2 Particulates. Mater. Res. Express 2024, 11, 036522. [Google Scholar] [CrossRef]
- Parveen, A.; Chauhan, N.R.; Suhaib, M. Influence of compaction pressure and Si3N4/ZrO2 reinforcement on the properties of aluminium hybrid composites. Adv. Mater. Process. Tech. 2022, 8, 2905–2917. [Google Scholar] [CrossRef]
- Nagasai, B.P.; Anusha, C.H.; Rajesh, A. Study on mechanical properties of Al-6061/ZrO2 reinforced metal matrix composites. Mater. Today Proc. 2021, 47, 4552–4557. [Google Scholar] [CrossRef]
- Gemeda, B.A.; Sinha, D.K.; Singh, G.K.; Alghtani, A.H.; Tirth, V.; Algahtani, A.; Mengesha, G.A.; Ahmed, G.M.S.; Hossain, N. Effect of sintering temperatures, reinforcement size on mechanical properties and fortification mechanisms on the particle size distribution of B4C, SiC, and ZrO2 in titanium metal matrix composites. Materials 2022, 15, 5525. [Google Scholar] [CrossRef] [PubMed]
- Khan, A.; Abdelrazeq, M.W.; Mattli, M.R.; Yusuf, M.M.; Alashraf, A.; Matli, P.R.; Shakoor, R.A. Structural and mechanical properties of Al-SiC-ZrO2 nanocomposites fabricated by microwave sintering technique. Crystals 2020, 10, 904. [Google Scholar] [CrossRef]
- Ramesh, S.; Govindaraju, N.; Suryanarayan, C.P. Investigation on mechanical and fatigue behaviour of aluminium-based SiC/ZrO2 particle reinforced MMC. IOP Conf. Ser. Mater. Sci. Eng. 2018, 346, 012030. [Google Scholar] [CrossRef]
- Azad, M.; Ya, H.H.; Azeem, M.; Bin, P.; Sapuan, M.; Khan, R.; Arif, S.; Husain, A. Modelling and Optimisation of Hardness Be-haviour of Sintered Al/SiC Composites Using RSM and ANN: A Comparative Study. Integr. Med. Res. 2020, 9, 14036–14050. [Google Scholar] [CrossRef]
- Garg, A.; Lam, J.S.L.; Gao, L. Power consumption and tool life models for the production process. J. Clean. Prod. 2016, 131, 754–764. [Google Scholar] [CrossRef]
- Ipakchi, H.; Rezadoust, A.M.; Esfandeh, M. Modeling and Optimization of Electrospinning Conditions of PVB Nanofiber by RSM and PSO-LSSVM Models for Improved Interlaminar Fracture Toughness of Laminated Composites. J. Compos. Mater. 2019, 54, 363–378. [Google Scholar] [CrossRef]
- Khan, K.; Johari, M.A.M.; Amin, M.N.; Khan, M.I.; Iqbal, M. Optimization of Colloidal Nano-Silica Based Cementitious Mortar Composites Using RSM and ANN Approaches. Results Eng. 2023, 20, 101390. [Google Scholar] [CrossRef]
- Hamzat, A.K.; Salman, U.T.; Murad, M.S.; Altay, O.; Bahceci, E.; Asmatulu, E.; Bakir, M.; Asmatulu, R. Development of Robust Machine Learning Models for Predicting Flexural Strengths of Fiber-Reinforced Polymeric Composites. Hybrid Adv. 2025, 8, 100385. [Google Scholar] [CrossRef]
- Danish, M.; Gupta, M.K.; Irfan, S.A.; Ghazali, S.M.; Rathore, M.F.; Krolczyk, G.M.; Alsaady, A. Machine learning models for prediction and classification of tool wear in sustainable milling of additively manufactured 316 stainless steel. Results Eng. 2024, 22, 102015. [Google Scholar] [CrossRef]
- Xu, C.; Yao, S.; Wang, G.; Wang, Y.; Xu, J. A prediction model of drilling force in CFRP internal chip removal hole drilling based on support vector regression. Int. J. Adv. Manuf. Technol. 2021, 117, 1505–1516. [Google Scholar] [CrossRef]
- Zhao, M.; Xue, B.; Li, B.; Zhu, J.; Song, W. Ensemble learning with support vector machines algorithm for surface roughness prediction in longitudinal vibratory ultrasound-assisted grinding. Precis. Eng. 2024, 88, 382–400. [Google Scholar] [CrossRef]
- Acosta, S.M.; Oliveira, R.M.A.; Sant’anna, Â.M.O. Machine learning algorithms applied to intelligent tyre manufacturing. Int. J. Comput. Integr. Manuf. 2023, 37, 497–507. [Google Scholar] [CrossRef]
- Padmavathi, K.R.; Ramakrishnan, R.; Karthikeyan, L.; Tamizhselvan, S.; Chezhian Babu, S. Comparison of the mechanical properties of micro/nano SiC/TiO2 reinforced aluminium metal matrix composites. Mater. Today Proc. 2023, 72, 1996–2001. [Google Scholar] [CrossRef]
- ASTM E92-23; Standard Test Methods for Vickers Hardness and Knoop Hardness of Metallic Materials. ASTM: West Conshohocken, PA, USA, 2023.
- Reddy, P.V.; Kumar, G.S.; Krishnudu, D.M.; Rao, H.R. Mechanical and wear performances of aluminium-based metal matrix composites: A review. J. Bio Tribo-Corro 2020, 6, 83. [Google Scholar] [CrossRef]
- Sekar, K.; Manohar, M.; Jayakumar, K. Mechanical and tribological properties of A356/Al2O3/MoS2 hybrid composites synthesized through combined stir and squeeze casting. In Advances in Materials and Metallurgy; Springer: Singapore, 2019; pp. 115–125. [Google Scholar]
- Kumar, R.; Anand, R.S. Bearing fault diagnosis using multiple feature selection algorithms with SVM. Prog. Artif. Intell. 2024, 13, 119–133. [Google Scholar] [CrossRef]
- Camposeco-Negrete, C.; de Dios Calderón-Nájera, J. Optimization of Energy Consumption and Surface Roughness in Slot Milling of AISI 6061 T6 Using the Response Surface Method. Int. J. Adv. Manuf. Technol. 2019, 103, 4063–4069. [Google Scholar] [CrossRef]

Disclaimer/Publisher’s Note: The statements, opinions and data contained in all publications are solely those of the individual author(s) and contributor(s) and not of MDPI and/or the editor(s). MDPI and/or the editor(s) disclaim responsibility for any injury to people or property resulting from any ideas, methods, instructions or products referred to in the content. |
© 2025 by the authors. Licensee MDPI, Basel, Switzerland. This article is an open access article distributed under the terms and conditions of the Creative Commons Attribution (CC BY) license (https://creativecommons.org/licenses/by/4.0/).