Article

Research on the Fire Hazard of Different Cables Based on Cone Calorimetry

School of Safety Engineering, China University of Mining and Technology, Xuzhou 221116, China
*
Author to whom correspondence should be addressed.
Fire 2023, 6(11), 431; https://doi.org/10.3390/fire6110431
Submission received: 20 September 2023 / Revised: 5 November 2023 / Accepted: 8 November 2023 / Published: 9 November 2023
(This article belongs to the Special Issue Cable and Electrical Fires)

Abstract

:
In recent years, due to the extensive application and inherent fire hazard of cable materials, the combustion characteristics of frequently used cables, including electrical cables, wires, optical fibers, and network cables have been studied based on ISO 5660 cone calorimetry. The fire hazard associated with these cables under different radiation intensities was explored in this study, with parameters such as time to ignition (TTI), heat release rate per unit area (HRRPUA), peak heat release rate (PHRR), total heat release (THR), and mass loss rate (MLR) being investigated for each cable type. Based on an experimental analysis, the risk of fire for all four cable types was augmented by an increase in the external radiation intensity, with electrical cables considered as posing the greatest risk. Regarding smoke toxicity, the lowest risk of smoke toxicity was demonstrated by the network cable, with an FED (fractional effective dose) of 0.0203, followed by optical fibers, with an FED of 0.0507; electrical wires, with an FED of 0.0417; and electrical cables, with an FED of 0.0501. Notably, no significant distinctions were exhibited by the other three cable types, and the smoke toxicity of all four cables did not reach lethal concentration levels in humans. Consequently, considering both thermal hazard and smoke toxicity, it became evident that electrical cables posed the greatest overall fire hazard.

1. Introduction

Recently, the widespread utilization of electronic and electrical devices has led to a surge in electrical fire incidents. Among the primary causes of electrical fires, cable malfunction, and ignition were prominent, accounting for over half of all electrical fire accidents in China [1,2]. Consequently, given the extensive application scenarios and significant fire risks associated with cables [3], numerous scholars from both domestic and international academic circles have undertaken extensive research on cable combustion behavior.
Advanced apparatuses, such as cone calorimeters, flash point testers, and flame propagation calorimeters, have been utilized to investigate this subject. In a study on halogen-free flame-retardant cables under external heat radiation intensities ranging from 25 to 75 kW/m2, Fontaine et al. [4] observed a reduction in cable ignition time with an increase in applied radiation intensity. Specifically, when the external radiation was increased from 25 kW/m2 to 75 kW/m2, the ignition time decreased by 802 s. Zheng et al. [5] conducted a comprehensive investigation of the ignition, expansion charring, pyrolysis, and combustion behavior of ZRC-YJV22 flame-retardant cables from both the macroscopic and microscopic perspectives. They employed multiple criteria to assess the cable’s hazardous nature and conducted a detailed analysis of the burning product characteristics and pyrolysis reaction mechanisms of the flame-retardant cable. The research outcomes had the potential to establish an integrated fire engineering database and comprehensive utility tunnel standards. Elliot et al. [6] explored the cone calorimeter testing method for insulation wires, a relatively simple, cost-effective method that exhibited good repeatability and provided quantitative data on wire combustibility. The results revealed significant differences between halogen-free flame-retardant wires and their equivalent halogen-containing counterparts. Barnes et al. [7] analyzed the fire performance of halogen-containing and halogen-free polymeric cable sheath materials. They found that flame-retardant cables and halogen-containing polymer cable sheaths demonstrated resistance to ignition and reduced heat release rates. However, they exhibited unfavorable factors, such as low smoke visibility and high toxicity. Tang et al. [8] conducted a comparative study on the combustion characteristics and fire hazards of two types of cables used in nuclear power plants, utilizing cone calorimetry and cable tray fire tests. The experimental findings demonstrated that the fire performance of the NPP flame-retardant cable was notably affected by external radiation intensity. A single peak in the heat release rate was exhibited under low radiation intensities, while two peaks were observed under high radiation intensities. On the other hand, the heat release rate curve of the conventional flame-retardant cable displayed three peaks, with the maximum heat release rate peak surpassing that of the NPP flame-retardant cable by 108 kW/m2. Matheson et al. [9] researched halogenated and non-halogenated polymer materials, revealing that halogen-containing materials exhibited superior electrical properties compared with non-halogenated flame-retardant materials.
Various testing methods have also been explored to determine the combustion characteristics of cables. Hirschler [10] summarized the advantages and limitations of various testing methods for cables and wires in fires of different scales. Additionally, he proposed using thermal power to assess the hazardous nature of cables and applying deep learning techniques to predict the effectiveness of cable fire tests. Kaczorek-Chrobak et al. [11] conducted fire experiments on power cables at radiation intensities of 10, 20, 30, 40, and 50 kW/m2. They compared the results with those of large-scale cable fire experiments and analyzed the cone calorimeter test results based on the Quintiere theory, substantiating the feasibility of using cone calorimetry as a substitute for large-scale fire tests. Sun-Yeo Mun et al. [12] investigated the thermal decomposition characteristics of five types of flame-retardant cables composed of various materials using thermogravimetric analysis. They observed that different cables exhibited similar thermal decomposition temperatures. However, significant differences were observed in the decomposition rates during combustion. Shi et al. [13] explored the relationship between fire source power and the combustion characteristics of flame-retardant coatings on subway cables. The researchers subjected cables with various flame-retardant properties to radiation heat fluxes ranging from 20 to 40 kW/m2 using a cone calorimeter. The results indicated a positive correlation between a cable’s burning rate and the rate of harmful gas generation with increasing radiation intensity. Moreover, the increase in the amount of flame-retardant coating extended the ignition time of the cable. Zhang et al. [14] conducted thermogravimetric experiments on the outer sheath material of low-voltage flame-retardant cables using a simultaneous thermal analyzer at three different heating rates. The findings indicated a two-stage thermal decomposition process for the cable’s outer sheath, and with an increase in the heating rate, the peak mass loss rate shifted towards higher temperature regions. Sun [15] conducted research on the combustion characteristics of cables, focusing on the ignition time and heat release rate through experiments with radiation intensities of 45 kW/m2 and 50 kW/m2.
In summary, despite both domestic and international scholars having conducted some research on the combustion characteristics and fire hazards of cables using apparatuses like the cone calorimeter, the flame propagation calorimeter, and the simultaneous thermal analyzer, most of these studies have focused solely on electrical cables. However, in many scenarios, besides electrical cables, a significant amount of electrical wires, network cables, and optical fibers can also be present. Therefore, it is imperative to employ a cone calorimeter to study the combustion characteristics of these other materials, including their heat release rate, ignition time, and smoke release rate, and to subsequently analyze their level of fire hazard (thermal hazard and smoke toxicity).
Compared with previous studies on cable materials, this article not only investigates the combustion characteristics of cables but also examines the smoke toxicity generated during cable combustion. Through a comprehensive analysis of the experimental results, the conclusion that electrical cables pose the greatest fire hazard was drawn. Furthermore, this study can serve as a guideline for the selection of appropriate cable materials in specific scenarios.

2. Experimental Methods

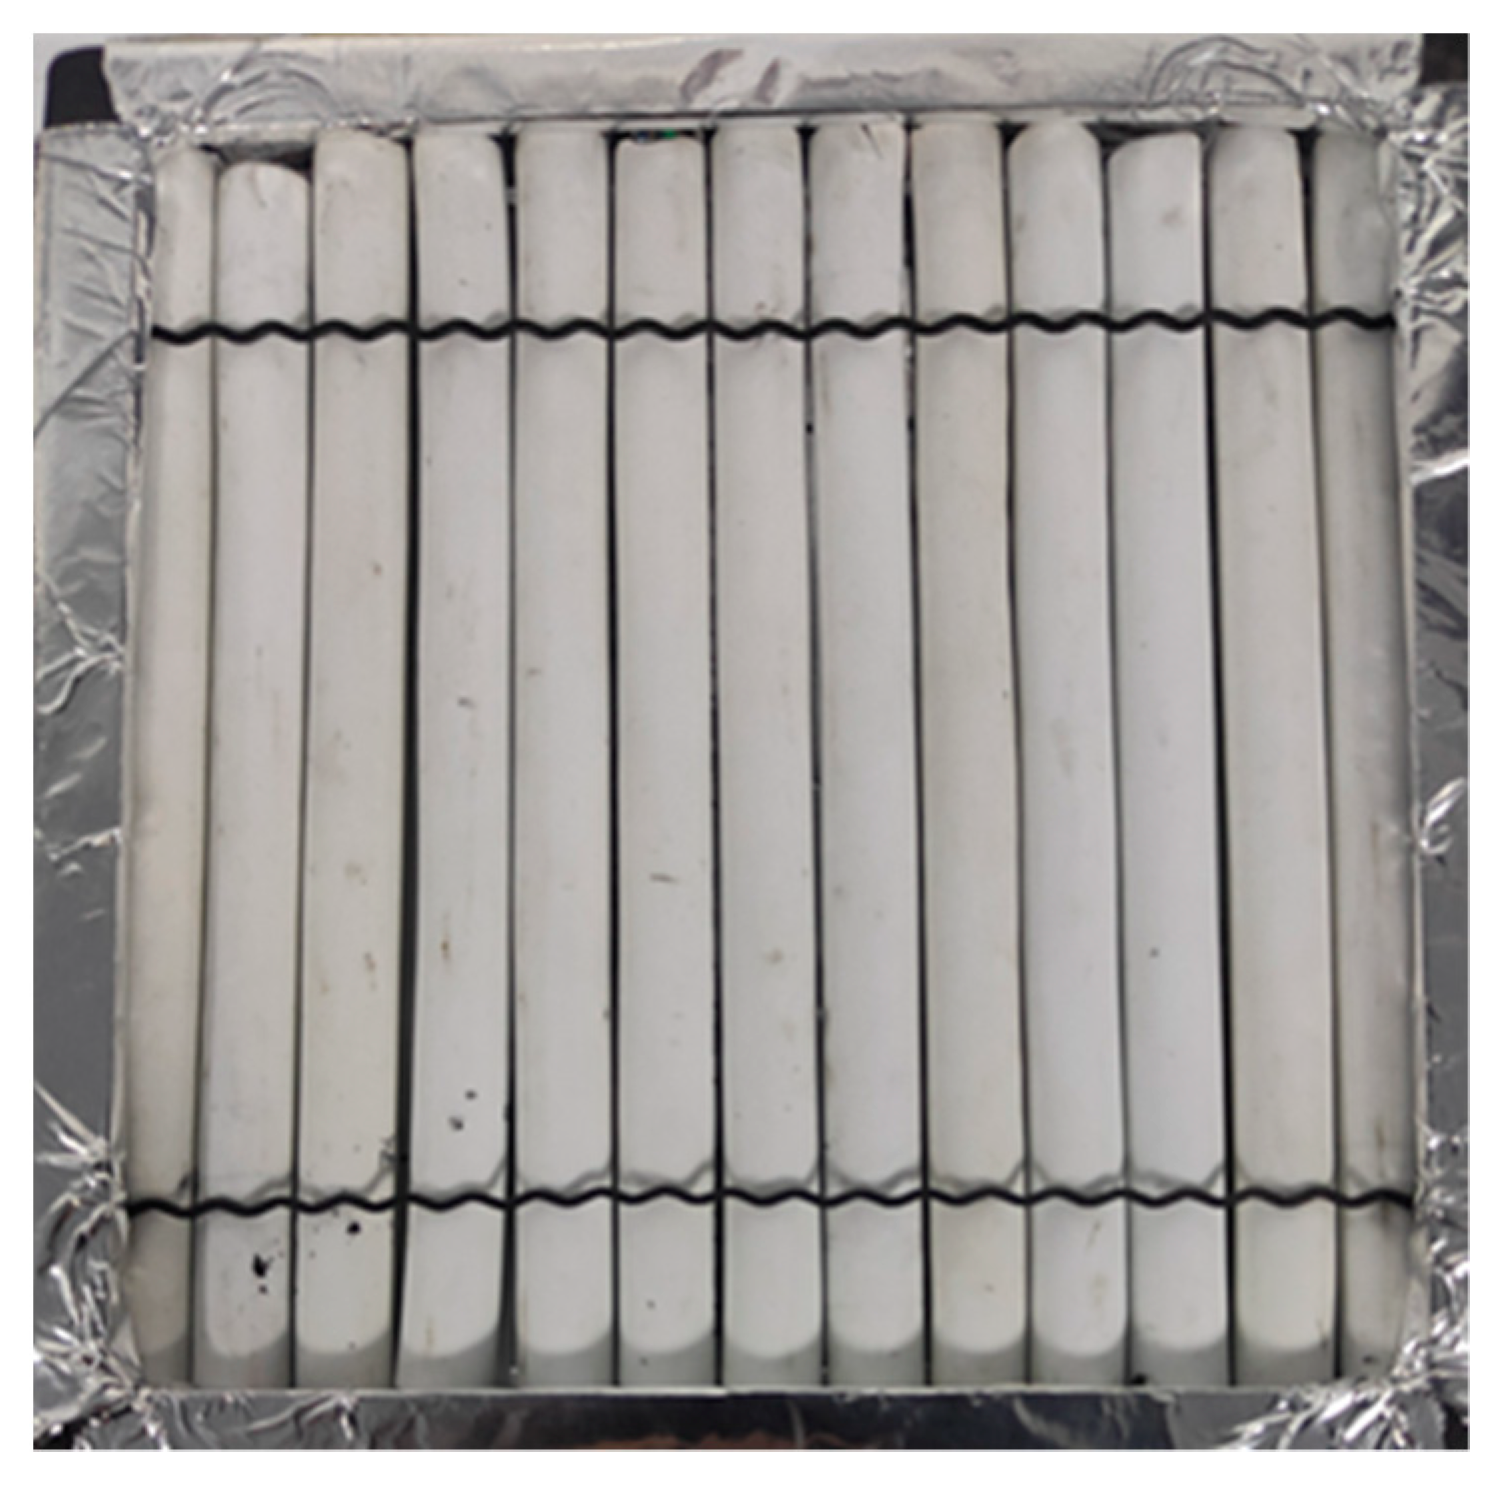
2.1. Experimental Equipment

A cone calorimeter was used in this experiment as it effectively replicates real-life fire scenarios, exhibits high repeatability, and allows for acquiring much combustion characteristic data on the test material in a single experiment [16].

2.2. Methods

Two variables were considered in the cable combustion experiment. (1) Cable types: Different cable types have different materials, structures, and combustibility, which can result in diverse combustion characteristics and fire hazard levels. Hence, cable types were treated as an experimental variable. (2) External radiation intensity: This variable was used to investigate how different combustion characteristic parameters and fire hazard levels change in different fire scenarios.
In choosing the experimental methods, we considered the international standard EN50399. However, after careful examination, we found that this standard was primarily intended for use in the European region. It was commonly used for testing cable fire resistance, as well as measuring heat release and smoke production from cables. Additionally, the material requirements specified in this standard differed significantly from those of our prepared materials. Taking into account the specific conditions in our region, we ultimately adopted the measurement standard for cable combustion characteristics outlined in ISO5660 [16].
The cables were prepared as 100 mm × 100 mm specimens, following the cone calorimeter’s instructions. Aluminum foil was used to protect five sides of each specimen, while an irradiated surface was left exposed; the foil did not exceed the specimen’s surface by more than 3 mm, as shown in Figure 1. Additionally, a wire mesh securely held the cables in place during combustion to prevent deformation. The experiments were conducted under controlled environmental conditions, maintaining an oxygen concentration of 20.95%, a temperature of 25.0 °C, and a relative humidity of 50%. Before each experiment, diligent calibration of the instruments was performed.
The experiment involved conducting combustion tests on four types of cables: YJV cables, BV wires, Cat6 ethernet cables, and OM3 optical fibers. These cables were subjected to four different thermal radiation intensities: 30 kW/m², 40 kW/m², 50 kW/m², and 60 kW/m². The manufacturers and dimensions of these four cable types are presented in Table 1. Furthermore, on the 100 mm × 100 mm test fixture, approximately 13 cables were used in each test, with each cable trimmed to a length of 100 mm and a width of around 7.7 mm. Our primary objective was to investigate the combustion characteristics and fire hazards of the cables when exposed to varying levels of heat from external radiation. As a result, a total of 16 different test conditions were examined, as detailed in Table 2.

3. Results and Analysis

3.1. Time to Ignition

Table 3 presents the time to ignition (TTI) of the four cable types under varying external radiation intensities. The analysis of Table 2 indicated that the ignition time of the materials decreased as the external radiant heat intensity increased. This was because, as the external heat radiation intensity applied to the cable increased, the heat transfer from the heater to the specimen’s surface intensified. This accelerated the thermal degradation rate of the specimen’s outer sheath, leading to a reduction in the time for the generation of combustible gases and ultimately resulting in the specimen igniting at an earlier stage. However, the rate of reduction diminished with time. This phenomenon could be attributed to the fact that, when the external radiation intensity reached higher levels (ranging from 50 to 60 kW/m² in this study), the accelerated thermal degradation effect due to the increased external radiant heat diminished. Consequently, the rate of ignition time reduction became less pronounced. Meinier et al. [17] observed similar patterns in their experimental investigations of halogen-free flame-retardant cables, and Chen [18] reported comparable findings regarding the combustion characteristics of flame-retardant EPDM rubber. Notably, the optical fiber exhibited a significantly shorter ignition time than the other cables under all four radiation intensities, with a mere 8 s. Therefore, in terms of ignition time alone, the flame retardancy ranking for the four cables was as follows: Cat6 ethernet cable > BV wire > YJV cable > OM3 optical fiber. As shown by the experiment, the LSZH materials demonstrated superior flame retardancy compared with the flame-retardant PVC materials, with ordinary PVC materials displaying the poorest flame-retardant performance in this ranking.

3.2. Heat Release Rate and Total Heat Release

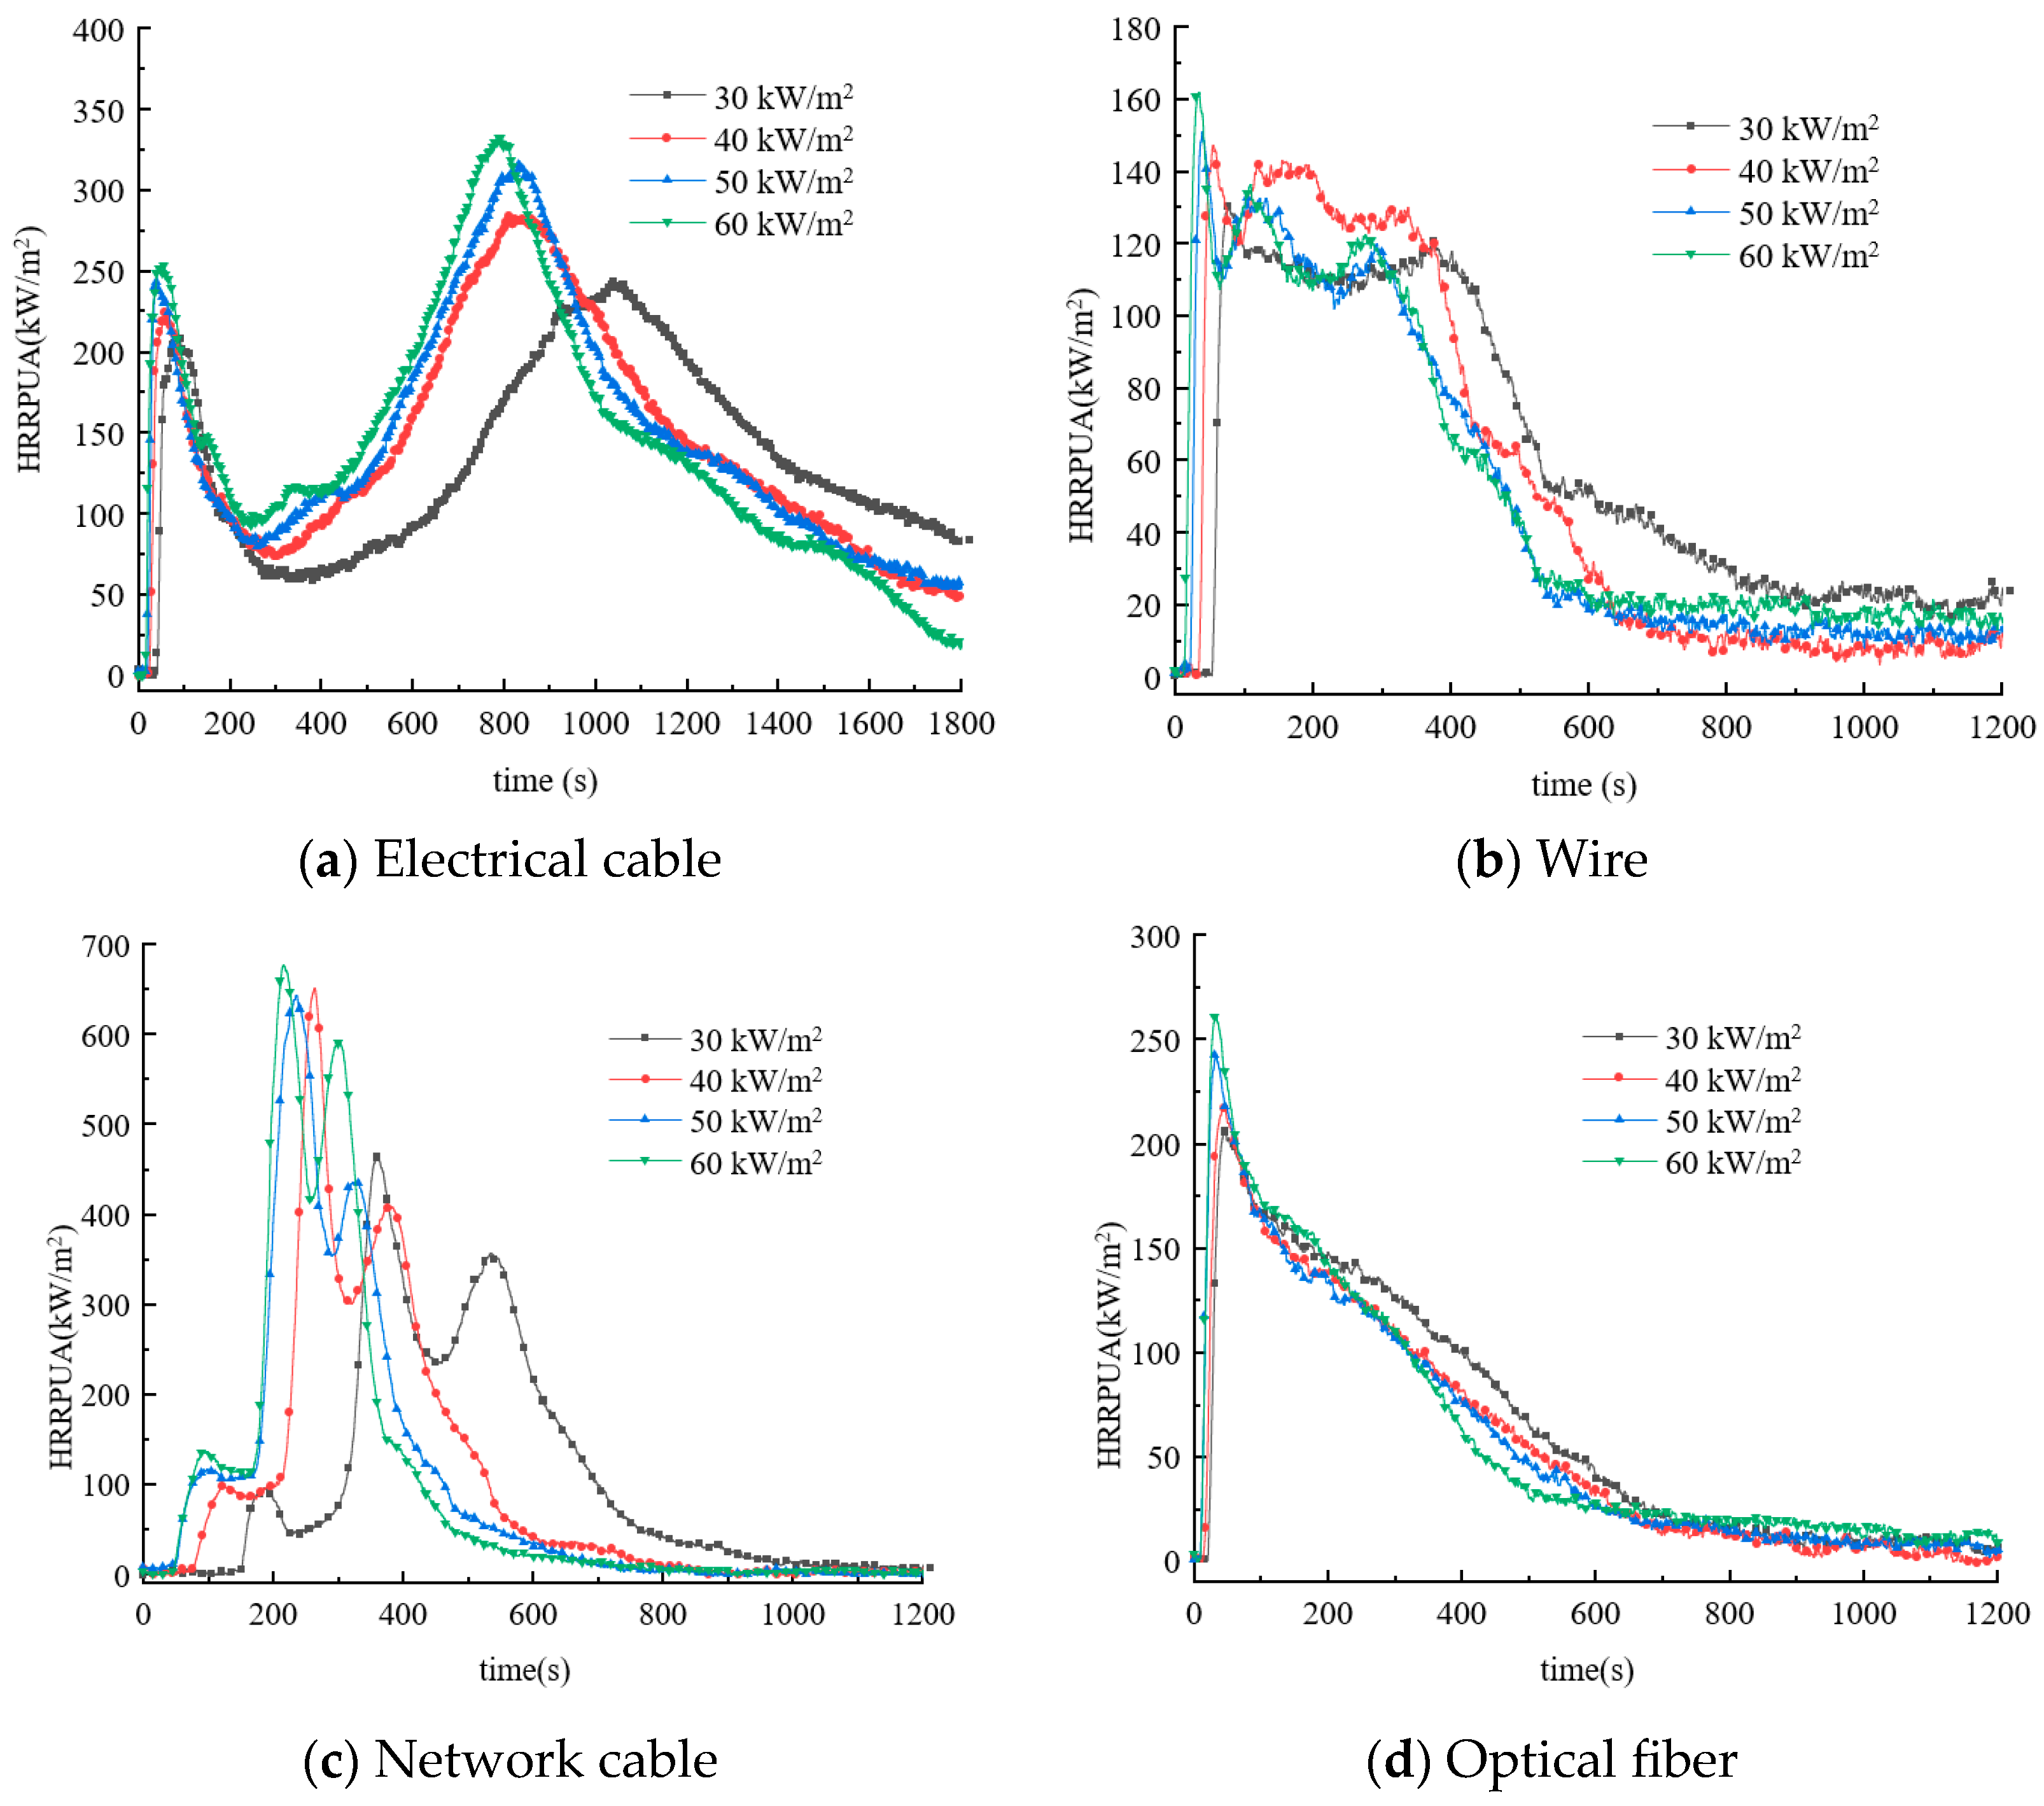
3.2.1. Heat Release Rate

Figure 2 illustrates the variation in the heat release rate per unit area (HRRPUA) over time for the four cable types under four different external radiation intensities. HRRPUA was a crucial parameter for assessing the fire hazard of cables [19]. The HRRPUA curves for the cables remained relatively consistent under different intensities of external radiation, as demonstrated by the graph. However, with an increase in external radiation intensity, the curves shifted toward the left. This phenomenon occurred because higher external radiation heat levels resulted in the cables receiving a greater amount of radiative energy from the cone heater. Consequently, the surface temperature of the cable’s outer sheath rose rapidly, leading to the thermal decomposition of the outer layer material. Compared with lower external radiation levels, this faster combustion reaction caused an accelerated increase in heat release, leading to a more rapid elevation in the heat release rate per unit area. During the combustion phase, the HRRPUA curves of different cable types exhibited variations. Optical fibers displayed a single peak, electrical cables showed an increase in heat release rate after a decrease in fire intensity with a curve featuring two peaks, and network cables and electric wires exhibited three distinct peaks. These differences arose due to a combination of factors, including cable material, flame-retardant properties, structure, and the formation of char during the combustion process.
The primary objective of this experiment was to measure the peak heat release rate (PHRR) and the average heat release rate (ave-HRR) during the onset of combustion up to 1 min, 3 min, and 5 min, denoted as ave-HRR1, ave-HRR3, and ave-HRR5, respectively [20]. The average and peak values of the heat release rate for each condition, along with the time to reach the peak (Tp), are presented in Table 3.
Table 4 clearly shows that an increase in the external radiation intensity led to a decrease in the time required for all four cable types to reach their maximum heat release rate (Tp), while their peak heat release rates increased by varying degrees. This phenomenon could primarily be attributed to higher external radiation intensities, resulting in faster material decomposition rates, more intense combustion, and greater heat emission. Consequently, a corresponding increase in the peak heat release rate and a gradual reduction in the time required to reach it were observed. The data in Table 4 indicate that electric wires had the greatest variation in Tp, while electrical cables had the smallest variation, with network cables and optical fibers falling in between. The differences in peak heat release rates were also pronounced across various radiation intensities, with network cables having shown the largest increase and electric wires having displayed the smallest increase, while cables and optical fibers lay in between. Furthermore, significant disparities were seen in the average heat release rates among the different cable types. Notably, at an external radiation intensity of 40 kW/m², the ave-HRR1 values for cables and optical fibers surpassed the ave-HRR3 and ave-HRR5 values, indicating that cables and optical fibers released a substantial amount of heat in the early stages of a fire. Moreover, at an external radiation intensity of 60 kW/m², network cables demonstrated the highest peak heat release rate among all conditions, reaching 676.3 kW/m² and requiring 213 s to reach this peak. Optical fibers achieved their peak heat release rate much faster, in just 31 s, but their peak value was only 242.87 kW/m². Despite having achieved the fastest peak heat release rate, the heat release rate of optical fibers was merely 35.9% of that observed for network cables, indicating that optical fibers posed a lower level of risk compared with network cables.

3.2.2. Total Heat Release

Table 5 provides a summary of the total heat release (THR) of cables under different external radiation intensities. Upon comparing the total heat release of cables at various radiation intensities after combustion, the average THR for cables was 258.49 MJ/m², while for wires, it was 65.02 MJ/m²; for network cables, it was 122.90 MJ/m²; and for optical fibers, it was 72.75 MJ/m². Overall, with the increase in external radiation intensity, the total heat release of the electrical cables tended to increase relative to that at 30 kW/m². When the external radiation intensity was raised from 30 kW/m2 to 60 kW/m2, the total heat release increased by 16.80 MJ/m2.

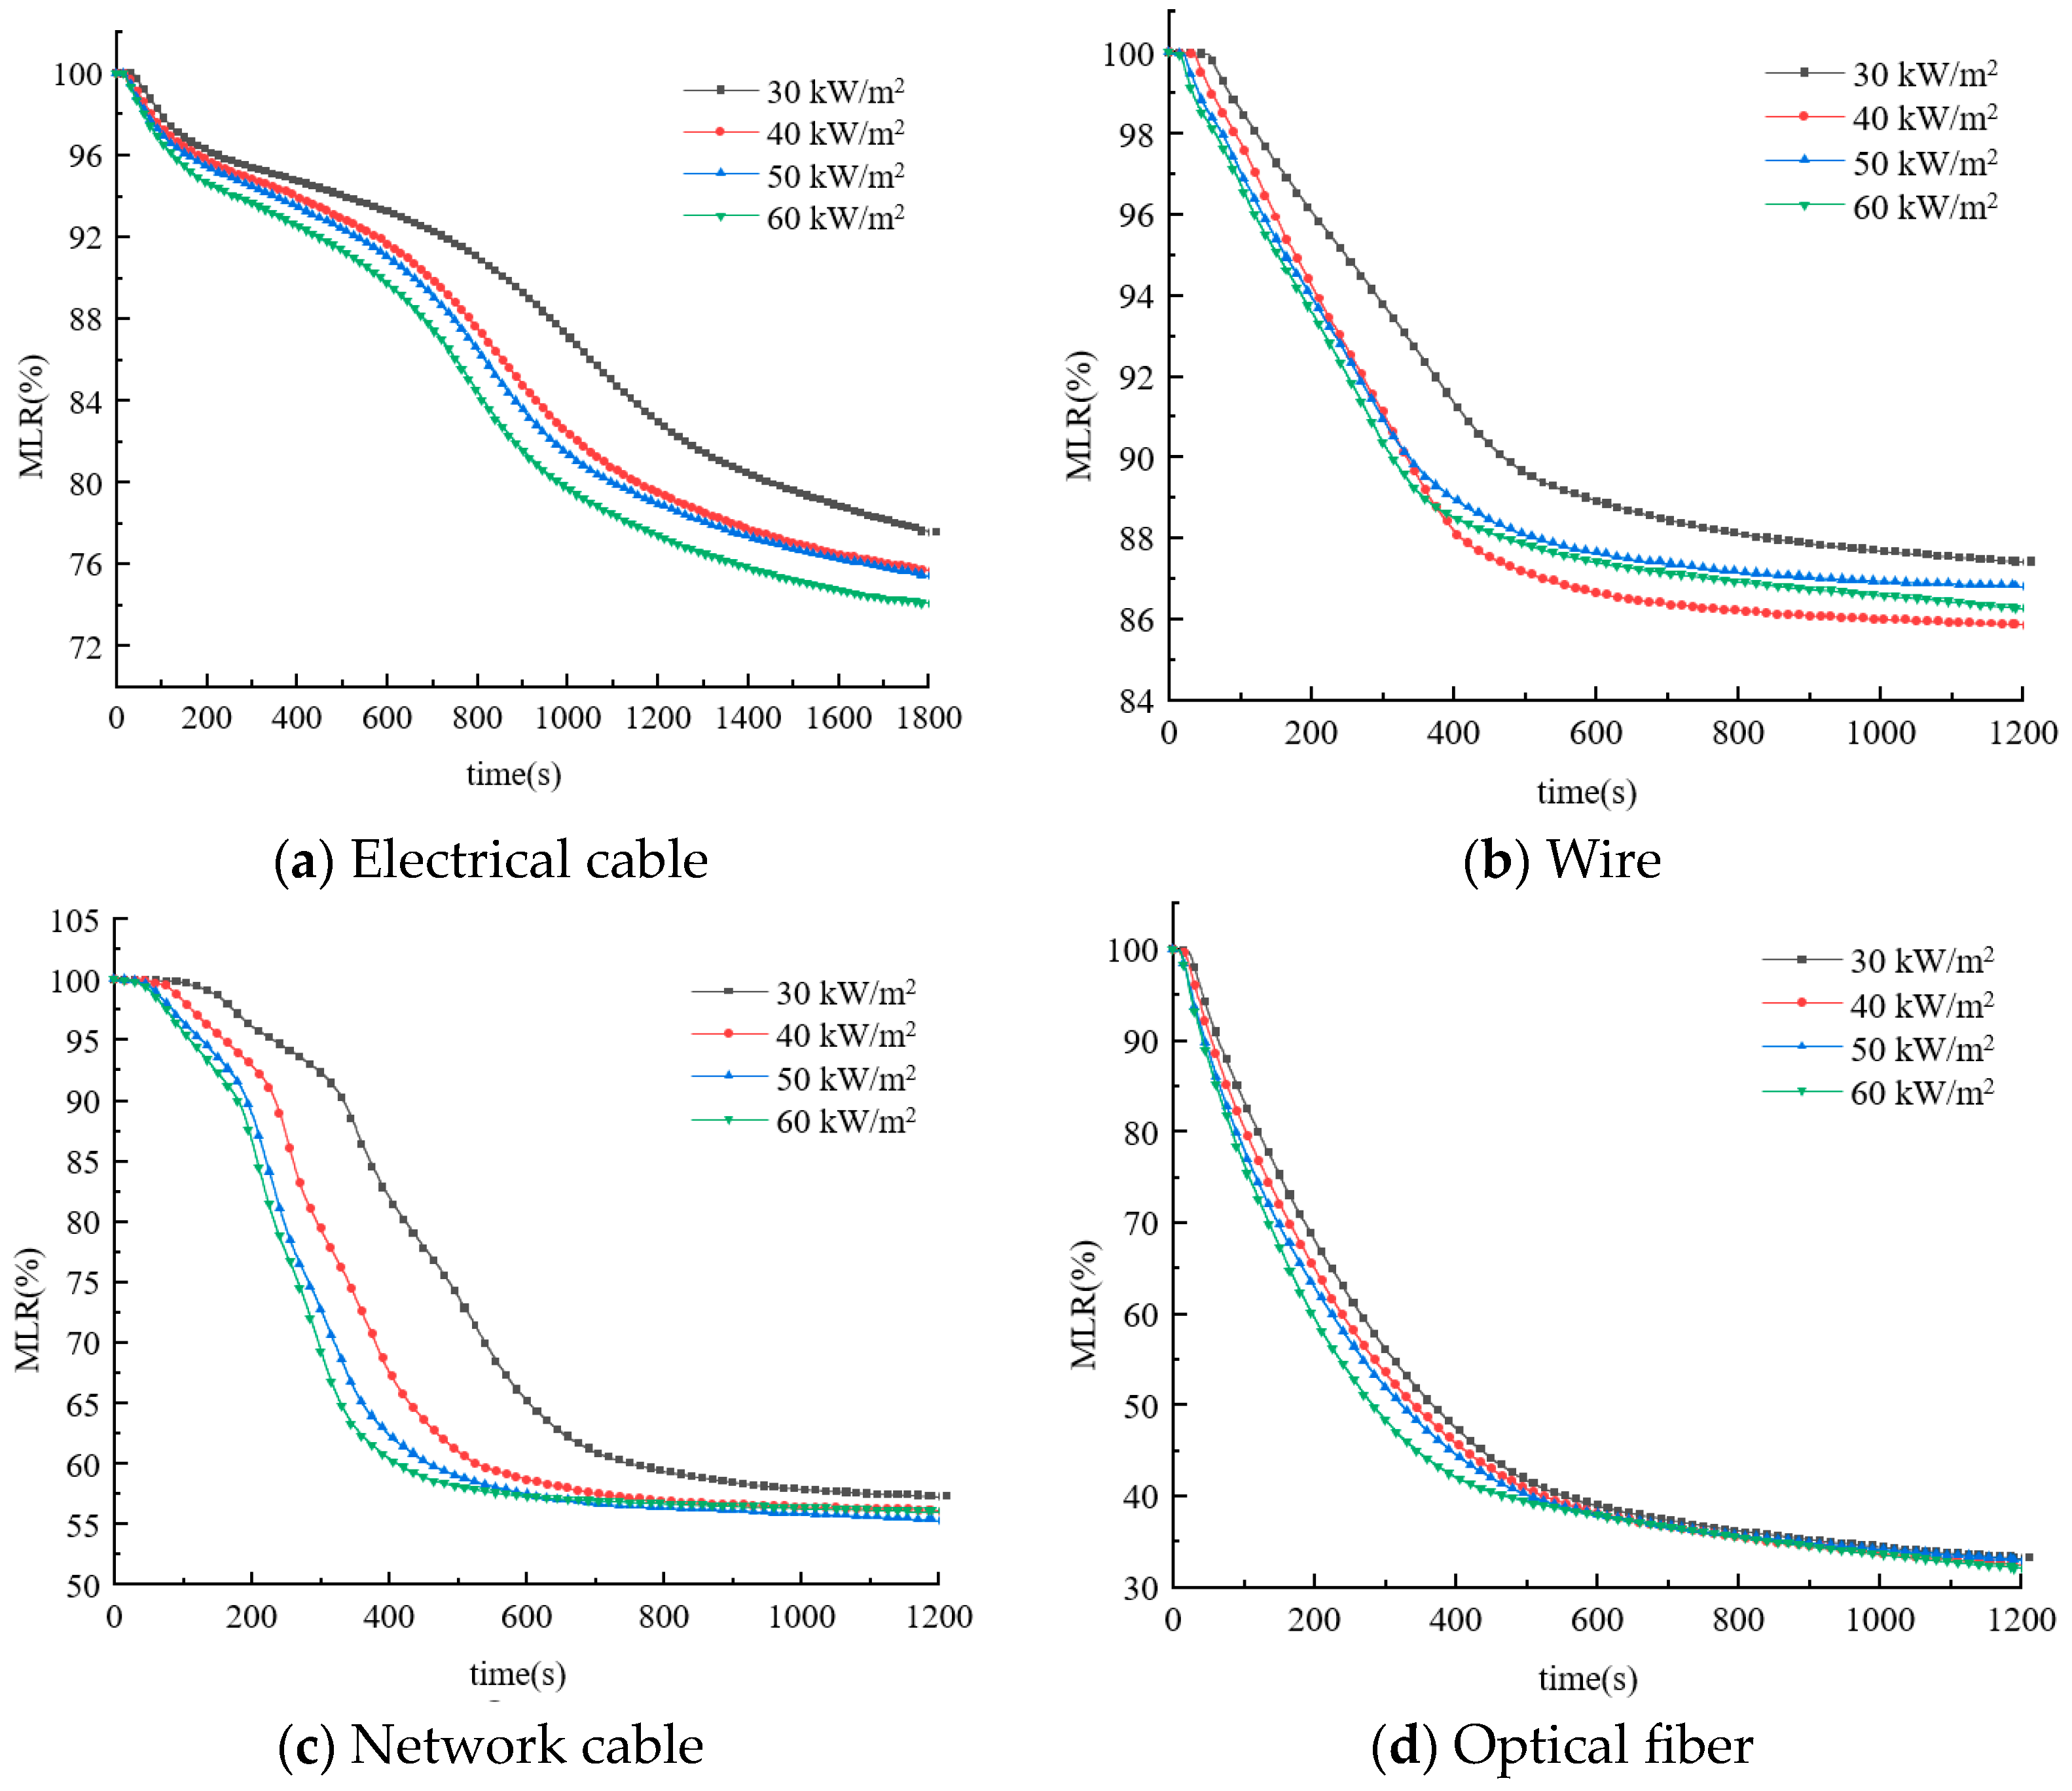
3.3. Mass Loss and Residual Mass

3.3.1. Mass Loss

Figure 3 illustrates that, with an increase in external radiation intensity, the mass loss rate (MLR) of all four cable types accelerated, with the most significant changes being observed in wires and network cables. Additionally, for cables, wires, and network cables, the increase in MLR was more pronounced at low to moderate radiation intensities compared with the increment observed at moderate to high intensities. This behavior could be attributed to the flame-retardant properties of cables. At radiation intensities exceeding 40 kW/m², the flame-retardant capabilities of cables, wires, and network cables were compromised during the initial stages of a fire. However, at radiation intensities below 40 kW/m², the flame-retardant properties of the cables played a role in delaying the combustion of materials.

3.3.2. Residual Mass

Figure 4 presents summarized data on the combustion residual mass of cables under different external radiation intensities. Analyzing the combustion residues revealed that, for the same type of cable, the differences in residual mass under various external radiation influences remained within 1%. However, significant variations in combustion residues existed among the different types of cables. For instance, at an external radiation intensity of 60 kW/m², the cable and wire experienced mass losses of 26.05% and 13.74%, respectively, while the network cable and optical fiber encountered mass losses of 43.88% and 67.97%, respectively. The maximum difference between them was 54.23%. This was due to differences in the composition of the cable materials. The copper cores in the electrical cables and wires accounted for a significant portion of the mass, with relatively fewer combustible materials in the outer sheath and insulation layers. Under the specified radiation intensity, cables and wires experienced less mass loss during thermal decomposition and combustion. In contrast, network cables had a lower mass proportion of copper cores, and optical fibers involved combustion in both the outer sheath and the inner core. So, it could be concluded that network cables and optical fibers contained lower metal components, resulting in a higher rate of mass loss. In terms of residual mass, network cables and optical fibers exhibited greater combustibility. Compared to electrical cables and wires, network cables and optical fibers had significantly lower non-combustible component percentages, resulting in a higher rate of mass loss.

3.4. Comprehensive Fire Risk Analysis

3.4.1. Thermal Hazard Analysis

The use of combustion characteristics such as ignition time, heat release rate per unit area, peak heat release rate, and mass loss had limitations and allowed only a rough estimation of the combustion behavior of the four types of cables. Consequently, this approach fell short of providing a comprehensive assessment of which material posed the greatest overall fire hazard. To address this limitation and to investigate the overall fire hazard of different cables under various radiation intensities, this study adopted two parameters from Petrella’s fire hazard rating system [21]: total heat release and parameter X0. Table 6 presents Petrella’s fire hazard rating system based on parameter X0. The formula for calculating X0 is given in the following Equation (1).
X 0 = P H R R T T I
The comprehensive evaluation table for the thermal hazards of different types of cables was computed and is presented in Table 7. As shown in Table 7, it became apparent that, for the same cable type, the X0 parameter values increased with the increase in radiation intensity, indicating a corresponding escalation in the risk of fire. When using X0 as the benchmark for assessing various cables, it was evident that fiber optic materials exhibited the greatest flashover hazard. Based on the total heat released, the different types of cables posed varying degrees of risk. Among them, electrical cables posed the highest risk for total heat release, indicating the highest level of danger. Following closely were the network cables and fiber optics, which released relatively lower amounts of total heat during the entire combustion process. Overall, a moderate to high level of fire hazard was presented by all four types of cables in the data center once the external radiation intensity had surpassed 30 kW/m². Among them, electrical cables exhibited the greatest overall risk of fire, followed by fiber optics and network cables, while wires posed the least danger.

3.4.2. Smoke Toxicity Analysis

The toxicity of smoke produced during cable combustion was comprehensively assessed using the smoke production rate, CO release rate, and FED method. Certainly, during the combustion process of cables, the main component of the flame-retardant outer sheath, PVC, produces harmful chlorine gas. However, our experimental equipment at that time could not accurately measure chlorine gas data. This limitation was primarily due to technical constraints of the equipment and the limited availability of facilities for monitoring this specific gas in our region. Therefore, our toxicity analysis primarily focused on parameters we could accurately measure, such as smoke generation and CO/CO2 emissions.
(1) Smoke production rate
The smoke production rate (SPR) was obtained by comparing the specific extinction area (SEA) with the mass loss rate (MLR). Figure 5 illustrates the smoke production rate (SPR) curves of the four cable types under different external heat radiation intensities. From the graph, it can be observed that the trends in the smoke generation rate curve and the heat release rate curve are similar. In the initial stage of material combustion, the smoke generation rate increased with an increase in external radiation. However, the smoke generation rate curve exhibited significant fluctuations, and the period of rapid smoke release coincided with the stage of high heat release rate. This indicates that the cable generated a substantial amount of smoke during the combustion phase, with the fire growing and the amount of smoke increasing simultaneously. Furthermore, the network cable exhibited the lowest smoke production rate. Under the influence of 30 kW/m2 thermal radiation, there was minimal smoke production during the initial 80 s after ignition, with SPR1 having remained below 0.007 m2/s. Additionally, following the attenuation of the fire, there was another period of approximately 150 s with almost no smoke generation. Even after 300 s, the peak smoke production rate was still under 0.035 m2/s. The network cable demonstrated effective smoke suppression characteristics during the combustion experiment.
(2) Carbon monoxide release rate
Figure 6 illustrates the CO release rate curves of the four cable types under different radiation intensities. It was evident from the graph that the CO release rate curve of the cables followed a similar pattern to that of the unit area heat release rate curve, with an increase in toxic gas emissions as the heat release intensity rose. Moreover, there were notable differences in the CO generation rates among the various cables. The network cable exhibited a significantly lower CO release rate compared with the others, with only an approximately 0.0217% CO release rate under the influence of 60 kW/m2 external heat radiation. In contrast, the CO release peaks of the other cables were generally in the range of 0.03% to 0.035%. The reason for this discrepancy was attributed to the superior smoke suppression effect of the LSZH sheathing material employed in the network cable, leading to a relatively lower CO release rate. As for the other three cable types, the distinctions in their CO release rates were less pronounced.
(3) FED method
The FED method enabled the calculation of smoke toxicity based on the composition and concentration of the combustion gases produced by the samples. In the FED testing related to CO and CO2 gases, our primary focus was CO emissions because CO posed a greater risk to human health. In this study, the concentrations of toxic components in the cable combustion products were measured using a cone calorimeter, and a mathematical model for smoke toxicity was established to quantitatively analyze the risk of cable fires. The overall smoke toxicity was computed by considering the cumulative toxicity of each component [22].
F E D = 0 i C i d t L C 50 i t
where F E D is the fractional effective dose;
C i is the concentration of toxic component i, μL/L;
L C 50 ( i ) t is the LC50 value of gas i, ppm.
As the toxic gases primarily detected in the cone calorimeter combustion experiment were CO and CO2, Equation (3) can be simplified to the following:
F E D = C O L C C O + c o 2 L C C O 2
The FED method was utilized to assess the toxicity of the smoke based on the calculated fractional effective dose. Since the measured CO2 concentration was much lower than L C C O 2 , the value of [ c o 2 ] L C C O 2 became extremely small, allowing for further simplification of the formula to the following:
F E D = C O 5000
The FED calculations under different radiation intensities are presented in Table 8, It was observed that the FED values of the four cable types at four different external radiation intensities, 30 kW/m2, 40 kW/m2, 50 kW/m2, and 60 kW/m2, ranged from 0.0203 to 0.06938, well below 1 (the FED value that would cause animal death), and did not reach a level of danger that would be fatal to humans. However, in practical scenarios, the potential risk posed by the generated toxic gases cannot be overlooked, given the number of cables involved. Table 8 indicates that, as the external radiation intensity increases, the toxicity of the smoke produced by the burning cables also increases, with the FED value of the network cable consistently remaining at the lowest level.

4. Conclusions

This study examined the combustion characteristics and overall fire risk of four frequently employed cable types under distinct external radiation levels using a cone calorimeter. The principal conclusions are outlined as follows.
Regarding the combustion characteristics of the cable, the findings revealed that, with the increase in external radiation intensity, the TTI of all four cables decreased, but the rate of reduction gradually diminished over time. Among them, the ignition time for optical fibers was the shortest, with a TTI of merely 8 s. Additionally, the heat release rate per unit area (HRRPUA) of the four cables remained relatively unchanged but reached their first peak earlier. This phenomenon was attributed to the cables experiencing higher external heat radiation, causing a rapid increase in the surface temperature and promoting thermal decomposition of the outer layer materials, leading to accelerated combustion reactions and an increase in heat release, resulting in a faster rise in the heat release rate per unit area. Furthermore, the peak heat release rate (PHRR) of the four cables showed varying degrees of increase. The total heat release (THR) for the cable exhibited a slight rise. Moreover, the mass loss rate (MLR) for all four cables was accelerated, and the proportion of mass loss for cables and wires was lower compared with those of network cables and optical fibers, with a maximum difference of 54.23%. This discrepancy primarily arose from the larger proportion of non-combustible components in cables and wires.
Our ability to determine the overall risk of fire of cables is limited when relying solely on an analysis of cable fire hazards based on their combustion characteristics. Therefore, to comprehensively evaluate the fire hazards of different types of cables, it was necessary to consider both their thermal hazards and smoke toxicities. As the external radiation intensity increased, the overall thermal hazard of all four cables increased, with electrical cables presenting the greatest risk, followed by network cables and optical fibers, and finally, wires. In the assessment of smoke toxicity, the lowest level of overall smoke toxicity among the four cable types was exhibited by network cables, while no significant difference was shown by the other three. Additionally, none of the materials reached toxic gas concentrations that could cause human fatalities. Therefore, electric cables pose the greatest overall risk of fire.
In this study, considering both thermal hazards and smoke toxicity, we ascertained that electrical cables pose the greatest risk of fire, supported by experimental data for these cables under different radiation intensities. This study provides valuable data that support the study of cable combustion characteristics in scenarios where cable hazards need to be considered.

Author Contributions

Conceptualization, B.S.; methodology, B.S. and H.L.; validation, B.S. and C.Y.; investigation, B.S. and H.L.; resources, B.S.; data curation, H.L.; writing—original draft preparation, C.Y. and H.L.; writing—review and editing, B.S. and C.Y.; visualization, H.L.; supervision, B.S.; project administration, B.S.; funding acquisition, B.S. All authors have read and agreed to the published version of the manuscript.

Funding

This research was supported by the National Natural Science Foundation of China (Grant No. 52074277) and the Natural Science Foundation of Jiangsu Province (Grant No. BK20211585).

Institutional Review Board Statement

Not applicable.

Informed Consent Statement

Not applicable.

Data Availability Statement

Data are contained within the article.

Conflicts of Interest

The authors declare no conflict of interest.

Abbreviations

TTItime to ignition
HRRPUAheat release rate per unit area
ave-HRRaverage heat release rate
PHRRpeak heat release rate
THRtotal heat release
MLRmass loss rate
SPRsmoke production rate
SEAsmoke extinction area
FEDfractional effective dose

References

  1. Xue, Y. Experimental Research on Fire Spread of PE and ETFE Conductors under Low-Pressure Conditions. Ph.D. Thesis, University of Science and Technology of China, Hefei, China, 2017. [Google Scholar]
  2. Zhu, K. Research on Horizontal and Inclined Fire Spread Behavior of Inner Core Wires with Different Thermal Conductivity under Low-Pressure Conditions. Ph.D. Thesis, University of Science and Technology of China, Hefei, China, 2019. [Google Scholar]
  3. Huang, X.; Nakamura, Y. A Review of Fundamental Combustion Phenomena in Wire Fires. Fire Technol. 2020, 56, 315–360. [Google Scholar] [CrossRef]
  4. Fontaine, G.; Ngohang, F.E.; Gay, L.; Bourbigot, S. Investigation of the Contribution to Fire of Electrical Cable by a Revisited Mass Loss Cone. In Fire Science and Technology 2015: The Proceedings of 10th Asia-Oceania Symposium on Fire Science and Technology; Springer: Singapore, 2017; pp. 687–693. [Google Scholar]
  5. Zheng, X.; Cai, G.; Guo, J.; Gao, W.; Huang, Y.; Tong, X. Combustion Characteristics and Thermal Decomposition Mechanism of the Flame-Retardant Cable in Urban Utility Tunnel. Case Stud. Therm. Eng. 2023, 44, 102887. [Google Scholar] [CrossRef]
  6. Elliot, P.; Whiteley, R. A Cone Calorimeter Test for the Measurement of Flammability Properties of Insulated Wire. Polym. Degrad. Stab. 1999, 64, 577–584. [Google Scholar] [CrossRef]
  7. Barnes, M.A.; Briggs, P.J.; Hirschler, M.M.; Matheson, A.F.; O’Neill, T.J. A Comparative Study of the Fire Performance of Halogenated and Non-Halogenated Materials for Cable Applications. Part I Tests on Materials and Insulated Wires. Fire Mater. 1996, 20, 17–37. [Google Scholar] [CrossRef]
  8. Tang, K.; Zhang, Y.; Jiang, S.; Li, C.; Ma, C.; Liu, G.; Zhang, H.; Yuan, B. A Comparative Study on Fire Hazards of Cables Used in Nuclear Power Plants Based on Small- and Large-Scale Experiments. J. Therm. Anal. Calorim. 2022, 147, 14659–14671. [Google Scholar] [CrossRef]
  9. Matheson, A.F.; Charge, R.; Corneliussen, T. Properties of PVC Compounds with Improved Fire Performance for Electrical Cables. Fire Saf. J. 1992, 19, 55–72. [Google Scholar] [CrossRef]
  10. Hirschler, M.M. Survey of Fire Testing of Electrical Cables. Fire Mater. 1992, 16, 107–118. [Google Scholar] [CrossRef]
  11. Kaczorek-Chrobak, K.; Fangrat, J.; Papis, B.K. Calorimetric Behavior of Electric Cables. Energies. 2021, 14, 1007. [Google Scholar] [CrossRef]
  12. Mun, S.Y.; Hwang, C.H. Experimental and Numerical Studies on Major Pyrolysis Properties of Flame Retardant PVC Cables Composed of Multiple Materials. Materials 2020, 13, 1712. [Google Scholar] [CrossRef] [PubMed]
  13. Shi, C.; Qian, X.; Zhang, Y.; Jing, J.; Ren, F.; Li, J. Research on the Combustion Characteristics of ZR-YJLV Cables Based on Flame Propagation Calorimetry. China Saf. Prod. Sci. Technol. 2020, 16, 17–21. [Google Scholar]
  14. Zhang, J.; Guo, Y.; Feng, R.; Li, K.; Huang, Y.; Shang, F. Characteristics and Reaction Mechanism of Pyrolysis Solid Gas Products of Typical Substation Flame-Retardant Low-Voltage Cable Outer Sheath Materials under Fire Conditions. J. Tsinghua Univ. (Nat. Sci. Ed.) 2022, 62, 33–42. [Google Scholar]
  15. Sun, Z. Experimental Analysis and Numerical Simulation of Radiation Ignition Behavior of Subway Cables; Capital University of Economics and Business: Beijing, China, 2019. [Google Scholar]
  16. ISO 5660-1; Reaction-to-Fire Tests-Heat Release, Smoke Production and Mass Loss Rate-Part1 Release Rate (Cone Calorimeter Method) and Smoke Production Rate (Dynamic Measurement). International Organization for Standardization (IOS): Geneva, Switzerland, 2015.
  17. Meinier, R.; Sonnier, R.; Zavaleta, P.; Suard, S.; Ferry, L. Fire Behavior of Halogen-Free Flame Retardant Electrical Cables with the Cone Calorimeter. J. Hazard. Mater. 2018, 342, 306–316. [Google Scholar] [CrossRef] [PubMed]
  18. Chen, R. Research on Pyrolysis and Combustion Characteristics of Typical Interior Materials of Subway Trains; University of Science and Technology of China: Hefei, China, 2016. [Google Scholar]
  19. Zhou, Q. Comparison of Experimental Methods for Fire Response of Materials. Fire Sci. Technol. 2007, 2007, 34–37. [Google Scholar]
  20. Shu, Z.; Xu, X.; Li, X. Fire Combustion Performance Evaluation of Polymer Materials: Cone Calorimeter Test Method; Chemical Industry Press: Beijing, China, 2007. [Google Scholar]
  21. Petrella, R. The Assessment of Full-Scale Fire Hazards from Cone Calorimeter Data. J. Fire Sci. 1994, 12, 14–43. [Google Scholar] [CrossRef]
  22. Mao, Y. Research on Fire Protection Development System of Passenger Cars Based on Fire Risk Analysis; University of Science and Technology of China: Hefei, China, 2019. [Google Scholar]
Figure 1. Effect of experimental material treatment.
Fire 06 00431 g001
Figure 2. HRRPUA curves of cables under different radiation powers.
Fire 06 00431 g002
Figure 3. Mass loss of cables under different radiation intensities.
Fire 06 00431 g003
Figure 4. Residual mass of cables under different radiation intensities.
Fire 06 00431 g004
Figure 5. Smoke production rate of cables under different radiation intensities.
Fire 06 00431 g005
Figure 6. Carbon monoxide release rate of cables under different radiation intensities.
Fire 06 00431 g006
Table 1. Material manufacturers and sizes.
TypeManufacturerSize
Electrical cableKangpu Technology Co., Ltd. (Suzhou, China)100 mm
WireHenggong Technology Co., Ltd. (Taizhou, China)100 mm
Network cableKangpu Technology Co., Ltd. (Suzhou, China)100 mm
Optical fiberYoupuguang Technology Co., Ltd.(Shenzhen, China)100 mm
Table 2. Experimental condition setting for cone calorimeter combustion test.
NO.Cable TypeOuter SheathInsulating LayerIntensity of External Heat Radiation
(kW/m2)
T-1Electrical cableFlame-retardant PVCXLPE30
T-240
T-350
T-460
T-5WireFlame-retardant PVCNone30
T-640
T-750
T-860
T-9Network cableLSZHHDPE30
T1040
T-1150
T-1260
T-13Optical fiberPVCNone30
T-1440
T-1550
T-1660
Table 3. Summary of ignition time of different types of cables.
TTI(s)Intensity of External Heat Radiation
30 kW/m240 kW/m250 kW/m260 kW/m2
Electrical cable37251815
Wire54332013
Network cable151774946
Optical fiber191288
Table 4. Peak heat release rate and average heat release rate under different operating conditions.
NO.TypeIntensity of External Heat Radiation (kW/m2)PHRR (kW/m2)TP (s)ave-HRR1ave-HRR3ave-HRR5
T-1Electrical cable30243.98 ± 1.281038166.55145.47114.84
T-240284.14 ± 1.31826198.10153.93124.98
T-350316.08 ± 2.73837204.67156.97128.88
T-460333.74 ± 2.63792216.71177.71146.89
T-5Wire30130.67 ± 1.5276110.62112.49112.12
T-640147.33 ± 1.3355117.50130.83129.35
T-750151.83 ± 3.2939114.35121.06117.01
T-860162.73 ± 2.7333120.52121.06118.46
T-9Network cable30463.59 ± 3.4636053.0375.07180.10
T1040653.03 ± 5.1726469.48144.08247.42
T-1150644.63 ± 2.8923590.65190.67296.59
T-1260676.31 ± 3.6821395.29213.88325.40
T-13Optical fiber30206.51 ± 1.8946165.90161.01150.87
T-1440217.36 ± 1.7444170.56159.79145.38
T-1550242.87 ± 2.6531192.27167.41148.99
T-1660261.72 ± 2.5632202.46179.65158.29
Table 5. Total heat release of cables under different radiation intensities.
THR (MJ/m2)Intensity of External Heat Radiation
30 kW/m240 kW/m250 kW/m260 kW/m2
Electrical cable245.47 259.33 266.89 262.26
Wire71.88 65.07 59.63 63.49
Network cable127.21 120.33 121.77 122.31
Optical fiber77.13 69.41 70.74 73.71
Table 6. Petrella thermal hazard assessment.
ValueTotal Heat Release (THR)X0 Parameter
0.1–1Ultra-low riskLow risk
1–10Low riskMedium risk
10–100Medium riskHigh risk
100–1000High risk--
Table 7. Comprehensive assessment form for cable thermal hazard.
NO.TypeIntensity of External Heat Radiation
(kW/m2)
TTI
(s)
THR
(MJ/m2)
X0 ParameterOverview
T-1Electrical cable3037245.47 ± 1.26
high risk
6.59
medium risk
Medium to high risk
T-24025259.33 ± 1.28
high risk
11.37
high risk
high risk
T-35018266.89 ± 2.11
high risk
17.56
high risk
high risk
T-46015262.26 ± 2.34
high risk
22.25
high risk
high risk
T-5Wire305471.88 ± 0.57
medium risk
2.42
medium risk
medium risk
T-6403365.07 ± 0.82
medium risk
4.46
medium risk
medium risk
T-7502059.63 ± 1.58
medium risk
7.59
medium risk
medium risk
T-8601363.49 ± 2.10
medium risk
12.52
high risk
Medium to high risk
T-9Network cable30151127.20 ± 1.07
high risk
3.07
medium risk
Medium to high risk
T104077120.33 ± 1.82
high risk
8.48
medium risk
Medium to high risk
T-115049121.77 ± 2.42
high risk
13.16
high risk
high risk
T-126046122.31 ± 2.26
high risk
14.74
high risk
high risk
T-13Optical fiber301977.13 ± 1.52
medium risk
10.87
high risk
Medium to high risk
T-14401269.41 ± 1.95
medium risk
18.21
high risk
Medium to high risk
T-1550870.74 ± 2.49
medium risk
30.36
high risk
Medium to high risk
T-1660873.70 ± 2.76
medium risk
32.71
high risk
Medium to high risk
Table 8. Smoke toxicity of cable combustion under different operating conditions.
NO.TypeIntensity of External Heat Radiation (kW/m2)CO Peak (ppm)FED = [CO]/5000
T-1Electrical cable30250.7 ± 1.500.0501
T-240256.5 ± 1.280.0513
T-350269.3 ± 2.110.0539
T-460308.3 ± 2.080.0617
T-5Wire30208.4 ± 1.020.0417
T-640253.2 ± 1.540.0506
T-750262.9 ± 2.170.0526
T-860322.8 ± 3.010.0646
T-9Network cable30101.5 ± 1.210.0203
T1040133.4 ± 1.360.0267
T-1150168.4 ± 2.270.0337
T-1260217.3 ± 2.510.0435
T-13Optical fiber30253.5 ± 1.230.0507
T-1440302.8 ± 1.550.0606
T-1550328.0 ± 1.870.0656
T-1660346.9 ± 2.140.0694
Disclaimer/Publisher’s Note: The statements, opinions and data contained in all publications are solely those of the individual author(s) and contributor(s) and not of MDPI and/or the editor(s). MDPI and/or the editor(s) disclaim responsibility for any injury to people or property resulting from any ideas, methods, instructions or products referred to in the content.

