
Numerical Simulation of Flow and Flame Dynamics of a Pool Fire Under Combined Effects of Wind and Slope

Abstract
1. Introduction
2. Numerical Models
2.1. Governing Equations
2.2. Numerical Schemes
3. Results and Discussion
3.1. Transient Temperature and Vortex Structure
3.2. Effect of Wind Velocity on the Mean Fields
4. Conclusions
- Under a wind speed of 0.5 m/s, a flame develops immediately downstream of the fire source and sustains two flanks of plume. Further downstream, the plume starts to rise due to buoyant force. A hairpin vortex is observed along the plume structure and is advected downstream with a smaller intensity and higher location.
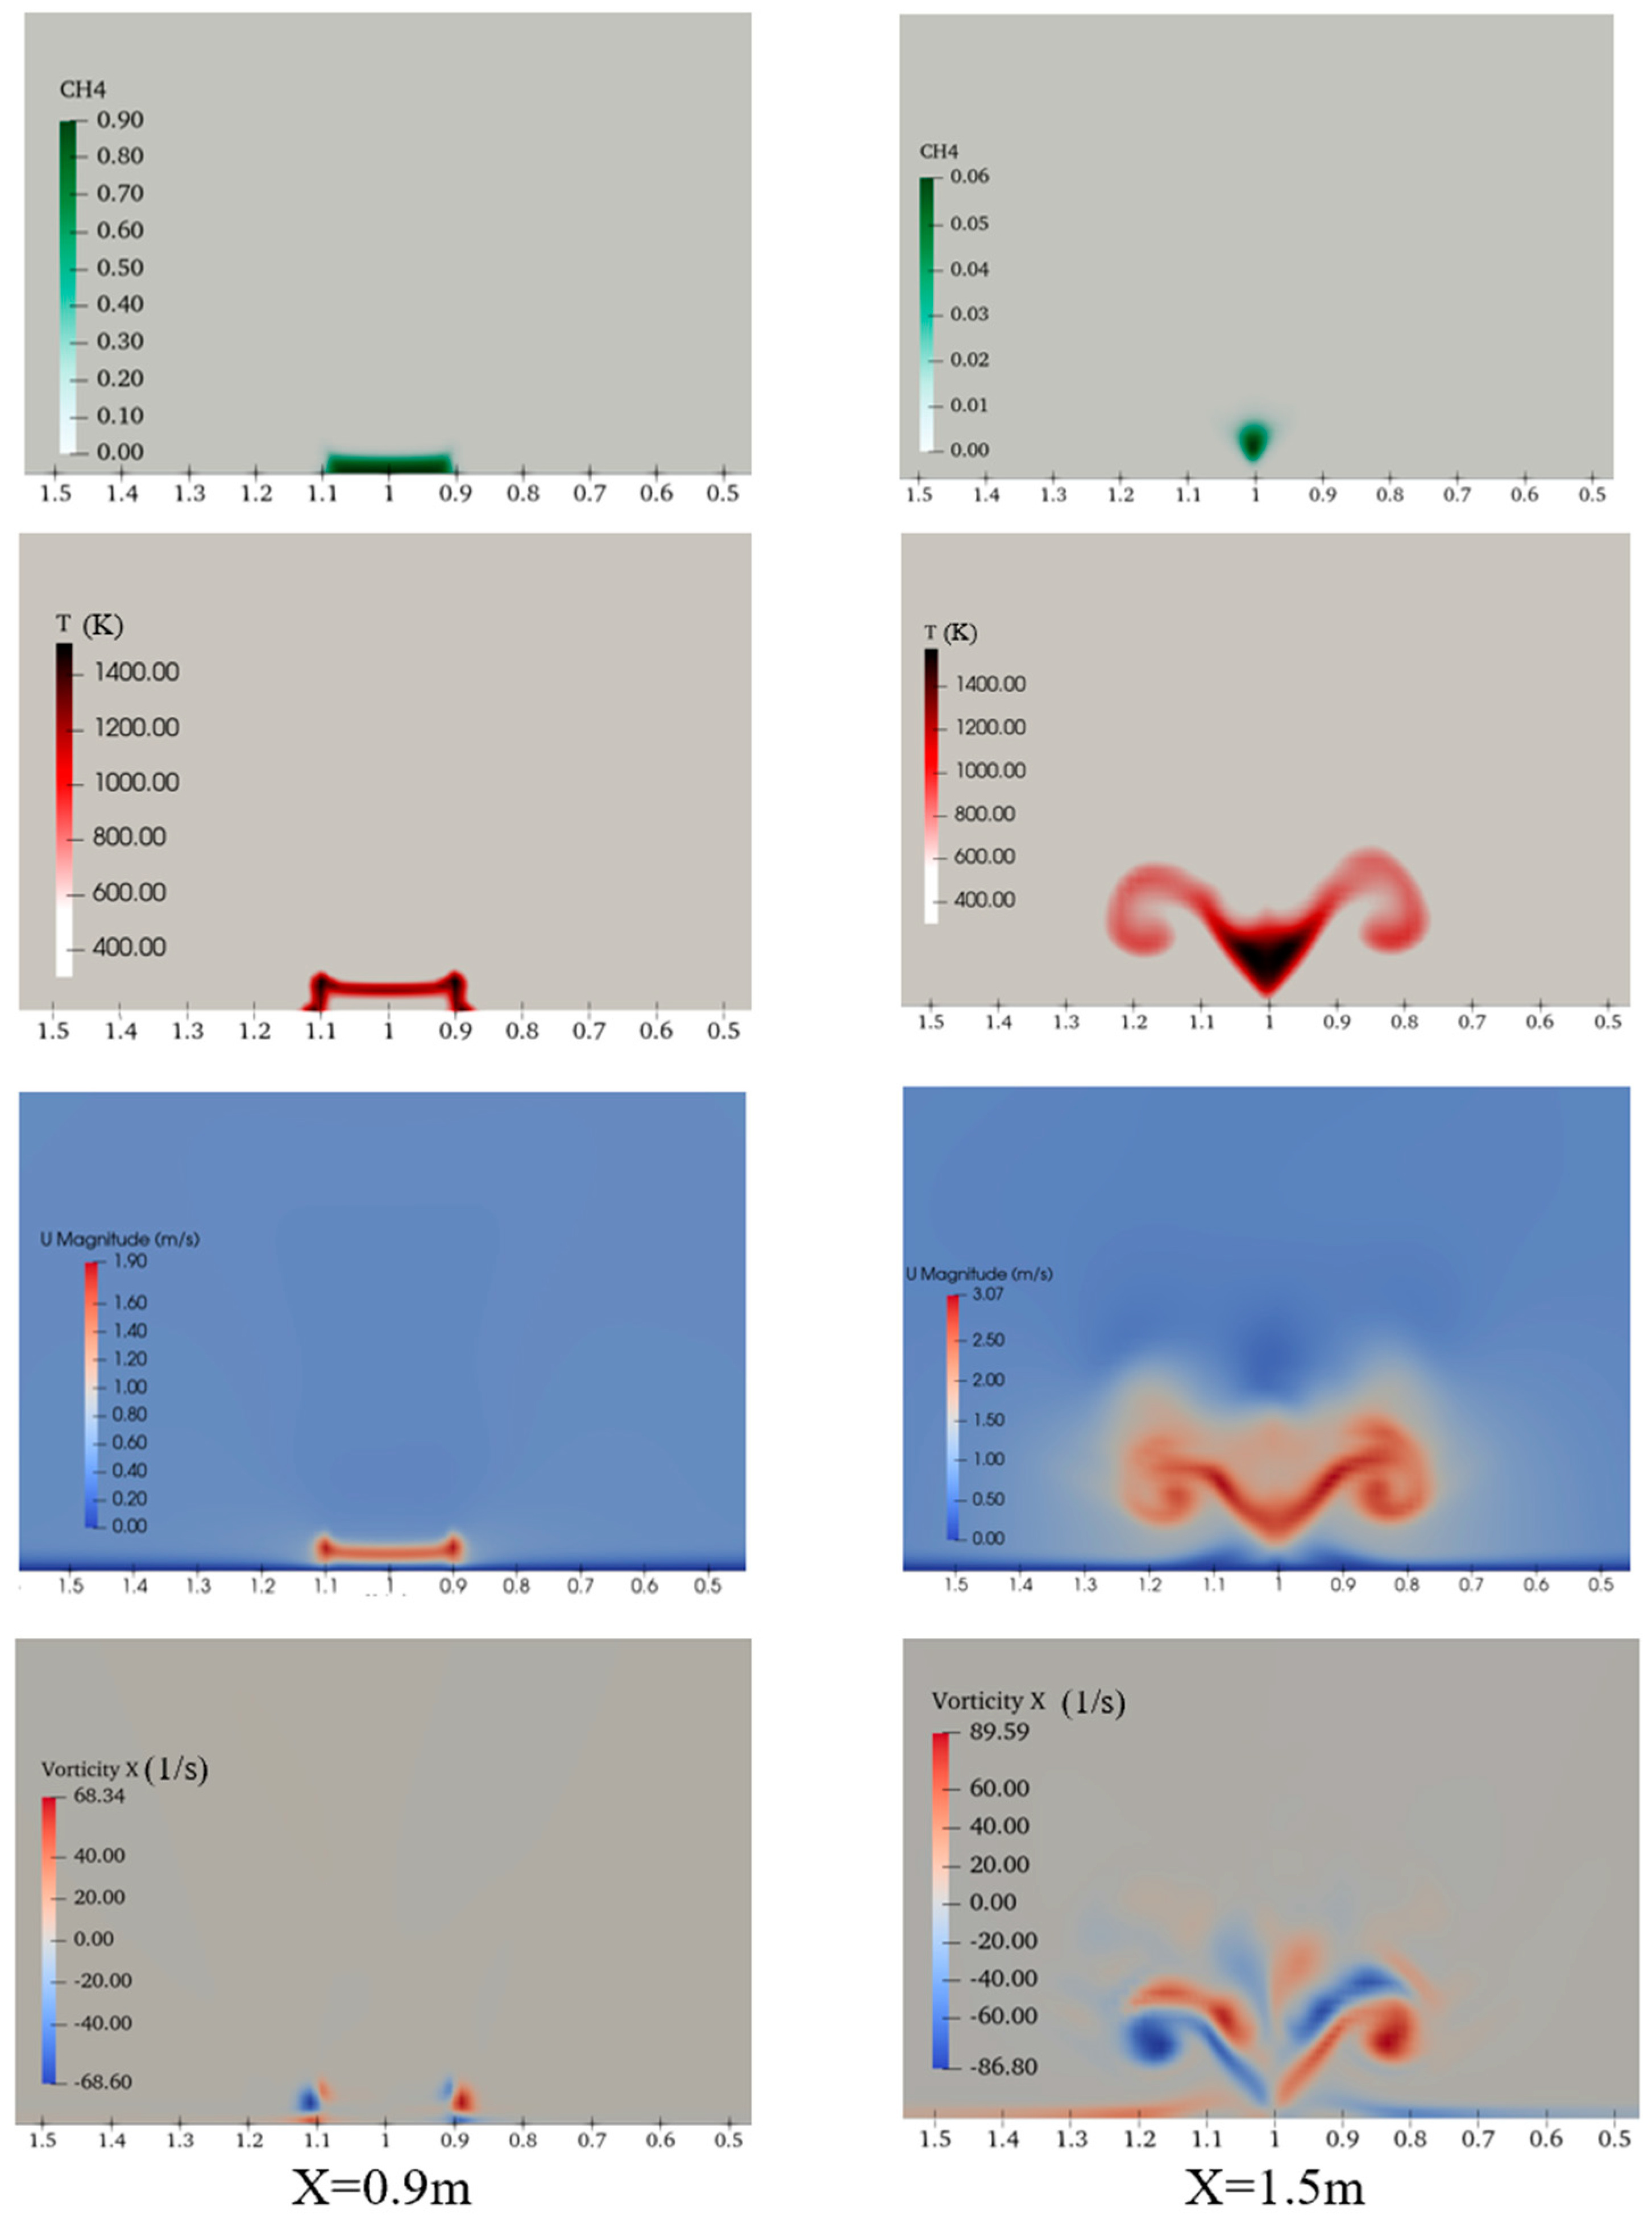
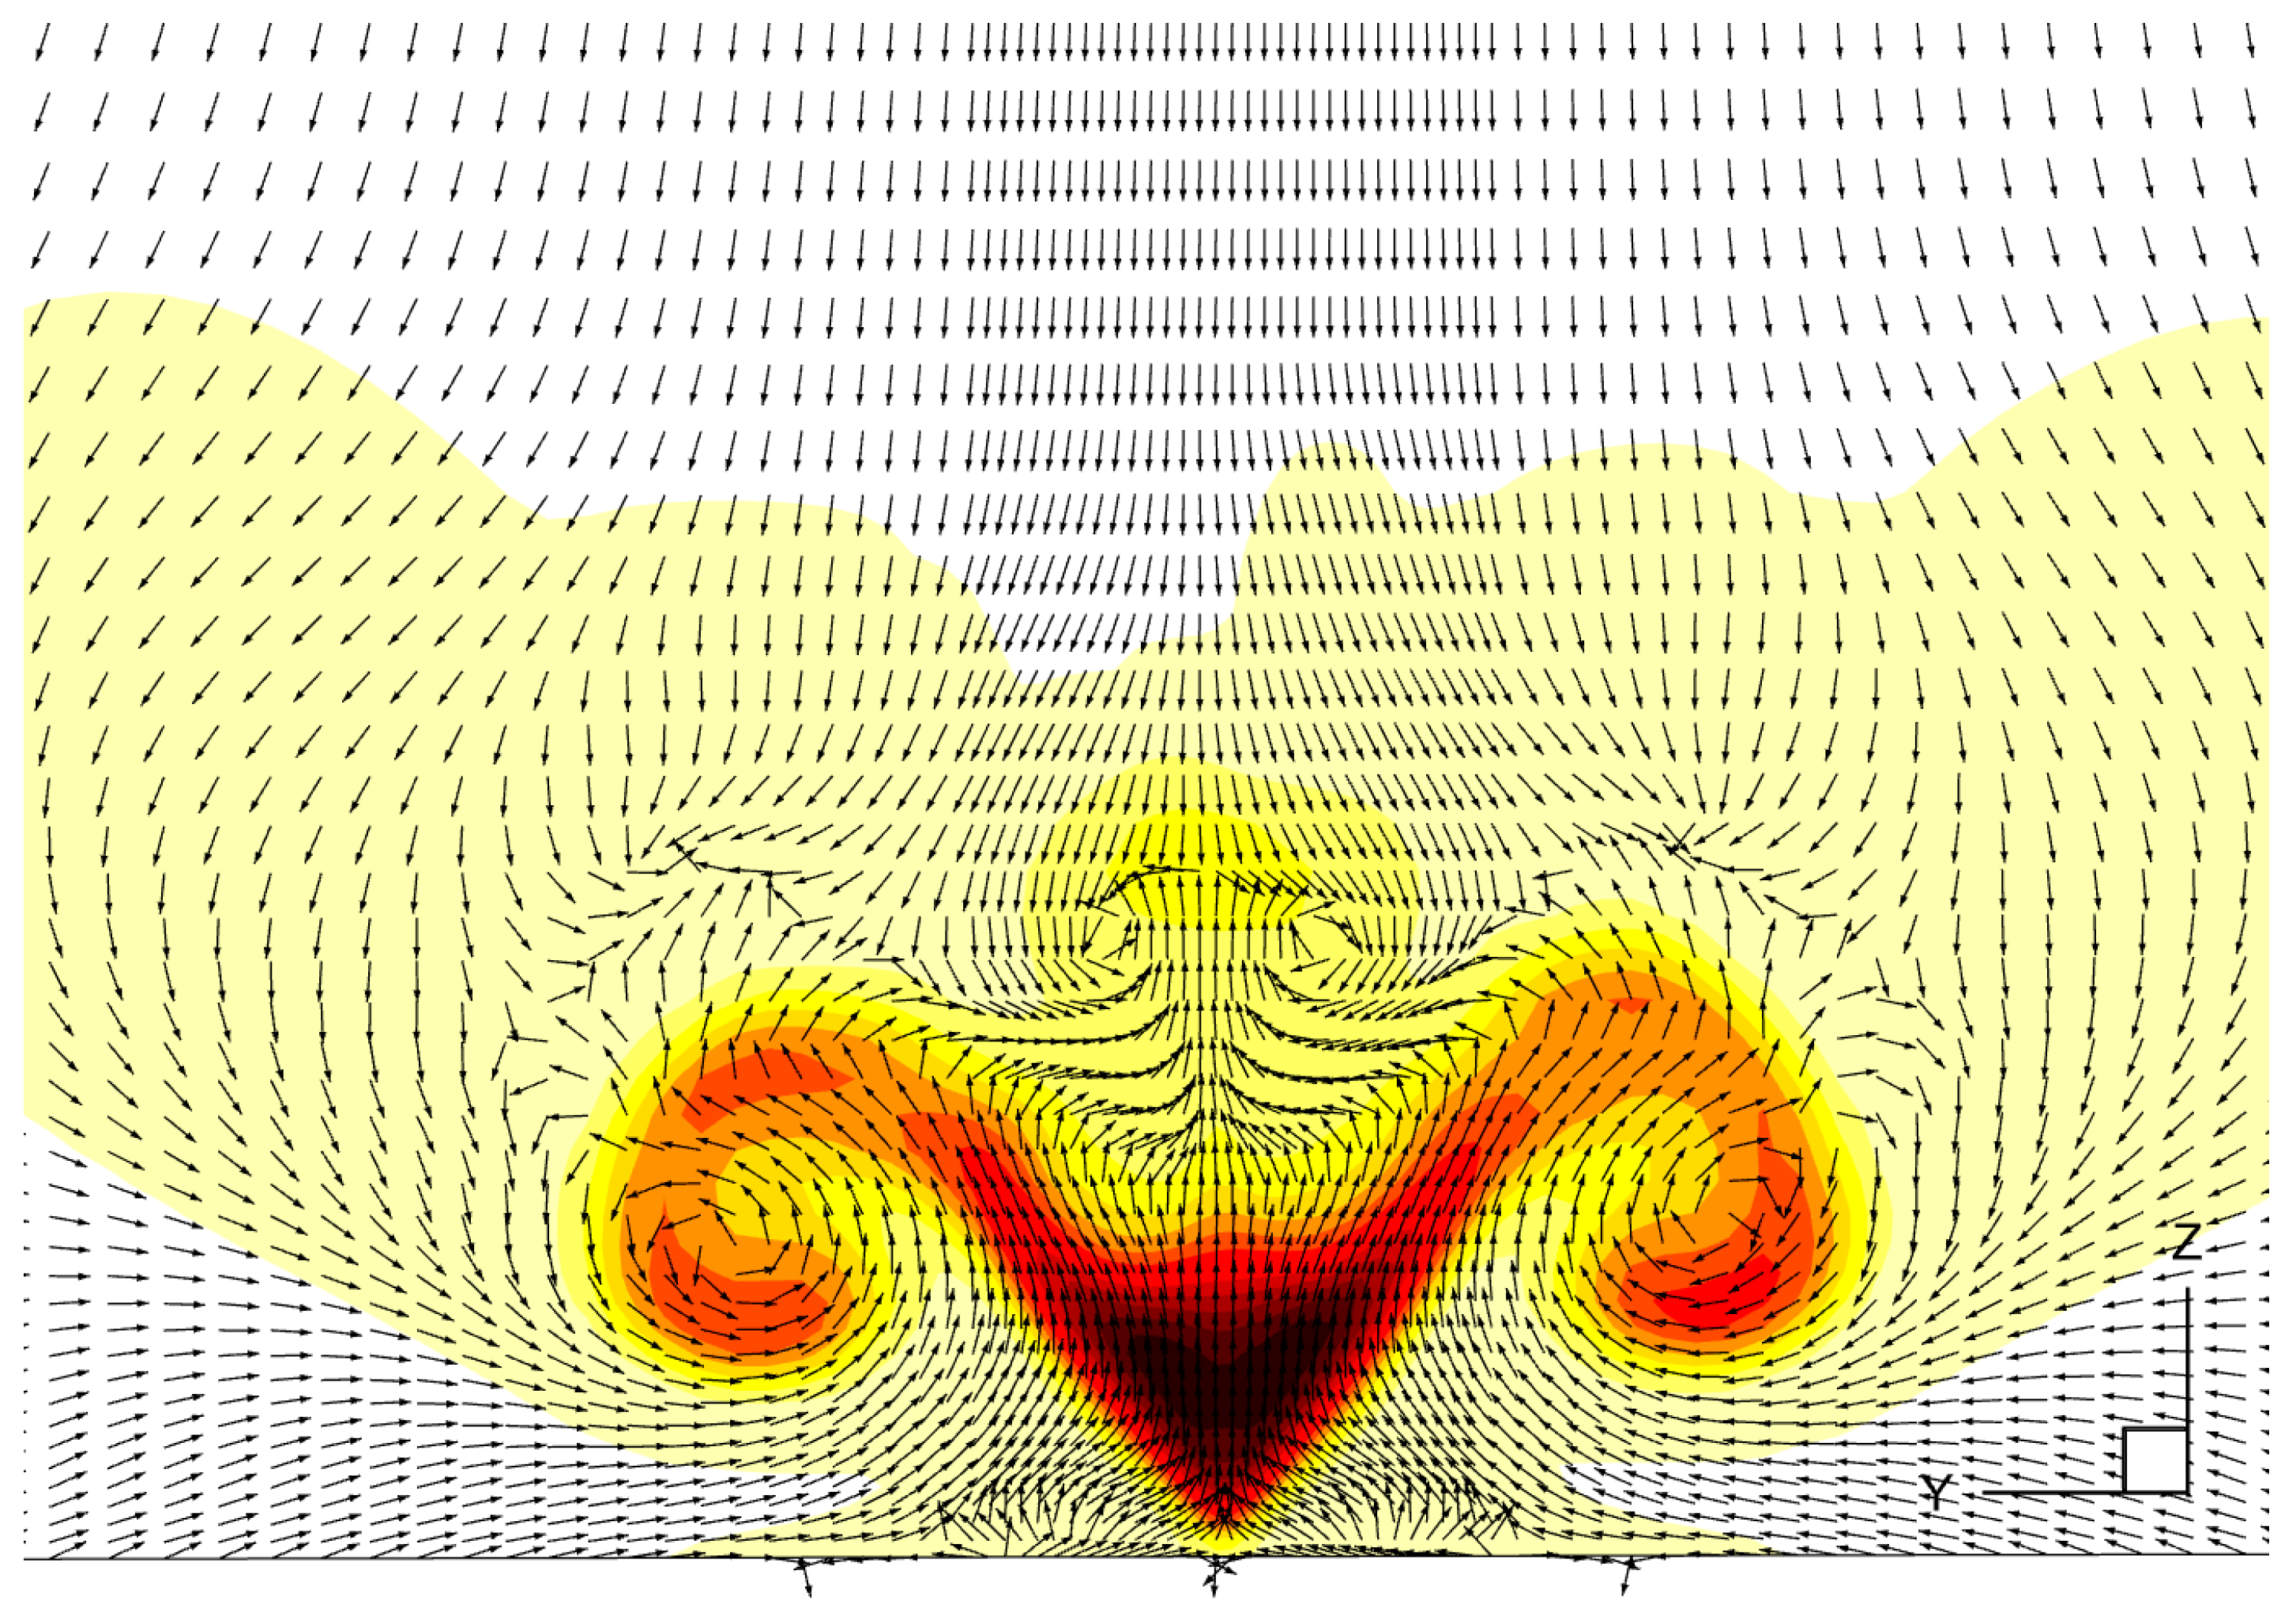
- The temperature, velocity, and vorticity distributions show significantly different shapes at different streamwise locations. Near the fire source, the flame is confined to a small region around the fire source. Downstream, unburned methane advected from upstream looks like an upside-down triangle. The temperature shows a similar shape in the center region, but with two large plume wings, which is caused by the strong air circulation from the environment to the center region. The air circulation flows inside when moving downstream in a cylindrical spiring pattern.
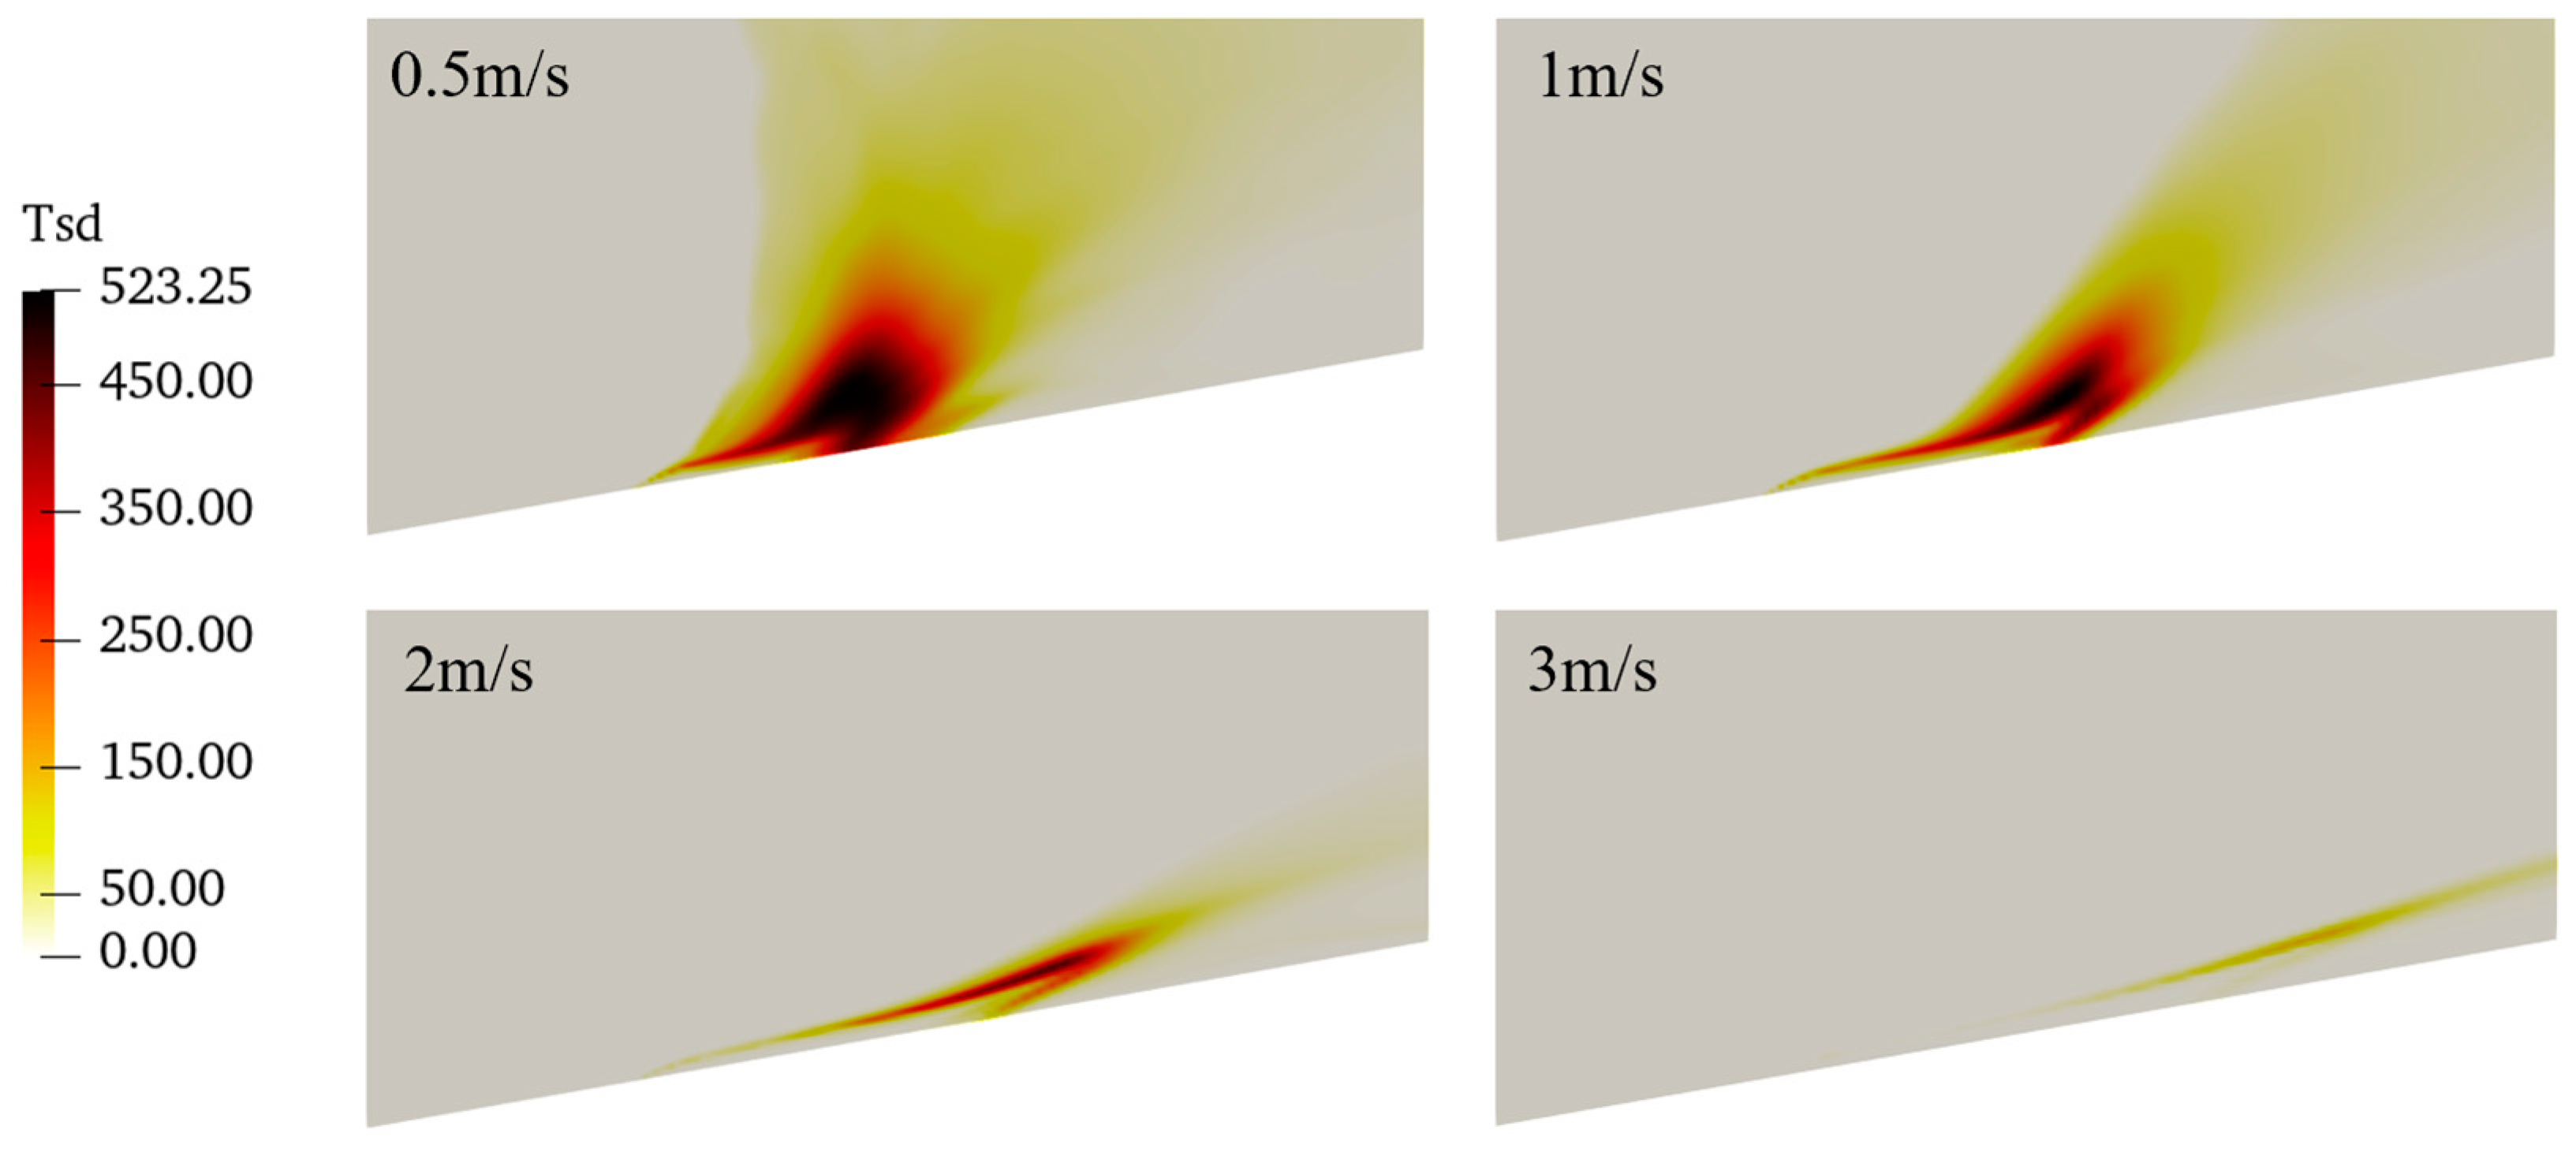
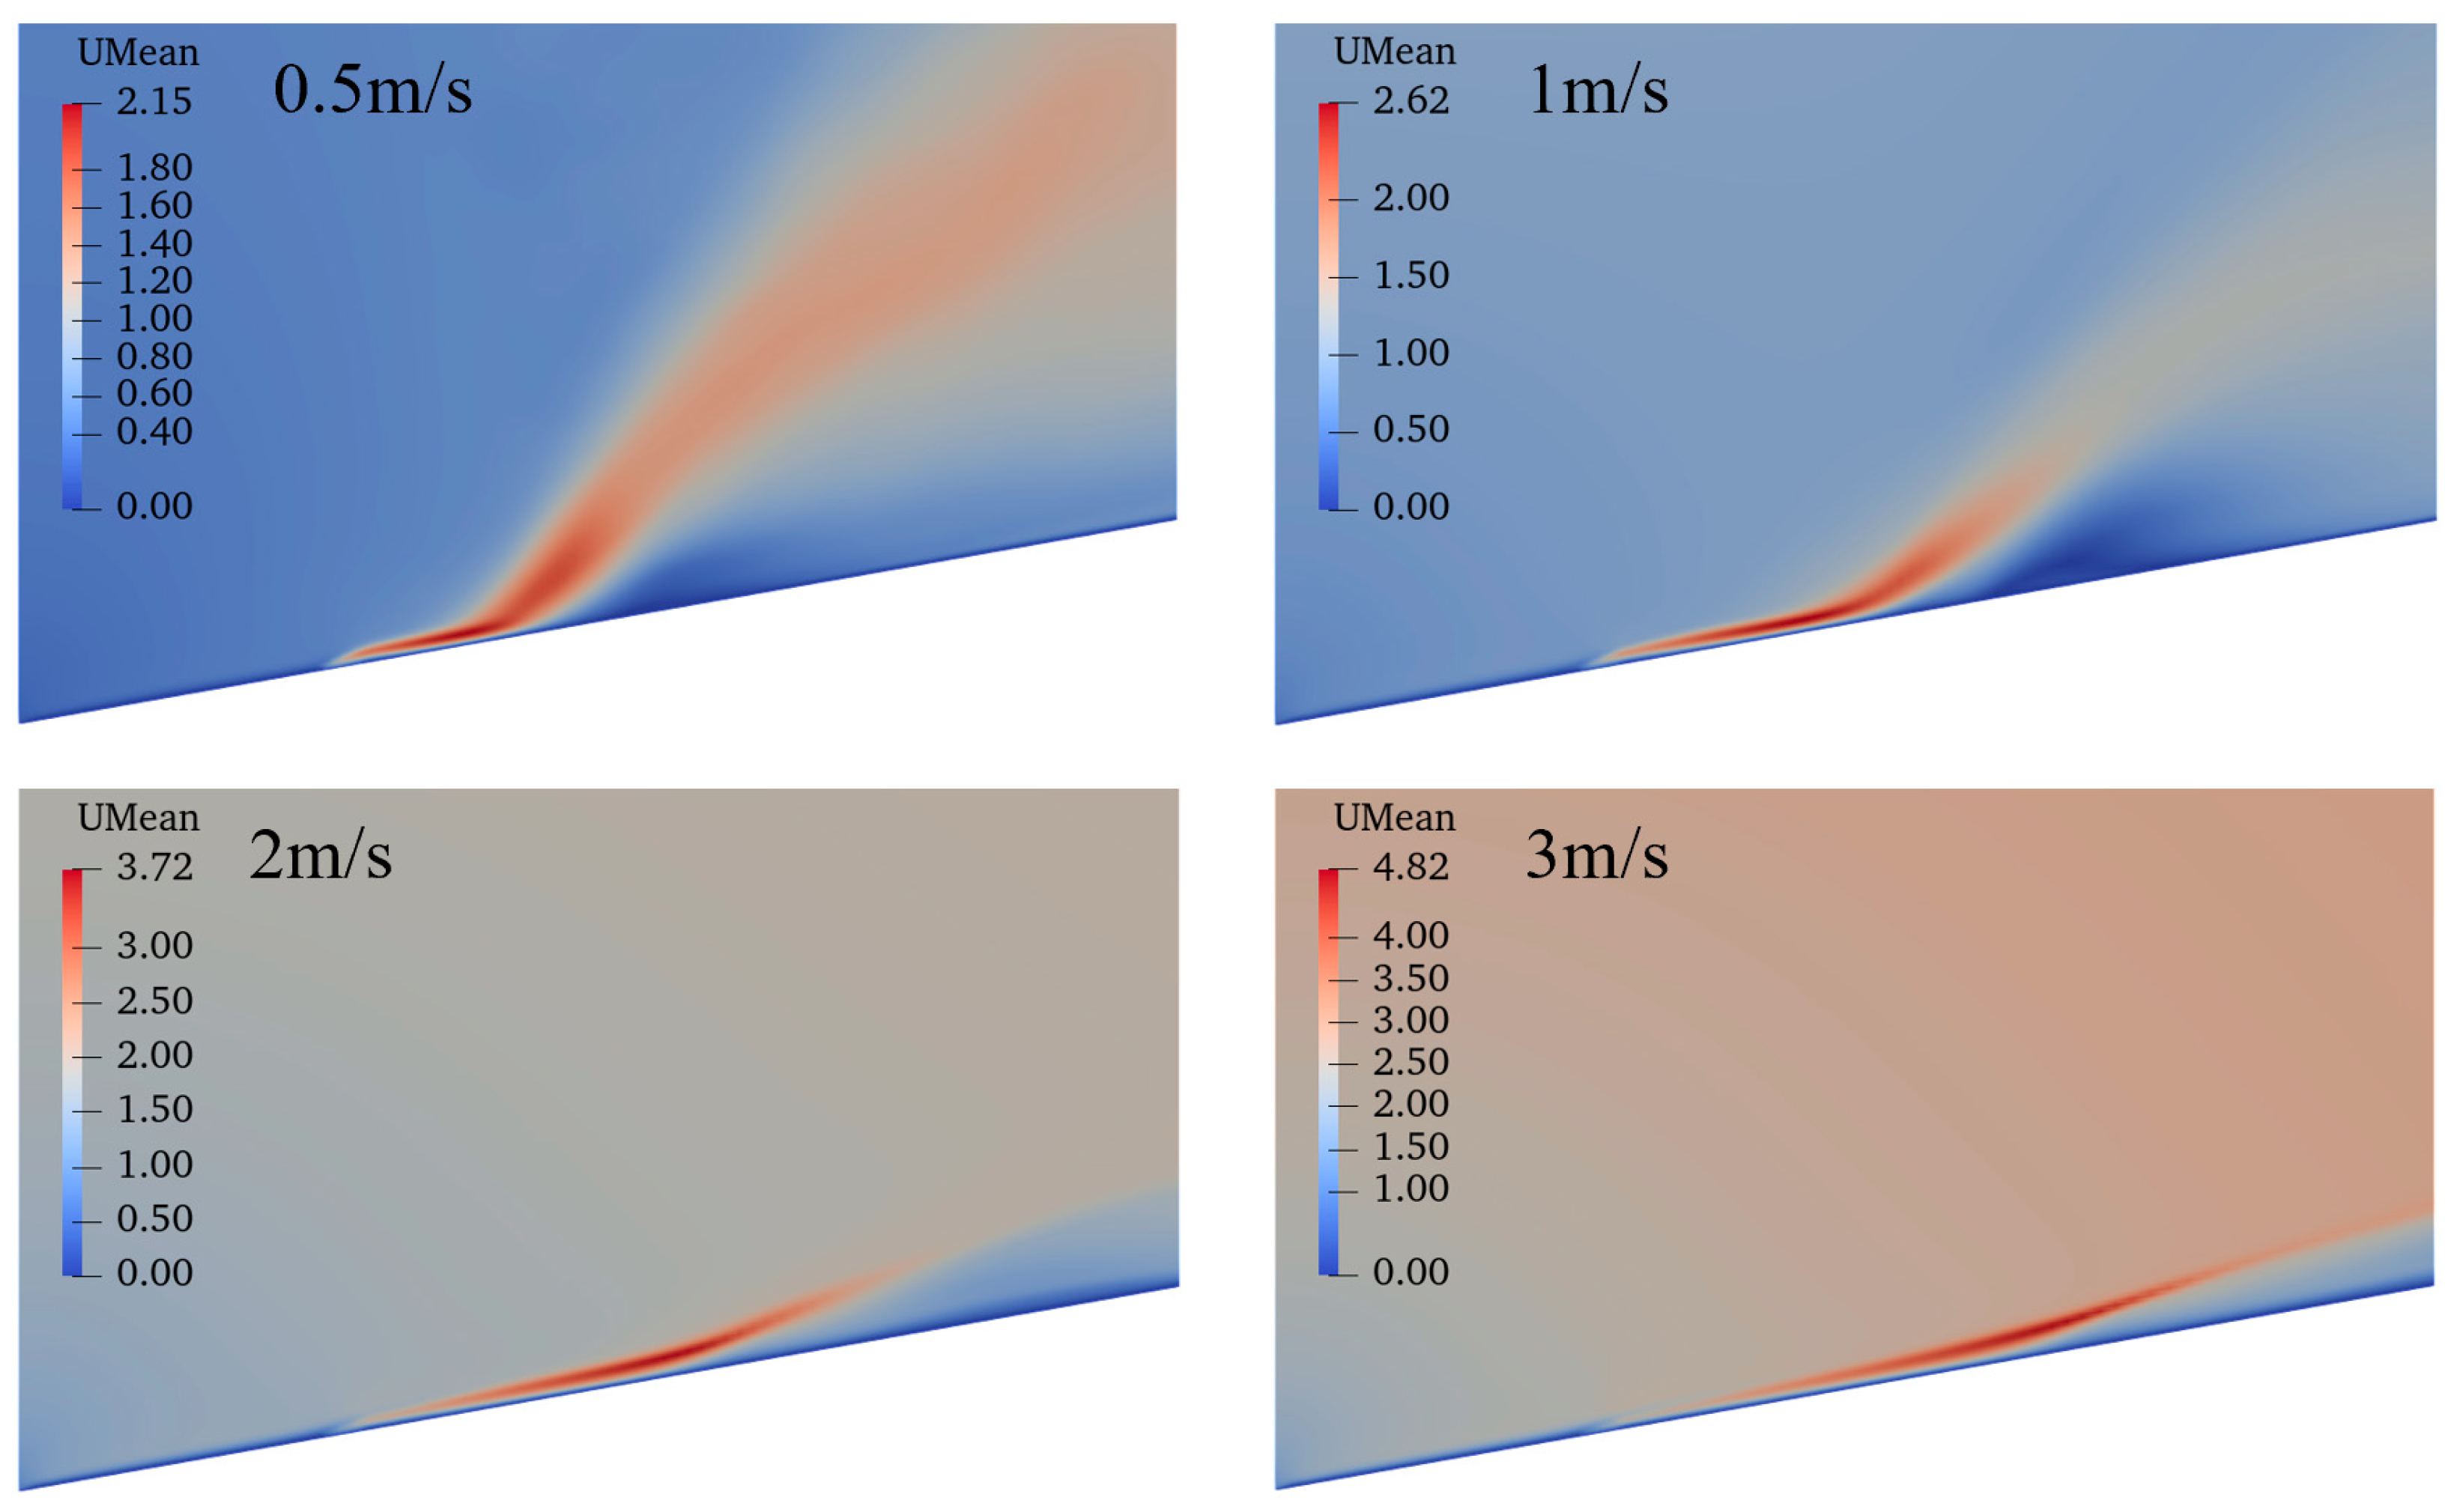
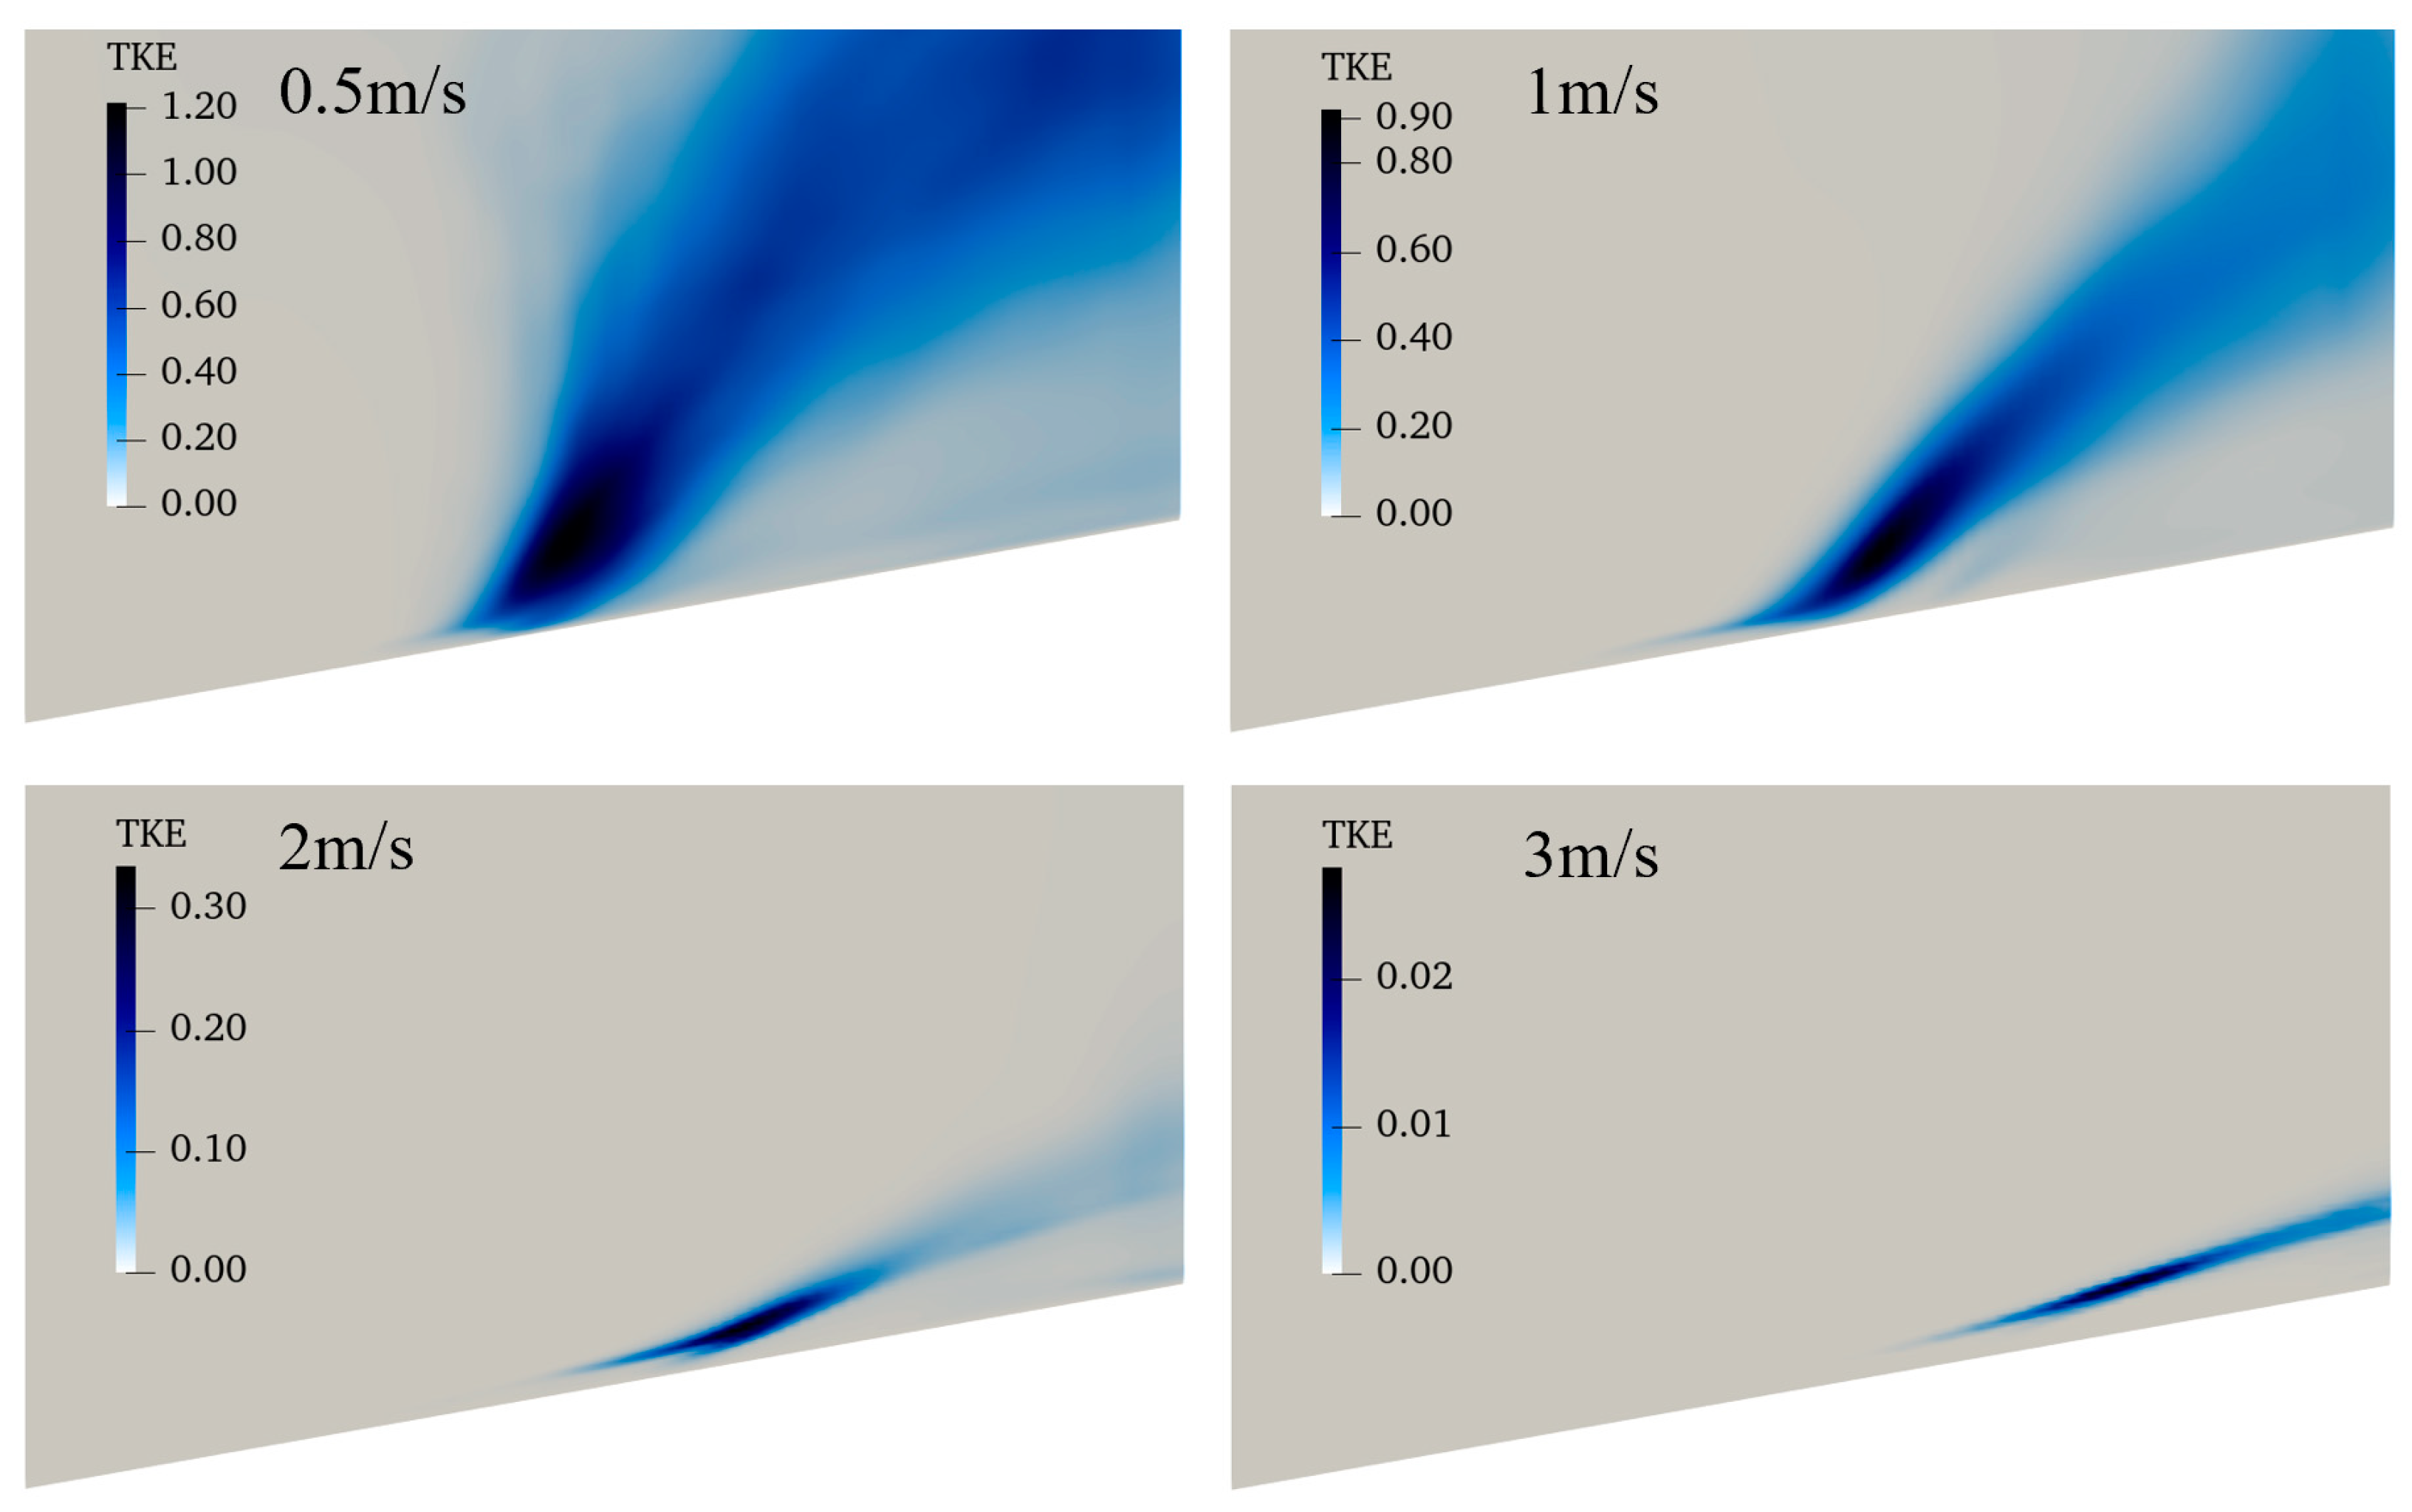
- When the wind speed increases, the temperature and velocity become more parallel to the surface and their maximum values increase. On the contrary, the temperature fluctuations and turbulent kinetic energy decrease with the wind speed, and they are more frequent near the flame tails.
Author Contributions
Funding
Data Availability Statement
Conflicts of Interest
References
- Hu, L. A review of physics and correlations of pool fire behaviour in wind and future challenges. Fire Saf. J. 2017, 91, 41–55. [Google Scholar] [CrossRef]
- Liu, N.; Lei, J.; Gao, W.; Chen, H.; Xie, X. Combustion dynamics of large-scale wildfires. Proc. Combust. Inst. 2021, 38, 157–198. [Google Scholar] [CrossRef]
- Brown, A.; Bruns, M.; Gollner, M.; Hewson, J.; Maragkos, G.; Marshall, A.; McDermott, R.; Merci, B.; Rogaume, T.; Stoliarov, S.; et al. Proceedings of the first workshop organized by the IAFSS Working Group on Measurement and Computation of Fire Phenomena (MaCFP). Fire Saf. J. 2018, 101, 1–17. [Google Scholar] [CrossRef] [PubMed]
- Sitte, M.P.; Doan, N.A.K. Velocity reconstruction in puffing pool fires with physics-informed neural networks. Phys. Fluids 2022, 34, 87124. [Google Scholar] [CrossRef]
- Sun, Y.; Yu, Y.; Chen, Q.; Jiang, L.; Zheng, S. Flow and thermal radiation characteristics of a turbulent flame by large eddy simulation. Phys. Fluids 2022, 34, 087127. [Google Scholar] [CrossRef]
- Chen, Y.; Fang, J.; Zhang, X.; Miao, Y.; Lin, Y.; Tu, R.; Hu, L. Pool fire dynamics: Principles, models and recent advances. Prog. Energy Combust. Sci. 2023, 95, 101070. [Google Scholar] [CrossRef]
- Liu, H.; Zheng, S.; He, Y.; Yang, Y.; Lu, Q. Radiation effects of CO2 and H2O dilution on laminar flame speeds of syngas flames under elevated pressures. Int. J. Hydrog. Energy 2023, 48, 38870–38877. [Google Scholar] [CrossRef]
- Zheng, S.; Zhang, M.; Yang, Y.; Na, M.; Lu, Q. Simultaneous reconstruction of temperature and concentration of H2O and soot based on infrared emission spectrum by inverse analysis. Int. J. Therm. Sci. 2024, 195, 108641. [Google Scholar] [CrossRef]
- Bi, Y.; Yang, Z.; Cong, H.; Bi, M.; Gao, W. Experimental and theoretical investigation on the effect of inclined surface on pool fire behavior. Process Saf. Environ. Prot. 2022, 162, 328–336. [Google Scholar] [CrossRef]
- Yang, Y.; Zheng, S.; Xu, M.; Liu, B.; Zhu, S.; Sui, R.; Lu, Q. Effect of simultaneous H2 and NH3 addition on soot formation in co-flow diffusion CH4 flame. Proc. Combust. Inst. 2024, 40, 105676. [Google Scholar] [CrossRef]
- Yang, Y.; Zheng, S.; Sui, R.; Lu, Q. Impact of ammonia addition on soot and NO/N2O formation in methane/air co-flow diffusion flames. Combust. Flame 2023, 247, 112483. [Google Scholar] [CrossRef]
- Lin, Y.; Delichatsios, M.A.; Zhang, X.; Hu, L. Experimental study and physical analysis of flame geometry in pool fires under relatively strong cross flows. Combust. Flame 2019, 205, 422–433. [Google Scholar] [CrossRef]
- Lin, Y.; Hu, L.; Zhang, X.; Chen, Y. Experimental study of pool fire behaviors with nearby inclined surface under cross flow. Process Saf. Environ. Prot. 2021, 148, 93–103. [Google Scholar] [CrossRef]
- Huang, M.; Zhou, K.; Li, D.; Ma, X.; Wu, J. Thermal Properties of Line Fire Under Cross Wind. J. Eng. Thermophys 2024, 45, 925–933. [Google Scholar]
- Liu, C.; Lai, T.; Zhang, H.; Huang, P.; Lin, K.; Lin, Y.; Li, M. Experimental study on the morphology of turbulent diffusion flames with different aspect ratios under slope conditions. Fuel 2024, 357, 129827. [Google Scholar] [CrossRef]
- Li, B.; Ding, L.; Simeoni, A.; Ji, J.; Wan, H.; Yu, L. Numerical investigation of the flow characteristics around two tandem propane fires in a windy environment. Fuel 2021, 286, 119344. [Google Scholar] [CrossRef]
- Wu, Y.; Xing, H.J.; Atkinson, G. Interaction of fire plume with inclined surface. Fire Saf. J. 2000, 35, 391–403. [Google Scholar] [CrossRef]
- Zhang, Y.; Zhang, W.; Lin, Y.; Chen, Y.; Li, K. Flame attachment effect on the distributions of flow, temperature and heat flux of inclined fire plume. Int. J. Heat Mass Transf. 2021, 174, 121313. [Google Scholar] [CrossRef]
- Ju, X.; Ren, X.; Sluder, E.; Yang, L.; Gollner, M.J. Flame attachment and downstream heating effect of inclined line fires. Combust. Flame 2022, 240, 112004. [Google Scholar] [CrossRef]
- Ren, X.; Sluder, E.T.; Heck, M.V.; Grumstrup, T.P.; Finney, M.A.; Mäkiharju, S.A.; Gollner, M.J. Scaling analysis of downstream heating and flow dynamics of fires over an inclined surface. Combust. Flame 2022, 242, 112203. [Google Scholar] [CrossRef]


| Variable | Slope | Fuel | Side | Top | Out | Inlet |
|---|---|---|---|---|---|---|
| CH4 | zeroGradient | totalFlowRateAdvectiveDiffusive | inletOutlet | inletOutlet | inletOutlet | inletOutlet |
| T | zeroGradient | fixedValue | inletOutlet | inletOutlet | inletOutlet | inletOutlet |
| U | noSlip | fixedValue | slip | pressureInletOutletVelocity | inletOutlet | fixedValue power-law |
| p | calculated | calculated | calculated | calculated | calculated | calculated |
| p_rgh | fixedFluxPressure | fixedFluxPressure | fixedFluxPressure | prghTotalHydrostaticPressure | fixedFluxPressure | fixedFluxPressure |
| Name | Discretization Method | Key Words in OpenFOAM |
|---|---|---|
| Time | First-order implicit | Euler |
| Advection–velocity | Upwind | Gauss linear LUST grad (U) |
| Advection–scalars | TVD | Gauss limitedLinear01 |
| Diffusion | Gaussian integration | Gauss linear uncorrected |
| Pressure–velocity coupling | PIMPLE | PIMPLE |
Disclaimer/Publisher’s Note: The statements, opinions and data contained in all publications are solely those of the individual author(s) and contributor(s) and not of MDPI and/or the editor(s). MDPI and/or the editor(s) disclaim responsibility for any injury to people or property resulting from any ideas, methods, instructions or products referred to in the content. |
© 2024 by the authors. Licensee MDPI, Basel, Switzerland. This article is an open access article distributed under the terms and conditions of the Creative Commons Attribution (CC BY) license (https://creativecommons.org/licenses/by/4.0/).
Share and Cite
Sun, Y.; Jiang, L.; Chen, Y. Numerical Simulation of Flow and Flame Dynamics of a Pool Fire Under Combined Effects of Wind and Slope. Fire 2024, 7, 421. https://doi.org/10.3390/fire7110421
Sun Y, Jiang L, Chen Y. Numerical Simulation of Flow and Flame Dynamics of a Pool Fire Under Combined Effects of Wind and Slope. Fire. 2024; 7(11):421. https://doi.org/10.3390/fire7110421
Chicago/Turabian StyleSun, Yujia, Lin Jiang, and Yue Chen. 2024. "Numerical Simulation of Flow and Flame Dynamics of a Pool Fire Under Combined Effects of Wind and Slope" Fire 7, no. 11: 421. https://doi.org/10.3390/fire7110421
APA StyleSun, Y., Jiang, L., & Chen, Y. (2024). Numerical Simulation of Flow and Flame Dynamics of a Pool Fire Under Combined Effects of Wind and Slope. Fire, 7(11), 421. https://doi.org/10.3390/fire7110421