
An Experimental Study on the Thermal Runaway Propagation of Cycling Aged Lithium-Ion Battery Modules


Abstract
1. Introduction
2. Experimental
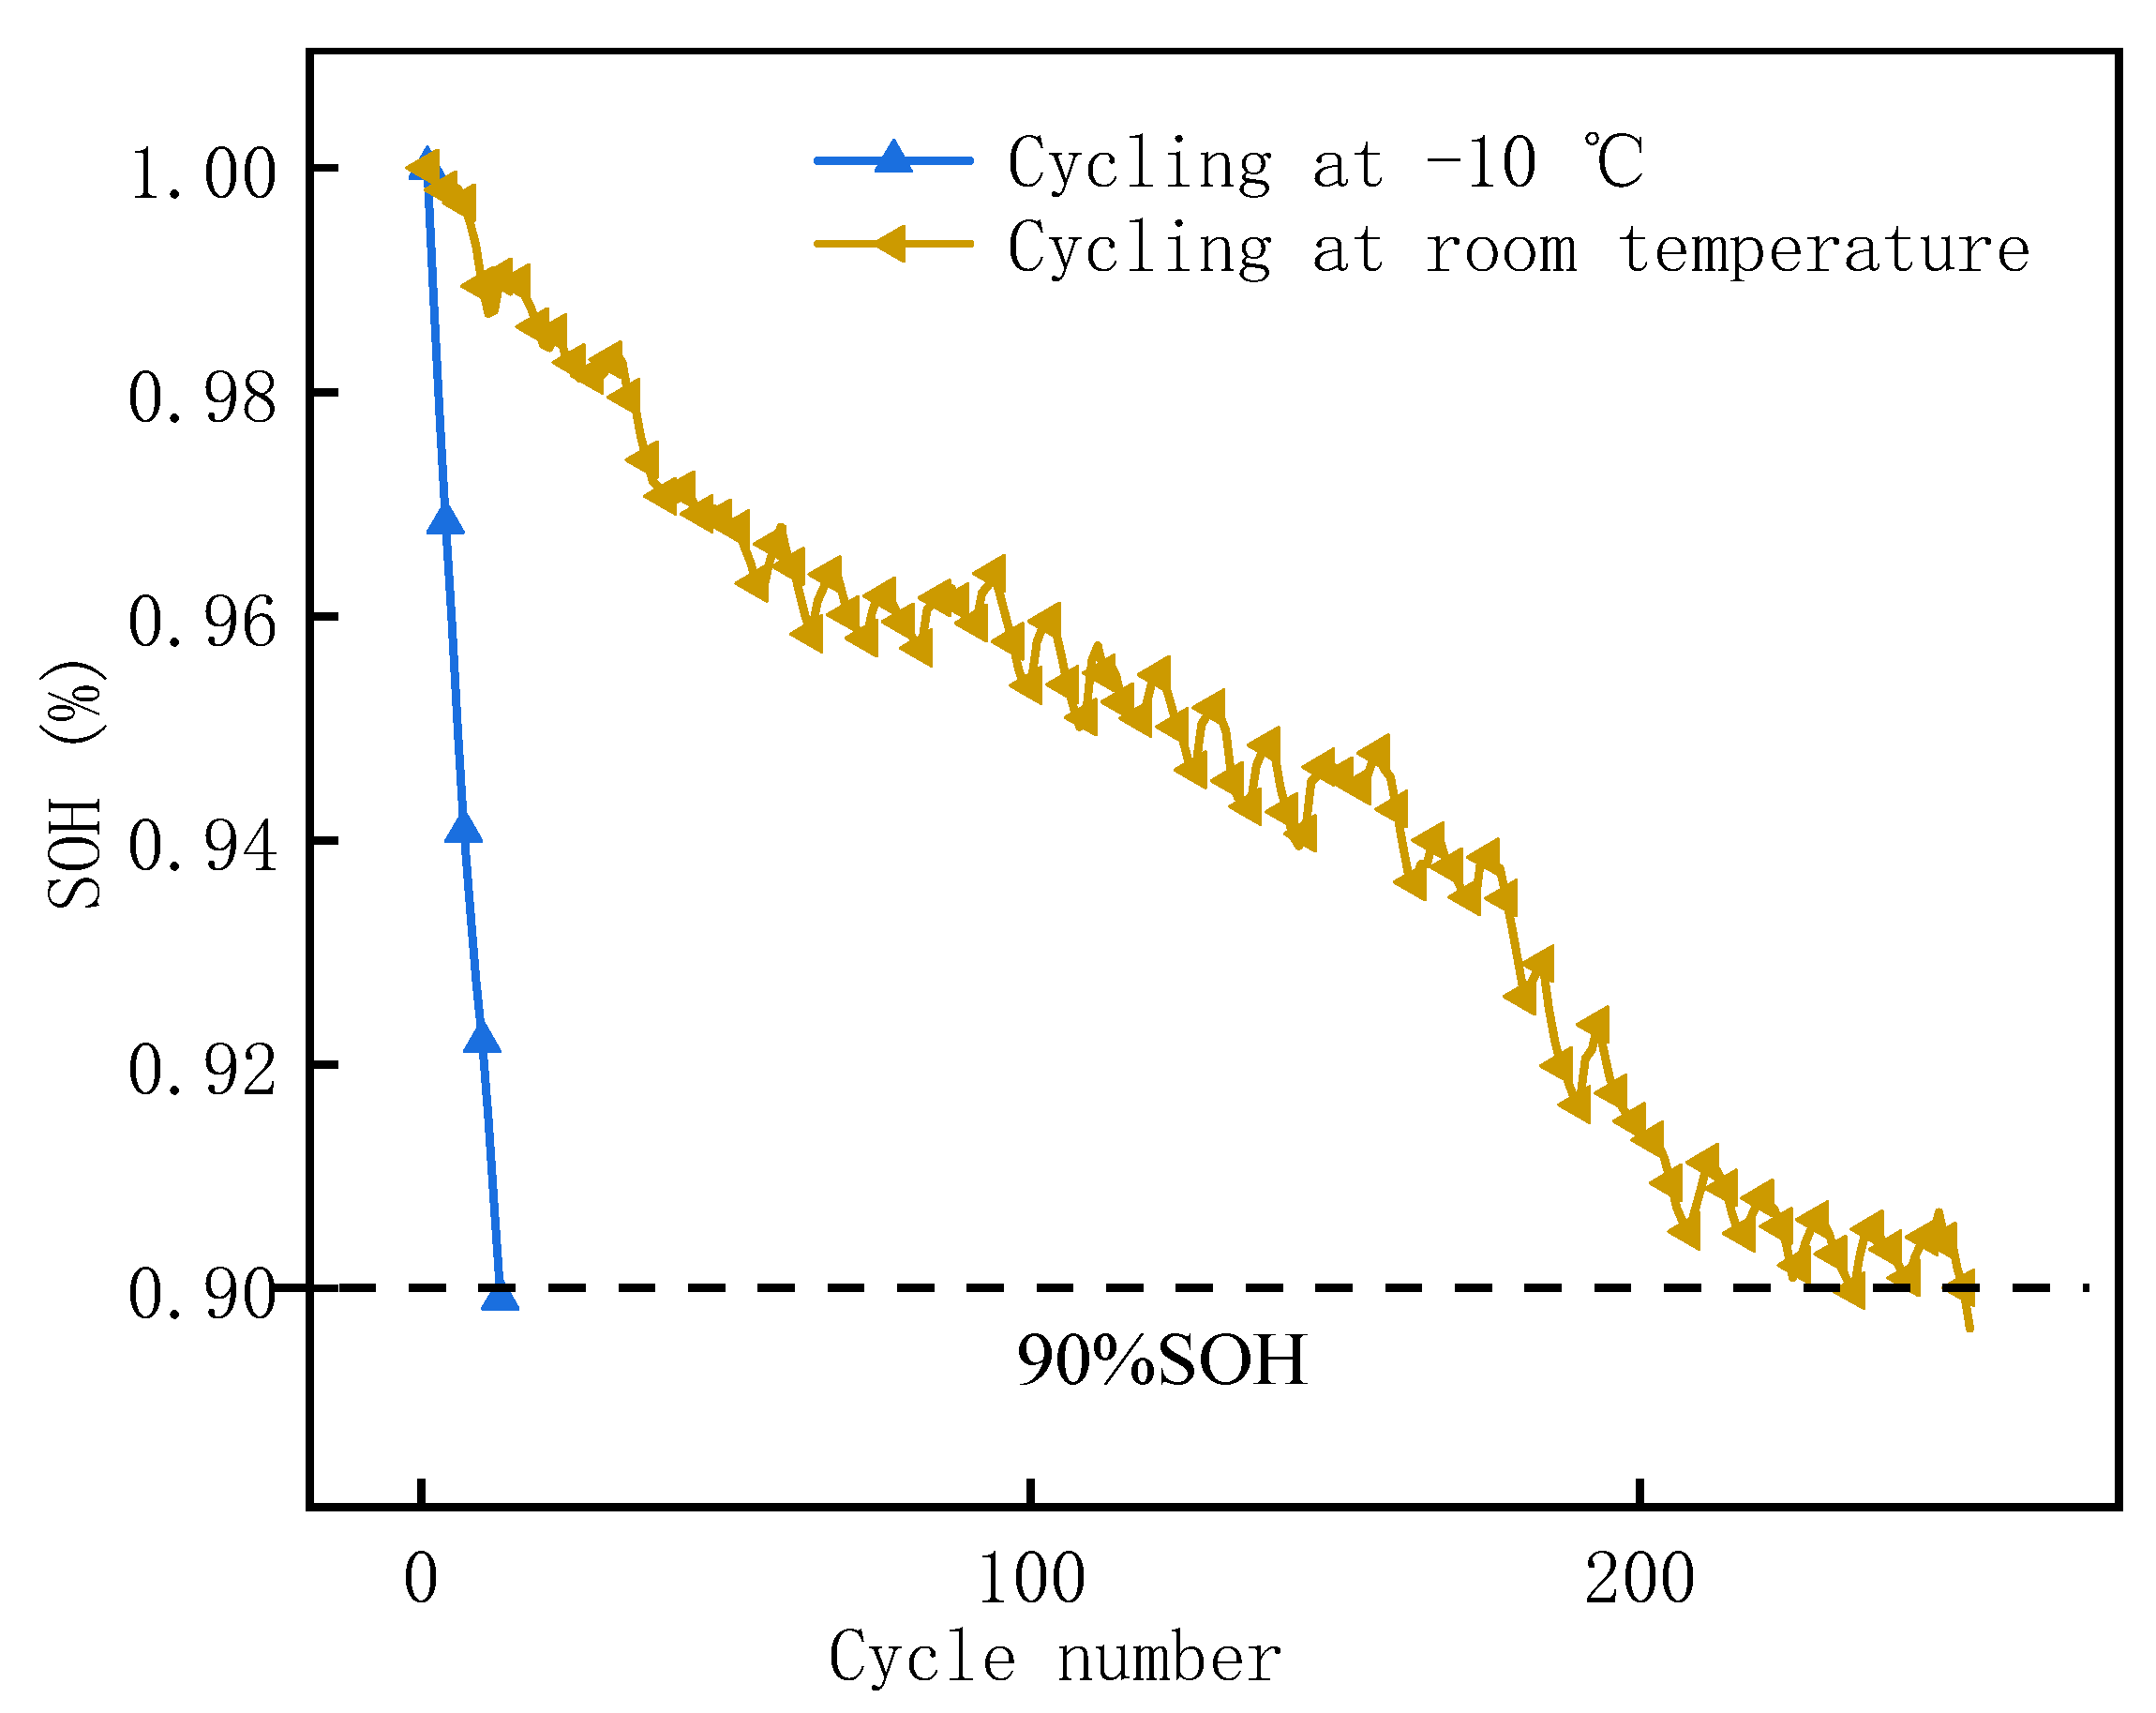
2.1. Battery Information
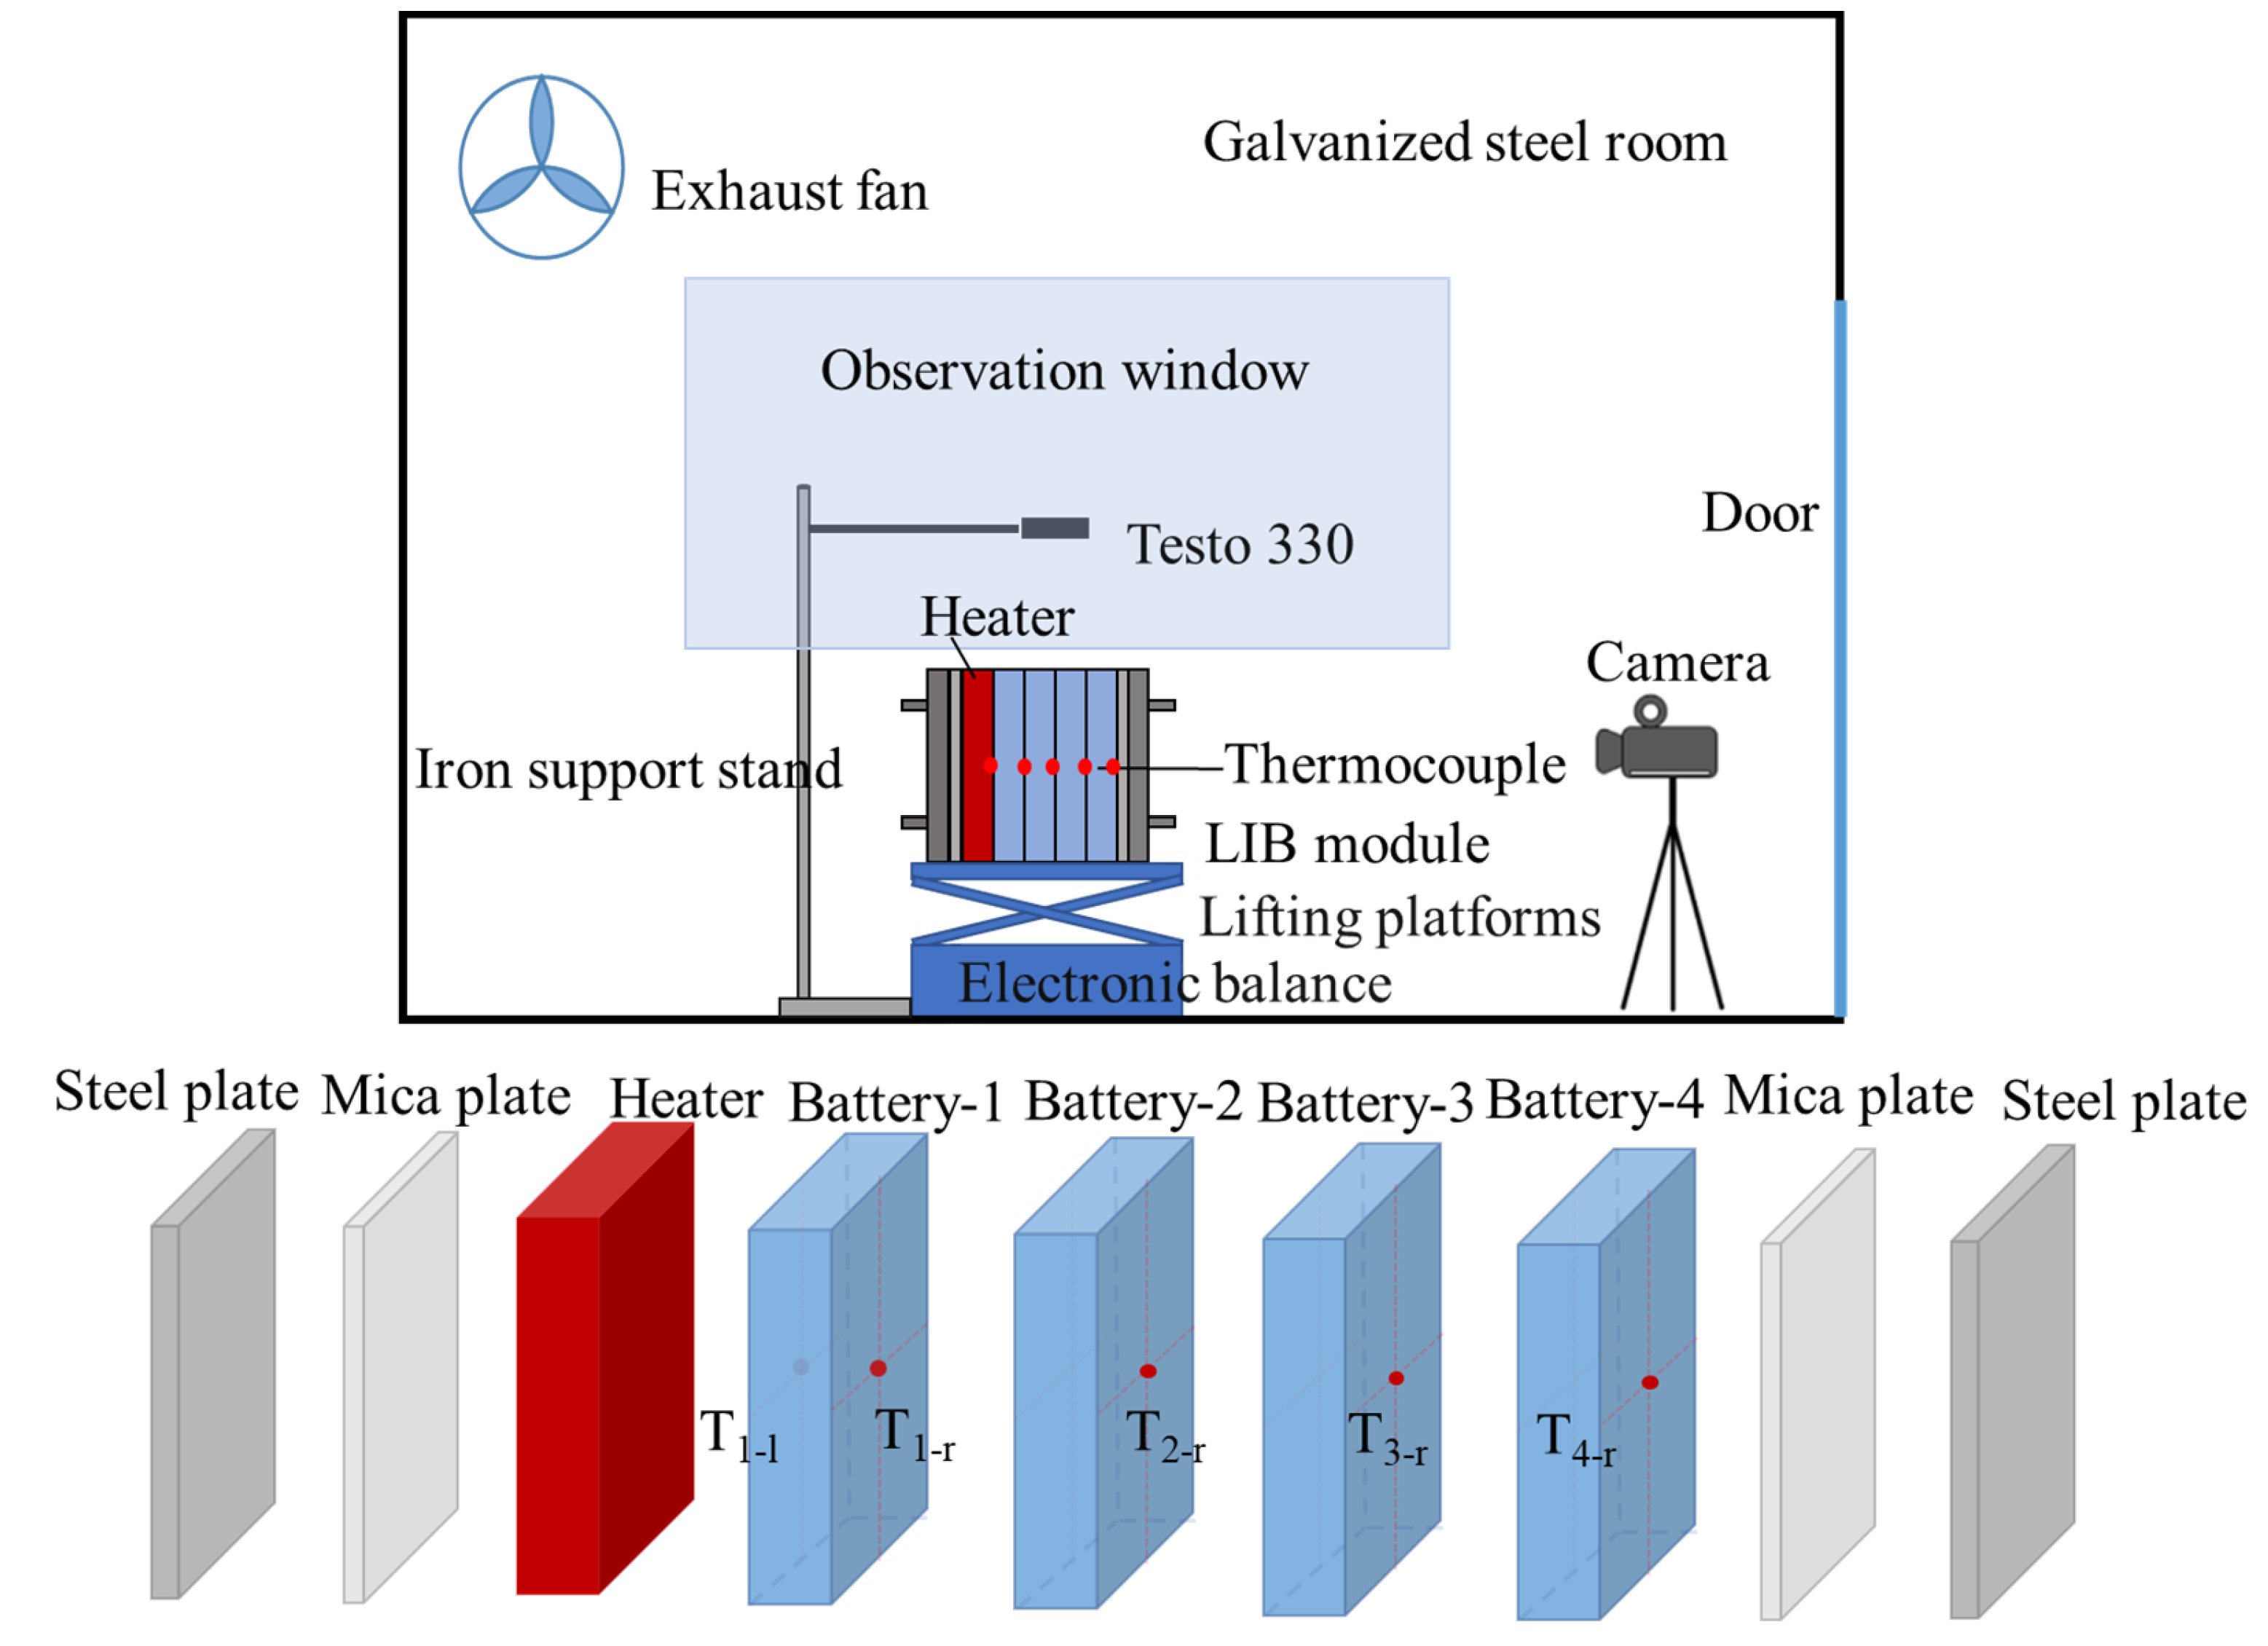
2.2. Apparatus and Experimental Setup
3. Results and Discussion
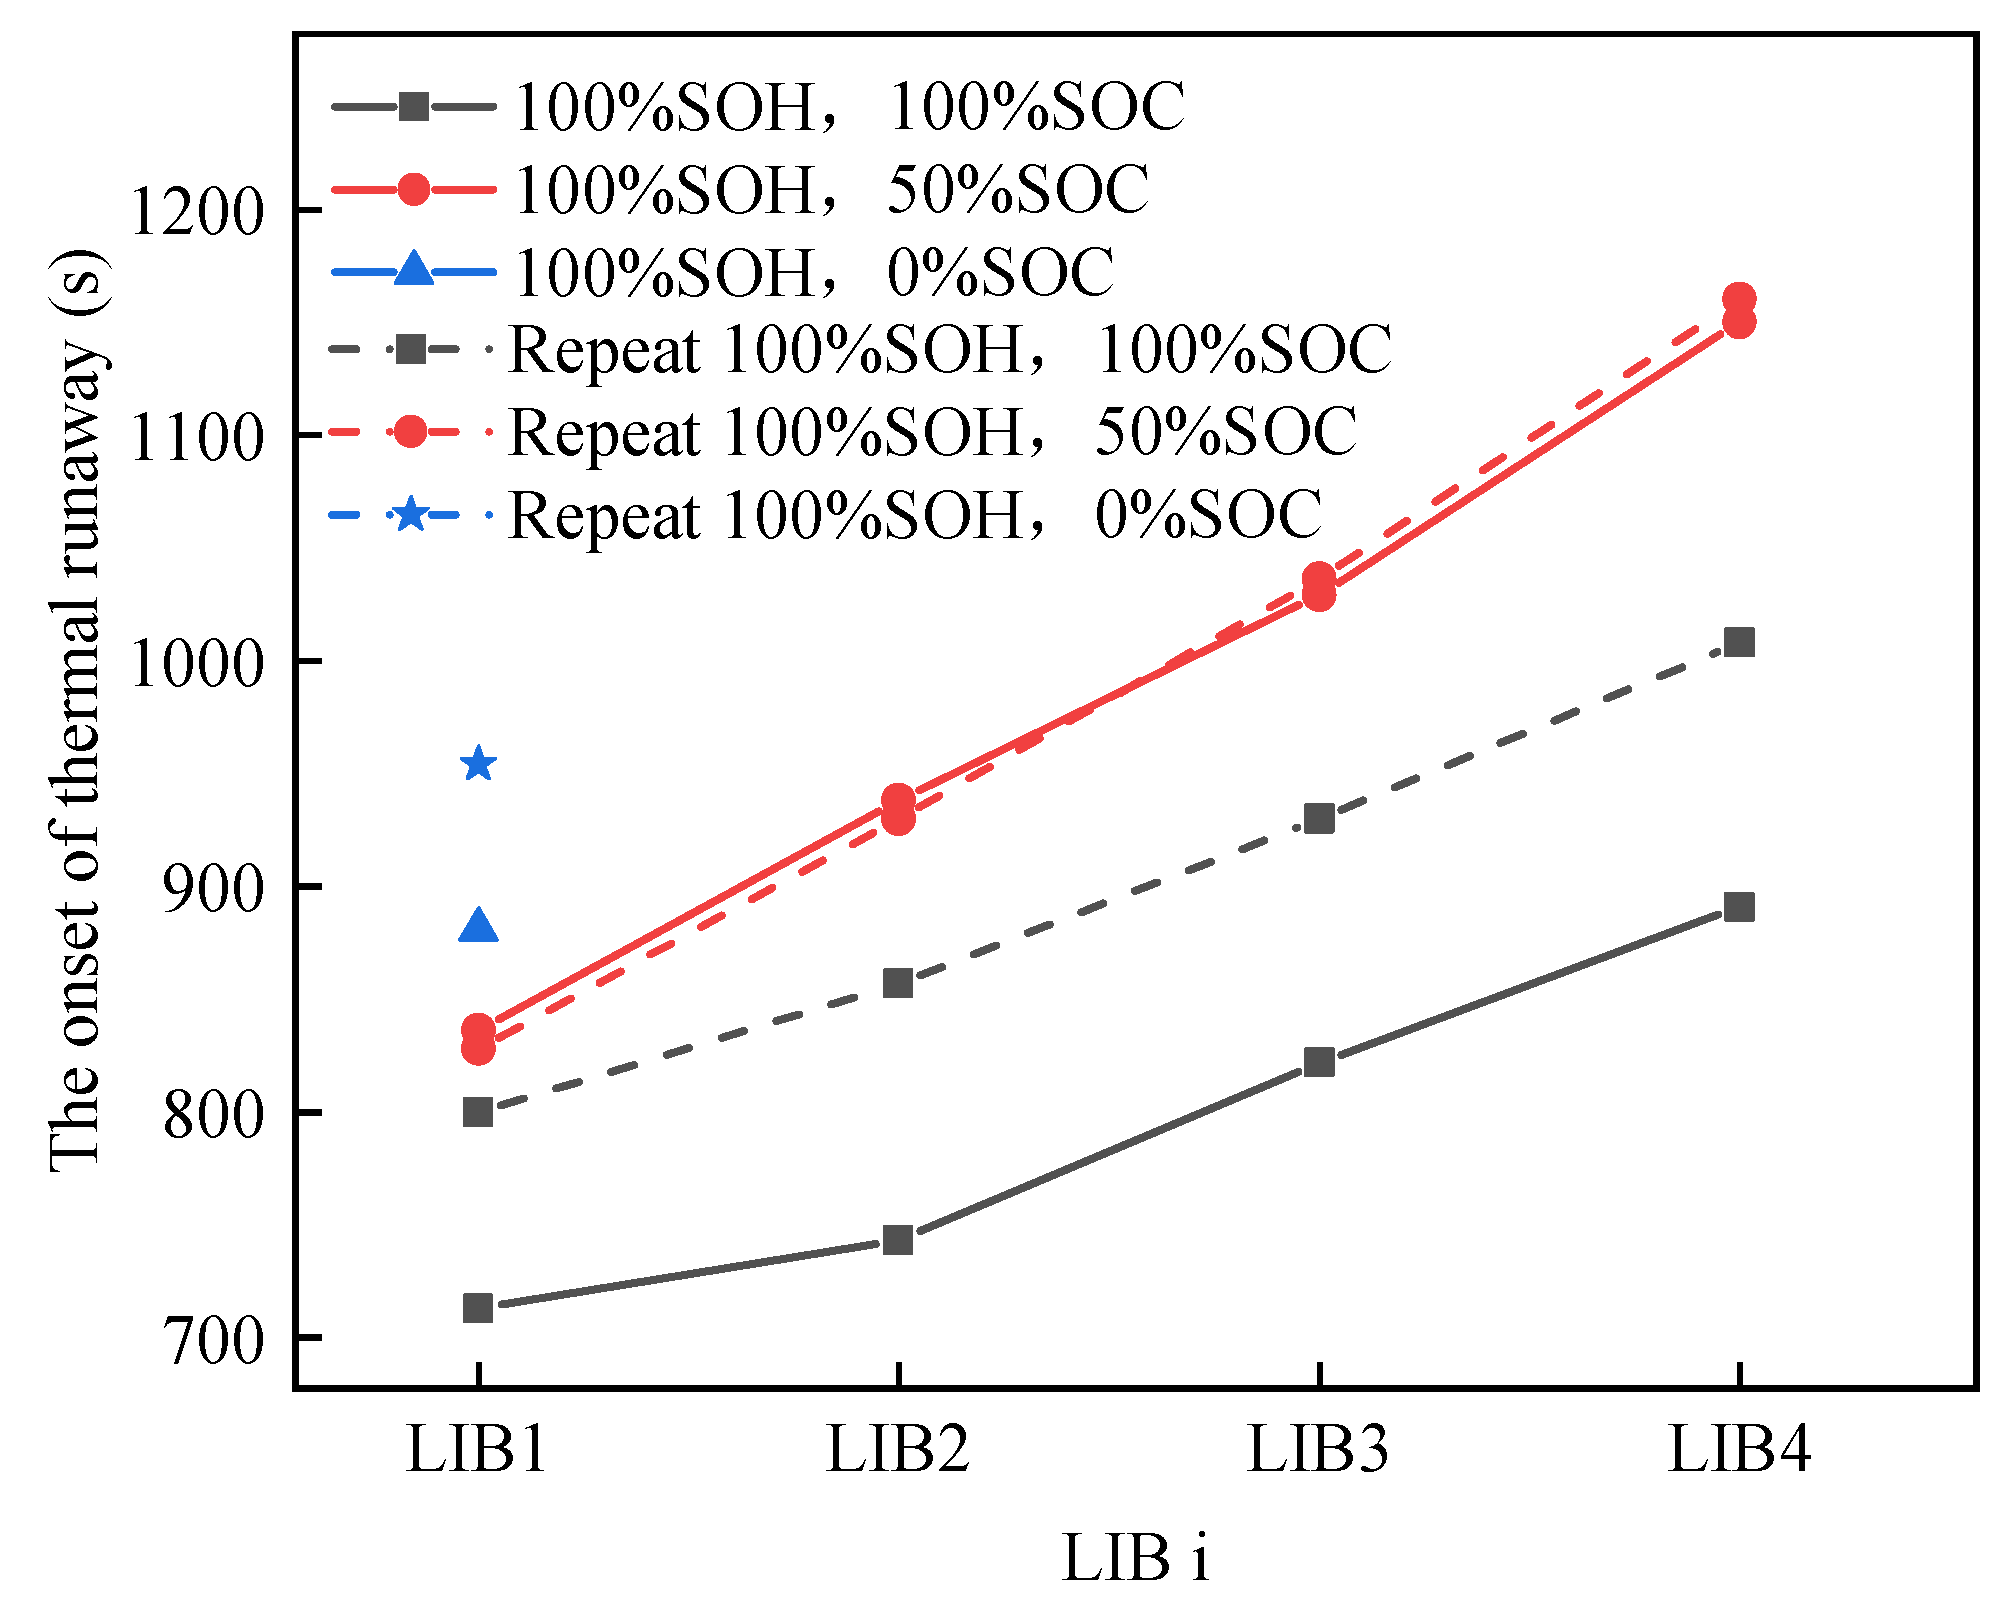
3.1. Thermal Runaway of LIB Modules with Different SOCs
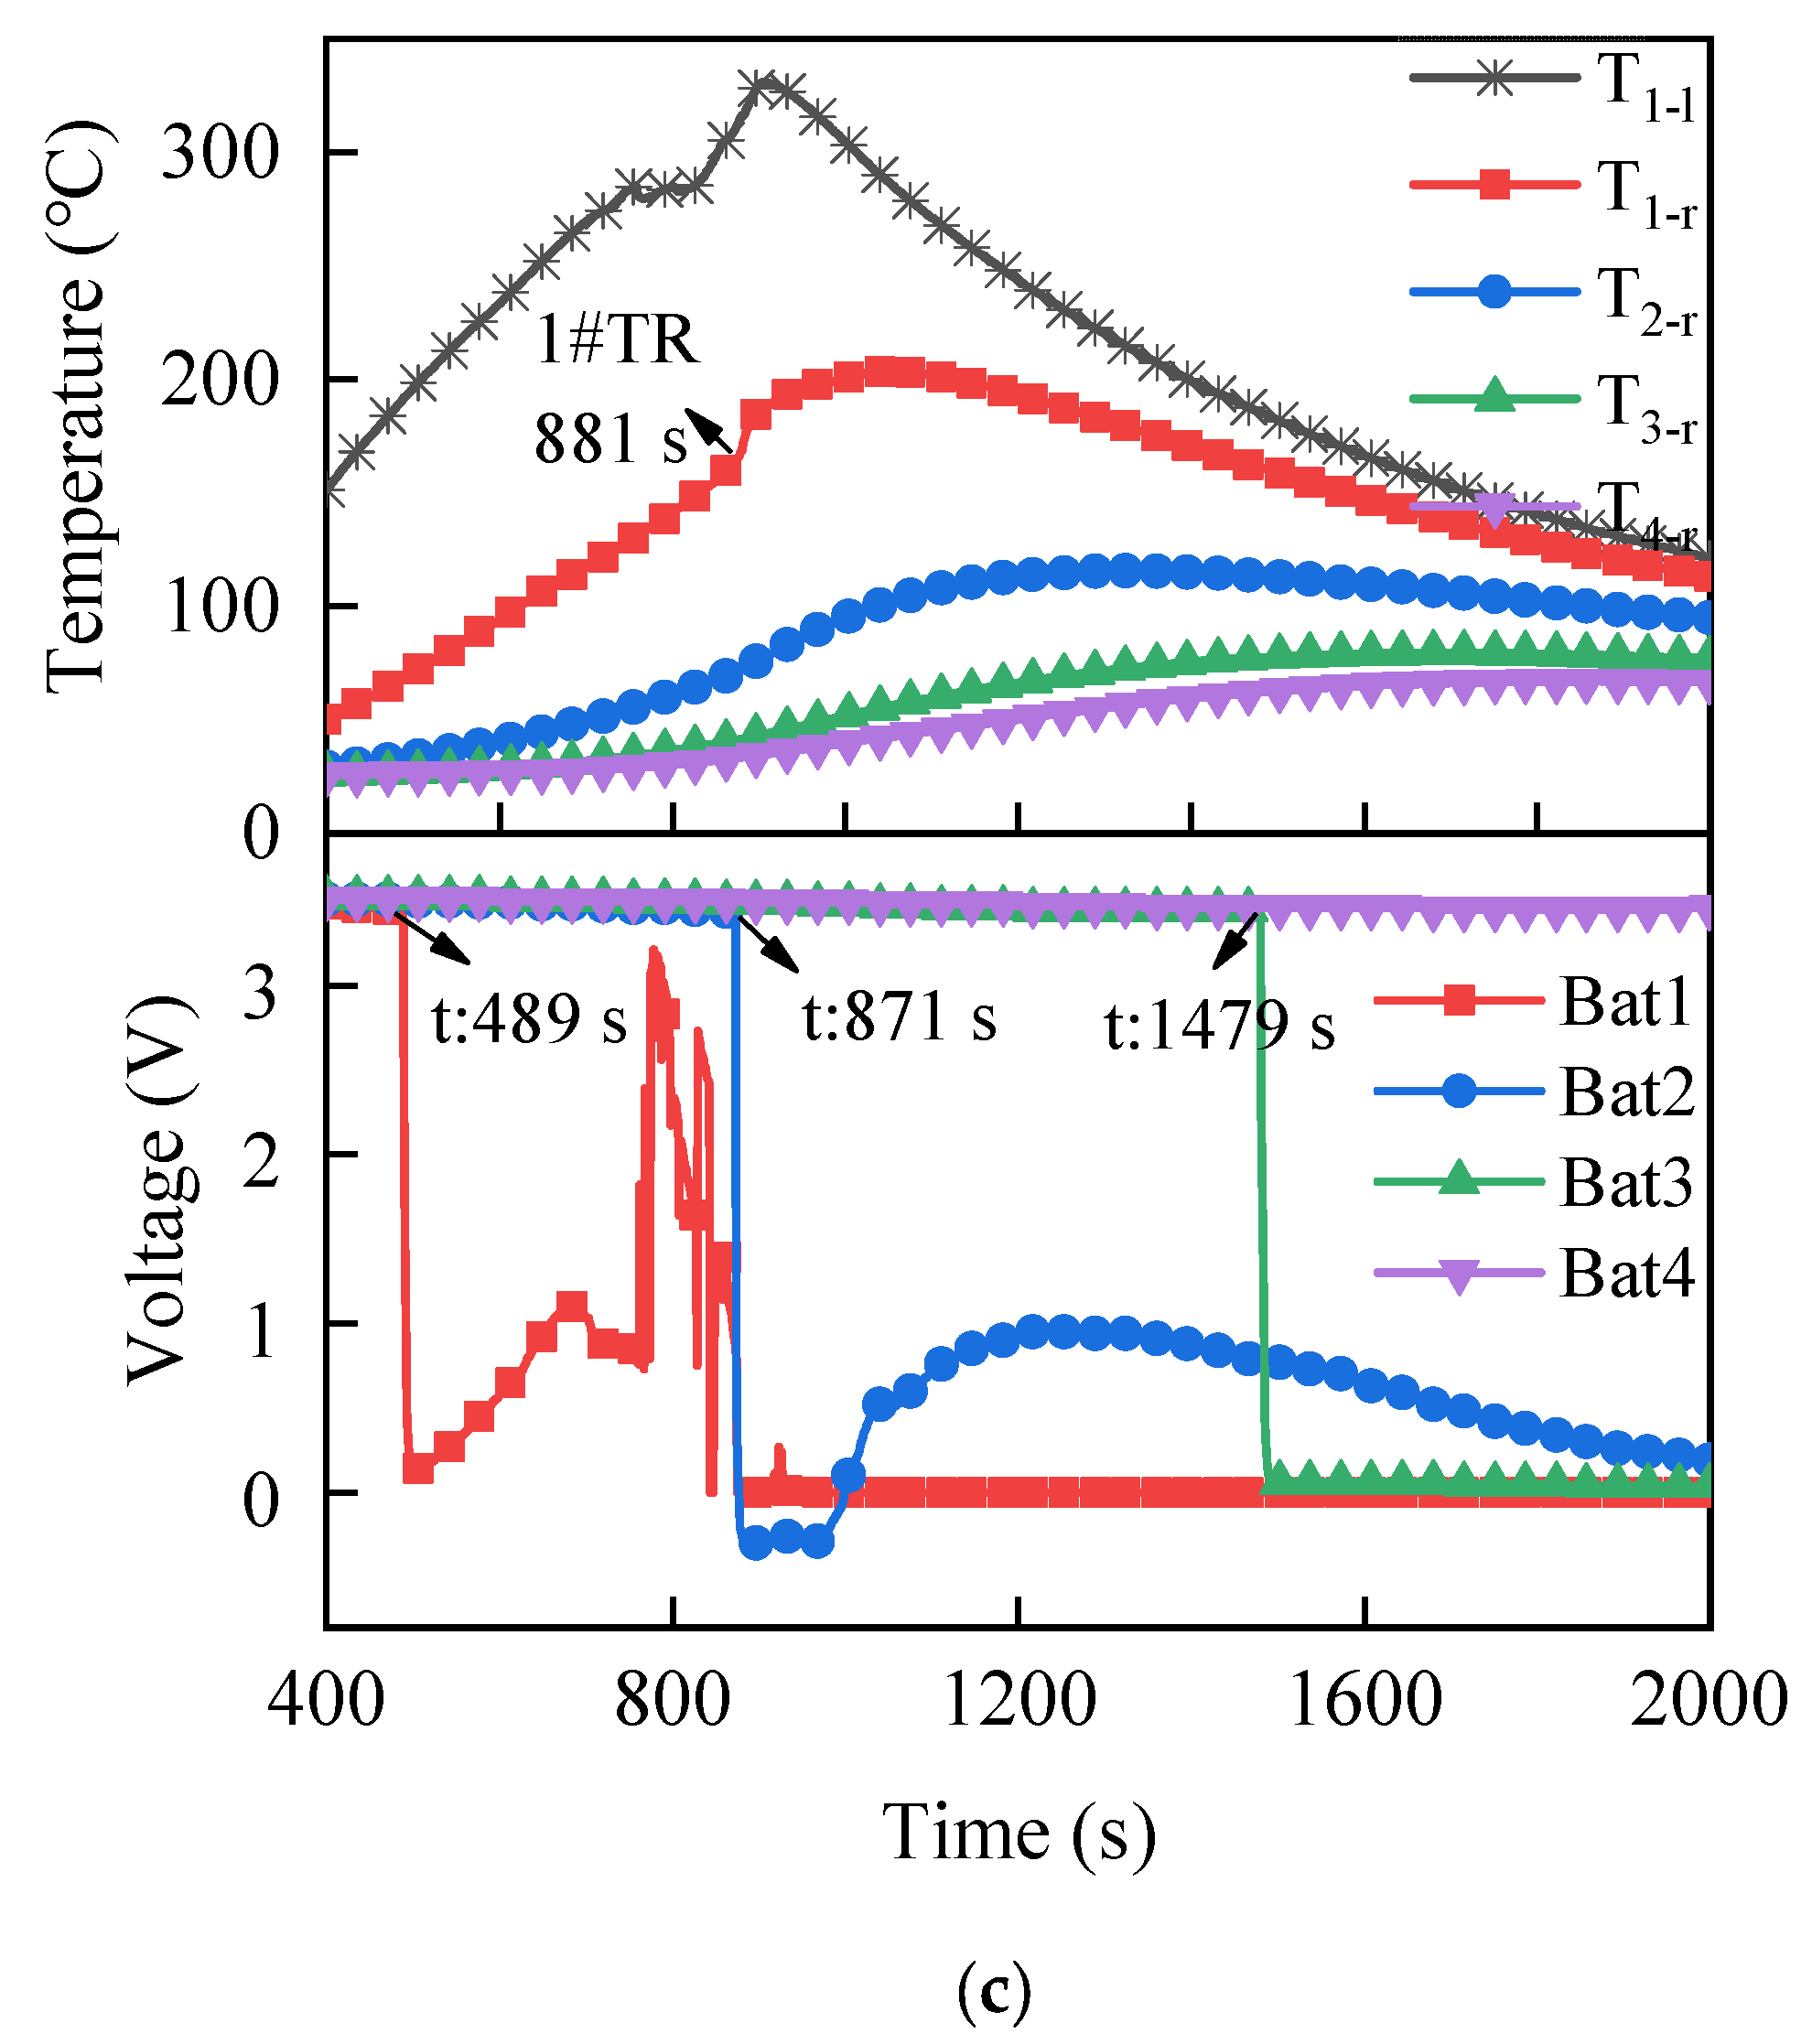
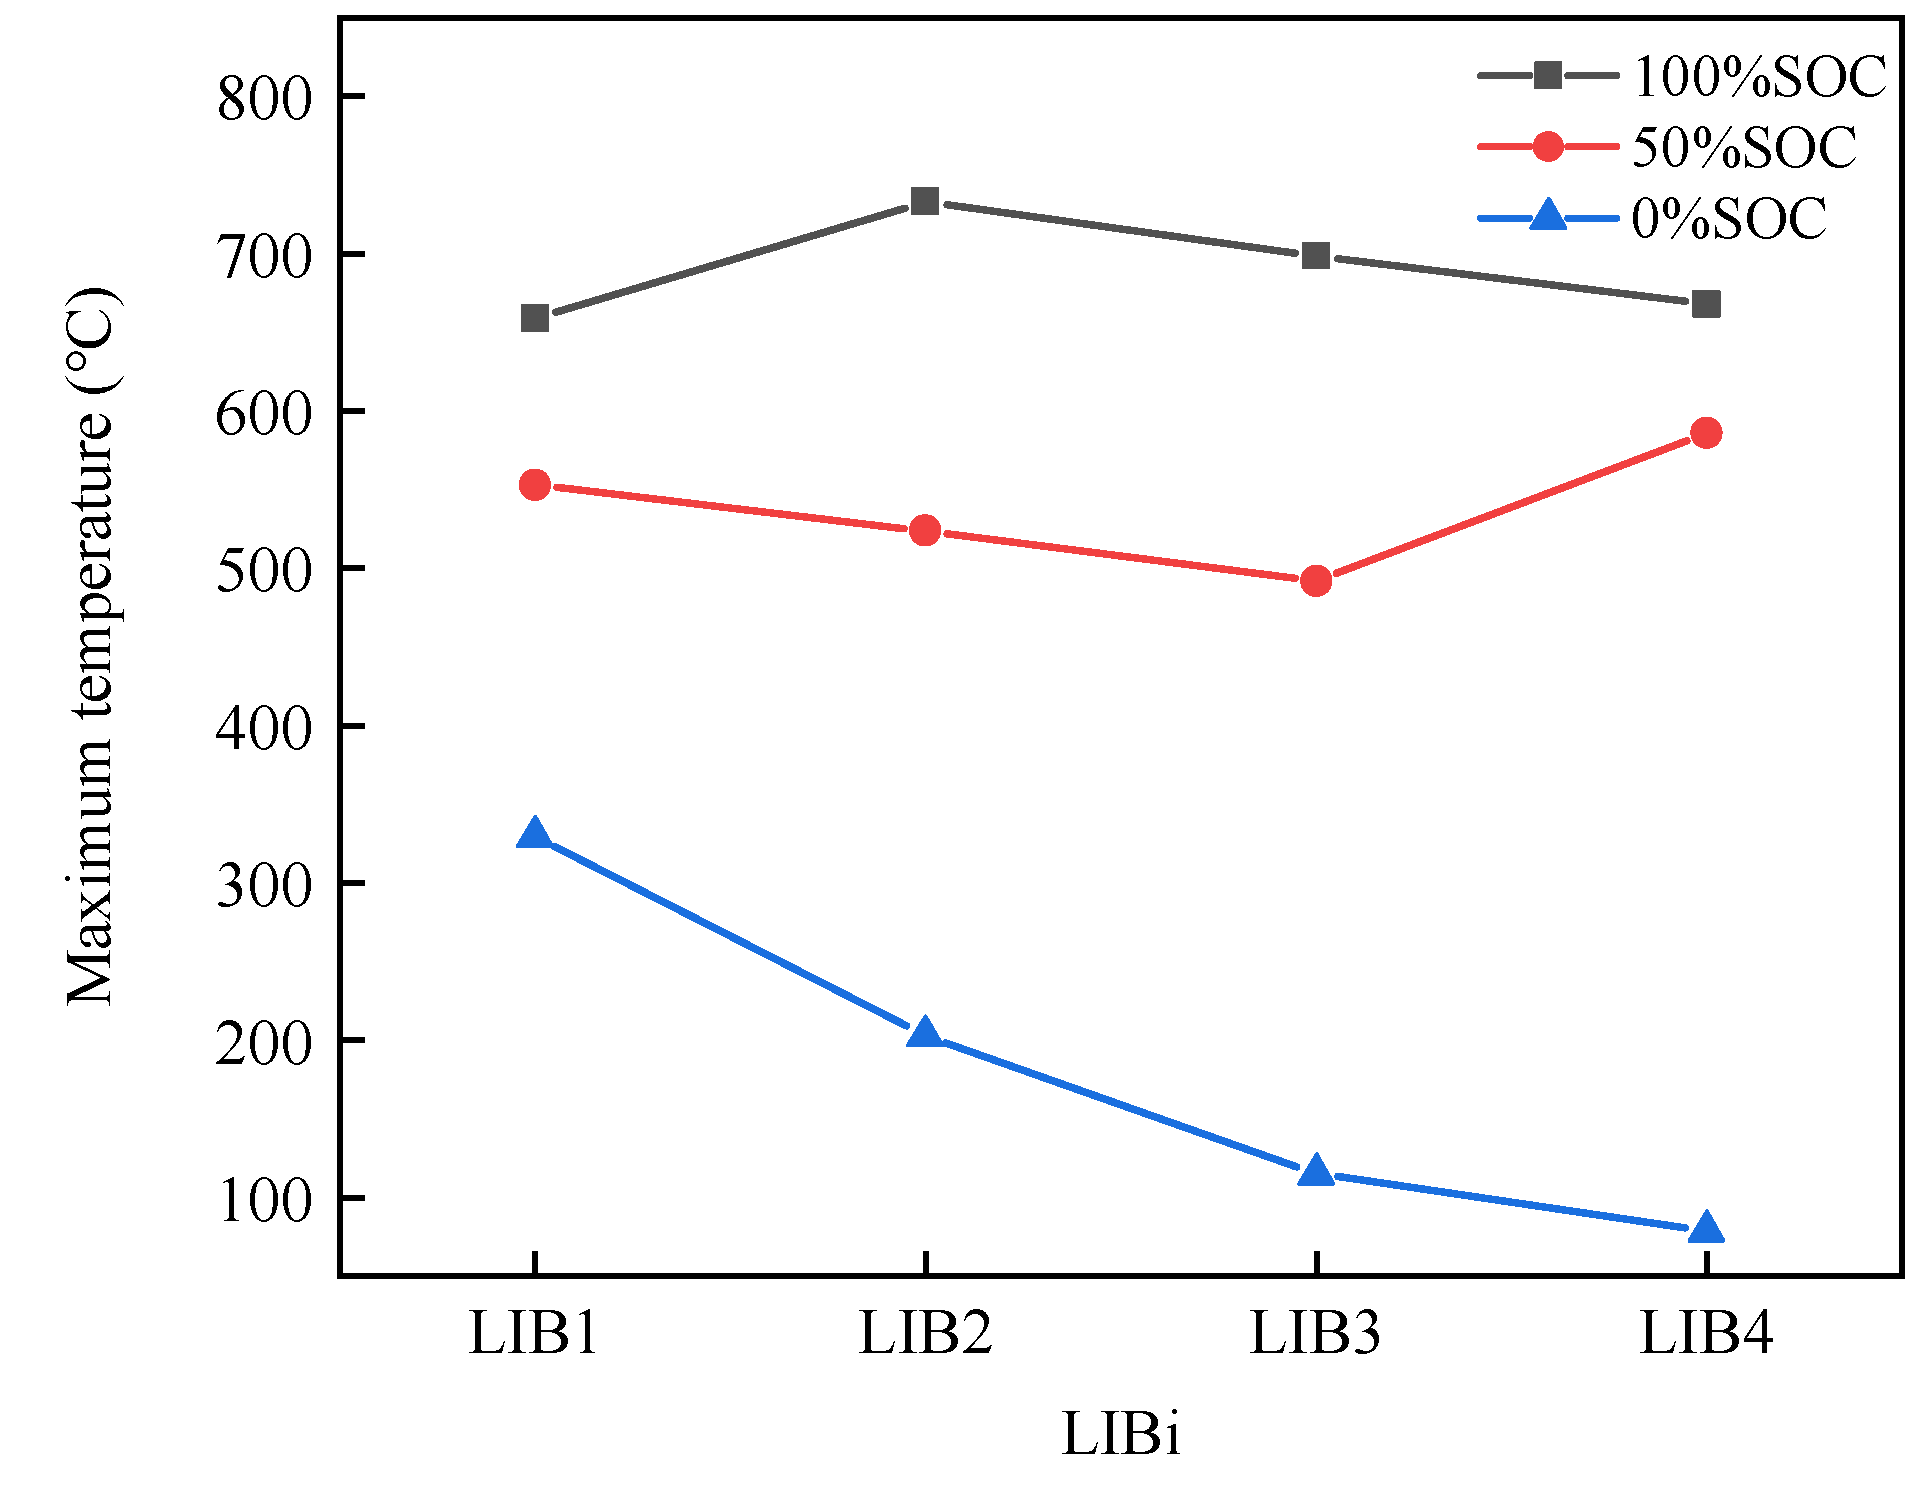
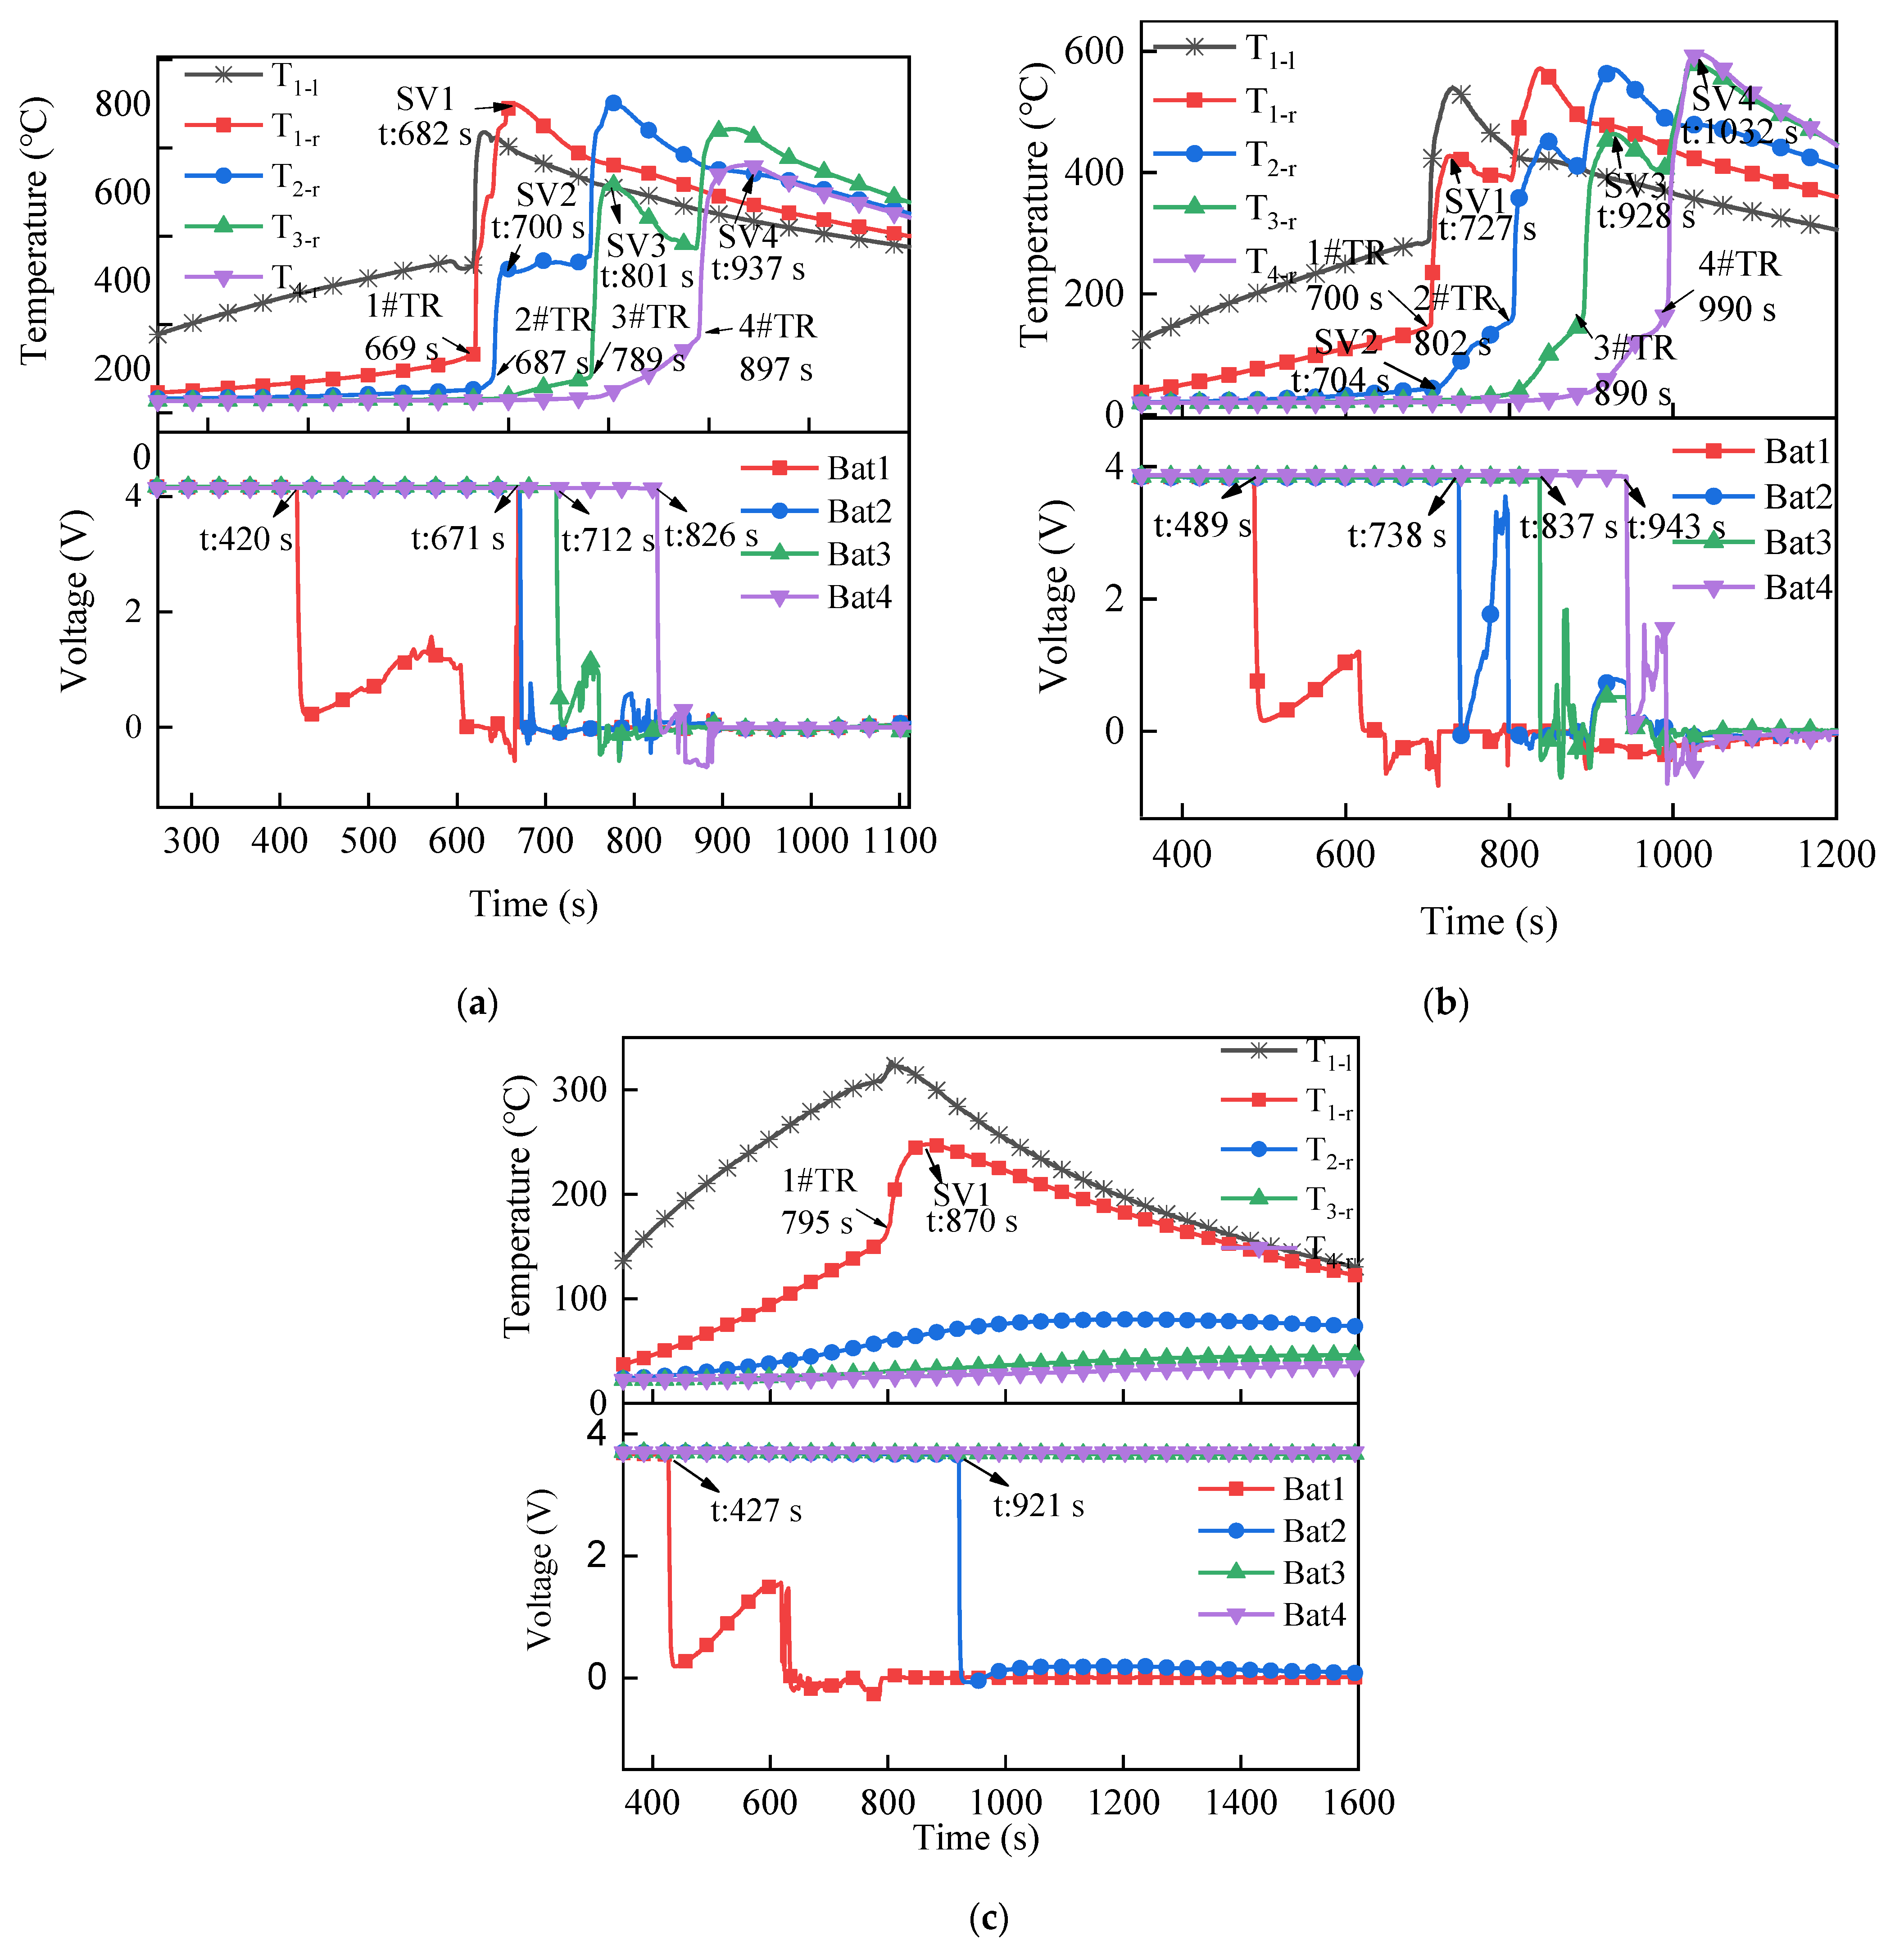
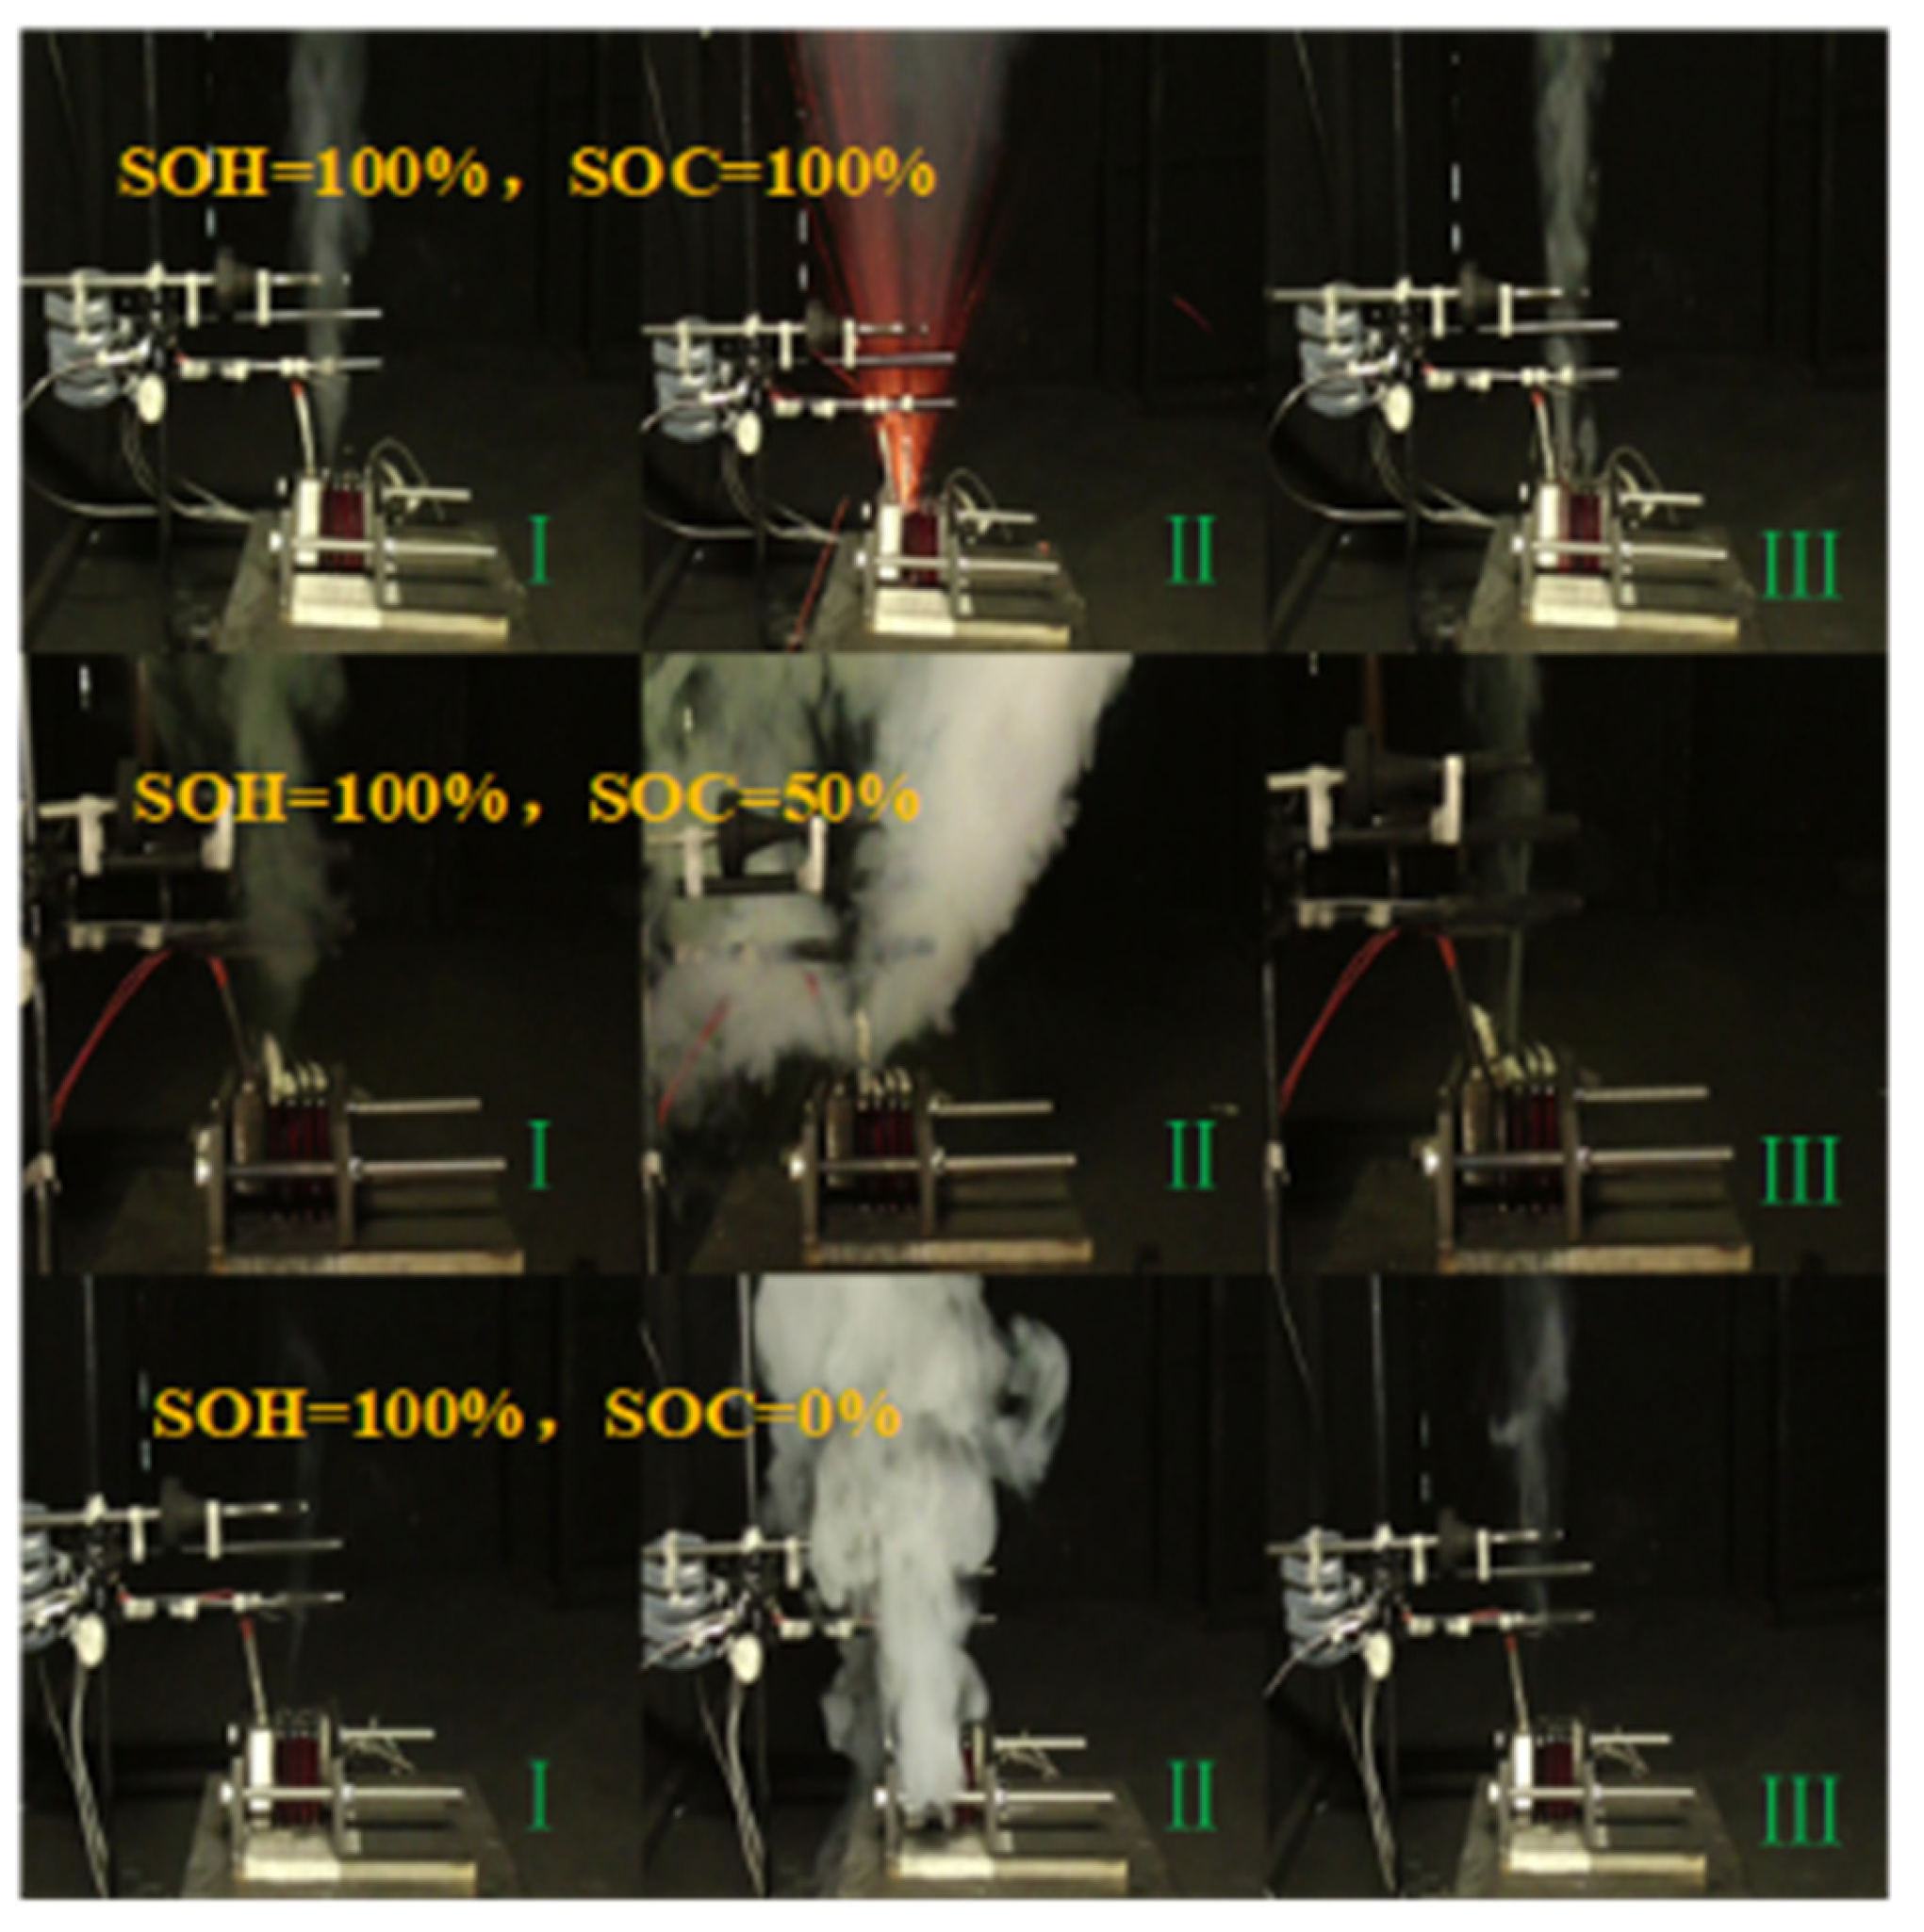
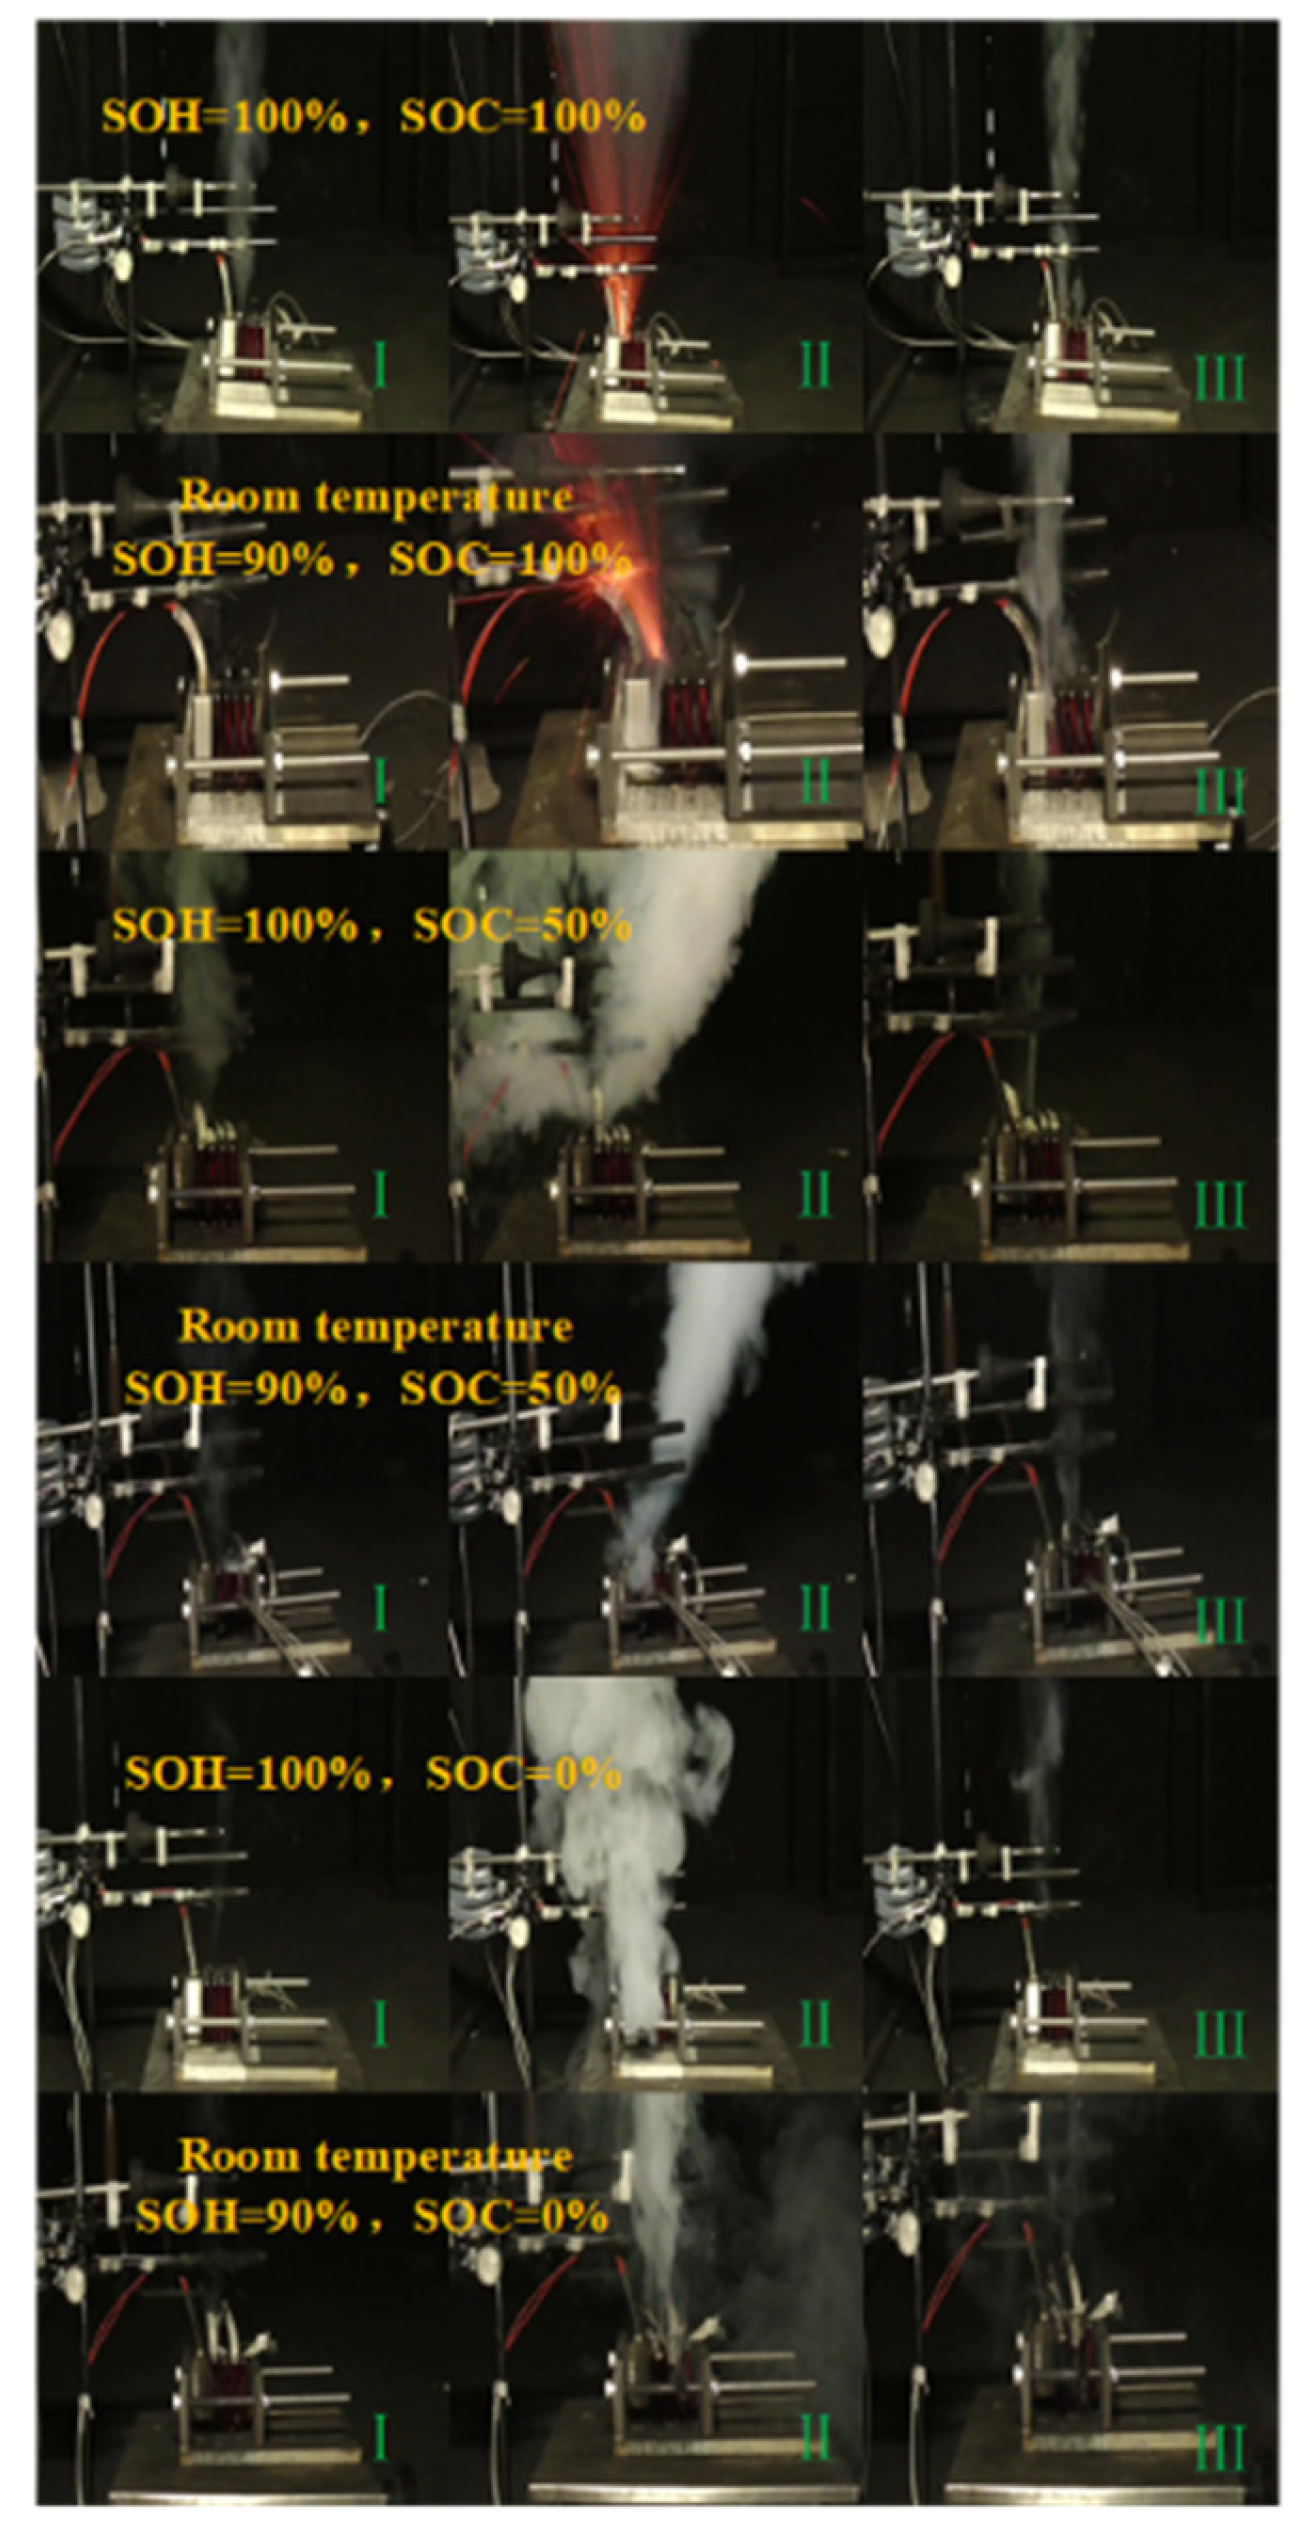
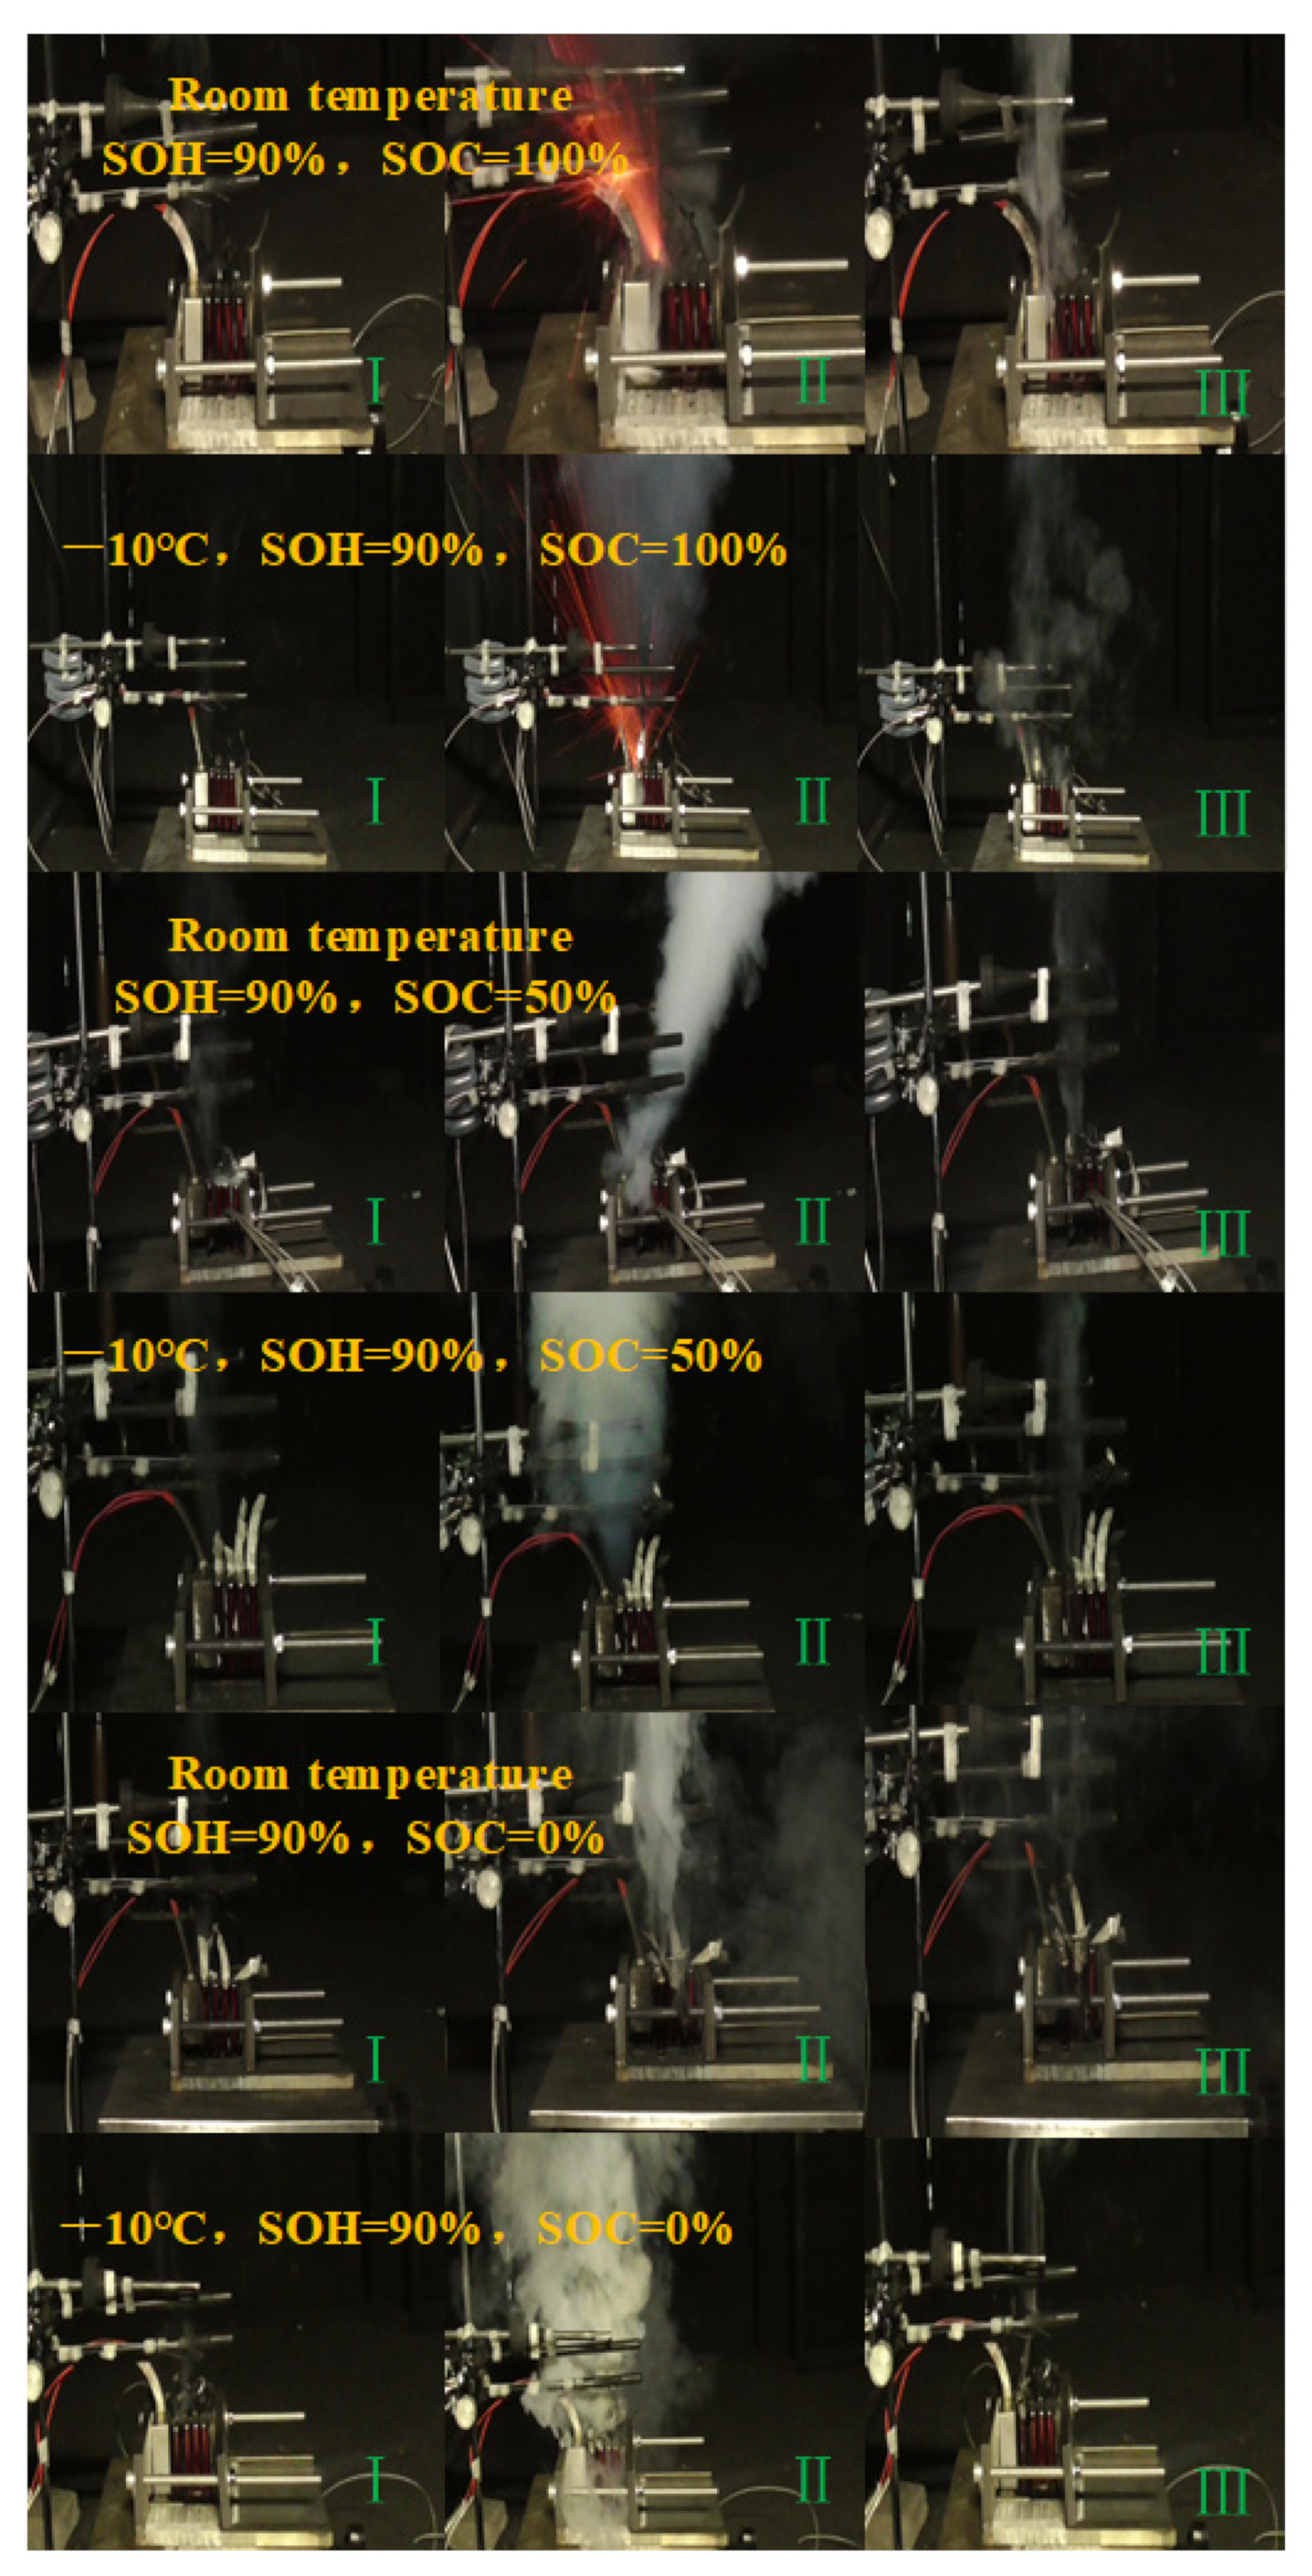
3.1.1. Characteristics of Thermal Runaway Propagation with Different SOCs
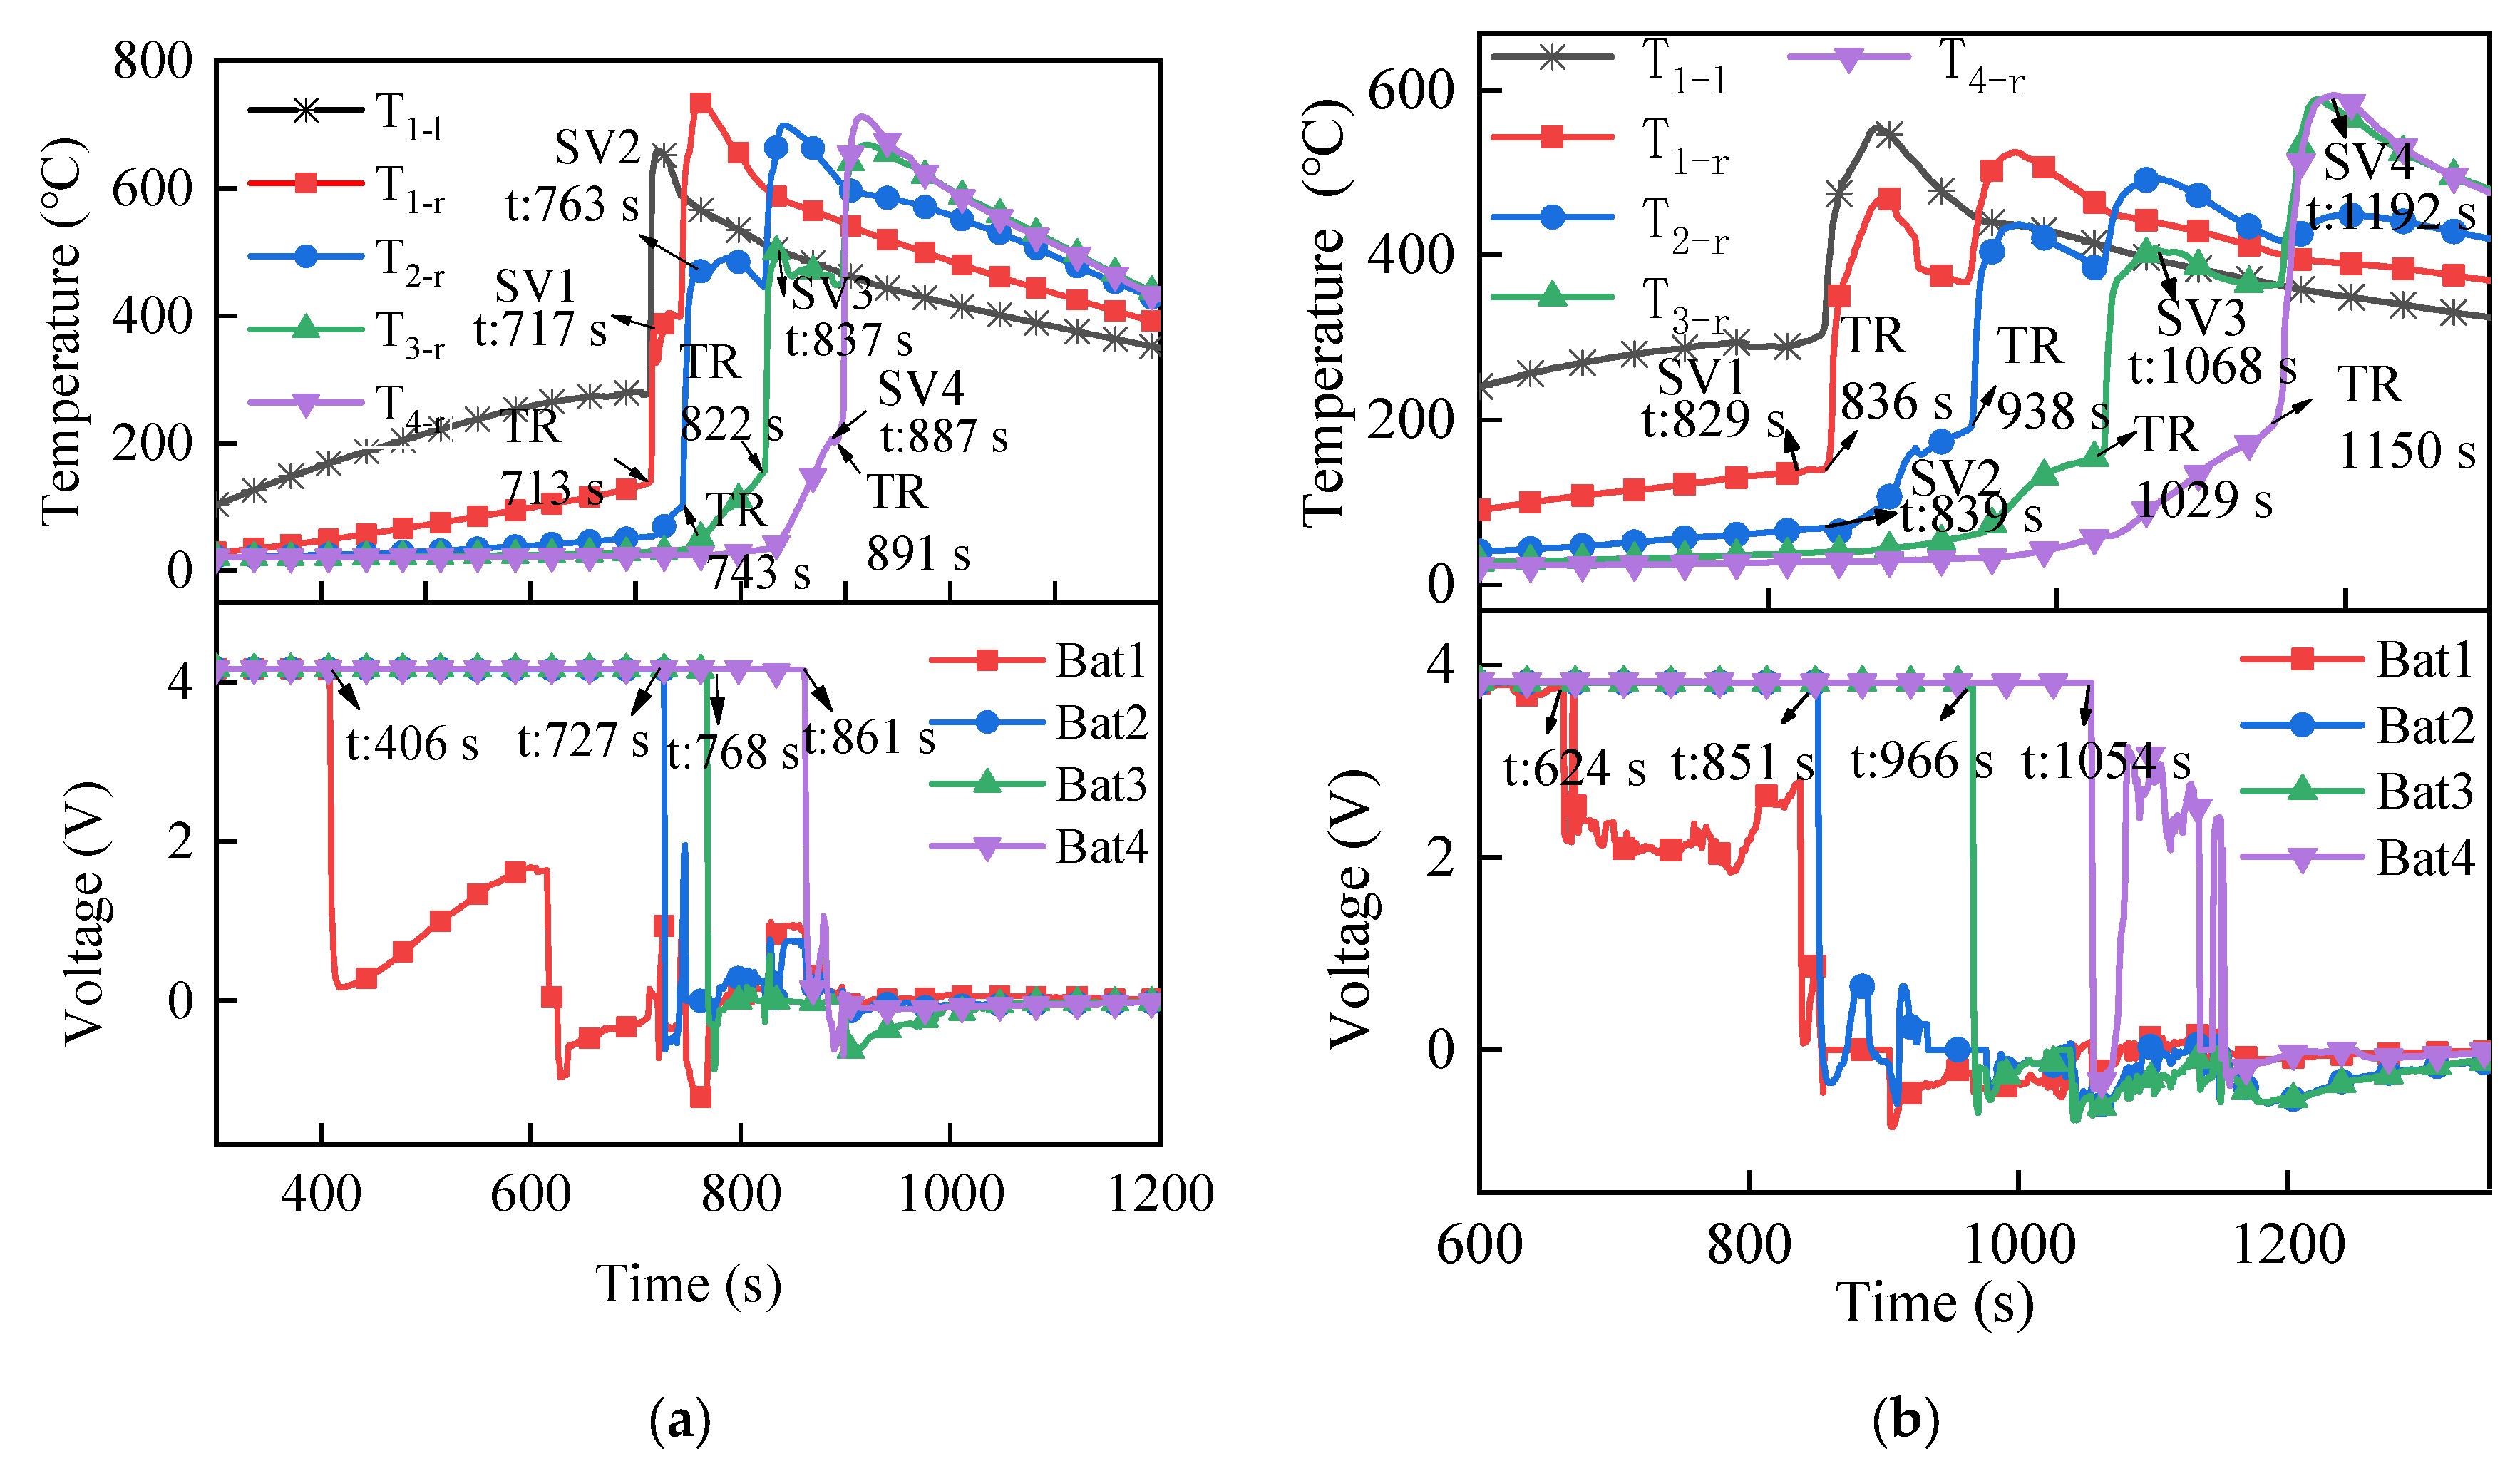
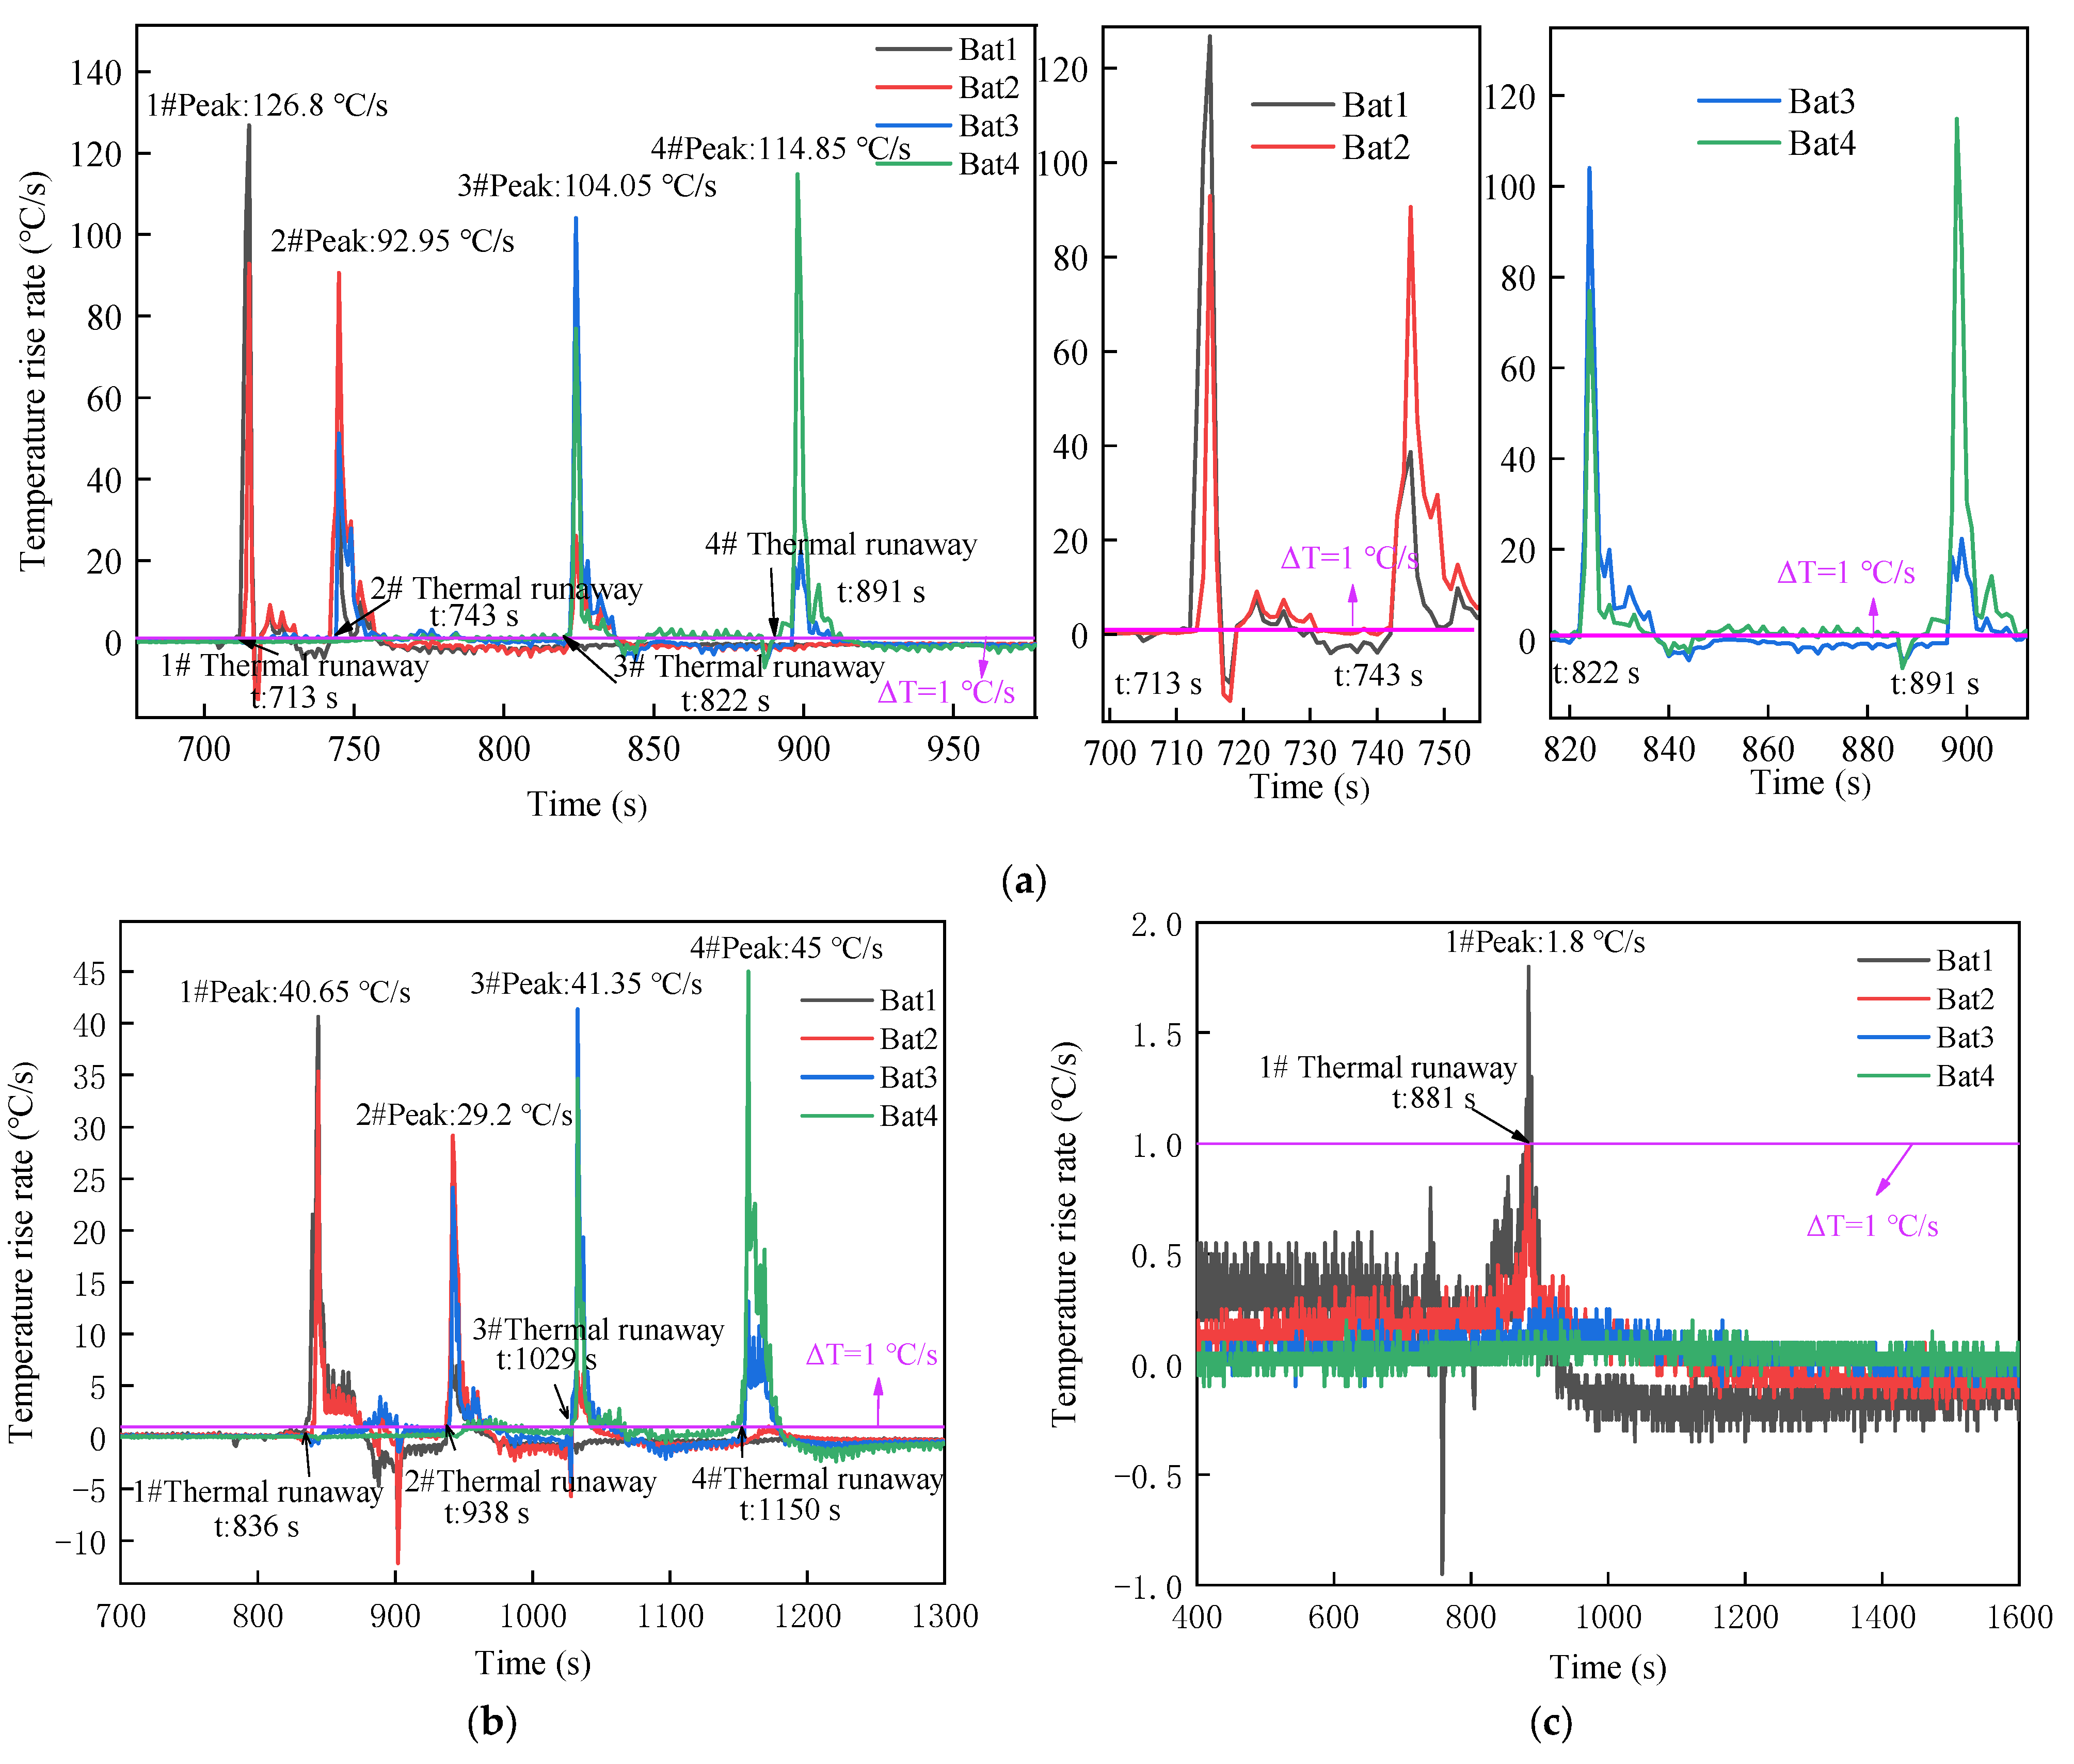
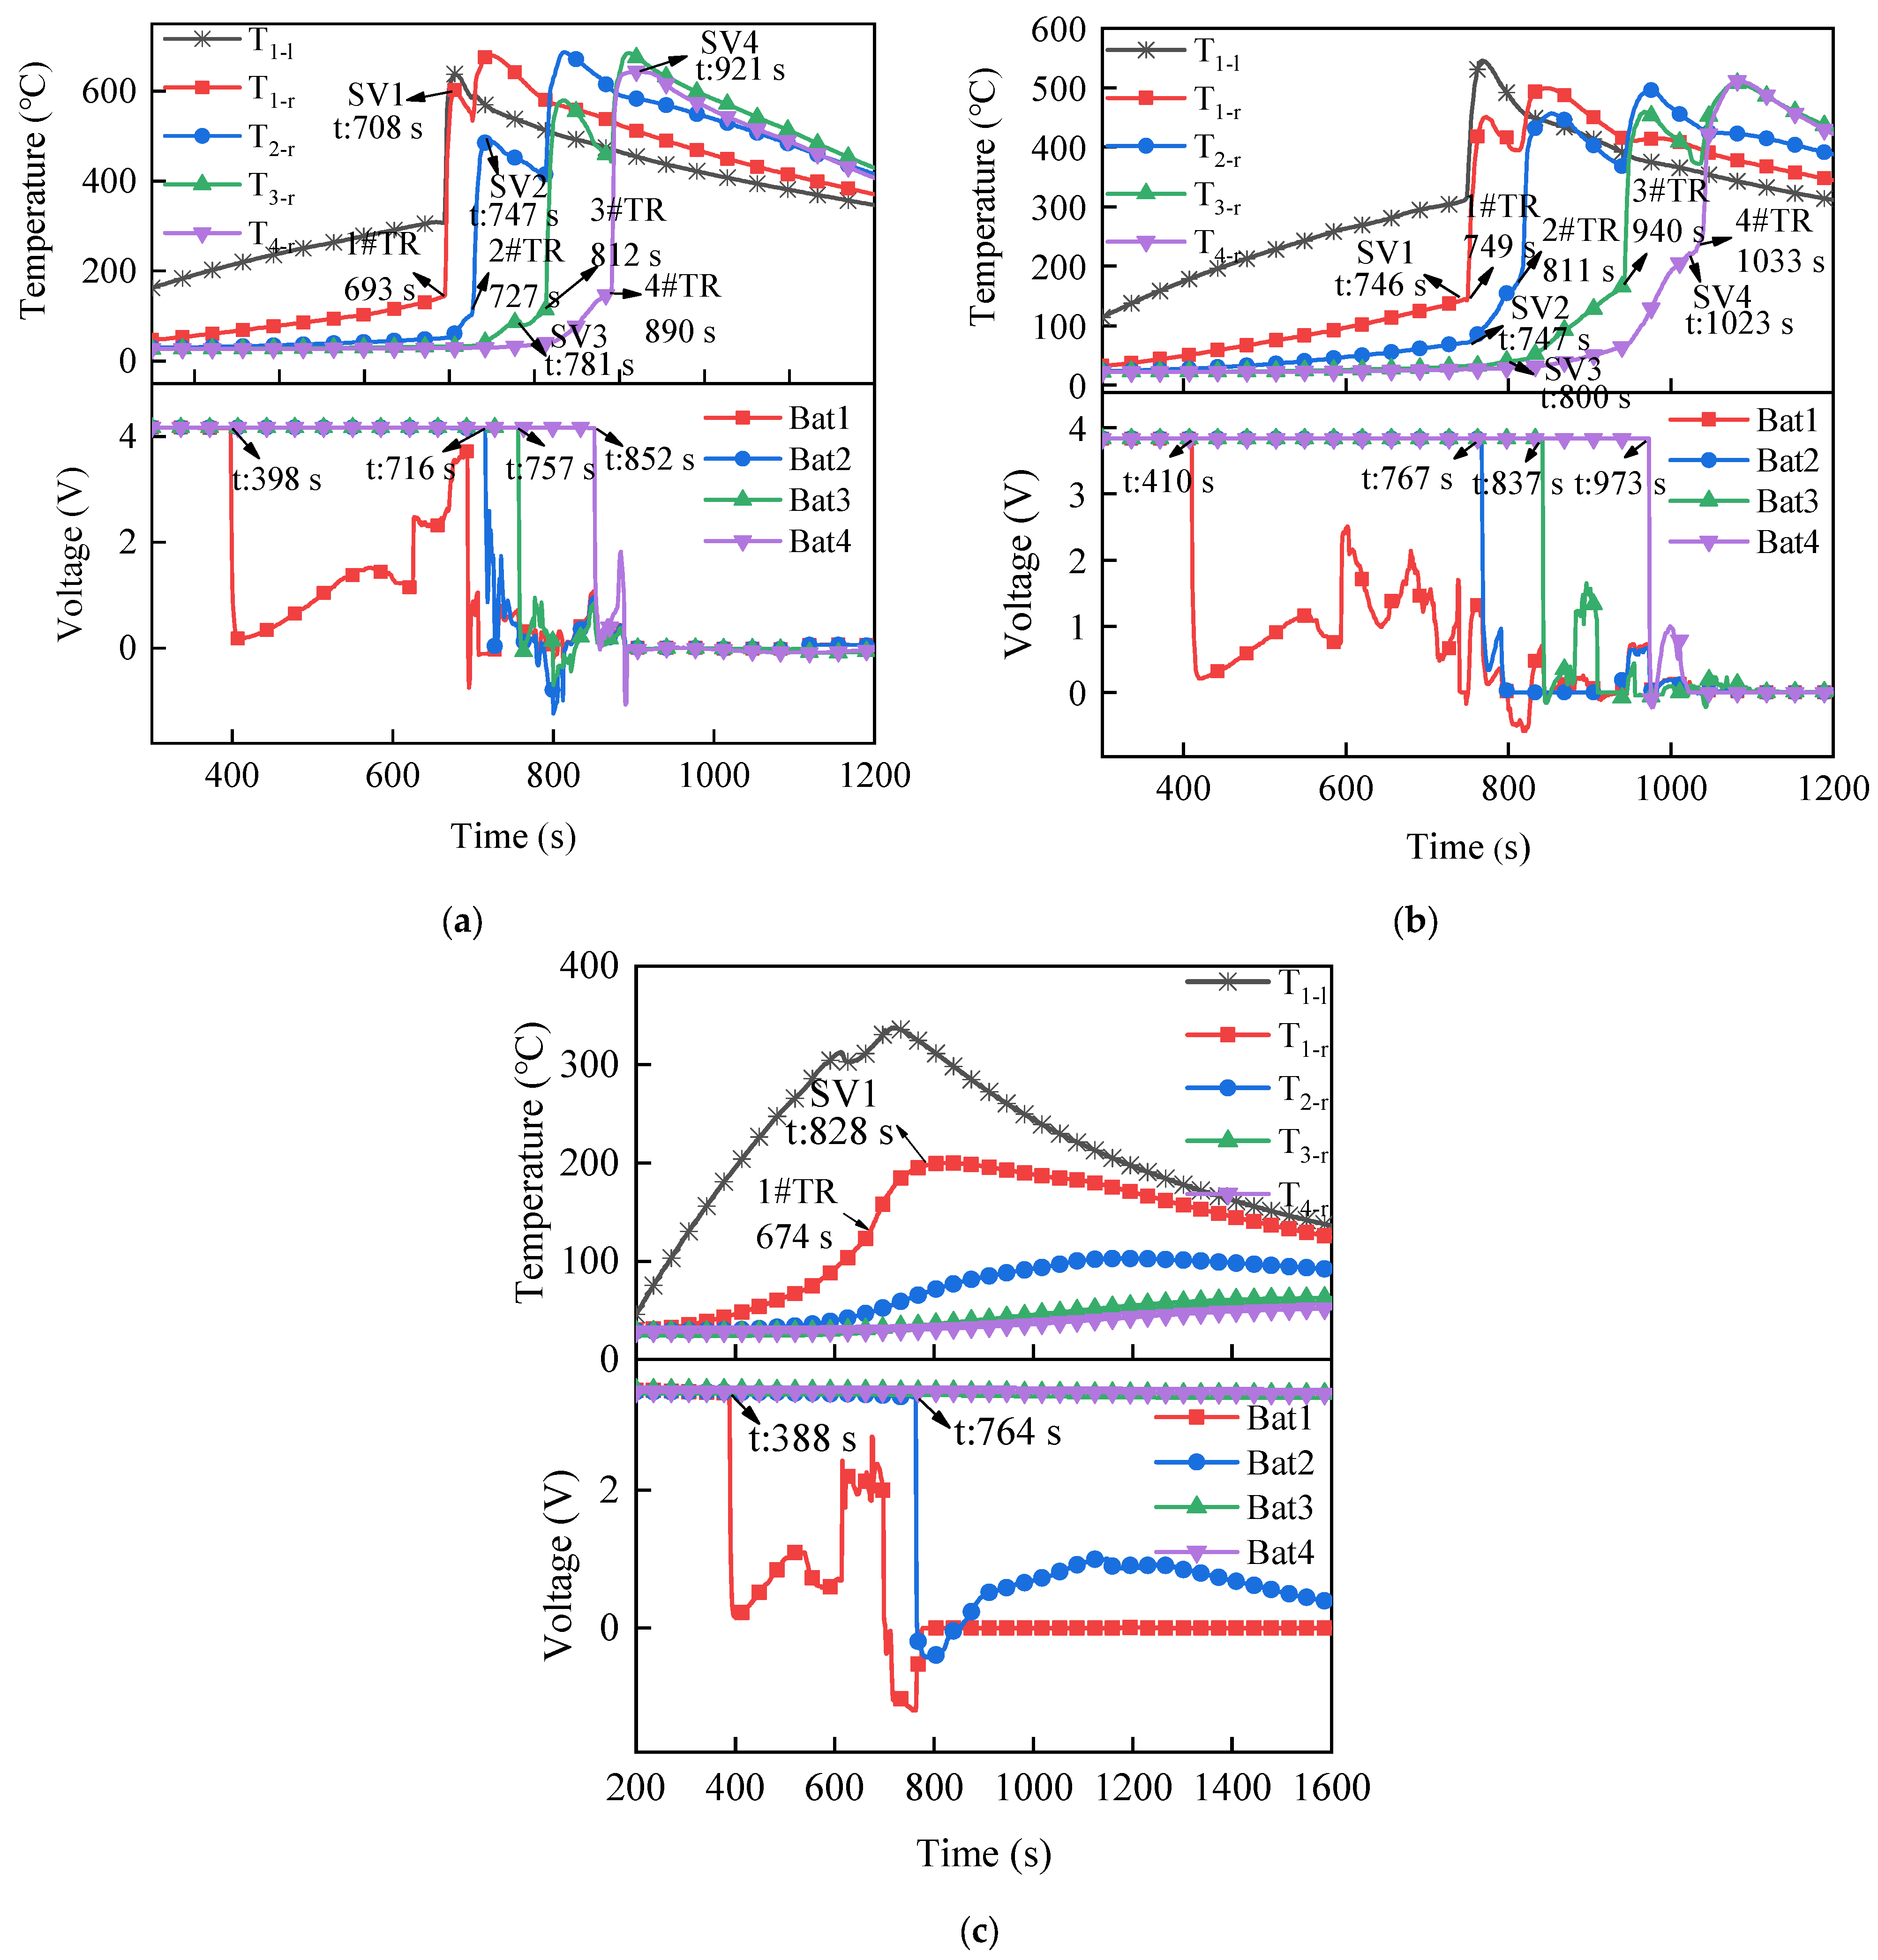
3.1.2. Temperature and Voltage
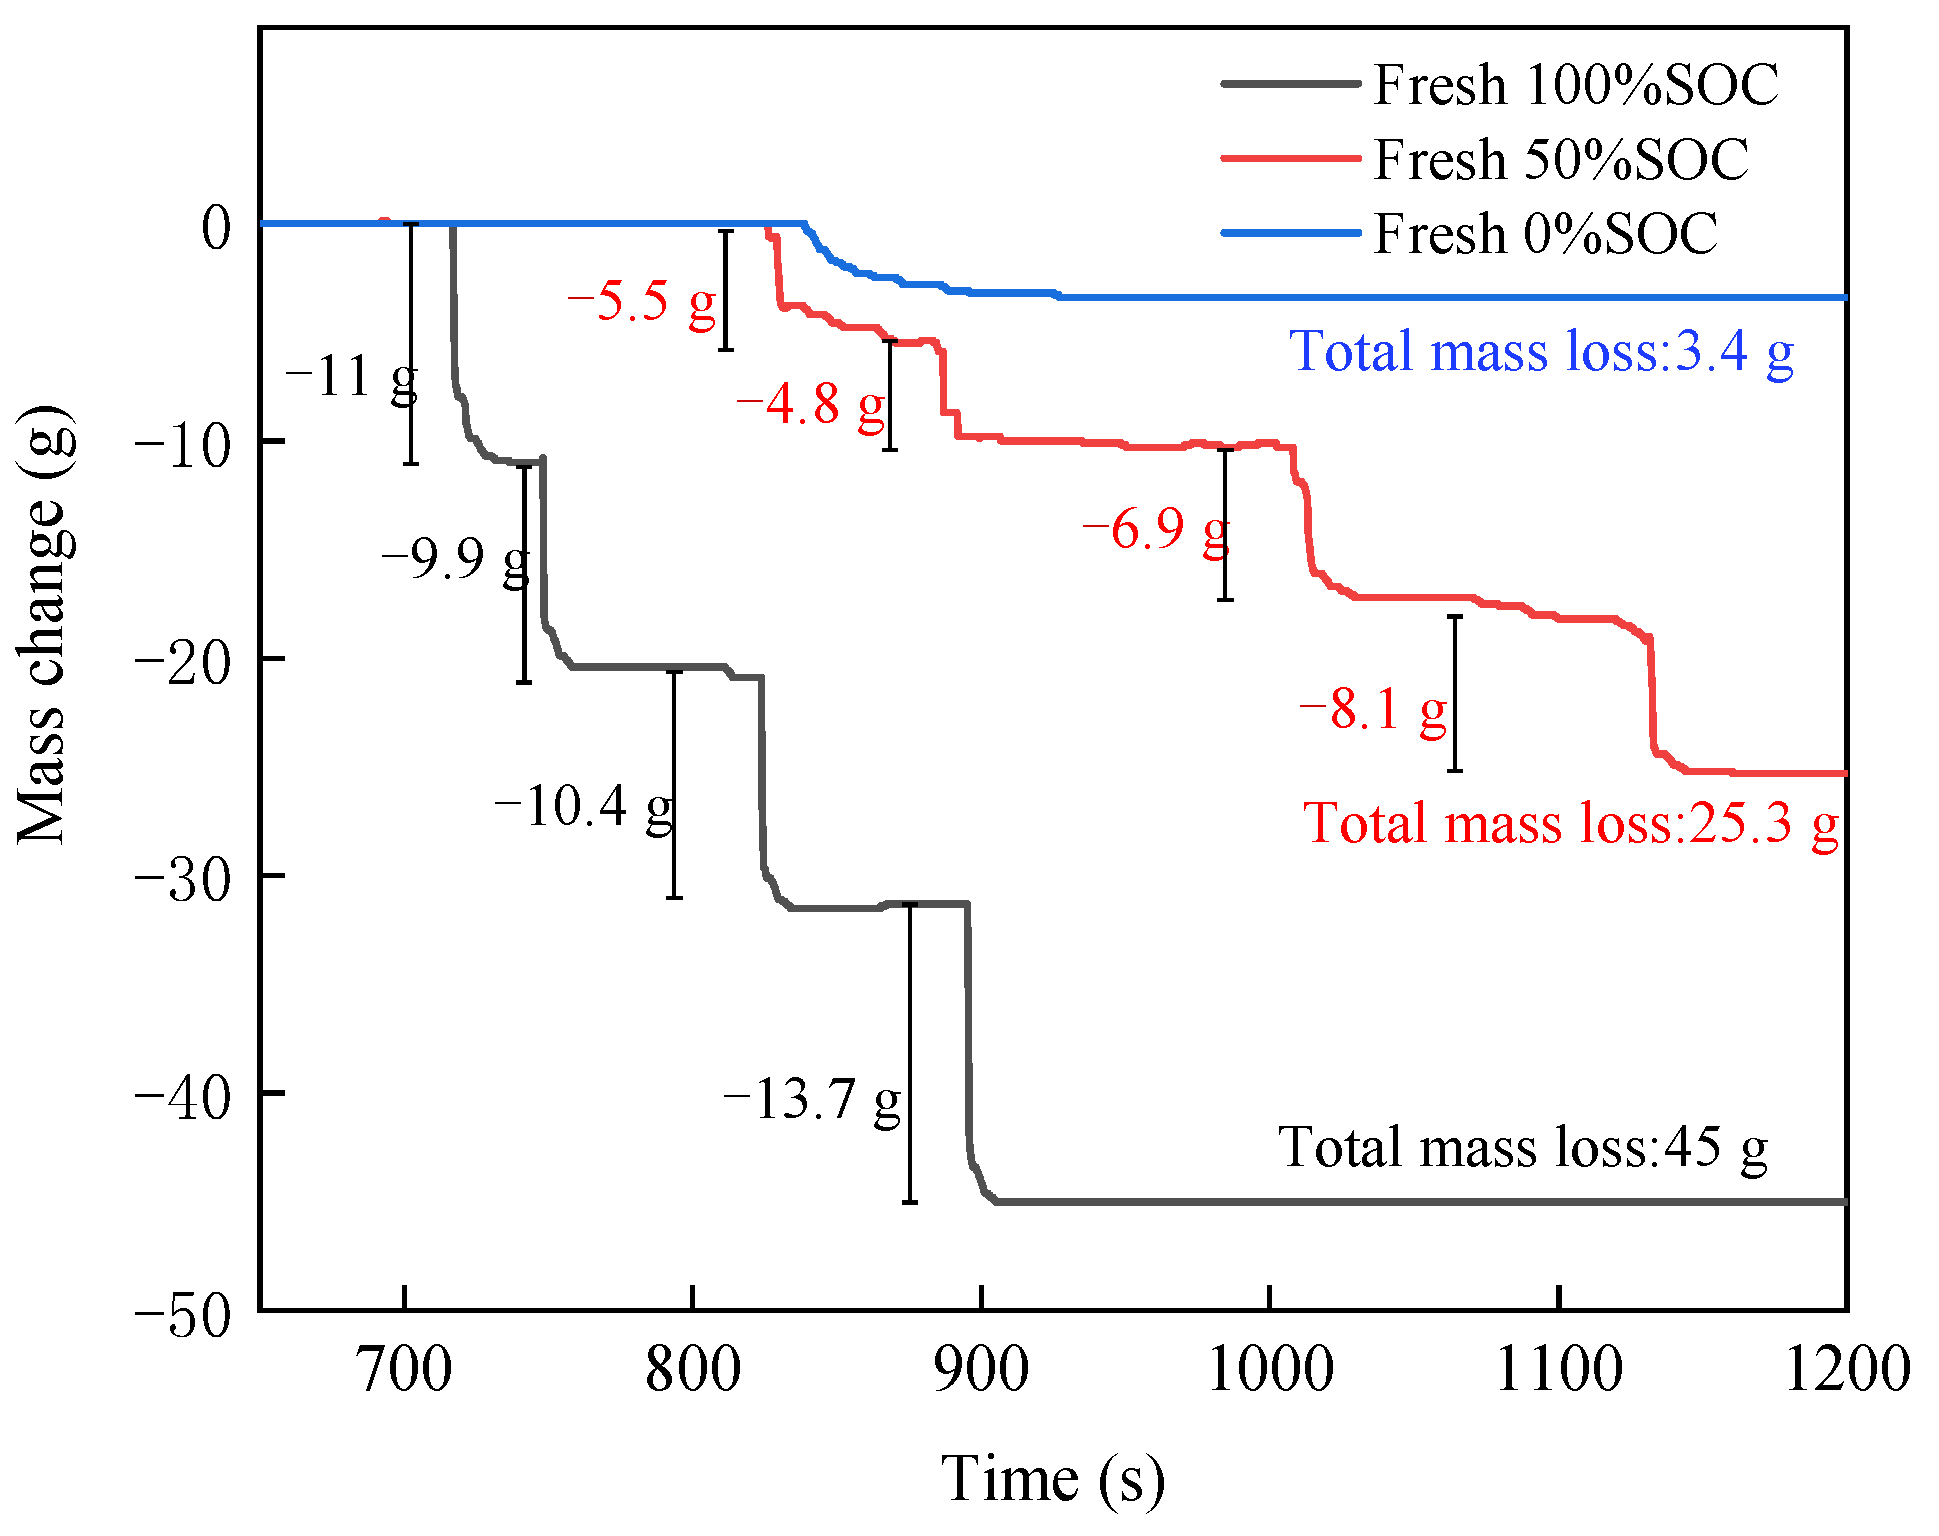
3.1.3. Mass Change
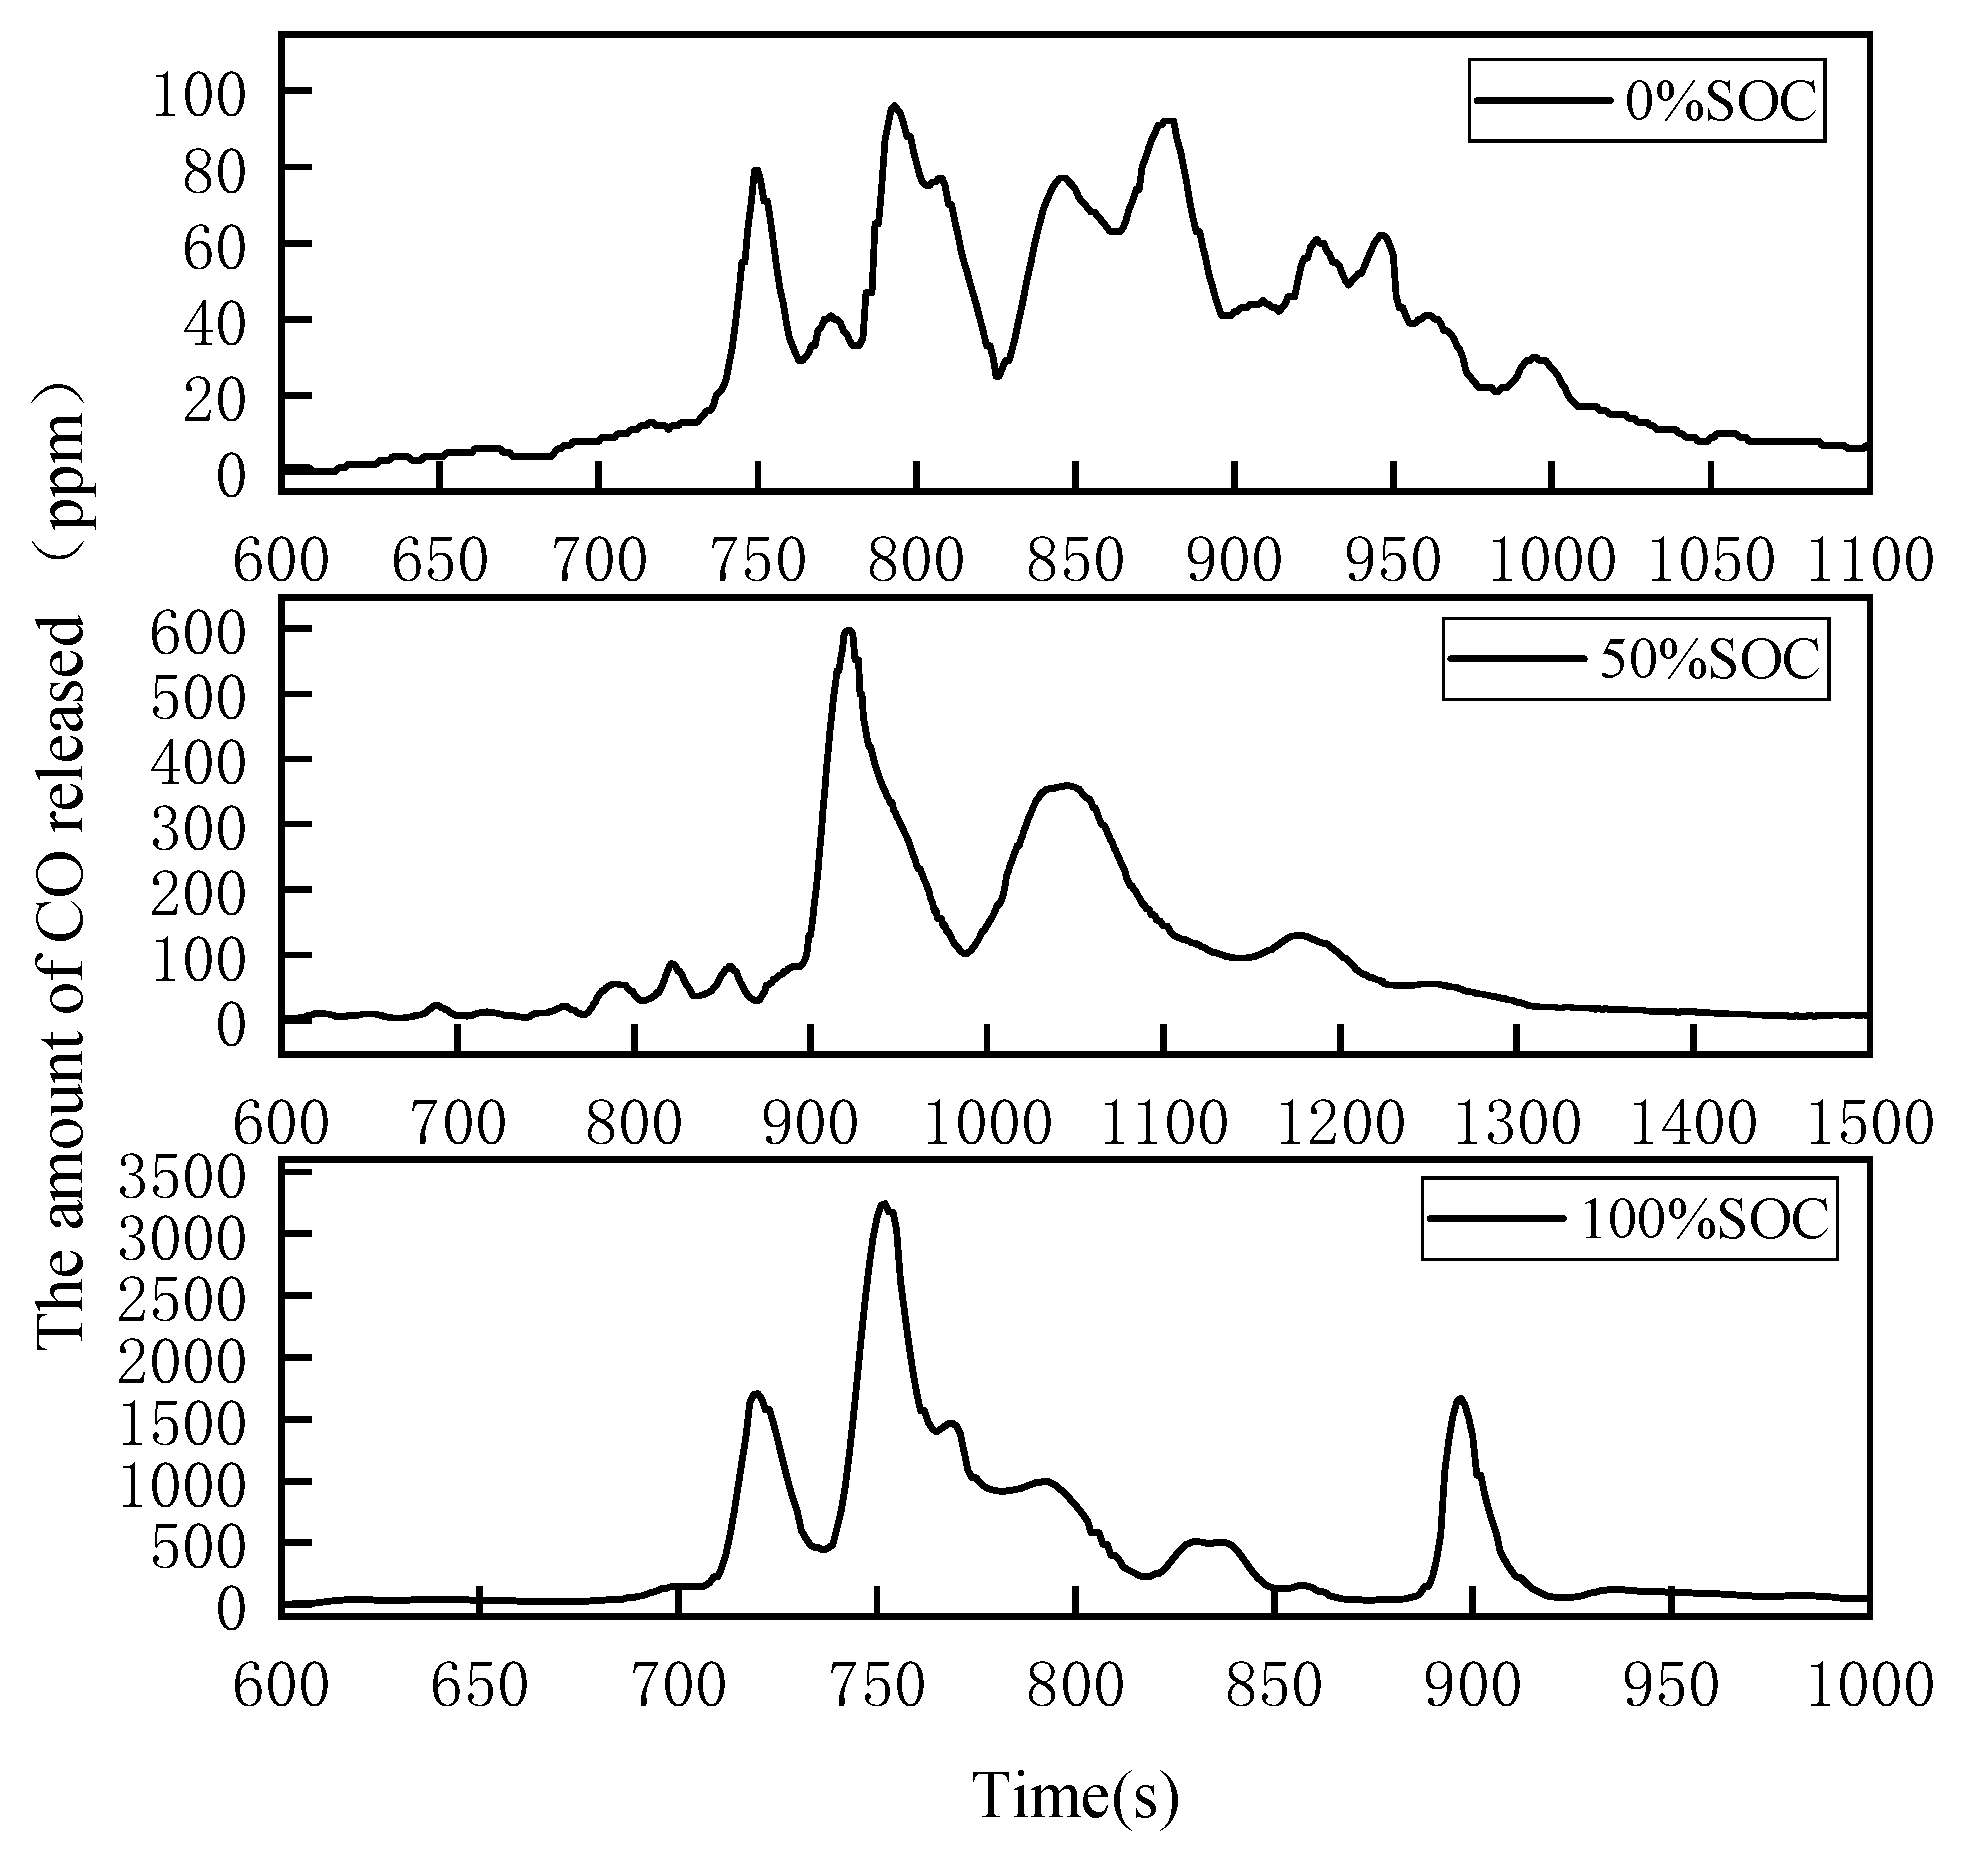
3.1.4. CO Emission
3.2. Thermal Runaway of LIB Modules with Different SOHs
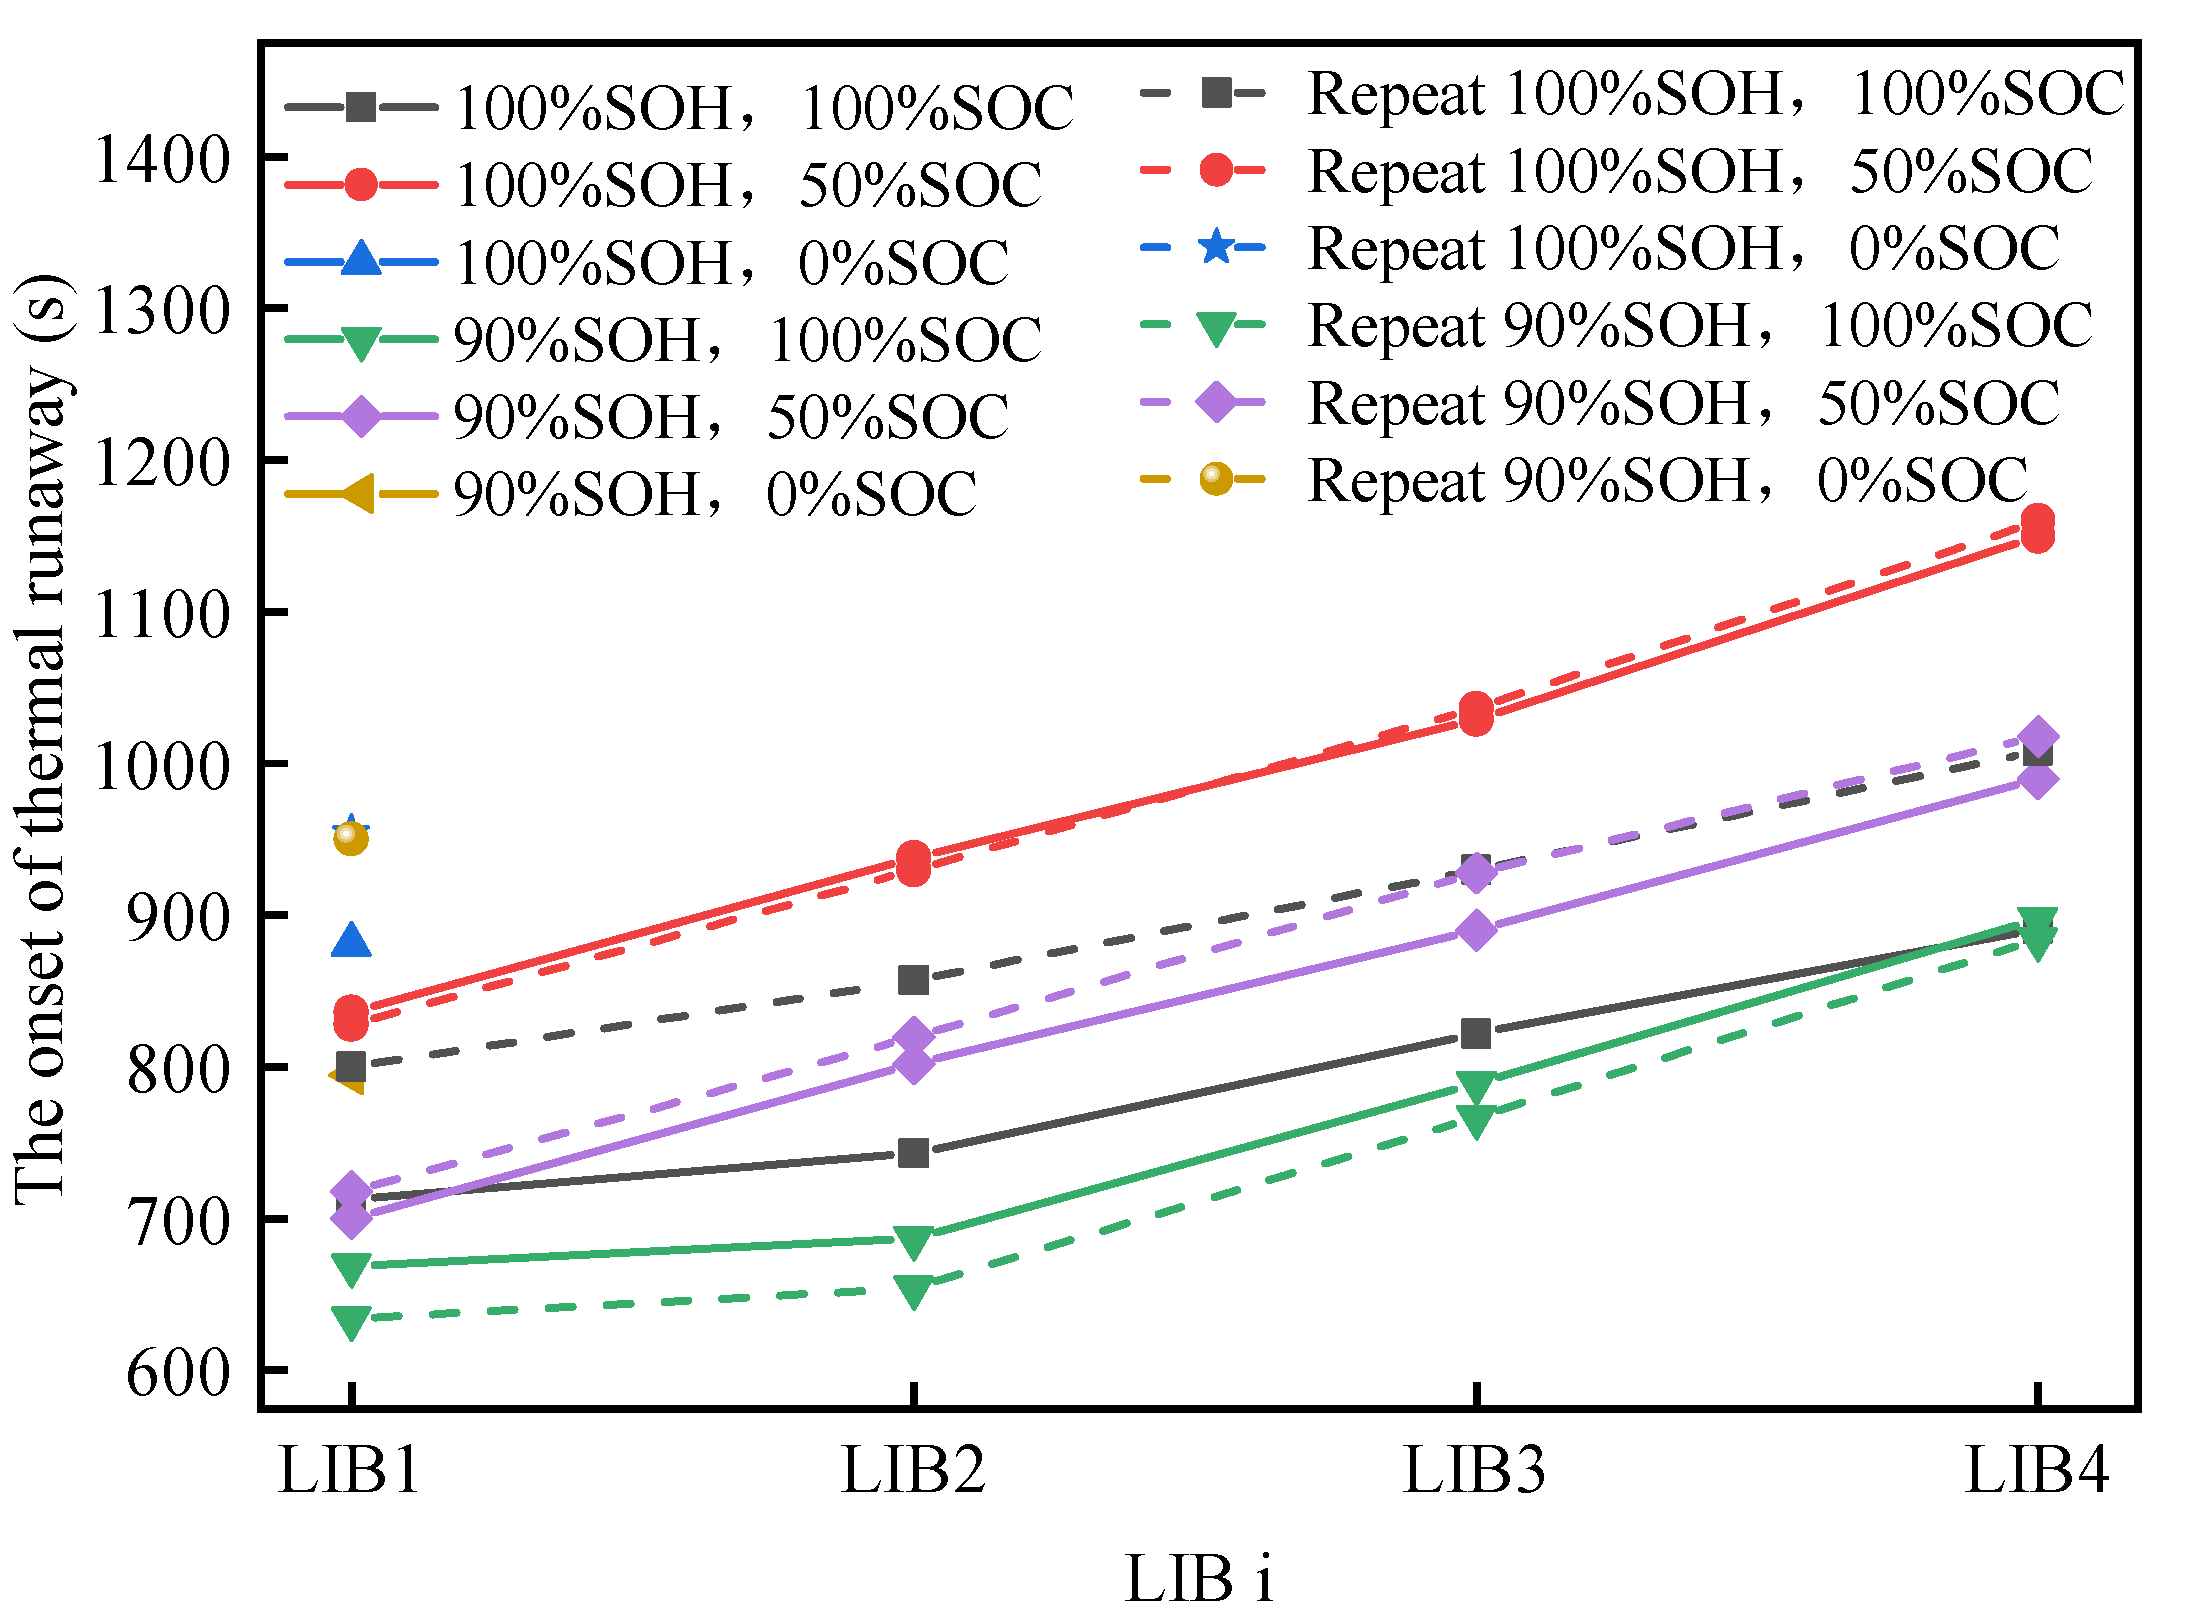
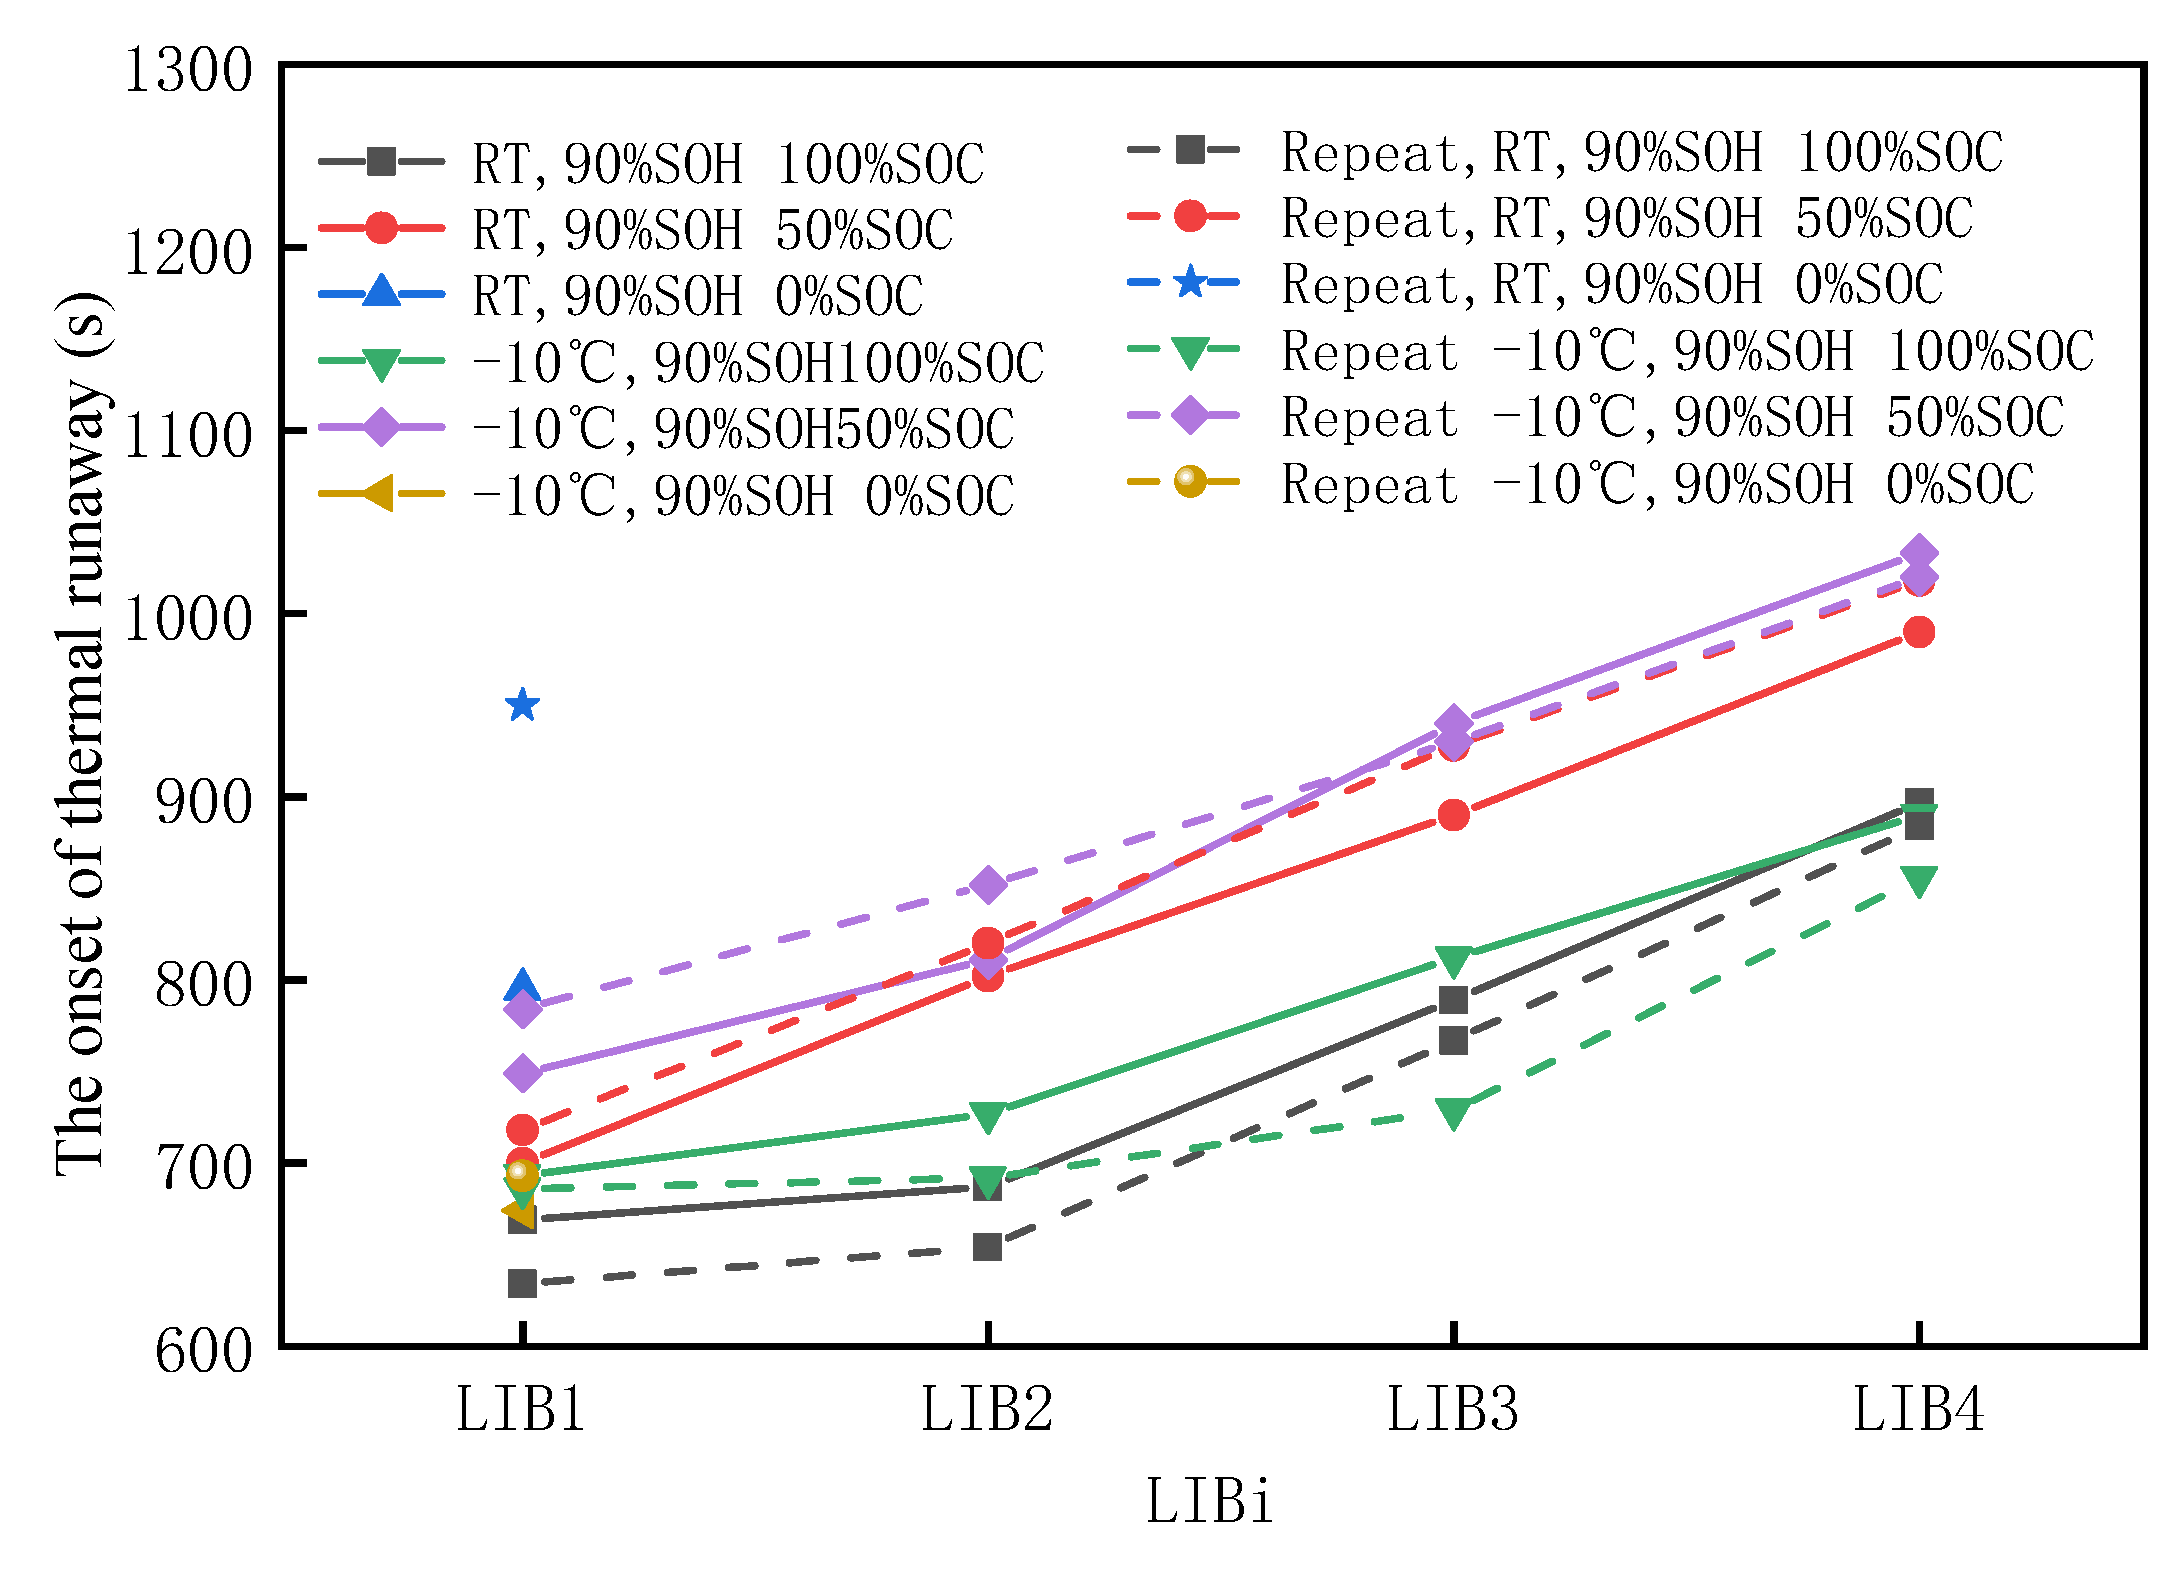
3.2.1. Characteristics of Thermal Runaway Propagation in Aging Batteries
3.2.2. Temperature and Voltage
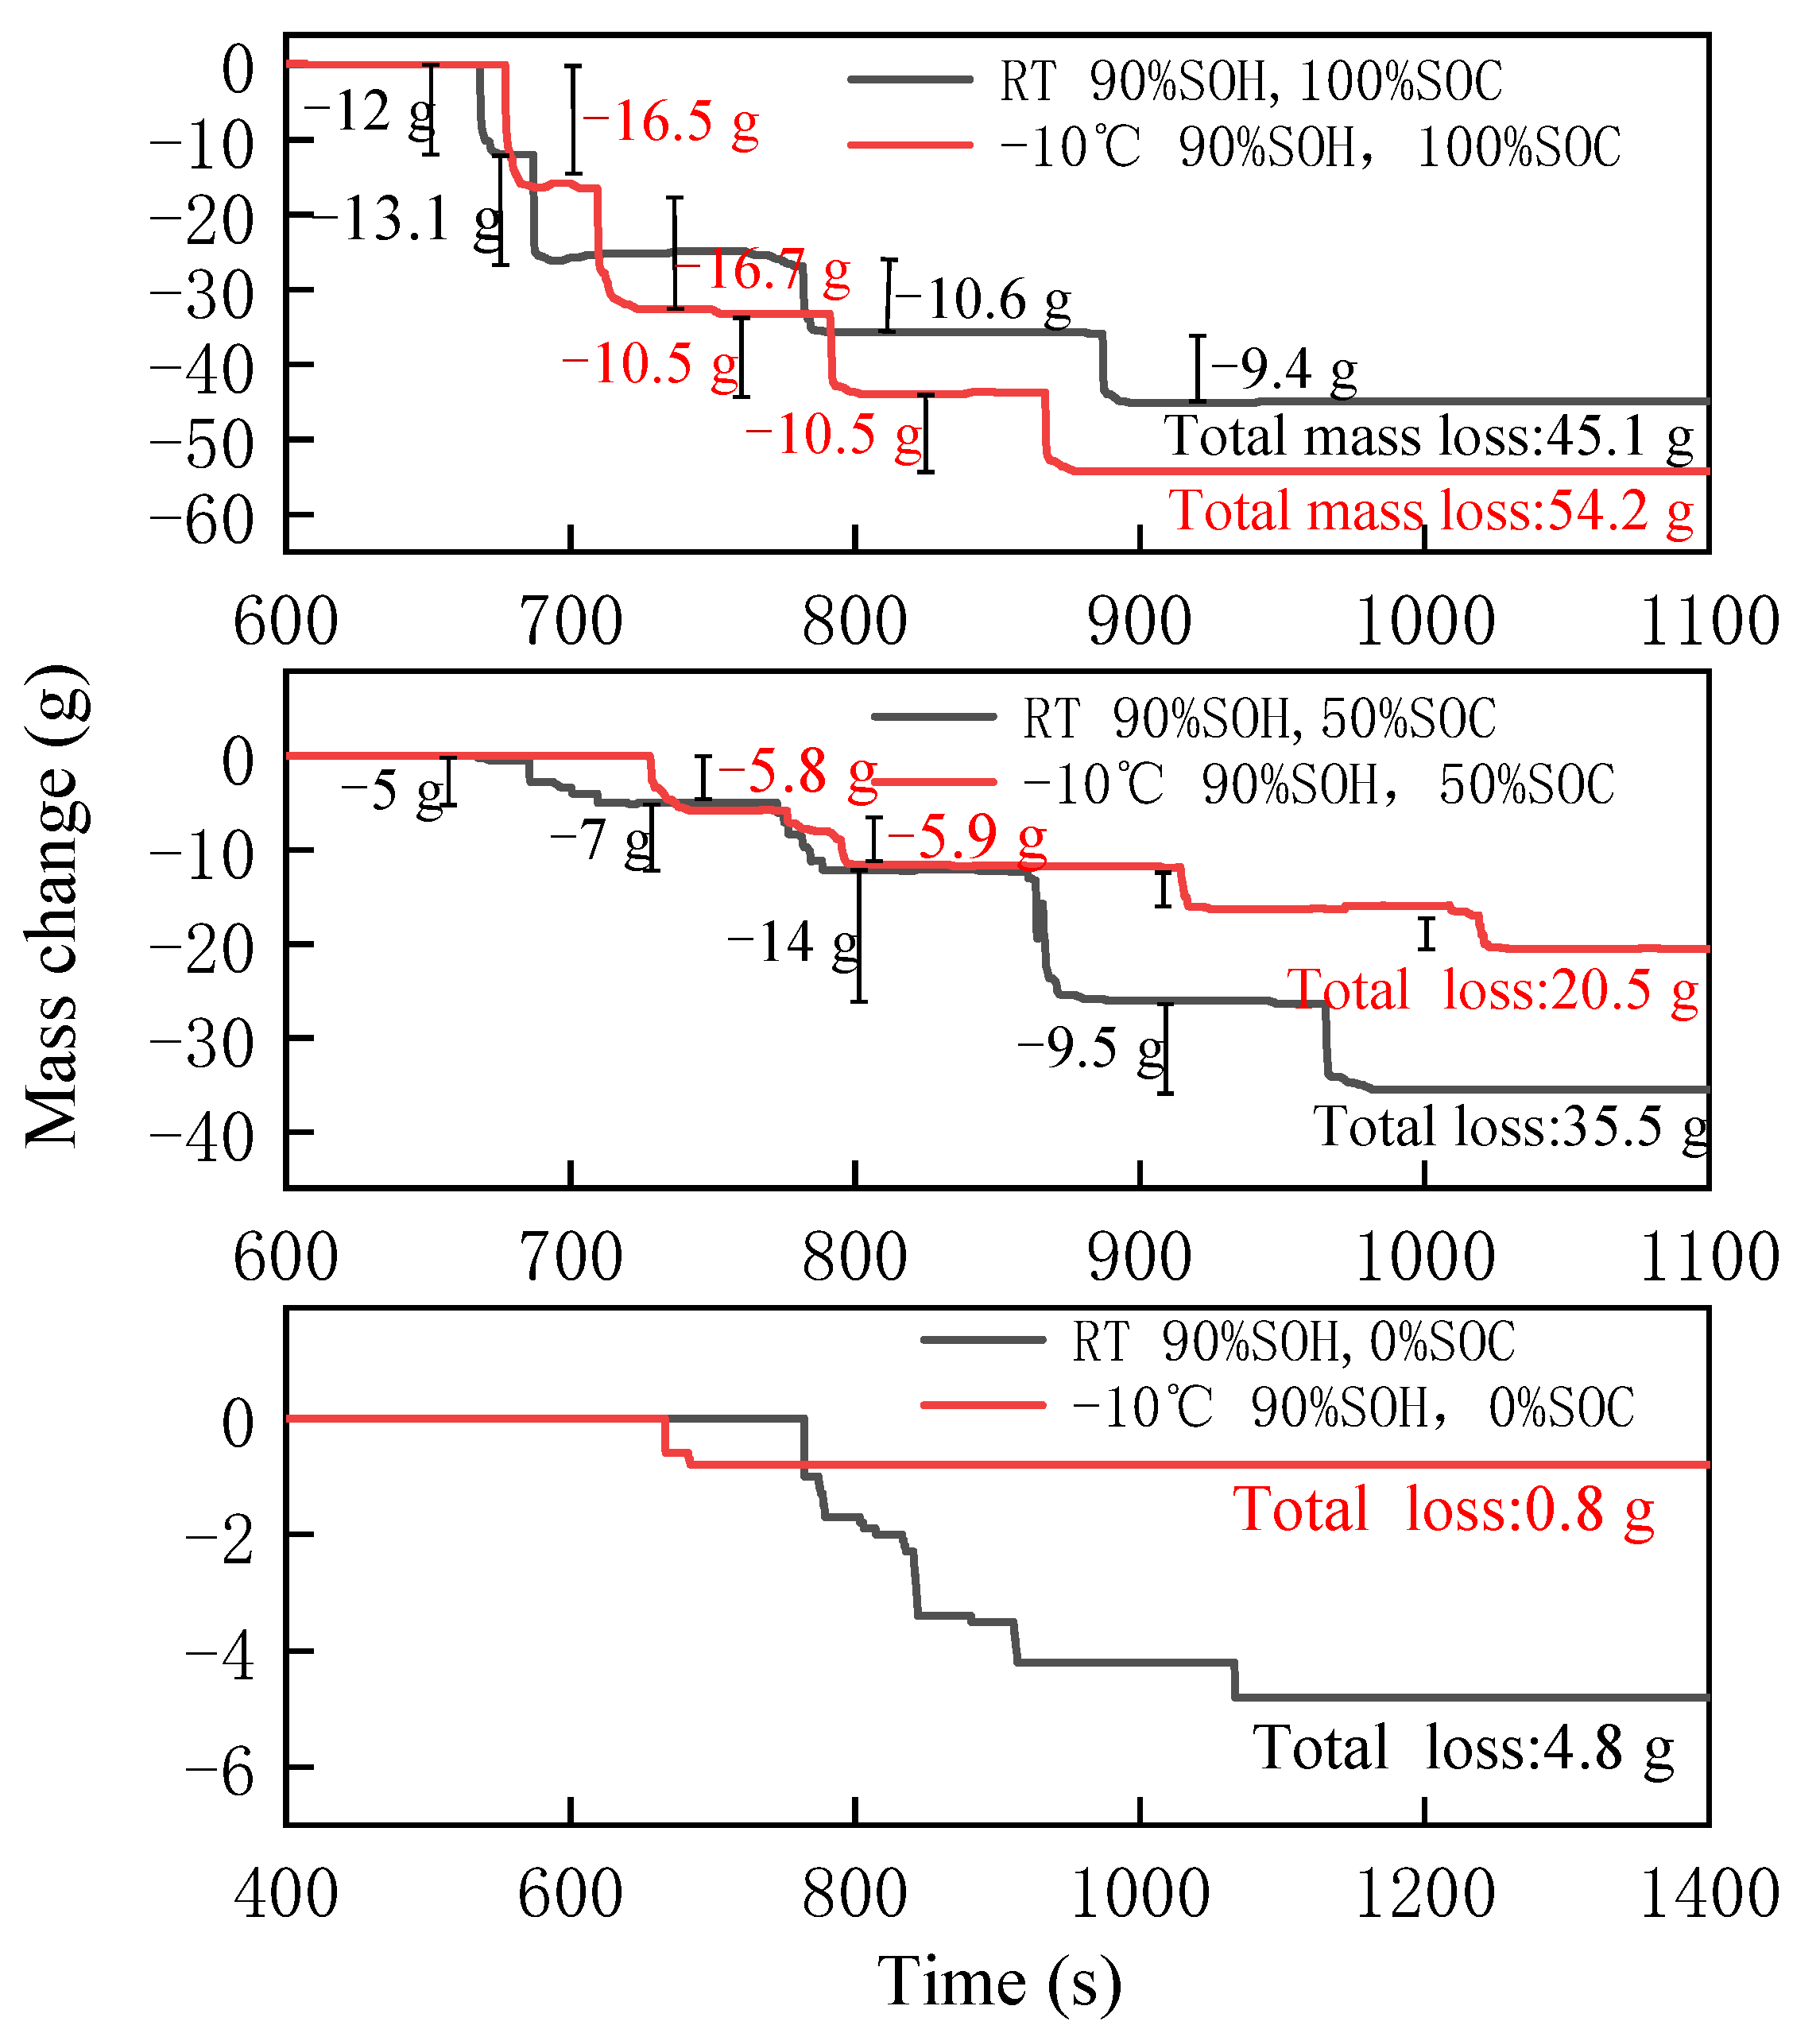
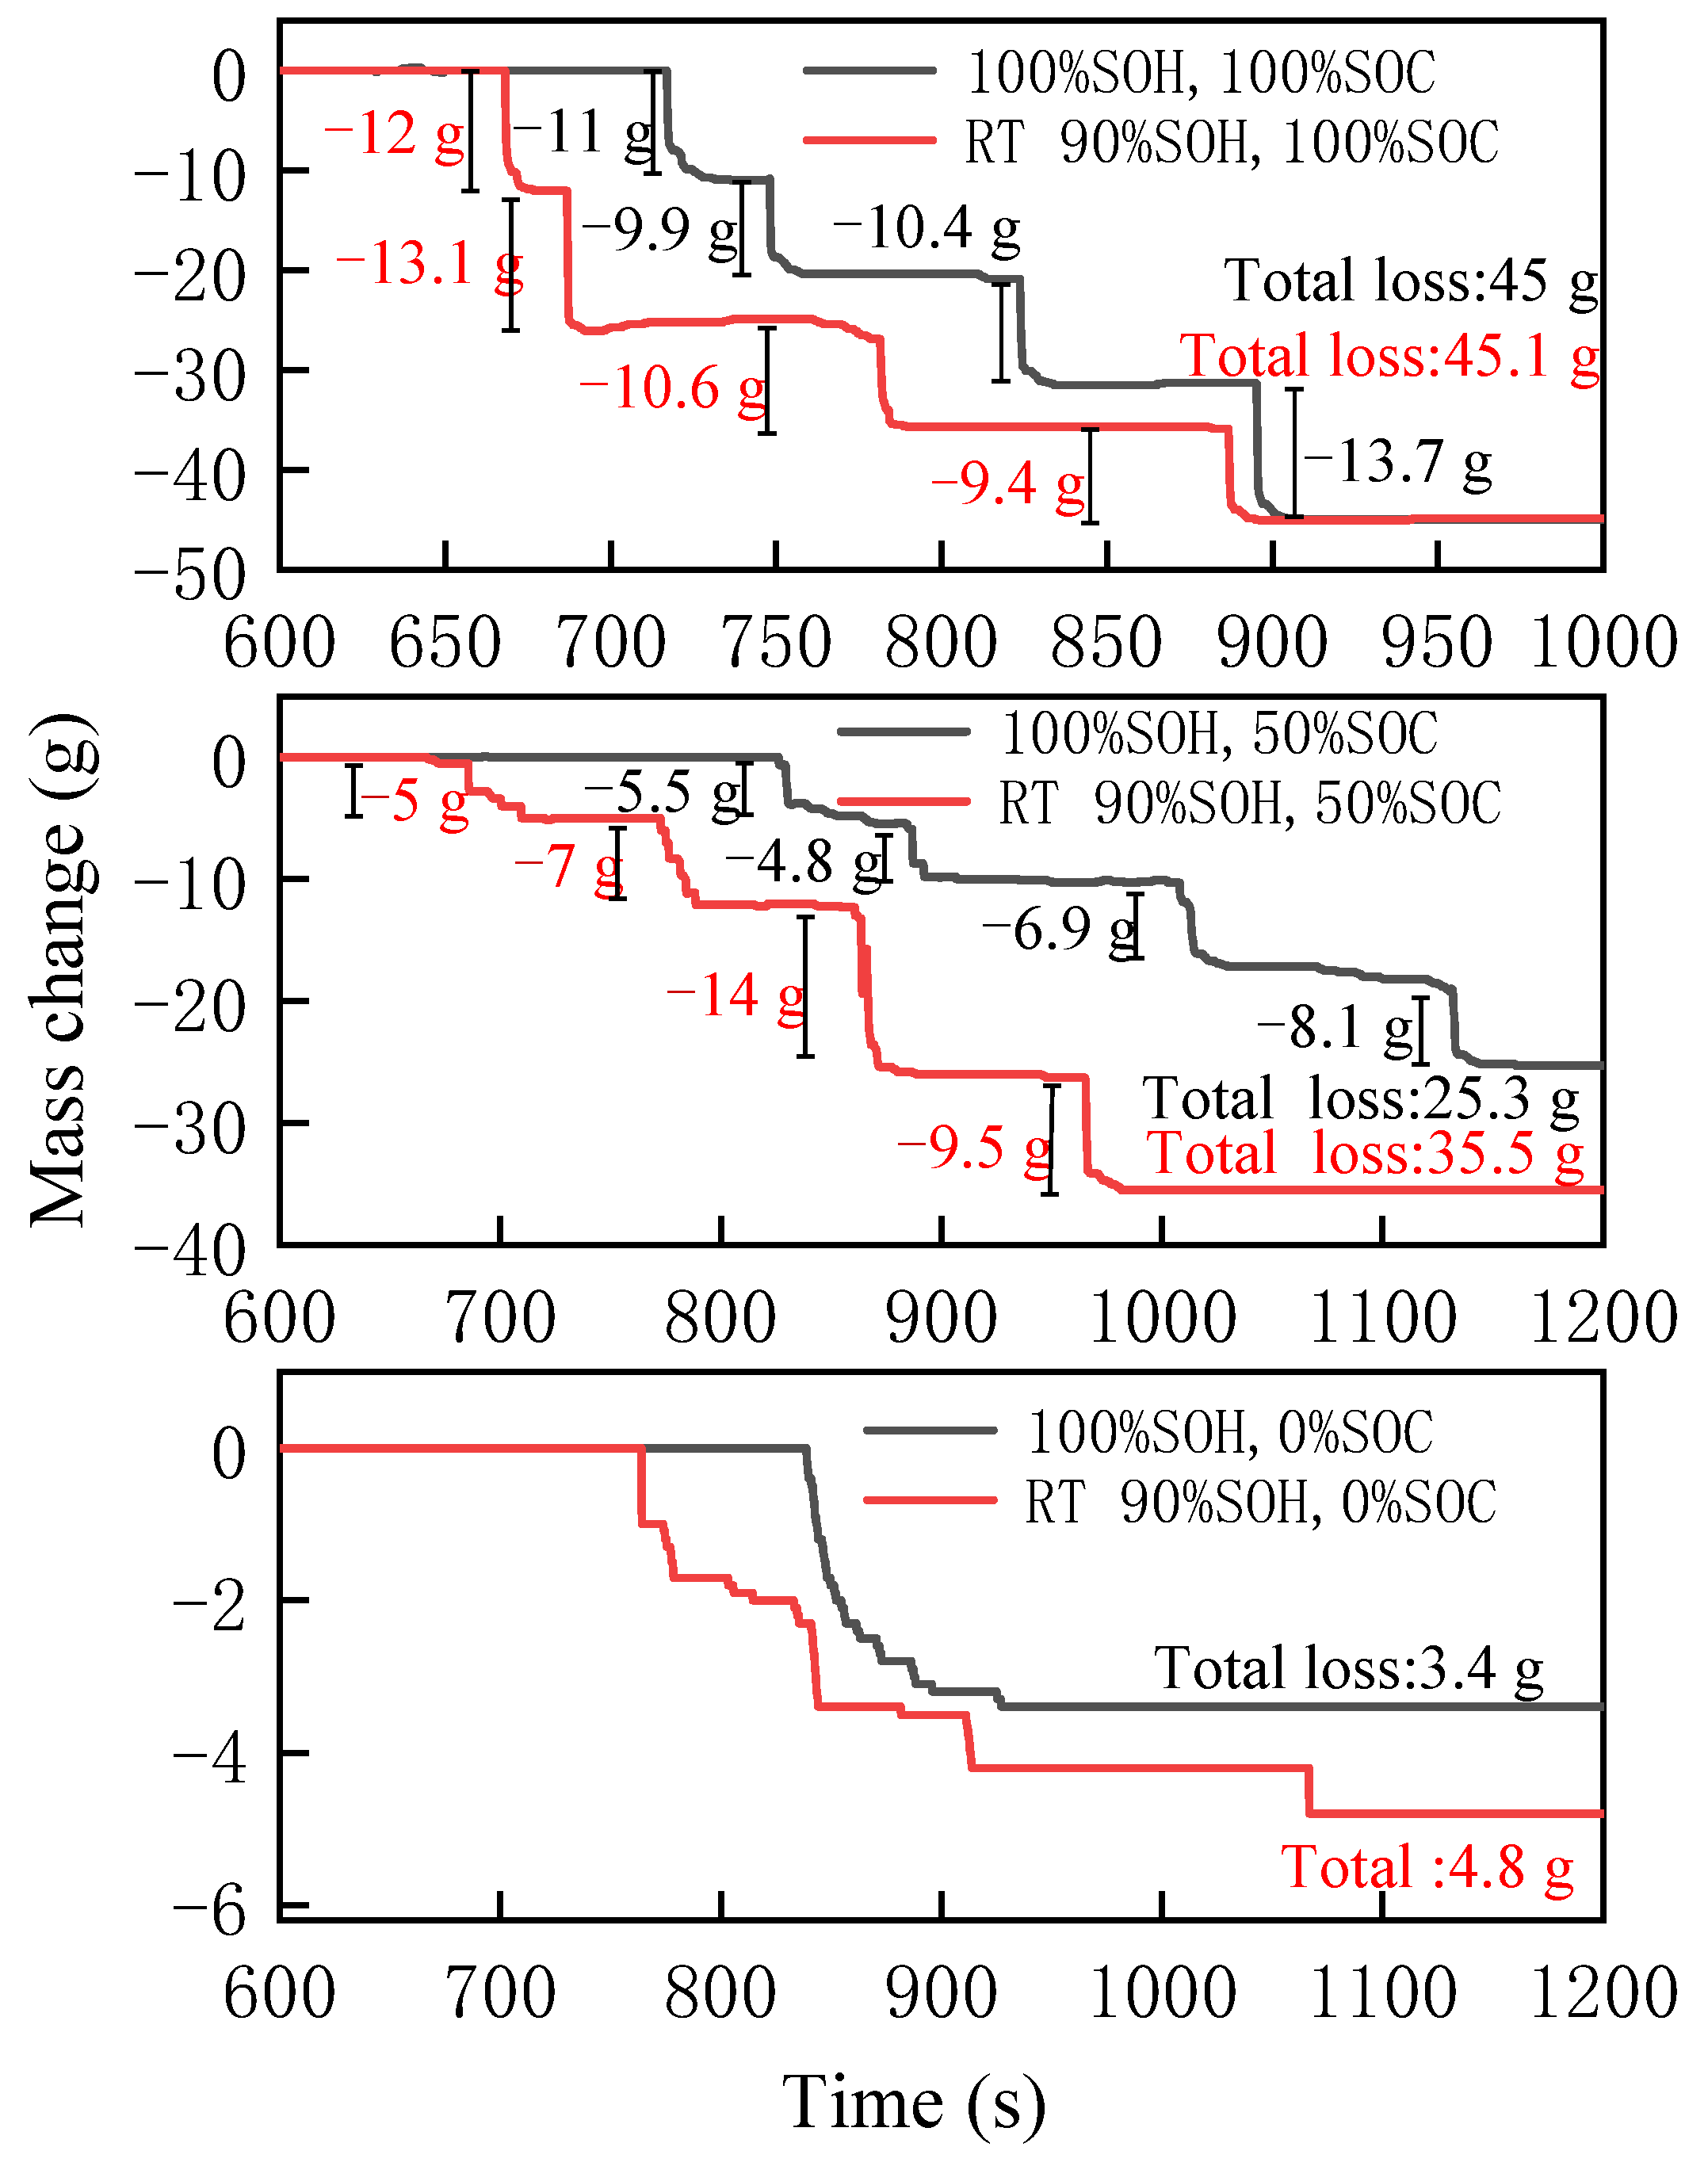
3.2.3. Mass Change
3.3. Thermal Runaway of LIB Modules with Different Aging Temperatures
3.3.1. Characteristics of Thermal Runaway Propagation in Aging Batteries
3.3.2. Temperature and Voltage
3.3.3. Mass Change
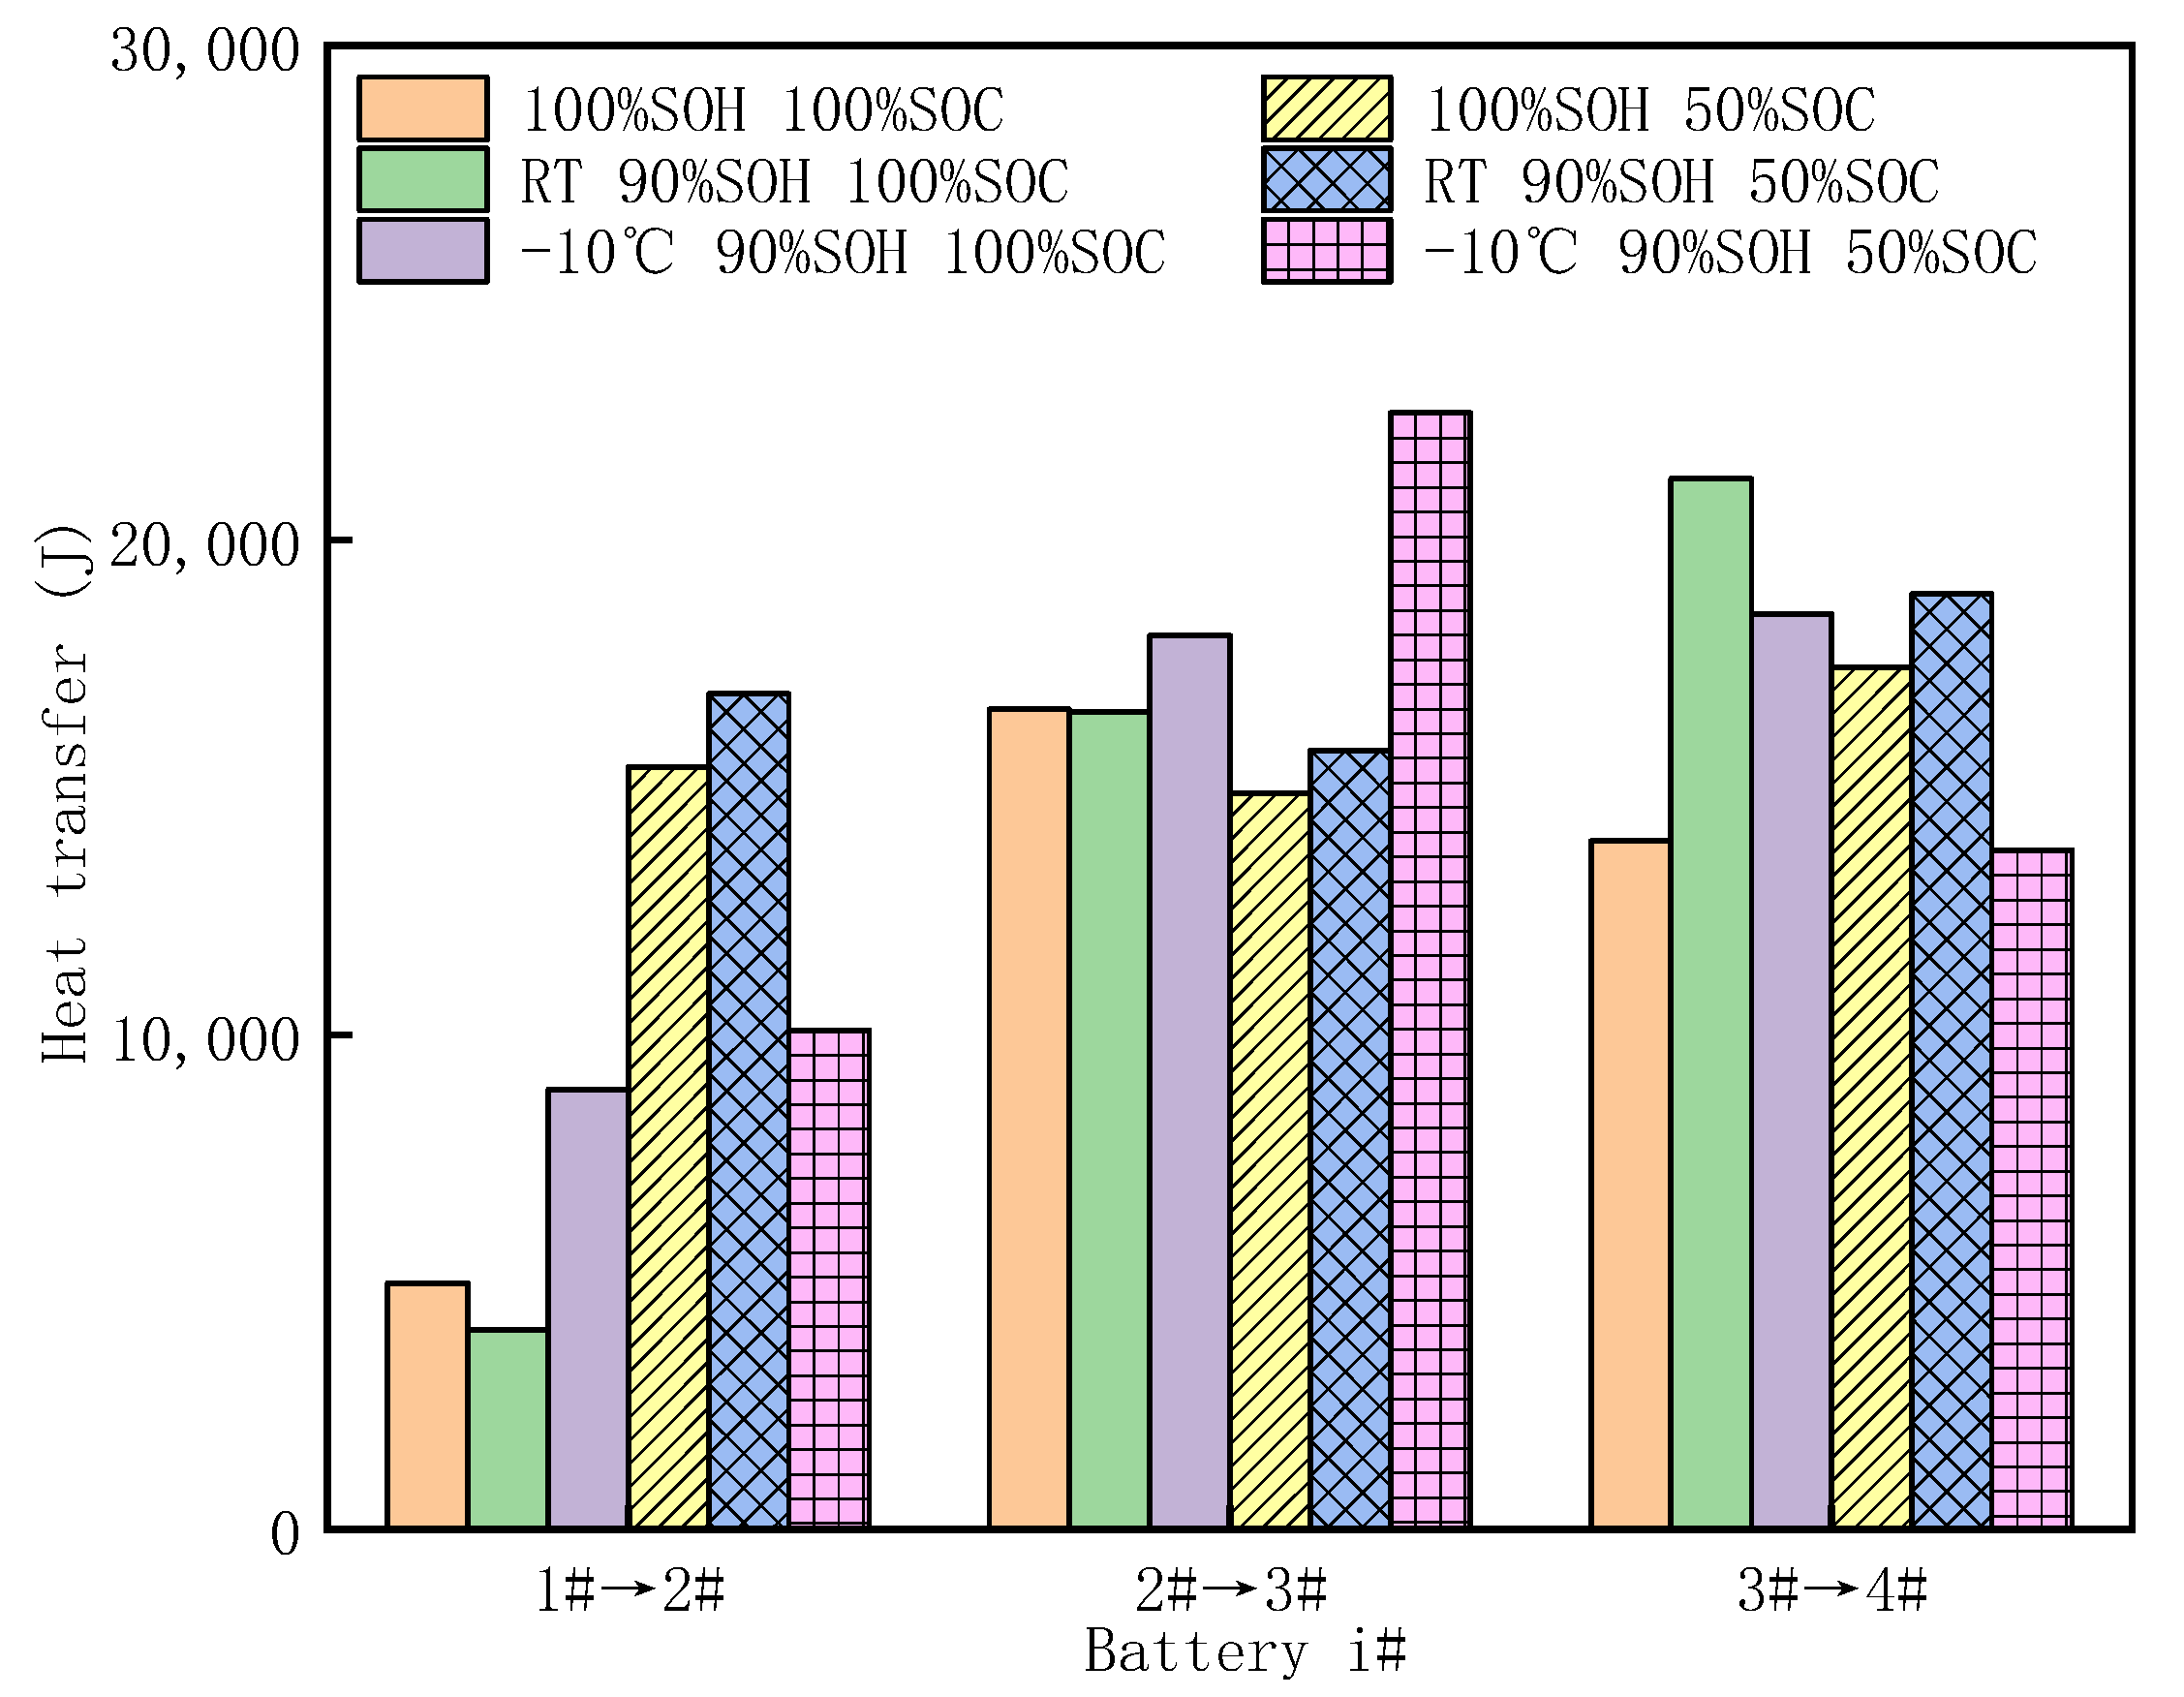
3.4. Analysis of Heat Transfer
4. Conclusions
- Increasing the SOC of the battery module leads to a more severe TR, as evidenced by earlier TR start times, accelerated TRP, increased temperature and temperature rates, greater mass loss, and higher CO emissions. These factors contribute to the increased harm caused by TR.
- Compared with the fresh battery modules, the room-temperature aged battery modules were less thermally stable and lost more mass.
- Compared with room temperature aging, the thermal stability of the battery modules was worse after low temperature aging, which was reflected in a faster propagation rate, higher increase in temperature rate, and greater mass loss.
- The heat transfer between adjacent cells was less than 25 kJ. Thermal runaway propagation between cells with higher SOCs requires less heat at the same SOH, and the average heat transfer between adjacent cells increased with the aging degree.
Author Contributions
Funding
Data Availability Statement
Conflicts of Interest
Abbreviations
| LIBs | lithium ion batteries |
| TR | thermal runaway |
| TRP | thermal runaway propagation |
| SOC | state of charge |
| SOH | state of health |
| SEI | solid electrolyte interface |
| CSBC | copper slug battery calorimetry |
| RT | room temperature |
| CV-CC | constant current and constant voltage |
| CC | constant current |
| SV | safety valve |
References
- Habib, A.K.M.R.R.; Butler, K.S. Alternatives to Lithium-Ion Batteries in Electric Vehicles. Future Technol. 2022, 1, 33–34. [Google Scholar] [CrossRef]
- Liu, J.; Wang, Z.; Bai, J. Influences of Multi Factors on Thermal Runaway Induced by Overcharging of Lithium-Ion Battery. J. Energy Chem. 2022, 70, 531–541. [Google Scholar] [CrossRef]
- Zhou, Z.; Ju, X.; Zhou, X.; Yang, L.; Cao, B. A Comprehensive Study on the Impact of Heating Position on Thermal Runaway of Prismatic Lithium-Ion Batteries. J. Power Sources 2022, 520, 230919. [Google Scholar] [CrossRef]
- Doose, S.; Hahn, A.; Fischer, S.; Müller, J.; Haselrieder, W.; Kwade, A. Comparison of the Consequences of State of Charge and State of Health on the Thermal Runaway Behavior of Lithium Ion Batteries. J. Energy Storage 2023, 62, 106837. [Google Scholar] [CrossRef]
- Dubarry, M.; Liaw, B.Y. Identify Capacity Fading Mechanism in a Commercial LiFePO4 Cell. J. Power Sources 2009, 194, 541–549. [Google Scholar] [CrossRef]
- Friesen, A.; Horsthemke, F.; Mönnighoff, X.; Brunklaus, G.; Krafft, R.; Börner, M.; Risthaus, T.; Winter, M.; Schappacher, F.M. Impact of Cycling at Low Temperatures on the Safety Behavior of 18650-Type Lithium Ion Cells: Combined Study of Mechanical and Thermal Abuse Testing Accompanied by Post-Mortem Analysis. J. Power Sources 2016, 334, 1–11. [Google Scholar] [CrossRef]
- Li, D.; Danilov, D.L.; Xie, J.; Raijmakers, L.; Gao, L.; Yang, Y.; Notten, P.H.L. Degradation Mechanisms of C6/LiFePO4 Batteries: Experimental Analyses of Calendar Aging. Electrochim. Acta 2016, 190, 1124–1133. [Google Scholar] [CrossRef]
- Li, H.; Duan, Q.; Zhao, C.; Huang, Z.; Wang, Q. Experimental Investigation on the Thermal Runaway and Its Propagation in the Large Format Battery Module with Li(Ni1/3Co1/3Mn1/3)O2 as Cathode. J. Hazard. Mater. 2019, 375, 241–254. [Google Scholar] [CrossRef]
- Wang, B.; Zhou, Z.; Li, L.; Peng, Y.; Cao, J.; Yang, L.; Cao, B. Experimental Study on Thermal Runaway and Its Propagation of Large Format Prismatic Lithium-Ion Batteries. J. Energy Storage 2022, 55, 105550. [Google Scholar] [CrossRef]
- Fang, J.; Cai, J.; He, X. Experimental Study on the Vertical Thermal Runaway Propagation in Cylindrical Lithium-Ion Batteries: Effects of Spacing and State of Charge. Appl. Therm. Eng. 2021, 197, 117399. [Google Scholar] [CrossRef]
- Liu, Y.; Niu, H.; Liu, J.; Huang, X. Layer-to-Layer Thermal Runaway Propagation of Open-Circuit Cylindrical Li-Ion Batteries: Effect of Ambient Pressure. J. Energy Storage 2022, 55, 105709. [Google Scholar] [CrossRef]
- Wang, Z.; He, T.; Bian, H.; Jiang, F.; Yang, Y. Characteristics of and Factors Influencing Thermal Runaway Propagation in Lithium-Ion Battery Packs. J. Energy Storage 2021, 41, 102956. [Google Scholar] [CrossRef]
- Ren, D.; Hsu, H.; Li, R.; Feng, X.; Guo, D.; Han, X.; Lu, L.; He, X.; Gao, S.; Hou, J.; et al. A Comparative Investigation of Aging Effects on Thermal Runaway Behavior of Lithium-Ion Batteries. eTransportation 2019, 2, 100034. [Google Scholar] [CrossRef]
- Kong, D.; Zhao, H.; Ping, P.; Zhang, Y.; Wang, G. Effect of Low Temperature on Thermal Runaway and Fire Behaviors of 18650 Lithium-Ion Battery: A Comprehensive Experimental Study. Process Saf. Environ. Prot. 2023, 174, 448–459. [Google Scholar] [CrossRef]
- Cai, Z.; Mendoza, S.; Goodman, J.; McGann, J.; Han, B.; Sanchez, H.; Spray, R. The Influence of Cycling, Temperature, and Electrode Gapping on the Safety of Prismatic Lithium-Ion Batteries. J. Electrochem. Soc. 2020, 167, 160515. [Google Scholar] [CrossRef]
- Liu, J.; Zhou, L.; Zhang, Y.; He, T.; Wang, Z. Thermal Stability of Lithium-Ion Battery Subjected to Inhomogeneous Aging. Process Saf. Environ. Prot. 2023, 180, 992–1002. [Google Scholar] [CrossRef]
- Essl, C.; Golubkov, A.W.; Fuchs, A. Influence of Aging on the Failing Behavior of Automotive Lithium-Ion Batteries. Batteries 2021, 7, 23. [Google Scholar] [CrossRef]
- Yu, H.; Mu, X.; Zhu, Y.; Liao, C.; Han, L.; Wang, J.; Cai, W.; Kan, Y.; Song, L.; Hu, Y. Sandwich Structured Ultra-Strong-Heat-Shielding Aerogel/Copper Composite Insulation Board for Safe Lithium-Ion Batteries Modules. J. Energy Chem. 2023, 76, 438–447. [Google Scholar] [CrossRef]
- Mu, X.; Li, X.; Liao, C.; Yu, H.; Jin, Y.; Yu, B.; Han, L.; Chen, L.; Kan, Y.; Song, L.; et al. Phosphorus-Fixed Stable Interfacial Nonflammable Gel Polymer Electrolyte for Safe Flexible Lithium-Ion Batteries. Adv. Funct. Mater. 2022, 32, 2203006. [Google Scholar] [CrossRef]
- Mu, X.; Zhou, X.; Wang, W.; Xiao, Y.; Liao, C.; Longfei, H.; Kan, Y.; Song, L. Design of Compressible Flame Retardant Grafted Porous Organic Polymer Based Separator with High Fire Safety and Good Electrochemical Properties. Chem. Eng. J. 2021, 405, 126946. [Google Scholar] [CrossRef]
- Graichen, H.-C.; Boye, G.; Sauerhering, J.; Köhler, F.; Beyrau, F. The Impact of a Combined Battery Thermal Management and Safety System Utilizing Polymer Mini-Channel Cold Plates on the Thermal Runaway and Its Propagation. Batteries 2024, 10, 1. [Google Scholar] [CrossRef]
- Li, W.; Wang, X.; Cen, P.Y.; Chen, Q.; De Cachinho Cordeiro, I.M.; Kong, L.; Lin, P.; Li, A. A Comparative Numerical Study of Lithium-Ion Batteries with Air-Cooling Systems towards Thermal Safety. Fire 2024, 7, 29. [Google Scholar] [CrossRef]
- Li, W.; Xie, Y.; Li, W.; Wang, Y.; Dan, D.; Qian, Y.; Zhang, Y. A Novel Quick Temperature Prediction Algorithm for Battery Thermal Management Systems Based on a Flat Heat Pipe. Batteries 2024, 10, 19. [Google Scholar] [CrossRef]
- Ahmadian-Elmi, M.; Zhao, P. Review of Thermal Management Strategies for Cylindrical Lithium-Ion Battery Packs. Batteries 2024, 10, 50. [Google Scholar] [CrossRef]
- Yang, S.; Zhang, C.; Jiang, J.; Zhang, W.; Zhang, L.; Wang, Y. Review on State-of-Health of Lithium-Ion Batteries: Characterizations, Estimations and Applications. J. Clean. Prod. 2021, 314, 128015. [Google Scholar] [CrossRef]
- Said, A.O.; Lee, C.; Stoliarov, S.I.; Marshall, A.W. Comprehensive Analysis of Dynamics and Hazards Associated with Cascading Failure in 18650 Lithium Ion Cell Arrays. Appl. Energy 2019, 248, 415–428. [Google Scholar] [CrossRef]
- Huang, Z.; Zhao, C.; Li, H.; Peng, W.; Zhang, Z.; Wang, Q. Experimental Study on Thermal Runaway and Its Propagation in the Large Format Lithium Ion Battery Module with Two Electrical Connection Modes. Energy 2020, 205, 117906. [Google Scholar] [CrossRef]
- Waldmann, T.; Wohlfahrt-Mehrens, M. Effects of Rest Time after Li Plating on Safety Behavior—ARC Tests with Commercial High-Energy 18650 Li-Ion Cells. Electrochim. Acta 2017, 230, 454–460. [Google Scholar] [CrossRef]
- Liu, Q.; Zhu, Q.; Zhu, W.; Yi, X. Influence of Aerogel Felt with Different Thickness on Thermal Runaway Propagation of 18650 Lithium-Ion Battery. Electrochemistry 2022, 90, 087003. [Google Scholar] [CrossRef]
- Zhou, Z.; Zhou, X.; Li, M.; Cao, B.; Liew, K.M.; Yang, L. Experimentally Exploring Prevention of Thermal Runaway Propagation of Large-Format Prismatic Lithium-Ion Battery Module. Appl. Energy 2022, 327, 120119. [Google Scholar] [CrossRef]
- Sun, J.; Li, J.; Zhou, T.; Yang, K.; Wei, S.; Tang, N.; Dang, N.; Li, H.; Qiu, X.; Chen, L. Toxicity, a Serious Concern of Thermal Runaway from Commercial Li-Ion Battery. Nano Energy 2016, 27, 313–319. [Google Scholar] [CrossRef]
- Kennedy, R.W.; Marr, K.C.; Ezekoye, O.A. Gas Release Rates and Properties from Lithium Cobalt Oxide Lithium Ion Battery Arrays. J. Power Sources 2021, 487, 229388. [Google Scholar] [CrossRef]
- Gao, T.; Bai, J.; Ouyang, D.; Wang, Z.; Bai, W.; Mao, N.; Zhu, Y. Effect of Aging Temperature on Thermal Stability of Lithium-Ion Batteries: Part A—High-Temperature Aging. Renew. Energy 2023, 203, 592–600. [Google Scholar] [CrossRef]
- Luo, M.; Song, J.; Ling, Z.; Zhang, Z.; Fang, X. Phase Change Material Coat for Battery Thermal Management with Integrated Rapid Heating and Cooling Functions from −40 °C to 50 °C. Mater. Today Energy 2021, 20, 100652. [Google Scholar] [CrossRef]
- Jiang, J.; Ruan, H.; Sun, B.; Wang, L.; Gao, W.; Zhang, W. A Low-Temperature Internal Heating Strategy without Lifetime Reduction for Large-Size Automotive Lithium-Ion Battery Pack. Appl. Energy 2018, 230, 257–266. [Google Scholar] [CrossRef]
- Huang, Z.; Li, X.; Wang, Q.; Duan, Q.; Li, Y.; Li, L.; Wang, Q. Experimental Investigation on Thermal Runaway Propagation of Large Format Lithium Ion Battery Modules with Two Cathodes. Int. J. Heat Mass Transf. 2021, 172, 121077. [Google Scholar] [CrossRef]


| Parameters | Value |
|---|---|
| Nominal capacity | 1880 mAh |
| Nominal voltage | 3.70 V |
| End voltage | 2.75 V |
| Charge voltage | 4.20 V |
| Weight | 40 g |
| Test | Temperature (°C) | State of Health (%) | State of Charge (%) |
|---|---|---|---|
| 1 | RT | 100 | 100 |
| 2 | RT | 100 | 50 |
| 3 | RT | 100 | 0 |
| 4 | RT | 90 | 100 |
| 5 | RT | 90 | 50 |
| 6 | RT | 90 | 0 |
| 7 | −10 | 90 | 100 |
| 8 | −10 | 90 | 50 |
| 9 | −10 | 90 | 0 |
| Test | Bat1 | Bat2 | Bat3 | Bat4 |
|---|---|---|---|---|
| 100% SOH,100% SOC | 126.8 °C/s | 92.95 °C/s | 104.05 °C/s | 114.85 °C/s |
| 90% SOH,100% SOC | 116.5 °C/s | 55.8 °C/s | 69.35 °C/s | 61.8 °C/s |
| 100% SOH,50% SOC | 40.65 °C/s | 29.2 °C/s | 41.35 °C/s | 45 °C/s |
| 90% SOH,50% SOC | 32.75 °C/s | 49.4 °C/s | 53.75 °C/s | 68.05 °C/s |
| 100% SOH,0% SOC | 1.8 °C/s | - | - | - |
| 90% SOH,0% SOC | 4.3 °C/s | - | - | - |
| Test | Bat1 | Bat2 | Bat3 | Bat4 |
|---|---|---|---|---|
| RT, 100% SOC | 116.5 °C/s | 55.8 °C/s | 69.35 °C/s | 61.8 °C/s |
| −10 °C,100% SOC | 164.3 °C/s | 51.6 °C/s | 83.9 °C/s | 103.15 °C/s |
| RT, 50% SOC | 32.75 °C/s | 49.4 °C/s | 53.75 °C/s | 68.05 °C/s |
| −10 °C,50% SOC | 39.55 °C/s | 25.9 °C/s | 28.95 °C/s | 27.1 °C/s |
| RT, 0% SOC | 4.3 °C/s | - | - | - |
| −10 °C,0% SOC | 1.9 °C/s | - | - | - |
| Battery Type | |
|---|---|
| 100% SOH,100% SOC | 11828 |
| 100% SOH,50% SOC | 15916 |
| RT,90% SOH, 100% SOC | 13934 |
| RT,90% SOH, 50% SOC | 17187 |
| −10 °C, 90% SOH, 100% SOC | 15159 |
| −10 °C, 90% SOH, 50% SOC | 15471 |
Disclaimer/Publisher’s Note: The statements, opinions and data contained in all publications are solely those of the individual author(s) and contributor(s) and not of MDPI and/or the editor(s). MDPI and/or the editor(s) disclaim responsibility for any injury to people or property resulting from any ideas, methods, instructions or products referred to in the content. |
© 2024 by the authors. Licensee MDPI, Basel, Switzerland. This article is an open access article distributed under the terms and conditions of the Creative Commons Attribution (CC BY) license (https://creativecommons.org/licenses/by/4.0/).
Share and Cite
Han, Z.; Zhao, L.; Zhao, J.; Xu, G.; Liu, H.; Chen, M. An Experimental Study on the Thermal Runaway Propagation of Cycling Aged Lithium-Ion Battery Modules. Fire 2024, 7, 119. https://doi.org/10.3390/fire7040119
Han Z, Zhao L, Zhao J, Xu G, Liu H, Chen M. An Experimental Study on the Thermal Runaway Propagation of Cycling Aged Lithium-Ion Battery Modules. Fire. 2024; 7(4):119. https://doi.org/10.3390/fire7040119
Chicago/Turabian StyleHan, Zhuxin, Luyao Zhao, Jiajun Zhao, Guo Xu, Hong Liu, and Mingyi Chen. 2024. "An Experimental Study on the Thermal Runaway Propagation of Cycling Aged Lithium-Ion Battery Modules" Fire 7, no. 4: 119. https://doi.org/10.3390/fire7040119
APA StyleHan, Z., Zhao, L., Zhao, J., Xu, G., Liu, H., & Chen, M. (2024). An Experimental Study on the Thermal Runaway Propagation of Cycling Aged Lithium-Ion Battery Modules. Fire, 7(4), 119. https://doi.org/10.3390/fire7040119