1. Introduction
The World Meteorological Organization of the United Nations has underscored a significant surge in the incidence of disasters, reporting that “the number of disasters has increased by a factor of five over the 50-year period, driven by climate change, more extreme weather and improved reporting” [
1]. Among these disasters, wildfires have notably experienced disproportionate growth in both intensity and frequency, as highlighted by reports from organizations like the United Nations Environment Programme [
2]. This trend is starkly exemplified by the unprecedented wildfire seasons witnessed in California between 2020 and 2022. The California Department of Forestry and Fire Protection (Cal Fire) has documented 2020 as its most extensive fire season on record, featuring individually record-breaking wildfires such as the August Complex Fire, the first “gigafire” in California history, scorching over one million acres [
3].
In the United States, governmental agencies charged with disaster response, such as the Federal Emergency Management Agency (FEMA), shoulder a pivotal responsibility in conducting preliminary damage assessment (PDA). This assessment is instrumental in unlocking federal funding for disaster survivors and local government entities. However, the escalating frequency and severity of natural disasters, compounded by complicating factors like the COVID-19 pandemic between 2020 and 2022, have introduced substantial operational burdens and process intricacies into disaster response efforts.
In 2023, the author directly participated in a PDA process in Northern California alongside FEMA, Cal Fire, and other agencies, providing firsthand insight into the challenges encountered. Notably, the exhaustive nature of the task demanded an individual and physical inspection of every affected residence, even in instances where accessibility issues arose due to road and building damage. Concurrently, public health and other concerns, such as social distancing, exacerbated delays and led to additional logistical coordination. The sheer volume of homes requiring assessment could overwhelm damage assessment teams, particularly in scenarios involving multiple concurrent disasters, prolonging the duration of PDAs and potentially compromising both the well-being of assessors and the accuracy of their findings. For instance, on this particular PDA trip, constraints such as the need to vacate the area before nightfall resulted in disparities in the assessment times allocated to different properties.
Simultaneous with the uptick in natural disasters, artificial intelligence (AI) has experienced remarkable advancements in recent years, particularly in the realm of computer vision. Stanford Computer Vision Lab defines computer vision as striving “to develop intelligent algorithms that perform important visual perception tasks such as object recognition, scene categorization, integrative scene understanding, human motion recognition, material recognition, etc”. [
4]. Noteworthy breakthroughs in deep learning have empowered computer vision models like convolutional neural network (CNN)-based architectures such as ResNet50 and VGG-16 to achieve unprecedented levels of accuracy in tasks such as image recognition and classification [
5,
6]. Another model that has emerged recently is OpenAI’s one-shot Contrastive Language-image Pre-training (CLIP) model, which could take in an image and a list of categories to make a prediction without previously having trained the model [
7]. In 2021, Google Research published the Vision Transformer (ViT) model, based on an architecture different from CNN, which has outperformed CNN models by four times in efficiency and accuracy, thus making it one of the best-performing models for computer vision tasks [
8]. One advantage of these computer vision models is their capability for Transfer Learning, where models trained on one task (e.g., classification of objects) could be re-trained to perform another similar task (e.g., classification of specific variations of the same object) with training data and appropriate labels [
9,
10].
AI technology, both computer vision-based or otherwise, has been implemented in disaster response to aid both survivors and responders alike in many ways. Examples include AI chatbots that connect survivors to humanitarian organizations for assistance [
11] and an open source software platform that classifies social media content to monitor the evolution of disasters [
12]. Specific to computer vision, both the research and practitioner communities have primarily focused on utilizing aerial imagery to aid with disaster response. Academic works have focused on topics such as using aerial imagery to develop a Disaster Impact Index [
13], to detect disasters [
14], and to conduct high-level damage assessment [
15]. The International Conference on Computer Vision (ICCV) and the Conference on Neural Information Processing Systems (NeurIPS), two of the leading computer vision academic conferences, have hosted the AI for Humanitarian Assistance and Disaster Response (AI4HADR,
https://www.hadr.ai (accessed on 2 January 2024)) workshops for the past few years, where most of the accepted papers focus on aerial imagery. Similarly, online communities, such as the 2000+ member LinkedIn group called “Satellite Imagery for Deep Learning” (
https://www.linkedin.com/groups/12698393/ (accessed on 2 January 2024)), have also provided forums for discussions of disaster response-related applications.
Disaster response organizations, predominantly governmental in nature, have primarily leveraged aerial imagery as the principal application of computer vision. The Department of Defense, through its Defense Innovation Unit, has spearheaded the development of an intergovernmental platform known as xView2. This platform automates the execution of computer vision algorithms on satellite imagery to monitor disaster progression over time (
https://www.diu.mil/ai-xview-challenge (accessed on 2 January 2024)). In an interview conducted by the author with FEMA’s former Chief Geospatial Officer, Christopher Vaughan, it was revealed that FEMA has also endeavored to integrate aerial imagery into its PDA processes. However, as of the current writing, the computer vision model reliant on aerial imagery merely assists FEMA in prioritizing the deployment of in-person damage assessors, rather than executing the damage assessment itself. Despite the assistance provided by the model, the PDA process remains predominantly manual.
The utilization of aerial imagery in disaster response, particularly for damage assessment, is encumbered by several limitations. Ground structures of interest may be obstructed by clouds, smoke, or other impediments, particularly in wildfire scenarios. Furthermore, the update frequency of aerial imagery varies inconsistently, contingent upon factors such as geographical region, which introduces unpredictability and unreliability. Moreover, processing aerial imagery entails additional computational and storage overhead. Critically, aerial imagery often lacks the resolution required to discern individual structures accurately, impeding the precise quantification of disaster damages. In discussions with FEMA’s Christopher Vaughan, an expressed aspiration was noted to explore the potential of computer vision technologies beyond reliance on satellite imagery, particularly concerning damage assessment.
As such, there is an opportunity to better understand how non-satellite imagery data could be utilized in the context of disaster response, particularly for damage assessment. Recent work has explored using ground-level imagery for damage assessment. Nia and Mori demonstrate that a CNN-based model, trained on a small set of manually curated data, can yield high accuracy in classifying building damages into different categories [
16]. The model proposed by Nguyen et al. offers a multimodal approach in taking textual input, along with image data, to predict the damage level in a particular area [
17]. Various other research papers have built models to demonstrate the promise of using computer vision algorithms on ground-level imagery to classify damage severity [
18,
19]. At the time of this writing, most of the papers we have come across have built their models using CNN or other more traditional approaches to the image classification task, instead of some of the newer models such as ViT.
As reliable and properly labeled training data has been identified as a limitation by several of the aforementioned studies, different approaches were taken to ensure sufficient data are available for model training. In some cases, volunteers and paid crowdsourced workers were used to label data found on social media and search engines [
19]; researchers have also opted to label the data found on the Internet themselves [
16]. Others have used Google Street View as the image source with additional manual labeling [
18]. Furthermore, in some cases, damage classification models are built from and used for, image data from different disaster types, despite the fact that damage from one type of disaster (e.g., wildfire) may look drastically different from another (e.g., flooding) [
17]. Manual labeling may also limit the scale of the data; for example, the model in 1 paper was trained on only 200 labeled images [
16]. In addition to scale, the main challenge with this approach is the potential lack of consistency in category definitions, where crowdsourced workers may not have sufficient context in distinguishing between different types of damages, as well as the potentially disparate manifestations of damages between disaster types.
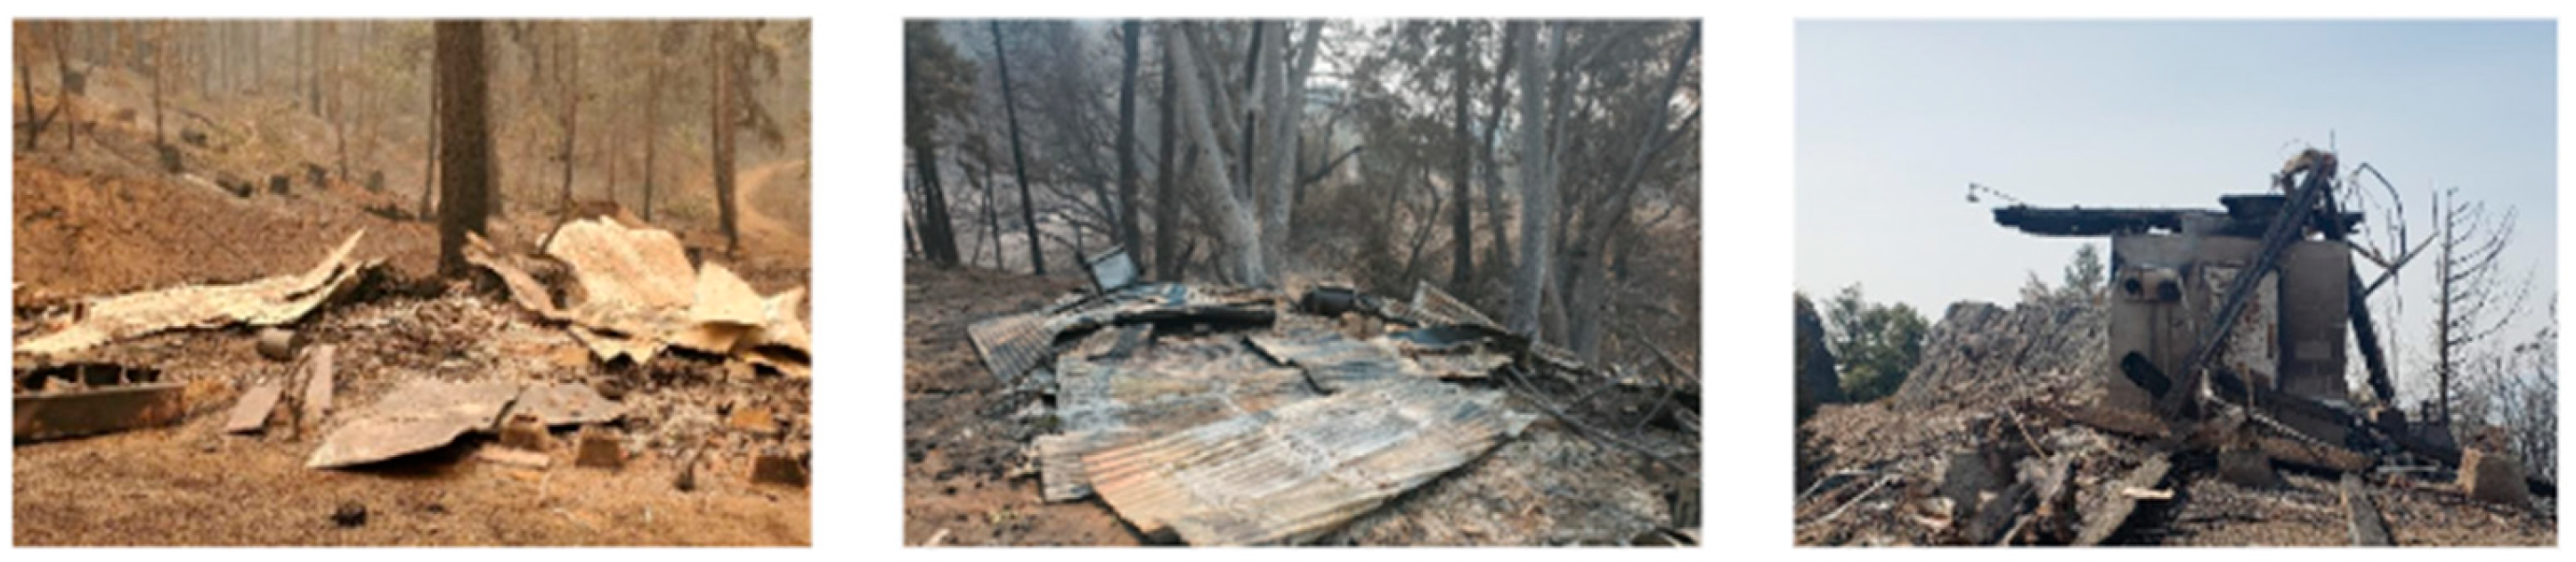
To mitigate the aforementioned constraints, we propose a damage severity classification model utilizing ground-level imagery, specifically targeting residential structures affected by wildfires. We hypothesize that employing a Vision Transformer (ViT) model would yield superior performance and operational efficiency compared to alternative approaches and manual labeling methods. Our model, trained on a dataset comprising over 18,000 professionally labeled images of homes damaged during the 2020–2022 California wildfires, has attained an accuracy score exceeding 95%. The methodology encompassed dataset curation, model training, rigorous testing, and subsequent deployment as an application tailored for utilization by on-the-ground disaster management personnel.
Our study contributes significantly to the literature on computer vision-based damage assessment in several key aspects. Firstly, our research employs a curated large-scale dataset, comprising over 18,000 images, with damage classification labeled by professional assessors from prior PDAs. Notably, our dataset exclusively focuses on wildfire-related damages, recognizing the distinctiveness of damage assessment needs across various disaster types within the PDA context. Moreover, our dataset emphasizes residential structures, which are pivotal for governmental organizations in determining emergency declarations. Secondly, our classifier is built upon the latest ViT model available at the time of this study, demonstrating superiority over traditional CNN architectures and other computer vision models, with accuracy surpassing 95%. Lastly, our affiliation with FEMA facilitated invaluable access to disaster response experts, enabling us to gather invaluable feedback and insights from the intended end users of our proposed algorithms. Thus, our research contributes to the field in three significant ways: (1) by curating and open sourcing a comprehensive dataset of fire damage classification, (2) by leveraging the latest state-of-the-art ViT model for classification tasks, and (3) by providing invaluable insights and feedback from disaster response personnel, enhancing the usability and applicability of our proposed tools.
3. Results
3.1. Classifier Performance Evaluation
Having selected ViT-B-16 as our model of choice, we commenced training using 80% of the entire dataset, comprising 15,222 images, while reserving 20% (3738 images) for evaluation purposes. The training was conducted over one epoch as well as four epochs, yielding the subsequent outcomes. The training process was completed within approximately 45 min.
Table 2 illustrates that while training over four epochs resulted in a decrease in Training Loss, it coincided with an increase in Evaluation Loss and a reduction in accuracy. This observation suggests potential overfitting due to the dataset’s size and complexity. Consequently, we opted to train the model for just one epoch, yielding the subsequent results:
Preliminary analysis of the Confusion Matrix, as shown in
Table 3, reveals a notable misclassification trend, particularly between images labeled as “Affected” and “No Damage”. This finding aligns with earlier observations regarding the relatively low Cosine Similarity Scores between these groups and the overall dataset. The overall accuracy computed stands at 95.43% (3567 out of 3738 samples). Further detailed breakdowns are presented in
Table 4 and
Table 5.
Our model demonstrates high Precision, Recall, and F1-Score values for the “Destroyed” and “No Damage” categories. However, it exhibits notably poorer performance in classifying the “Affected” group, particularly in terms of Recall and F1-Score metrics. This discrepancy may partly be attributed to the group’s lower representation in both the training and test datasets, with a support of 330 samples. Nevertheless, when considering all categories collectively, the model achieves high Precision, Recall, and F1-Score metrics.
3.2. Evaluation Loss Investigation
While the overall Precision, Recall, and accuracy metrics demonstrate commendable performance, a detailed examination of per-category misclassifications in the test set reveals areas for further investigation. Among the 171 misclassified instances, the distribution is as follows:
“Affected” misclassified as “Destroyed” (11 cases, 6.43% of all misclassifications);
“Affected” misclassified as “No Damage” (126 cases, 73.68% of all misclassifications);
“Destroyed” misclassified as “Affected” (7 cases, 4.09% of all misclassifications);
“Destroyed” misclassified as “No Damage” (10 cases, 5.85% of all misclassifications);
“No Damage” misclassified as “Affected” (14 cases, 8.18% of all misclassifications);
“No Damage” misclassified as “Destroyed” (3 cases, 1.75% of all misclassifications).
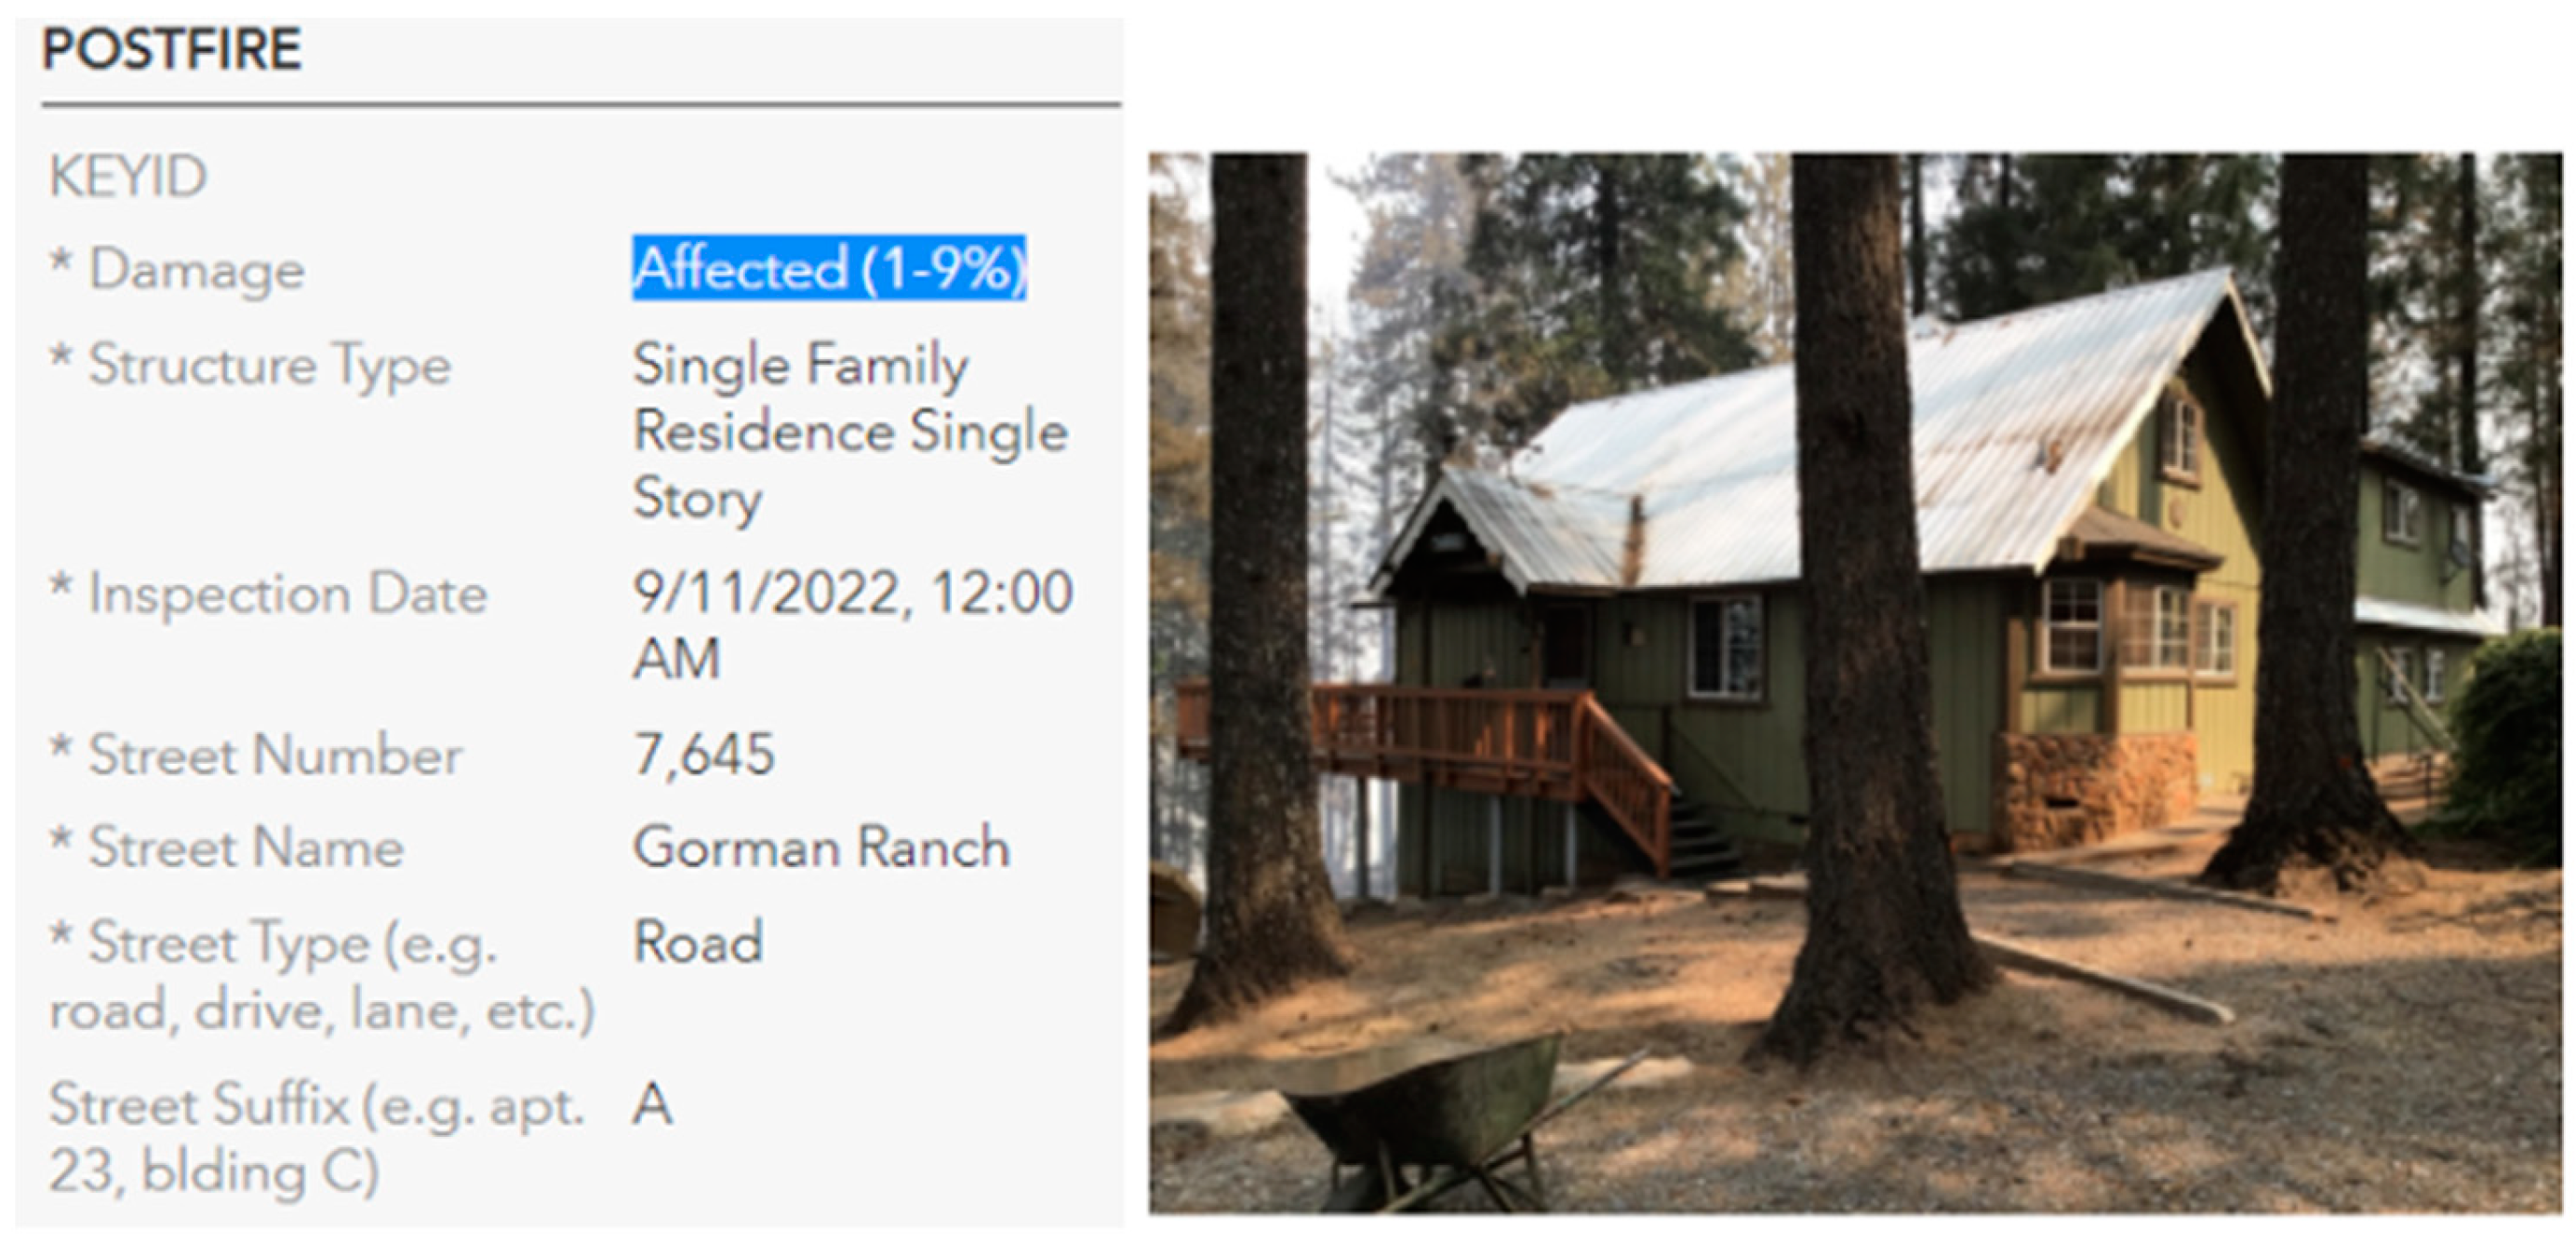
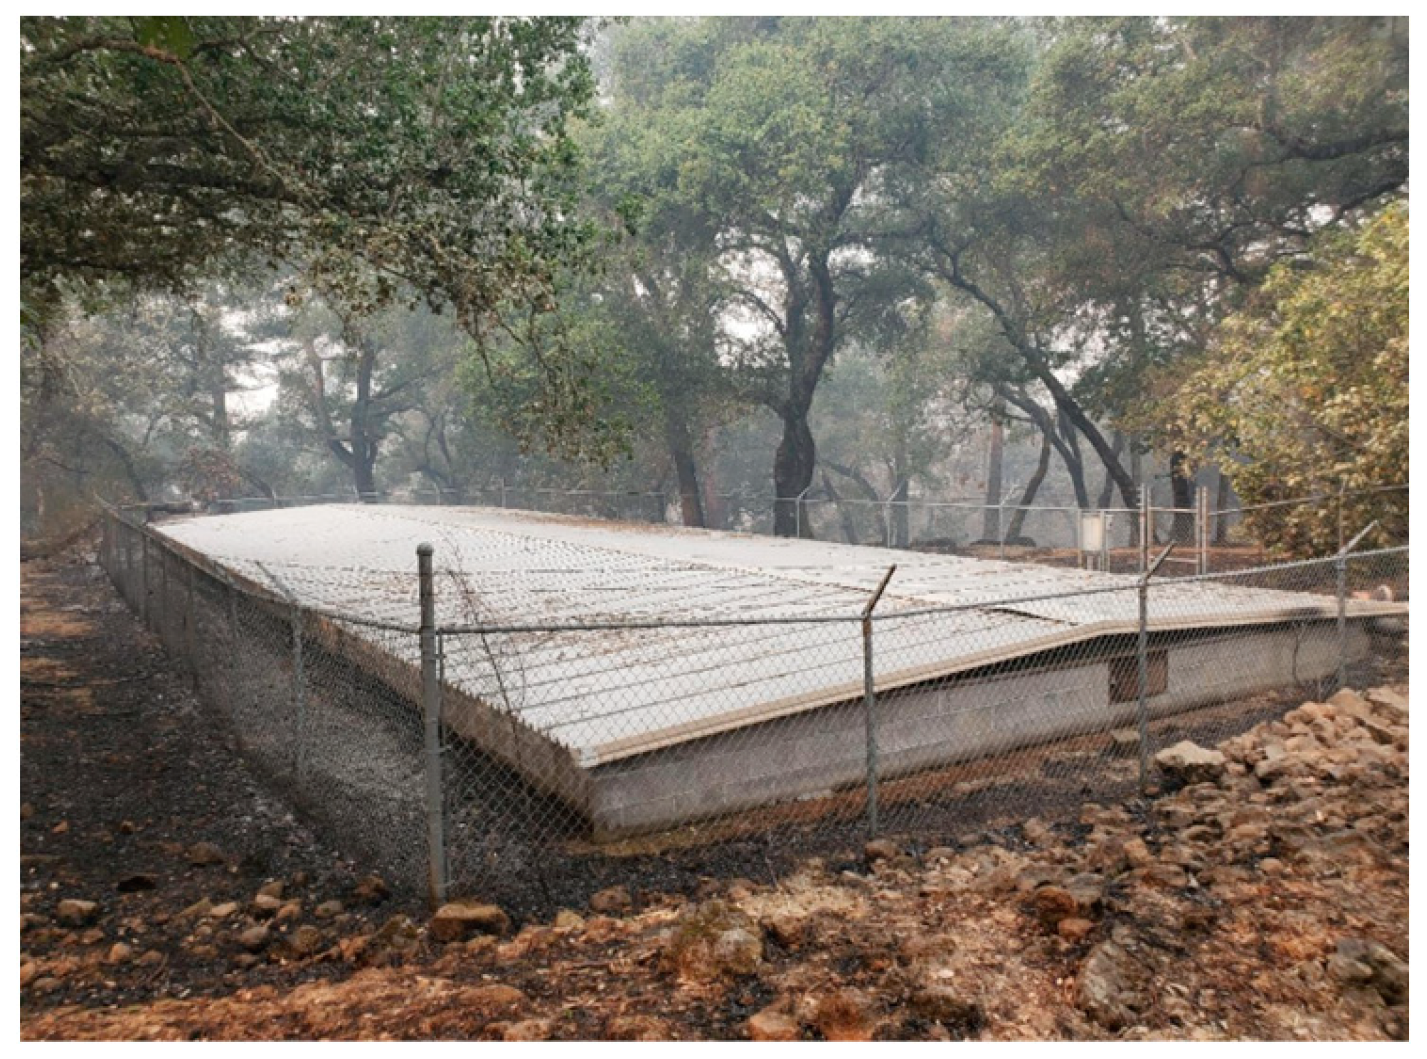
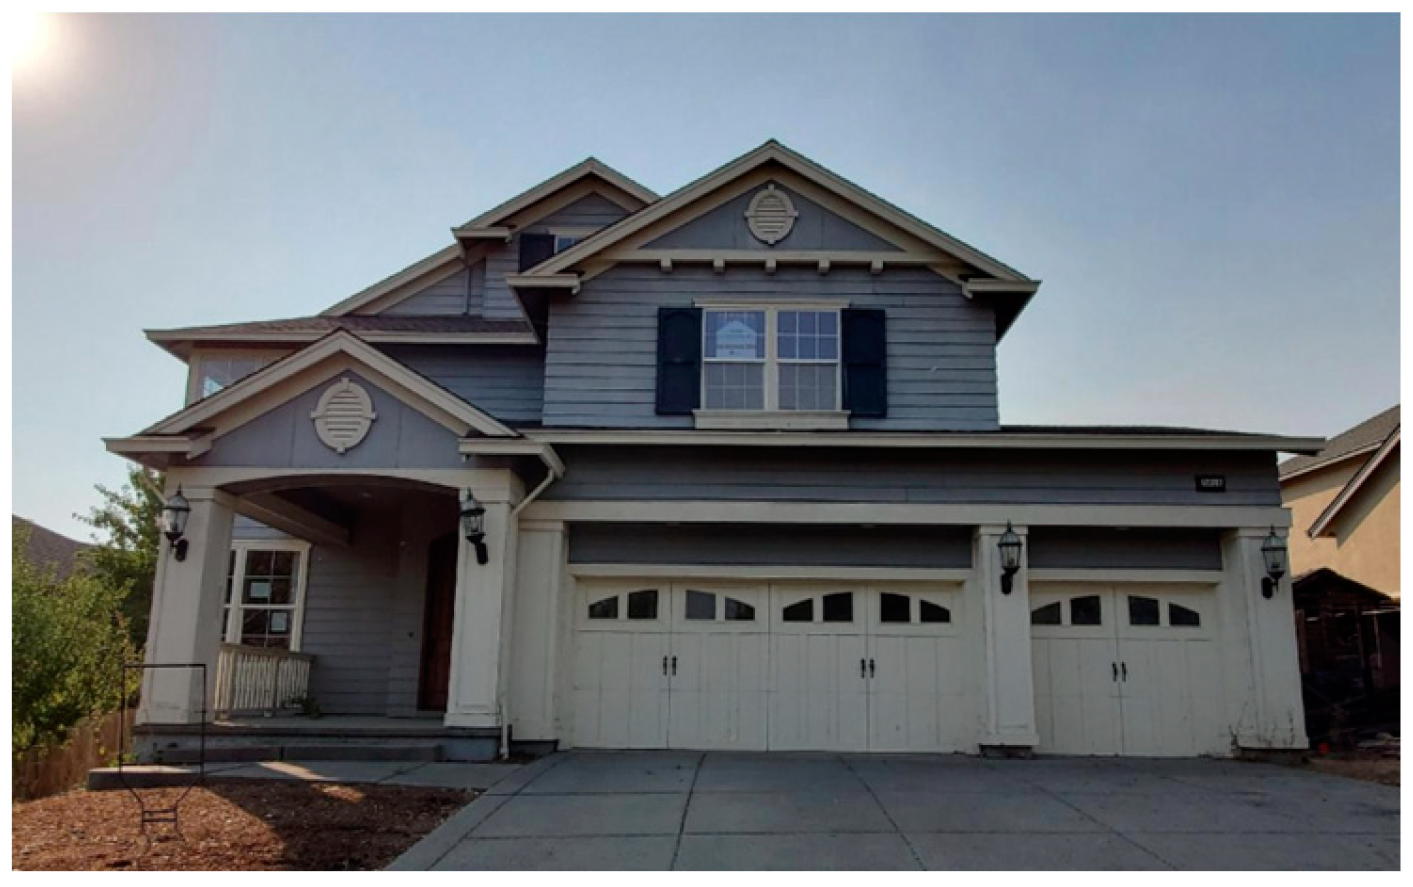
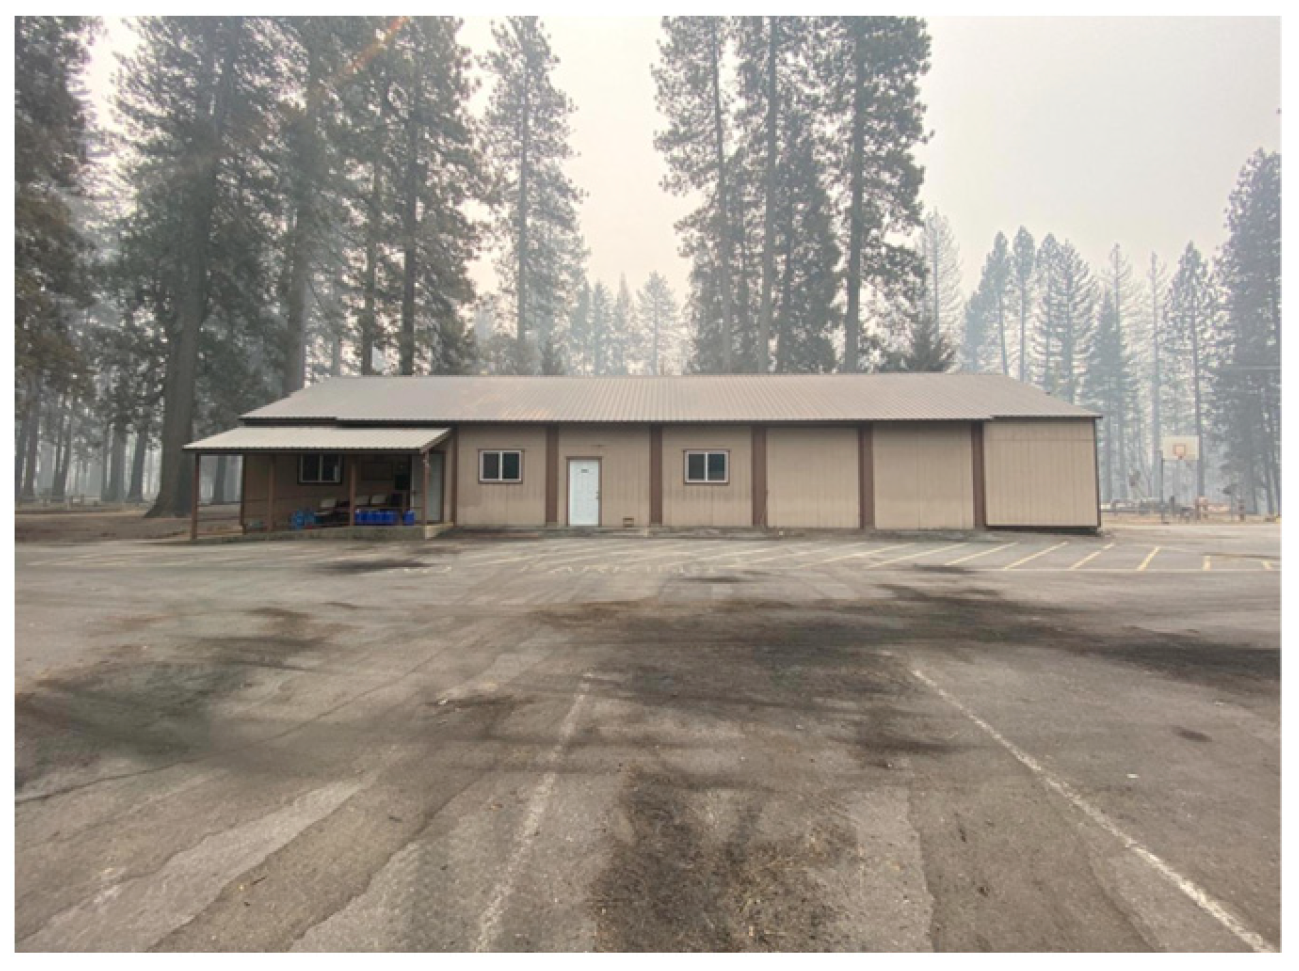
Upon reviewing all 171 misclassification cases, it became evident that the majority of misclassifications underscore issues (“Unusable” images) within the dataset rather than inherent algorithmic limitations. Several misclassified images exhibited fundamental issues warranting exclusion from evaluation, such as images depicting non-residential structures (e.g.,
Figure 12, classified as “No Damage” despite being labeled “Affected”) and images where damages were not discernible upon inspection (e.g.,
Figure 13, classified as “No Damage” despite being labeled “Affected”).
Consequently, the images with underlying issues have been excluded, prompting a recalculation of the metrics:
“Affected” misclassified as “Destroyed”: 4 (decreased by 7 from the initial count of 11);
“Affected” misclassified as “No Damage”: 85 (decreased by 41 from the initial count of 126);
“Destroyed” misclassified as “Affected”: 3 (decreased by 4 from the initial count of 7);
“Destroyed” misclassified as “No Damage”: 6 (decreased by 4 from the initial count of 10);
“No Damage” misclassified as “Affected”: 8 (decreased by 6 from the initial count of 14);
“No Damage” misclassified as “Destroyed”: 1 (decreased by 2 from the initial count of 3).
Table 6 shows the breakdown of the Precision and Recall rate by Severity Category. The overall accuracy has improved to 97.09%, marking an increase of 1.66% from the previous value of 95.43%. The “Affected” category improved the most as the result of this change.
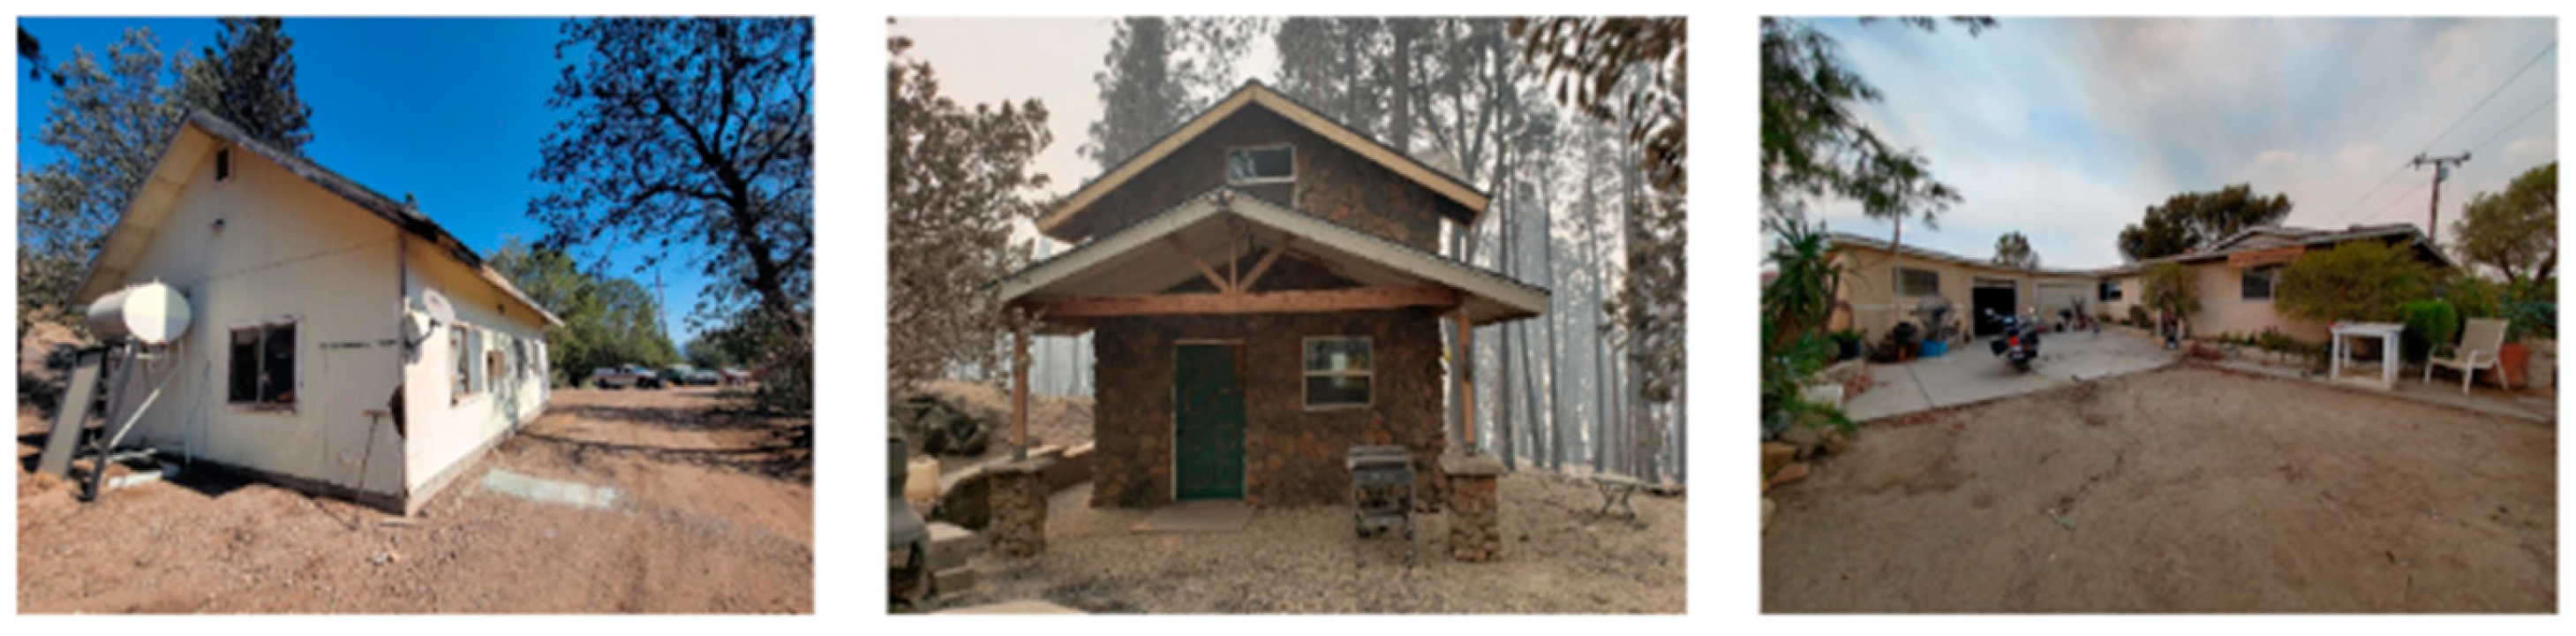
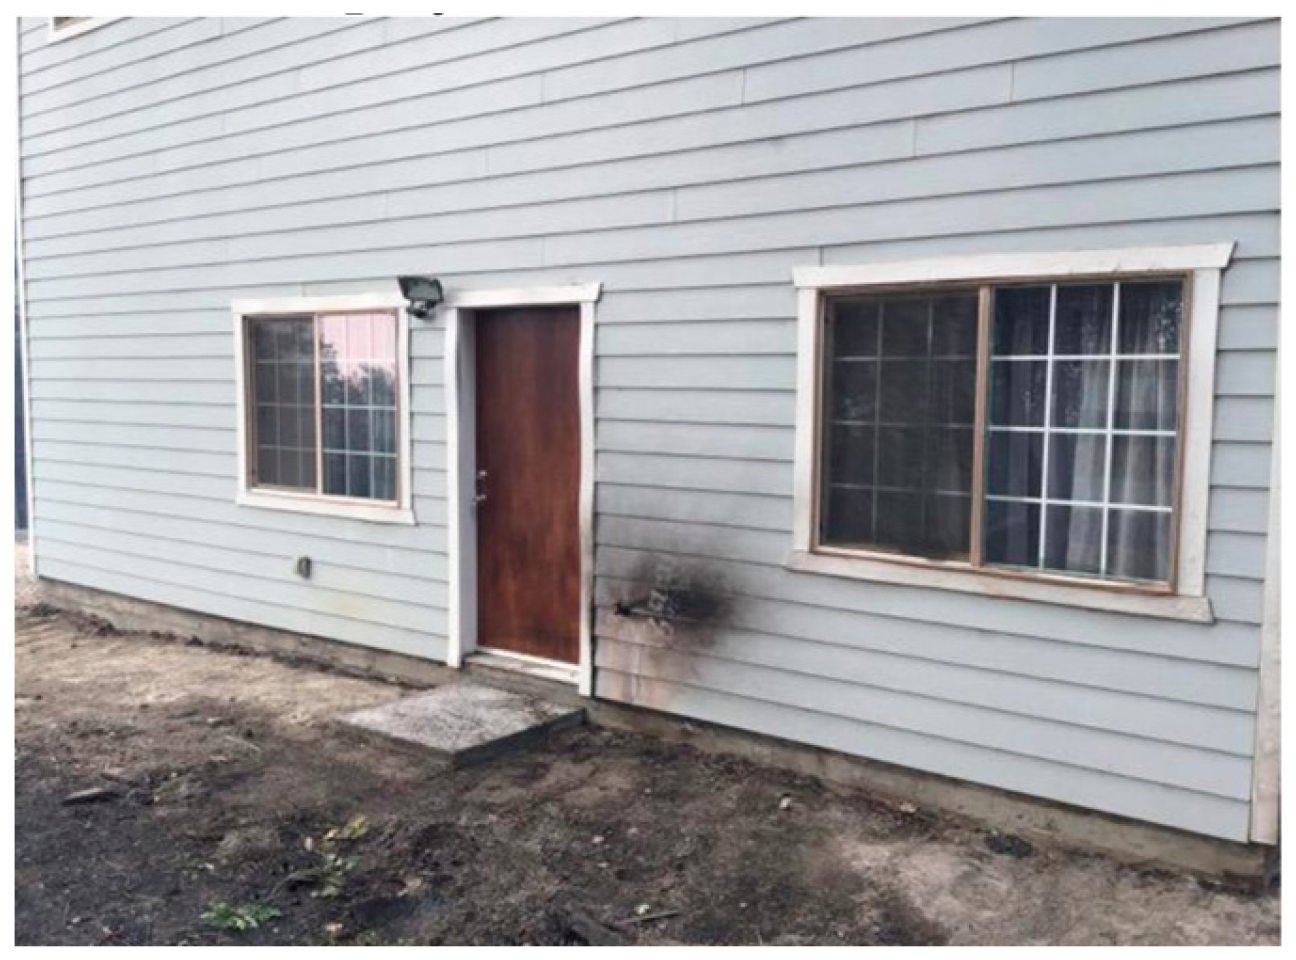
Additional images with ambiguous classification merit consideration for exclusion, as exemplified by
Figure 14 and
Figure 15, both labeled as “No Damage”, where discerning the origin of the damage, whether attributable to the wildfire event or not, poses challenges. Their potential removal would likely lead to notable enhancements in metrics such as overall accuracy rate and by-category recall rates.
3.3. Accuracy Degree and Comparison with Other Models
The accuracy of our current image classification model is notable, achieving a commendable rate of 95%. This metric serves as a critical benchmark for assessing the model’s proficiency in accurately categorizing images. To provide a comprehensive evaluation of its efficacy, we conducted a comparative analysis with other commonly employed models. Specifically, we trained a convolutional neural network (CNN)-based model and applied the one-shot Contrastive Language-image Pre-training (CLIP) model to the same dataset.
3.3.1. Comparison against CNN-Based Model
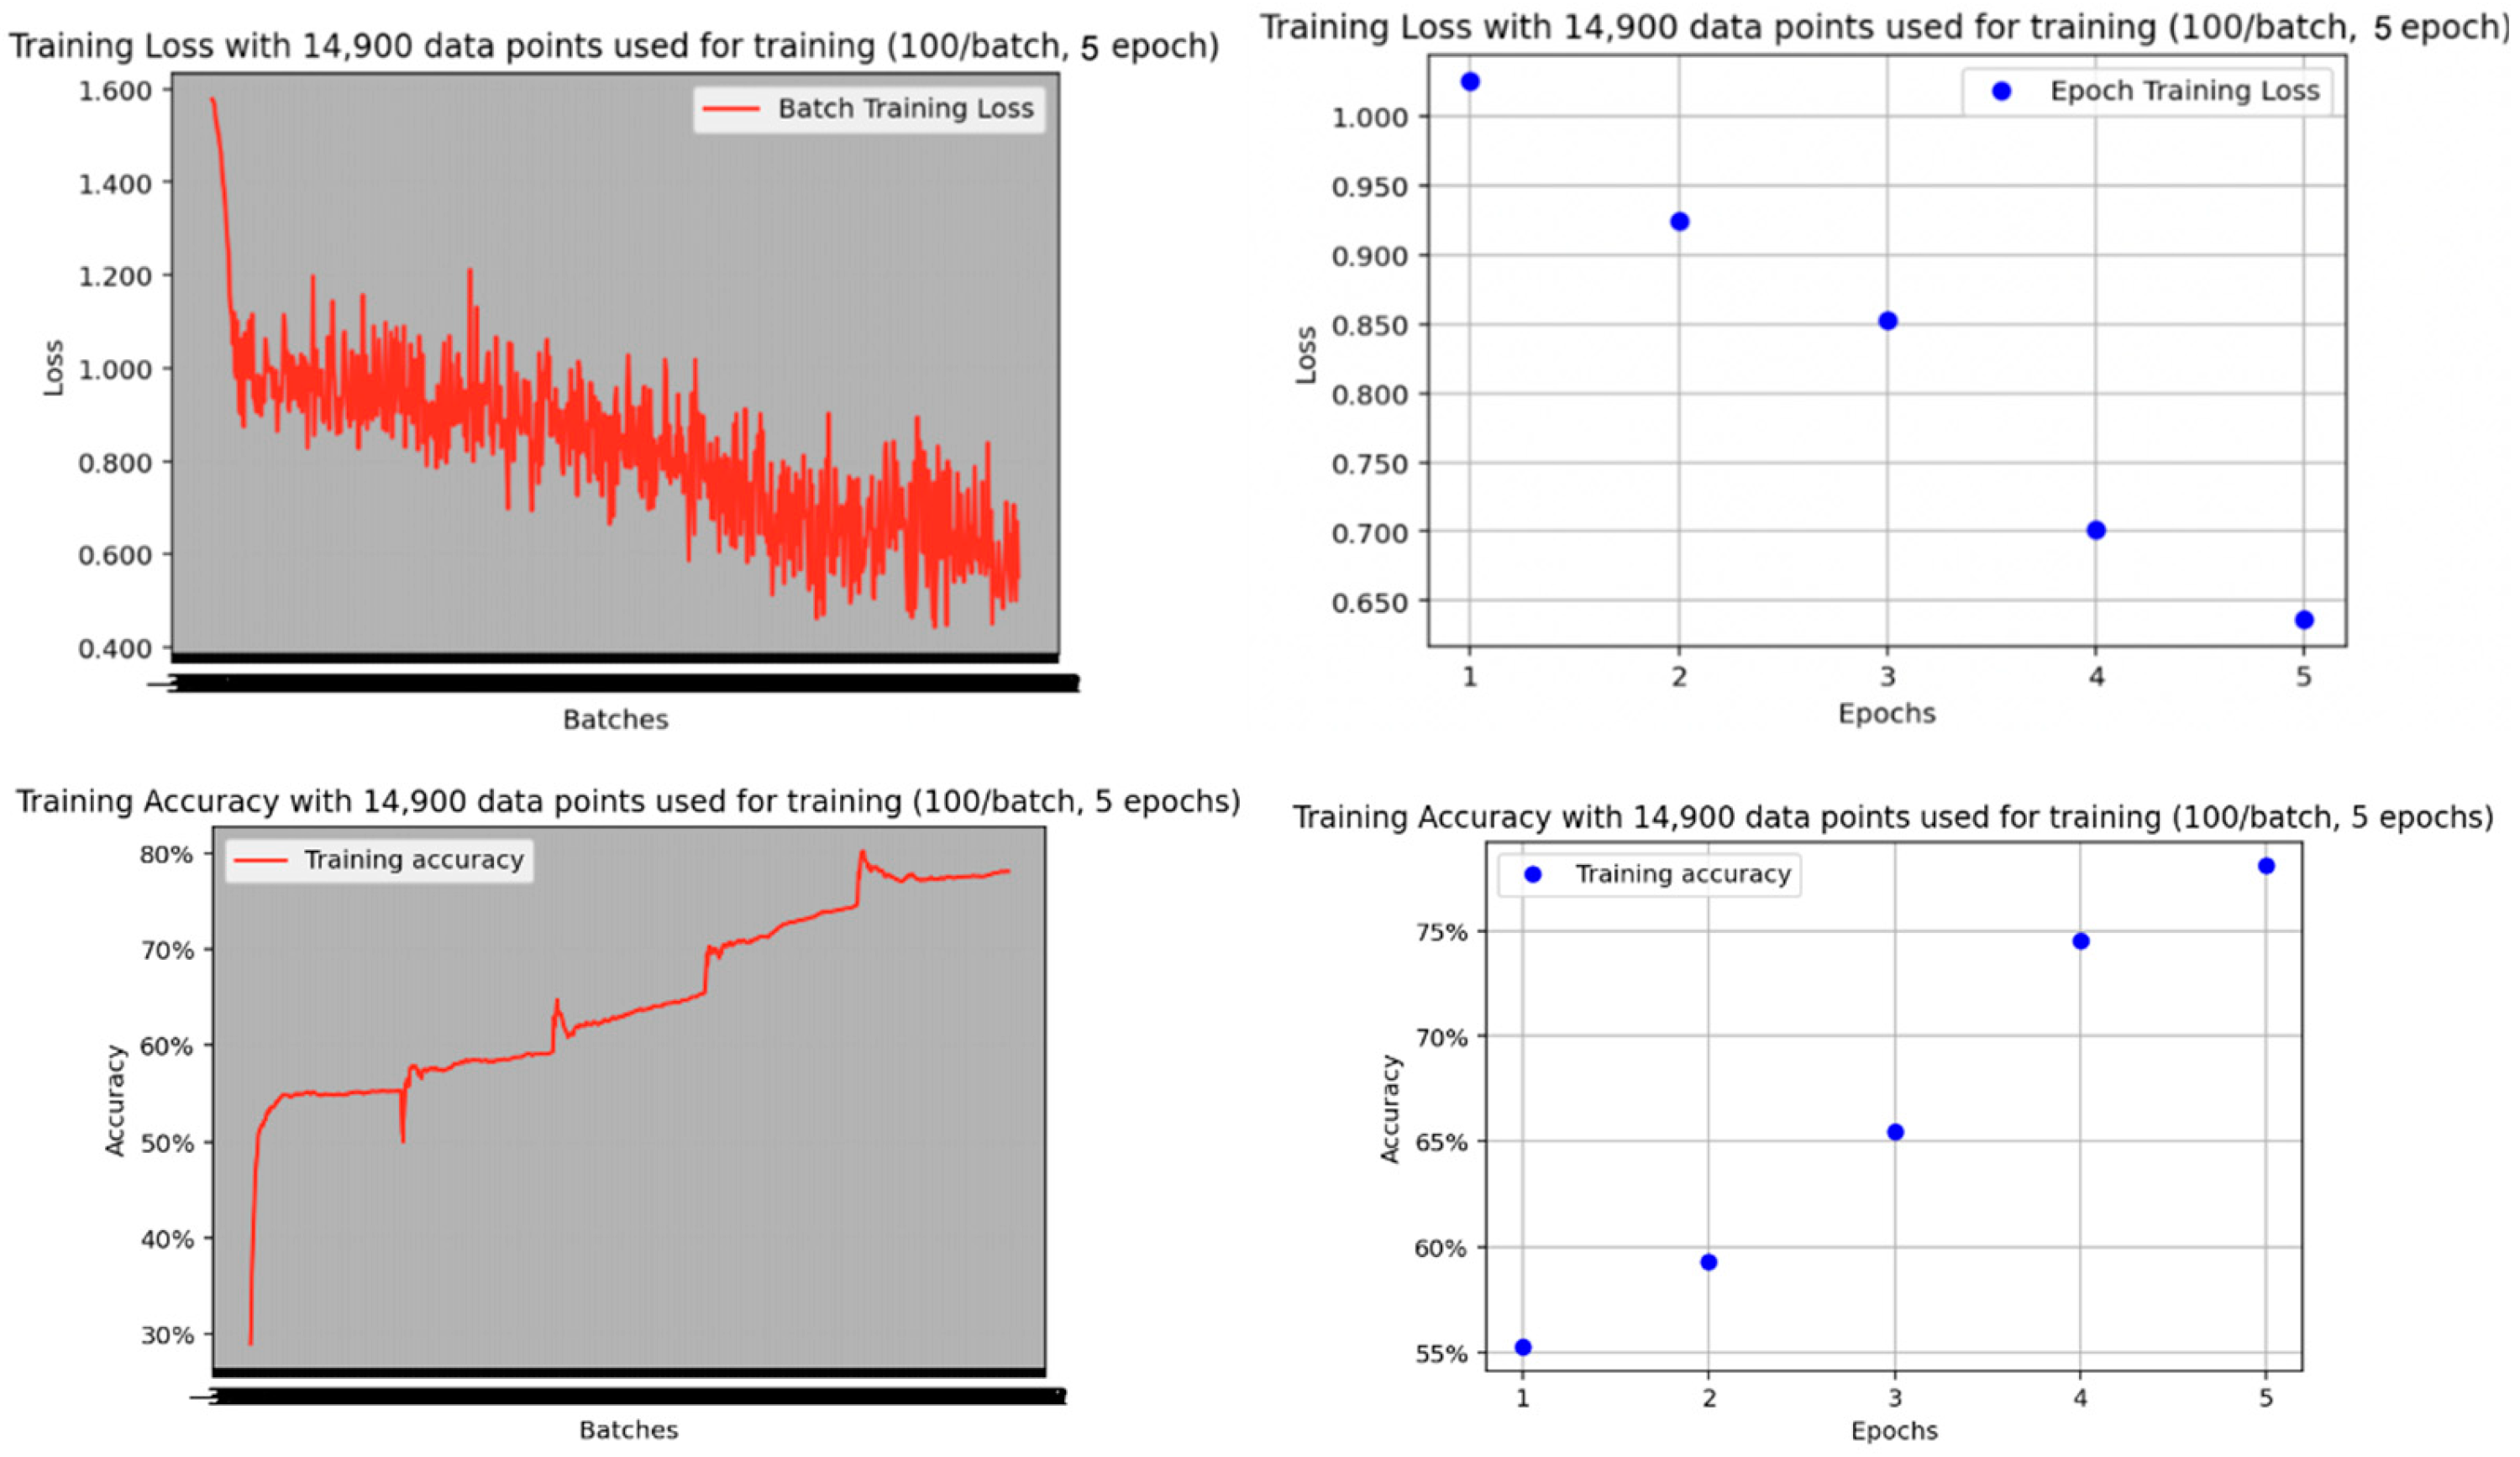
For the CNN-based model, we initialized a basic CNN architecture and conducted training over five epochs on the training data subset. Subsequently, we evaluated its performance against the test dataset, resulting in the following outcomes, as seen in
Figure 16:
The CNN model’s overall accuracy of 0.78 (which is −0.17 against 0.95 of the ViT model) in this classification task could stem from various factors. Firstly, CNN architecture may struggle to capture the intricate features and subtle patterns present in the dataset, particularly since the images exhibit complex visual characteristics such as varying lighting conditions, perspectives, or occlusions. This limitation of CNNs to effectively model long-range dependencies and capture global context might lead to inaccuracies in classification, resulting in lower accuracy.
Table 7 provides a more detailed breakdown by Severity Category.
On the other hand, the ViT model in this case worked better perhaps due to its ability to efficiently capture global relationships between image patches using self-attention mechanisms. Unlike CNNs, which rely on convolutional layers to extract hierarchical features from local image regions, ViTs treat images as sequences of patches and model interactions between them, thereby facilitating the learning of long-range dependencies and context-aware representations. This capability of ViTs to effectively capture global context may enable more accurate classification, especially in scenarios where images contain diverse visual characteristics or intricate patterns that CNNs may struggle to discern, such as with our fire damage dataset. Consequently, the inherent architecture of ViT models, optimized for learning from image sequences, might offer superior performance compared to CNNs in image classification tasks characterized by complex and diverse datasets, potentially leading to higher accuracy rates.
3.3.2. Comparison against CLIP Model
In comparison with the CLIP model, we conducted an evaluation of the test set images using three classification options: “a photo of a damaged home”, “a photo of a destroyed home”, and “a photo of a home with no damage”. The model yielded the following results, shown in
Table 8:
As seen in
Table 9, the CLIP model produced an overall accuracy of 0.76, indicating a −0.19 deviation from the accuracy attained by our ViT model (0.95). While exhibiting inferior performance compared to ViT overall, the CLIP model demonstrated particularly poor performance in the “Affected” category. This discrepancy may partly stem from the potentially ambiguous phrasing of the classification options, notably “a photo of a damaged home”. Nonetheless, the CLIP model exhibited notably high precision and recall rates for the “Destroyed” and “No Damage” categories, despite being devoid of prior training data.
The low overall accuracy of 0.76 attained by the CLIP model in our damage classification task can be attributed to various factors. Primarily, CLIP’s design as a generalized model tailored to comprehend image context across a wide linguistic spectrum contrasts with our task’s requirement for precise image categorization based on predefined labels of damage categories. This mismatch between the model’s broader capabilities and the task’s specific demands likely contributed to its suboptimal performance.
Furthermore, CLIP’s reliance on one-shot contrastive learning may have hindered its effectiveness compared to the specialized architecture of ViT models for image classification tasks such as damage severity assessments. ViT models, explicitly engineered for image analysis, harness self-attention mechanisms to capture intricate visual patterns and dependencies within images, potentially resulting in more accurate classifications compared to CLIP. Additionally, the CLIP model’s performance may have been affected by inadequate representation of the diverse range of images encountered during inference, whereas ViT models have demonstrated proficiency across various image datasets owing to their capability to learn hierarchical representations of visual features. As such, ViT has been shown to perform better than CLIP for our specific application.
3.3.3. Comparison against Manual Process
Utilizing a ViT-based image classification model for tasks such as determining damage severity offers several advantages over manual assessment. Firstly, ViT models possess the ability to analyze large volumes of image data rapidly and consistently, thereby significantly reducing the time and effort required for manual inspection. This expedited process enables timely decision making and intervention in disaster response scenarios, ultimately facilitating more efficient resource allocation and mitigation efforts. The images themselves could be obtained by untrained staff, drones, or other means to alleviate the assessors of the operational burden.
Moreover, ViT models can operate autonomously, eliminating the inherent subjectivity and potential biases associated with manual assessment. By relying on predefined classification criteria and learned patterns from training data, ViT models offer an objective and standardized approach to damage severity determination, ensuring greater accuracy and reliability in the assessment process. Additionally, ViT models can handle large-scale datasets with varying degrees of complexity, allowing for comprehensive analysis of damage across diverse geographical regions and disaster scenarios.
Furthermore, employing ViT-based models enables the integration of advanced computer vision techniques, such as image augmentation and feature extraction, to enhance the model’s predictive capabilities and adaptability to different environmental conditions. This flexibility and scalability make ViT models well suited for dynamic and evolving disaster response scenarios, where rapid and accurate assessment of damage severity is paramount for effective decision making and resource allocation. Overall, the adoption of ViT-based image classification models offers a compelling alternative to manual assessment, providing greater efficiency, objectivity, and scalability in determining damage severity in disaster response efforts.
3.4. Interpretability
Despite leading to more accurate and reliable results, ViT models do lack interpretability and this poses a significant challenge, as stakeholders, such as the disaster response personnel, may require insights into the model’s decision-making process to trust and effectively utilize its outputs. To address the problem of interpretability associated with ViT models, several approaches can be employed. One strategy involves leveraging post hoc interpretation techniques to gain insights into the model’s internal workings. Techniques such as saliency mapping, which highlights the most influential regions of an image on the model’s predictions, can provide valuable information about the features driving the classification decisions. Similarly, gradient-based methods can reveal how changes in input pixels affect the model’s output probabilities, offering insights into the decision boundaries learned by the model.
Furthermore, model-agnostic interpretation methods can be utilized to enhance the interpretability of ViT models. Techniques like LIME (local interpretable model-agnostic explanations) and SHAP (Shapley Additive Explanations) approximate the behavior of the black-box model using interpretable surrogate models, enabling stakeholders to understand the factors contributing to individual predictions. Additionally, incorporating domain knowledge and expert insights into the model training process can improve interpretability by aligning the model’s outputs with established principles and guidelines in the field.
By integrating these interpretability-enhancing techniques into the development and deployment of ViT-based image classification models, stakeholders can gain actionable insights into the model’s decision-making process, fostering trust and facilitating informed decision making in critical applications such as disaster response and damage severity assessment.
3.5. Application Demonstration and Feedback
In response to feedback from disaster response professionals, several enhancements are currently in progress for our ViT-based application for post-disaster damage severity classification. These enhancements aim to improve user experience and utility based on the insights gathered from stakeholders:
One significant enhancement entails enabling users to submit multiple images for a single structure, allowing for a more comprehensive assessment of damage severity by aggregating classification results across multiple submissions and weighting them accordingly.
Additionally, efforts are underway to enhance the application’s functionality by enabling users to submit images for multiple structures simultaneously, streamlining the process and facilitating bulk analysis of damage severity.
Another important feature in development is the capability to export classification results as a CSV file, facilitating further analysis and integration with external systems or tools for comprehensive post-disaster assessment.
Furthermore, plans include incorporating Geographic Information System (GIS) functionality into the application, enabling users to export classification results as a GIS layer for seamless integration with GIS mapping platforms. This integration will enhance spatial analysis capabilities and facilitate visualization of damage severity data in a geographic context.
Moreover, the application will be designed to interface with another application dedicated to human reviewers, allowing for Quality Assurance checks on the model’s classifications and enabling iterative model improvement based on human feedback.
To ensure the application meets the evolving needs of disaster management professionals, additional focus groups with end users in the field of disaster management will be scheduled. These focus groups will provide valuable insights and guidance for further refinement and updates to the application, ensuring its effectiveness and relevance in real-world disaster response scenarios. Updates and iterations based on user feedback will be provided to continuously enhance the application’s functionality and usability.
4. Discussion
4.1. Dataset Improvement
There are many ways to enhance the open source dataset we have provided for the research community. Primarily, significant improvements can be achieved through additional data cleaning procedures aimed at eliminating mislabeled or irrelevant images from the dataset, such as those noted above. For instance, a thorough review could identify and remove images featuring close-up views of machinery, which offer limited relevance to the structural damage classification tasks. Similarly, the dataset may contain aerial images that were erroneously included, which should be promptly identified and excluded to bolster the overall quality and relevance of the dataset.
This study could also offer insights to guide future data collection efforts aimed at continually enhancing the dataset. Collaboration with agencies such as Cal Fire presents an opportunity to implement standardized guidelines for image capture during PDAs. Such guidelines would not only optimize the efficacy of models trained on the dataset but also streamline operational workflows within government agencies. Recommendations may include capturing comprehensive images of entire structures alongside close-up shots focusing on specific areas critical for damage classification determination.
Numerous additional data points could significantly enhance the dataset’s richness and analytical potential. Leveraging our affiliation with FEMA, we have access to valuable financial data detailing the compensation awarded to property owners for home damage. Integrating this financial information, along with property value data, holds promise for fostering a more holistic comprehension of damage within the disaster context. Furthermore, ongoing projects in the field continually generate and evaluate satellite imagery of disaster-affected structures, presenting a compelling opportunity to explore potential linkages or synergies between our dataset and existing repositories with similar aerial perspectives.
Our dataset presents a valuable resource that could be seamlessly integrated into ongoing initiatives focused on consolidating and expanding disaster image datasets. For instance, the Incident1M Dataset, curated by the Qatar Computing Research Institute (QCRI) and MIT researchers, comprises nearly one million disaster images alongside additional contextual information [
23]. By incorporating our dataset into such projects, researchers can benefit from a more comprehensive and diverse pool of data, thereby enriching their analyses and advancing the field’s understanding of disaster response and mitigation strategies.
4.2. Model and Application Improvement
There are many potential avenues for improving the performance of the model for the task of classifying damage severity. Firstly, refining the model architecture through techniques such as adjusting the depth and width of the transformer layers or exploring alternative attention mechanisms could potentially improve its ability to capture intricate visual patterns and dependencies within images. Additionally, optimizing hyperparameters such as learning rate, batch size, and regularization techniques could lead to better convergence and performance of the model.
Additionally, employing advanced techniques for data preprocessing, such as image normalization, augmentation, and denoising, could help mitigate noise and variability in the dataset, thereby improving the robustness of the classifier. Moreover, exploring ensemble methods that combine multiple ViT models or integrate predictions from other modalities, such as textual or geographical data, may further enhance classification performance and reliability.
Despite the large dataset we used to train the model, there remains ample room for enhancing the dataset to introduce further intricacy and nuance into the model. For example, augmenting the training dataset with additional diverse and representative samples, particularly from different regions that are prone to wildfires, could enhance the model’s ability to generalize across various scenarios.
Even in the absence of the data refinements proposed in preceding sections, additional metadata fields hold promise for augmenting the existing model architecture. These may include pertinent details such as the geographical addresses of the structures under assessment, the materials utilized in different structural components, and supplementary fields for free-text inspection notes. Given the recent strides in large language models, exploring avenues to integrate textual inputs into the model framework represents a compelling opportunity for enhancing performance and enriching the analytical capabilities of the classifier.
Even in the absence of additional input sources, the classifier presents avenues for refinement and enhancement. For instance, the development of distinct penalty schemes for misclassifications could mitigate operational challenges, particularly in scenarios where misidentifying a “Destroyed” home as “No Damage” holds greater significance than the reverse. Additionally, establishing an acceptability threshold could automate workflow processes, redirecting structures to human reviewers only when the model lacks a predetermined confidence level in its damage classification. This strategic allocation of resources could optimize staffing within disaster management organizations. Furthermore, there exists potential to explore optimal data storage practices to ensure the effective organization and accessibility of all pertinent data points.
An additional avenue for investigation involves the sequential integration of diverse computer vision algorithms to streamline workflow processes. For instance, an initial model could discern whether an image meets specified criteria, such as identifying residential structures, before a subsequent classifier model determines the severity of damage inflicted upon the structure. Existing research has already embraced an integrated approach, incorporating both ground-level and satellite imagery data for enhanced analysis [
24]. Furthermore, exploring methodologies to isolate home structures prior to damage severity classification warrants consideration, potentially optimizing the efficiency and accuracy of the classification process.
Given the dynamic nature of artificial intelligence and computer vision, numerous novel models and variants are continually emerging, presenting diverse avenues for exploration in image classification tasks beyond the ViT model. An extensive survey assessing the performance of various image classification datasets on our dataset could offer invaluable insights, leveraging the evolving landscape of AI and computer vision to enhance classification accuracy and efficiency. This opportunity underscores the importance of continuously evaluating and integrating cutting-edge methodologies to advance the capabilities and applicability of image classification techniques.
As the research project advances, we envision the full deployment and utilization of the application by disaster response personnel, including those within agencies such as FEMA, as well as direct engagement with disaster survivors. The implementation of such a tool holds the potential to significantly streamline the process of conducting PDAs, thereby expediting assistance to survivors. Furthermore, this initiative aligns with existing research proposals advocating for the enhanced integration of citizens into disaster response workflows, underscoring the potential for technological innovations to foster greater community participation and resilience [
25].
Lastly, continuous evaluation and validation of the model’s performance in real-time disasters, coupled with more feedback from domain experts and end users in the disaster management field, are essential for iterative refinement and improvement of the classifier. This iterative approach allows for the identification of model weaknesses and biases, leading to targeted interventions and enhancements to ensure the classifier’s efficacy in real-world applications.


