Article

The House Is Burning: Assessment of Habitat Loss Due to Wildfires in Central Mexico

by
Carlos Alberto Mastachi-Loza
1,*,
Jorge Paredes-Tavares
2,
Rocio Becerril-Piña
3,
María de Lourdes Ruiz-Gómez
4,
Carlos Alejandro Rangel Patiño
5 and
Carlos Diaz-Delgado
1,*
1
Instituto Interamericano de Tecnología y Ciencias del Agua, Universidad Autónoma del Estado de México, Carretera Toluca—Atlacomulco km 14.5, Toluca 50200, Mexico
2
IxM CONAHCYT—Centro de Investigaciones en Ciencias de Información Geoespacial, Contoy 137, Col. Lomas de Padierna, Mexico City 14240, Mexico
3
Red Lerma—Instituto Interamericano de Tecnología y Ciencias del Agua, Universidad Autónoma del Estado de México, Carretera Toluca—Atlacomulco km 14.5, Toluca 50200, Mexico
4
Laboratorio de Ecología y Comportamiento, Facultad de Ciencias, Universidad Autónoma del Estado de México, Instituto literario, Toluca 50100, Mexico
5
Tecnológico de Estudios Superiores de Huixquilucan, Paraje El Río S/N, La Magdalena Chichicaspa, Huixquilucan 52773, Mexico
*
Authors to whom correspondence should be addressed.
Fire 2024, 7(4), 134; https://doi.org/10.3390/fire7040134
Submission received: 11 March 2024 / Revised: 27 March 2024 / Accepted: 4 April 2024 / Published: 12 April 2024
(This article belongs to the Special Issue Effects of Fires on Forest Ecosystems)

Abstract

:
Fire suppression and climate change have increased the frequency and severity of wildfires, but the responses of many organisms to wildfire are still largely unknown. In this study, we assessed the risk of habitat loss for amphibians, mammals, and reptiles caused by wildfires in central Mexico. We accomplished this by: (1) determining the likelihood of wildfire occurrence over a 12-year period using historical records and the Poisson probability mass function to pinpoint the most susceptible areas to wildfire; (2) evaluating species exposure by identifying natural land use that aligns with the potential distribution areas of biodiversity; (3) assessing species vulnerability based on the classifications established by the IUCN and CONABIO. Our findings have unveiled three regions exhibiting a concentration of high-risk values. Among these, two are positioned near major urban centers, while the third lies in the southeastern sector of the Nevado de Toluca protection area. Amphibians emerged as the taxonomic group most severely impacted, with a substantial number of species falling within the Critically Endangered and Endangered categories, closely followed by mammals and reptiles. Furthermore, we have identified a correlation between the location of risk zones and agricultural areas. This study revealed hotspots that can offer valuable guidance for strategic initiatives in fire-prone regions associated to the potential distribution of amphibians, mammals, and reptiles. Moreover, future studies should contemplate integrating field data to enhance our comprehension of the actual effects of wildfires on the spatial distribution of these animal groups.

1. Introduction

Fire has historically been and continues to be a significant component of the Earth’s system, having widespread impact on climate, biogeochemical cycles and human health. Wildfires are fires that are uncontrolled and unplanned, and can be ignited by various sources such as lightning, volcanic eruptions, or humans activities (campfires, cigarettes, burning of debris, electrical shocks, equipment breakdowns, fireworks, etc.) [1,2]. Depending on its severity, the impact of wildfires can be significant for the economy, society, and environment. Globally distributed across all flammable biomes, wildfires are strongly associated with extreme weather conditions [3]. They are essential for maintaining the savanna ecosystems, and in boreal forests create a mosaic of habitats [4] in the different stages of post-fire succession [5]. In fire-prone areas, natural systems have developed adaptation mechanisms that maintain ecosystem stability [6]. However, the wildfire resilience of those systems has been diminished by human activities, originated through the fragmentation of natural covers due to changes in land use, forest exploitation, alteration, the disposal of combustible materials, an increase in the number of intentional wildfires, the introduction of new species [7] and climate change [8,9]. Extreme drought events often lead to abnormally large and high-intensity wildfires too [10,11]. This means that fire regimes in many regions have departed from those regimes under which species evolved [12], reducing the intervals and persistence thresholds of species, thereby increasing the risk of ecosystem collapse in many regions [13].
The implications of wildfires vary in socio-economic and environmental terms. The Centre for Research on the Epidemiology of Disasters (CRED) has estimated that since 2000, wildfires worldwide have led to 2052 deceased, 14,454 injured and 119,911 homeless people [14]. Additionally, so-called “extreme” or “mega” fires [15] have been documented in USA [16,17], Australia [18], Portugal [19], Chile [20], Greece [21] and Brazil [22].
From an environmental point of view, they alter soil stability, favoring runoff [23], erosion and sediment deposition [24,25]. Moreover, depending on the temperature threshold and exposure time [26], soil nutrients can be volatilized and irreversibly damaged [27]. In addition, forests, scrublands, and savannahs—the habitat of an important part of global biodiversity—are the most wildfire-affected ecosystems worldwide [28,29,30]. However, the effects of ignition patterns on biodiversity are difficult to determine. Knowledge of them is insufficient or poorly understood [27,31,32,33,34,35] because they not only depend on the size, intensity, and homogeneity of fires [2,34,36], but also on the studied species, for whom there are not enough records documenting the number of individuals affected by events of this nature [37,38]. It is evident that the richness and abundance of species inhabiting these territories are affected in different ways, which in most cases is derived from direct and indirect impacts on their habitats [39,40,41,42] either for terrestrial or aquatic systems. For instance, in California, in 2020–2021, more than 19,000 km2 of forest vegetation burned, potentially affecting the habitat of 508 vertebrate species [43]. In Australia in 2019–2020, wildfires impacted over 30% of the available habitat of fauna, where more than 3 billion native vertebrates, 143 million mammals, 2.46 billion reptiles, 181 million birds, and 51 million frogs were burnt [2].
Wildfires primarily impact organisms that have adapted to specific habitat characteristics, especially those highly sensitive to alterations in the ecosystem’s attributes [42]. The severity of fires can create conditions to which native species are not adapted, increasing both favorable and unfavorable conditions for the establishment of native, invasive, or exotic species [44]. The vulnerability of a species to the direct and indirect effects of fires largely depends on how individuals exploit and perceive their environment, as well as the extent of habitat disturbance following a fire [45]. For mammals, the impact is variable [46]; for instance, loss of canopy cover can promote the growth of grasslands and shrubs, which benefits small mammals. Conversely, the removal of fuel biomass, a common practice for wildfire control, may even enhance mammal’s proliferation [47,48,49]. In contrast, biomass removal has adverse effects on amphibian populations because they rely on the moisture and nutrients provided by these materials. This elimination of biomass plays a crucial role for amphibian survival and their mobility by preventing the connection of different landscape strata [50,51]. The true impact of fires varies among species and ecosystems. Species inhabiting rain forests are generally less adapted to fire, compared to those inhabiting dry forests [52]. Disturbance is often associated with negative effects on amphibian conservation; however, some amphibians seem to be favored by disturbed habitats, as recent fires can provide better thermal opportunities [53]. Although fires negatively impact reptile abundance, their richness and composition remain unaffected after wildfires. This suggests that reptiles may be resilient to wildfires [54]. However, it has also been established that reptiles are affected by habitat gaps created by wildfires, because of their limited distribution and low dispersal capabilities. Nevertheless, their responsiveness largely depends on the recovery rate of the system [54]. For example, some lizards prefer specific burning regimes [55], due to changes in the vegetation structure and the formation of microhabitats after a wildfire. Knowledge of the responses of fauna to disturbances caused by wildfires has been extensively developed in fire-dependent ecosystems in North America and Australia. However, research in tropical zones and ecosystems sensitive to fire is still in its early stages, further compounded by the limited number of studies contributing to the understanding of fire history [44]. Without leaving aside the logistical difficulties and unpredictability of wildfires, many of the studies are opportunistic and take advantage of being performed in the right space at the right time [56].
Considering such context, the objective of this study was to evaluate the potential risks posed by wildfire occurrences to habitat loss for α-diversity (amphibians, mammals, and reptiles) in the State of Mexico. The selection of these taxonomic groups was based on available information within the study area, including IUCN potential distribution and CONABIO specimen records. We suggest that these criteria may act as a baseline for a comprehensive integration of the history of wildfires and the threat to species distribution, especially considering that the region consistently ranks first in the number of wildfires annually in the Mexican territory. Consequently, this study aims to inform the development of risk mitigation strategies within early warning systems for wildfires and contribute to management and conservation strategies in the State of Mexico.

2. Materials and Methods
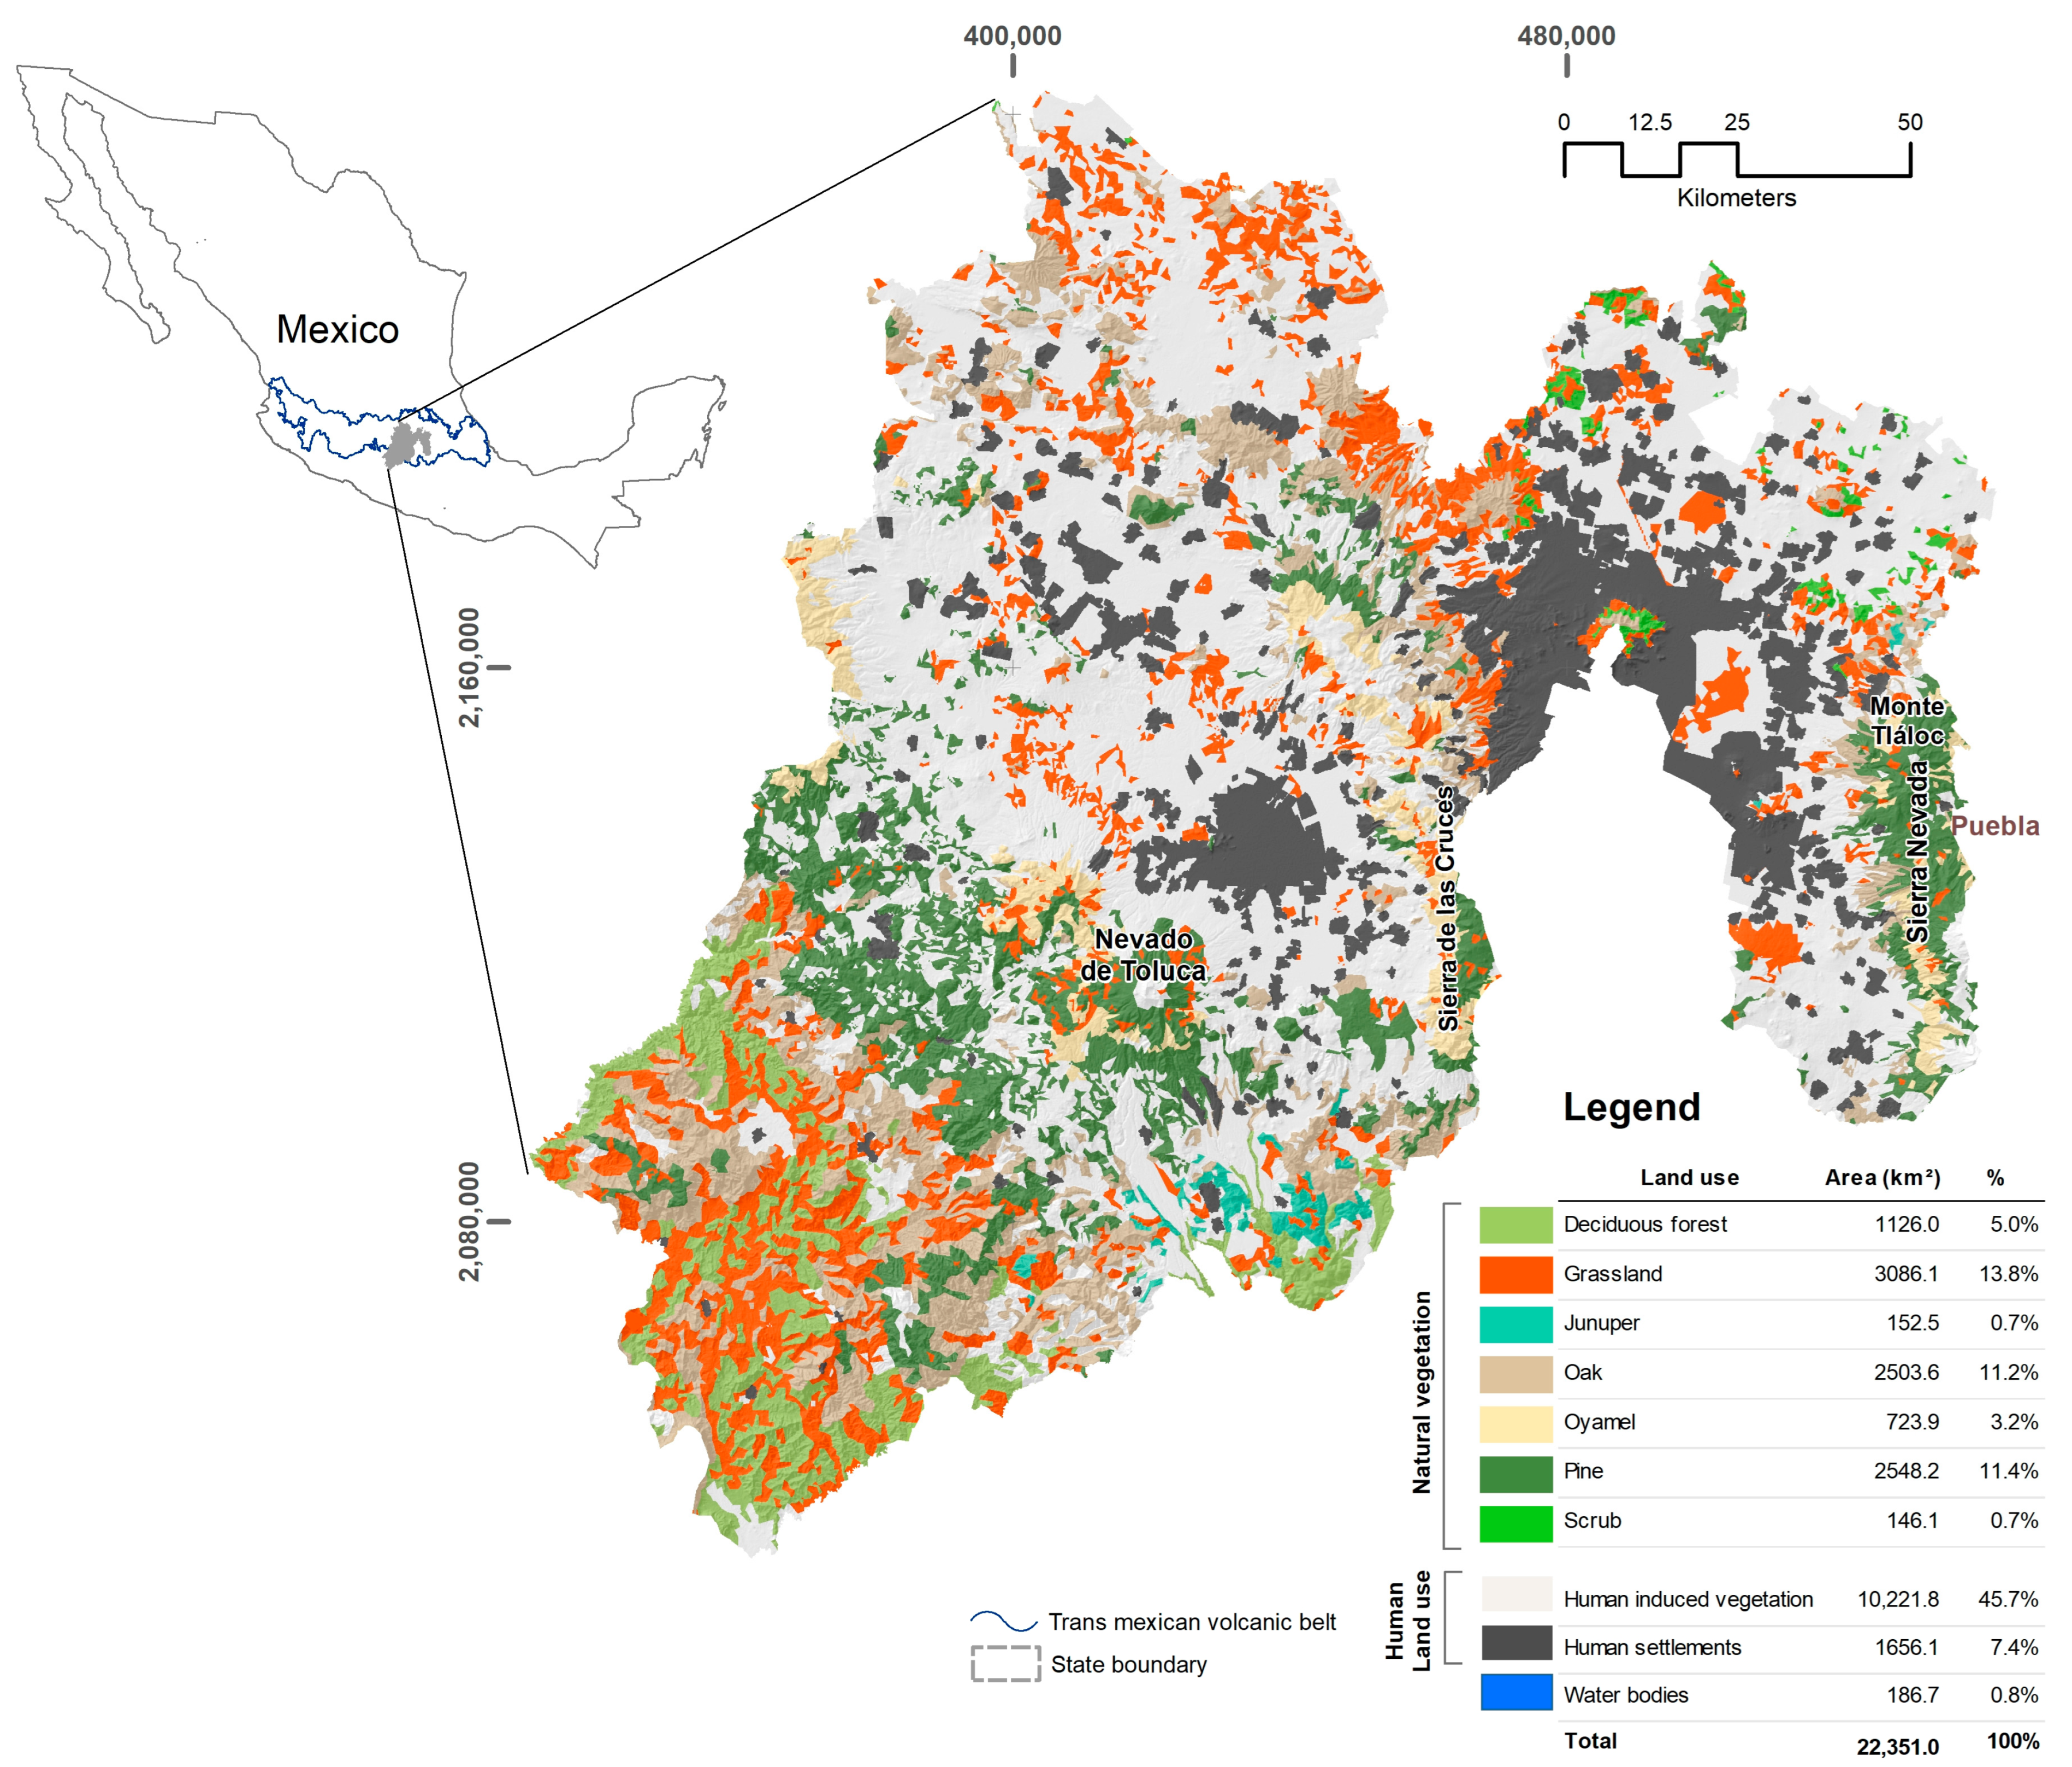
2.1. Study Area

The State of Mexico is in central Mexico (Figure 1). Its total area is 22,351.8 km2, and houses the largest number of inhabitants (16,992,418) [57]. This region holds significant economic importance and ranks second in its contribution to the national GDP [58]. Changes in land use are constant and consistent; urban areas have increased while grassland and forest areas have decreased [59]. The predominant land uses related to human activities are agriculture, which reaches approximately 45%, and human-induced grasslands, which represent nearly 14% of the surface. Five climates are identified in the area: temperate subhumid, semi-cold, cold, semi-arid temperate, semi-warm, and warm. Precipitation varies between 539 to 1219 mm/year and altitudinal values range between 400 and 5380 masl. These conditions generate a high heterogeneity that has favored the evolution and persistence of an important biological diversity. It is represented by 125 native species of mammals, grouped in eight orders, comprising 26% of the terrestrial mammals in the country [60]. Amphibians are represented by the orders Caudata (salamanders and axolotls) and Salientia (frogs), with 17 and 34 species, respectively (12.4% and 14.3% of the national total), 5 of which are endemic and 25 are considered as threatened. For reptiles, there are three species of turtles (Testudinata) in the region, all threatened, representing 6.2% of the national total. Additionally, 90 species of Squamates (snakes and lizards) represent 22.9% of the total, of which 38 are threatened [61].
Natural vegetation occupies approximately 35% of the State’s territory [62], and it is the preferred habitat for biodiversity. A great proportion of the natural vegetation is concentrated in the southwest of the state, although dense and large forests are also identified in the Nevado de Toluca Volcano and the Sierra Nevada (Figure 1) in the west. These regions represent hotspots of temperate biodiversity. Despite this, deforestation in natural areas has intensified, altering biological corridors and impacting the connectivity of the landscape [63].
Historically, the State of Mexico has consistently reported the highest number of wildfires (Figure 2) in the country, accounting for over 19% of the national wildfires; however, a significant portion of the recorded wildfires did not cover large areas, representing only 2% of the total burnt area [64]. In Mexico, the years most impacted by wildfires have been 1998, 2011 and 2023, accounting for 849,623 ha, 956,408 ha, and 974,622 ha of burnt surface, respectively.
According to SEMARNAT [64], in the State of Mexico the years with the highest number of fires (exceeding 2000 records) were 2000, 2011 and 2013. Furthermore, it has been noted that since 2019, the burnt area progressively increased from 10,000 ha to over 20,000 ha in 2023.

2.2. Methodology to Determine Biodiversity at Risk
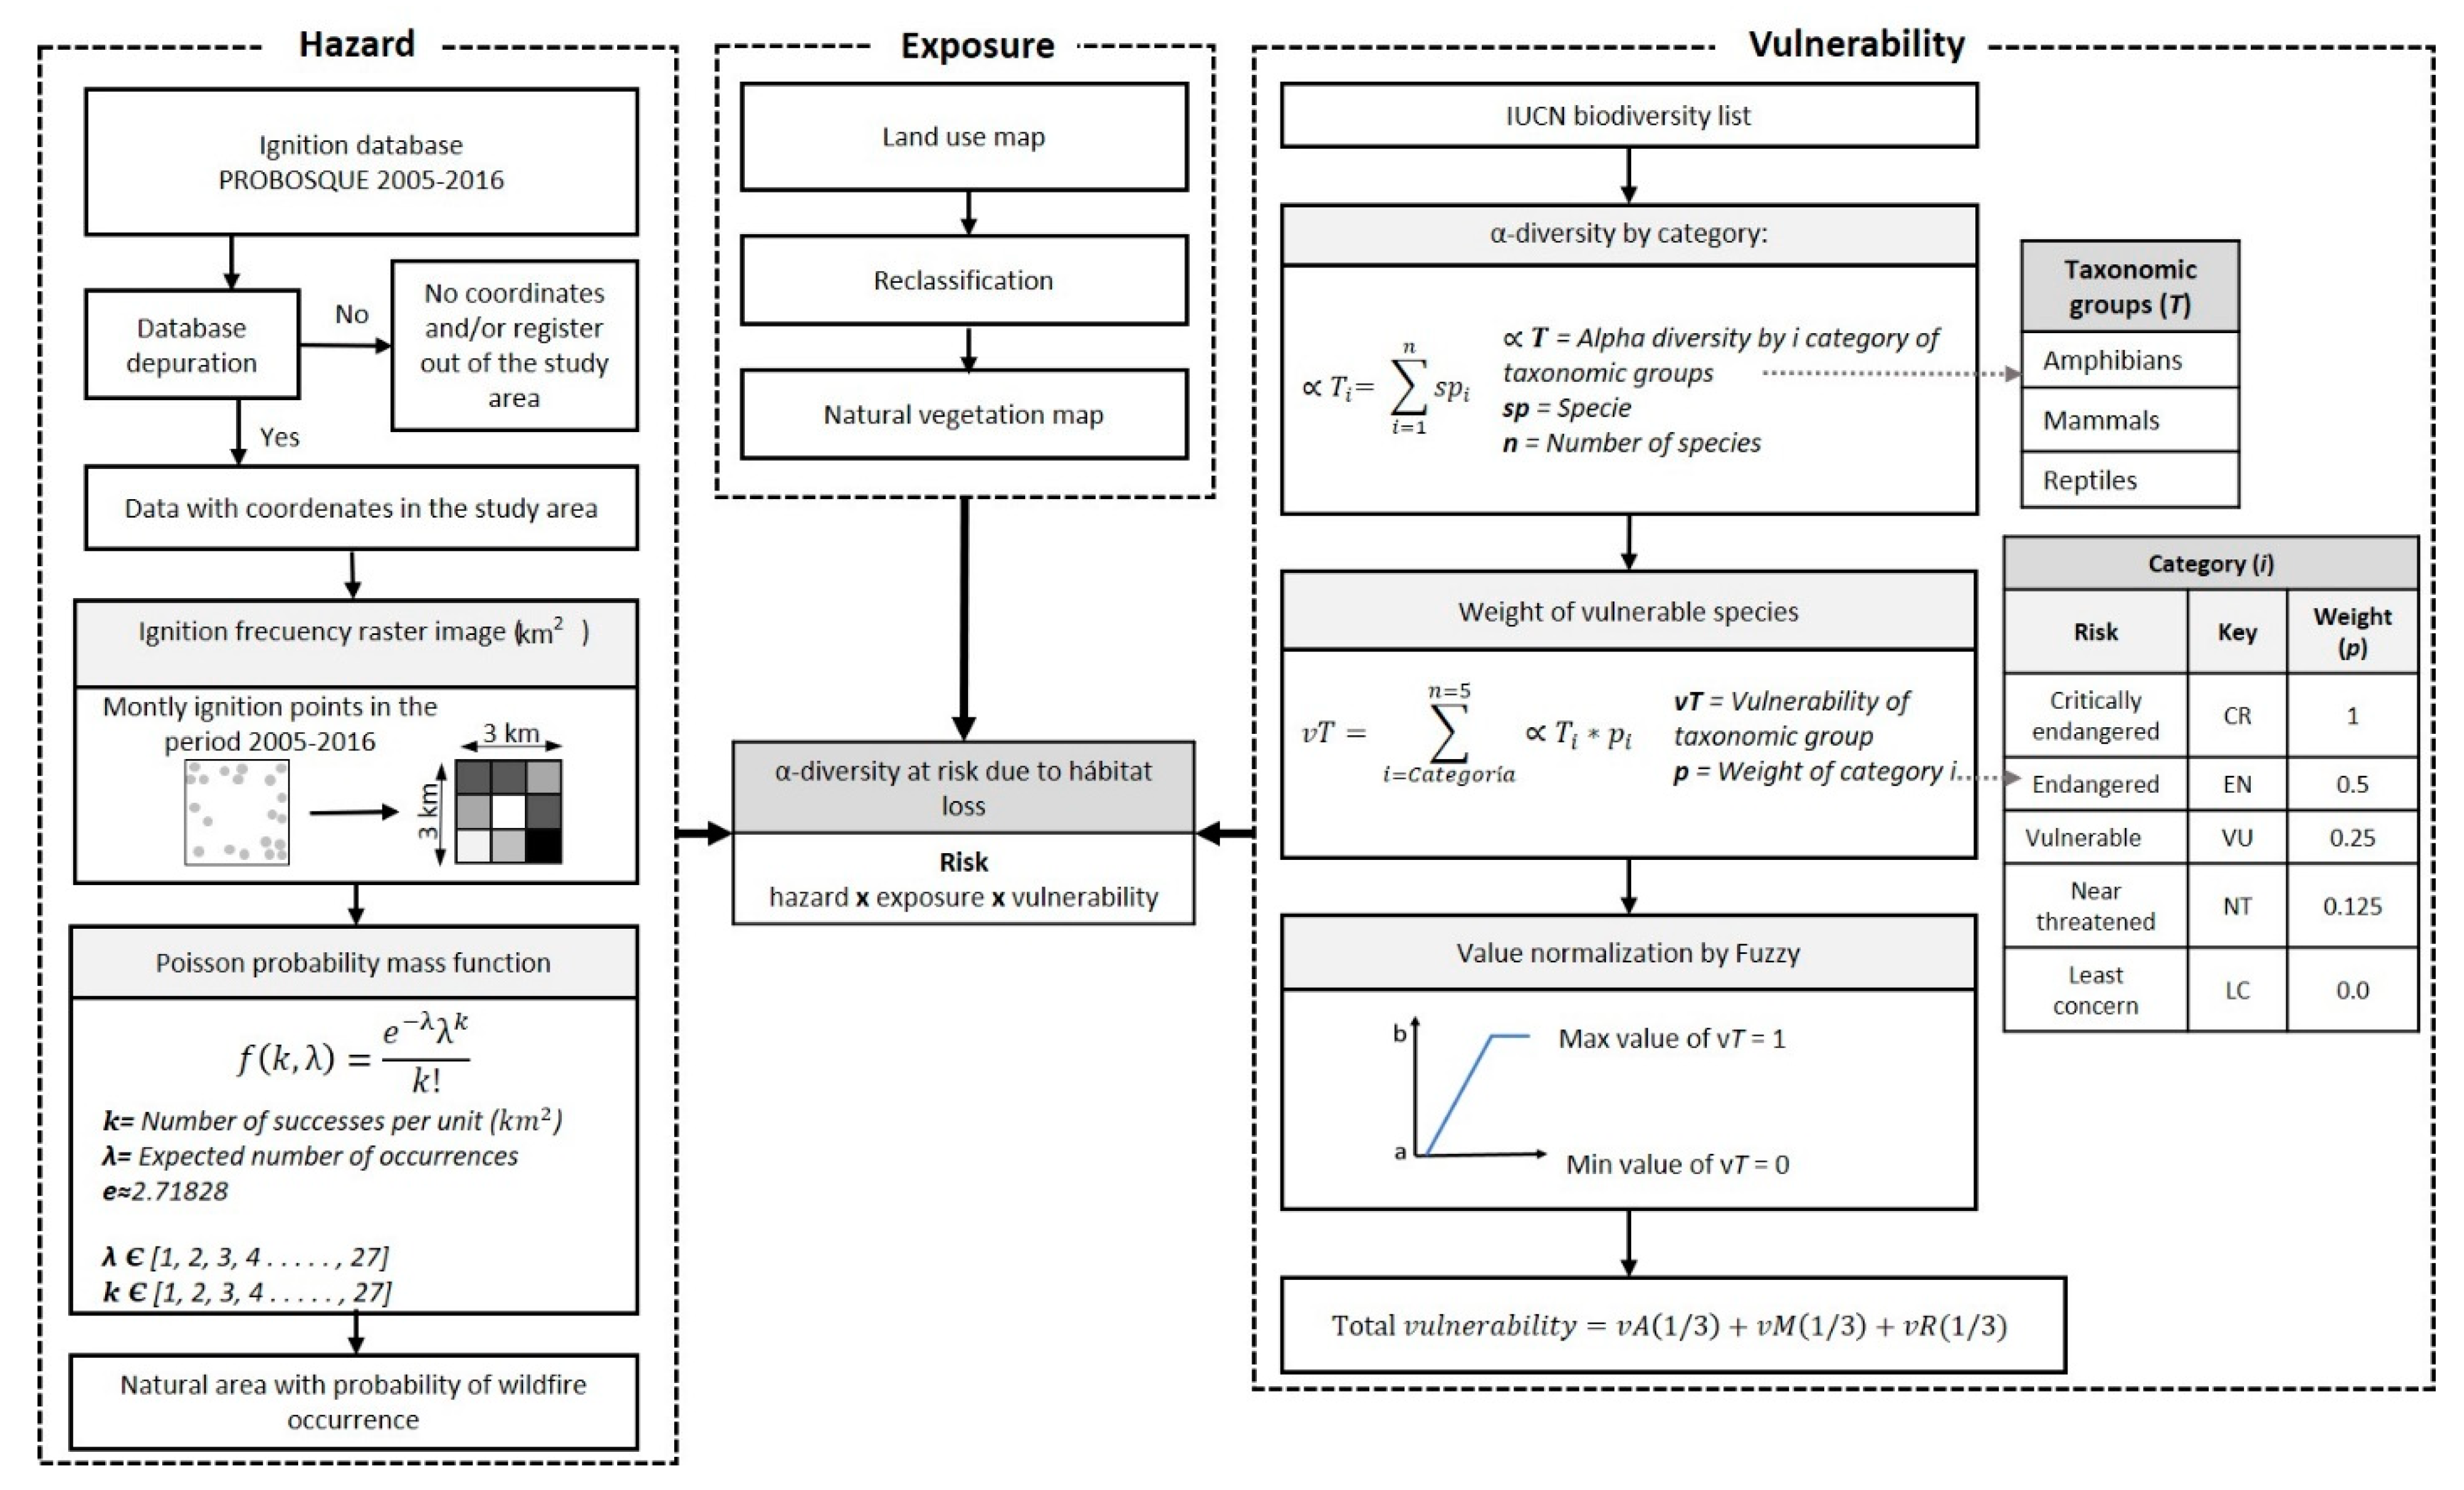
The risk of affectation of the α-diversity due to habitat degradation and/or loss was analyzed using the approach proposed by Crichton [65], where the risk is obtained via the following equation:
Risk = Hazard * Exposure * Vulnerability
A potential degradation is considered where the occurrence and the degree of degradation are an uncertainty determined by: (a) hazard, the frequency and severity of an event that can cause habitat loss; (b) exposure, the proximity of the studied species to the sources of danger; and (c) vulnerability, which measures the possible level of affectation for the species [66]. The methodological framework of this study is shown in Figure 3.

2.2.1. Hazard

To assess the hazard, we utilized the ignition database from PROBOSQUE; this is a database with records of all fires that occurred in the State of Mexico, together with their date of occurrence, geographic coordinates, affected area, type of stratum affected, duration, and causes of fire. For our analysis, we excluded records lacking coordinates or located outside the natural vegetation cover within our study area (see Figure 1). A data quality analysis was also conducted, excluding from the study those data points georeferencing outside the boundaries of the State of Mexico, and those with records corresponding to a different municipality than that indicated. We conducted an annual analysis of ignition points’ behavior for the period 2005–2016. Subsequently, we generated raster files illustrating ignition frequency per square kilometer to examine the spatial and temporal distribution in the study area. We determined the surface area susceptible to ignition using the Poisson probability mass function [67]. In this function, λ was defined based on the density of ignition points per pixel (1 km2) (see Figure 4). Monthly wildfire density data were transformed from probability values and reclassified to produce a hazard map specific to the dry season (December to June).

2.2.2. Exposure

We consider biodiversity exposure as the territory portion in which land use classification corresponds to some category of natural vegetation (Figure 1). The assumptions were that populations of mammals, reptiles and amphibians in these ecosystems are preferentially distributed, and that the occurrence of ignition points in such territories would have a greater impact on α-diversity. Vegetation types corresponding to deciduous forest, grassland, juniper, oak, oyamel, pine, and scrub were grouped to obtain a layer that represents the exposure of ecosystems to wildfires, considering land use and vegetation data from INEGI [62].

2.2.3. Vulnerability

The potential distribution of amphibians, mammals and reptiles in the State of Mexico was extracted from information published by the International Union for Conservation of Nature (IUCN) (https://www.iucnredlist.org/resources/spatial-data-download) (accessed on 20 February 2024). In addition, the base of the National Biodiversity Information System (SNIM-CONABIO) [68] was integrated. This georeferenced base integrates the record of specimens, taxonomy, year of collection, type of vegetation, risk and conservation (CITES, IUCN and NOM-059-SEMARNAT-2010). Then, α-diversity (species richness per spatial unit) was determined based on the number of species and their potential territorial distribution. Subsequently, species of each Class (Amphibia, Reptilia and Mammalia) were weighted by weight factors [69,70,71] according to their vulnerability or degree of risk, as established by the IUCN [71]: Critically Endangered (CR), Endangered (EN), Vulnerable (VU), Near Threatened (NT), and Least Concern (LC). A weight (p) was assigned to each category with an exponential decay function, resulting in values of 1.0, 0.5, 0.25, 0.125 and 0.0, respectively. The potential distribution of CR, EN, and VU species within the State was corroborated by reviewing local scientific publications and records from the past 30 years on gbif.org (accessed on 10 March 2020).
Maximum and minimum values were defined nationally by Class; the values were used to normalize information throughout a fuzzy linear membership function in ranges from 0 to 1. The next step was to cut out the cartography obtained within the State limits, and finally, to obtain the total vulnerability by adding up the vulnerability layers of the three taxonomic groups multiplied by 1/3, so that the range of values remained between 0 and 1.

2.2.4. α-Diversity at Risk due to Wildfires Habitat Loss

Finally, we multiplied the hazard, exposure, and vulnerability layers to generate a raster map with values ranging from 0 to 1. Lower values indicate areas with a lower risk of α-diversity habitat degradation caused by forest wildfires, while higher values represent areas at greater risk due to these events for the period 2005–2016. Furthermore, we compared the distribution of areas with risk probability to the bioclimatic corridors generated by CONABIO [72] to assess their potential impact on regions promoting connectivity between ecosystems. To achieve this, we calculated two landscape metrics: patch numbers (using the eight-neighbor rule) and core areas, employing the Landscape Ecology Statistics extension [73] within QGIS 3.14 [74].

3. Results

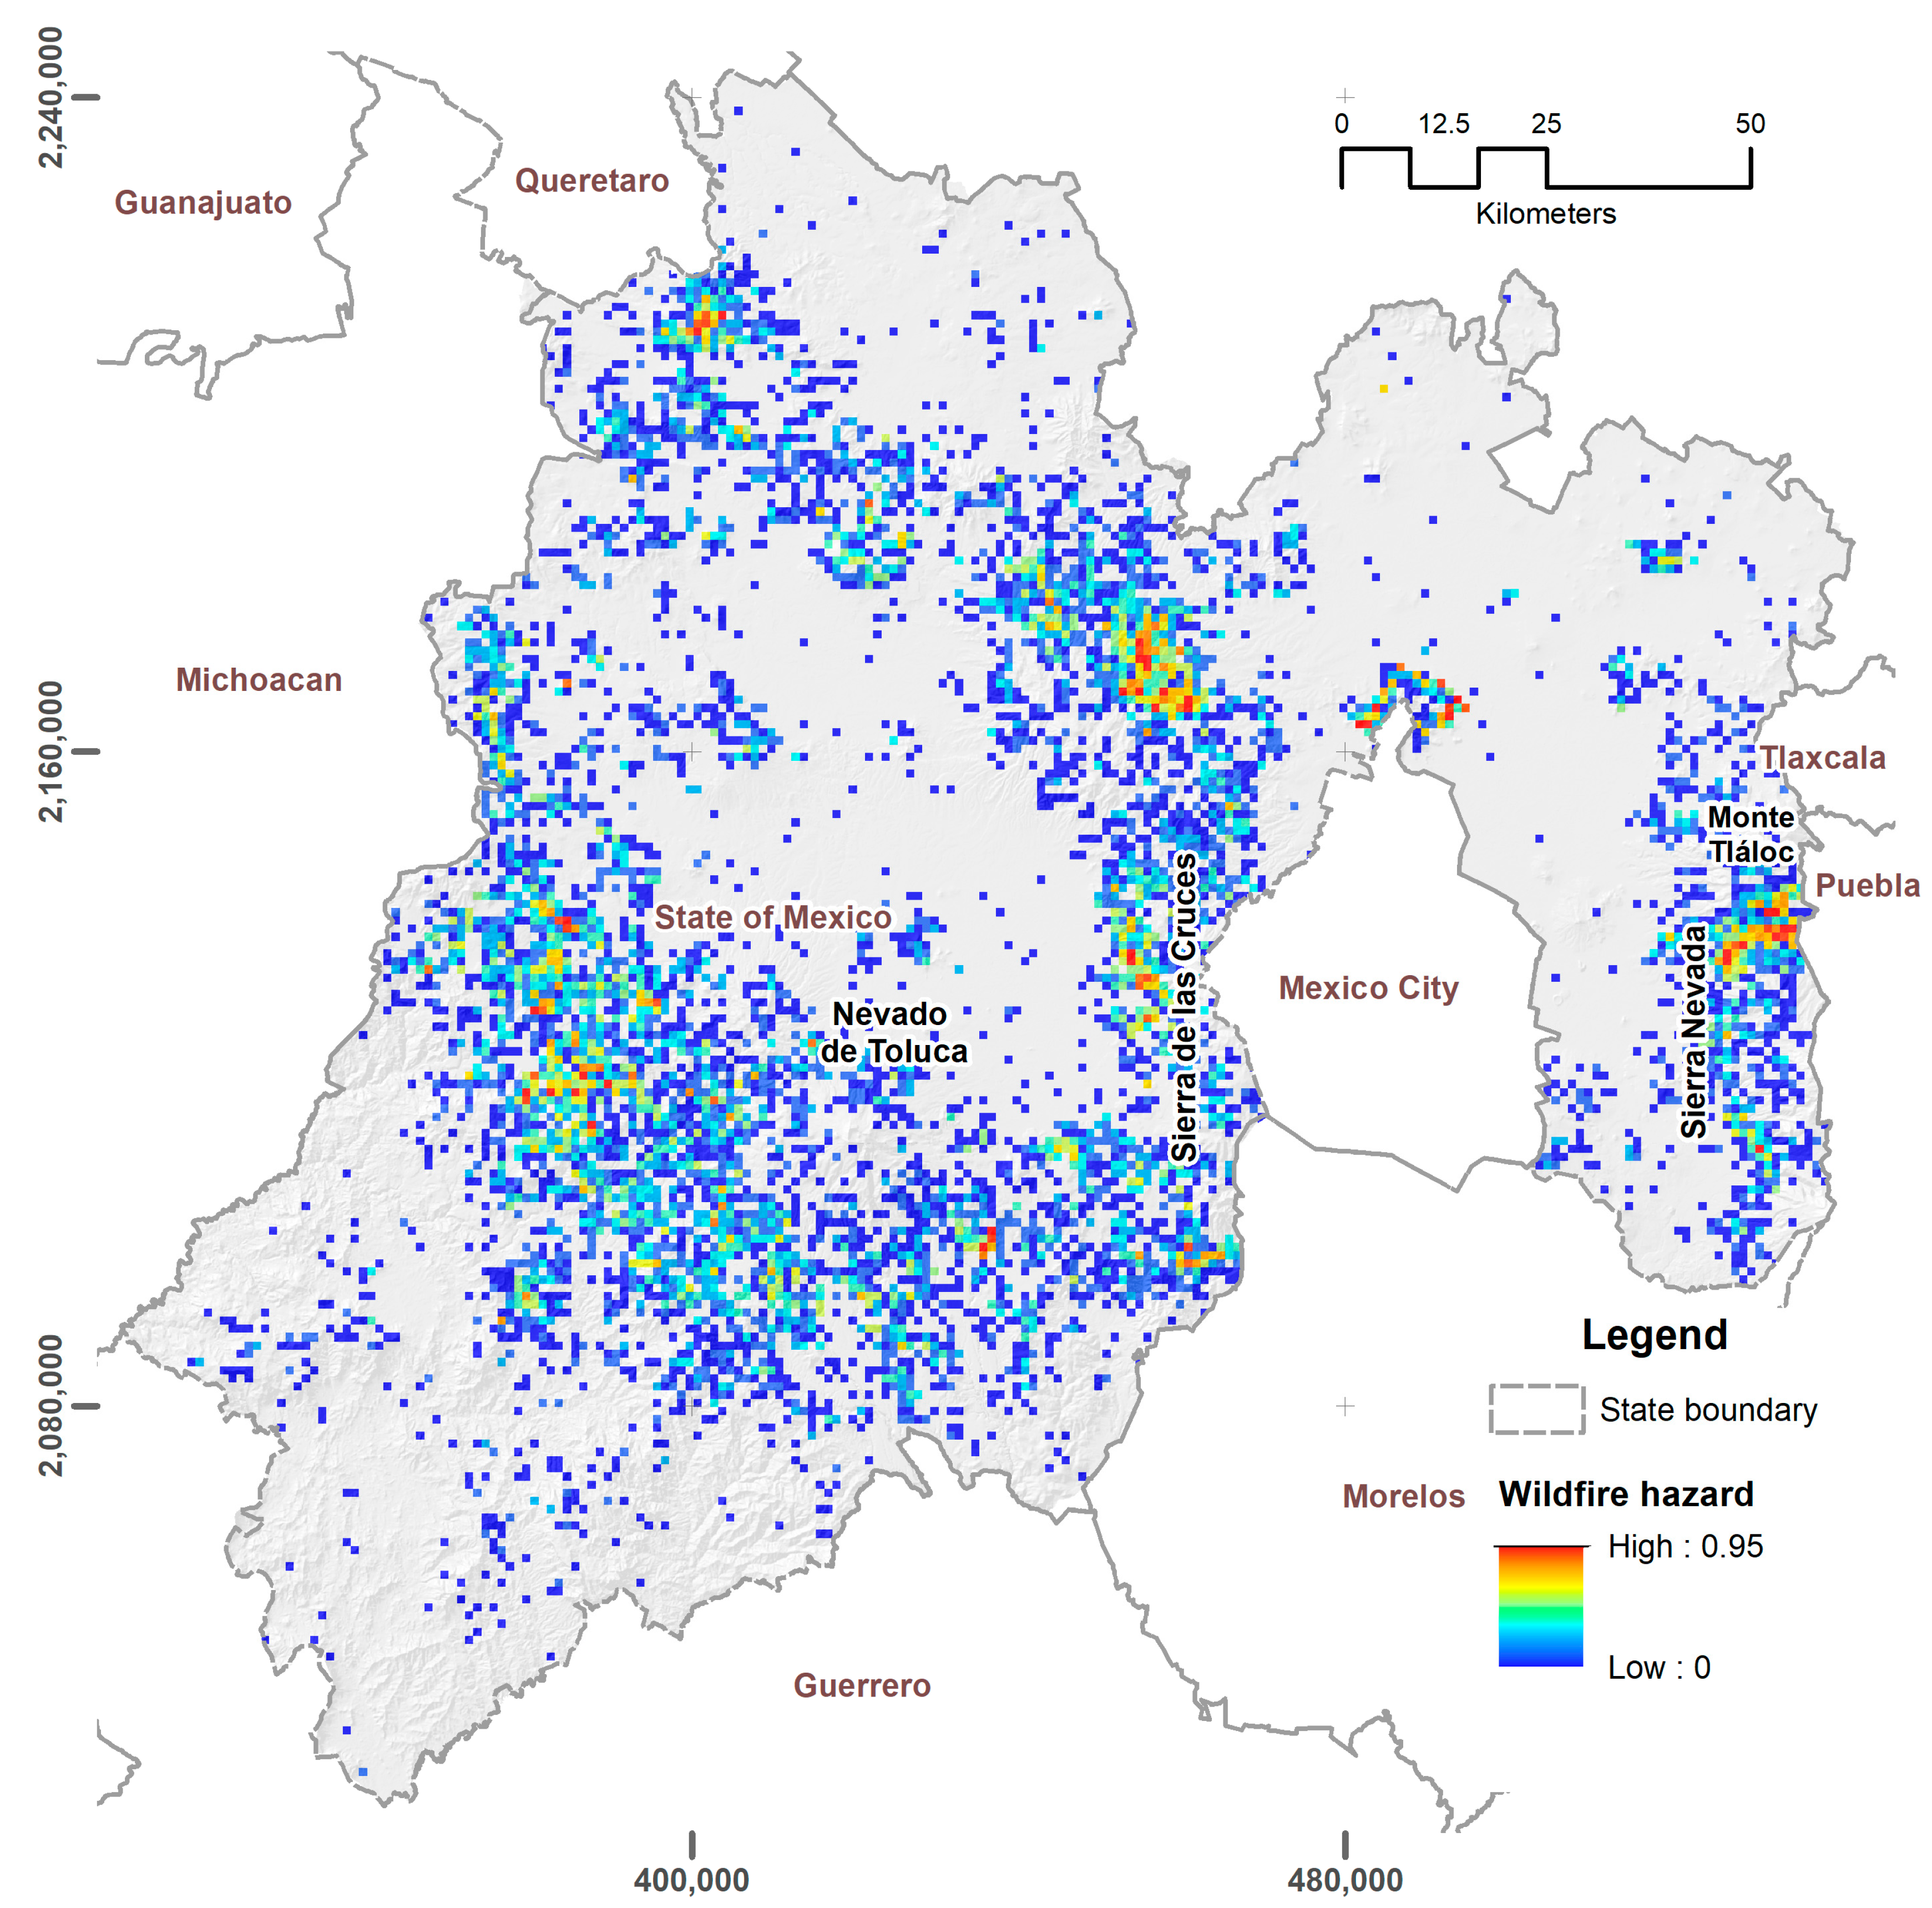
3.1. Exposure Zones and Hazard Analysis

To assess habitat degradation, we considered seven categories of natural vegetation: deciduous forest, grassland, juniper (Juniperus), oak (Quercus), oyamel (Abies), pine (Pinus), and scrubs, along with their respective vegetation associations (see Figure 1). In these natural vegetation areas, we documented 9833 wildfires during 2005–2016, accounting for 65.4% of the total. These were distributed as follows: 2298 occurred in areas with oak, 115 in scrublands, 688 in oyamel, 1228 in grasslands, 5352 in pine forests, 52 in deciduous forests, and 100 in juniper. During the analysis period, an annual average of 580 fires were documented in natural vegetation cover. The highest incidence of fires and largest burned areas were recorded between 2011 and 2013, surpassing 9000 ha per year, encompassing agricultural zones. A significant number of these fires resulted from the extreme drought across the country, starting in March, escalating to severe and extreme levels by June. Therefore, it was plausible that the frequency and scale of wildfires escalated, reflecting the heightened recurrence and severity of drought events [10,11] as well as climate variability in the region [75].
The ignition frequency per km2 (Figure 4) allowed us to identify the most affected areas. Maximum accumulated values of 27 ignition points per km2 (M = 2.5, SD = 2.60) were reached in the period. The distribution of the number of ignition points was mainly biased towards low values, since pixels having a frequency of one ignition point comprised 47% of the total (2772 km2), and pixels with two ignition points corresponded to 20% of the cases (1174 km2), representing a total of 67%. Figure 4 shows a hazard map that represents parts of the territory with the probability of wildfire occurrence, with values ranging from 0 to 0.95, (M = 0.20, SD = 0.15), covering a total area of 5821 km2.
Approximately 40% (1221 km2) of the State surface presents a probability between 0 and 0.25 of being affected by at least one wildfire within a year. Around 47% (1438 km2) has an ignition point event probability from 0.25 to 0.5; 12% (363 km2) between 0.5 and 0.75; and approximately 0.02% (62 km2) presents a probability ranging from 0.75 to 1 for the occurrence of ignition point events. Areas with the highest risk of wildfires are located in the western, north-central and eastern portions. The most high-risk areas are located in: La Marquesa, Cumbres Sierra Nevada National Park, Aculco, Iztaccíhuatl-Popocatépetl National Park, Ocuilan, and Temascaltepec. These regions are often characterized by agrosilvopastoral systems, which are frequently the primary cause of fires in these areas. In 2013, the protection status of the Nevado de Toluca Volcano was changed from National Park to a less restrictive category, and forest cover loss increased after the change. The pressure for forestry exploitation also represents another impact coupled with wildfires [63].

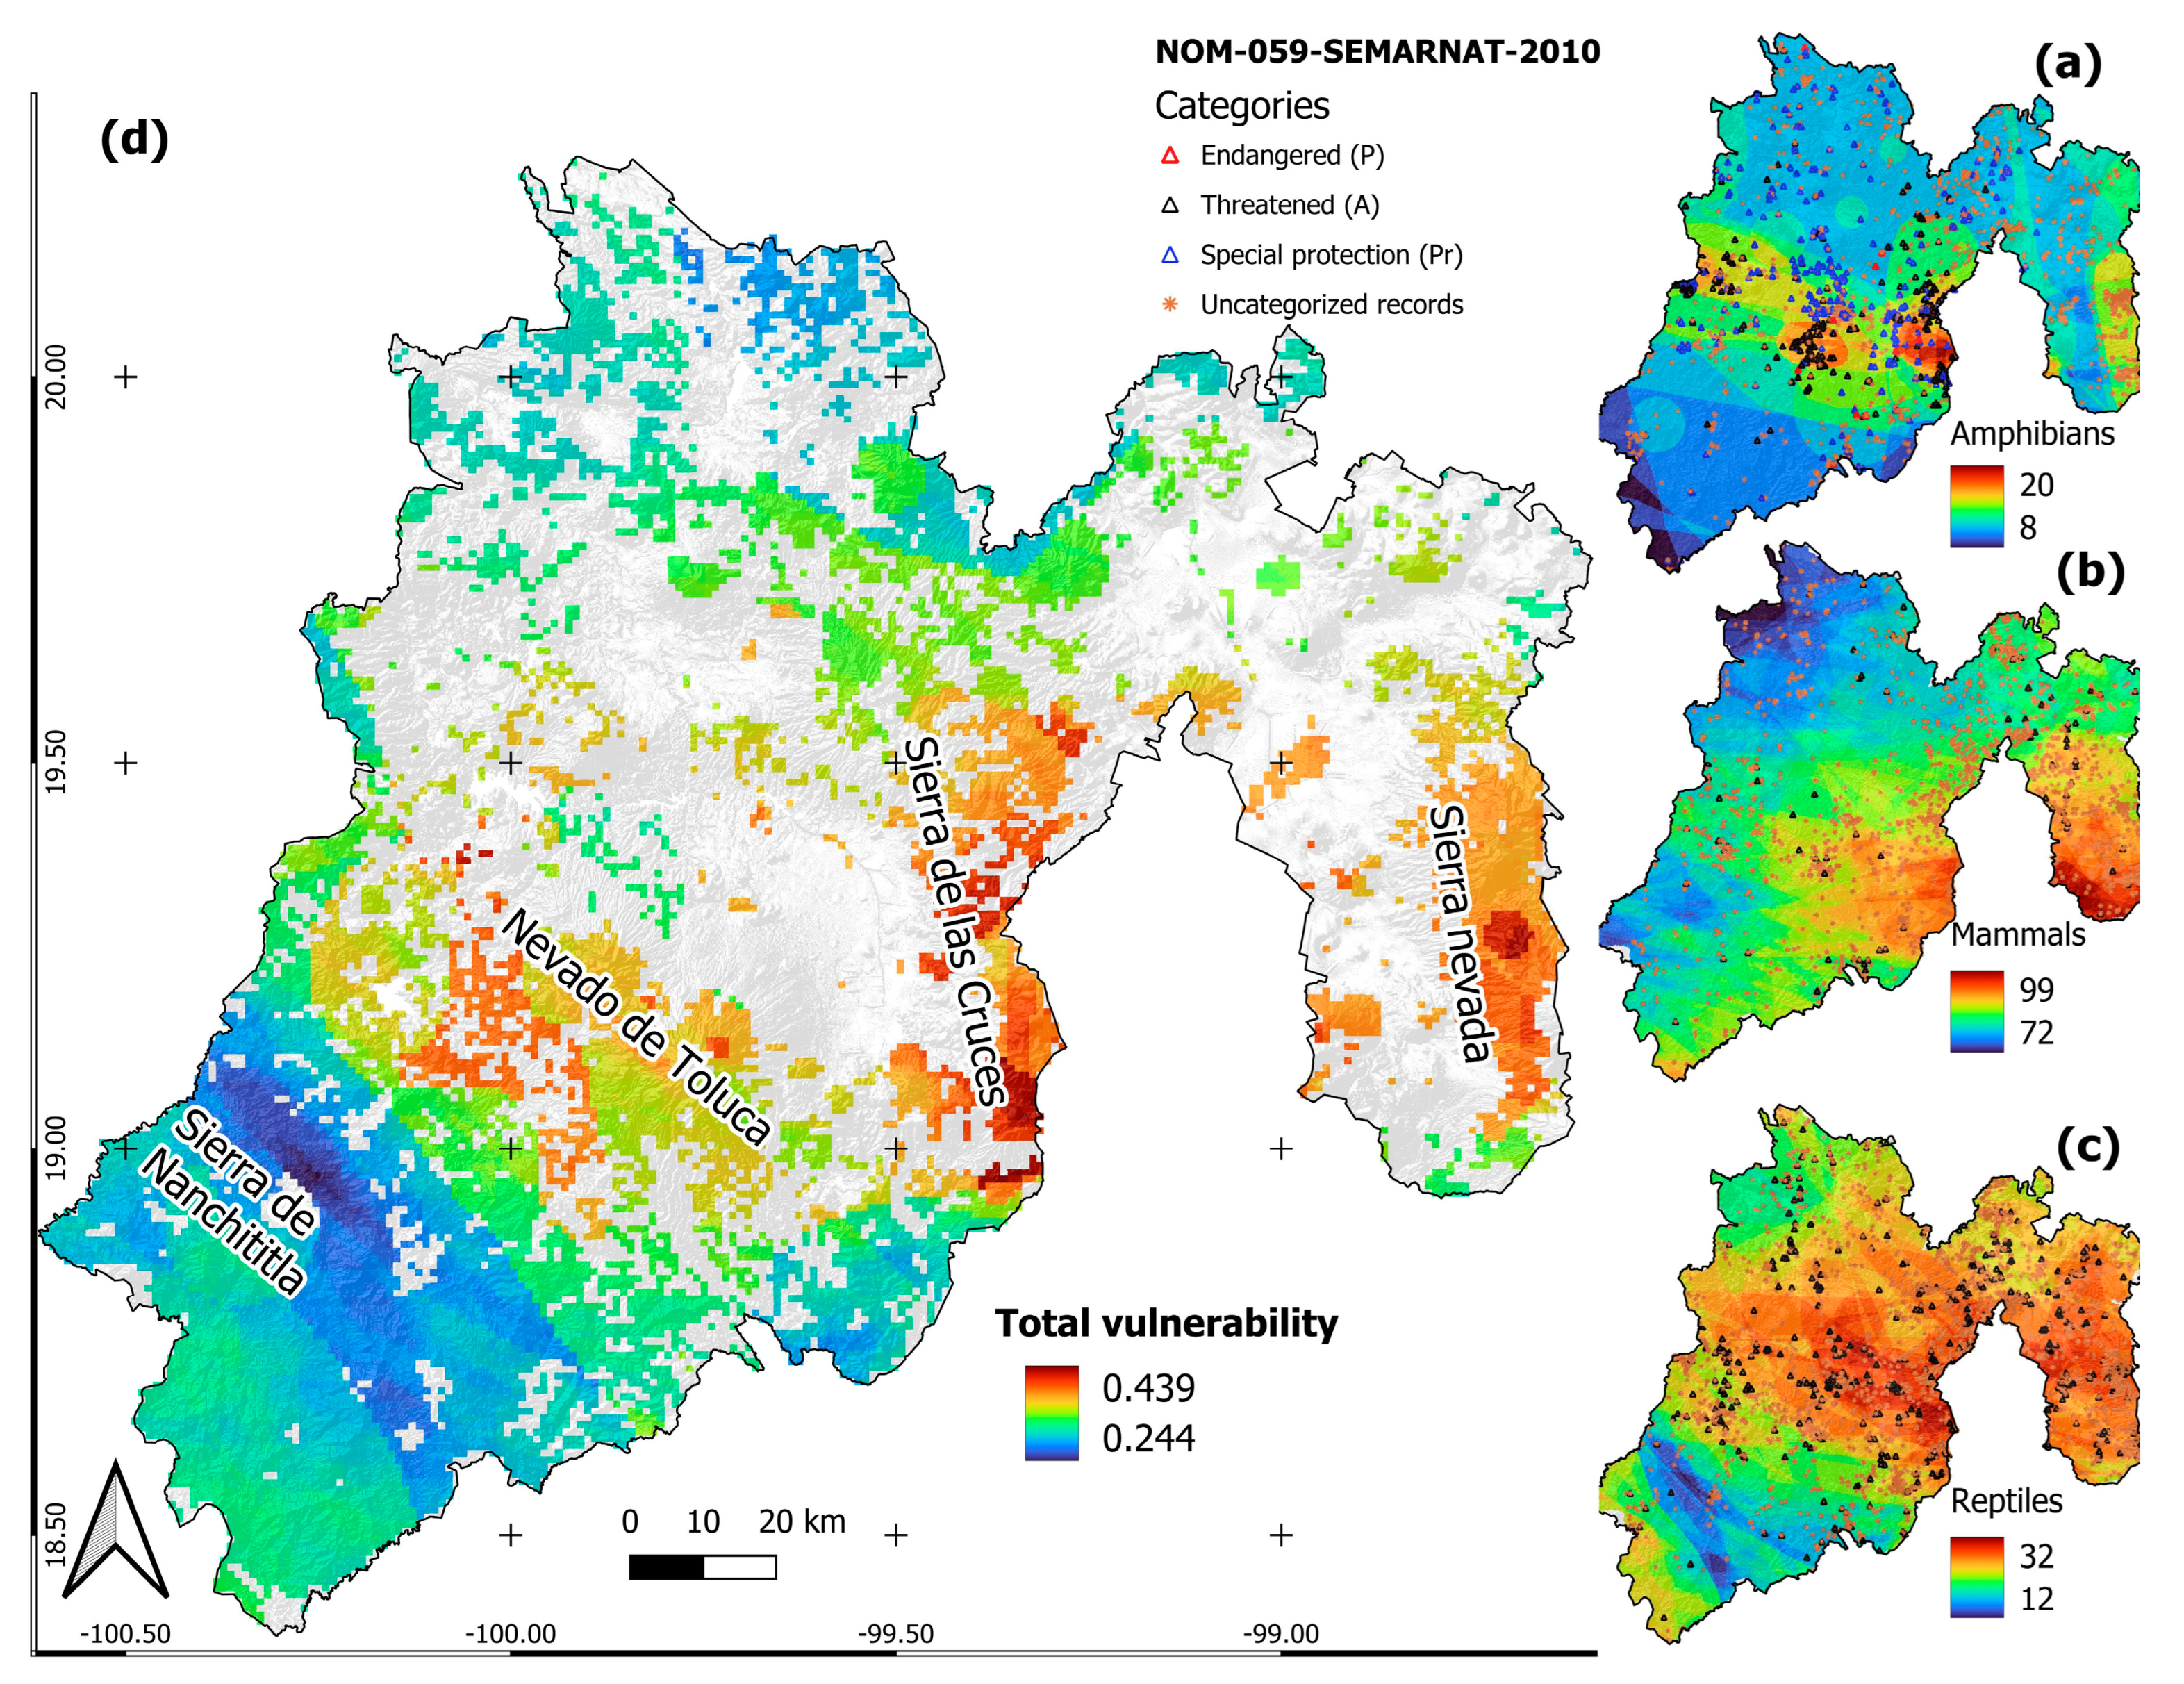
3.2. Vulnerability of Amphibians, Mammals and Reptiles

α-diversity values in the study area show that the richest group is mammals, with potential distribution values of up to 99 spp. per km2. Species are mainly concentrated in the limits of Mexico City and in the eastern part of the State. Reptiles have areas with up to 32 spp. per km2, and amphibians record up to 20 spp. per km2. The minimum values for amphibians, mammals and reptiles are 8, 72 and 12, respectively (Figure 5a–c). We acknowledge that potential distribution figures tend to overestimate the presence of species in certain regions; however, we consider it convenient to conserve these values for the protection and conservation of natural spaces and corridors, instead of information sources that underestimate species distribution. Additionally, the records of CONABIO specimens reinforce the resulting map, because for some species, not only do the distribution areas coincide, but we were also able to identify that some categories are listed in both the IUCN Red List and in the Mexican Standard NOM-059-SEMARNAT-2010, which can be considered equivalent [76].
The total vulnerability values (Figure 5d) range from 0.24 to 0.43; the highest are distributed in the limits of Mexico City, the eastern area, and the west of the State. The most vulnerable areas are Sierra Nevada, Sierra de las Cruces and Nevado de Toluca. It is widely recognized that herpetofauna has exhibited adaptability in peri-urban areas [77], and the region under study is no exception. Nonetheless, rapid local environmental changes and the vulnerability of species may hinder their ability to adapt promptly. Hence, it is imperative to incorporate such studies into fire management practices and their implications for fauna conservation.
Table 1 shows the species in the risk categories of the IUCN, except those in the LC category. Amphibians have the highest number of species at the highest risk levels (CR, EN and VU), with five, eight and two, respectively. The most affected species are Ambystoma leorae and Pseudoeurycea robertsi (CR); Pseudoeurycea tlilicxitl, Ambystoma altamirani, and Ambystoma ordinarium (EN); and Chiropterotriton orculus (VU). Mammals have two species listed as CR, two as EN, and three as VU. The most affected species are Habromys delicatulus in the CR category, Romerolagus diazi in EN and Microtus quasiater in NT.
Finally, reptiles do not have species in the CR category. However, there are four species in the EN category and two listed as VU. The most affected species are Barisia rudicollis (EN), Thamnophis scaliger (VU) and Agkistrodon bilineatus (NT).

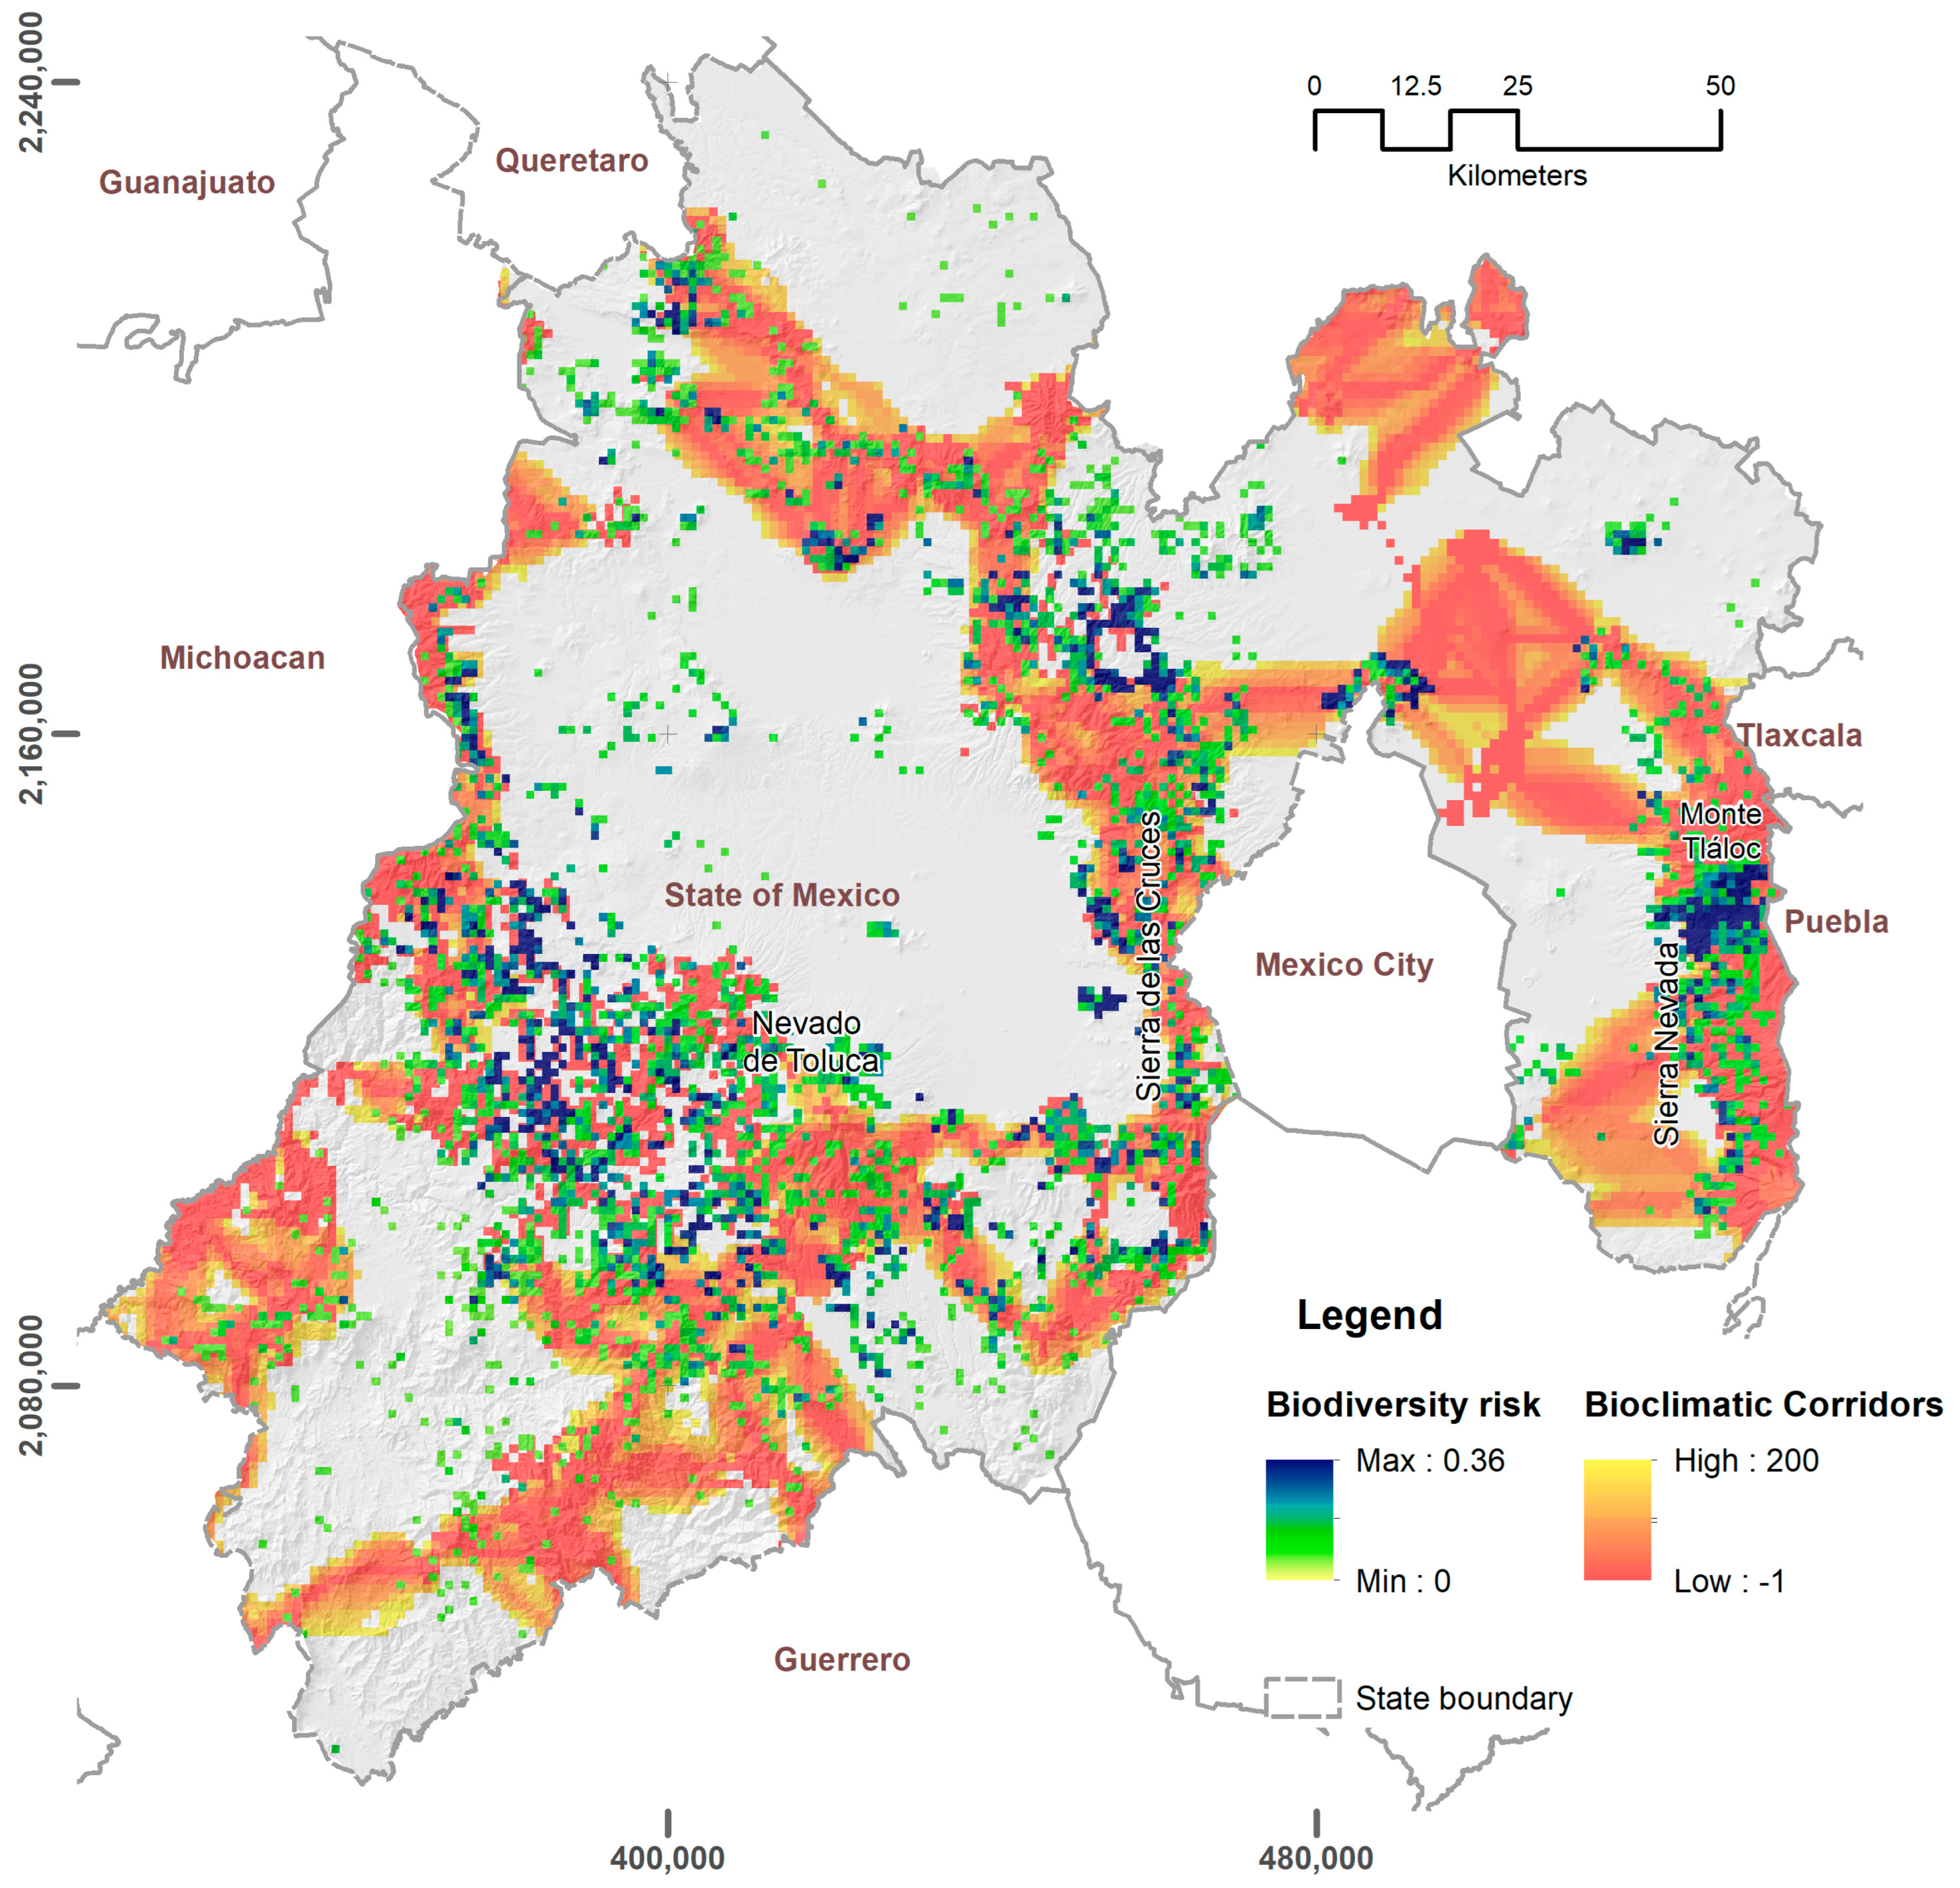
3.3. α-Diversity at Risk due to Wildfires Habitat Degradation

Figure 6 shows the α-diversity potential risk affection due to habitat degradation and the layer of bioclimatic corridors generated by CONABIO [72]. The risk values range from 0 to 0.36. The highest values represent areas in which α-diversity in CR, EN and VU categories is more likely to be affected by wildfires occurring in natural vegetation areas. Regions that contain the highest number of high-risk pixels are the Sierra Nevada (SN), the Sierra de las Cruces (SC), and a corridor from the west of the State to the southern slope of the Nevado de Toluca, altering biological corridors and impacting the connectivity of the landscape. The SN within the limits of the State of Mexico covers an approximate area of 672 km2 of natural soil; the overall core area of this surface is 335.3 km2. With the pixel resolution defined in this investigation (1 km2), five patches were identified, one of which is predominant, containing 95% of the pixels. There, 9.6% of the wildfires in the State during 2005–2016 were registered. As for SC, it agglomerates approximately 738 km2 of natural land use grouped into eight patches, and the overall core area of the surface is 203.6 km2; the patch with the largest area contains 59% of the pixels for which 16.4% of the wildfires in the period were registered. Regarding NT, the highest coverage of natural land use was approximately 1540 km2, which was fragmented into 11 patches. One patch predominated 96% of the area, and despite its size, it contained several gaps because the neighborhoods connecting a high number of pixels were present across its vertices, resulting in an overall core area of 451 km2. The highest wildfire percentage was accumulated in this area (30.5%).

4. Discussion

Studying the effects and responses of individuals and communities to wildfires poses significant challenges. Comparing pre- and post-fire conditions relies on fires occurring coincidentally during the study period [56]. Long-term projects, like continuous sampling over multiple years, are constrained in Mexico and other developing countries due to the considerable investments needed in time, materials, and safety measures for the research team. Within this framework, existing databases, such as those offered by the IUCN and CONABIO, represent valuable assets for comprehensive studies aiming to serve as reference points regarding the impacts of wildfires on regional biodiversity.
We found that for the State of Mexico in Central Mexico, the Nevado de Toluca is the region with the highest probability of increased fragmentation and reduction in the extension of core areas due to wildfires. The second region is Sierra de las Cruces, followed by the Sierra Nevada.
The regions studied are, partially belong to, or are contiguous with protected natural areas, and coincide with the bioclimatic corridors defined by CONABIO. In addition, most of the hazard zones are adjacent to agricultural areas, and in the so-called wildland–urban interface (WUI) [78]. WUI is linked to the large urban regions of the Toluca Valley and Mexico Valley Metropolitan Areas, whose periphery has expanded three times since 1990 [79]. All of this shows the need to review and strengthen protection and conservation measures for these regions so as to prevent this dynamic from expanding to other areas.
The way in which wildfires, as habitat alteration processes, affect α-diversity is different for each species. It is known that even within the same taxonomic group, species can respond differently to similar events worldwide [80,81,82,83,84,85,86]. Hence, it is important to carry out local studies to identify habitats and species susceptible to habitat alteration. Here, amphibians have the highest proportion of threatened species within the study area. Amphibians are a diverse group with complex life cycles and are sensitive to humidity; therefore, they can be particularly vulnerable to disturbances caused by wildfires [87]. Although many organisms can move in the event of a wildfire, amphibians face a greater risk due to desiccation and predation, and this vulnerability is enhanced by their relatively restricted geographic and ecological distribution [88]. Some studies in the USA indicate that after a fire burned the forest surrounding wetlands, there were no changes in the occupancy of breeding sites by salamanders (Ambystoma macrodactylum Baird) [45]. In the case of Plethodon neomexicanus, after a wildfire, it is possible to exceed the critical thermal maximum, and in the case of Ambystoma talpoideum, canopy removal may increase desiccation and mortality. However, some microhabits after a fire can also confer an unexpected benefit, such as greater resistance to chytridiomycosis and other diseases [53]. The effects of wildfires on amphibians depend on the extent, severity, isolation and characteristics of the ecosystem [89]. This is a very important point, since the region is impacted by changes in land use due to the high ignition frequency and constant expansion of urban centers [90], including Mexico City.
It is important to emphasize that the response of a species to the impact generated by wildfires may differ and depend on ecological traits, including its degree of specialization to a particular habitat, food resources, life history traits, ecological requirements, ecological plasticity or past events that affect the current population size. Such is the case of the mammal Habromys schmidly, an endemic species to central Mexico, that inhabits mountain forests but is cataloged as CR [91]; however, the most recent record for the species is from 2006, and there are no new records. Additionally, Romerolagus diazi is an EN species, whose distribution is limited to central Mexico [92]. Observations of this species in natural areas have considerably reduced since 1987, and it has not been found in the Nevado de Toluca [93] in recent years. Specifically, wildfires have been considered as one of the main causes of habitat fragmentation for this mammal, limiting its distribution area [60,94]. R. diazi (volcano rabbit) habitat has been gradually destroyed by changes in land use and wildfires, but the main problem is that it is a habitat specialist whose survival depends on the presence of grasslands; therefore, moving to different habitat type [95] is not possible for the species. For reptiles, some species in the study area are sensitive to wildfires, such as A. deppii, an arboreal species whose main threats are changes in land use as well as wildfires [80,84]. Additionally, various studies have found that wildfires cause garter snakes (Thamnophis spp.) to disappear from burned areas due to a reduction in their preys and/or because they increase their own risk of predation [81,85]. The impact of fire varies among amphibian species, and varies from absence to presence depending on the habitat associations of specific traits. Some amphibians present morphological and behavioral traits to survive fires, which may differ even in the same community [52], highlighting the need and importance of local studies.
Despite the variety of the impacts on biodiversity, this study does not intend to simplify the relationship between the studied species and the burned areas; rather, it focuses on identifying regions with the greatest potential impact on vulnerable species, highlighting those that have been exposed to multiple wildfires. Thus, this can represent a starting point to determining the species that may be more susceptible to being affected by these drastic changes in ecosystems. Additionally, our results emphasize the importance of identifying regions in which wildfires frequently occur, so as to design and implement monitoring measures that not only record wildfire occurrences, but also include the intensity and dimension of wildfires, in order to determine negative impacts on natural lands and therefore on the habitats of vulnerable species.

5. Conclusions

Records of wildfire occurrences in the State of Mexico for 2005–2016 were processed to generate a cartography of wildfire density per km2. Afterwards, we calculated wildfire occurrence probability by using the Poisson probability mass function model, identifying areas with the highest hazard of being affected.
We identified the α-diversity of amphibians, mammals and reptiles, and their potential distribution in the study area, by only considering those zones with natural vegetation, which were defined as exposure zones and assigned a weight based on the degree of vulnerability defined by the IUCN for each species.
The risk of affecting diversity due to habitat degradation was determined by map algebra, which highlighted a concentration of high values in the Sierra Nevada and Sierra de las Cruces, as well as a region with scattered pixels due to natural soil use fragmentation in the south of the Nevado de Toluca and the limits of Mexico City.
The occurrence of wildfires affects natural spaces in different ways; the degradation of habitat and a lack of connectivity due to fragmentation are among the most debated issues in the literature [96]; as observed here, these effects can be determine the occurrence and severity of wildfires.
Three regions were found in which the effects are manifested with greater intensity: SN, SC, and NT. Natural land use in these regions is divided into 5, 8 and 11 patches, respectively; in the three cases, there is a predominant patch that groups most of the surface (95% in SN, 59% in SC and 96% in NT). These large patches house the core areas for each region. The highest percentage of core areas is found in SN, with 49.9% of the total use being for natural land, followed by NT with 29.3% and SC with 27.6%.
It is expected that the risk of affecting α-diversity in the region will constitute an important decision-making criterion in current wildfire combat protocols, as well as in the formulation of an early warning system against them. In this study, hotspots are identified to guide strategic efforts in fire-prone areas linked to the potential distribution of amphibians, mammals, and reptiles with an IUCN risk category in the State of Mexico. Furthermore, in future studies it is advisable to carry out long-term studies to evaluate the effects before and after wildfires, based on the endemism and the vulnerability of the species due to anthropization and climate change.

Author Contributions

Conceptualization, C.A.M.-L., R.B.-P. and C.D.-D.; methodology, J.P.-T., C.A.M.-L. and C.D.-D.; software, R.B.-P. and J.P.-T.; writing—original draft preparation, C.A.M.-L., R.B.-P. and J.P.-T.; writing—review and editing, C.A.M.-L., C.D.-D., M.d.L.R.-G. and C.A.R.P.; visualization, J.P.-T. and C.A.R.P.; funding acquisition, C.D.-D., R.B.-P. and C.A.M.-L. All authors have read and agreed to the published version of the manuscript.

Funding

This research was funded by CONACyT, project 248498 “Hydroclimatological model for the real-time identification of areas susceptible to ignition danger to support the protection of ecosystems and their biodiversity—Modelo de base hidroloclimatológica para la identificación en tiempo real de áreas susceptibles a peligro de ignición como apoyo a la protección de ecosistemas y su biodiversidad”.

Institutional Review Board Statement

Not applicable.

Informed Consent Statement

Not applicable.

Data Availability Statement

Data are available upon request.

Acknowledgments

We thank PROBOSQUE for accessing wildfire databases of the State of Mexico. Thanks to the CONACYT-Determinación de las condiciones macro y microclimáticas del nicho ecológico y sus implicaciones sobre la fisiología hidrotérmica en dos especies de Salamandra. We are grateful to the editor and anonymous reviewers for their very constructive and useful comments.

Conflicts of Interest

The authors declare no conflicts of interest.

References

  1. Harrison, S.P.; Marlon, J.R.; Bartlein, P.J. Fire in the Earth System; Springer: Berlin/Heidelberg, Germany, 2010; ISBN 90-481-8715-X. [Google Scholar]
  2. Haque, M.K.; Azad, M.A.K.; Hossain, M.Y.; Ahmed, T.; Uddin, M.; Hossain, M.M. Wildfire in Australia during 2019–2020, Its Impact on Health, Biodiversity and Environment with Some Proposals for Risk Management: A Review. J. Environ. Prot. 2021, 12, 391–414. [Google Scholar] [CrossRef]
  3. Bowman, D.M.; Williamson, G.J.; Abatzoglou, J.T.; Kolden, C.A.; Cochrane, M.A.; Smith, A.M. Human Exposure and Sensitivity to Globally Extreme Wildfire Events. Nat. Ecol. Evol. 2017, 1, 0058. [Google Scholar] [CrossRef]
  4. Moretti, M.; Obrist, M.K.; Duelli, P. Arthropod Biodiversity after Forest Fires: Winners and Losers in the Winter Fire Regime of the Southern Alps. Ecography 2004, 27, 173–186. [Google Scholar] [CrossRef]
  5. Foster, C.; Barton, P.; Robinson, N.; MacGregor, C.; Lindenmayer, D.B. Effects of a Large Wildfire on Vegetation Structure in a Variable Fire Mosaic. Ecol. Appl. 2017, 27, 2369–2381. [Google Scholar] [CrossRef] [PubMed]
  6. He, T.; Belcher, C.M.; Lamont, B.B.; Lim, S.L. A 350-million-year Legacy of Fire Adaptation among Conifers. J. Ecol. 2016, 104, 352–363. [Google Scholar] [CrossRef]
  7. Brooks, M.L.; D’antonio, C.M.; Richardson, D.M.; Grace, J.B.; Keeley, J.E.; DiTomaso, J.M.; Hobbs, R.J.; Pellant, M.; Pyke, D. Effects of Invasive Alien Plants on Fire Regimes. BioScience 2004, 54, 677–688. [Google Scholar] [CrossRef]
  8. Di Virgilio, G.; Evans, J.P.; Blake, S.A.; Armstrong, M.; Dowdy, A.J.; Sharples, J.; McRae, R. Climate Change Increases the Potential for Extreme Wildfires. Geophys. Res. Lett. 2019, 46, 8517–8526. [Google Scholar] [CrossRef]
  9. McWethy, D.B.; Schoennagel, T.; Higuera, P.E.; Krawchuk, M.; Harvey, B.J.; Metcalf, E.C.; Schultz, C.; Miller, C.; Metcalf, A.L.; Buma, B. Rethinking Resilience to Wildfire. Nat. Sustain. 2019, 2, 797–804. [Google Scholar] [CrossRef]
  10. Littell, J.S.; Peterson, D.L.; Riley, K.L.; Liu, Y.; Luce, C.H. A Review of the Relationships between Drought and Forest Fire in the United States. Glob. Chang. Biol. 2016, 22, 2353–2369. [Google Scholar] [CrossRef]
  11. Ruffault, J.; Curt, T.; St-Paul, N.M.; Moron, V.; Trigo, R.M. Extreme Wildfire Occurrence in Response to Global Change Type Droughts in the Northern Mediterranean. Nat. Hazards Earth Syst. Sci. 2017, 1–21. [Google Scholar] [CrossRef]
  12. Pausas, J.G.; Keeley, J.E. Evolutionary Ecology of Resprouting and Seeding in Fire-prone Ecosystems. New Phytol. 2014, 204, 55–65. [Google Scholar] [CrossRef]
  13. Le Breton, T.D.; Lyons, M.B.; Nolan, R.H.; Penman, T.; Williamson, G.J.; Ooi, M.K. Megafire-induced Interval Squeeze Threatens Vegetation at Landscape Scales. Front. Ecol. Environ. 2022, 20, 327–334. [Google Scholar] [CrossRef]
  14. EM-DAT; CRED; UCLouvain, Brussels EM-DAT CRED. Available online: https://www.emdat.be (accessed on 20 January 2024).
  15. Linley, G.D.; Jolly, C.J.; Doherty, T.S.; Geary, W.L.; Armenteras, D.; Belcher, C.M.; Bliege Bird, R.; Duane, A.; Fletcher, M.; Giorgis, M.A. What Do You Mean,‘Megafire’? Glob. Ecol. Biogeogr. 2022, 31, 1906–1922. [Google Scholar] [CrossRef]
  16. Singleton, M.P.; Thode, A.E.; Meador, A.J.S.; Iniguez, J.M. Increasing Trends in High-Severity Fire in the Southwestern USA from 1984 to 2015. For. Ecol. Manag. 2019, 433, 709–719. [Google Scholar] [CrossRef]
  17. Weber, K.T.; Yadav, R. Spatiotemporal Trends in Wildfires across the Western United States (1950–2019). Remote Sens. 2020, 12, 2959. [Google Scholar] [CrossRef]
  18. Collins, L.; Bradstock, R.A.; Clarke, H.; Clarke, M.F.; Nolan, R.H.; Penman, T.D. The 2019/2020 Mega-Fires Exposed Australian Ecosystems to an Unprecedented Extent of High-Severity Fire. Environ. Res. Lett. 2021, 16, 044029. [Google Scholar] [CrossRef]
  19. Castellnou, M.; Guiomar, N.; Rego, F.; Fernandes, P.M. Fire Growth Patterns in the 2017 Mega Fire Episode of October 15, Central Portugal. Adv. For. Fire Res. 2018, 447–453. [Google Scholar]
  20. Pliscoff, P.; Folchi, M.; Aliste, E.; Cea, D.; Simonetti, J.A. Chile Mega-Fire 2017: An Analysis of Social Representation of Forest Plantation Territory. Appl. Geogr. 2020, 119, 102226. [Google Scholar] [CrossRef]
  21. Troumbis, A.Y.; Kalabokidis, K.; Palaiologou, P. Diverging Rationalities between Forest Fire Management Services and the General Public after the 21st-Century Mega-Fires in Greece. J. For. Res. 2022, 33, 553–564. [Google Scholar] [CrossRef]
  22. Fidelis, A.; Alvarado, S.T.; Barradas, A.C.S.; Pivello, V.R. The Year 2017: Megafires and Management in the Cerrado. Fire 2018, 1, 49. [Google Scholar] [CrossRef]
  23. Pereira, M.G.; Fernandes, L.S.; Carvalho, S.; Santos, R.B.; Caramelo, L.; Alencoao, A. Modelling the Impacts of Wildfires on Runoff at the River Basin Ecological Scale in a Changing Mediterranean Environment. Environ. Earth Sci. 2016, 75, 392. [Google Scholar] [CrossRef]
  24. Pastor, A.V.; Nunes, J.P.; Ciampalini, R.; Koopmans, M.; Baartman, J.; Huard, F.; Calheiros, T.; Le-Bissonnais, Y.; Keizer, J.J.; Raclot, D. Projecting Future Impacts of Global Change Including Fires on Soil Erosion to Anticipate Better Land Management in the Forests of NW Portugal. Water 2019, 11, 2617. [Google Scholar] [CrossRef]
  25. Kastridis, A.; Margiorou, S.; Sapountzis, M. Check-Dams and Silt Fences: Cost-Effective Methods to Monitor Soil Erosion under Various Disturbances in Forest Ecosystems. Land 2022, 11, 2129. [Google Scholar] [CrossRef]
  26. Pingree, M.R.; Kobziar, L.N. The Myth of the Biological Threshold: A Review of Biological Responses to Soil Heating Associated with Wildland Fire. For. Ecol. Manag. 2019, 432, 1022–1029. [Google Scholar] [CrossRef]
  27. Neary, D.G.; Ryan, K.C.; DeBano, L.F. Wildland Fire in Ecosystems: Effects of Fire on Soils and Water; Gen. Tech. Rep. RMRS-GTR-42-vol. 4; US Department of Agriculture, Forest Service, Rocky Mountain Research Station: Ogden, UT, USA, 2005; Volume 42, 250p. [Google Scholar]
  28. Bond, W.J.; Woodward, F.I.; Midgley, G.F. The Global Distribution of Ecosystems in a World without Fire. New Phytol. 2005, 165, 525–538. [Google Scholar] [CrossRef] [PubMed]
  29. Silveira, J.M.; Louzada, J.; Barlow, J.; Andrade, R.; Mestre, L.; Solar, R.; Lacau, S.; Cochrane, M.A. A Multi-taxa Assessment of Biodiversity Change after Single and Recurrent Wildfires in a Brazilian Amazon Forest. Biotropica 2016, 48, 170–180. [Google Scholar] [CrossRef]
  30. Adams, M.A. Mega-Fires, Tipping Points and Ecosystem Services: Managing Forests and Woodlands in an Uncertain Future. For. Ecol. Manag. 2013, 294, 250–261. [Google Scholar] [CrossRef]
  31. Caon, L.; Vallejo, V.R.; Ritsema, C.J.; Geissen, V. Effects of Wildfire on Soil Nutrients in Mediterranean Ecosystems. Earth-Sci. Rev. 2014, 139, 47–58. [Google Scholar] [CrossRef]
  32. Slingsby, J.A.; Moncrieff, G.R.; Rogers, A.J.; February, E.C. Altered Ignition Catchments Threaten a Hyperdiverse Fire-dependent Ecosystem. Glob. Chang. Biol. 2020, 26, 616–628. [Google Scholar] [CrossRef]
  33. DeBano, L.F.; Neary, D.G.; Ffolliott, P.F. Fire Effects on Ecosystems; John Wiley & Sons: Hoboken, NJ, USA, 1998. [Google Scholar]
  34. Southwell, D.; Legge, S.; Woinarski, J.; Lindenmayer, D.; Lavery, T.; Wintle, B. Design Considerations for Rapid Biodiversity Reconnaissance Surveys and Long-term Monitoring to Assess the Impact of Wildfire. Divers. Distrib. 2022, 28, 559–570. [Google Scholar] [CrossRef]
  35. Gade, M.R.; Gould, P.R.; Peterman, W.E. Habitat-Dependent Responses of Terrestrial Salamanders to Wildfire in the Short-Term. For. Ecol. Manag. 2019, 449, 117479. [Google Scholar] [CrossRef]
  36. Bradstock, R.A. Effects of Large Fires on Biodiversity in South-Eastern Australia: Disaster or Template for Diversity? Int. J. Wildland Fire 2008, 17, 809. [Google Scholar] [CrossRef]
  37. Legge, S.; Rumpff, L.; Woinarski, J.C.; Whiterod, N.S.; Ward, M.; Southwell, D.G.; Scheele, B.C.; Nimmo, D.G.; Lintermans, M.; Geyle, H.M. The Conservation Impacts of Ecological Disturbance: Time-bound Estimates of Population Loss and Recovery for Fauna Affected by the 2019–2020 Australian Megafires. Glob. Ecol. Biogeogr. 2022, 31, 2085–2104. [Google Scholar] [CrossRef]
  38. Jolly, C.J.; Dickman, C.R.; Doherty, T.S.; van Eeden, L.M.; Geary, W.L.; Legge, S.M.; Woinarski, J.C.; Nimmo, D.G. Animal Mortality during Fire. Glob. Chang. Biol. 2022, 28, 2053–2065. [Google Scholar] [CrossRef] [PubMed]
  39. Kyle, S.C.; Block, W.M. Effects of Wildfire Severity on Small Mammals in Northern Arizona Ponderosa Pine Forests. In Fire and Forest Ecology: Innovative Silviculture and Vegetation Management. Tall Timbers Fire EcologyConference Proceedings, No. 21; Tall Timbers Research Station: Tallahassee, FL, USA, 2000; Volume 21, pp. 163–168. [Google Scholar]
  40. Pastro, L.A.; Dickman, C.R.; Letnic, M. Burning for Biodiversity or Burning Biodiversity? Prescribed Burn vs. Wildfire Impacts on Plants, Lizards, and Mammals. Ecol. Appl. 2011, 21, 3238–3253. [Google Scholar] [CrossRef]
  41. Driscoll, D.A.; Armenteras, D.; Bennett, A.F.; Brotons, L.; Clarke, M.F.; Doherty, T.S.; Haslem, A.; Kelly, L.T.; Sato, C.F.; Sitters, H. How Fire Interacts with Habitat Loss and Fragmentation. Biol. Rev. 2021, 96, 976–998. [Google Scholar] [CrossRef] [PubMed]
  42. Cunillera-Montcusí, D.; Gascón, S.; Tornero, I.; Sala, J.; Àvila, N.; Quintana, X.D.; Boix, D. Direct and Indirect Impacts of Wildfire on Faunal Communities of Mediterranean Temporary Ponds. Freshw. Biol. 2019, 64, 323–334. [Google Scholar] [CrossRef]
  43. Ayars, J.; Kramer, H.A.; Jones, G.M. The 2020 to 2021 California Megafires and Their Impacts on Wildlife Habitat. Proc. Natl. Acad. Sci. USA 2023, 120, e2312909120. [Google Scholar] [CrossRef] [PubMed]
  44. González, T.M.; González-Trujillo, J.D.; Muñoz, A.; Armenteras, D. Effects of Fire History on Animal Communities: A Systematic Review. Ecol. Process. 2022, 11, 11. [Google Scholar] [CrossRef]
  45. Hossack, B.R.; Pilliod, D.S. Amphibian Responses to Wildfire in the Western United States: Emerging Patterns from Short-Term Studies. Fire Ecol. 2011, 7, 129–144. [Google Scholar] [CrossRef]
  46. Chia, E.K.; Bassett, M.; Nimmo, D.G.; Leonard, S.W.; Ritchie, E.G.; Clarke, M.F.; Bennett, A.F. Fire Severity and Fire-Induced Landscape Heterogeneity Affect Arboreal Mammals in Fire-Prone Forests. Ecosphere 2015, 6, 1–14. [Google Scholar] [CrossRef]
  47. Roberts, S.L.; Kelt, D.A.; Van Wagtendonk, J.W.; Miles, A.K.; Meyer, M.D. Effects of Fire on Small Mammal Communities in Frequent-Fire Forests in California. J. Mammal. 2015, 96, 107–119. [Google Scholar] [CrossRef]
  48. Bagne, K.E.; Finch, D.M. Response of Small Mammal Populations to Fuel Treatment and Precipitation in a Ponderosa Pine Forest, New Mexico. Restor. Ecol. 2010, 18, 409–417. [Google Scholar] [CrossRef]
  49. Converse, S.J.; White, G.C.; Block, W.M. Small Mammal Responses to Thinning and Wildfire in Ponderosa Pine–Dominated Forests of the Southwestern United States. J. Wildl. Manag. 2006, 70, 1711–1722. [Google Scholar] [CrossRef]
  50. Otto, C.R.V.; Kroll, A.J.; McKenny, H.C. Amphibian Response to Downed Wood Retention in Managed Forests: A Prospectus for Future Biomass Harvest in North America. For. Ecol. Manag. 2013, 304, 275–285. [Google Scholar] [CrossRef]
  51. Todd, B.D.; Luhring, T.M.; Rothermel, B.B.; Gibbons, J.W. Effects of Forest Removal on Amphibian Migrations: Implications for Habitat and Landscape Connectivity. J. Appl. Ecol. 2009, 46, 554–561. [Google Scholar] [CrossRef]
  52. Beranek, C.T.; Hamer, A.J.; Mahony, S.V.; Stauber, A.; Ryan, S.A.; Gould, J.; Wallace, S.; Stock, S.; Kelly, O.; Parkin, T. Severe Wildfires Promoted by Climate Change Negatively Impact Forest Amphibian Metacommunities. Divers. Distrib. 2023, 29, 785–800. [Google Scholar] [CrossRef]
  53. Hossack, B.R.; Eby, L.A.; Guscio, C.G.; Corn, P.S. Thermal Characteristics of Amphibian Microhabitats in a Fire-Disturbed Landscape. For. Ecol. Manag. 2009, 258, 1414–1421. [Google Scholar] [CrossRef]
  54. Santos, X.; Belliure, J.; Gonçalves, J.F.; Pausas, J.G. Resilience of Reptiles to Megafires. Ecol. Appl. 2022, 32, e2518. [Google Scholar] [CrossRef]
  55. Wilgers, D.J.; Horne, E.A. Effects of Different Burn Regimes on Tallgrass Prairie Herpetofaunal Species Diversity and Community Composition in the Flint Hills, Kansas. J. Herpetol. 2006, 40, 73–84. [Google Scholar] [CrossRef]
  56. Barrile, G.M.; Chalfoun, A.D.; Estes-Zumpf, W.A.; Walters, A.W. Wildfire Influences Individual Growth and Breeding Dispersal, but Not Survival and Recruitment in a Montane Amphibian. Ecosphere 2022, 13, e4212. [Google Scholar] [CrossRef]
  57. INEGI. Censo Población y Vivienda 2020; INEGI: Aguascalientes, Mexico, 2020.
  58. INEGI. Producto Interno Bruto por Entidad Federativa (PIBE); INEGI: Aguascalientes, Mexico, 2023; p. 12.
  59. Godinez-Tovar, A.G.; Lopez-Gutierrez, M.; Becerril-Piña, R.; Mastachi-Loza, C.A. Influencia Del Cambio Del Uso de Suelo Sobre La Dinámica de La Precipitación. Caso de Estudio: Curso Alto de La Cuenca Alta Del Río Lerma, México. In Geología Ambiental y Recursos Hídricos; Cromberger Editores e Impresores, S.A. de C.V.: Mexico City, Mexico, 2023; Volume 37, pp. 349–364. ISBN 978-607-589-210-8. [Google Scholar]
  60. Monroy-Vilchis, O.; Luna-Gil, A.A.; Endara-Agramont, A.R.; Zarco-González, M.M.; González-Desales, G.A. Nevado de Toluca: Habitat for Romerolagus Diazi? Anim. Biodivers. Conserv. 2020, 43, 115–121. [Google Scholar] [CrossRef]
  61. Aguilar, X.; Casas, G. Secretaría del Medio Ambiente Anfibios y Reptiles. In Biodiversidad del Estado de México: Estudio de Estado; Secretaría del Medio Ambiente, Ed.; Gobierno del Estado de México y Comisión para el Conocimiento y Uso de la Biodiversidad: Toluca, Mexico, 2009; pp. 125–130. [Google Scholar]
  62. INEGI. Conjunto de Datos Vectoriales de Uso de Suelo y Vegetación Escala 1:250 000, Serie V; NEGI: Aguascalientes, Mexico, 2013.
  63. Gonzalez-Fernandez, A.; Segarra, J.; Sunny, A.; Couturier, S. Forest Cover Loss in the Nevado de Toluca Volcano Protected Area (Mexico) after the Change to a Less Restrictive Category in 2013. Biodivers. Conserv. 2022, 31, 871–894. [Google Scholar] [CrossRef]
  64. SEMARNAT. Sistema Nacional de Información Ambiental y de Recursos Naturales; SNIARN: Mexico City, Mexico, 2024. [Google Scholar]
  65. Crichton, D. The Risk Triangle in Natural Disaster Management; Tudor Rose: London, UK, 1999. [Google Scholar]
  66. Crichton, D. UK and Global Insurance Responses to Flood Hazard. Water Int. 2002, 27, 119–131. [Google Scholar] [CrossRef]
  67. Katti, S.K.; Rao, A.V. Handbook of the Poisson Distribution; Taylor & Francis Group: Abingdon, UK, 1968. [Google Scholar]
  68. CONABIO. Sistema Nacional de Información Sobre Biodiversidad (SNIB); Registros de Ejemplares; CONABIO: Mexico City, Mexico, 2024. [Google Scholar]
  69. Lange, H.J.D.; Lahr, J.; Van der Pol, J.J.; Wessels, Y.; Faber, J.H. Ecological Vulnerability in Wildlife: An Expert Judgment and Multicriteria Analysis Tool Using Ecological Traits to Assess Relative Impact of Pollutants. Environ. Toxicol. Chem. Int. J. 2009, 28, 2233–2240. [Google Scholar] [CrossRef]
  70. Leverington, F.; Costa, K.L.; Pavese, H.; Lisle, A.; Hockings, M. A Global Analysis of Protected Area Management Effectiveness. Environ. Manag. 2010, 46, 685–698. [Google Scholar] [CrossRef] [PubMed]
  71. IUCN. IUCN Red List Categories and Criteria, Version 3.1, 2nd ed.; IUCN: Gland, Switzerland, 2012; ISBN 978-2-8317-1435-6. [Google Scholar]
  72. CONABIO; CONANP; PNUD. Corredores Bioclimáticos Para La Conservación de La Biodiversidad. 2019. Mexico City, Mexico. Available online: http://www.conabio.gob.mx/informacion/gis/?vns=gis_root/region/prioridad/clccrecgw (accessed on 3 April 2024).
  73. Jung, M. LecoS—A Python Plugin for Automated Landscape Ecology Analysis. Ecol. Inform. 2016, 31, 18–21. [Google Scholar] [CrossRef]
  74. QGIS Development Team QGIS Geographic Information System. Open source Geospatial Foundation Project. Available online: http://qgis.org (accessed on 25 March 2020).
  75. Mastachi-Loza, C.A.; Becerril-Piña, R.; Gómez-Albores, M.A.; Díaz-Delgado, C.; Romero-Contreras, A.T.; Garcia-Aragon, J.A.; Vizcarra-Bordi, I. Regional Analysis of Climate Variability at Three Time Scales and Its Effect on Rainfed Maize Production in the Upper Lerma River Basin, Mexico. Agric. Ecosyst. Environ. 2016, 225, 1–11. [Google Scholar] [CrossRef]
  76. Luna-Vega, I.; Alcántara-Ayala, O.; García-Morales, L.J.; Espinosa, D.; Ramírez-Martínez, J.C.; Contreras-Medina, R. Threatened Trees Characteristic of Mexican Tropical Montane Cloud Forests. Diversity 2022, 15, 42. [Google Scholar] [CrossRef]
  77. Strachinis, I. The Herpetofauna of the Peri-Urban Forest Seich Sou (Kedrinos Lofos), Thessaloniki, Greece. Ecol. Balk. 2023, 15, 1–7. [Google Scholar]
  78. Glickman, D.; Babbitt, B. Urban Wildland Interface Communities within the Vicinity of Federal Lands That Are at High Risk from Wildfire. Fed. Regist. 2001, 66, 751–777. [Google Scholar]
  79. Cobos, E.P. Zona Metropolitana Del Valle de México: Neoliberalismo y Contradicciones Urbanas. Sociologias 2016, 18, 54–89. [Google Scholar] [CrossRef]
  80. CITES. Estado de Conservación, Uso, Gestión y Comercio de Las Especies Del Género Abronia Que Se Distribuyen En México; Vigésimo Séptima Reunión Del Comité de Fauna Veracruz: Veracruz, Mexico, 2014; Volume 23. [Google Scholar]
  81. Cruz-Sáenz, D.; Vázquez, S.G.; Lazcano, D. Notes on the Herpetofauna of Western Mexico 13: Effects of Wildfires on the Reptile Community in the Natural Protected Area “La Primavera,” in Jalisco, Mexico. Bull. Chic. Herp. Soc. 2015, 50, 96–100. [Google Scholar]
  82. Moreira, F.; Russo, D. Modelling the Impact of Agricultural Abandonment and Wildfires on Vertebrate Diversity in Mediterranean Europe. Landsc. Ecol. 2007, 22, 1461–1476. [Google Scholar] [CrossRef]
  83. Pianka, E.R.; Goodyear, S.E. Lizard Responses to Wildfire in Arid Interior Australia: Long-Term Experimental Data and Commonalities with Other Studies. Austral Ecol. 2012, 37, 1–11. [Google Scholar] [CrossRef]
  84. SEMARNAT. Programa de Acción Para La Conservación de Las Especies Abronia (Abronia spp) En México; SNIARN: Mexico City, Mexico, 2018. [Google Scholar]
  85. Setser, K.; Cavitt, J.F. Effects of Burning on Snakes in Kansas, USA, Tallgrass Prairie. Nat. Areas J. 2003, 23, 315–319. [Google Scholar]
  86. Woinarski, J.C.; Armstrong, M.; Price, O.; McCartney, J.; Griffiths, A.D.; Fisher, A. The Terrestrial Vertebrate Fauna of Litchfield National Park, Northern Territory: Monitoring over a 6-Year Period and Response to Fire History. Wildl. Res. 2005, 31, 587–596. [Google Scholar] [CrossRef]
  87. Hossack, B.R.; Lowe, W.H.; Corn, P.S. Rapid Increases and Time-Lagged Declines in Amphibian Occupancy after Wildfire. Conserv. Biol. 2013, 27, 219–228. [Google Scholar] [CrossRef]
  88. García, S.; Monroy-Vilchis, O.; Fajardo, V.; Aguilera-Reyes, U. Genetic Diversity and Structure of an Endemic and Critically Endangered Stream River Salamander (Caudata: Ambystoma Leorae) in Mexico. Conserv. Genet. 2014, 15, 49–59. [Google Scholar]
  89. Hossack, B.R.; Lowe, W.H.; Honeycutt, R.K.; Parks, S.A.; Corn, P.S. Interactive Effects of Wildfire, Forest Management, and Isolation on Amphibian and Parasite Abundance. Ecol. Appl. 2013, 23, 479–492. [Google Scholar] [CrossRef]
  90. Monroy Vilchis, O.; Zarco Gonzalez, M.; Dominguez Vega, H.; Garcia Aguilar, A.S. Ambystoma Leorae (Taylor, 1943). New Records, Natural History Notes and Threat Status. Short Note Herpetozoa 2015, 30, 166–168. [Google Scholar]
  91. Romo-Vázquez, E.; León-Paniagua, L.; Sánchez, O. A New Species of Habromys (Rodentia: Neotominae) from México. Proc. Biol. Soc. Wash. 2005, 118, 605–618. [Google Scholar] [CrossRef]
  92. Velázquez, A.; Romero, F.J.; León, L.V.I. Fragmentación Del Hábitat Del Conejo Zacatuche. In Ecología y Conservación Del Conejo Zacatuche y Su Hábitat; Velázquez, A., Romero, F.J., López-Paniagua, Y.J., Eds.; Universidad Nacional Autónoma de México-Fondo de Cultura Económica: Mexico City, Mexico, 1996; pp. 73–86. [Google Scholar]
  93. Granados, H. Basic Information on the Vokano Rabbit Ln: Proceedings of the World Lagomorph Conference, Guelph 1979 (Fcis K. Myers and CA Maclnnes); University of Guelph: Guelph, ON, Canada, 1981. [Google Scholar]
  94. Cervantes, F.A.; Barrera, C.B. Estudios Sobre La Biología de Roedores Silvestres Mexicanos; Universidad Nacional Autónoma de México: Ciudad de México, México, 2012. [Google Scholar]
  95. Rizo-Aguilar, A.; Guerrero, J.A.; Hidalgo-Mihart, M.G.; González-Romero, A. Relationship between the Abundance of the Endangered Volcano Rabbit Romerolagus Diazi and Vegetation Structure in the Sierra Chichinautzin Mountain Range, Mexico. Oryx 2015, 49, 360–365. [Google Scholar] [CrossRef]
  96. Matthews, J.M. Effects of Wildfire Intensity on Invasives, Stand Structure and Fuel Loading in Shenandoah National Park. Ph.D. Thesis, Virginia Tech, Blacksburg, VA, USA, 2004. [Google Scholar]
Figure 1. Distribution of land use categories in the State of Mexico, Central Mexico.
Fire 07 00134 g001
Figure 2. Temporal dynamics of fires in Mexico, boxplot indicates the occurrence of fires by State and the line represents the area burned. The State of Mexico has the highest number of fires, although the burnt area is small (Database: SEMARNAT-SNIARN, 2023).
Fire 07 00134 g002
Figure 3. Methodological framework to determine biodiversity at risk due to habitat degradation caused by wildfires in the State of Mexico. Hazard: calculated from the Poisson probability mass function. Exposure: areas with natural vegetation (assumed to be the natural habitat of amphibians, mammals and reptiles). Vulnerability: calculated from the weighted and normalized α-diversity for each taxonomic group.
Fire 07 00134 g003
Figure 4. Wildfire hazard map in the State of Mexico, showing 1 km2 pixels, where values closer to 1 have a higher probability of wildfire occurrence.
Fire 07 00134 g004
Figure 5. α-diversity of amphibians (a), mammals (b) and reptiles (c). Total vulnerability values (d) of species studied in the State of Mexico in natural vegetation zones, normalized by a fuzzy linear membership function and defined from minimum and maximum values of Mexican Republic.
Fire 07 00134 g005
Figure 6. Potential map of biodiversity at risk by habitat degradation due to wildfire. Bioclimatic corridors generated by CONABIO (2019) are shown, where values closest to −1 represent the optimal routes within the corridors, and values close to 200 are located towards the edges, representing the most exposed areas.
Fire 07 00134 g006
Table 1. Species and their risk from the Red List, present in the natural areas affected by the occurrence of wildfires for the period 2005–2016 (species records were taken from the Gbif database https://www.gbif.org/ (accessed on 10 March 2020).
CategoryNameLast RecordRecords in the Last 30 YearsNatural Inhabited Area (km2)Natural Area Burned (km2)% Natural Area Burned
AmphibiansCRAmbystoma bombypellum20163131.240.690.52
Ambystoma granulosum19977374.303.044.09
Ambystoma leorae20186426.5752.7912.37
Lithobates tlaloci----45.701.844.02
Pseudoeurycea robertsi201820318.4322.707.13
ENAmbystoma altamirani201957565.1842.697.55
Ambystoma lermaense2011648.970.000.00
Ambystoma ordinarium----863.9263.127.31
Craugastor hobartsmithi1997794.843.333.51
Plectrohyla pentheter----1345.6414.011.04
Pseudoeurycea longicauda201447110.573.803.44
Pseudoeurycea tlilicxitl20152742.4565.418.81
VUChiropterotriton orculus2019211201.878.898.89
Isthmura bellii201976782.87343.605.07
NTAquiloeurycea cephalica----1221.2695.337.81
Lithobates neovolcanicus20187257.679.963.87
MammalsCRHabromys schmidlyi200624.020.00.0
ENLeptonycteris nivalis20001810,238.87395.513.86
Romerolagus diazi201823978.95109.1611.15
VULeptonycteris yerbabuenae20192810,238.87395.513.86
Sigmodon alleni----220.180.450.20
NTChoeronycteris mexicana2019110,238.87395.513.86
Corynorhinus mexicanus2009119981.36395.063.96
Leopardus wiedii----1435.2710.550.74
Lepus callotis----10,237.84395.513.86
Microtus quasiater----363.3647.7213.13
ReptilesENAbronia deppii201953093.42174.575.64
Barisia herrerae20161105.173.142.99
Barisia rudicollis2018121437.0298.246.84
Thamnophis melanogaster2019323473.83191.945.53
VUThamnophis scaliger201956673.9744.456.60
NTAgkistrodon bilineatus----218.7917.137.83
Disclaimer/Publisher’s Note: The statements, opinions and data contained in all publications are solely those of the individual author(s) and contributor(s) and not of MDPI and/or the editor(s). MDPI and/or the editor(s) disclaim responsibility for any injury to people or property resulting from any ideas, methods, instructions or products referred to in the content.

