Abstract
To achieve successful prevention of fire incidents originating from human activities, it is imperative to possess a thorough understanding. This paper introduces a machine learning approach, specifically utilizing deep neural networks (DNN), to develop predictive models for fire occurrence in Keelung City, Taiwan. It investigates ten factors across demographic, architectural, and economic domains through spatial analysis and thematic maps generated from geographic information system data. These factors are then integrated as inputs for the DNN model. Through 50 iterations, performance indices including the coefficient of determination (R2), root mean square error (RMSE), variance accounted for (VAF), prediction interval (PI), mean absolute error (MAE), weighted index (WI), weighted mean absolute percentage error (WMAPE), Nash–Sutcliffe efficiency (NS), and the ratio of performance to deviation (RPD) are computed, with average values of 0.89, 7.30 10−2, 89.21, 1.63, 4.90 10−2, 0.97, 2.92 10−1, 0.88, and 4.84, respectively. The model’s predictions, compared with historical data, demonstrate its efficacy. Additionally, this study explores the impact of various urban renewal strategies using the DNN model, highlighting the significant influence of economic factors on fire incidence. This underscores the importance of economic factors in mitigating fire incidents and emphasizes their consideration in urban renewal planning.
1. Introduction
Fire disasters pose prevalent hazards across various regions, including Australia, Canada, the United States, Europe, Japan, and Taiwan [1,2,3,4,5,6]. In the United States, an annual average of 358,500 homes experience structural fires, resulting in over 3000 fatalities each year, according to reports from the National Fire Protection Association and the Federal Emergency Management Agency [7]. Fire incidents are classified based on various causes, including electrical issues, spontaneous combustion of flammable materials, cooking-related accidents, religious activities, construction mishaps, and other factors. The elevated vulnerability of the elderly population to residential fires is identified by Karemaker et al. [8], emphasizing the necessity for tailored interventions to reduce such risks within their residences. According to the research findings of Laban et al. [9], the age of a residential property is typically identified as a key factor contributing to increased fire risk. Additionally, socioeconomic factors related to fire safety are commonly regarded as significant analytical elements for assessing the predicted occurrence rates of community fires [10,11,12].
In 2023, Taiwan reported a total of 17,466 fire incidents [13]. The financial losses incurred by these fires amounted to NTD 620,060,000. Most fire incidents occurred between 9:00 AM and 21:00 PM, indicating a higher frequency during the typical daytime activities of the general population [14,15,16]. Particularly, the Keelung City Fire Bureau reported a total of 115 fire incidents from January to December in 2023 [17]. The analysis of the timing of these fire occurrences revealed that the highest number, 21 cases, transpired between 9:00 and 12:00, representing approximately 18% of the total incidents for the year. Concerning the distribution of fire incidents across administrative districts, Zhongzheng District ranked first with 27 cases, constituting 23% of the total incidents, followed by Qidu District with 23 cases, accounting for 20%. The analysis conducted by the Fire Bureau indicated that electrical factors were the leading cause of ignition, accounting for 44 cases, or 38% of the total incidents [16]. When delving into the reasons behind fires, diverse methodologies, including field surveys, laboratory experiments, and statistical analysis, are often utilized to comprehend the factors underlying fire incidents [17,18,19,20]. To investigate the origins of fire incidents and the characteristics of fires, statistical techniques have been widely employed as inspection methods in various countries [21,22,23]. The factors contributing to fire incidents include average population density, household density, and ratios of elderly population, among others [24]. Moreover, scholars have previously combined geographic information systems (GIS) with statistical methods to reveal spatial patterns and trends related to fires ignited by human activity [25,26]. Furthermore, this combination offers numerous benefits for delineating fire patterns [27].
In recent years, the increasing prevalence of artificial neural network (ANN) methods has led to numerous studies employing ANN to examine the factors behind fire incidents [28,29,30]. A deep neural network (DNN) is distinguished within the realm of ANN by its intricate arrangement of interconnected nodes or neurons spanning multiple layers. It serves as a fundamental element in deep learning, a specialized domain of machine learning focused on constructing and interpreting intricate data patterns using complex hierarchical architectures [31,32]. Previous research has demonstrated that DNN models possess the advantage of adaptability, allowing for the analysis of dynamic and evolving patterns of fire incidents over time. Furthermore, DNN models can be utilized for predictive analysis to anticipate future fire incidents based on historical data and identified patterns [33]. Alkhatib et al. [34] present an overview of how machine learning algorithms are applied in forest fire science. Stand-alone approaches such as ANNs, convolutional neural networks (CNNs), and support vector machine (SVM) are among the machine learning techniques frequently employed [35,36]. Implementing tree-based bagging methods like random forest (RF) can effectively enhance the efficiency of models for fire risk assessment and susceptibility.
However, for tasks that require modeling intricate relationships and patterns in data, ANNs are often favored due to their flexibility, adaptability, and ability. ANNs excel in learning intricate patterns and representations through multiple layers of interconnected neurons. While SVMs are robust for binary classification tasks, they may encounter difficulties with large-scale datasets and complex feature spaces. In contrast, ANNs offer scalability and the capability to handle high-dimensional data effectively [37,38].
Acknowledging the necessity for advanced techniques in fire prevention, this paper introduces a machine learning method, specifically DNN, to develop predictive models for fire incidence. The research integrates ten factors across demographic, architectural, and economic domains, leveraging spatial analysis and thematic maps obtained from GIS. These factors are then employed as inputs for the DNN model. The model’s accuracy is confirmed through validation against historical data, demonstrating its effectiveness. Furthermore, the proposed model is utilized to explore various urban renewal scenarios, revealing the substantial impact of different factors. The structure of this article is outlined as follows: firstly, in Section 1, the study area and datasets are introduced. In Section 2, the predictive models for fire incidents are discussed. This section covers the development of DNN architecture, assessment of loss functions, and performance evaluation. Section 4 presents the results, including validation and prediction. Finally, the key findings of this pioneering work are summarized in Section 5. To highlight the main contributions of the paper, the key contributions of this study are outlined as follows:
- ▪
- A machine learning approach, specifically DNN, is developed for the development of predictive models for fire incidence in Keelung city, Taiwan.
- ▪
- This study investigates the consequences of various urban renewal approaches by utilizing the proposed DNN model to examine scenarios that incorporate these strategies.
- ▪
- Our study underscores the pivotal role of economic factors in significantly reducing fire incidence, emphasizing the importance of addressing these aspects in urban renewal strategies.
2. Study Area and Datasets
2.1. Study Area
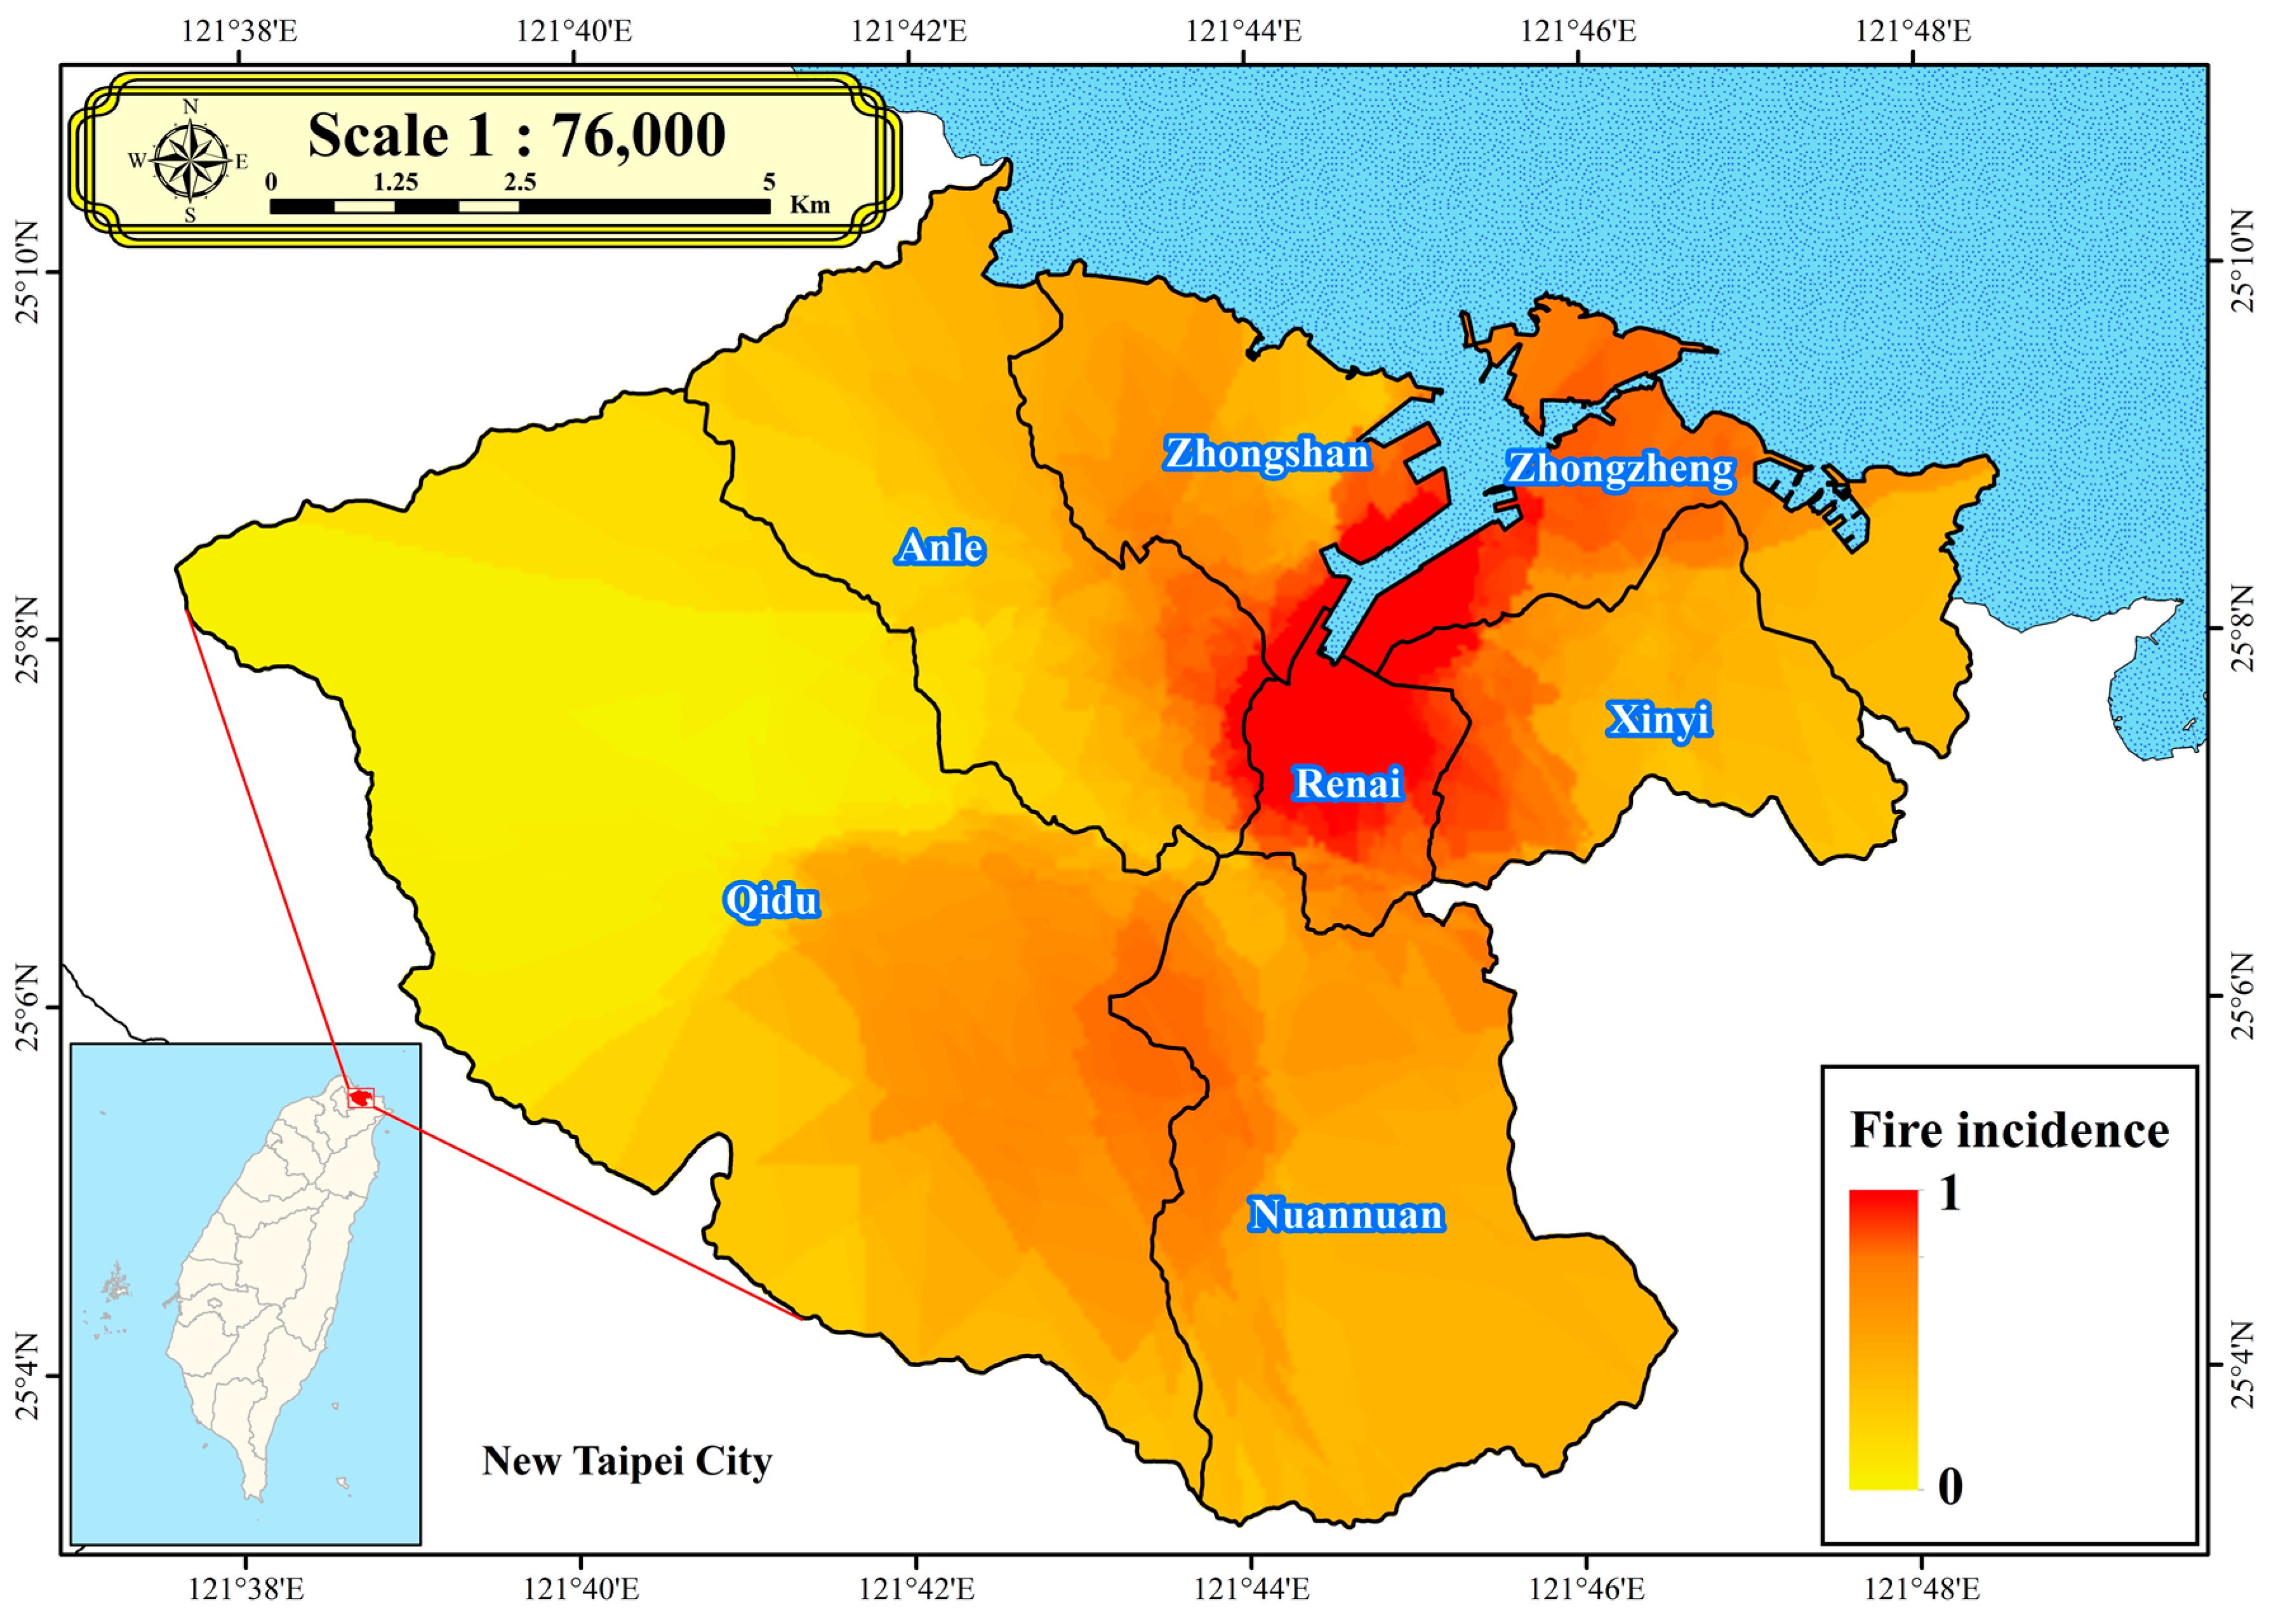
The focus of this study is Keelung City, located at the northernmost point of Taiwan, as illustrated in Figure 1. This study employed ArcGIS 10.8, developed by the Environmental Systems Research Institute (ESRI), which is widely recognized as one of the most commonly used GIS software products globally. Positioned with its northern face towards the East China Sea, it is surrounded by mountains to the east, west, and south, presenting characteristics of a port city. Keelung City consists of seven administrative districts, comprising 157 villages with a total of 156,056 households and a population of approximately 370,000. Among them, Anle District has the highest population, totaling 82,384 people. In terms of population density, Renai District ranks first citywide, followed by Anle and Zhongshan districts, which are more densely populated. Keelung City covers an area of approximately 132.8 square kilometers, with hills and mountains accounting for about 94%, flatlands about 5%, and the remaining area consisting of rivers and lakes.
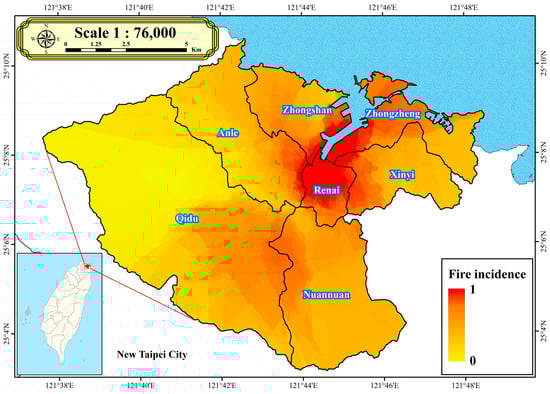
Figure 1.
Normalized fire incidents in Keelung City from 2012 to 2021.
In this study, a data repository is constructed to pinpoint areas at high risk for fire incidents in Keelung City. The initiative involves consolidating data on fire incidents in Keelung City, encompassing details such as the date, time, and location of each event. The historical data on fire incidents are obtained from the Keelung City Fire Bureau.
Figure 1 provides detailed insights into the frequency and spatial distribution of normalized fire incidents throughout Keelung City from 2012 to 2021. Zhongzheng District recorded the highest number of fire incidents, totaling 232 occurrences, followed by Renai District with 179 incidents. Consequently, Figure 1 illustrates that areas with high fire incidence are located in Zhongzheng District and Renai District. However, other administrative districts such as Zhongshan District, Anle District, Qidu District, and Nuannuan District fall within the moderate range of fire incidence, while Xinyi District experienced the lowest number of fire incidents, with only 95 occurrences. This study computed the incidence of fires per household in each neighborhood from 2012 to 2021 and established the fire incidence over the past decade as a factor.
2.2. Datasets
This study collects data from four distinct categories: demographic, architectural, economic, and fire-related data [39,40,41]. The demographic dataset includes information on population demographics, such as statistics on the elderly population, elderly individuals living alone, young age population, and prime-age population. The young age population refers to individuals aged 0–14 [13], while individuals aged 65 and above are considered elderly [42]. These data were sourced from the household registration office and the Department of Social Affairs in 2023 and are formatted in Comma-Separated Value (CSV).
Architectural data consist of variables such as the quantity of real estate properties, real estate properties aged over 40 years, non-reinforced concrete (RC) real estate properties, and non-RC real estate properties aged over 30 years. These data were sourced from the same authorities as the demographic data. The data format is in CSV and Shapefile (SHP). This dataset provides insights into the distribution and quantity of buildings.
Economic data based on the three-sector model, which divides economies into three sectors including the primary, secondary, and tertiary sectors of the economy, were obtained from the Department of Economic Affairs in 2023. These sectors categorize economic activities based on the type of goods produced or services rendered. The primary sector involves activities related to the extraction and production of raw materials directly from the Earth. Examples of activities in this sector include agriculture, fishing, forestry, mining, and natural resource extraction. The secondary sector comprises activities related to the manufacturing and processing of raw materials into finished products. Examples include manufacturing, construction, refining, and processing industries. The tertiary sector comprises activities that provide services rather than goods. Examples include retail, hospitality, healthcare, education, banking, transportation, entertainment, and tourism. The data format for these sectors is in CSV and SHP, allowing for the analysis of the quantity and distribution of industries across the three sectors.
This study investigates and analyzes factors related to fire incidents, as indicated in Table 1. The objective is to explore the correlation between demographic, architectural, economic, and fire data and historical fire incidents to discern factors highly associated with high fire incident density.

Table 1.
Source datasets used in this study.
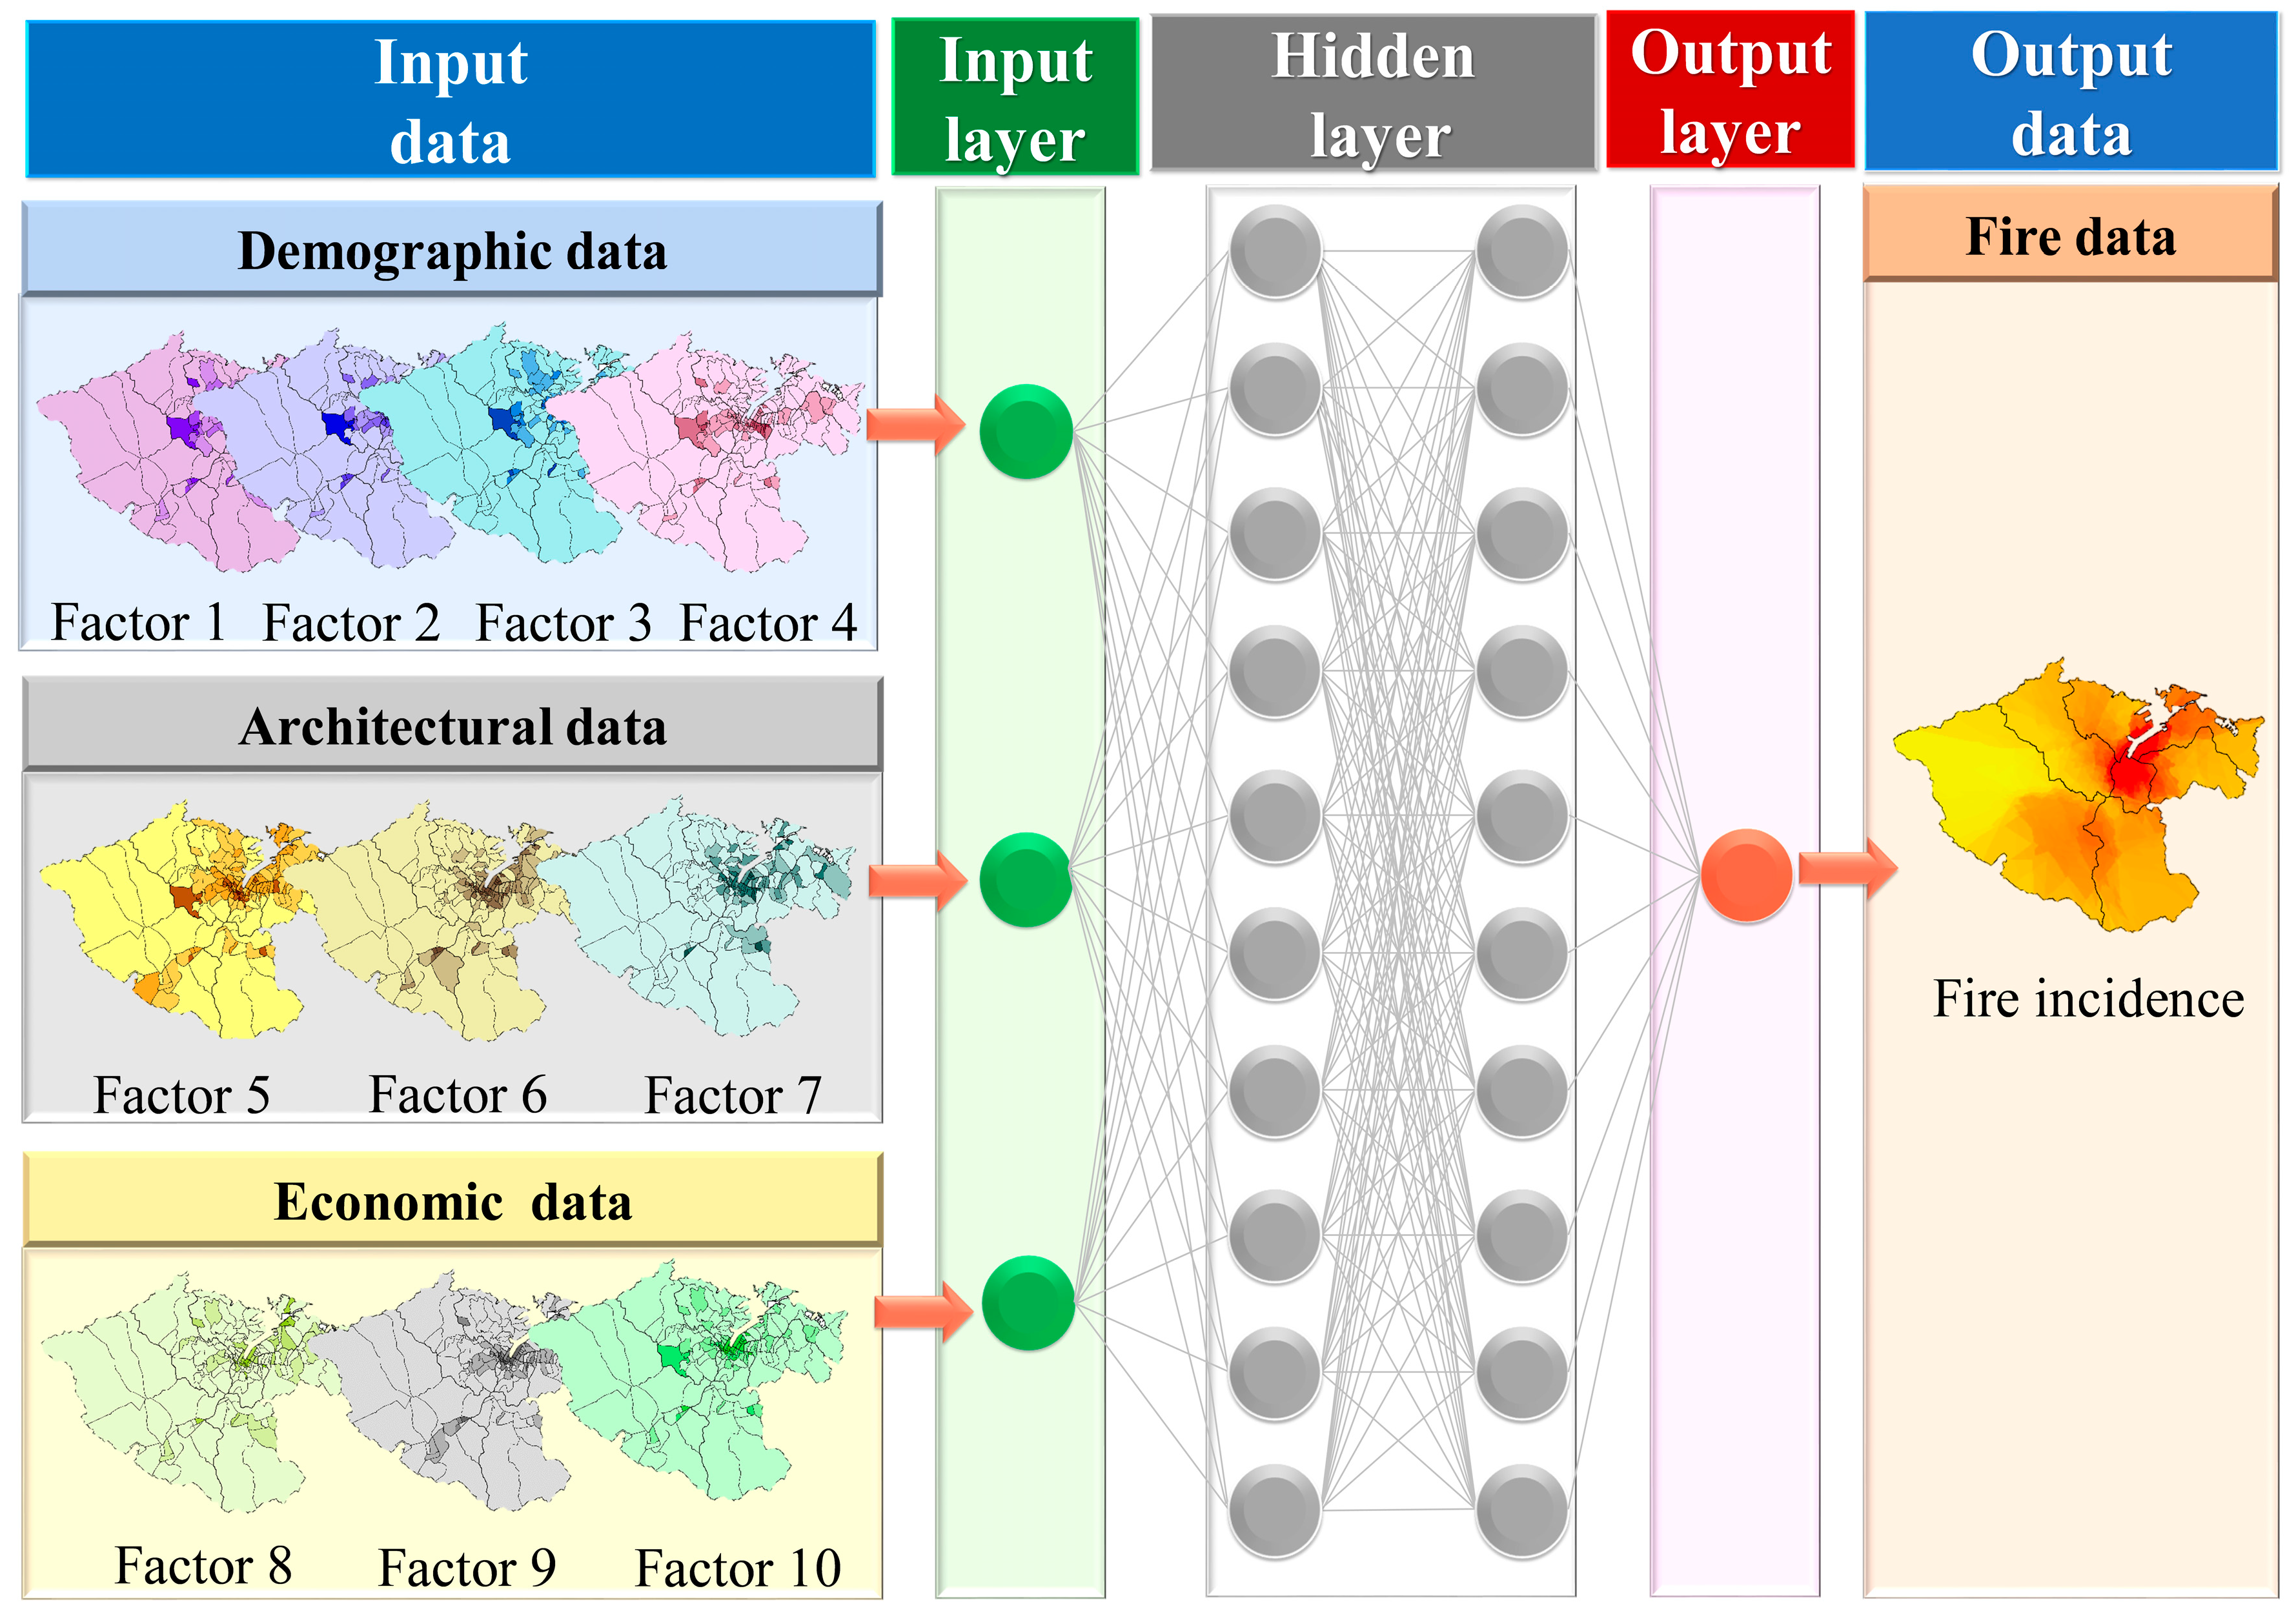
Based on the source datasets used in this study, as shown in Table 1, this study further consolidates Table 2 to identify the factors used in this study. Table 2 displays four categories (demographic data, architectural data, economic data, and fire data), which extend to 11 factors in each village. Within the demographic data category, there are 4 factors: Factor 1 represents inhabitant density, Factor 2 represents elderly inhabitant density, Factor 3 represents elderly living alone inhabitant density, and Factor 4 represents young age inhabitants’ density. The architectural data category comprises 3 factors: Factor 5 represents the quantity of real estate, with “real estate” indicating buildings, Factor 6 is real estates over 40 years old, and Factor 7 is non-RC real estate. The economic data category contains 3 factors: Factor 8 is the primary sector of the economy, Factor 9 is the secondary sector of the economy, and Factor 10 is the tertiary sector of the economy. Fire data yields Factor 11, representing fire incidents in each village.
Table 2.
Factors used in this study.
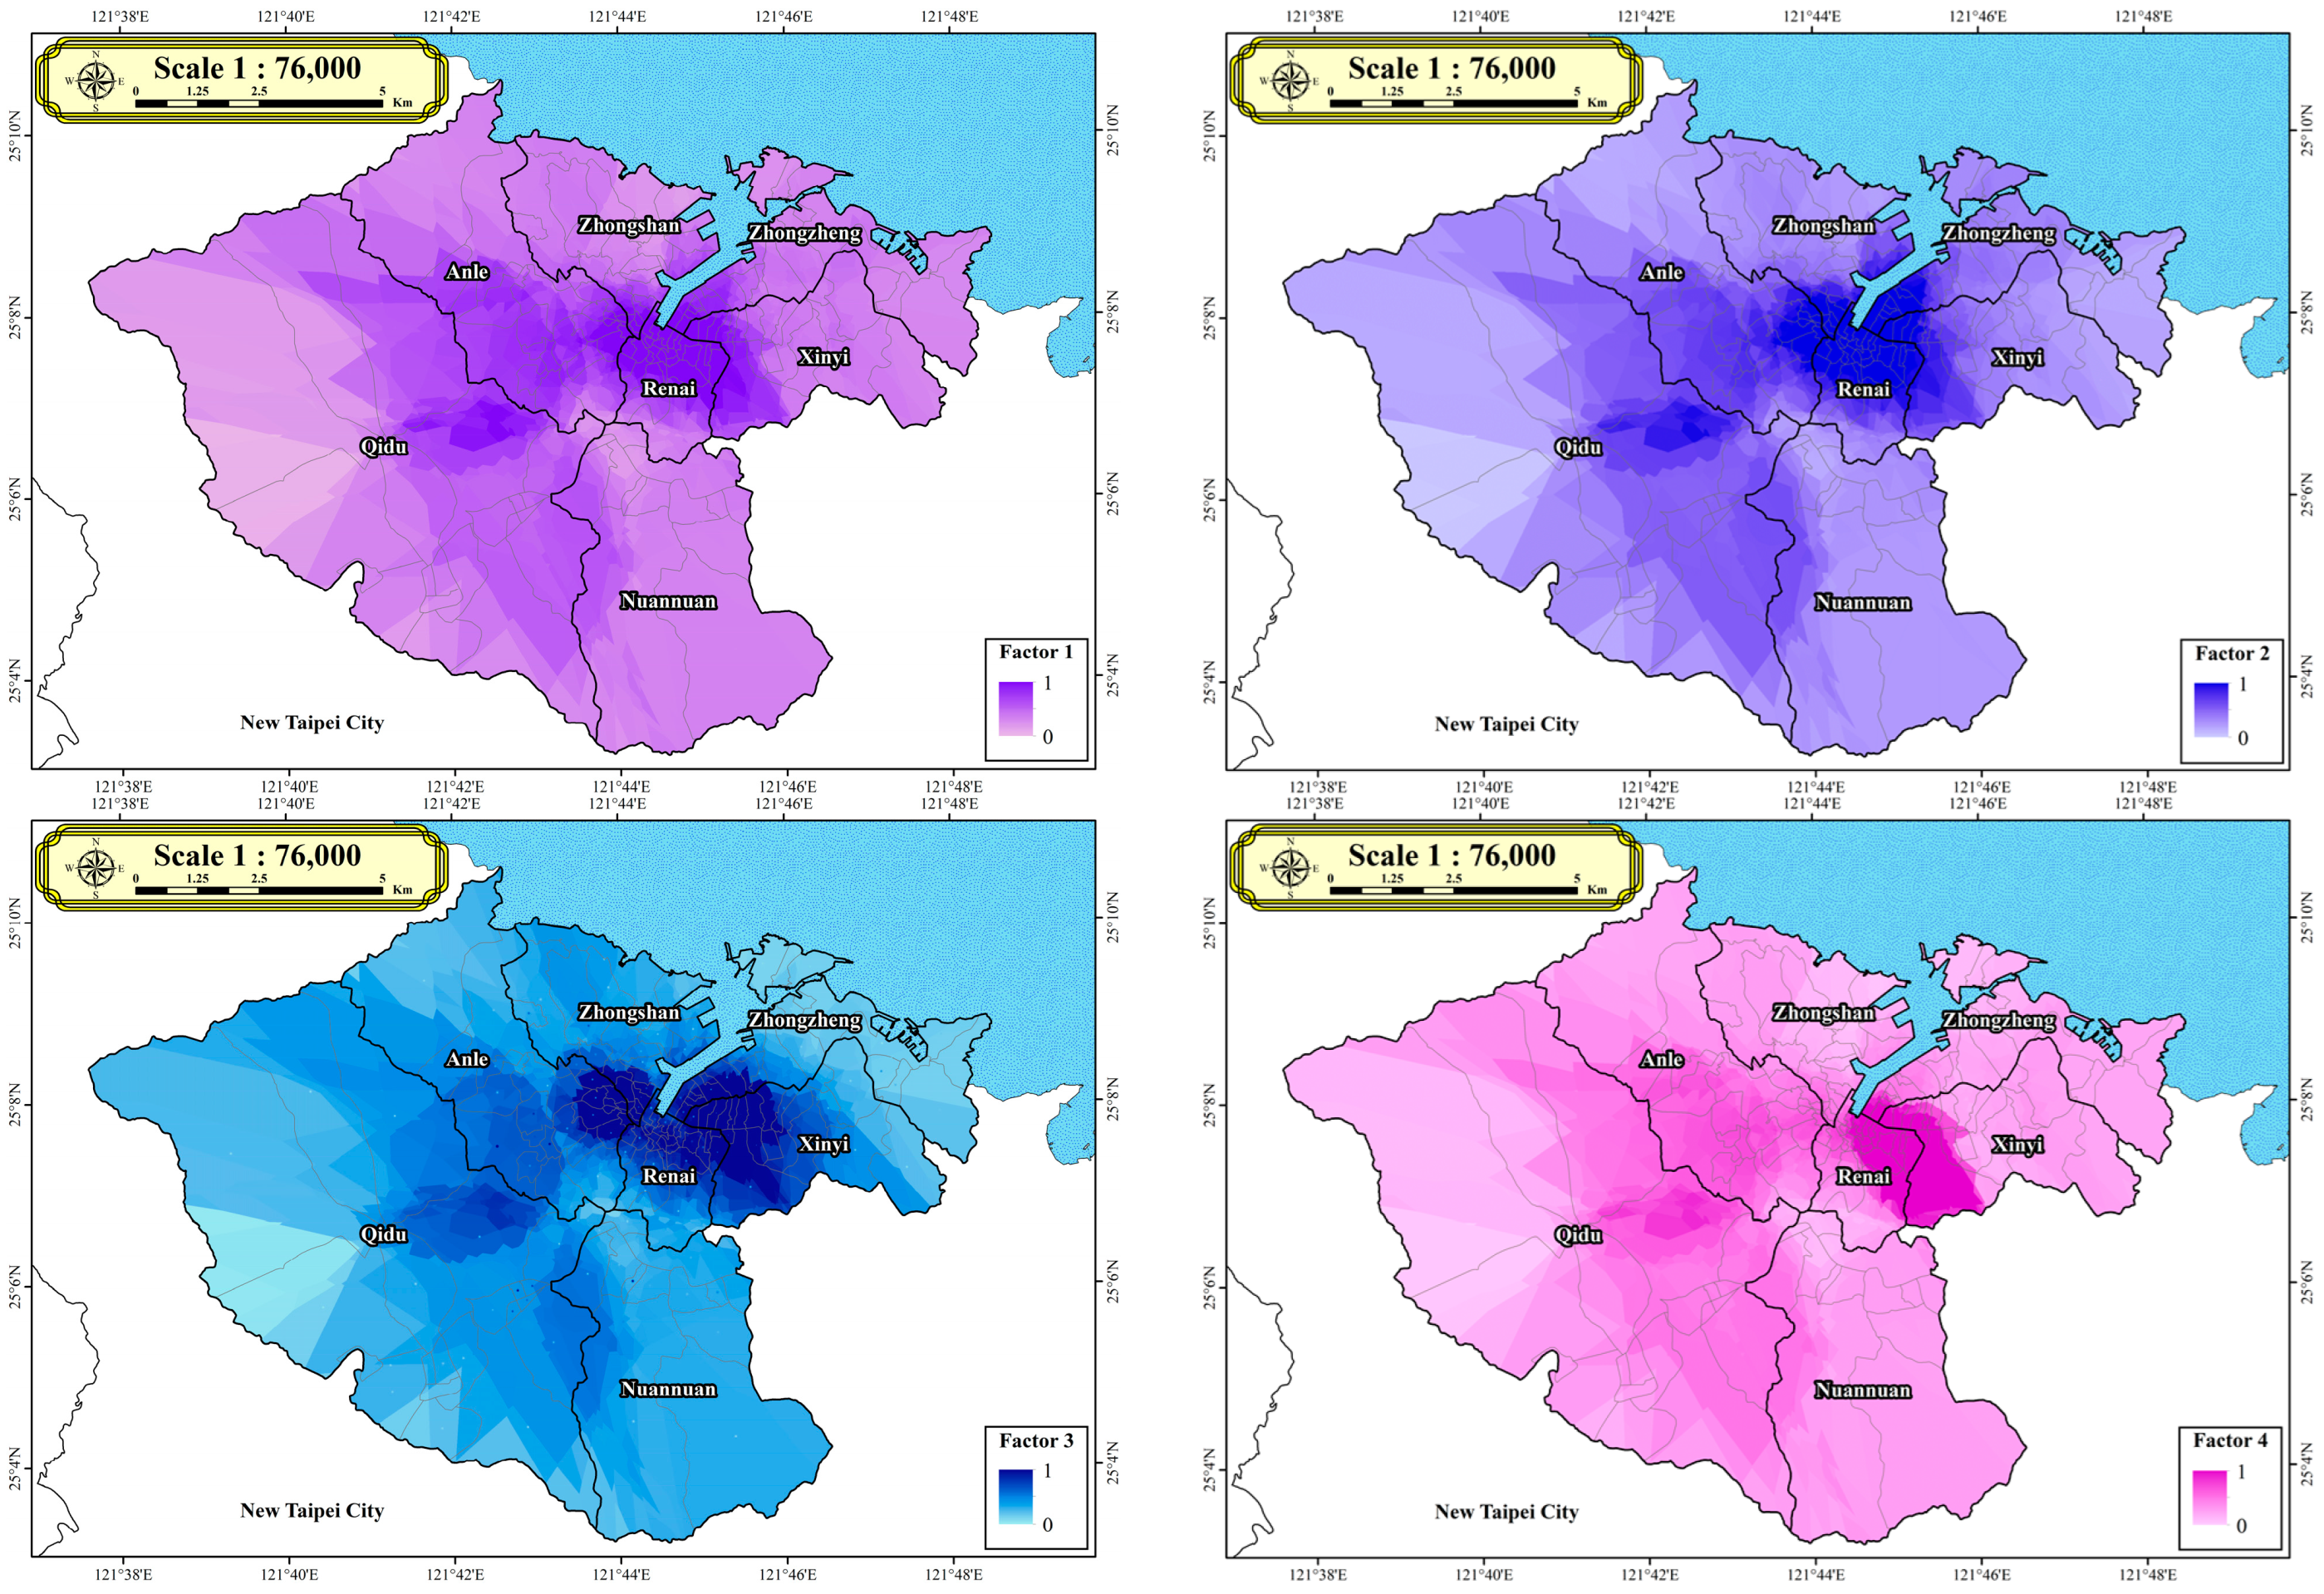
Table 2 provides the definitions and calculation formulas for these factors. The table includes categories, definitions, formulas, and definitions of symbols used in the formulas. These factors are computed for 157 villages in Keelung City, which serve as input for subsequent DNN model analyses. The study initially defines the boundaries of the 157 villages to establish the geographical limits and scope of each village unit. Subsequently, through GIS spatial analysis, point data representing different locations within each village are inputted into every village. This process ensures that the data for the 11 variables across the boundaries of the 157 villages are fully prepared. Definitions for the 11 variables listed in Table 2 are provided below. All the input data utilized in this study have been normalized, as depicted in Figure 2.
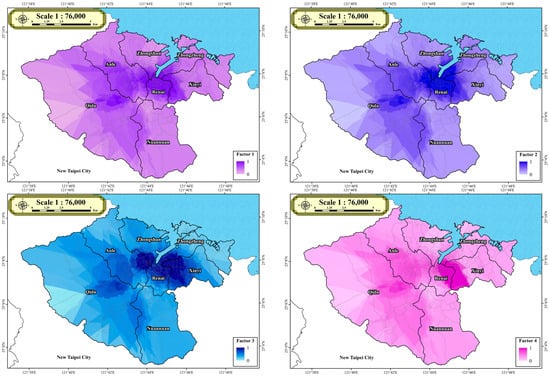
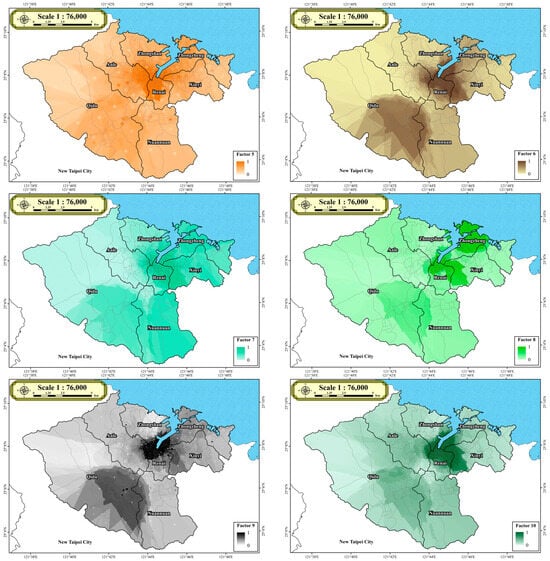
Figure 2.
Normalized input data utilized in this study.
2.2.1. Demographic Data
In this study, demographic data comprise four factors. Factor 1 () represents inhabitant density, Factor 2 () represents elderly inhabitant density, Factor 3 () represents elderly living alone inhabitant density, and Factor 4 () represents young age inhabitants’ density. Factor 1 (inhabitant density) is calculated by dividing the number of inhabitants in each village () by the area of each village (). Factor 2 (elderly inhabitants) is defined as the number of elderly inhabitants in each village () divided by the area of each village (). Factor 3 (elderly living alone inhabitants) is defined as the number of elderly living alone inhabitants in each village () divided by the area of each village (). Factor 4 (young age inhabitants) is defined as the number of young age inhabitants in each village () divided by the area of each village ().
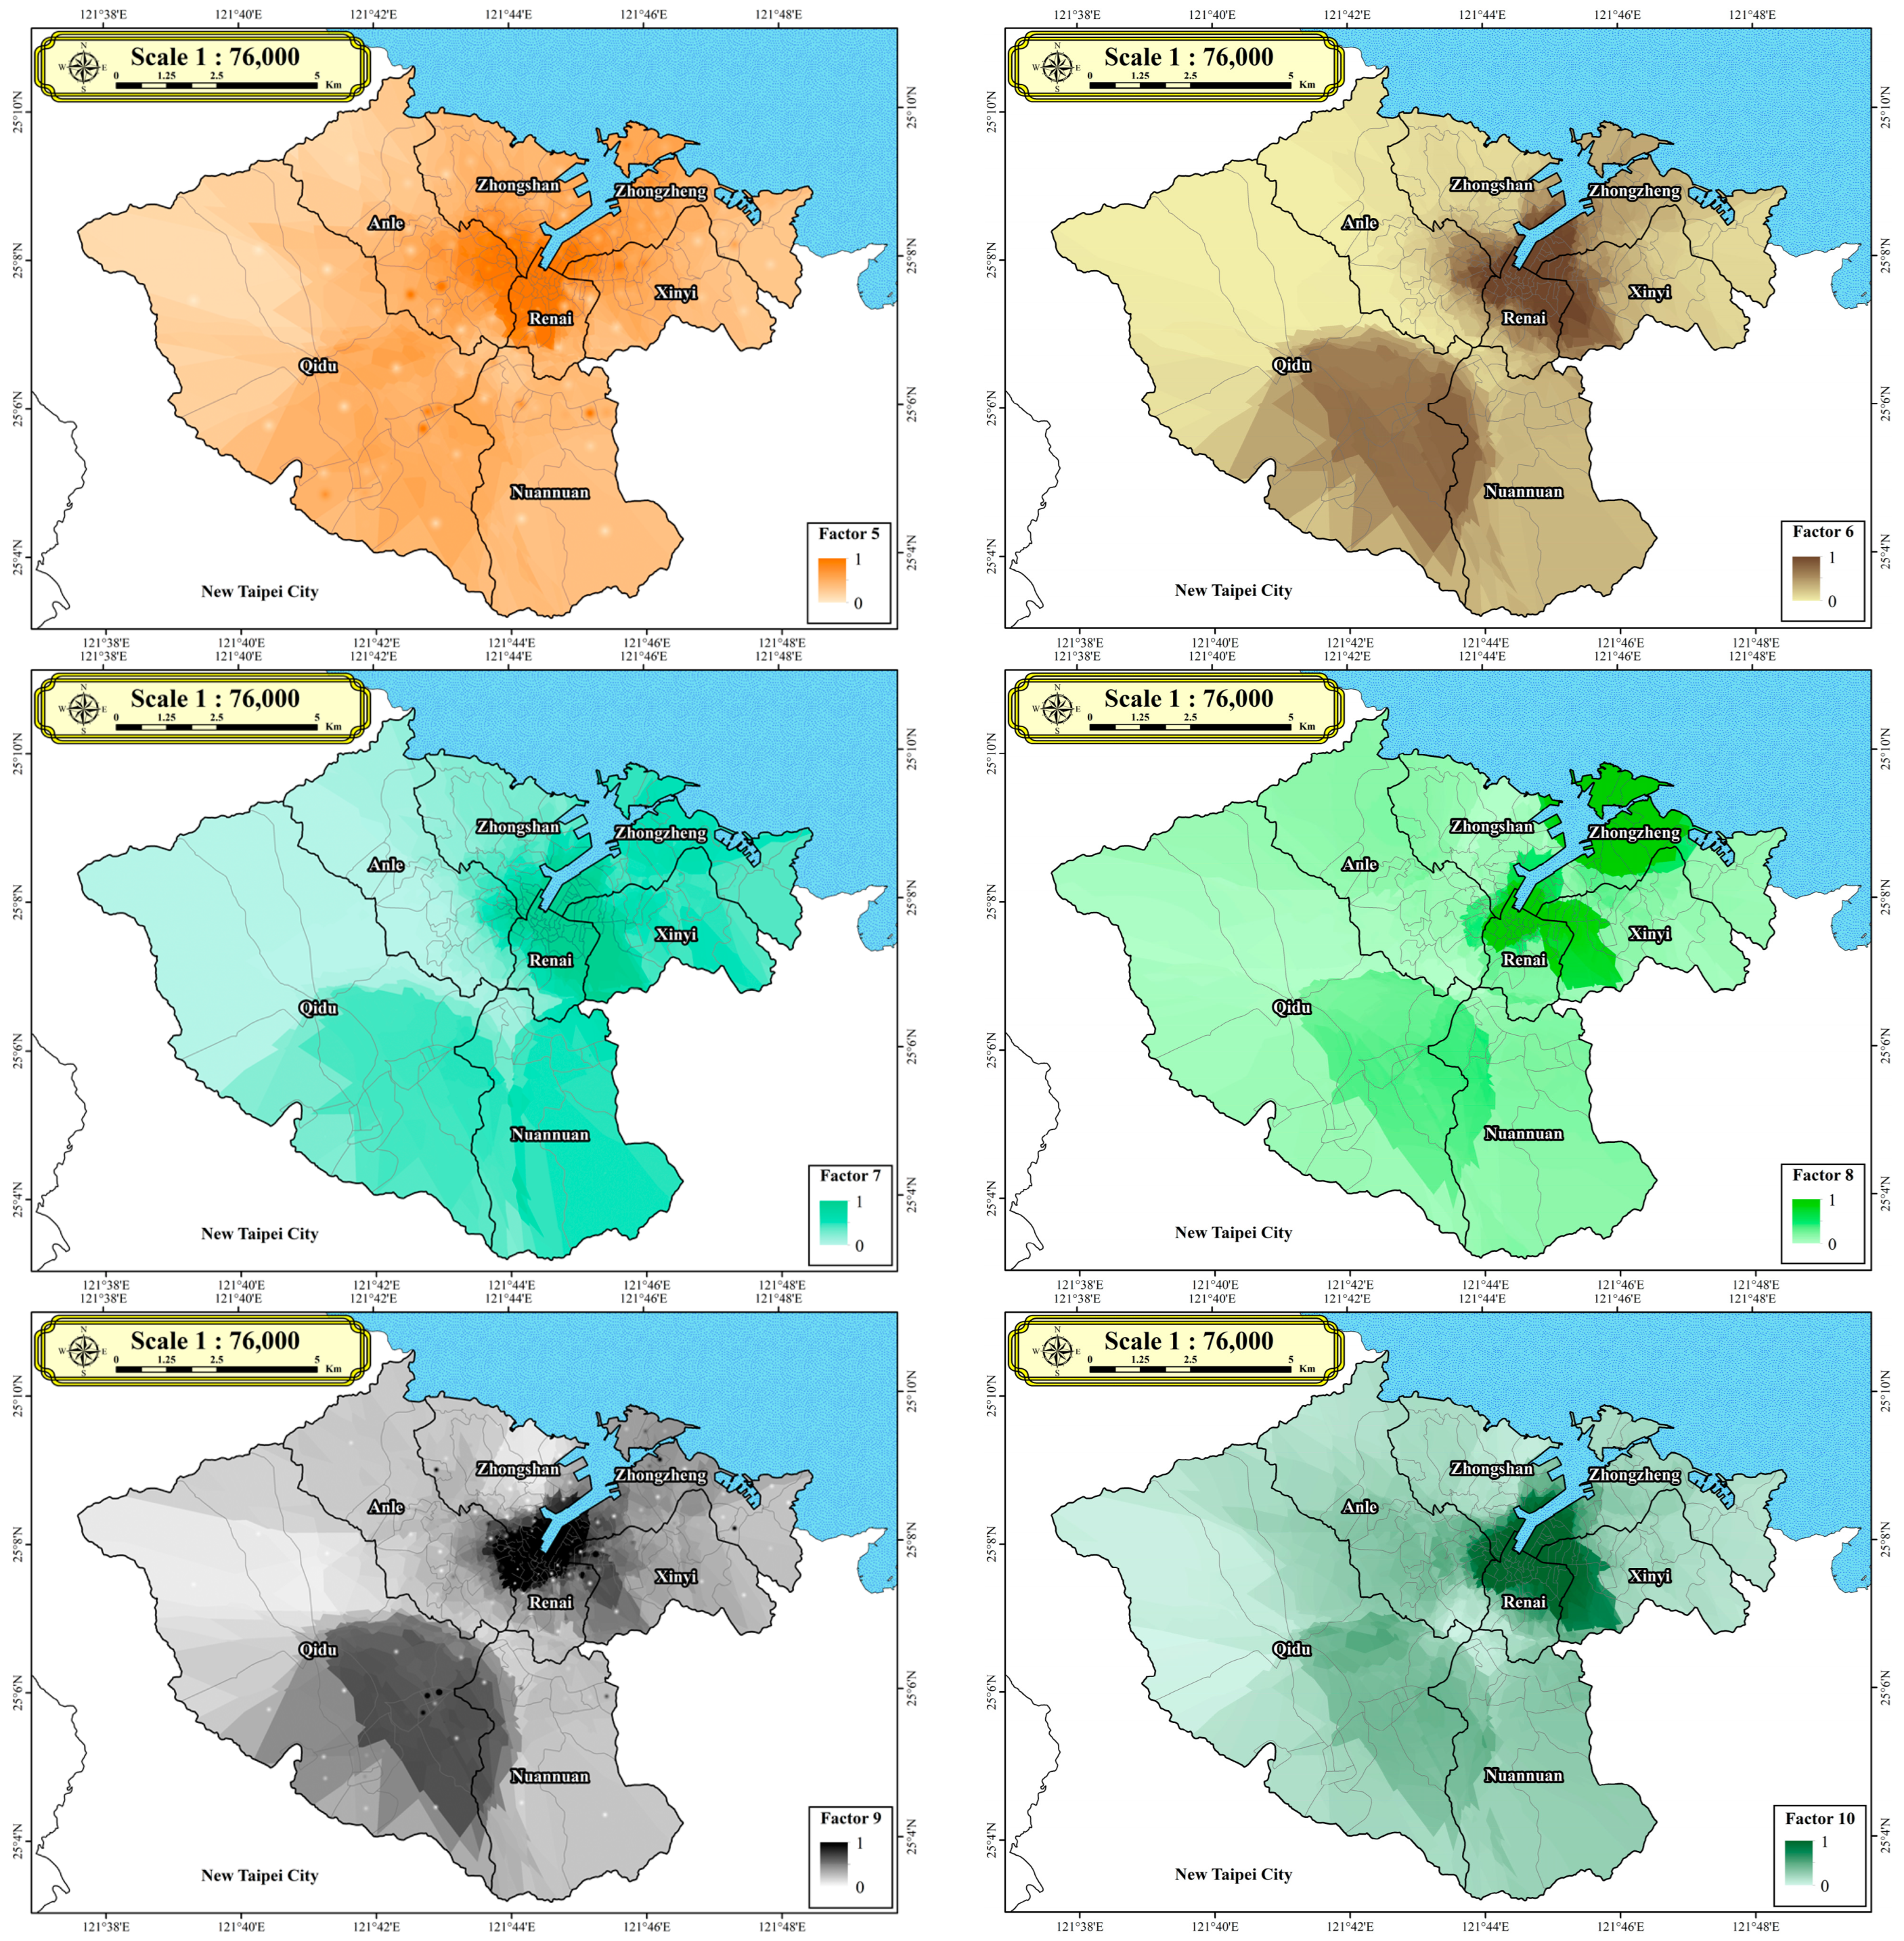
2.2.2. Architectural Data
Architectural data in this study includes three factors. Factor 5 () represents the number of real estates, Factor 6 () represents real estates over 40 years old, and Factor 7 () represents non-RC real estates. Factor 5 (number of real estates) is computed by dividing the number of real estates in each village () by the area of each village (). Factor 6 (real estates over 40 years old) is defined as the number of real estates over 40 years old in each village () divided by the area of each village (). Factor 7 (non-RC real estates) is defined as the number of non-RC real estates in each village () divided by the area of each village ().
2.2.3. Economic Data
In this study, economic data encompasses three factors. Factor 8 () represents the primary sector of the economy, Factor 9 () represents the secondary sector of the economy, and Factor 10 () represents the tertiary sector of the economy. Factor 8 (primary sector of the economy) is determined by dividing the number of primary sector establishments in each village () by the area of each village (). Factor 9 (secondary sector of the economy) is defined as the number of secondary sector establishments in each village () divided by the area of each village (). Factor 10 (tertiary sector of the economy) is defined as the number of tertiary sector establishments in each village () divided by the area of each village ().
2.2.4. Fire Data
Regarding historical fire data, this study utilizes ten years of historical fire data from the Keelung City Fire Department [17], spanning from 2012 to 2021, comprising a total of 1095 fire incidents. Among these, the analysis focuses primarily on 811 indoor fire incidents, excluding fires unrelated to buildings. Fire density () for each village is calculated by dividing the number of fire incidents in each village over the past decade () by the area of each village (). The definition of the fire density is as Equation (1).
where denotes the fire density for each village, denotes the number of fire incidents in each village over the past decade, and denotes the area of each village (measured in square meter).
3. Predictive Models for Fire Incident
This study employs a machine learning methodology, particularly emphasizing DNN, to construct predictive models for fire incidents. Figure 3 depicts the flowchart of the predictive models for fire incidents. The first step involves data preparation, sourced primarily from various departments of the Keelung City Government [39,40,41]. These datasets include demographic, architectural, and economic data, which serve as inputs for the DNN model. Subsequently, GIS and spatial analysis are utilized for data preprocessing. These datasets are used for training, testing, and validation purposes. The second step entails constructing the DNN architecture, which includes building the neural network and configuring relevant parameters.
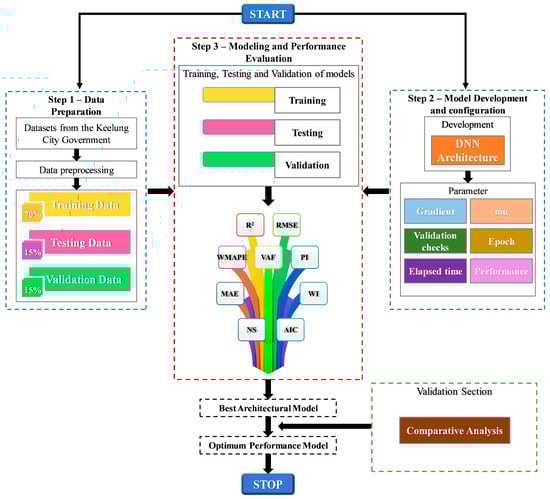
Figure 3.
Flowchart of the predictive models for fire incidents.
This architecture consists of interconnected nodes known as neurons, organized into layers such as input, hidden, and output layers. Each neuron receives input signals, computes using activation functions, and generates output signals passed to the next layer. Through backward propagation, data traverses the network, while adjustments to neuron connections occur during training through backpropagation. This enables the network to learn from data and make predictions or classifications. The third step involves modeling and performance evaluation. The proposed model’s effectiveness was assessed using a range of performance metrics, including the coefficient of determination (R2), root mean square error (RMSE), variance accounted for (VAF), prediction interval (PI), mean absolute error (MAE), weighted index (WI), weighted mean absolute percentage error (WMAPE), and Nash–Sutcliffe efficiency (NS). These indices were employed to verify the accuracy of the model developed in this investigation. Subsequent sections will detail the development of the DNN architecture for constructing predictive models for fire incidents.
3.1. DNN Architecture Development
The development of the DNN architecture constitutes a pivotal stage in the construction of predictive models for various applications, notably fire incidence prediction. DNNs, a specialized type of neural network, feature multiple layers of interconnected nodes or neurons, essential for deep learning. The process of developing the DNN architecture typically commences with the formulation of weights for predictive modeling. These weights are derived from a linear combination of bias terms and inputs, representing the interconnections among neurons. Each neuron within the hidden layers of the network computes an estimation or output by performing a weighted sum of its inputs and applying an activation function. The establishment of the DNN architecture initiates with the formulation of weights for modeling fire incidence, derived from the linear combination of bias terms and inputs. Each neuron within a hidden layer of the neural network is attributed a numerical value representing its output or activation, calculated by computing the weighted sum of its inputs. Subsequently, this value undergoes an activation function to yield the final output, as prescribed by the network configuration.
where represents the weighted sum, represents the bias, represents the input unit, m represents the total input elements originating from the input layer, and denotes the weight between neuron i and j in the hidden layer.
As depicted in Equation (2), the computation for estimating each neuron within a hidden layer of a neural network entails the dot product of its input values with the respective weights, followed by the application of an activation function to the result. Subsequently, this estimation is propagated to the neurons in the subsequent layer. The precise value for each neuron’s estimation relies on factors including the network architecture, the designated weights for connections, and the chosen activation function, as exemplified by Equation (3):
where represents the aggregate weighted sum of neuron i within the jth hidden layer, represents signifies the bias, represents the weight linked to the activation function, n denotes the number of the neuron, and represents the activation function, which in this study, is the hyperbolic tangent function. Numerical approximations can be derived as depicted below:
where depicts the approximations, and depicts the weights related to the output layer. The architecture’s design and configuration play pivotal roles in determining its performance and effectiveness in processing and interpreting data. It involves specifying the number of layers, the number of neurons within each layer, the activation functions used, and the overall network topology. Optimizing these parameters is essential to enhance the DNN’s ability to extract meaningful features and patterns from the input data.
The DNN architecture depicted in Figure 4 illustrates the interconnections between nodes, where the connections represent weighted values responsible for regulating signal propagation. The neural network processes simulated signals by combining weights for each input before they reach the neural unit, as illustrated in Figure 4. Each node in the network is associated with an activation function, which determines the network’s output. In this study, we employ backpropagation neural networks within the DNN framework. Backpropagation enables the network to learn from errors by iteratively adjusting the weights and biases based on the disparity between the predicted and actual outputs. This iterative learning process enhances the network’s capacity to capture intricate patterns and relationships in the data. Additionally, backpropagation enables DNNs to effectively handle extensive and high-dimensional datasets. By backpropagating errors through the network, DNNs can efficiently update their parameters, making them suitable for tasks involving large-scale data.
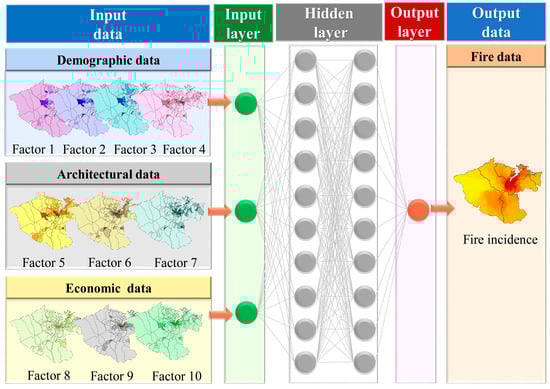
Figure 4.
The proposed DNN architecture.
3.2. Loss Function Assessment
Throughout the development process, optimizers are utilized to minimize discrepancies between predicted and actual solutions. This iterative approach involves updating weights and biases to identify parameter combinations that minimize the loss function value, thus improving the network’s predictive accuracy. The main objective of this study is to establish DNN architecture development, which involves adjusting network parameters (including weights and biases) to minimize the objective function and achieve optimal training. The loss function used in this study serves to quantify the difference between predicted output values and actual target values. The formula for the loss function is expressed as follows:
where M denotes the number of the data point, denotes the exact solutions, and Loss denotes the loss function. The Levenberg–Marquardt (LM) algorithm functions as the optimizer aimed at reducing Equation (5), which measures the difference between the predicted and actual solutions for each data point. In the development of the DNN architecture, various aspects, such as design, configuration, and optimization of a multi-layered neural network, are considered to tailor it to specific predictive modeling tasks like fire incidence prediction. Through iterative adjustments of weights and biases, the algorithm seeks to identify the parameter configuration that yields the lowest value for the loss function. By capitalizing on its hierarchical structure and intricate connections, DNNs provide a robust framework for processing and analyzing intricate datasets to extract valuable insights and patterns.
3.3. Performance Evaluation
The effectiveness of the proposed model underwent evaluation through various performance indices, encompassing R2, RMSE, VAF, PI, MAE, WI, WMAPE, and NS to validate the accuracy of the model developed in this study [43]. R2 represents the proportion of the variance in the dependent variable that is predictable from the independent variables. It is a measure of how well the observed outcomes are replicated by the model. Equation (6) represents the mathematical expression:
In the above equation, represents the actual probability of the liquefaction value, indicates the model’s predicted probability of the liquefaction value, denotes the mean value of , and n indicates the total number of data points in the specific phase.
RMSE is a measure of the differences between values predicted by a model and the observed values. It denotes the square root of the mean of the squared variances between predicted and observed values, as shown in Equation (7).
VAF quantifies the ratio of variance in the dependent variable explained by the independent variables within the model, as depicted in Equation (8).
PI represents the range in which future observations are likely to fall, given the predictions made by the model. It provides a measure of the uncertainty associated with individual predictions, as depicted in Equation (9).
MAE is the average of the absolute differences between predicted and observed values. It measures the average magnitude of the errors in a set of predictions, without considering their direction, as depicted in Equation (10).
WI is a composite measure that aggregates multiple indicators or variables by assigning weights to each indicator. It yields a unified score that signifies the relative significance of various factors, as illustrated in Equation (11).
WMAPE represents the average percentage error between predicted and observed values, incorporating weights based on factors like the importance or frequency of each observation, as outlined in Equation (12).
NS is a measure used to assess the accuracy of hydrological or environmental models. It compares the observed and simulated values and represents the relative magnitude of the residual variance compared to the measured data variance. A value of 1 indicates perfect model performance, while values less than 0 indicate poor performance.
The ratio of performance to deviation (RPD) is a metric used to assess the performance of a model relative to its deviation or variability. It is calculated by dividing the performance metric (e.g., accuracy, prediction error) by the standard deviation of the observed values. A higher RPD value indicates better performance relative to the variability in the data.
In the above equation, RPD denotes the ratio of performance to deviation, STD denotes the standard deviation, n denotes the number of data samples (157 records, yi denotes the predicted data, yav denotes the average of all predicted data, di denotes the original data, and davg denotes the average of all original data.
Standard deviation (STD) is a measure of the dispersion or variability of a set of values. It quantifies the average distance of each data point from the mean of the data set. A higher standard deviation indicates greater variability in the data points, while a lower standard deviation indicates less variability.
In the above equation, m denotes the number of model runs (50 runs), Performance indicesi denotes performance indices, and Performance indicesavg denotes the average performance indices over 50 model runs. The optimal values for the performance indices, comprising R2, VAF, PI, WI, MAE, WMAPE, NS, and RMSE, are 1, 100, 2, 1, 0, 0, 1, and 0, respectively [43].
4. Results
This study first conducts verification analysis through the development of the DNN architecture, where ten factors are utilized as inputs for the DNN model. The effectiveness of the developed model is confirmed by comparing its predictions with historical data, using various performance indices to validate the results, thereby demonstrating the reliability of the DNN model. Furthermore, the model is employed to explore scenarios involving diverse urban renewal strategies, where the ten factors are categorized into demographic, architectural, and economic aspects. This study investigates whether reducing a specific aspect’s proportion contributes to a decrease in fire incidents.
It is known that the correlation is the measure of how two or more variables are related to one another. Correlation serves as a vital measure to understand the relationship between multiple variables. A positive correlation coefficient indicates that the dependent variable increases with the independent variable’s increase, and vice versa. Given the high-dimensional nature of the dataset in this study, selecting relevant features becomes crucial to enhance the performance and efficiency of neural networks. Initially, we utilize a correlation coefficient matrix to assess dataset intricacies. This matrix provides insights into the associations among various factors and fire incidents. Table 3 presents the correlation coefficients between potential fire factors and fire occurrences. Notably, the demographic data (factors 1 to 4), architectural data (factors 5 to 7), and economic data (factors 8 to 10) exhibit strong correlations within their respective groups. These findings illuminate the relationship between independent and dependent variables, thereby informing subsequent feature selection processes in the study.
Table 3.
Correlation coefficient matrix.
As this study deals with high-dimensional data, feature selection may be crucial for enhancing the performance and efficiency of neural networks. We employ a correlation coefficient matrix to evaluate issues within the dataset. Through the utilization of this matrix, we gain insights into the relationships between each factor and fire incidents. The correlation coefficients between potential fire factors and fires are presented in Table 3. As depicted in Table 3, the correlation coefficients matrix reveals that factors 6 (real estate over 40 years old), 10 (tertiary sector), and 2 (elderly inhabitants) exhibit correlation coefficients of 0.77, 0.73, and 0.7, respectively, with factor 11 (fire incidents), all surpassing 0.7, indicating a strong correlation. This study can further derive relevant feature selection information from these results.
Since the focus of this study is primarily on utilizing DNN to develop predictive models for fire occurrence in Keelung City, Taiwan, we considered ten factors across demographic, architectural, and economic dimensions as input data for the DNN model, without delving into the repeated exploration of the relationships among these ten factors.
4.1. Hyperparameter Analysis
Given that the network architecture can vary depending on the types and quantities of layers utilized, this study proceeds to conduct hyperparameter analysis. In the hyperparameter analysis, datasets were divided into training, testing, and validation sets in the proportions of 70% to 15% to 15%. Model parameters are outlined in Table 4. The input layer comprises ten neurons, while the number of neurons in the hidden layers is randomly determined, and the output layer consists of only one neuron. The LM algorithm serves as the chosen training function.
Table 4.
The model parameters.
4.1.1. Number of Hidden Layers
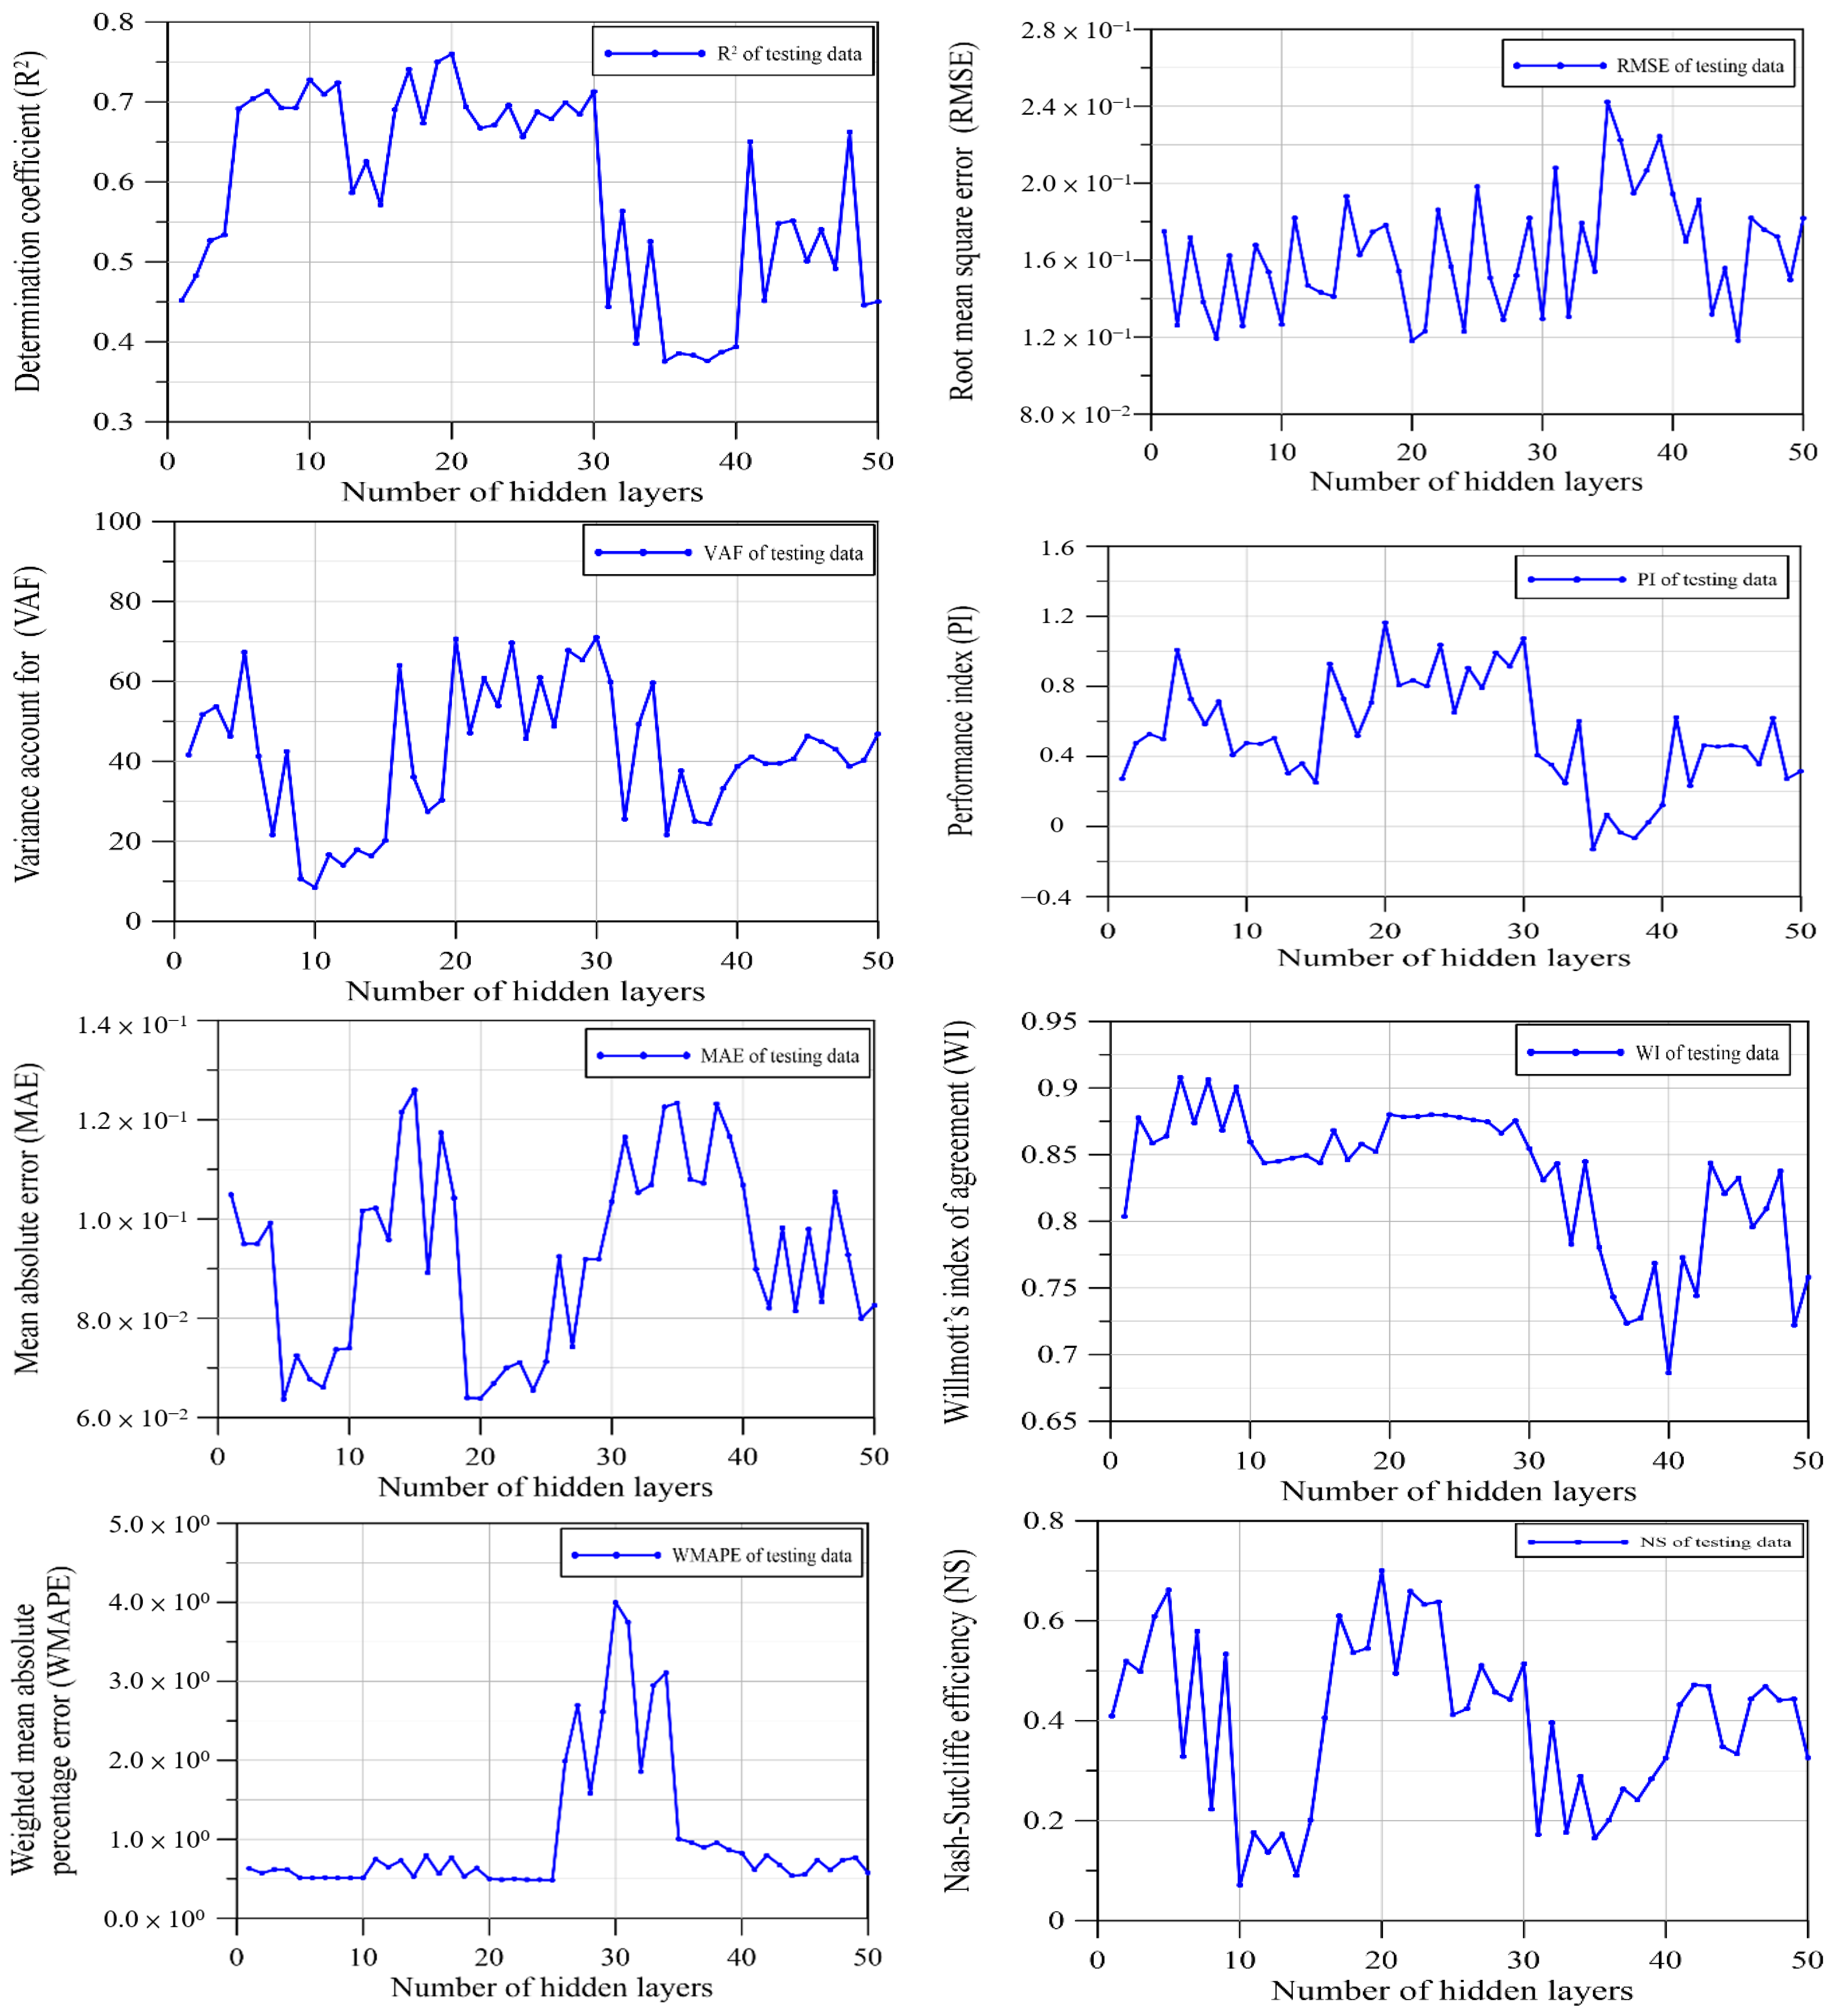
Determining the number of hidden layers and the number of neurons within the model typically involves trial and error. This study investigates the influence of the number of hidden layers on the analysis results. The number of neurons in the output layer remains fixed based on the application and is determined by the class being processed. According to the analysis findings, employing twenty hidden layers yields reliable results, as illustrated in Figure 5. Consequently, the proposed model incorporates twenty hidden layers.
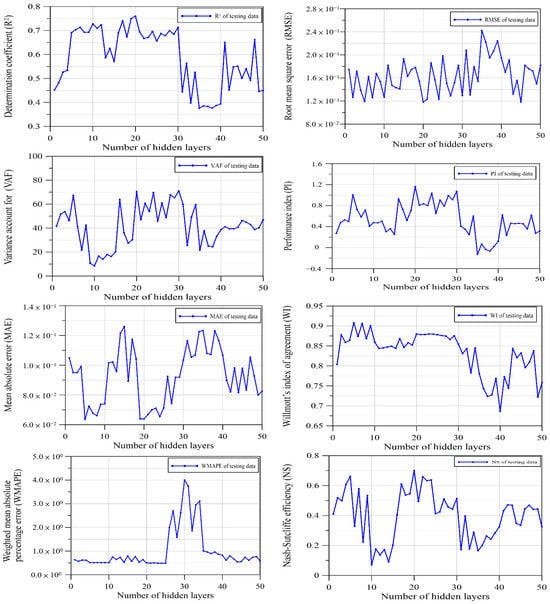
Figure 5.
Hyperparameter analysis of the number of hidden layers.
4.1.2. Activation Function
This study also conducted an analysis comparing the results with other activation functions, such as ReLU or Tanh, as illustrated in Table 5. The findings demonstrate that the Sigmoid activation function employed in this study yields superior results across various performance indices. The main reason why we use the sigmoid function (hyperbolic tangent sigmoid transfer function) is because it exists between 0.0 and 1.0. Therefore, it is especially used for the proposed model where we have to predict the probability as an output. Since probability the of anything exists only between the range of 0 and 1, the sigmoid activation function is adopted as the activation function for the proposed neural networks.
Table 5.
The modeling precision across 50 runs using various activation functions for the testing dataset.
4.2. Validation
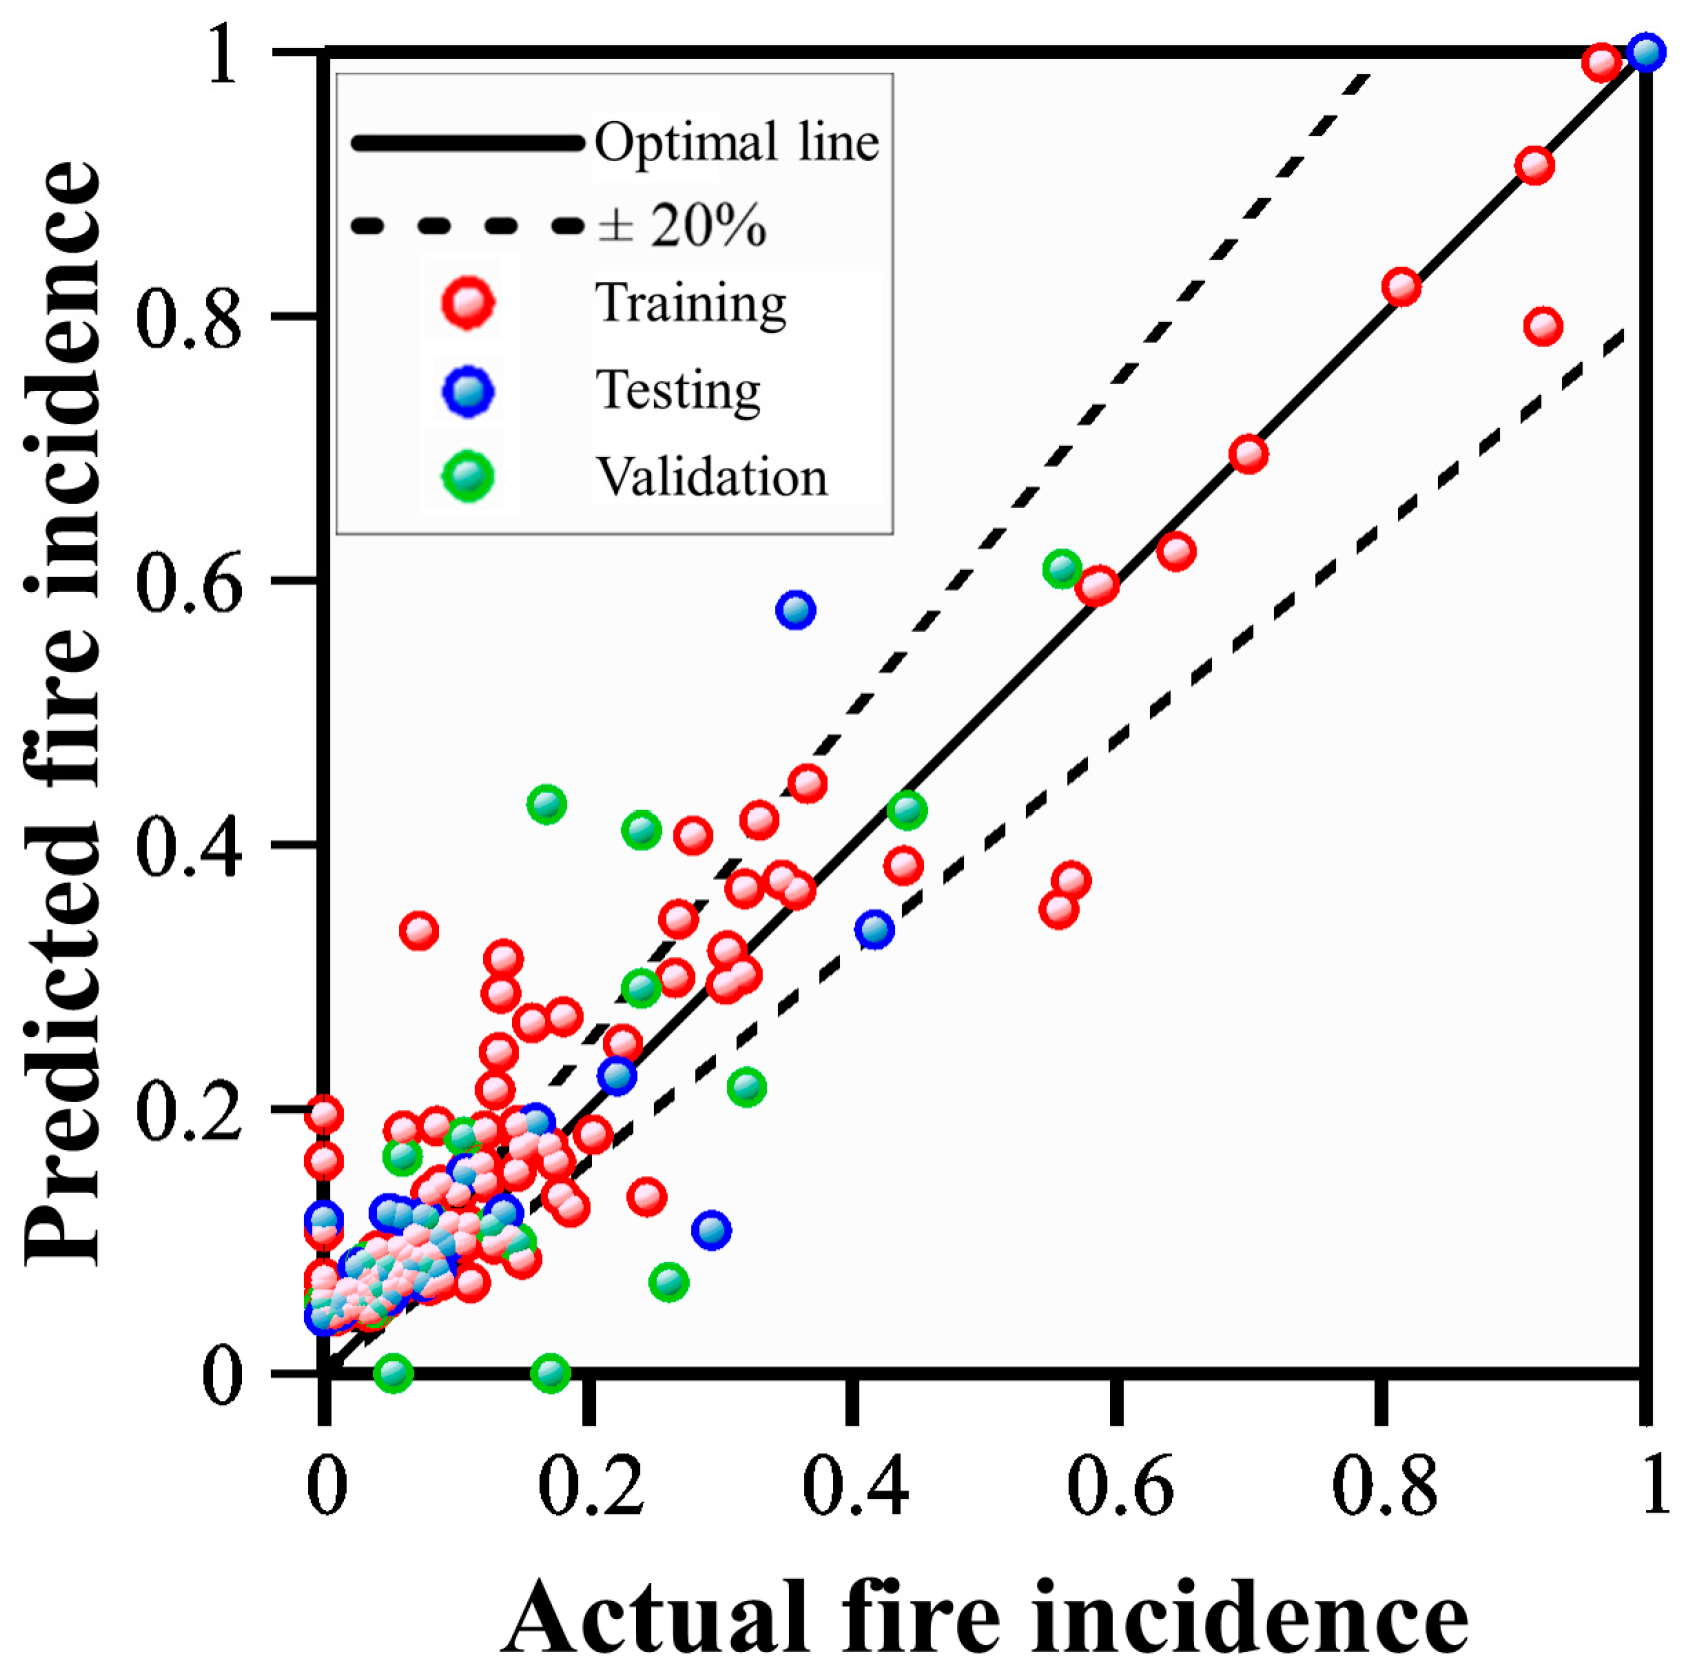
The proposed DNN architecture consists of ten input layers, twenty hidden layers, and one output layer. During training, the LM algorithm was employed. The optimal validation performance for mean squared error was attained, reaching 0.018 by epoch 4. Figure 6 illustrates the correlation coefficient (R) computed for the training dataset. The R values obtained for the training, validation, and testing datasets were 0.95, 0.81, and 0.95, respectively. These values suggest a strong correlation between historical fire incidence and the model predictions. Moreover, data points closer to the optimal line indicate higher prediction accuracy of the models.

Figure 6.
Performance of proposed DNN predictive models for fire incidence.
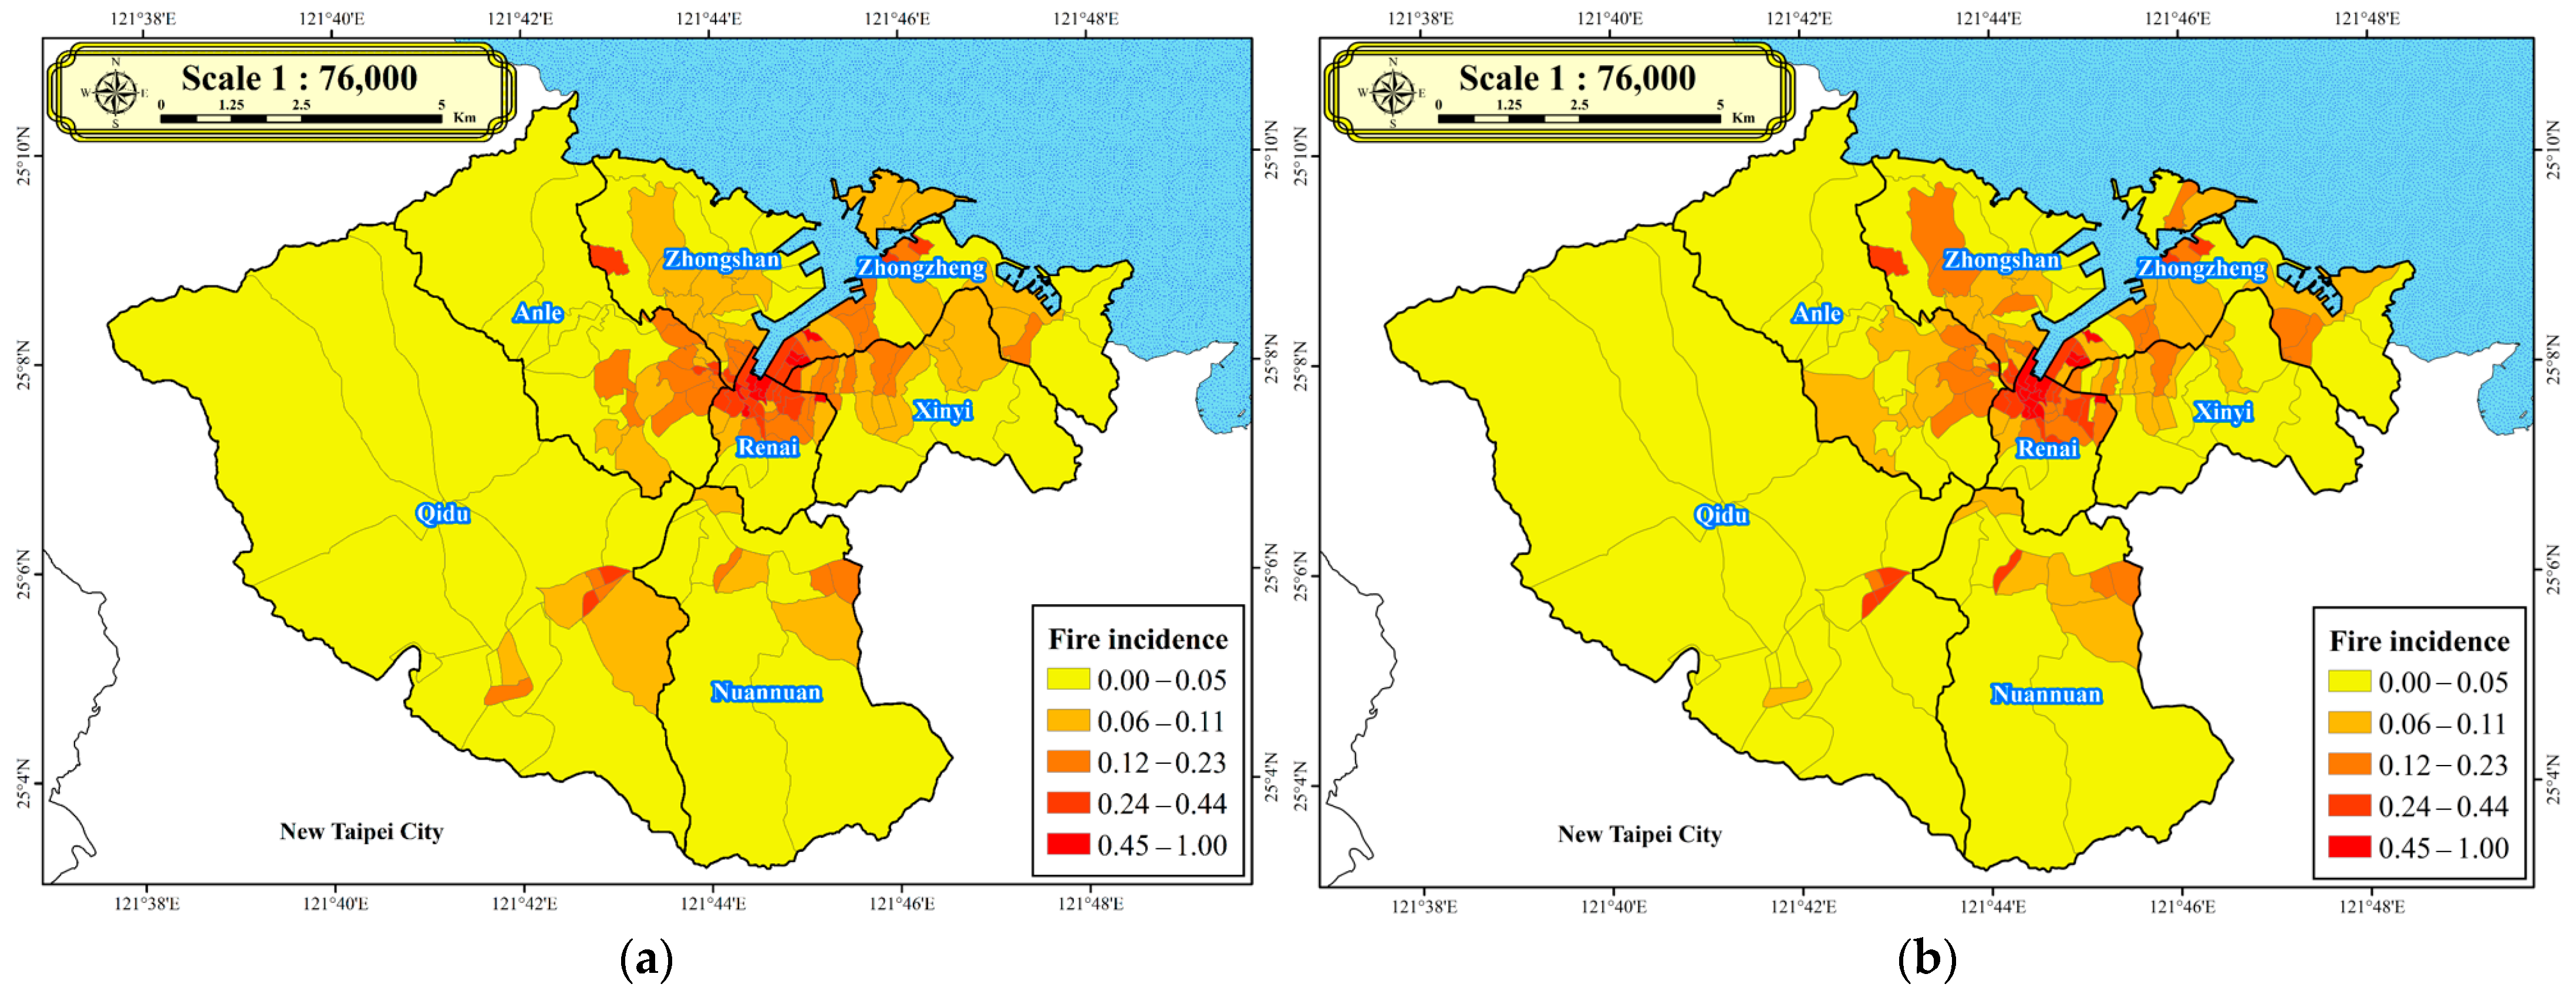
Figure 7 depicts the comparison of historical fire incidence in Keelung County. In general, the predictions generated by the proposed DNN model (Figure 7a) align closely with the historical fire incidence data provided by the Keelung City Fire Bureau (Figure 7b). These findings affirm the effectiveness of the proposed DNN model in predicting fire incidence in Keelung County.
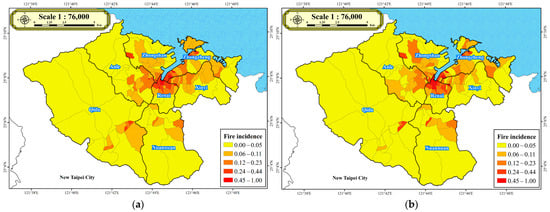
Figure 7.
Comparison of the historical fire incidence in Keelung County: (a) this study; (b) Keelung City Fire Bureau.
In the subsequent analysis, ten factors are utilized as inputs. Table 6 displays the modeling accuracy across 50 runs for the testing dataset. The analysis scrutinizes various performance indices, including R2, RMSE, VAF, PI, MAE, WI, WMAPE, NS, and RPD, to validate the accuracy of the DNN model developed in this study. Through computation across 50 runs, the average values of these performance indices, namely R2, RMSE, VAF, PI, MAE, WI, WMAPE, NS, and RPD, are calculated as 0.89, 7.30 10−2, 89.21, 1.63, 4.90 10−2, 0.97, 2.92 10−1, 0.88, and 4.84, respectively. According to ref. [43], the performance indices calculated in this study are very close to the ideal values for these performance indices. These findings affirm the validity of utilizing ten factors as inputs for the DNN model. Furthermore, the developed model demonstrates its capability to accurately predict fire incidents. Overall, the analysis underscores the effectiveness of using factors as inputs for the DNN model in predicting fire incidents.
Table 6.
The modeling accuracy across 50 runs for the testing dataset.
Subsequently, this study was further compared with other machine learning methods such as SVM. SVM is recognized as one of the commonly utilized machine learning algorithms, widely employed in classification and regression tasks, particularly in scenarios where the data exhibit non-linear separability. Notably, SVM excels in managing high-dimensional data and addressing non-linear classification challenges. In our study, the obtained analysis results were juxtaposed with those derived from SVM. These findings are detailed in Table 6, illustrating that SVM continues to yield favorable outcomes and further confirming the viability of the proposed model. Nevertheless, it is worth mentioning that across various performance metrics, our DNN model exhibits a slight improvement in precision compared to SVM.
4.3. Prediction
This study employs the developed DNN model to investigate various urban renewal strategies and assess if different scenarios can mitigate or diminish fire incidents. Based on the results of the aforementioned validation cases, Keelung County has 12 villages with fire densities ranging from 0.45 to 1, indicating areas with more severe fire incidents, as shown in Figure 7. Implementing fire prevention measures in these twelve villages could directly mitigate the occurrence or impact of fire incidents, thereby diminishing fire risks and enhancing disaster resilience. Therefore, the subsequent application cases focus solely on these 12 villages for analysis.
Analyzing demographic, architectural, and economic factors, this study investigates the demographic aspect to assess whether decreasing the population proportion influences the occurrence rate of fire incidents. On the architectural front, assuming a decrease in the proportion of older buildings, such as those exceeding 40 years (indicating urban renewal), this study investigates if it influences the occurrence of fire incidents. Regarding the economic dimension, hypothesizing changes in economic dynamics within the second and third sectors, this study explores the significant impact of economic fluctuations and other variables on the incidence rate of fires.
Considering demographic, architectural, and economic aspects, the aforementioned three dimensions encompass five scenarios each. Regarding the demographic aspect, reductions in demographic-related factors are examined across five scenarios, including reductions of 90%, 80%, 70%, 60%, and 50% of their original values. These scenarios are labeled as Cases 1 to 5, respectively. For the architectural aspect, reductions in architectural-related factors are explored across five scenarios, with reductions of 90%, 80%, 70%, 60%, and 50% of their original values. These scenarios are denoted as Cases 6 to 10, respectively. In terms of the economic aspect, reductions in economic-related factors are considered across five scenarios, involving reductions of 90%, 80%, 70%, 60%, and 50% of their original values. These scenarios are labeled as Cases 11 to 15, respectively. The average fire incidence for the 12 villages with severe fire incidents for each scenario is summarized in Table 7.
Table 7.
Consideration of different scenarios for fire incidents.
Table 7 outlines the average fire incidence across the 12 villages under various scenarios and computes the decrease in fire incidence. This decrease is determined by the disparity between the original fire incidence and the adjusted fire incidence post-adaptation, reflecting the degree of fire incident reduction. Figure 8 plots the relationship between average fire incidence and reduction in fire incidence. In Figure 8, the values depicted on the left vertical axis correspond to the bar plot data, while those on the right axis indicate the cumulative percentage reduction in fire incidence.
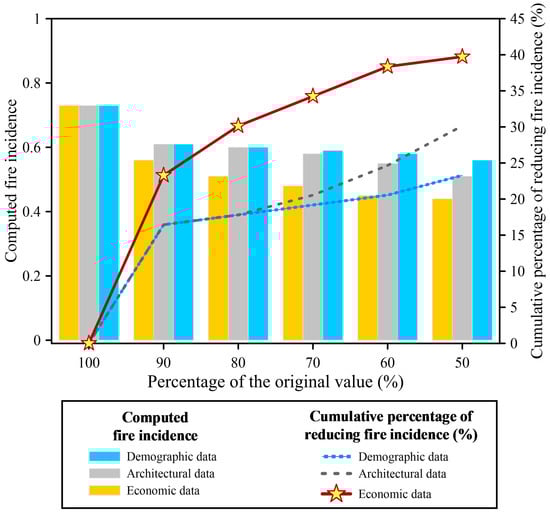
Figure 8.
Relationship between average fire incidence and reduction in fire incidence.
Among the scenarios analyzed, diminishing factors associated with the economic aspect emerge as the most potent in reducing fire incidence, as shown in Figure 8. Results of this study indicate that reducing economic factors yields a reduction in fire incidence significantly, compared with reducing demographic factors or architectural factors. Additionally, the next most effective strategy in reducing fire density involves diminishing factors linked to the architectural aspect. The results highlight the significant impact of reducing economic-related factors in substantially decreasing fire incidence, as indicated by the study’s findings.
5. Discussion
The implementation of DNN has shown promising results in predicting fire incidents originating from human activities in Keelung City, Taiwan. The validation of the DNN model’s effectiveness involved assessing various performance indices, including R2, RMSE, VAF, PI, MAE, WI, WMAPE, and NS, which yielded satisfactory results, confirming the reliability of the model’s predictions. Additionally, this study explored the ramifications of different urban renewal strategies by employing the DNN model to analyze scenarios incorporating these approaches. This study targets 12 villages in Keelung City with a higher frequency of severe fire incidents. It simulates the implementation of fire prevention measures to evaluate their effectiveness in mitigating fires. Across demographic, architectural, and economic dimensions, each of these three aspects includes several scenarios. Specifically, within the demographic, architectural, and economic realms, reductions in representative factors for these three dimensions are examined, involving reductions from 90% to 50% from their original values.
The results demonstrate that reducing demographic, architectural, and economic factors to 90% of their original values effectively decreases fire incidence. A significant finding was the substantial impact of economic factors on fire occurrence, with a 23.29% reduction observed when these factors were decreased. Additionally, reducing demographic or architectural factors to 90% of their original values also led to a considerable reduction in fire incidence, by 16.44%. Further analysis revealed that diminishing architectural factors emerged as the second most effective strategy for lowering fire density, surpassing the impact of demographic factors.
These findings emphasize the substantial influence of reducing economic-related factors on decreasing fire incidents. Moreover, the reduction in architectural factors emerged as another effective strategy, highlighting the interconnectedness of various factors contributing to fire incidence. Finally, this study underscores the critical role of economic factors in reducing fire incidents and stresses the importance of incorporating these factors into urban renewal strategies.
6. Conclusions
This study introduces DNN to formulate predictive models for fire incidence in Keelung City, Taiwan. Through this novel approach, the study effectively forecasts fire incidents in Keelung City, Taiwan. The main discoveries of this investigation are summarized as follows:
Spatial analysis and thematic maps generated from the GIS were utilized to examine ten factors spanning demographic, architectural, and economic domains, which were used as inputs for the ANN model. Subsequently, the proposed model was developed to predict fire incidence. The model’s accuracy was validated by comparing its predictions with historical fire incidence data obtained from the Keelung City Fire Bureau. Evaluation of the model’s effectiveness involved calculating various performance indices, including R2, RMSE, VAF, PI, MAE, WI, WMAPE, NS, and RPD, resulting in values of 0.89, 7.30 10−2, 89.21, 1.63, 4.90 10−2, 0.97, 2.92 10−1, 0.88, and 4.84, respectively. The congruence between the model’s predictions and historical data confirms its reliability.
This study further investigates the effects of diverse urban renewal strategies, employing the proposed DNN model to analyze scenarios involving these strategies. A notable discovery is the substantial impact of economic factors on fire incidence. Following closely, reducing architectural factors emerges as the next most effective strategy for lowering fire density. Our study emphasizes the pivotal role of economic factors in significantly reducing fire incidence, highlighting the importance of addressing these aspects in urban renewal strategies.
Author Contributions
Conceptualization, C.-Y.K. and C.-Y.L.; methodology, validation, writing, C.-Y.L. All authors have read and agreed to the published version of the manuscript.
Funding
This research received no external funding.
Institutional Review Board Statement
Not applicable.
Informed Consent Statement
Not applicable.
Data Availability Statement
Dataset available on request from the authors.
Conflicts of Interest
The authors declare no conflicts of interest.
References
- Yoshioka, H.; Himoto, K.; Kagiya, K. Large urban fires in Japan: History and management. Fire Technol. 2020, 56, 1885–1901. [Google Scholar] [CrossRef]
- Fernandez-Anez, N.; Krasovskiy, A.; Müller, M.; Vacik, H.; Baetens, J.; Hukić, E.; Kapovic Solomun, M.; Atanassova, I.; Glushkova, M.; Bogunović, I.; et al. Current wildland fire patterns and challenges in Europe: A synthesis of national perspectives. Air Soil Water Res. 2021, 14, 11786221211028185. [Google Scholar] [CrossRef]
- Liu, B.F.; Iles, I.A.; Herovic, E. Leadership under fire: How governments manage crisis communication. Commun. Stud. 2020, 71, 128–147. [Google Scholar] [CrossRef]
- Tymstra, C.; Jain, P.; Flannigan, M.D. Characterisation of initial fire weather conditions for large spring wildfires in Alberta, Canada. Int. J. Wildland Fire 2021, 30, 823–835. [Google Scholar] [CrossRef]
- Gissing, A.; Timms, M.; Browning, S.; Crompton, R.; McAneney, J. Compound natural disasters in Australia: A historical analysis. Environ. Hazards 2022, 21, 159–173. [Google Scholar] [CrossRef]
- Chang, R.H.; Tso, Y.E.; Lin, C.H.; Kwesell, A. Challenges to the Fire Service–Centric Emergency Management System. Nat. Hazards Rev. 2022, 23, 05021017. [Google Scholar] [CrossRef]
- Federal Emergency Management Agency. Socioeconomic Factors and the Incidence of Fire; Federal Emergency Management Agency: Washington, DC, USA, 1997.
- Karemaker, M.; Ten Hoor, G.A.; Hagen, R.R.; van Schie, C.H.; Boersma, K.; Ruiter, R.A. Elderly about home fire safety: A qualitative study into home fire safety knowledge and behaviour. Fire Saf. J. 2021, 124, 103391. [Google Scholar] [CrossRef]
- Laban, M.; Milanko, V.; Kočetov Mišulić, T.; Draganić, S. Fire statistics and risk analysis in wooden building structures in Serbia. Int. Wood Prod. J. 2017, 8, 62–70. [Google Scholar] [CrossRef]
- Akter, S.; Grafton, R.Q. Do fires discriminate? Socio-economic disadvantage, wildfire hazard exposure and the Australian 2019–20 ‘Black Summer’fires. Clim. Chang. 2021, 165, 53. [Google Scholar] [CrossRef]
- Tselios, V.; Tompkins, E.L. Can we prevent disasters using socioeconomic and political policy tools? Int. J. Disaster Risk Reduct. 2020, 51, 101764. [Google Scholar] [CrossRef]
- Cvetković, V.M.; Dragašević, A.; Protić, D.; Janković, B.; Nikolić, N.; Milošević, P. Fire safety behavior model for residential buildings: Implications for disaster risk reduction. Int. J. Disaster Risk Reduct. 2022, 76, 102981. [Google Scholar] [CrossRef]
- National Fire Agency, Ministry of the Interior, Taiwan. Analysis of National Fire Statistics for the Year 2023. Available online: https://www.nfa.gov.tw/cht/index.php?code=list&ids=220 (accessed on 1 December 2023).
- Jones, M.W.; Abatzoglou, J.T.; Veraverbeke, S.; Andela, N.; Lasslop, G.; Forkel, M.; Smith, A.J.P.; Burton, C.; Betts, R.A.; van der Werf, G.R.; et al. Global and regional trends and drivers of fire under climate change. Rev. Geophys. 2022, 60, e2020RG000726. [Google Scholar] [CrossRef]
- Cattau, M.E.; Wessman, C.; Mahood, A.; Balch, J.K. Anthropogenic and lightning-started fires are becoming larger and more frequent over a longer season length in the USA. Glob. Ecol. Biogeogr. 2020, 29, 668–681. [Google Scholar] [CrossRef]
- Zhang, X.; Yao, J.; Sila-Nowicka, K.; Jin, Y. Urban fire dynamics and its association with urban growth: Evidence from Nanjing, China. ISPRS Int. J. Geo-Inf. 2020, 9, 218. [Google Scholar] [CrossRef]
- Keelung City Fire Bureau, Taiwan. Overview of Fire Statistical Analysis in Keelung City for the Year 2023. Available online: https://www.klfd.klcg.gov.tw/tw/klfd1/2050.html (accessed on 1 December 2023).
- Jain, P.; Wang, X.; Flannigan, M.D. Trend analysis of fire season length and extreme fire weather in North America between 1979 and 2015. Int. J. Wildland Fire 2017, 26, 1009–1020. [Google Scholar] [CrossRef]
- Anderson, A.; Ezekoye, O.A. Quantifying generalized residential fire risk using ensemble fire models with survey and physical data. Fire Technol. 2018, 54, 715–747. [Google Scholar] [CrossRef]
- Bradley, B.A.; Curtis, C.A.; Fusco, E.J.; Abatzoglou, J.T.; Balch, J.K.; Dadashi, S.; Tuanmu, M.N. Cheatgrass (Bromus tectorum) distribution in the intermountain Western United States and its relationship to fire frequency, seasonality, and ignitions. Biol. Invasions 2018, 20, 1493–1506. [Google Scholar] [CrossRef]
- Oliveira, S.; Moreira, F.; Boca, R.; San-Miguel-Ayanz, J.; Pereira, J.M. Assessment of fire selectivity in relation to land cover and topography: A comparison between Southern European countries. Int. J. Wildland Fire 2013, 23, 620–630. [Google Scholar] [CrossRef]
- Parisien, M.A.; Peters, V.S.; Wang, Y.; Little, J.M.; Bosch, E.M.; Stocks, B.J. Spatial patterns of forest fires in Canada, 1980–1999. Int. J. Wildland Fire 2006, 15, 361–374. [Google Scholar] [CrossRef]
- Cattau, M.E.; Mahood, A.L.; Balch, J.K.; Wessman, C.A. Modern pyromes: Biogeographical patterns of fire characteristics across the contiguous United States. Fire 2022, 5, 95. [Google Scholar] [CrossRef]
- González-Olabarria, J.R.; Mola-Yudego, B.; Coll, L. Different factors for different causes: Analysis of the spatial aggregations of fire ignitions in Catalonia (Spain). Risk Anal. 2015, 35, 1197–1209. [Google Scholar] [CrossRef] [PubMed]
- Marinho, A.A.R.; de Gois, G.; de Oliveira-Júnior, J.F.; Correia Filho, W.L.F.; de Barros Santiago, D.; da Silva Junior, C.A.; Teodoro, P.E.; de Souza, A.; Capristo-Silva, G.F.; de Freitas, W.F.; et al. Temporal record and spatial distribution of fire foci in State of Minas Gerais, Brazil. J. Environ. Manag. 2021, 280, 111707. [Google Scholar] [CrossRef] [PubMed]
- Buffington, T.; Scott, J.G.; Ezekoye, O.A. Combining spatial and sociodemographic regression techniques to predict residential fire counts at the census tract level. Comput. Environ. Urban Syst. 2021, 88, 101633. [Google Scholar] [CrossRef]
- Sivrikaya, F.; Küçük, Ö. Modeling forest fire risk based on GIS-based analytical hierarchy process and statistical analysis in Mediterranean region. Ecol. Inform. 2022, 68, 101537. [Google Scholar] [CrossRef]
- Akbulak, C.; Tatlı, H.; Aygün, G.; Sağlam, B. Forest fire risk analysis via integration of GIS, RS and AHP: The Case of Çanakkale, Turkey. J. Hum. Sci. 2018, 15, 2127–2143. [Google Scholar] [CrossRef]
- Masoumi, Z.; van L.Genderen, J.; Maleki, J. Fire Risk Assessment in Dense Urban Areas Using Information Fusion Techniques. ISPRS Int. J. Geo-Inf. 2019, 8, 579. [Google Scholar] [CrossRef]
- Sharma, R.; Rani, S.; Memon, I. A smart approach for fire prediction under uncertain conditions using machine learning. Multimed. Tools Appl. 2020, 79, 28155–28168. [Google Scholar] [CrossRef]
- Khan, S.; Khan, A. Ffirenet: Deep learning based forest fire classification and detection in smart cities. Symmetry 2022, 14, 2155. [Google Scholar] [CrossRef]
- Sathishkumar, V.E.; Cho, J.; Subramanian, M.; Naren, O.S. Forest fire and smoke detection using deep learning-based learning without forgetting. Fire Ecol. 2023, 19, 1–17. [Google Scholar] [CrossRef]
- Xie, L.; Zhang, R.; Zhan, J.; Li, S.; Shama, A.; Zhan, R.; Wang, T.; Lv, J.; Bao, X.; Wu, R. Wildfire Risk Assessment in Liangshan Prefecture, China Based on an Integration Machine Learning Algorithm. Remote Sens. 2022, 14, 4592. [Google Scholar] [CrossRef]
- Alkhatib, R.; Sahwan, W.; Alkhatieb, A.; Schütt, B. A brief review of machine learning algorithms in forest fires science. Appl. Sci. 2023, 13, 8275. [Google Scholar] [CrossRef]
- Yu, Y.; Yao, M. When Convolutional Neural Networks Meet Laser-Induced Breakdown Spectroscopy: End-to-End Quantitative Analysis Modeling of ChemCam Spectral Data for Major Elements Based on Ensemble Convolutional Neural Networks. Remote Sens. 2023, 15, 3422. [Google Scholar] [CrossRef]
- Xie, W.; Wei, S.; Zheng, Z.; Yang, D. A CNN-based lightweight ensemble model for detecting defective carrots. Biosyst. Eng. 2021, 208, 287–299. [Google Scholar] [CrossRef]
- Iban, M.C.; Sekertekin, A. Machine learning based wildfire susceptibility mapping using remotely sensed fire data and GIS: A case study of Adana and Mersin provinces, Turkey. Ecol. Inform. 2022, 69, 101647. [Google Scholar] [CrossRef]
- El-Madafri, I.; Peña, M.; Olmedo-Torre, N. Dual-Dataset Deep Learning for Improved Forest Fire Detection: A Novel Hierarchical Domain-Adaptive Learning Approach. Mathematics 2024, 12, 534. [Google Scholar] [CrossRef]
- Department of Civil Affairs, Keelung City Government. Available online: https://www.klcg.gov.tw/tw/civil (accessed on 1 December 2023). (In Chinese)
- Department of Urban Development, Keelung City Government. Available online: https://www.klcg.gov.tw/tw/urban (accessed on 1 December 2023). (In Chinese)
- Department of Economic Affairs, Keelung City Government. Available online: https://www.klcg.gov.tw/en/klcg2/3285-128527.html (accessed on 1 December 2023). (In Chinese)
- World Health Organization. World Report on Ageing and Health; World Health Organization: Geneva, Switzerland, 2015.
- Kumar, D.R.; Samui, P.; Burman, A.; Wipulanusat, W.; Keawsawasvong, S. Liquefaction susceptibility using machine learning based on SPT data. Intell. Syst. Appl. 2023, 20, 200281. [Google Scholar] [CrossRef]


Disclaimer/Publisher’s Note: The statements, opinions and data contained in all publications are solely those of the individual author(s) and contributor(s) and not of MDPI and/or the editor(s). MDPI and/or the editor(s) disclaim responsibility for any injury to people or property resulting from any ideas, methods, instructions or products referred to in the content. |
© 2024 by the authors. Licensee MDPI, Basel, Switzerland. This article is an open access article distributed under the terms and conditions of the Creative Commons Attribution (CC BY) license (https://creativecommons.org/licenses/by/4.0/).