Article

A Study on the Impact Erosion Effect of a Two-Phase Jet Field on a Wall at Different Impact Distances by Numerical Simulation

1
College of Power Engineering, Naval University of Engineering, Wuhan 430033, China
2
System Design Institute of Hubei Aerospace Technology Academy, Wuhan 430000, China
*
Author to whom correspondence should be addressed.
Fire 2024, 7(9), 312; https://doi.org/10.3390/fire7090312
Submission received: 10 July 2024 / Revised: 28 August 2024 / Accepted: 1 September 2024 / Published: 4 September 2024
(This article belongs to the Special Issue Protection of Ships against Fire and Personnel Evacuation)

Abstract

:
When a motor is accidentally started, the solid particles produced by fuel combustion have impact and erosion effects on the surrounding structure via gas ejection, and the structure of the bulkhead is damaged. Therefore, in this paper, the effect of solid particle phase motion on a bulkhead was investigated. A two-dimensional SST k-ω model was used for the analysis. The grid size of the core area of a supersonic jet was selected as RN/24 by the calculation accuracy, and the resources and time consumption of the calculation were comprehensively considered. Based on the simulation of supersonic impact jets, the influence of the phase motion of solid particles was introduced, and the impact of a two-phase jet field on a wall was investigated. The addition of a particle phase created a hysteresis effect on the airflow, changing the shock structure of the pure gas-phase flow field. The rebound of the particle phase at the wall caused the waves in front of the wall to move forward and the stagnation bubble structures to disappear in some cases. The particle aggregation degree and collision angle would affect the particle erosion rate of solid bulkheads. The increase in particle jet impingement distance would change the distribution of particle aggregation and would influence the distribution of wall particle erosion rate and deposition rate. This paper would provide theoretical and engineering guidance for the safety protection design of magazines, which is of great significance for the safety assurance of ship magazines.

1. Introduction

When a motor is exposed to high temperatures, impacts, or other environmental factors, it is likely to spontaneously ignite or even explode [1]. After a motor ignites, the impact of the supersonic jets it produces will seriously threaten the ship’s equipment and bulkhead structures [2]. In addition, metal components such as aluminum and magnesium are frequently added to the propellant in order to increase the propulsion energy provided by a motor. When the propellant is burned, these metal components can form solid oxide particles in the high-temperature gas that exits the nozzle, which will worsen the impact on the equipment and bulkheads [3]. Therefore, studying the impact damage effect on a bulkhead when a motor is accidentally ignited is of great significance for magazine fire and explosion prevention design.
The supersonic jet flow field generated by propellant combustion is extremely complex, including intricate shock wave structures and gas–solid two-phase flow issues. When a supersonic jet hits a bulkhead, the bulkhead may be destroyed by the high-pressure load of airflow and the impact erosion of solid particles [4]. The descriptive analysis of supersonic shock jets using numerical simulation methods is of great research value and has attracted many researchers [5,6,7,8]. Cai et al. established a numerical calculation model for the jet impact of a liquid oxygen paraffin motor. The effects of re-ignition on the jet impact characteristics were investigated [9]. Davied et al. developed a computational fluid dynamics model of an engine-generated plume [10]. It was used to predict the stagnation pressure in the region close to the nozzle outlet to determine whether the generated exhaust gases would damage equipment on surrounding vehicles. Wang et al. performed pure gas-phase and two-phase shock calculations for a gas jet impingement baffle to obtain the erosion rate distribution and the flow field structure in the impingement zone [11]. Basu et al. numerically calculated the exhaust impact using the three-dimensional N-S equations with a speculative flow model of shear stresses, and investigated the impact and erosion effects of the jet on the jet blades [12].
In this paper, two-dimensional axisymmetric models were used to numerically simulate the jet impact effect of accidental ignition of motors on bulkheads. The solid particles were introduced to investigate the impact of a two-phase jet field on a wall to further understand the hazardous factors in the case of an accidental motor ignition.

2. Determination of Mathematical Models

2.1. Basic Control Equations

The supersonic impact jet is a unique high-speed flow phenomenon that satisfies the continuity, momentum, and energy equations as well as requiring a comprehensive consideration of fluid viscosity laws [13]. In the category of continuum mechanics, the Navier–Stokes (N-S) equation system of the basic control equation of viscous fluid mechanics can be appropriately simplified for different flow conditions [14]. It is possible to obtain the Euler equation for non-viscous flow situations, the Laplace equation for spinless flow, the N-S equations for incompressible fluids, and the Boussinesq equation for fluids for which the density is related to temperature and not to pressure, when buoyancy is taken into account [15,16]. For high Reynolds number flows, the relative geometric size of the flow layer close to the wall is tiny, and some parts of the N-S equation are disregarded [17,18].
In this paper, the N-S equation system can be converted to the equation system with the two-dimensional axisymmetric case in a cylindrical coordinate system, as follows:
Continuous equations:
ρ t + x ρ v x + r ρ v r + ρ v r r = S m
Axial momentum equation:
t ρ v x + 1 r x r ρ v x v x + 1 r r r ρ v r v x = p x + 1 r x r μ 2 v x x 2 3 v + 1 r r r μ v x r + v r x + F x
Radial momentum equation:
t ρ v r + 1 r x r ρ v x v r + 1 r r r ρ v r v r = p r + 1 r x r μ v r x + v x r + 1 r r r μ 2 v r r 2 3 v 2 μ v r r 2 + 2 3 μ r v + ρ v z 2 r + F r
Energy equation:
t ρ h + x ρ u h + 1 r r r ρ v h = x μ σ h h x + 1 r r r μ σ h h r + S h
Thereinto:
v = v x x + v r r + v r r
where x is the axial coordinate; r is the radial coordinate; Fx is the axial momentum source term, N/m2; Fr is the radial momentum source term, N/m2; and vz is the vortex velocity, m/s.

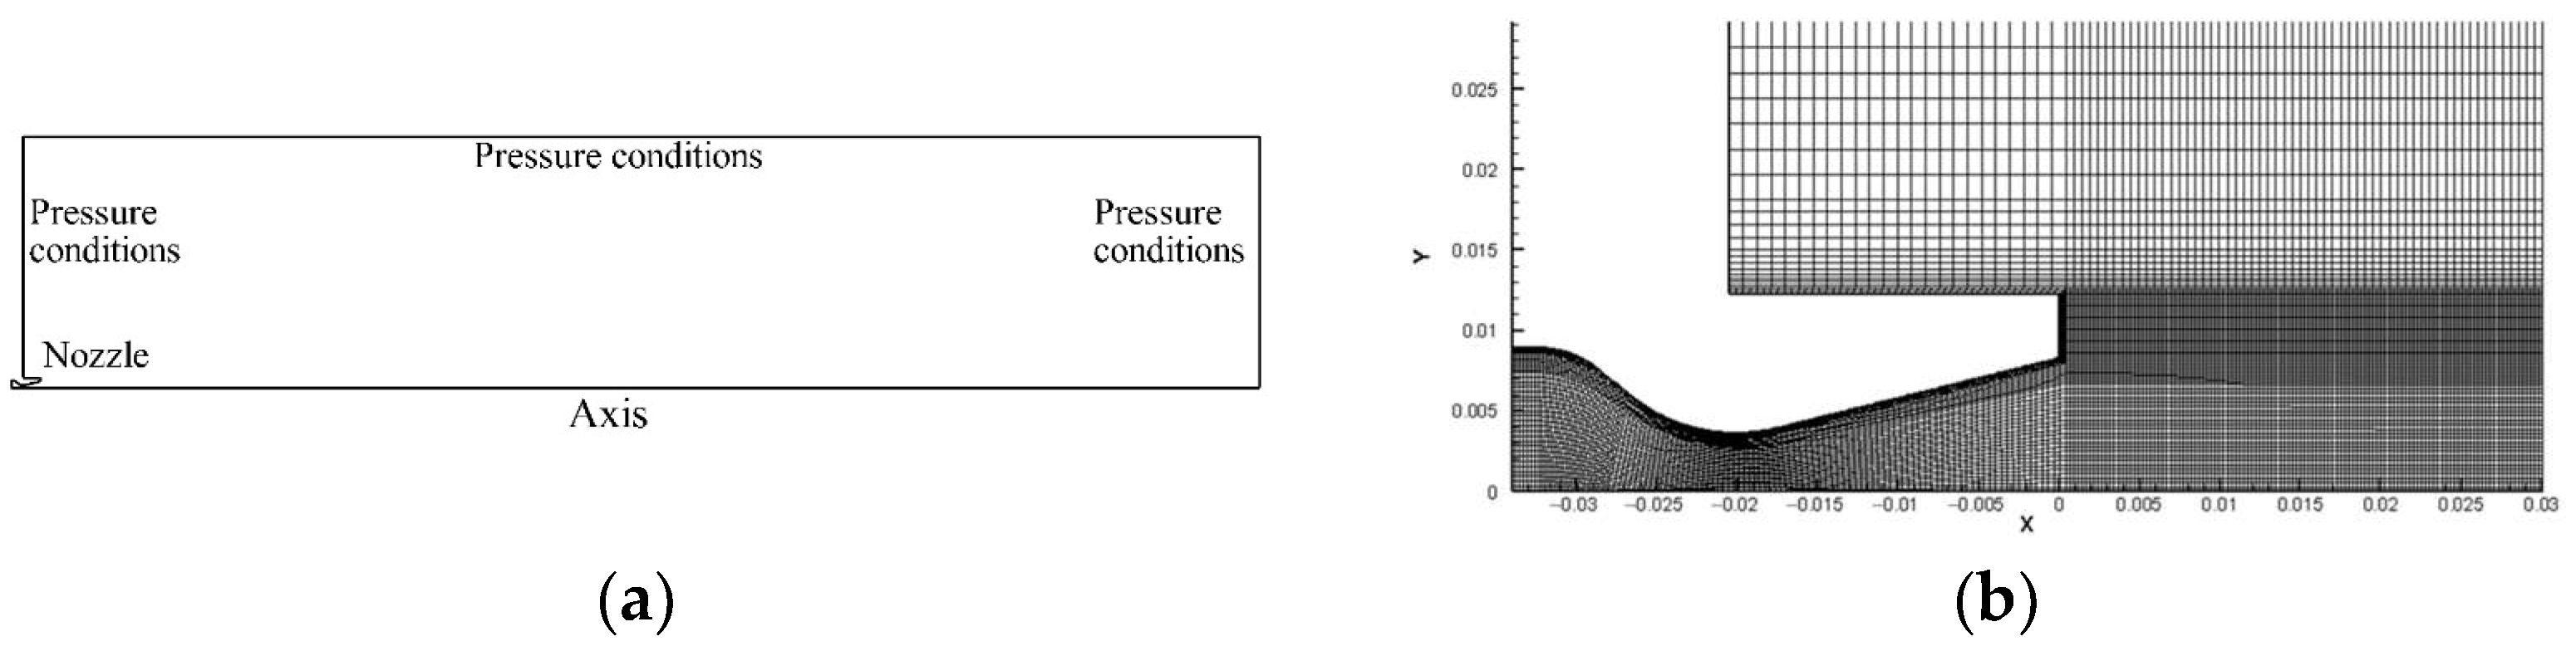
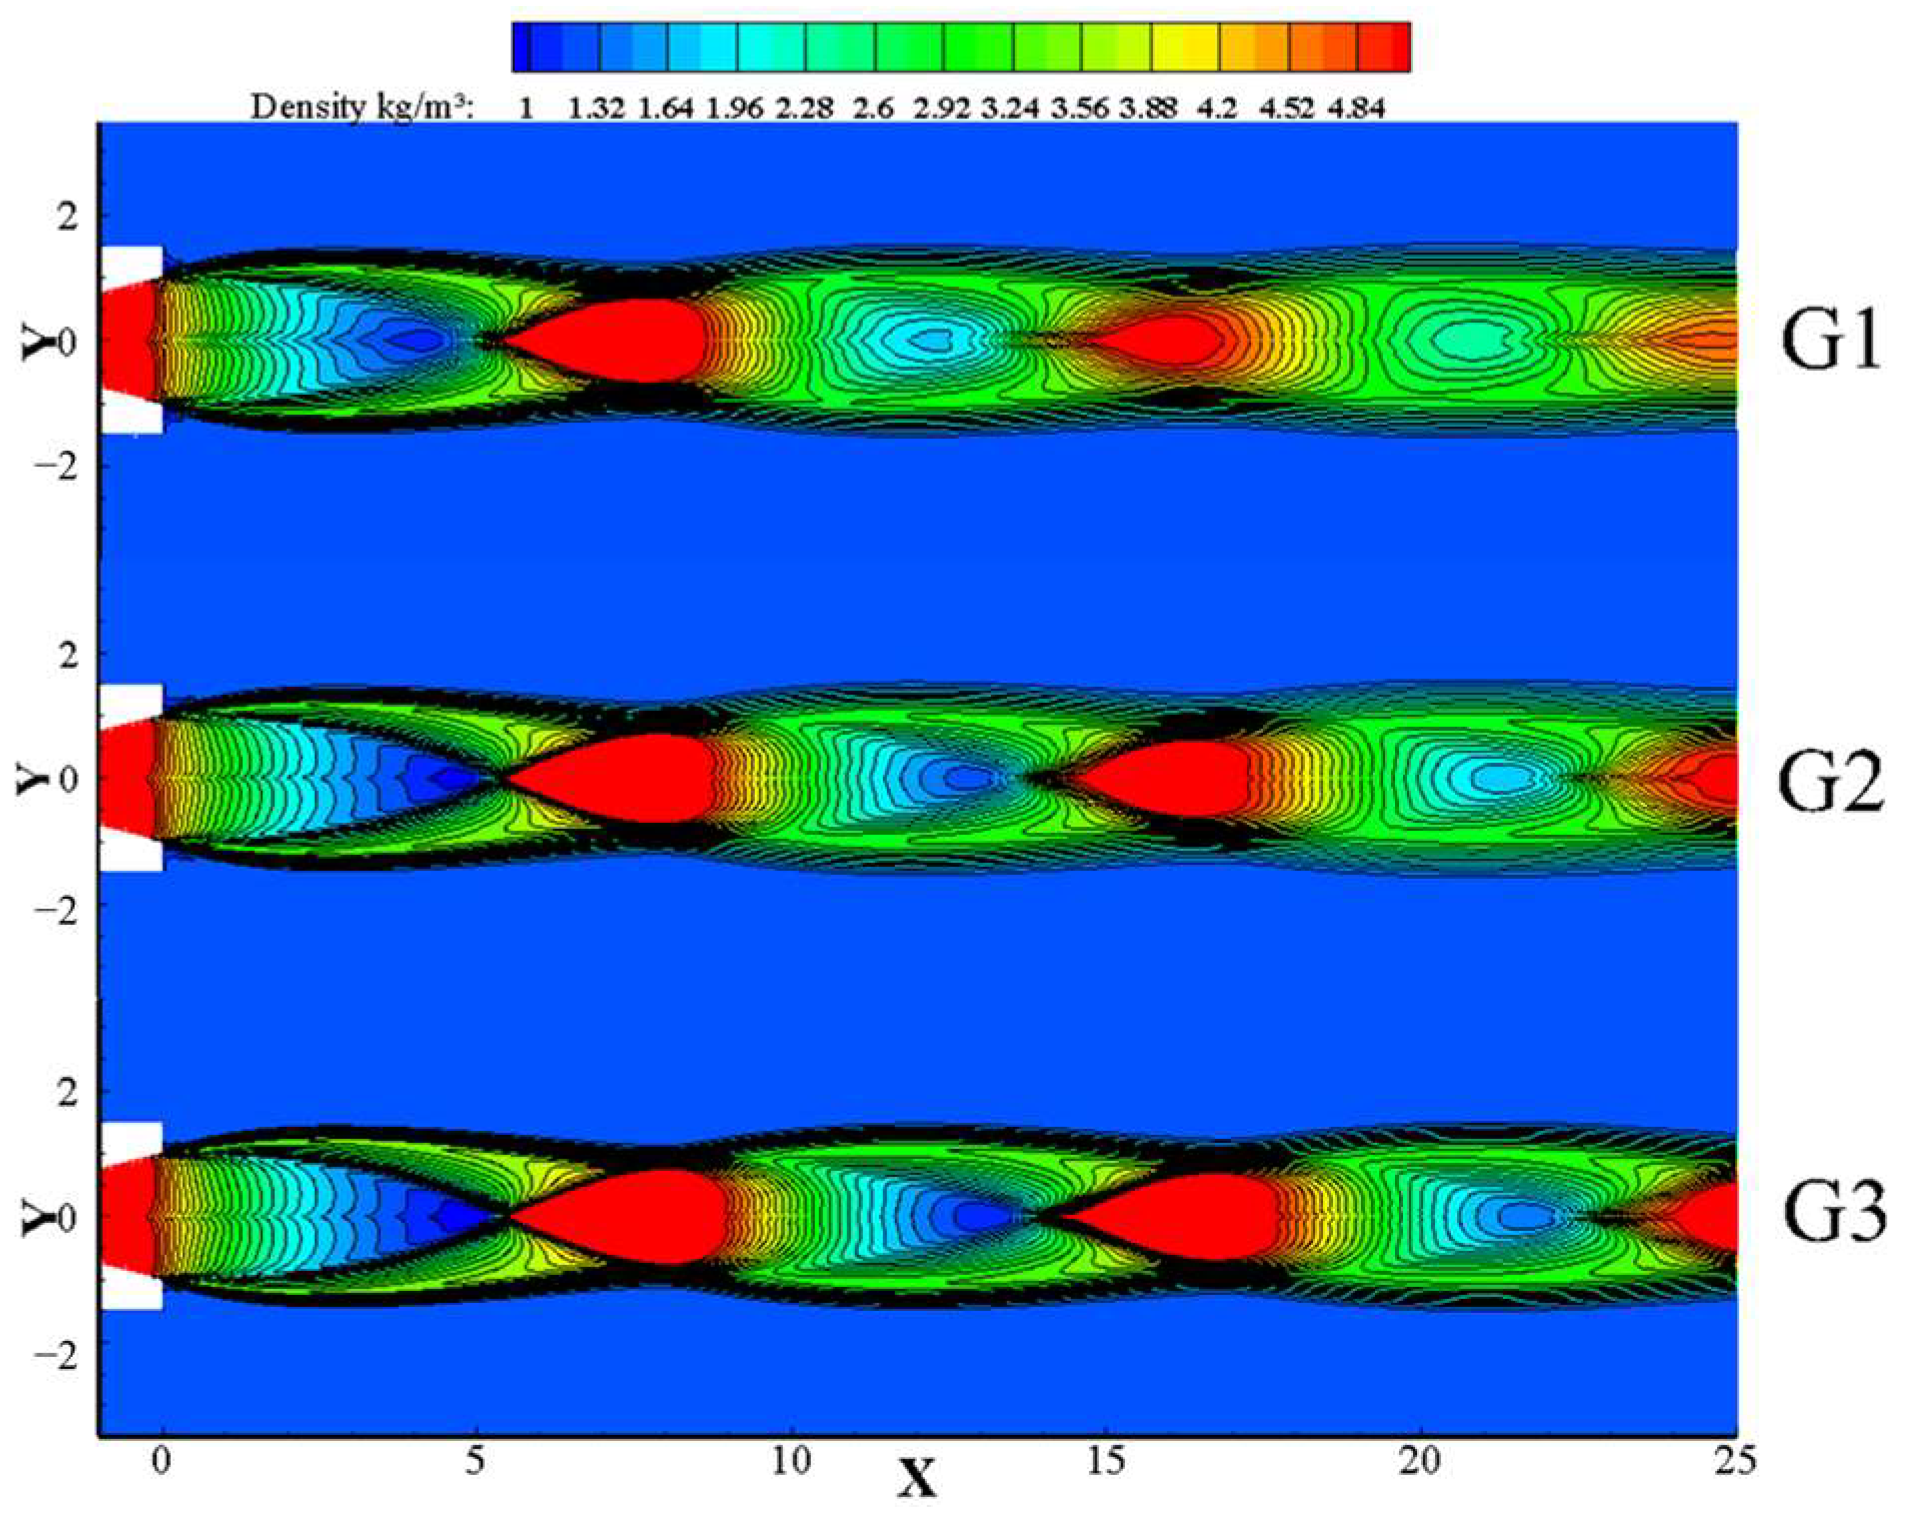
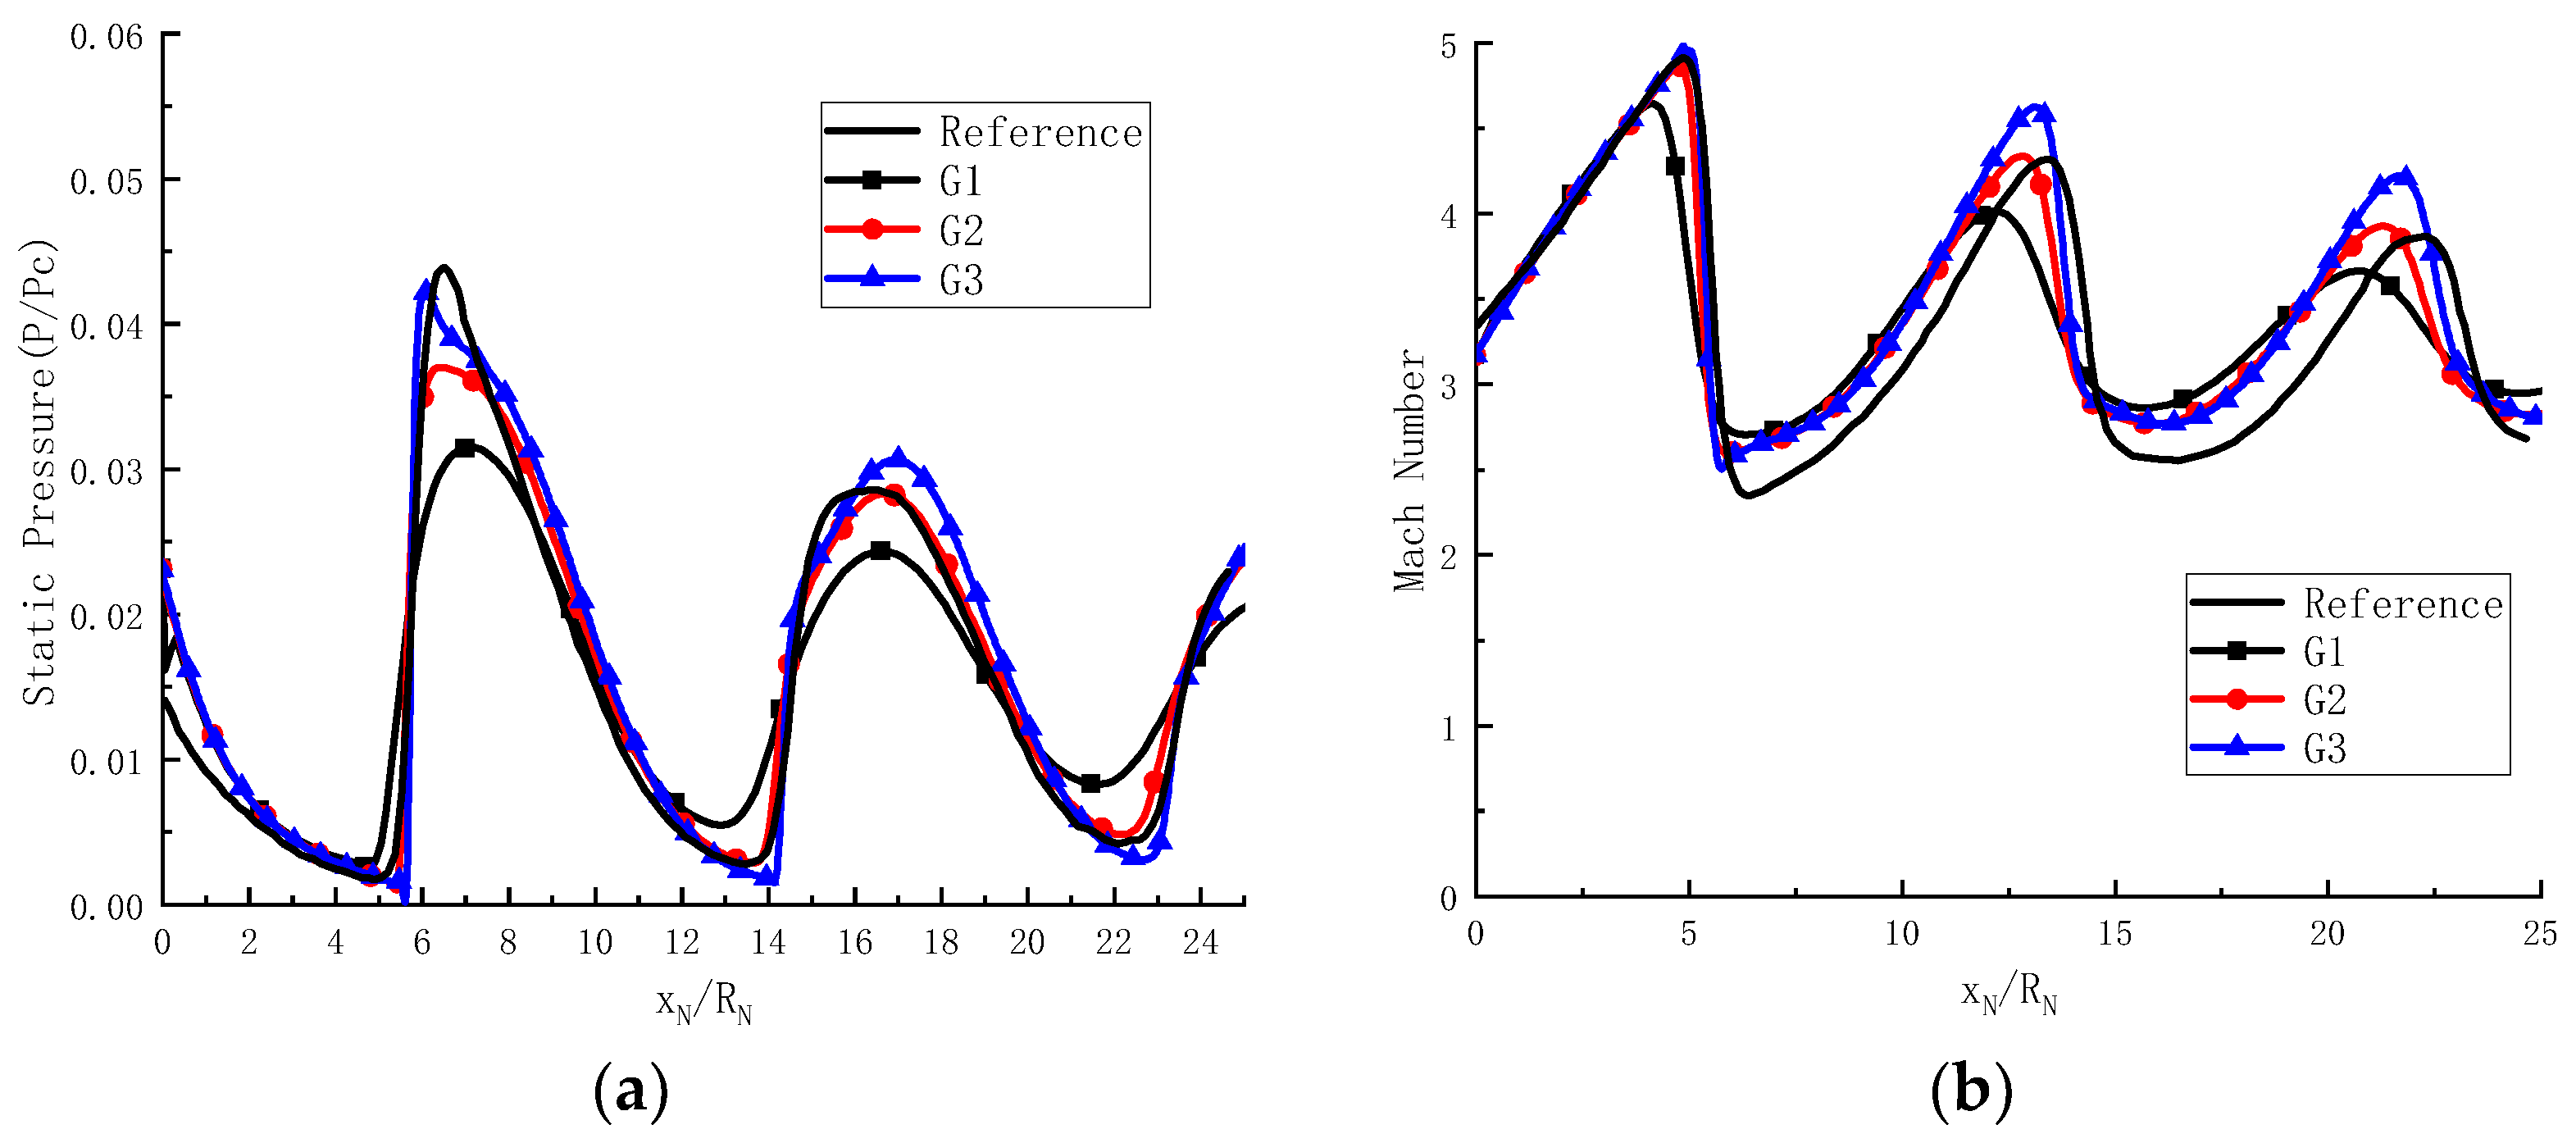
2.2. Determination of Grid Scale

In numerical simulation, the grid size directly affects the calculation accuracy. The smaller the grid size, the greater the grid number and the higher the accuracy, yet also the higher the calculation cost. Therefore, it is necessary to select an appropriate grid size to ensure that the calculation error is small enough and the computational cost is acceptable. In this paper, the experimental conditions and results of the literature were used to compare and verify grids of different scales [17] and finally to determine the appropriate grid scale.
As shown in Figure 1a, the calculation domain included the nozzle section with the outer area, where the nozzle outlet radius RN was 8.26 mm, the throat radius RT was 3.6 mm, and the length of the nozzle expansion section was 20 mm. In order to reduce the influence of boundary conditions on the jet area and better simulate the supersonic jet field, the calculation area outside the nozzle was large enough. In the case of free jet, the area of the flow field was 180 RN × 36 RN, with an orthogonal quadrilateral grid adopted, as shown in Figure 1b.
To study the impact on the capture accuracy of the shock wave structure downstream of the nozzle, three grid scales were selected, namely grid G1-RN/12, grid G2-RN/24, and grid G3-RN/48. The nozzle inlet conditions were set as follows: total pressure Pc was 6.76 × 10⁶ Pa, temperature was 295 K, and ambient pressure was atmospheric. The simulation time performance under the three grid scales, which was conducted using the same calculation end conditions by the pressure base solver and Euler model, is shown in Table 1. As the number of grids increased, the memory footprint of the computing resources and the calculation time in the simulation process increased. The calculation time increased faster than the memory footprint.
The gas density clouds simulation results of the supersonic free jet at three grid scales are shown in Figure 2. The position coordinates in the figure are dimensionless, divided by the nozzle outlet radius. It was found that as the number of grids increased, the shock system structure of the supersonic free jet became clearer. In the gas density cloud of the mesh model G1, the oblique shock structure at the third node of the jet was almost indistinguishable. In the gas density cloud of the mesh model G3, the oblique shock at the third node was relatively clear. Compared with the schlieren of the free jet tested by Tsuboi et al. [19], it can be found that the length of the jet section in the simulation results was basically consistent with the experimental results, which verified the reliability of the simulation calculation.
Figure 3 shows the distribution of gas static pressure and gas Mach number along the central axis. It was found that the capture of the shock wave position and the calculation of the shock pressure were basically consistent with the literature simulation results [19]. Under the grid model G1 scale, the calculation results were different from the literature results. The dissipation effect of the grid was obvious, resulting in a small gas pressure after the shock wave. Under the grid model G2 scale, the calculation results were significantly improved. Except for the fact that the pressure after the first oblique shock was slightly less than the calculated value in the literature, the rest were consistent with the calculation results in the literature. Under the grid model G3 scale, the structure of supersonic free jet shock wave was more accurately captured and the gas pressure was higher after each oblique shock.
In summary, when the grid scale of the supersonic jet nozzle was encrypted from RN/24 to RN/48, the improvement in calculation accuracy was limited, while the memory footprint of computing resources and the calculation time were greatly increased. Hence, the grid size of the supersonic jet was selected as RN/24.

2.3. Determination of Turbulence Model

It is well known that supersonic impact jets form boundary layers at bulkheads, accompanied by large pressure gradients and flow separation [20]. Simulation prediction of impact jets serves as one of the important tools to verify the performance of the bulkhead. Common turbulence models have good prediction of heat transfer coefficients in shock jets, such as the realizable k-ε model, the Spalart–Almaras (S-A) model, and the shear stress transfer (SST) k-ω model [19]. Here, with the help of Fluent, the above three models were utilized to compare and analyze the wall pressure distribution and flow field characteristics of the impinging jet, in order to select a more suitable turbulence model. The experimental model and working conditions from the literature were used and compared with the experimental results [19].

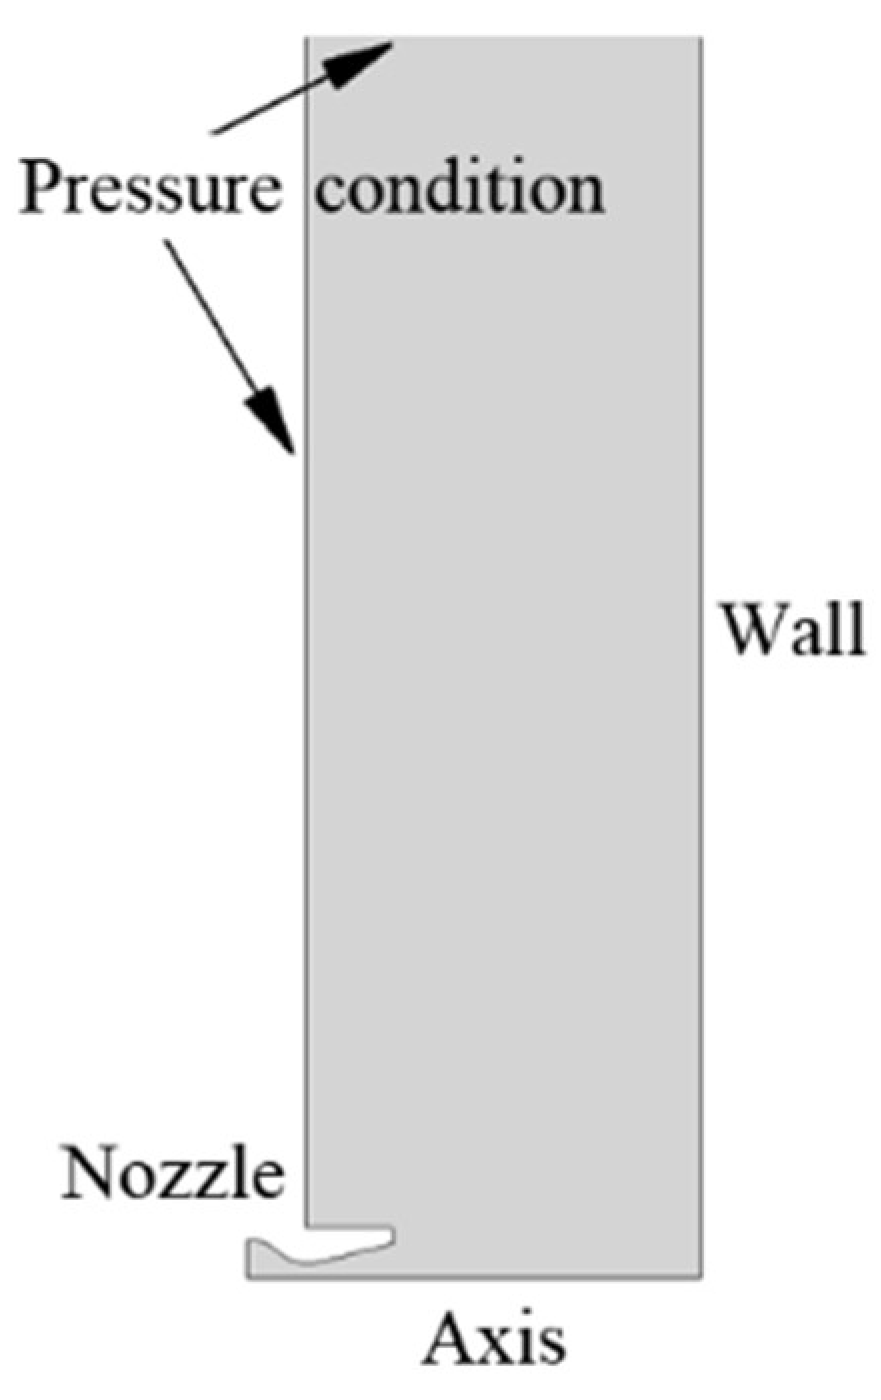
2.3.1. Physical Model

The schematic of the physical model is shown in Figure 4, and the dimension of the nozzle was consistent with the previous text. The wall surface perpendicular to the jet direction was set downstream of the nozzle and three different distances were set from the wall to the nozzle exit, which were 8.74 RN, 12.2 RN, and 15.7 RN. Figure 5 shows the meshing of the model; the mesh was encrypted at the wall position to improve the solution accuracy near the wall.

2.3.2. Comparative Analysis

Figure 6, Figure 7 and Figure 8 show the simulation diagrams of gas density clouds under different working conditions. Comparied with the schlieren diagrams of the corresponding experimental working conditions [19], the structure of the jet shock system under each simulated working condition basically corresponded to the structure in the experimental schlieren diagram. There was an obvious free jet area, wall stagnation zone, and wall jet area. At the same time, the wall had little effect on the upstream structure of the gas shock jet, that is, the free jet area. The three different turbulence models had the same nodal structures as the free jets except for the position near the wall. In the wall jet area, all three of the turbulence models could simulate the continuous shock waves and expansion wave reflection structures. Compared to the S-A model and SST k-ω, the simulation results of the realizable k-ε model were worse in terms of the clarity of the predicted cloud map of this structure. As the compression–expansion system weakened, the wall jet gradually became uniform.
In the wall stagnation zone of the impact jet, the calculation results were significantly different. When the supersonic gas jet encountered the wall structure, the air velocity was reduced to subsonic speed or even zero, forming a pre-wall shock at the front of the wall. For the realizable k-ε model, the pre-wall shock was the most different from other models, especially when the impact distance was 15.7 RN. The shape of the pre-plate shock predicted by the S-A model was similar to that of the SST k-ω model. However, under the S-A model, the pre-wall shock was spaced from the wall surface, making the size of the stagnation zone larger. Compared with the experimental schlieren diagrams [19], the SST k-ω model had better prediction of the shape and position of the shock wave before the plate.
Figure 9 shows the Mach number and gas streamline diagrams of the impinging jet field under different turbulence model computational conditions. Under all calculation conditions, the Mach number distribution of the impinging jet field was basically the same. In some working conditions, there were obvious large-size gas reflux structures in the wall stagnation zone, which were usually referred to as stagnation bubbles. However, for the realizable k-ε model, the impinging jet field at the three wall distances did not produce reflux structures, i.e., there was no stagnation and antifoaming. For the other two models, all calculation conditions showed stagnation bubbles. When the spacings were 8.74 RN and 12.2 RN, the area of the reflux zone predicted by the S-A turbulent model was significantly larger than that of the SST k-ω model, which calculated a weaker airflow reflux. When the spacing was 15.7 RN, both of the turbulence models predicted the stagnation bubbles in the impinging jet field, and the sizes of the wall reflux zone were similar.
Figure 10 shows the comparison of wall static pressure simulation results and experiment results of the vertical wall supersonic impact jet under different wall spacing and turbulence model conditions. The experimental results were derived from the work of Tsuboi et al. [19]. With the increase in the spacing between the wall and the nozzle, the static pressure value of the stagnant zone in the center of the wall decreased and the distance from the axis of the first oblique shock reflection point in the wall jet area increased. This was due to the decrease in the pre-wall shock intensity with the extension of the gas jet. Among the three turbulence models, the simulation result of the SST k-ω model was the closest to the experimental value for the static pressure distribution. The realizable k-ε turbulence models always overestimated the static pressure value of the stagnation zone and the error was more pronounced, especially at x NP = 15 . 7   R N . The S-A model prediction was too large for the return zone, making the static pressure value of the wall stagnation zone too small. In the wall jet region, the number of cycles of the gas compression expansion structure under the calculation condition of the SST k-ω model was higher than those of the other two turbulence models.
In summary, the SST k-ω model had obvious advantages over the other two models in the simulation prediction of the supersonic gas shock jets. It was more accurate in calculating the static pressure distribution of the wall and predicting the complex flow field structure of the impact jet. Therefore, the SST k-ω model was selected for the simulation calculation.

3. Collision of Particles with Solid Bulkheads

The collision with the bulkhead is one of the important factors affecting the movement of particles, which is also a prerequisite for studying the effect of particle erosion. Usually, collisions are divided into elastic collisions and inelastic collisions. When using the inelastic collision model, it is assumed that the particles completely attach to the solid wall and disappear into the calculation domain after the collision. When calculated using the elastic collision model, it is assumed that the rebound process occurs when the particles collide with the solid wall, which not only produces a loss of momentum of the solid particles, but also changes the direction of the particles (as shown in Figure 11). During the collision between particles and solid wall, their momentum changes are determined by the recovery coefficient. When the recovery coefficient is zero, it indicates that the momentum of the solid particles completely disappears and the particles are attached to the wall; when the recovery coefficient is one, it indicates that the collision is completely elastic and the solid particle momentum is not lost before and after the collision [21].
There are many factors that affect the elastic collision process of particles, such as bulkhead material properties, particle incidence angle and velocity, etc. It is shown that the recovery coefficient determining the rebound velocity of particles is a function of the angle of incidence θ1, and the Forder collision model [22] was used here. The specific expression is as follows:
E n   = V 2 , n V 1 , n = 0.988 0.78 θ 1 + 0.19 θ 1 2 0.024 θ 1 3 + 0.027 θ 1 4 E t   = V 2 , t V 1 , t = 1 0.78 θ 1 + 0.84 θ 1 2 0.21 θ 1 3 + 0.028 θ 1 4 0.022 θ 1 5
where En is the normal recovery coefficient perpendicular to the solid wall, Et is the tangent recovery coefficient of the solid wall, and V1,n, V2,n and V1,t, V2,t are the normal velocity and tangential velocity before and after the collision of the particle and the solid wall surface, m/s, respectively.

3.1. Particle Erosion and Deposition Model of Bulkhead

Particle erosion is mainly caused by the impact of solid particles entrained in the fluid on the bulkhead. This erosion can lead to reduced bulkhead performance and a shorter service life. The influencing factors of erosion mainly include collision speed, collision angle, bulkhead performance, wall temperature, friction coefficient between particles and bulkheads, shielding effect caused by rebound particles, etc. Here, the research results of Troyes et al. [23] were used to study the erosion rate of solid particles on solid walls, and Al2O3 was selected as the typical component of the solid particles after motor ignition. The erosion rate of a single particle on a solid bulkhead was calculated as follows:
Q e r o s i o n = m p a r C d p a r v p a r 2 4 σ s w a l l f θ 1
where Q erosion   is the dimension, m3; C ( d par )   is a function related to the diameter of the particle, taking a constant of 0.5; m par   is the mass of a single impacting particle, kg; v par is the velocity of a single particle hitting the wall, m/s; and σ s - wall is the yield strength of the wall material for impacting the wall, MPa. ƒ(θ1) is a function related to the angle of incidence θ1, defined as follows:
f θ 1 = s i n 2 θ 1 3 s i n 2 θ 1         0 < θ 1 < 18.5 1 3 c o s 2 θ 1             θ 1 > 18.5
Fitting the above equation in the form of a polynomial of order 4 yields:
(1)
0 < θ 1 < 0.323 rad f θ 1 = 2 θ 1 2.996 θ 1 2 1.372 θ 1 3 + 1 . 155 θ 1 4
(2)
θ 1 > 0.323 rad f θ 1 = 0.3163 + 0.1149 θ 1 0.6173 θ 1 2 + 0.316 θ 1 3 0.03253 θ 1 4
When the incidence angle function is within the range, 0   <   θ 1   <   π 2 , its range varies with the angle of incidence as shown in Figure 12. Other conditions being equal, the incidence angle of the Al2O3 solid particles colliding with the wall is about 0.3 rad (17.2°) and the erosion rate of the particle is maximum. When the incidence angle is 0 or π 2 , the erosion rate is 0, and Al2O3 solid particles have no erosion effect on the solid wall.
The number of particles that Al2O3 particles hit on the wall ( A s w a l l ) in an area of time ( Δ t ) is N p a r t i c l e s , then the erosion rate of the wall element ( R e r o s i o n , kg m 2 s 1 ) can be expressed as:
R e r o s i o n = i = 1 N p a r t i c l e s ρ s w a l l Q e i Δ t A s w a l l
where ρ s w a l l is the density of the solid wall material, kg/m3. The dimension at this time is Q e i , caused by the i-th particle. While the solid particles hit the solid wall and cause the wall material to peel off, some solid particles will also attach to the solid wall to produce a particle deposition effect. The deposition effect is only related to the mass and quantity of particles hitting the wall, and the particle deposition rate ( R a c c r e t i o n ) is defined as:
R a c c r e t i o n = p = 1 N p a r t i c l e s m ˙ p A f a c e

3.2. Calculation Condition Setting

The balance components of the combustion chamber outlet are shown in Table 2 [24]. They were used to calculate the mass flow rate of solid particles. When the total mass flow of the motor was 3.5 kg/s, the mass flow rate of the solid particles was 0.635 kg/s. A random orbital model was used to calculate the pulsation of the solid phase.
To simplify the calculation, the following assumptions were made here: (a) there was no mass exchange between the gas phase and the solid particle phase; (b) ignoring complex conditions such as chemical reactions in the jet field and secondary interactions between gas–solid phases, such as Basset force, Saffman lift, etc.; (c) during the flow process, the particle phase property parameters were constant; and (d) radiative heat transfer was not considered.
Suppose the Al2O3 particles exist in a solid-phase spherical form with a density of 3800 kg/m³, a specific heat of 1254 KJ/(kg · K) [25], and an average size of about 5 μm [26]. The nozzle inlet is the Al2O3 particle injection position, and the particles are uniformly added to the flow field in the form of a surface source. The bulkhead is set as a reflection boundary. The exit of the flow field is set as an escape condition, and the particle track calculation stops when the particles overflow the calculation area.

4. Two-Phase Jet Field Analysis at Different Impact Distances

4.1. Study on Two-Phase Jet Fields

Figure 13 shows the velocity distribution of the particle phase and the gas phase after the accidental ignition of the motor at three different jet impact distances. The left side of the figure is the particle motion trajectory and velocity distribution, while the right side is the gas phase velocity distribution. Contour lines are the gas Mach numbers. The particle injection caused significant changes in the flow structure of the supersonic impact jet field. As can be seen from the velocity comparison of the motions in the figure, the velocity of the gas phase component was higher than that of the particle phase component, and the hysteresis effect of the particle movement relative to the gas flow was obvious. This is caused by the characteristics of the particles themselves. After passing through the nozzle, the gas phase expanded and accelerated due to its compressibility, and soon reached supersonic speed. The particle phase was incompressible and could only rely on the aerodynamic force of the continuous phase to move. However, the particle phase more easily maintained the original motion state under the action of inertia, and the speed change lagged. At the same time, the hysteresis of the particle phase could also affect the flow of the gas phase, resulting in a change in the gas-phase flow structure, i.e., a change in the shock wave structure.
In the free jet zone, the particle phase velocity lagged the nozzle throat, its movement boundary was smaller than the gas phase boundary, and it grew slowly. Under the action of aerodynamics, the particle phase gradually accelerated. Under the action of inertia, the velocity of the particle phase did not change significantly when intercepting the shock wave through the jet, resulting in a downstream particle phase velocity that was slightly higher than the gas phase velocity. However, the hysteresis effect of the particle phase velocity hindered the formation of subsequent intersecting shock waves. In the wall jet area, the addition of particle phases led to a decrease in the air velocity of the wall jet area and the supersonic range. The particle phase in the jet gradually entered the mixing zone of the flow field. Under the influence of turbulence in the mixing zone, the movement of the particle phase began to pulsate irregularly. At the same time, the particle phase motion boundary gradually coincided with the jet gas phase boundary.
In the wall stagnation zone of the impact jet, the addition of solid particle phases had the greatest effect on the flow field. Compared with the pure gas-phase flow field, the distances between the shock wave and the wall surface of the two-phase jet field were significantly increased in the 8.74 RN and 12.2 RN working conditions. In the 15.7 RN working condition, the flow structure of the retardation zone was consistent with the previous two working conditions and quite different from the pure gas phase. This was because the particle phase rebounded many times at the near wall after hitting the wall. On the one hand, a higher degree of particle aggregation was formed in the near wall area, and the particle phase distribution density was higher. On the other hand, the rebound of particles had a stronger hindrance to the flow of the jet gas phase, making the wall front shock move forward, as shown in Figure 14. In the 15.7 RN working condition, the original stagnant flow defoaming structure disappeared, which was attributed to the particle phase changing the structure of the jet impingement system.
Figure 14 shows the distribution of the particle aggregation in the two-phase impact jet field at three different distances between the wall and the nozzle. The areas of dense particle aggregation in the flow field were mainly near the nozzle and in the wall stagnation zone of the jet. After the particle phase left the nozzle, the aggregation degree of the particle phase at the axis gradually decreased with the expansion of the jet diameter. The rebound effect of the nozzle throat on the particles resulted in a higher aggregation at the edge of the particle phase movement. From the Mach number contour distribution, the difference in the distributions of the particle phase aggregation was the main factor leading to the special structure of gas jets in the flow field. In the wall jet zone, due to the rebound action of the wall, the concentration of particles near the wall was smaller than the jet boundary position within the approximate s R N < 15   range, while the situation was the opposite in the downstream position.

4.2. Study on the Erosion and Deposition of Particles on the Wall

Figure 15 shows the calculated erosion rate of solid particles relative to the wall in the two-phase jet at different impact distances, while Figure 16 shows the deposition rate of solid particles at the wall.
In the two-phase impact jet field of the motor, the relative wall erosion rate and particle deposition rate of particles increased with the increase in radius, and then decreased. The erosion effect and deposition effect of particles on the wall were mainly concentrated in the s R N < 4 range. Near the edge of the stagnation zone of the jet wall ( s R N = 2 ), the particle erosion rate and deposition rate suddenly became 0, which made the erosion rate and deposition rate curves appear as double peaks. The highest erosion rate of particles relative to the wall in the motor jet was in the 2 < s R N < 3 range, while the position with the higher rate of particle deposition was in the s R N < 2 range. As the impact distance of the motor jet increased from 8.74 RN to 15.7 RN, the maximum erosion rate and maximum deposition rate of the wall gradually decreased.
Figure 17 shows the distribution of particle phase aggregation at local positions on the wall in the two-phase jet field under different jet impact distances, and the contour line of the figure is the gas Mach number contour. The figures show that the first collision between the particle phase and the wall was in the stagnation zone. As the particle incidence angle near the axis was close to perpendicular, the wall erosion rate at the jet axis was almost zero. As the radius increased, the angle of incidence of particle collision with the wall decreased. At the same time, the aggregation degree of the particle phase increased, and the erosion rate of the wall increased and reached the maximum value at the radial edge of the particle movement. When the particles rebounded and were subjected to aerodynamic forces, the radial velocity increased and the angle of incidence of the collision decreased. Moreover, due to the uneven distribution of the first collision between the particle phase with the wall, the particle phase aggregation zone caused by the secondary collision of particles occurred at the wall position 2 < s R N , resulting in the secondary peak of the wall erosion rate and the particle phase deposition rate. Due to the decrease in the angle of incidence of particle collisions, this was the place where the wall erosion rate was the largest. Thus, an area with sparse particles was formed between the area where the wall erosion rate and the particle phase deposition rate were both zero. With the increase in jet impact distance, the radius of the first collision area between the particle phase and the wall increased so that the pos.tion where the erosion rate and deposition rate dropped sharply to zero moved outward, and the particle phase aggregation degree in the secondary collision area decreased. Therefore, the maximum erosion rate also decreased with the increase in impact distance. After the secondary collision between the particle phase and the wall in the wall jet area, the particle phase basically turned to radial motion, so the erosion and deposition rate of the wall was basically zero.

5. Conclusions

In this study, the impact effects of supersonic gas jets and combustion product particles on the bulkhead of a bomb depot after accidental ignition of the motor were studied by simulation. The conclusions are obtained as follows.
(1)
Simulations were carried out using different grid sizes, and the simulation results were compared with previous experimental data. The grid size of the core area of the supersonic jet was selected as RN/24 by the calculation accuracy, and the resources and time consumption of the calculation were comprehensively considered.
(2)
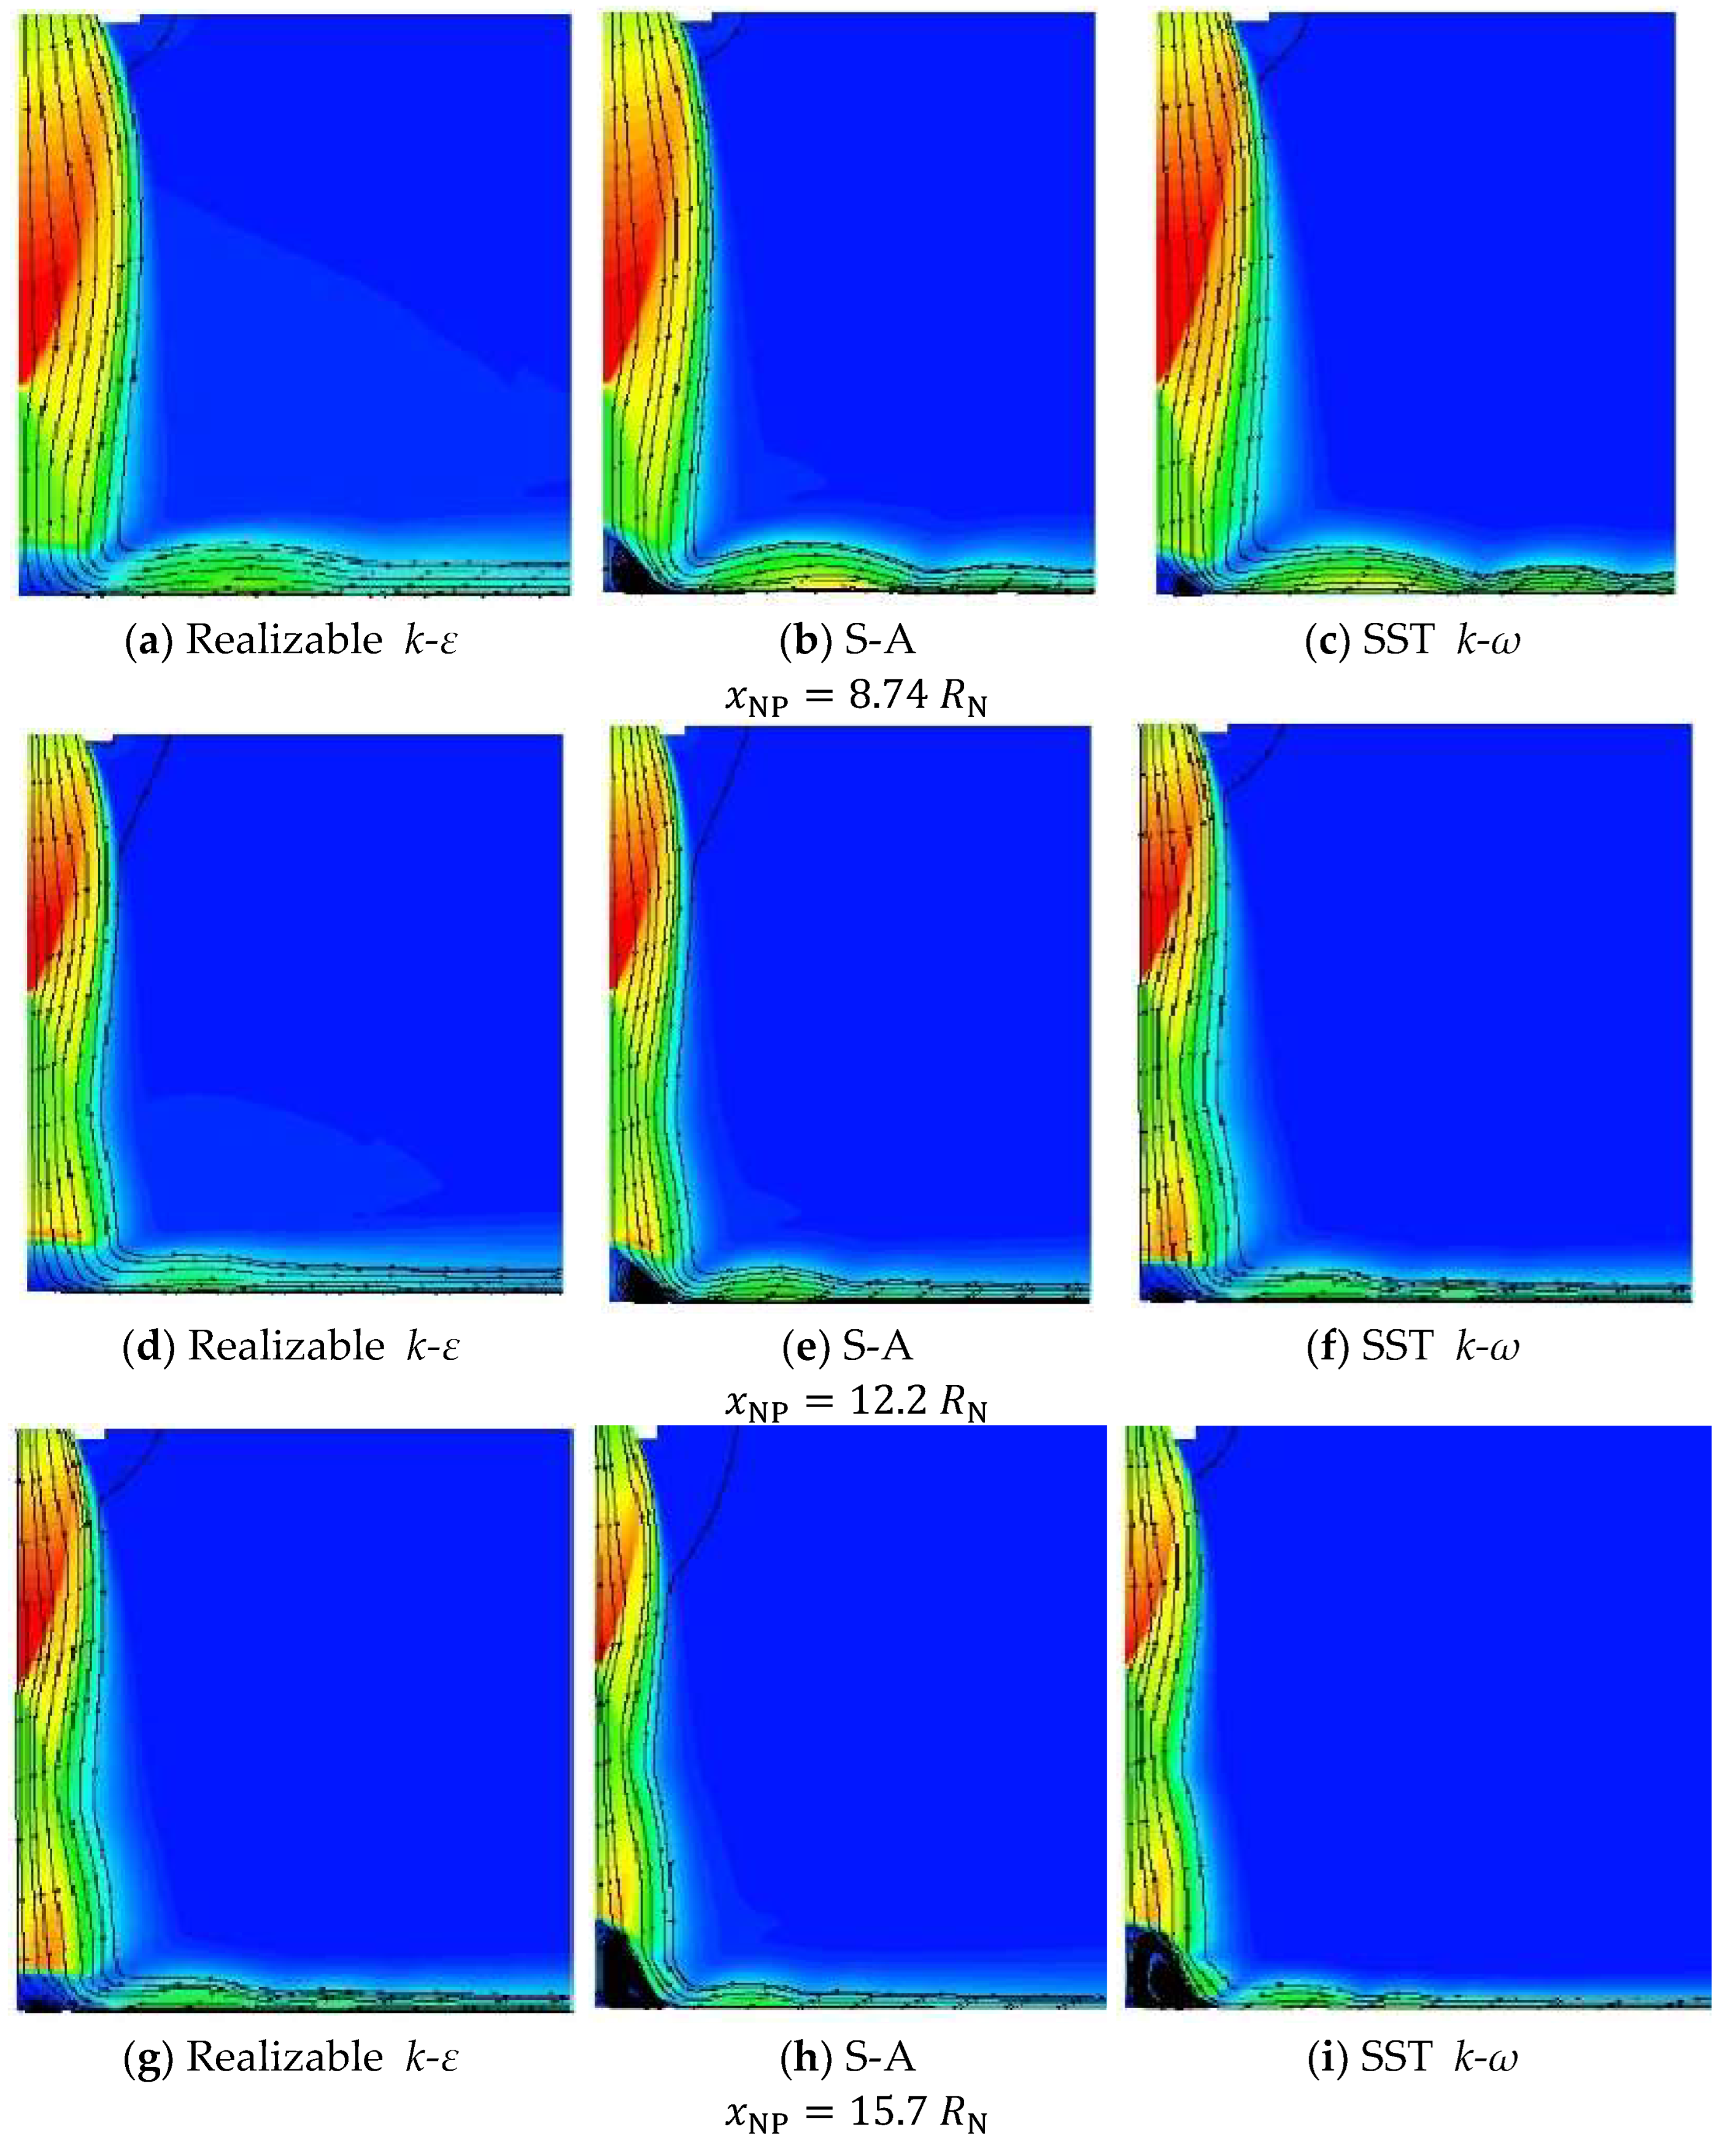
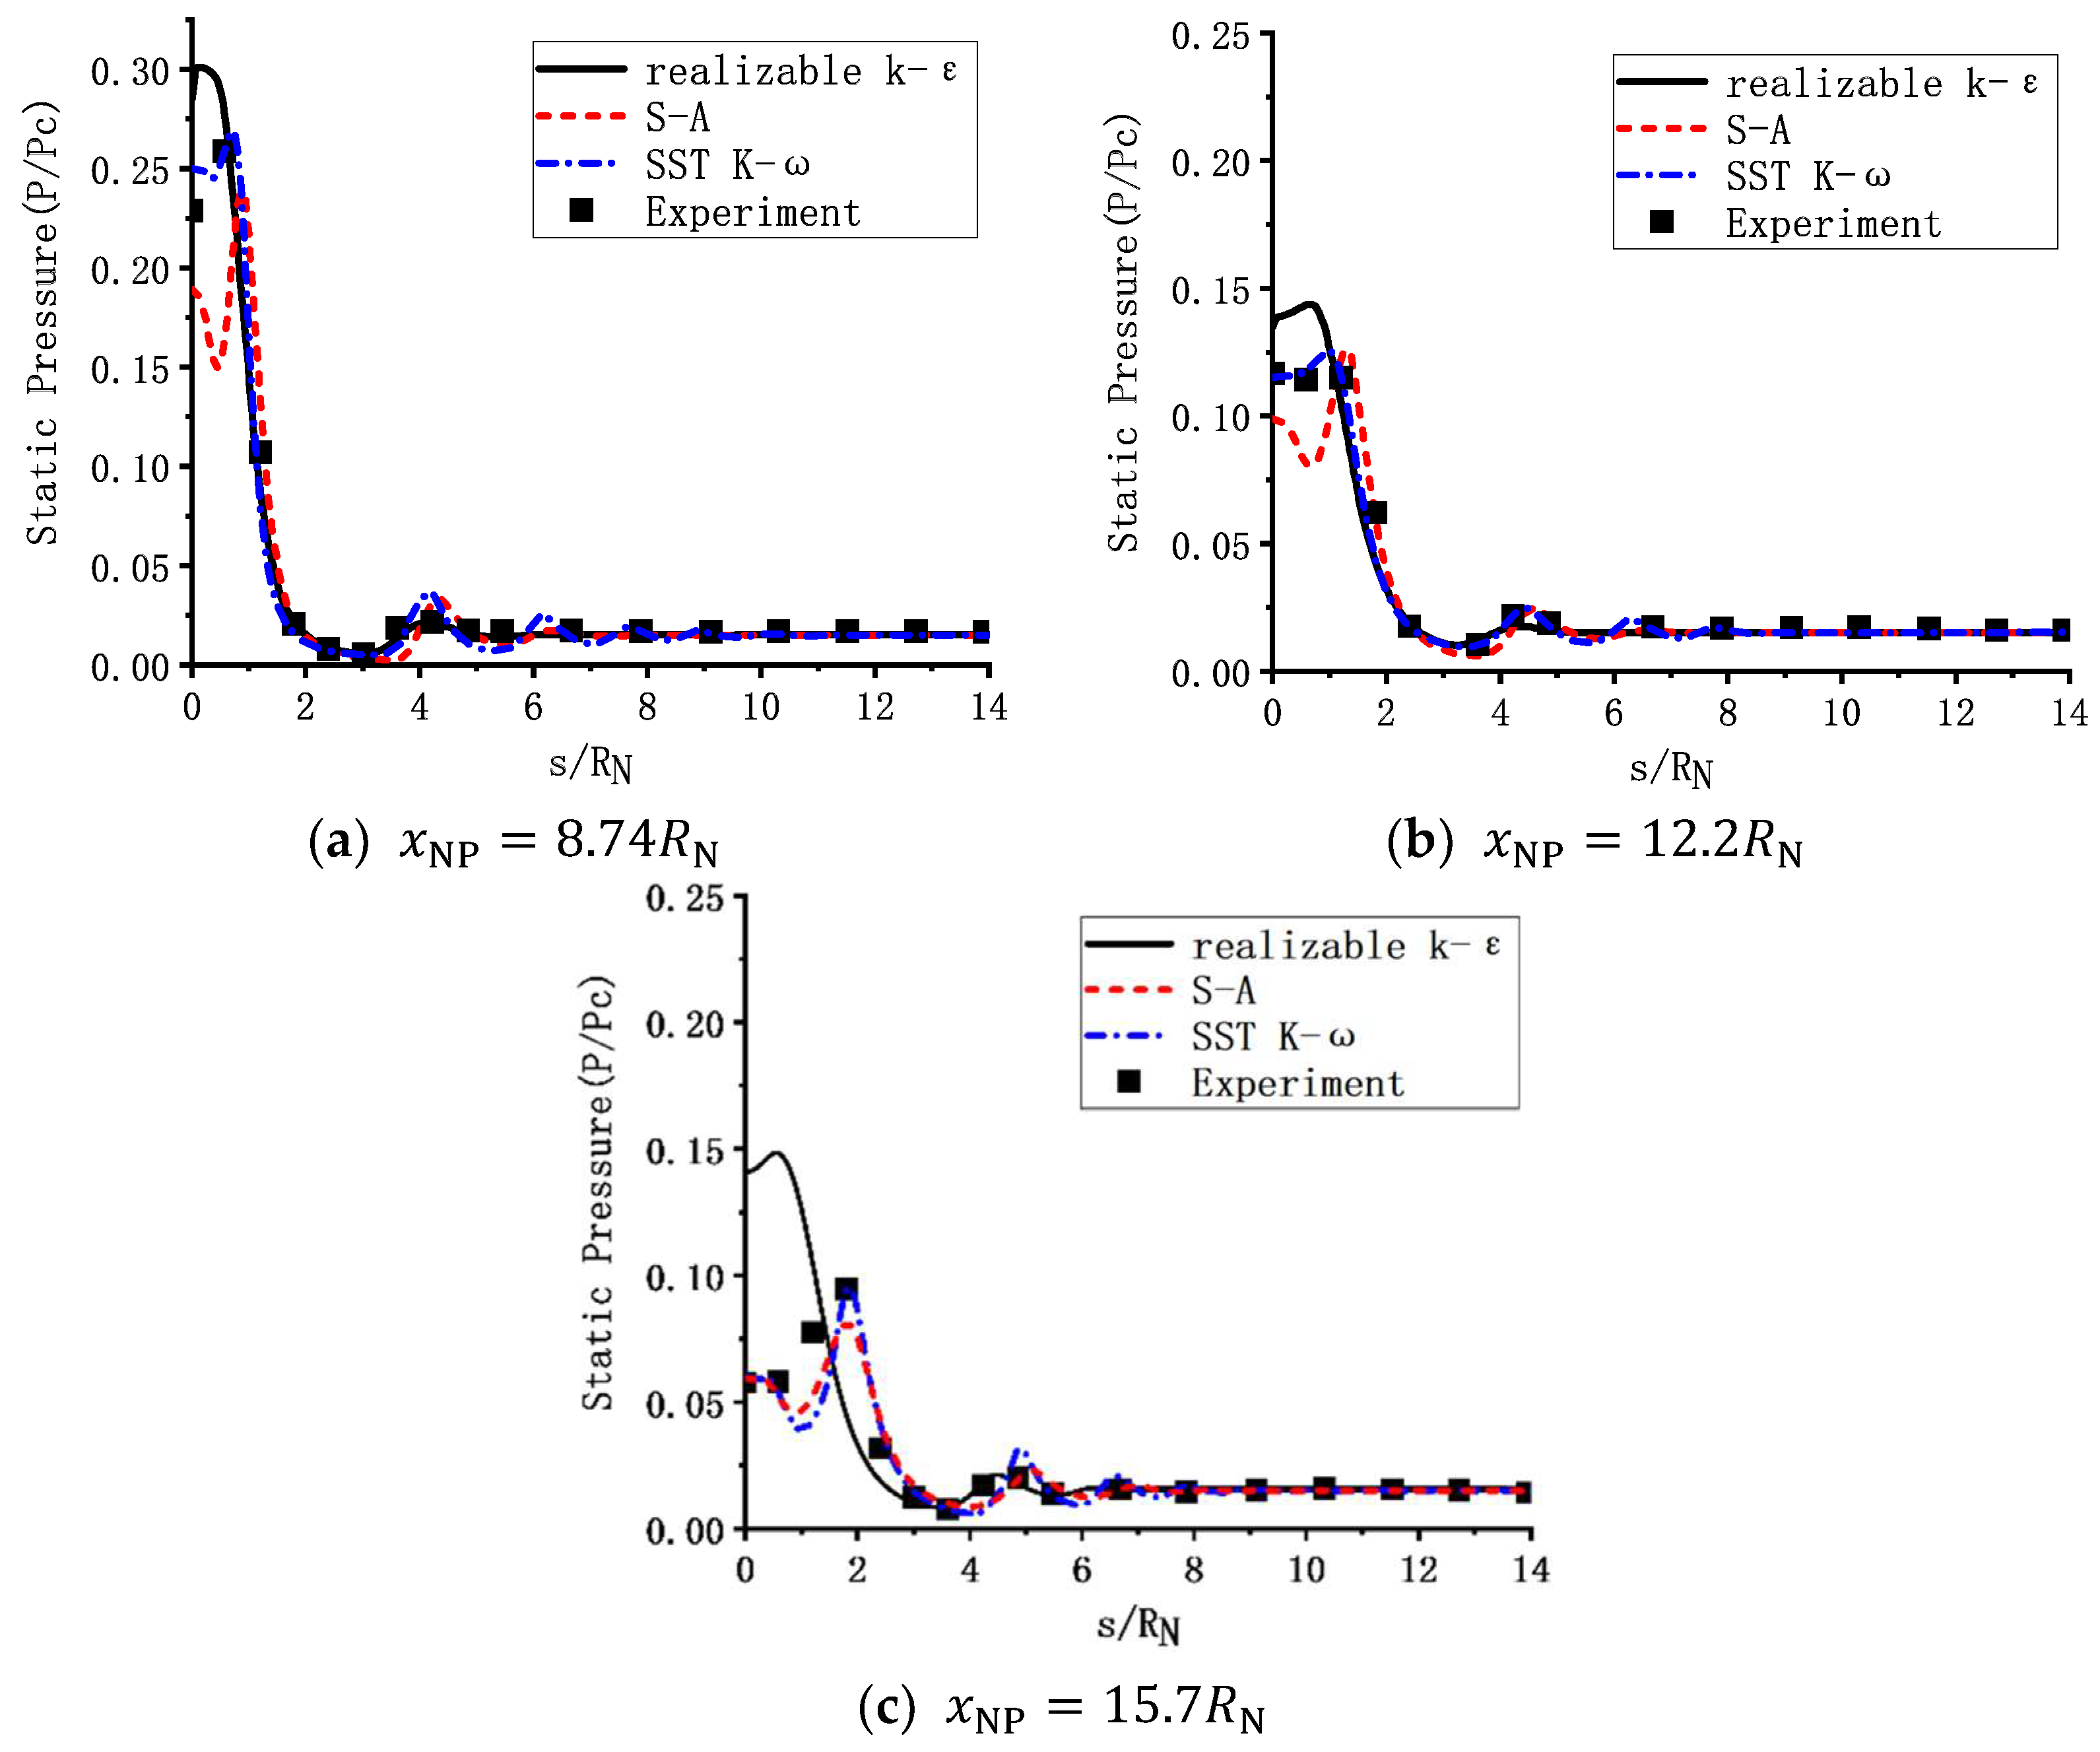
The SST k-ω turbulence model was selected for the simulation. The SST k-ω model had more cycles of gas compression and expansion structures in the wall jet region than the other two turbulence models for different impact distances. The simulation of the static pressure distribution at the wall of the supersonic impact jet was closest to the experimental values.
(3)
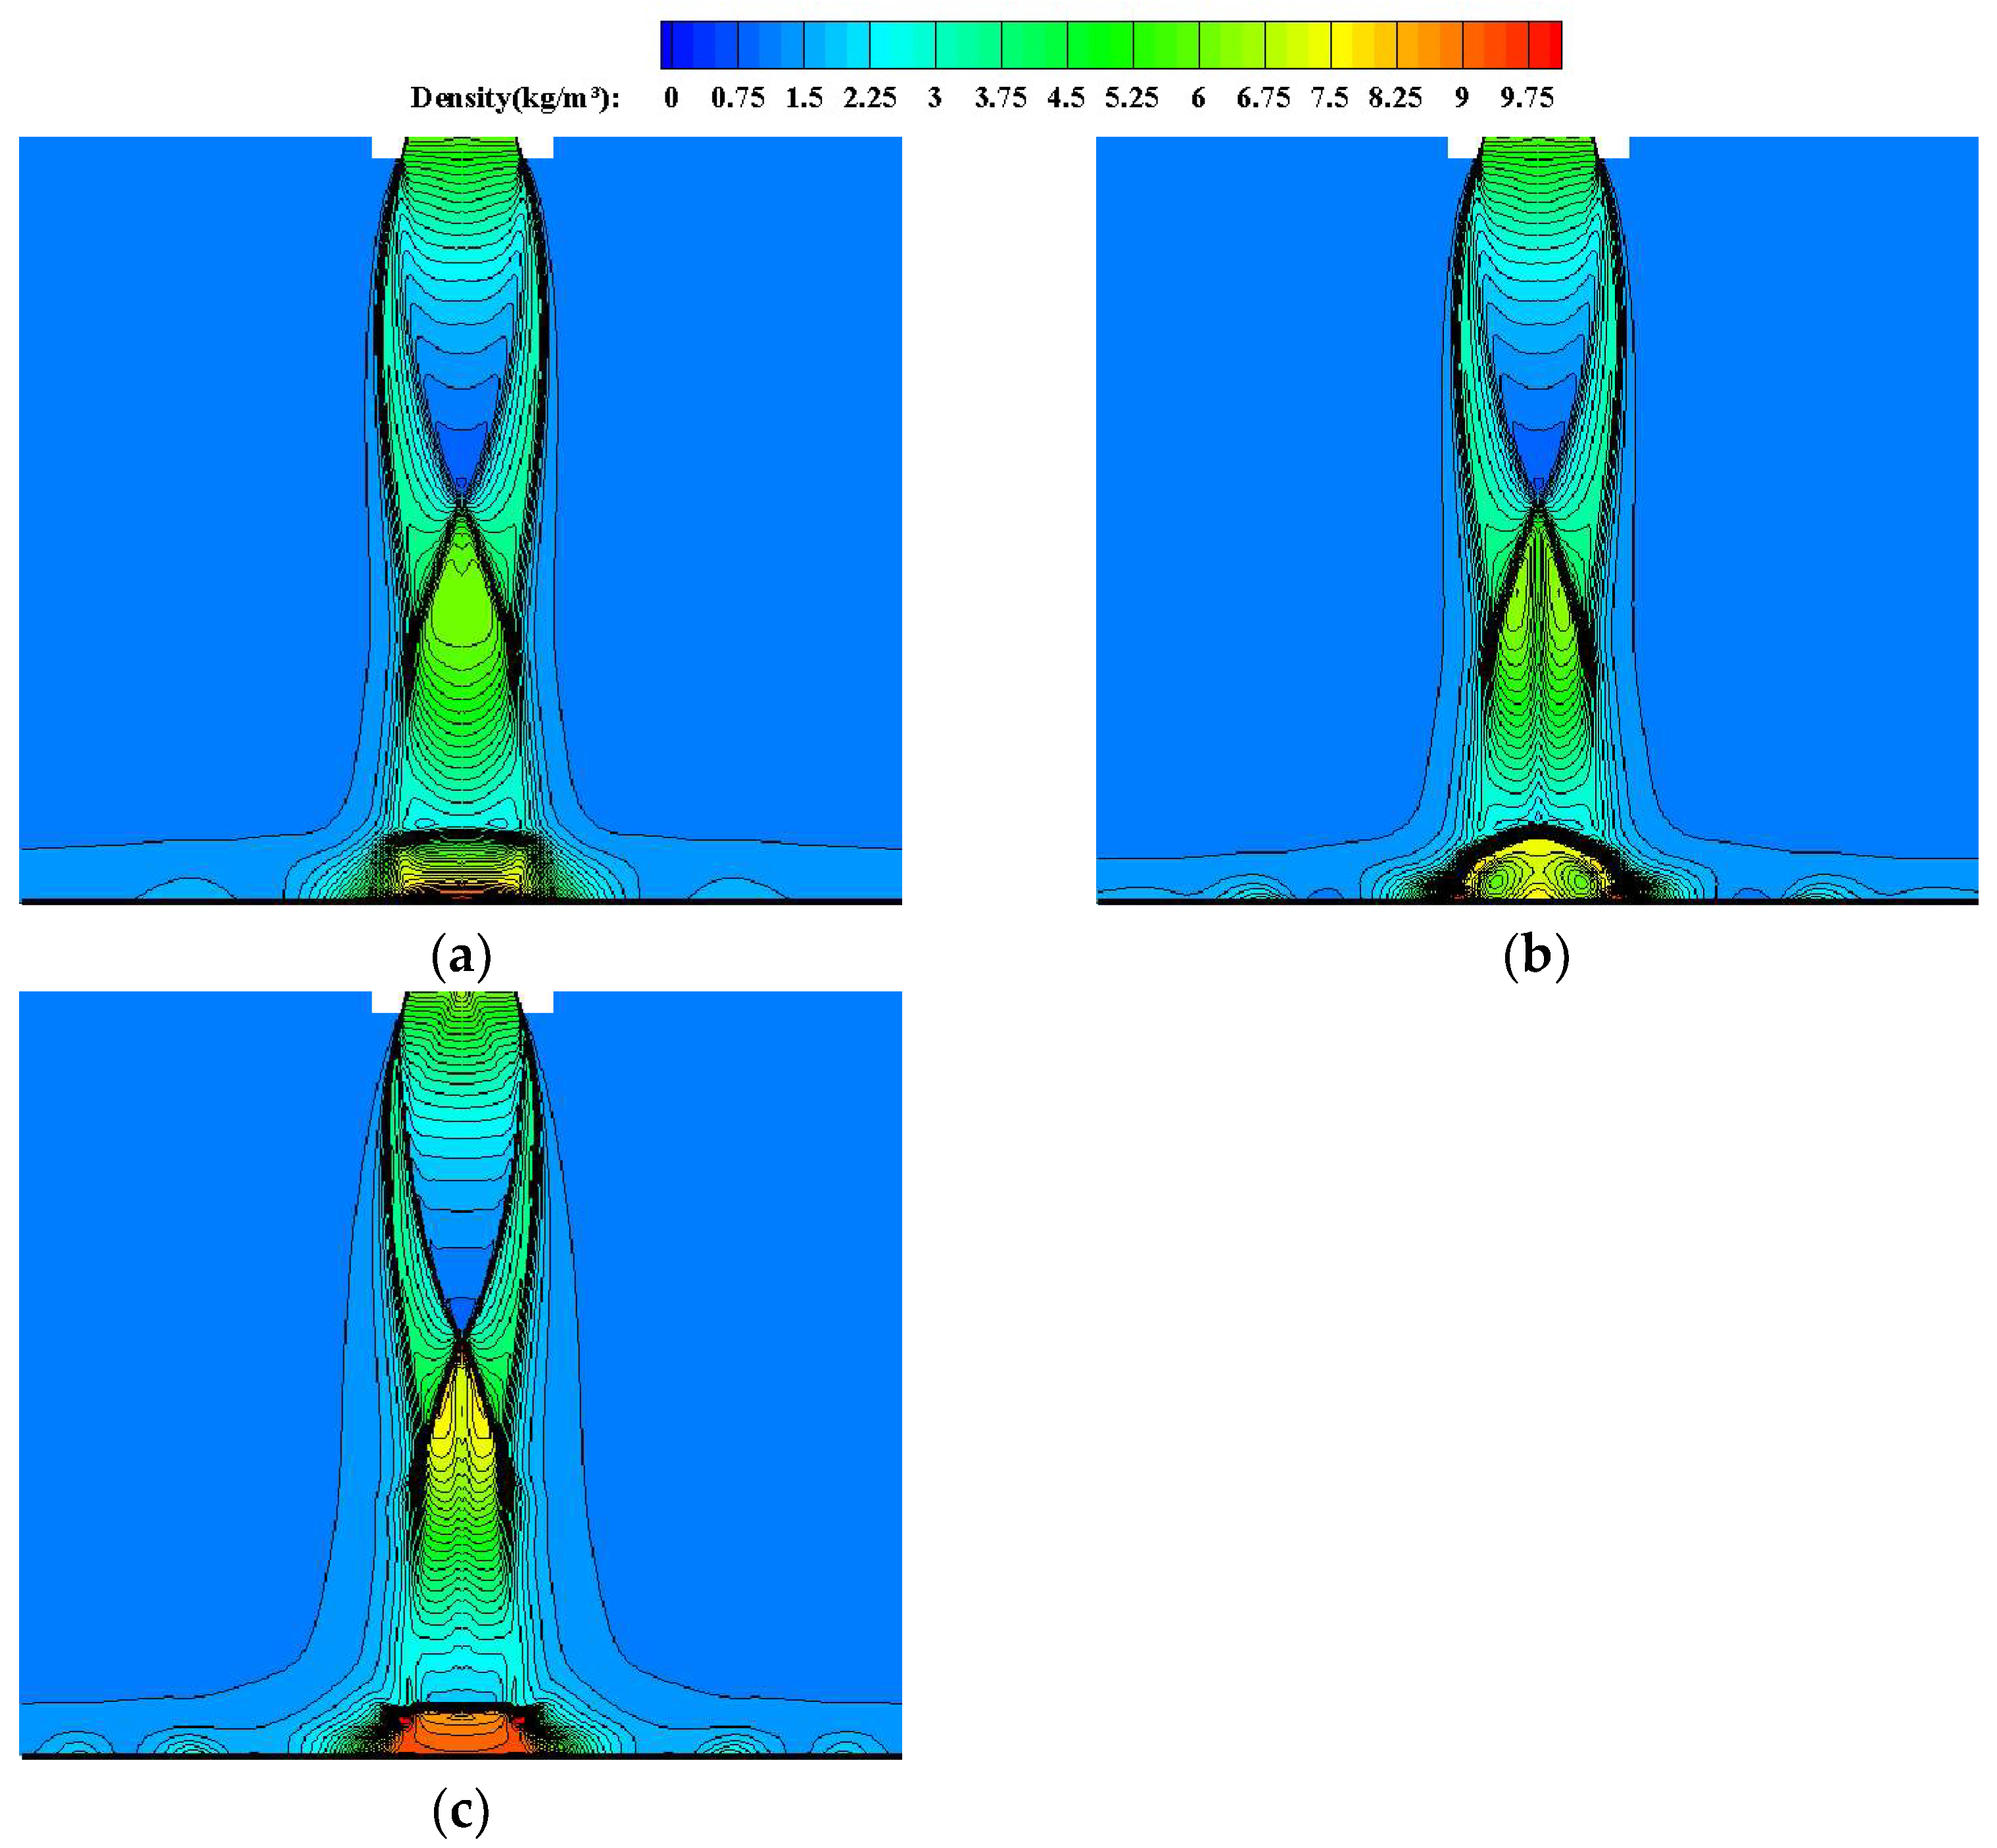
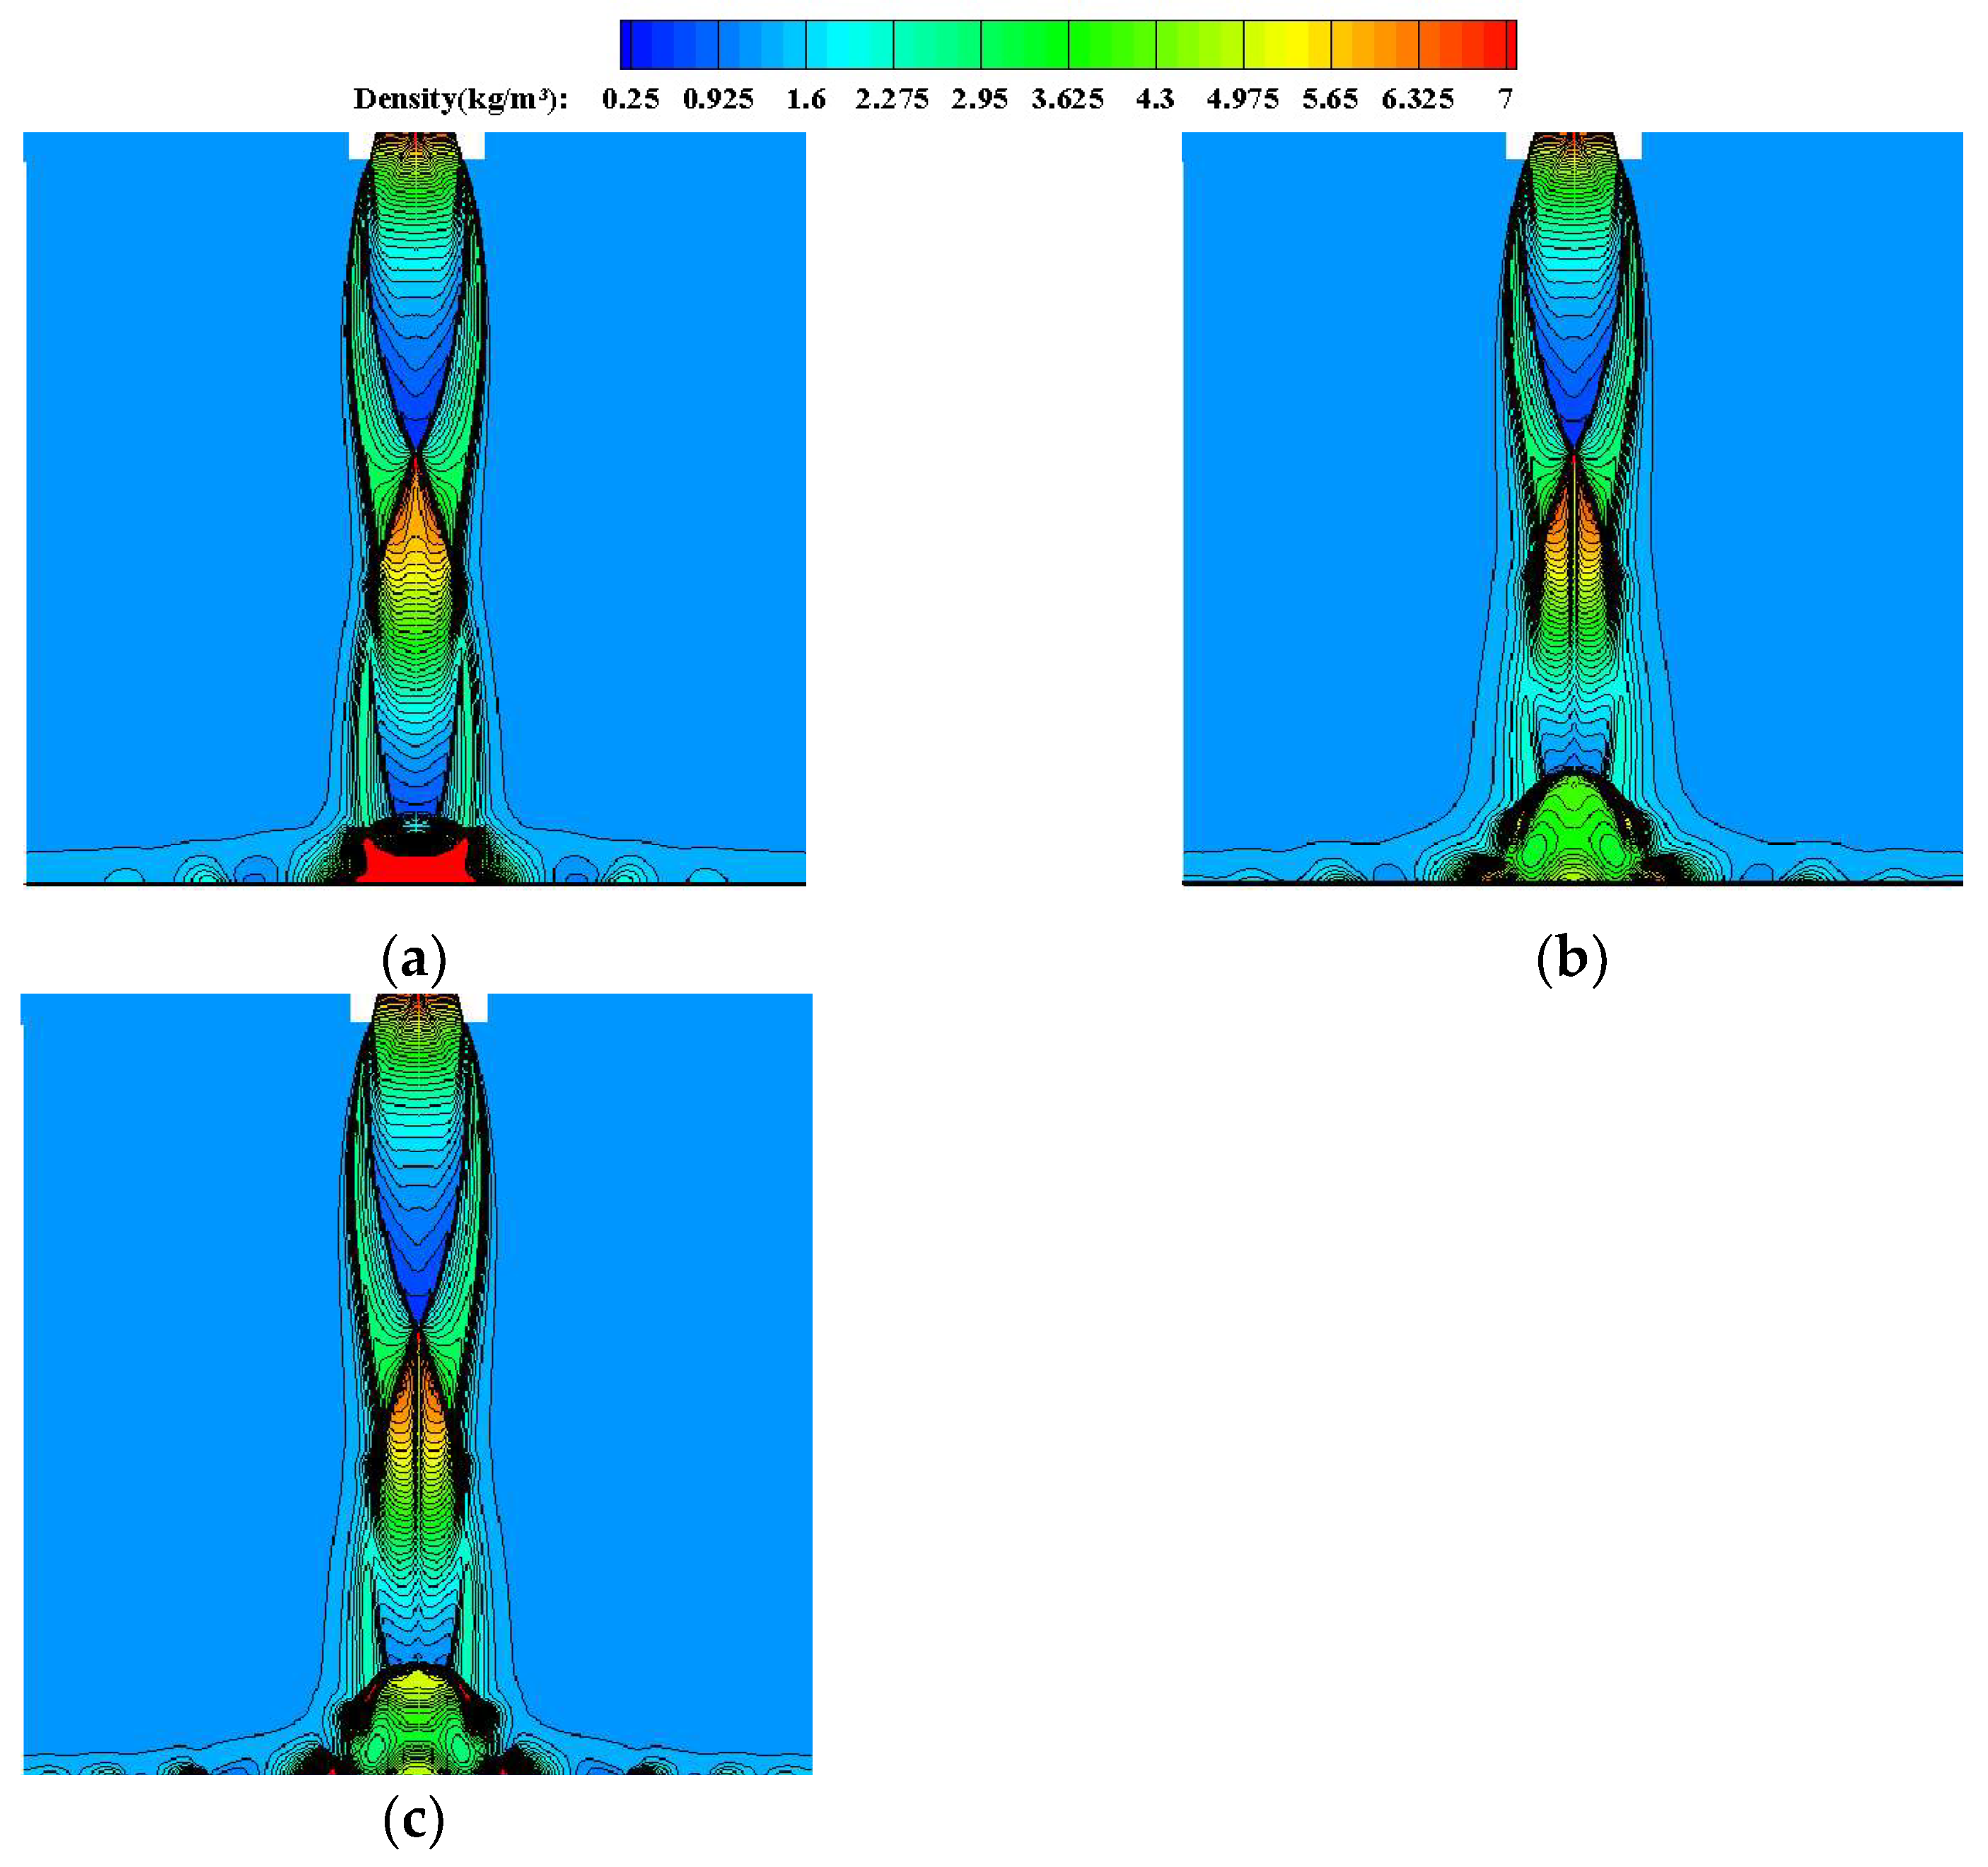
The effects of different shock distances on the two-phase shock jet field of a solid rocket motor were investigated. In the shock jet field, the addition of the particle phase created a hysteresis effect on the airflow, changing the shock structure of the pure gas-phase flow field. The rebound of the particle phase at the wall caused the waves in front of the wall to move forward and the stagnation bubble structures to disappear in some cases.
(4)
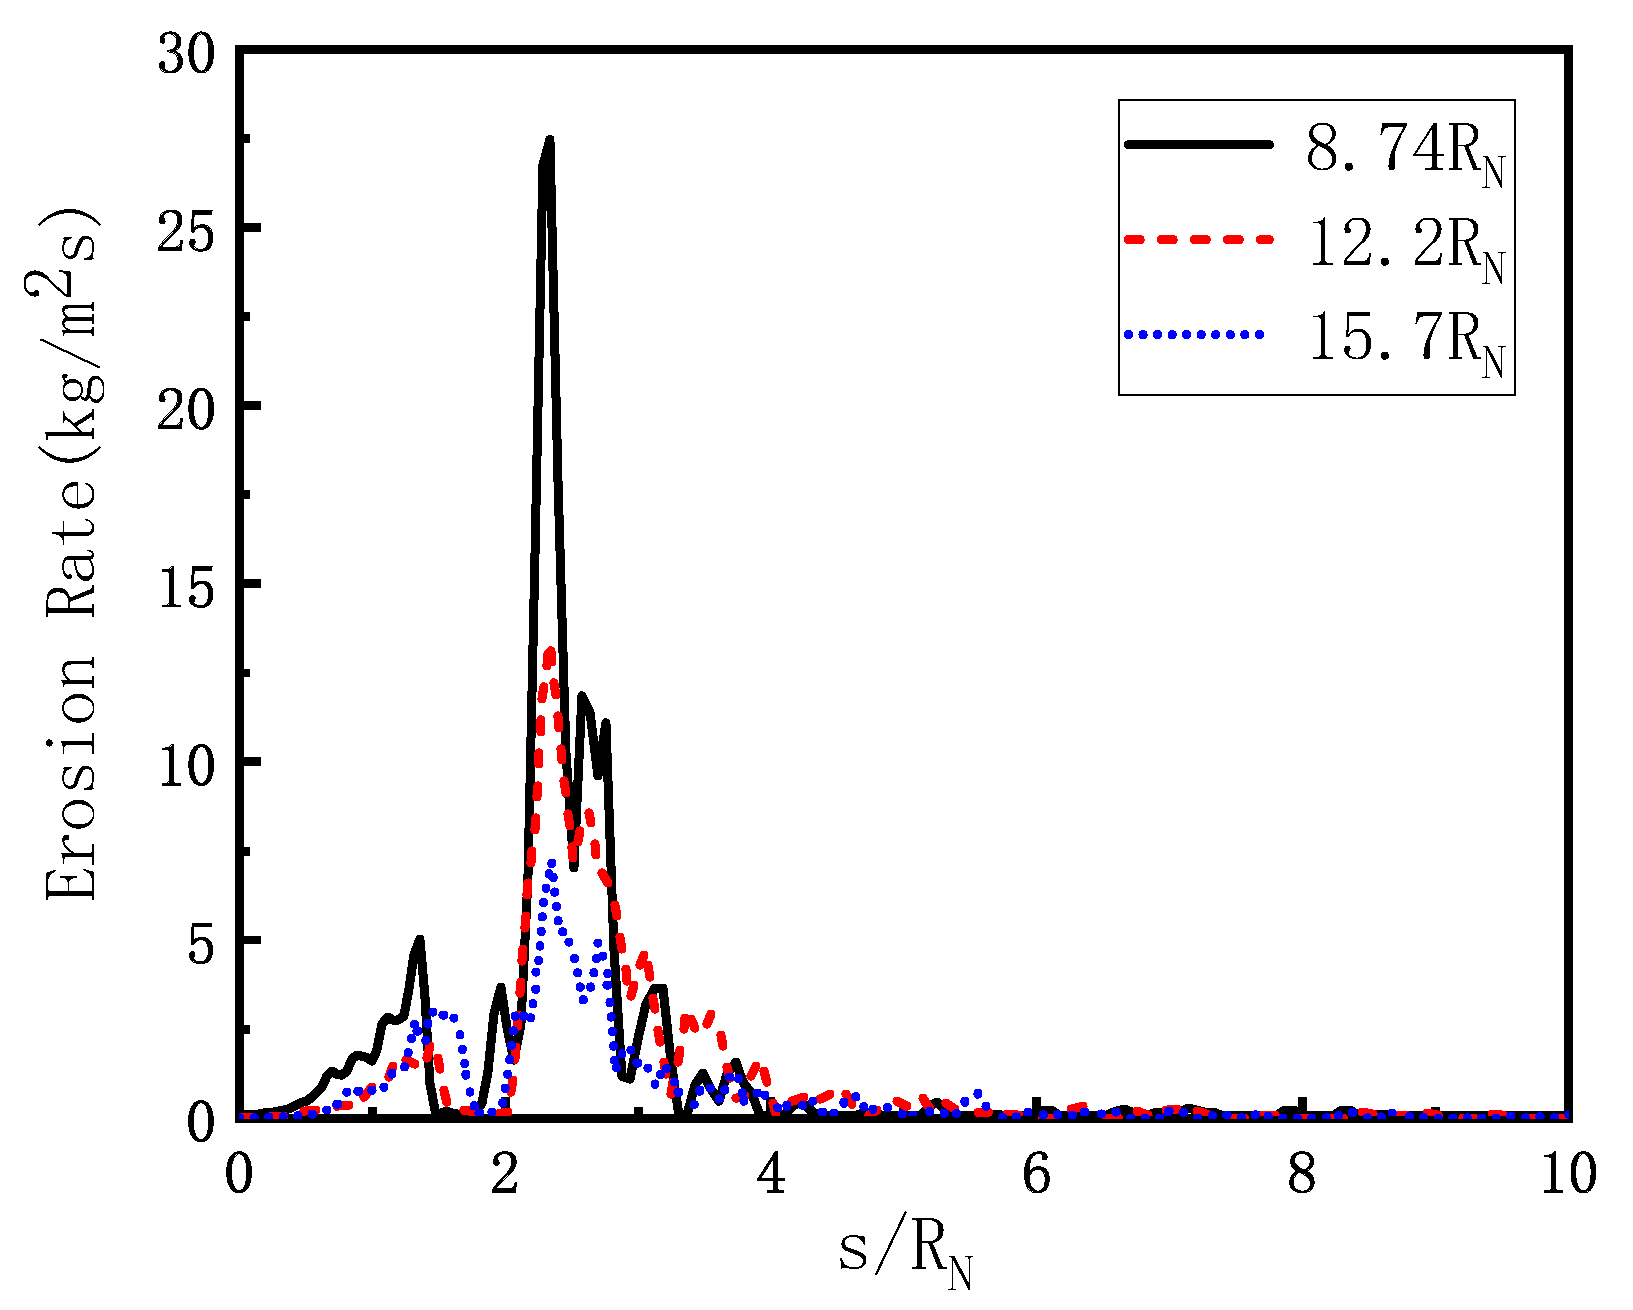
The erosion rate of particles relative to the solid wall was affected by the particle phase aggregation degree and collision angle. The particle erosion rate at the jet axis was low due to the large incidence angle of particle collision. At the edge of the jet particle movement, the erosion rate of the accumulation area of the secondary collision between the particle and the wall was large. The deposition rate of the granular phase at the wall was mainly affected by the degree of particle aggregation. The increase in jet impact distance changed the distribution of particle phase aggregation, thereby changing the distribution of the wall particle erosion rate and deposition rate.
Due to space constraints, the effect of the accidental ignition of motors on bulkheads has not been studied here, and subsequent authors will continue to study this area.

Author Contributions

Conceptualization and methodology, Y.L.; validation, Y.L. and Y.W.; formal analysis, Y.L.; investigation, Y.L. and M.D.; data curation, Y.L. and Y.W.; writing—original draft preparation, Y.L.; writing—review and editing, M.D. All authors have read and agreed to the published version of the manuscript.

Funding

This research received no external funding.

Institutional Review Board Statement

Not applicable.

Informed Consent Statement

Not applicable.

Data Availability Statement

The original contributions presented in the study are included in the article, further inquiries can be directed to the corresponding author.

Conflicts of Interest

The authors declare no conflicts of interest.

References

  1. DeLuca, L.T.; Annovazzi, A. Survey of burning rate measurements in small solid rocket motors. FirePhysChem 2024, 4, 146–165. [Google Scholar] [CrossRef]
  2. Wang, Y.; Yang, Y.; Zou, G.; Dong, H.; Huo, Y. Pressure relief of underground ammunition storage under missile accidental ignition. Def. Technol. 2021, 17, 1081–1093. [Google Scholar] [CrossRef]
  3. Zhang, Y.; Yi, J.; Xie, X.; Chen, C.; Li, H.; Li, W.; Xu, Y.; Sun, Z.; Zhao, F. Numerical simulation of nano-aluminum ignition in oxygen and steam environments. FirePhysChem 2024, 4, 114–121. [Google Scholar] [CrossRef]
  4. Imaizumi, Y.; Kamiyama, K.; Matsuba, K.I. New analysis model of solid body formation in particle method for jet impingement and solidification in severe accidents of SFRs. Ann. Nucl. Energy 2024, 206, 110658. [Google Scholar] [CrossRef]
  5. Joshi, J.; Sahu, S.K. Effect of nozzle configurations and jet orientations on thermal performance of jet impingement on convex surface. Int. J. Therm. Sci. 2024, 203, 109171. [Google Scholar] [CrossRef]
  6. Cornaro, C.; Fleischer, A.S.; Goldstein, R.J. Flow visualization of a round jet impinging on cylindrical surfaces. Exp. Therm. Fluid Sci. 1999, 20, 66–78. [Google Scholar] [CrossRef]
  7. McDaniel, C.S.; Webb, B.W. Slot jet impingement heat transfer from circular cylinders. Int. J. Heat Mass Transfer. 2000, 43, 1975–1985. [Google Scholar] [CrossRef]
  8. Pachpute, S.; Premachandran, B. Experimental and numerical investigations of slot jet impingement with and without a semi-circular bottom confinement. Int. J. Heat Mass Transfer. 2017, 114, 866–890. [Google Scholar] [CrossRef]
  9. Cai, H.; Nie, W.; Hou, Z. Impact effect of liquid rocket motor exhaust plume on launching platform. J. Aerosp. Power. 2016, 31, 1995–2001. [Google Scholar]
  10. David, R.; Wallman, P.; Sanford, M. Characterization of rocket plume fluid dynamic environment using numerical & experiment approaches. AIAA J. 2013, 50, 527–539. [Google Scholar]
  11. Wang, G.; Xu, W.; Gao, Y. A study on erosive effect of two phase impinging jets on vertical plate. J. Ballist. 2009, 21, 10–14. [Google Scholar]
  12. Basu, S.; Saha, S.; Chakraborty, D. Numerical simulation of missile jet deflector. J. Spacecr. Rocket. 2017, 54, 930–935. [Google Scholar] [CrossRef]
  13. Shapiro, A.H. The Dynamics and Thermodynamics of Compressible Fluid Fow; Ascher, H., Ed.; Wiley: Hoboken, NJ, USA, 2017; Volume 2. [Google Scholar]
  14. Nicomedes, W.L.; Bathe, K.-J.; Moreira, F.J.S.; Mesquita, R.C. Overlapping finite elements for the Navier-Stokes equations. Comput. Struct. 2024, 299, 107343. [Google Scholar] [CrossRef]
  15. Cai, C.; Fan, L.; Wu, B. Numerical simulation of combustor temperature performance of a high-temperature high-speed heat-airflow simulation system. World J. Eng. 2016, 13, 422–431. [Google Scholar] [CrossRef]
  16. Clarkson, P.A.; Kruskal, M.D. New similarity reductions of the boussinesq equations. J. Math. Phys. 1989, 30, 2201–2213. [Google Scholar] [CrossRef]
  17. Du, J.; Navon, I.M.; Zhu, J.; Fang, F.; Alekseev, A.K. Reduced order modeling based on POD of a parabolized Navier–Stokes equations model II: Trust region POD 4D VAR data assimilation. Comput. Math. Appl. 2013, 65, 380–394. [Google Scholar] [CrossRef]
  18. Zhang, J.; Zhang, G.; Zhao, S.; Han, B. The influence of dusty size distribution model on propagation of electromagnetic waves in inhomogeneous plasma sheath. J. Phys. Conf. Ser. 2021, 1995, 012014. [Google Scholar] [CrossRef]
  19. Tsuboi, N.; Hayashi, A.K.; Fujiwara, T.; Arashi, K.; Kodama, M. Numerical simulation of a supersonic jet impingement on a ground. Proc. Soc. Automot. Eng. 1991, 246, 421–433. [Google Scholar]
  20. Song, G.; Zong, H.; Liang, H.; Su, Z.; Xie, L.; Zheng, X. Parametric study of high-frequency characteristics of plasma synthetic jet actuator. Plasma Sci. Technol. 2021, 23, 125503. [Google Scholar] [CrossRef]
  21. Li, J.; Jiang, Y. Numerical calculation on the influence of missile exhaust plume with mechanical properties to the double-launch box. Adv. Mat. Res. 2014, 978, 101–105. [Google Scholar] [CrossRef]
  22. Pattamatta, A.; Singh, G.; Mongia, H. Assessment of Turbulence Models for Free and Confined Impinging Jet Flows. In Proceedings of the 42nd AIAA Thermophysics Conference (AIAA), Honolulu, HI, USA, 27–30 June 2011. [Google Scholar]
  23. Aiister, F.; Martin, T.; David, H. A numerical investigation of solid particle erosion experienced within oilfield control valves. Wear 1998, 216, 184–193. [Google Scholar]
  24. Li, Z.; Xiang, H.; Zhang, X. Numerical simulation of jet flow field of composite propellant missile engine. J. Solid Rocket. Technol. 2014, 1, 37–42. [Google Scholar]
  25. Bing, X.; Liu, L. Numerical calculation of flow field in vertical launching gas exhaust system. J. Ordnance Equip. Eng. 2016, 37, 52–54. [Google Scholar]
  26. Li, Y.; Chen, L.; Jian, Z. Numerical study of two-phase nozzle flow with classified particles. J. Solid Rocket. Technol. 2003, 26, 32–34. [Google Scholar]
Figure 1. (a) Computational domains; (b) calculation grid.
Fire 07 00312 g001
Figure 2. The gas density clouds simulation results of different mesh models.
Fire 07 00312 g002
Figure 3. The calculation results of gas parameters on the jet axis under different grids compared with the results in the reference [19]: (a) gas static pressure; (b) gas Mach number.
Fire 07 00312 g003
Figure 4. Physical model of impinging jet.
Fire 07 00312 g004
Figure 5. Meshing model of impinging jet.
Fire 07 00312 g005
Figure 6. The calculated results of gas density compared with the experimental results when the impact distance is 8.74 RN. (a) Realizable k-ε. (b) S-A. (c) SST k-ω.
Fire 07 00312 g006
Figure 7. The calculated results of gas density compared with the experimental results when the impact distance is 12.2 RN. (a) Realizable k-ε. (b) S-A. (c) SST k-ω.
Fire 07 00312 g007
Figure 8. The calculated results of gas density compared with the experimental results when the impact distance is 15.7 RN. (a) Realizable k-ε. (b) S-A. (c) SST k-ε.
Fire 07 00312 g008
Figure 9. Mach number and streamline diagrams of flow field under different conditions.
Fire 07 00312 g009
Figure 10. Calculation results of wall static pressure of different turbulence models compared with test.
Fire 07 00312 g010
Figure 11. Collision and rebound between particles and wall.
Fire 07 00312 g011
Figure 12. Variation of incident angle function with incident angle.
Fire 07 00312 g012
Figure 13. Particle and gas phase velocity distribution of impinging jet at different impingement distances.
Fire 07 00312 g013
Figure 14. Particle concentration distribution of impinging jet at different impingement distances.
Fire 07 00312 g014aFire 07 00312 g014b
Figure 15. Distribution of the erosion rate of solid particles relative to the wall in the two-phase jet at different impact distances.
Fire 07 00312 g015
Figure 16. Wall particle accretion rate distribution.
Fire 07 00312 g016
Figure 17. Particle concentration distribution of impinging jet.
Fire 07 00312 g017
Table 1. Computational time consumption for meshes of three scales.
GridNumber of MeshesMemory Footprint (MB)Calculation Time (h)
G180,0006.66
G2150,00012.914
G3270,00023.429
Table 2. Environmental parameters at the outlet of the combustion chamber.
ComponentQuality
Fraction
ComponentQuality
Fraction
ComponentQuality
Fraction
CO2.4412 × 10−1H21.5212 × 10−2OH6.1308 × 10−3
CO25.7111 × 10−2H2O1.5973 × 10−1O22.7547 × 10−4
Cl1.1398 × 10−2N21.3789 × 10−1H7.2076 × 10−4
Cl25.6607 × 10−5O3.0101 × 10−4HCl1.8564 × 10−1
Al2O31.814 × 10−1
Disclaimer/Publisher’s Note: The statements, opinions and data contained in all publications are solely those of the individual author(s) and contributor(s) and not of MDPI and/or the editor(s). MDPI and/or the editor(s) disclaim responsibility for any injury to people or property resulting from any ideas, methods, instructions or products referred to in the content.

