
Study on Performance of Coordinated Ventilation Strategies during T-Shaped Subway Station Hall Fire


Abstract
:1. Introduction
2. Full-Scale Experiments and Numerical Setup
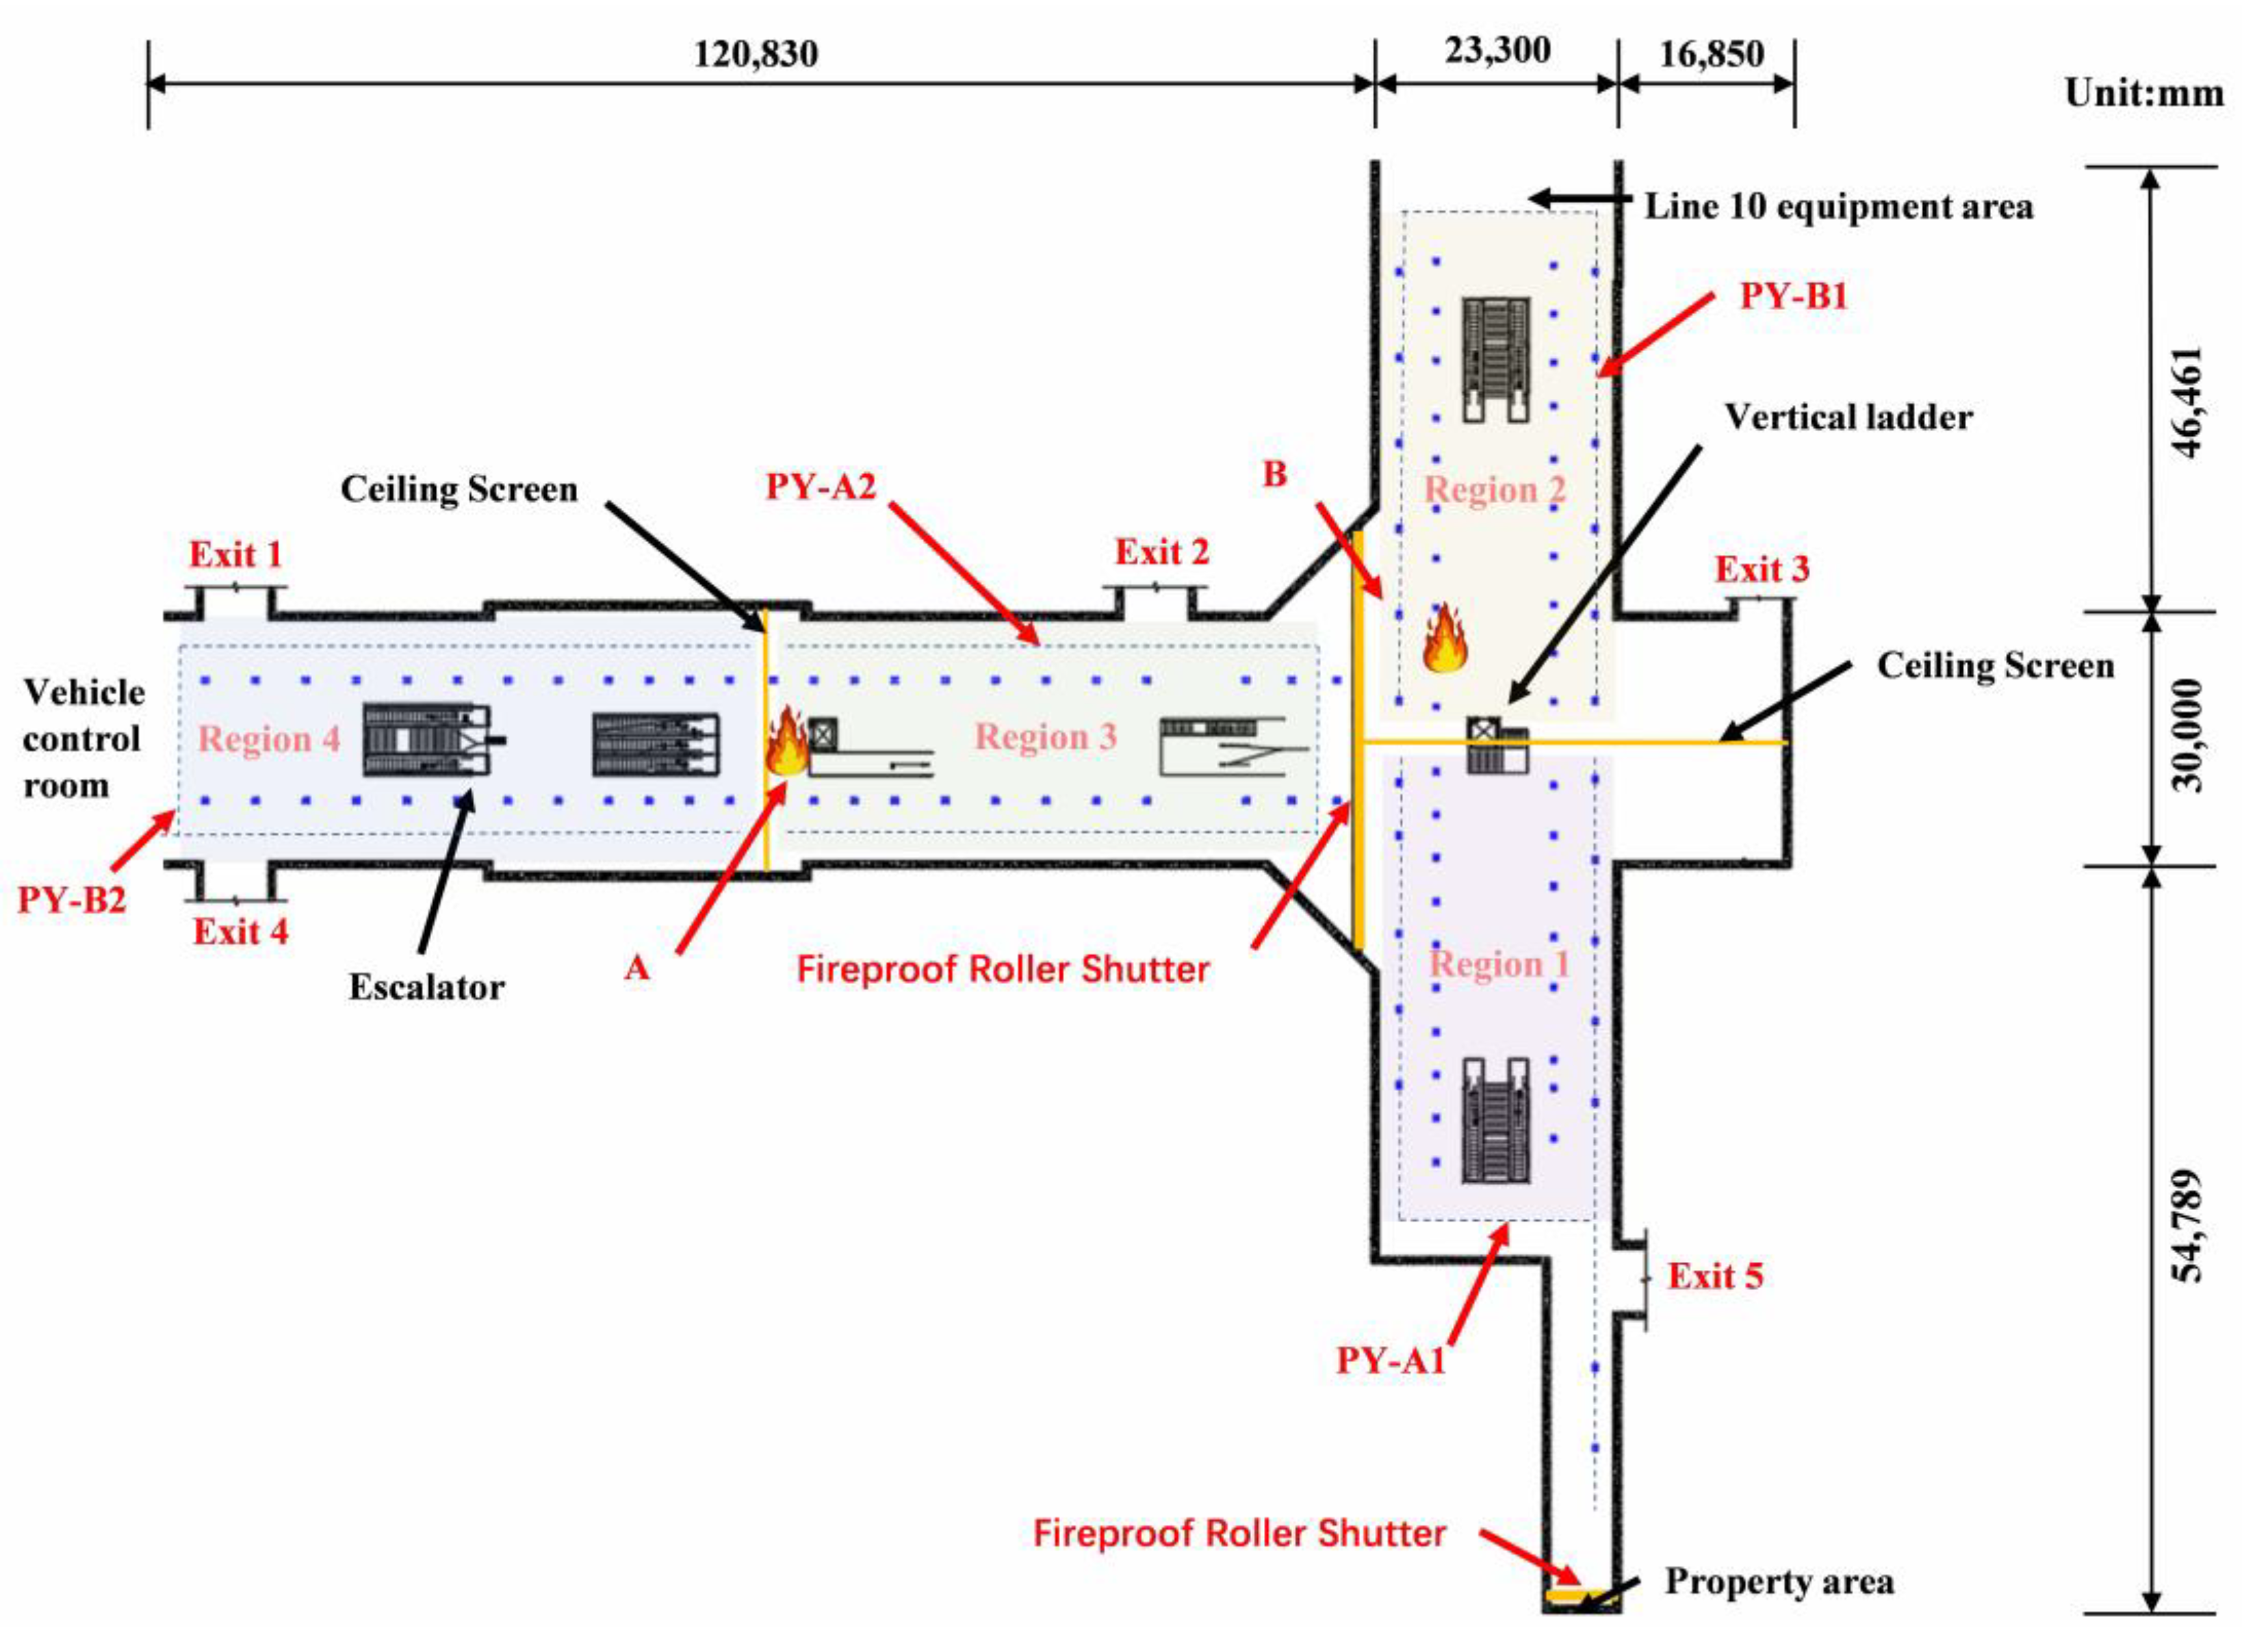
2.1. Experimental Setup
2.1.1. Overview
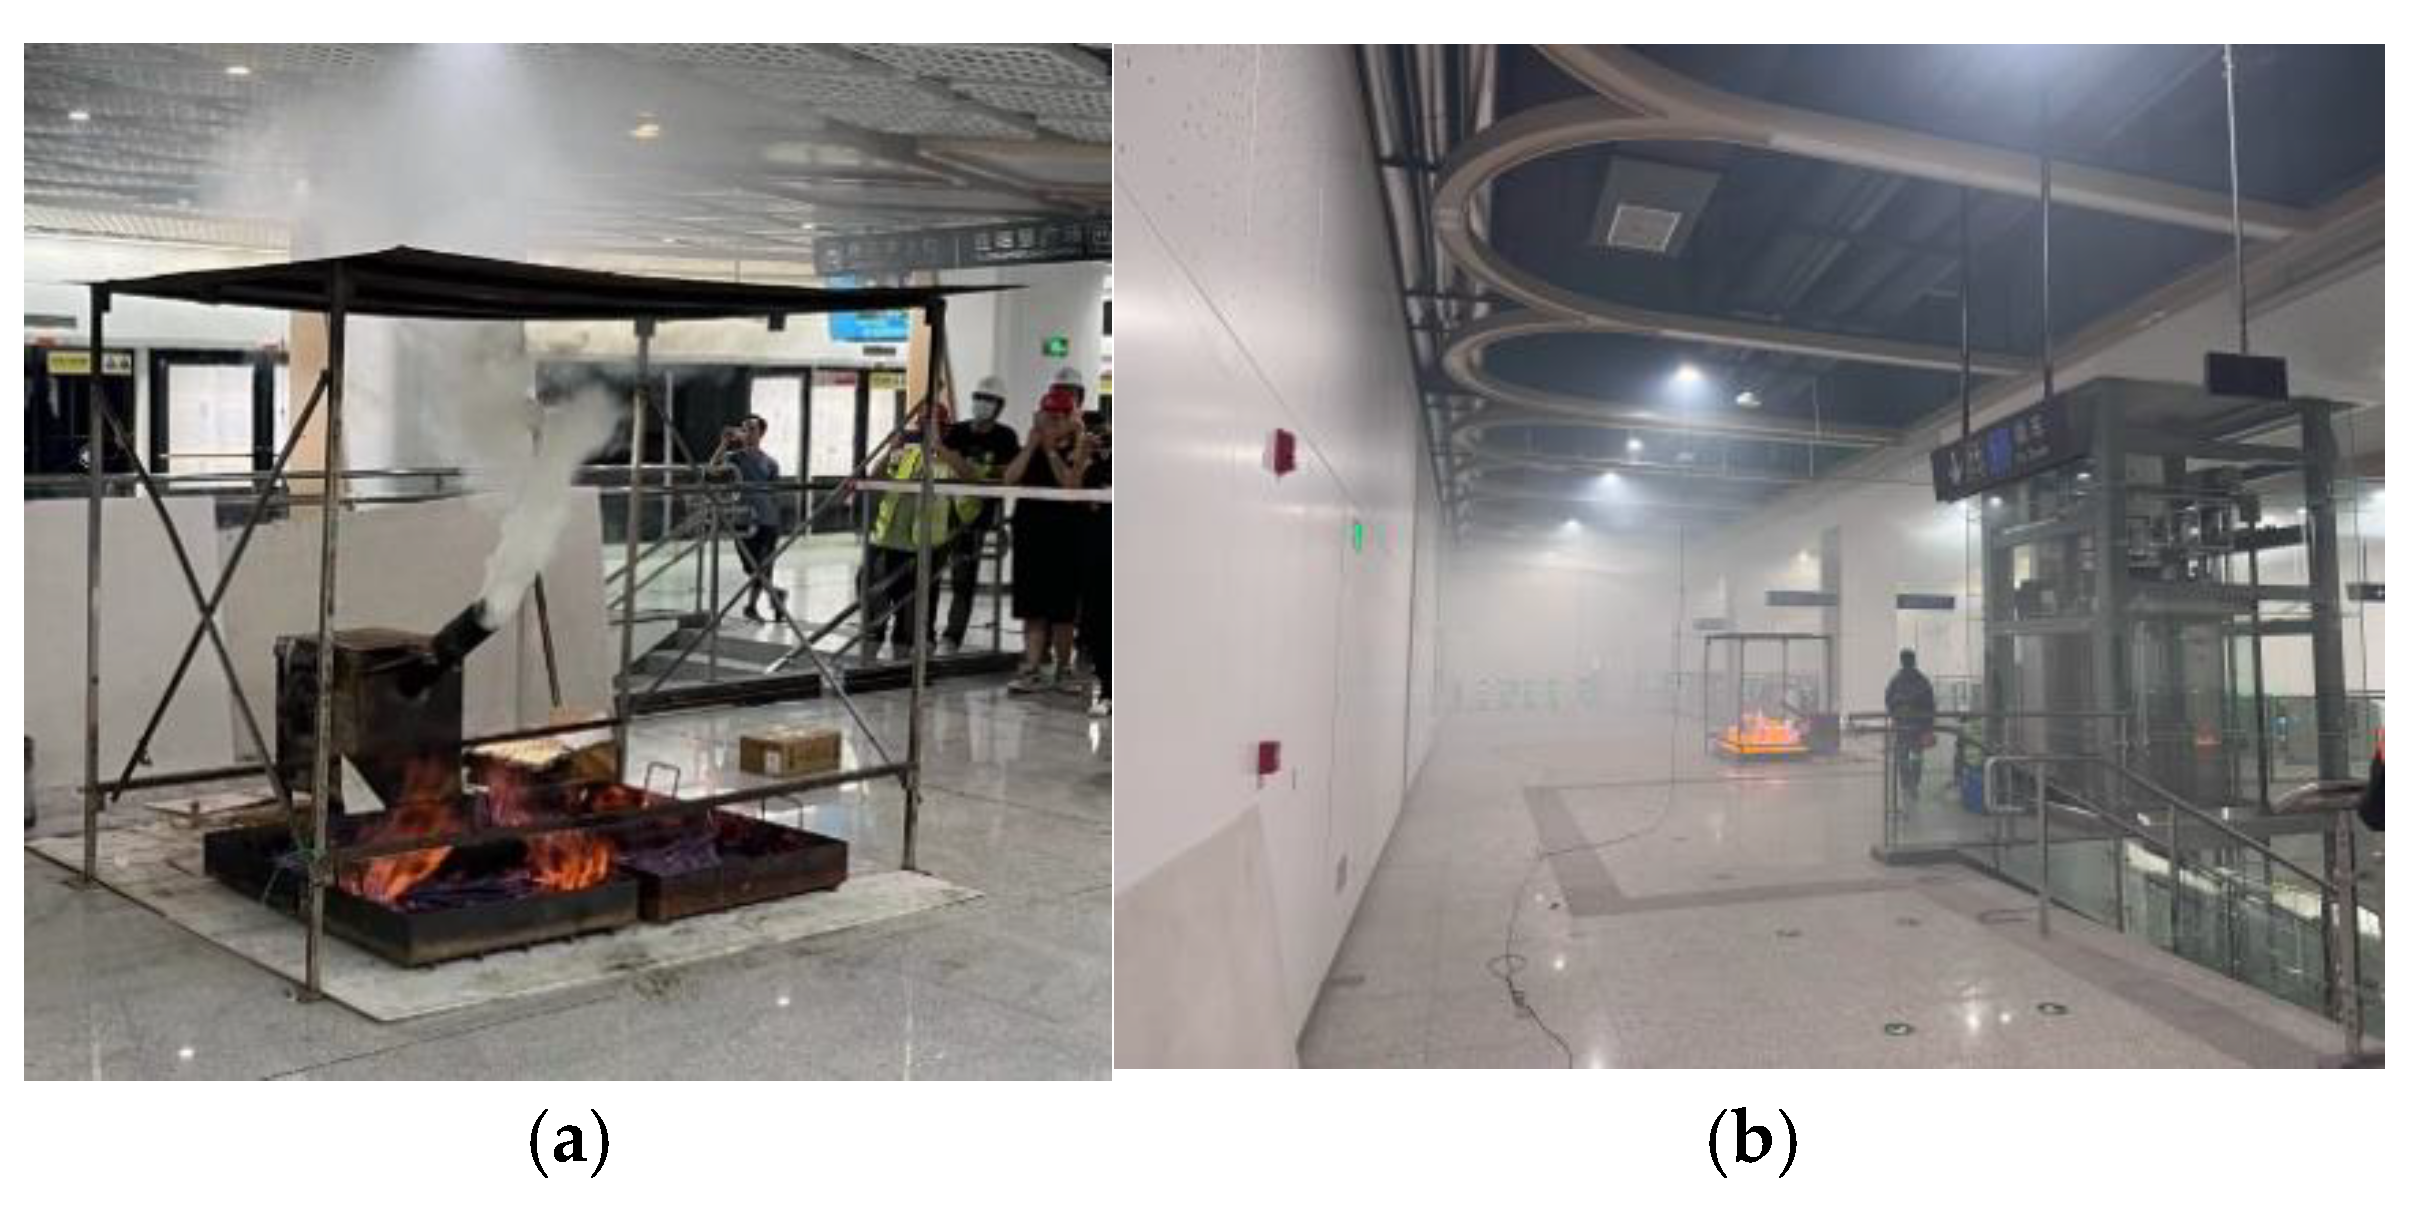
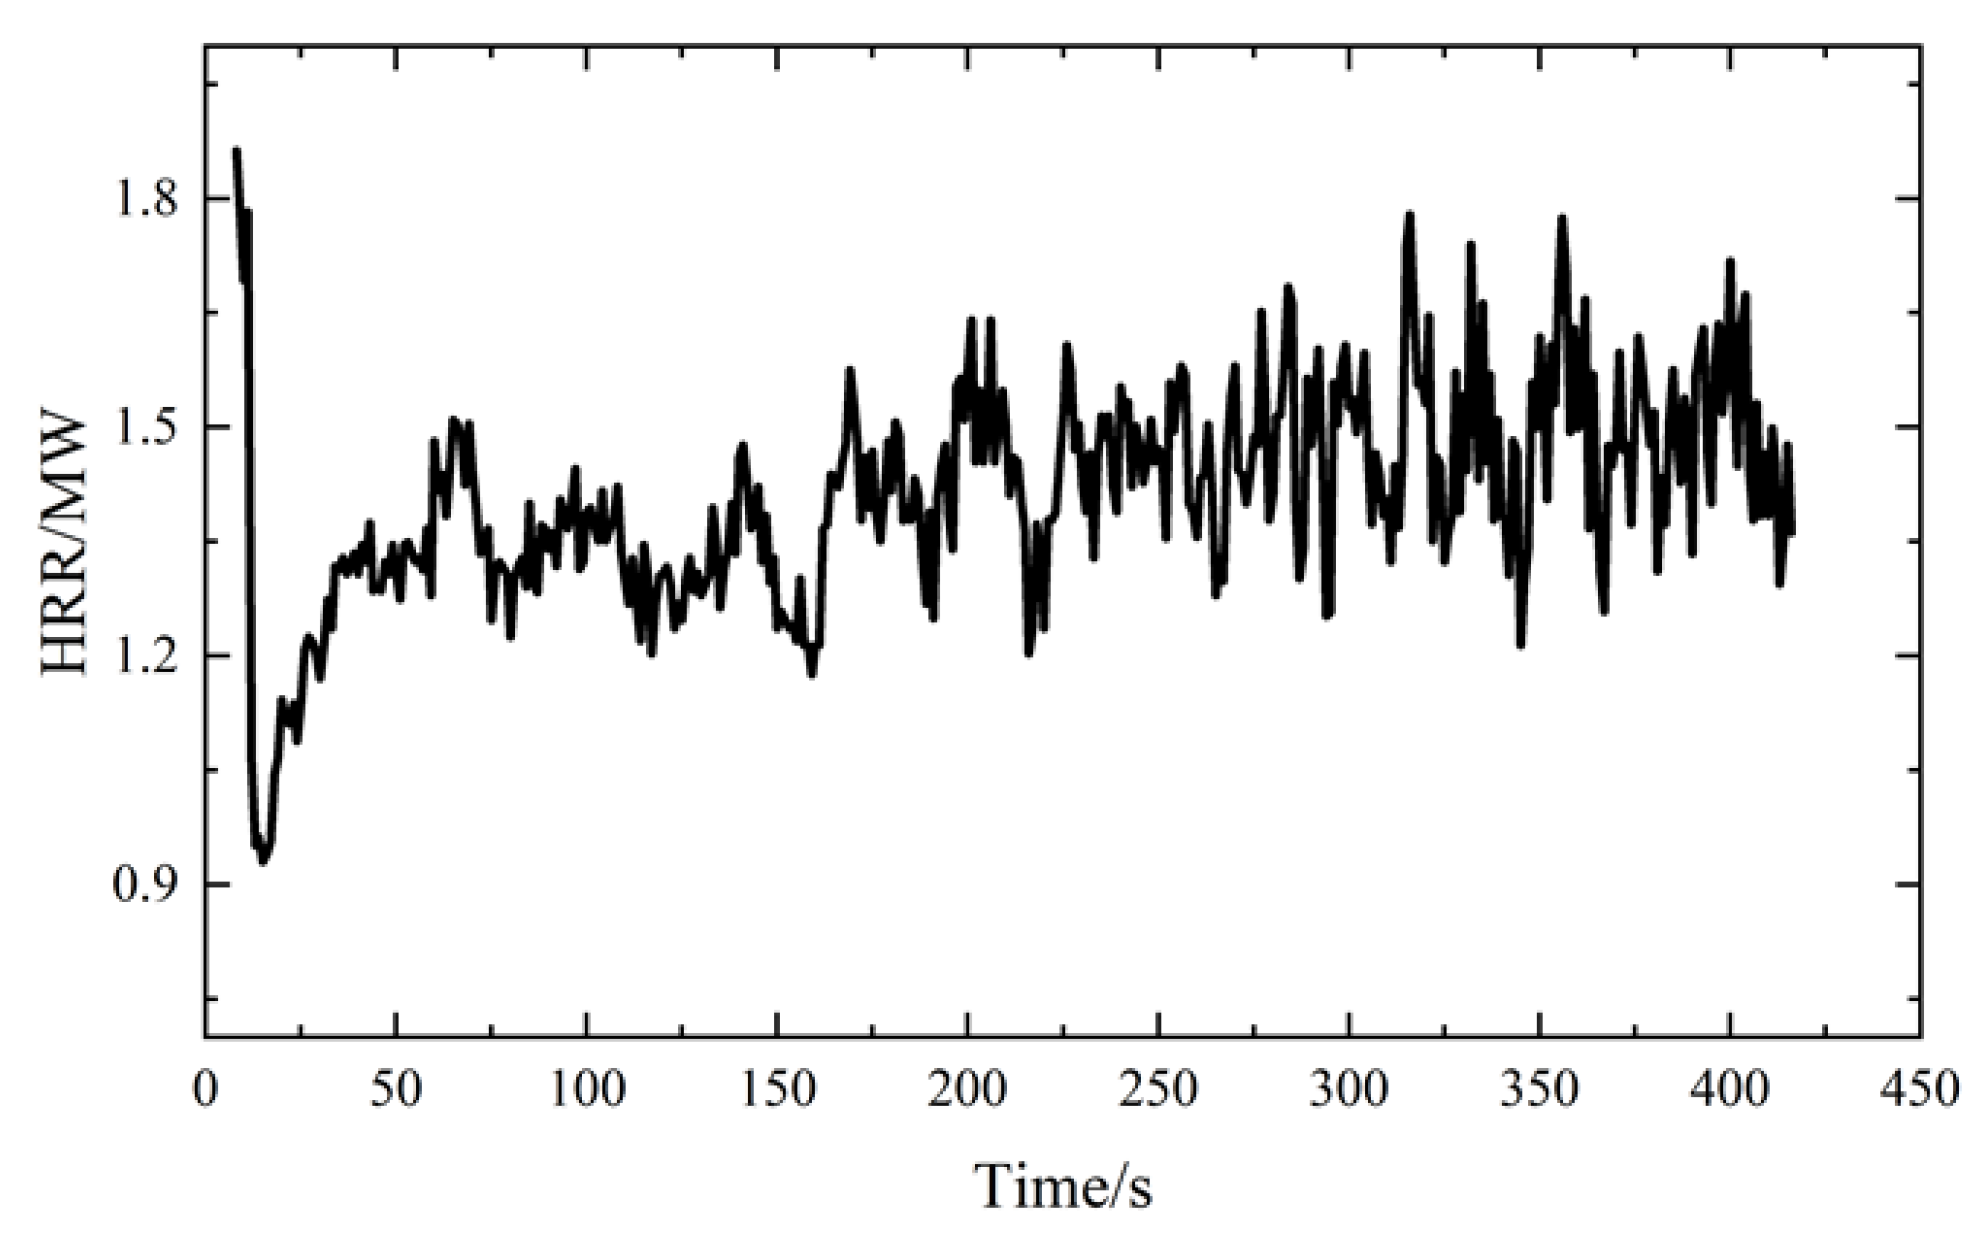
2.1.2. Fire Source Design
2.1.3. Experimental Conditions and Temperature Measurement Arrangement
2.2. Numerical Setup
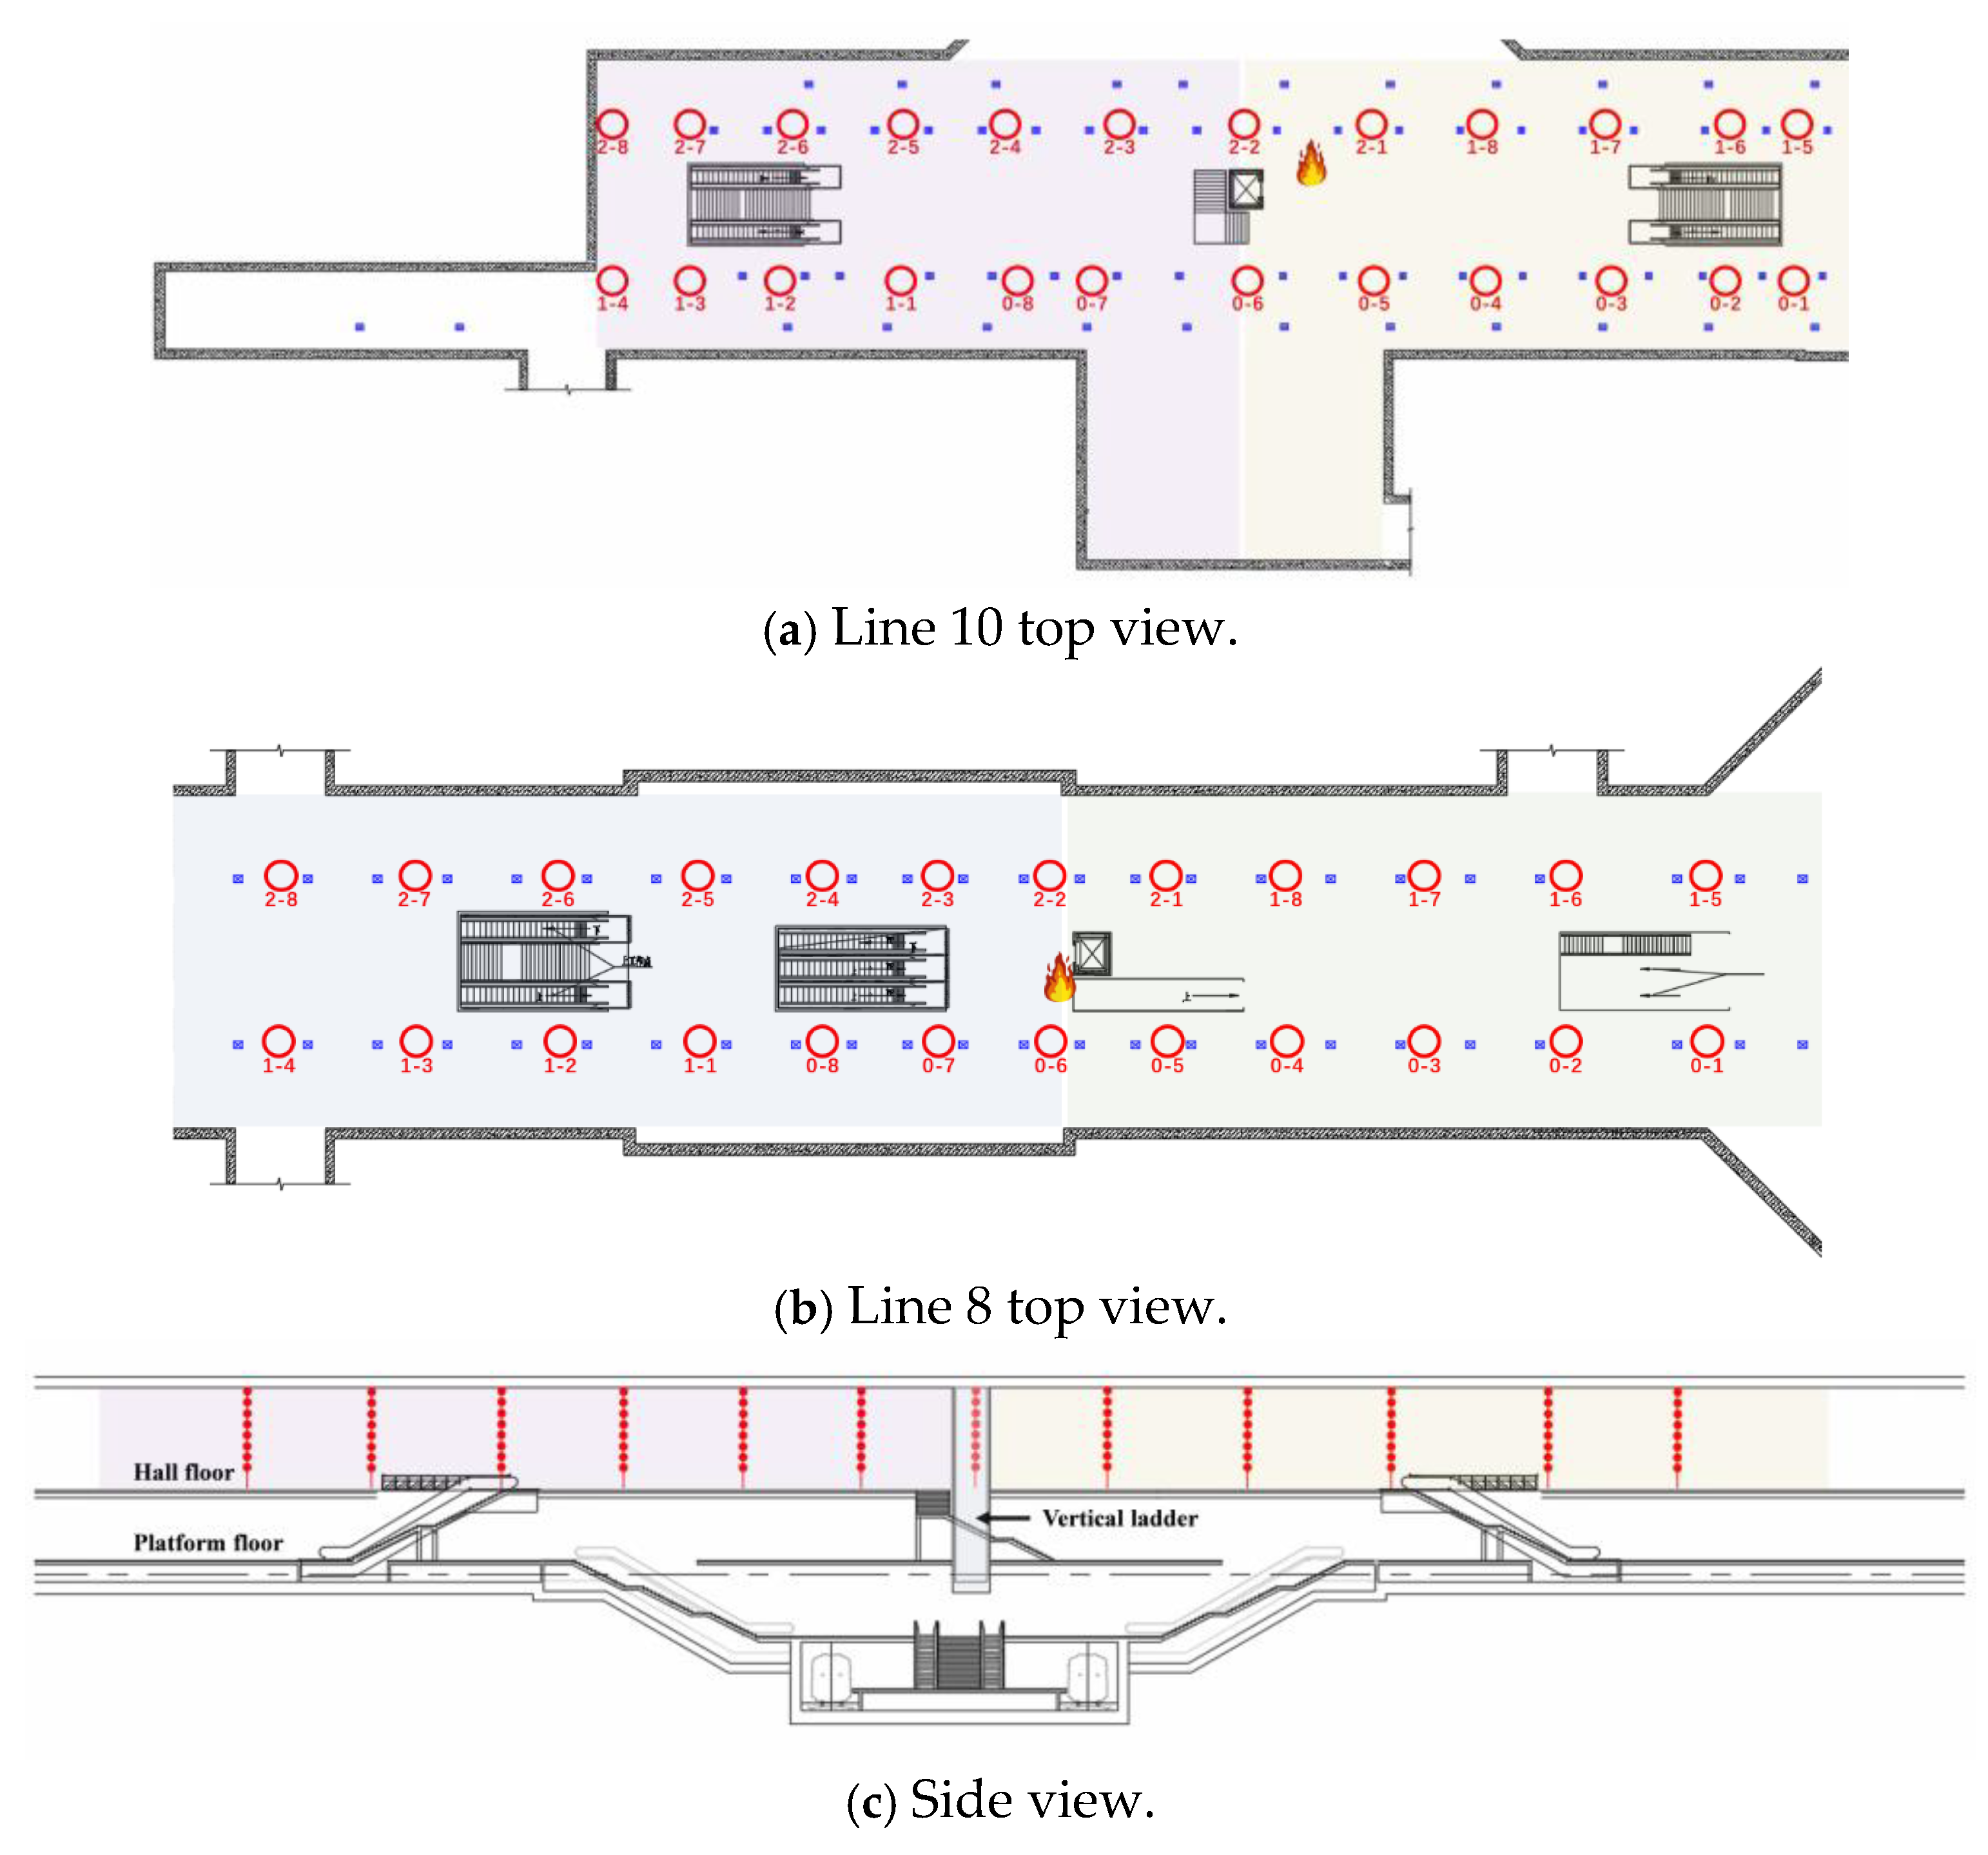
2.2.1. Model Configuration
2.2.2. Fire Scenarios
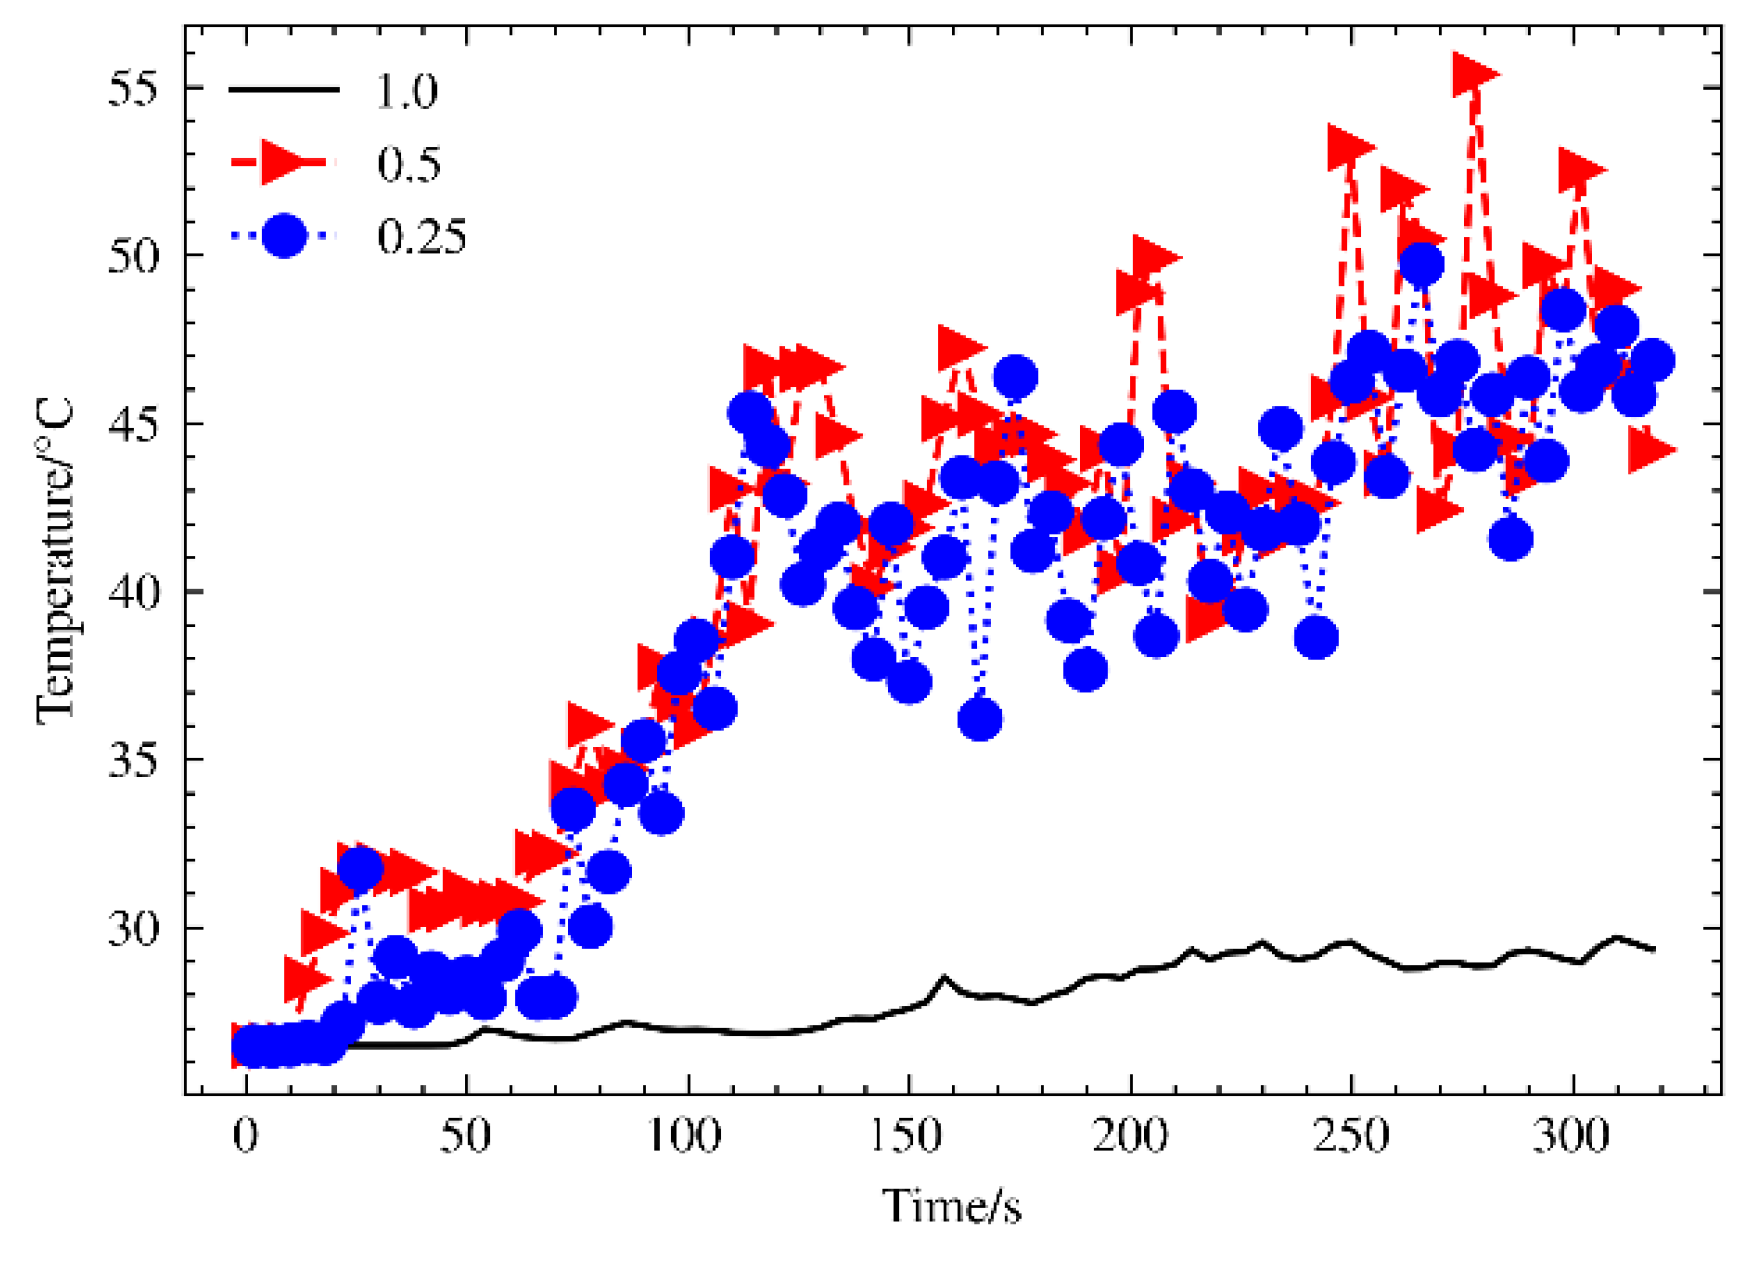
2.2.3. Grid Sensitivity Analysis
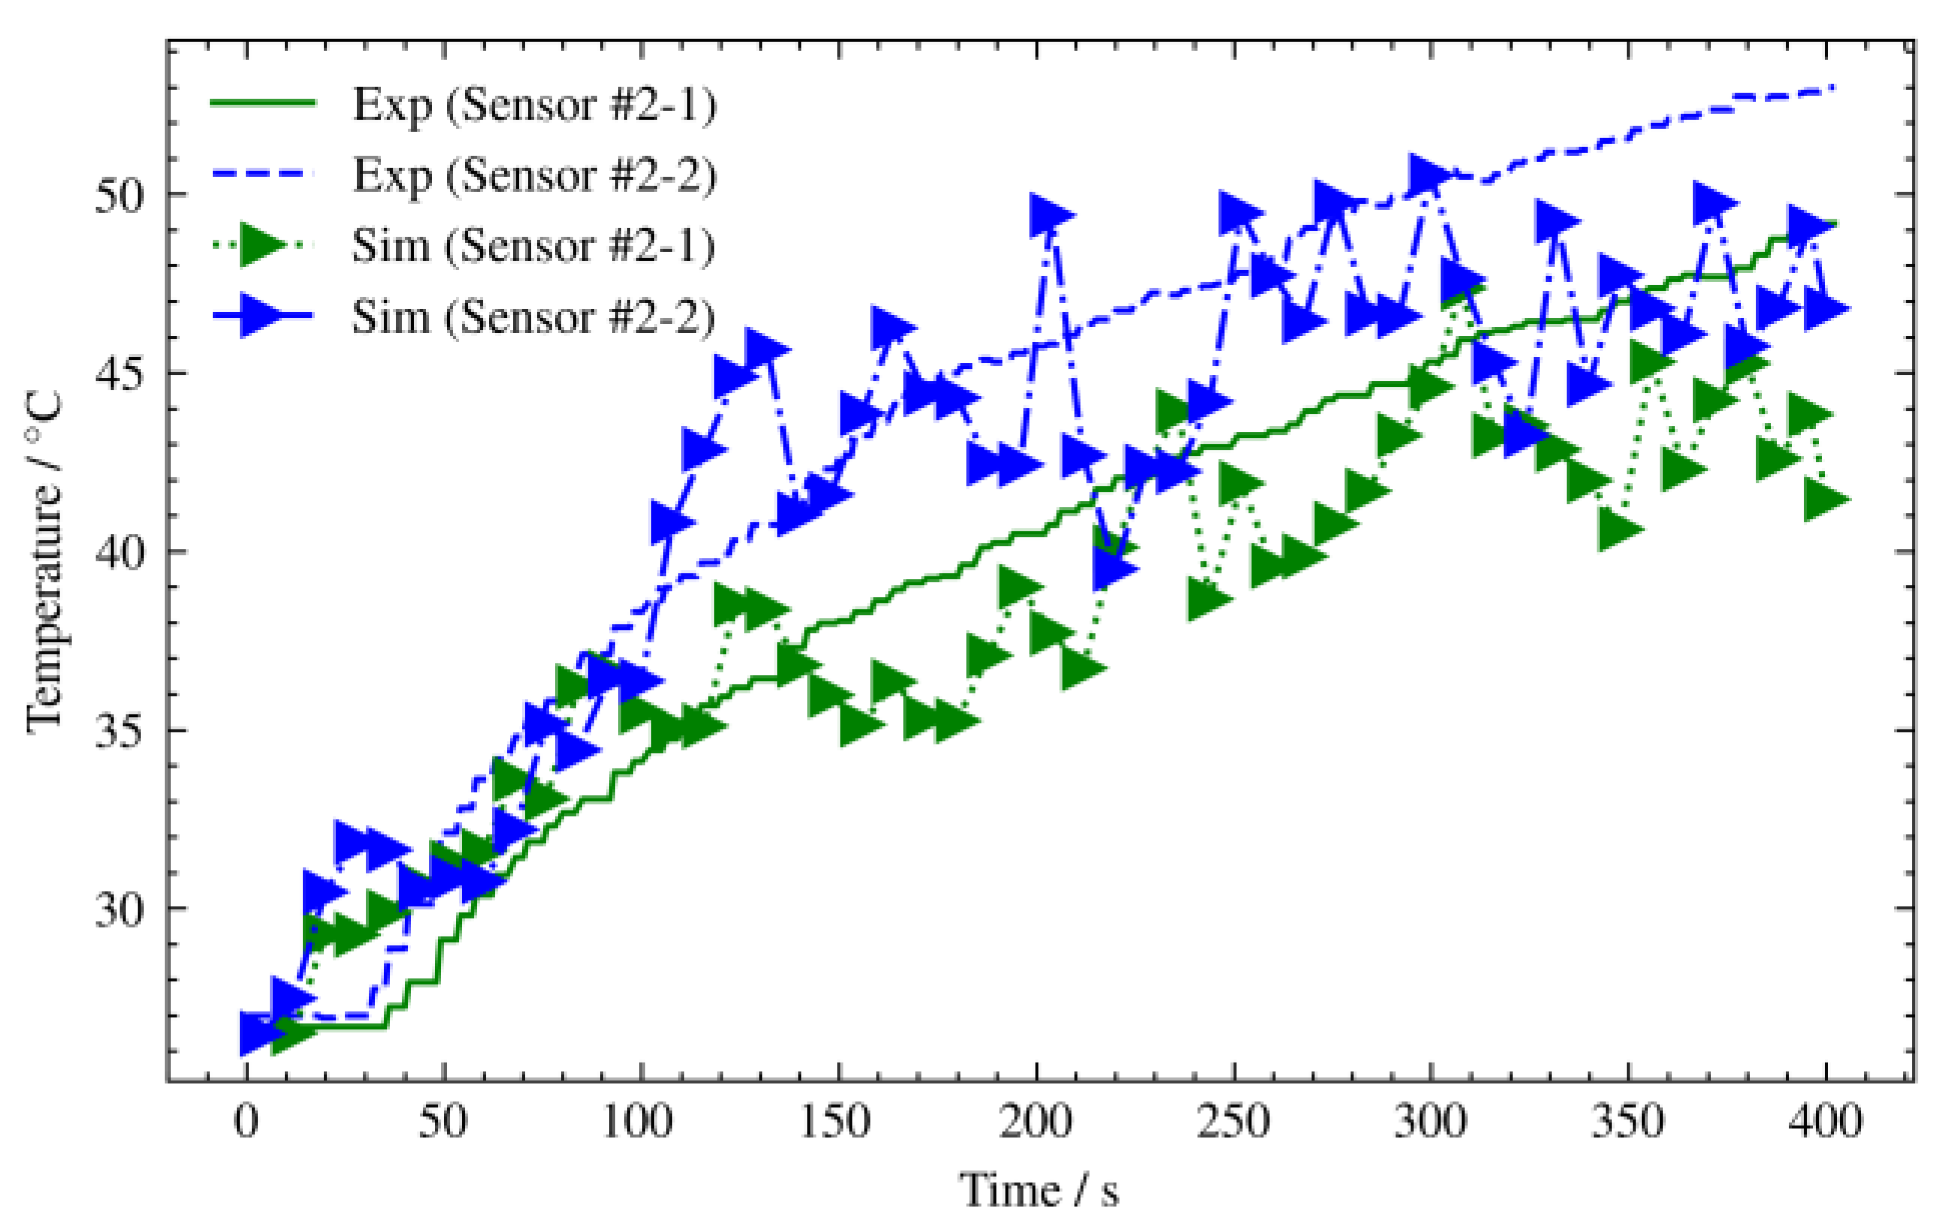
2.3. Comparison Between Experiment and Simulation Results
3. Results and Discussion
3.1. Fire Locations
3.2. Ceiling Screen and Fireproof Roller Shutters
3.3. The Effect of the Opening and Closing of the Smoke Exhaust Fan on Smoke Characteristics
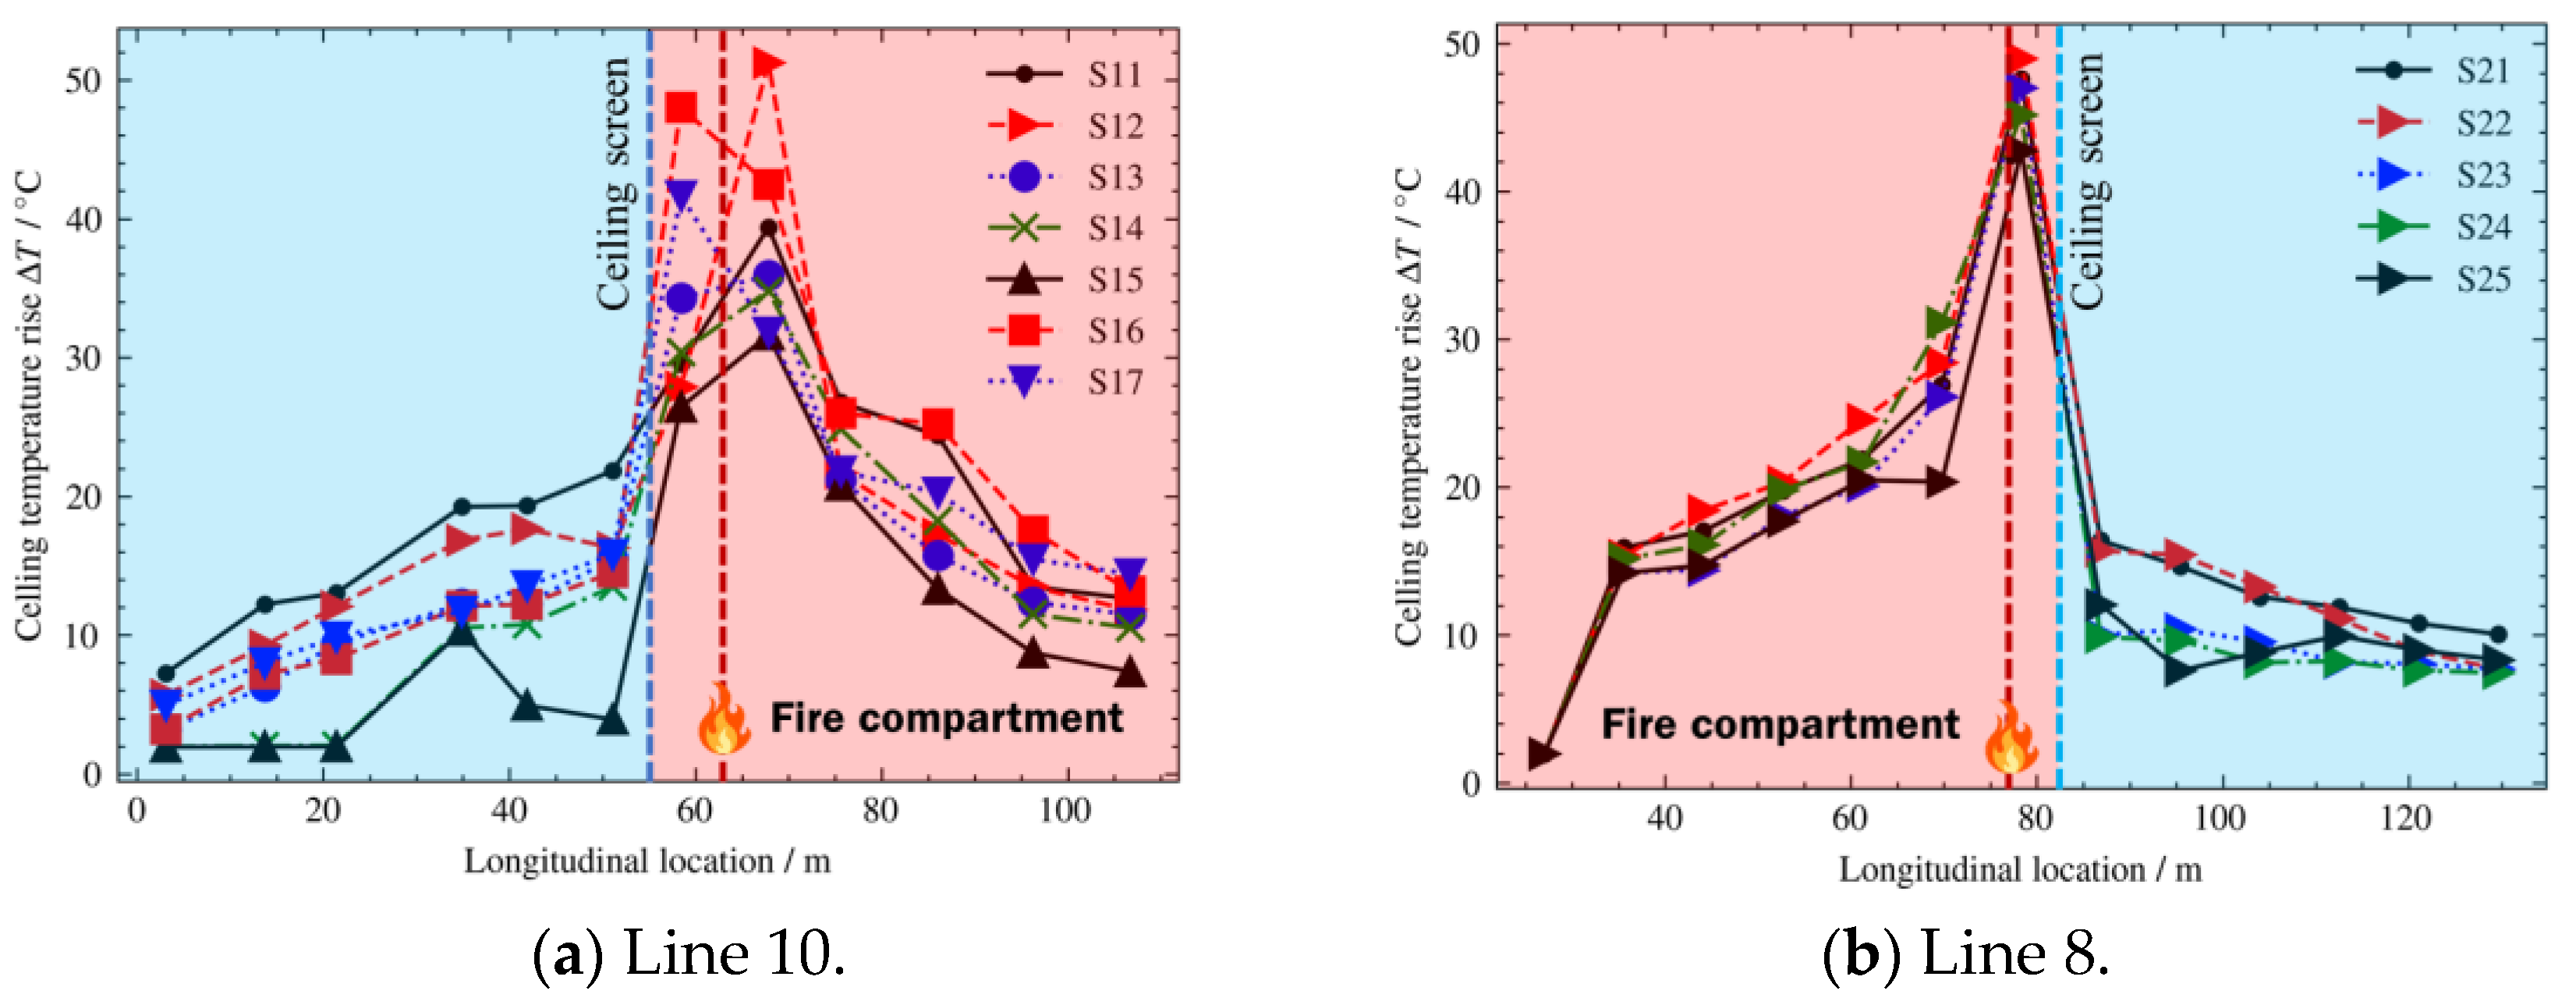
3.3.1. Line 10
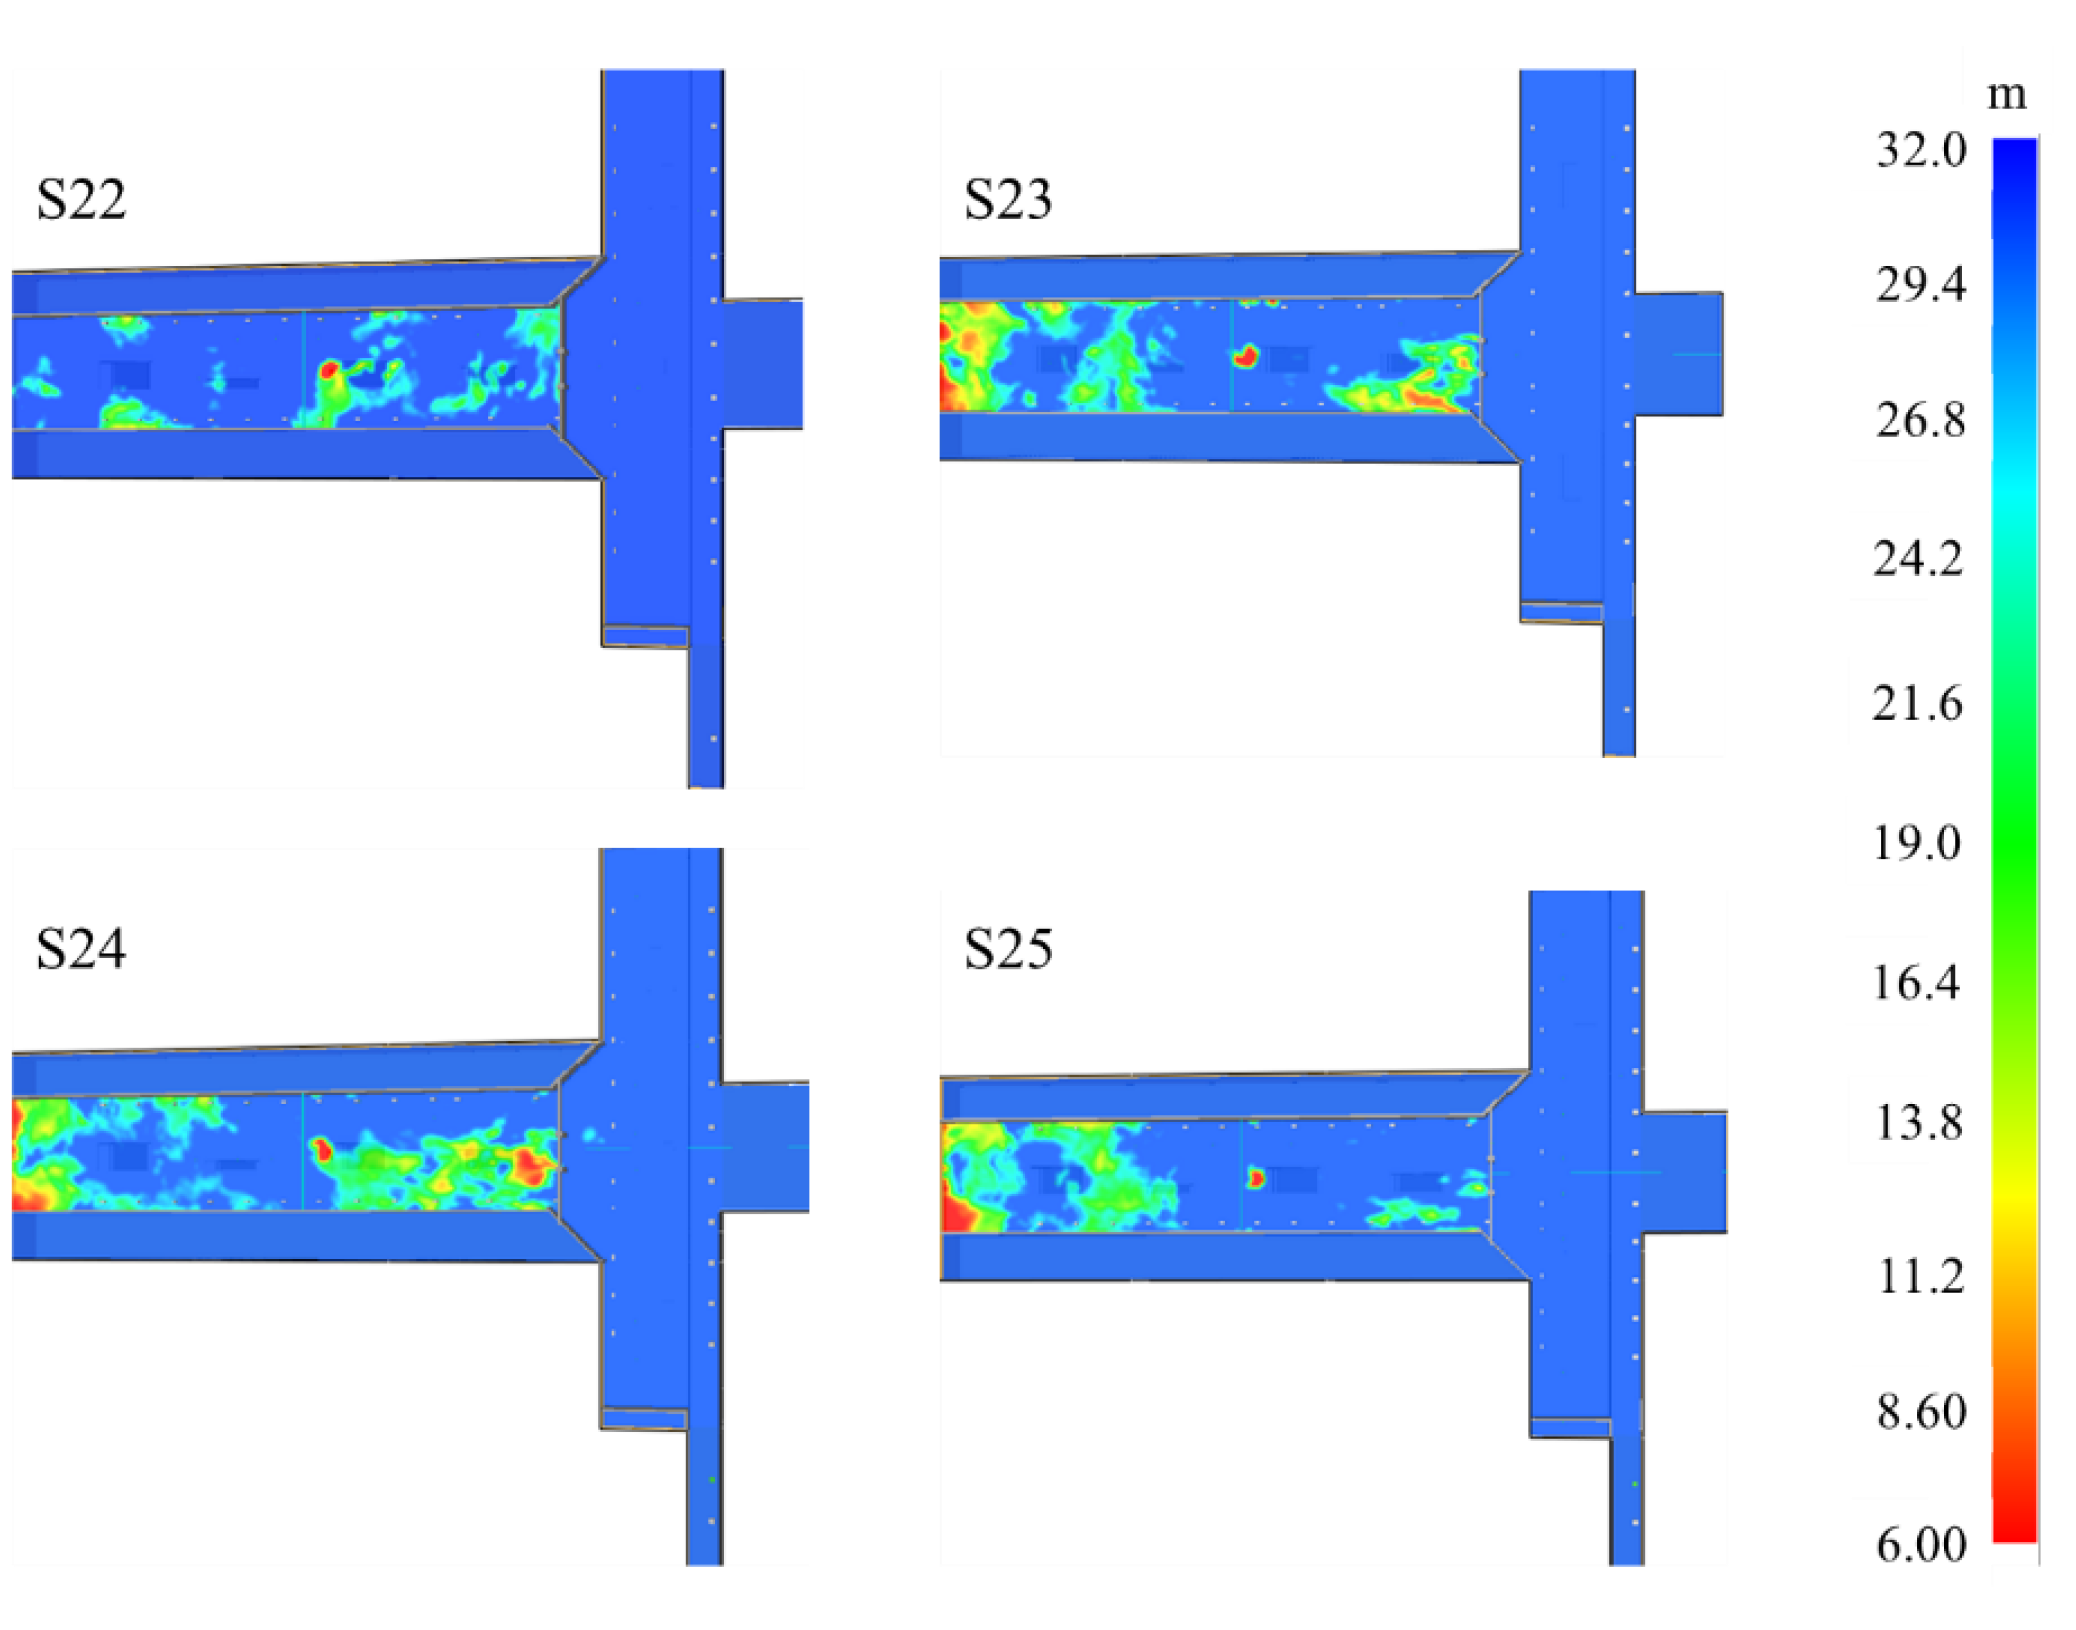
3.3.2. Line 8
4. Conclusions
- (1)
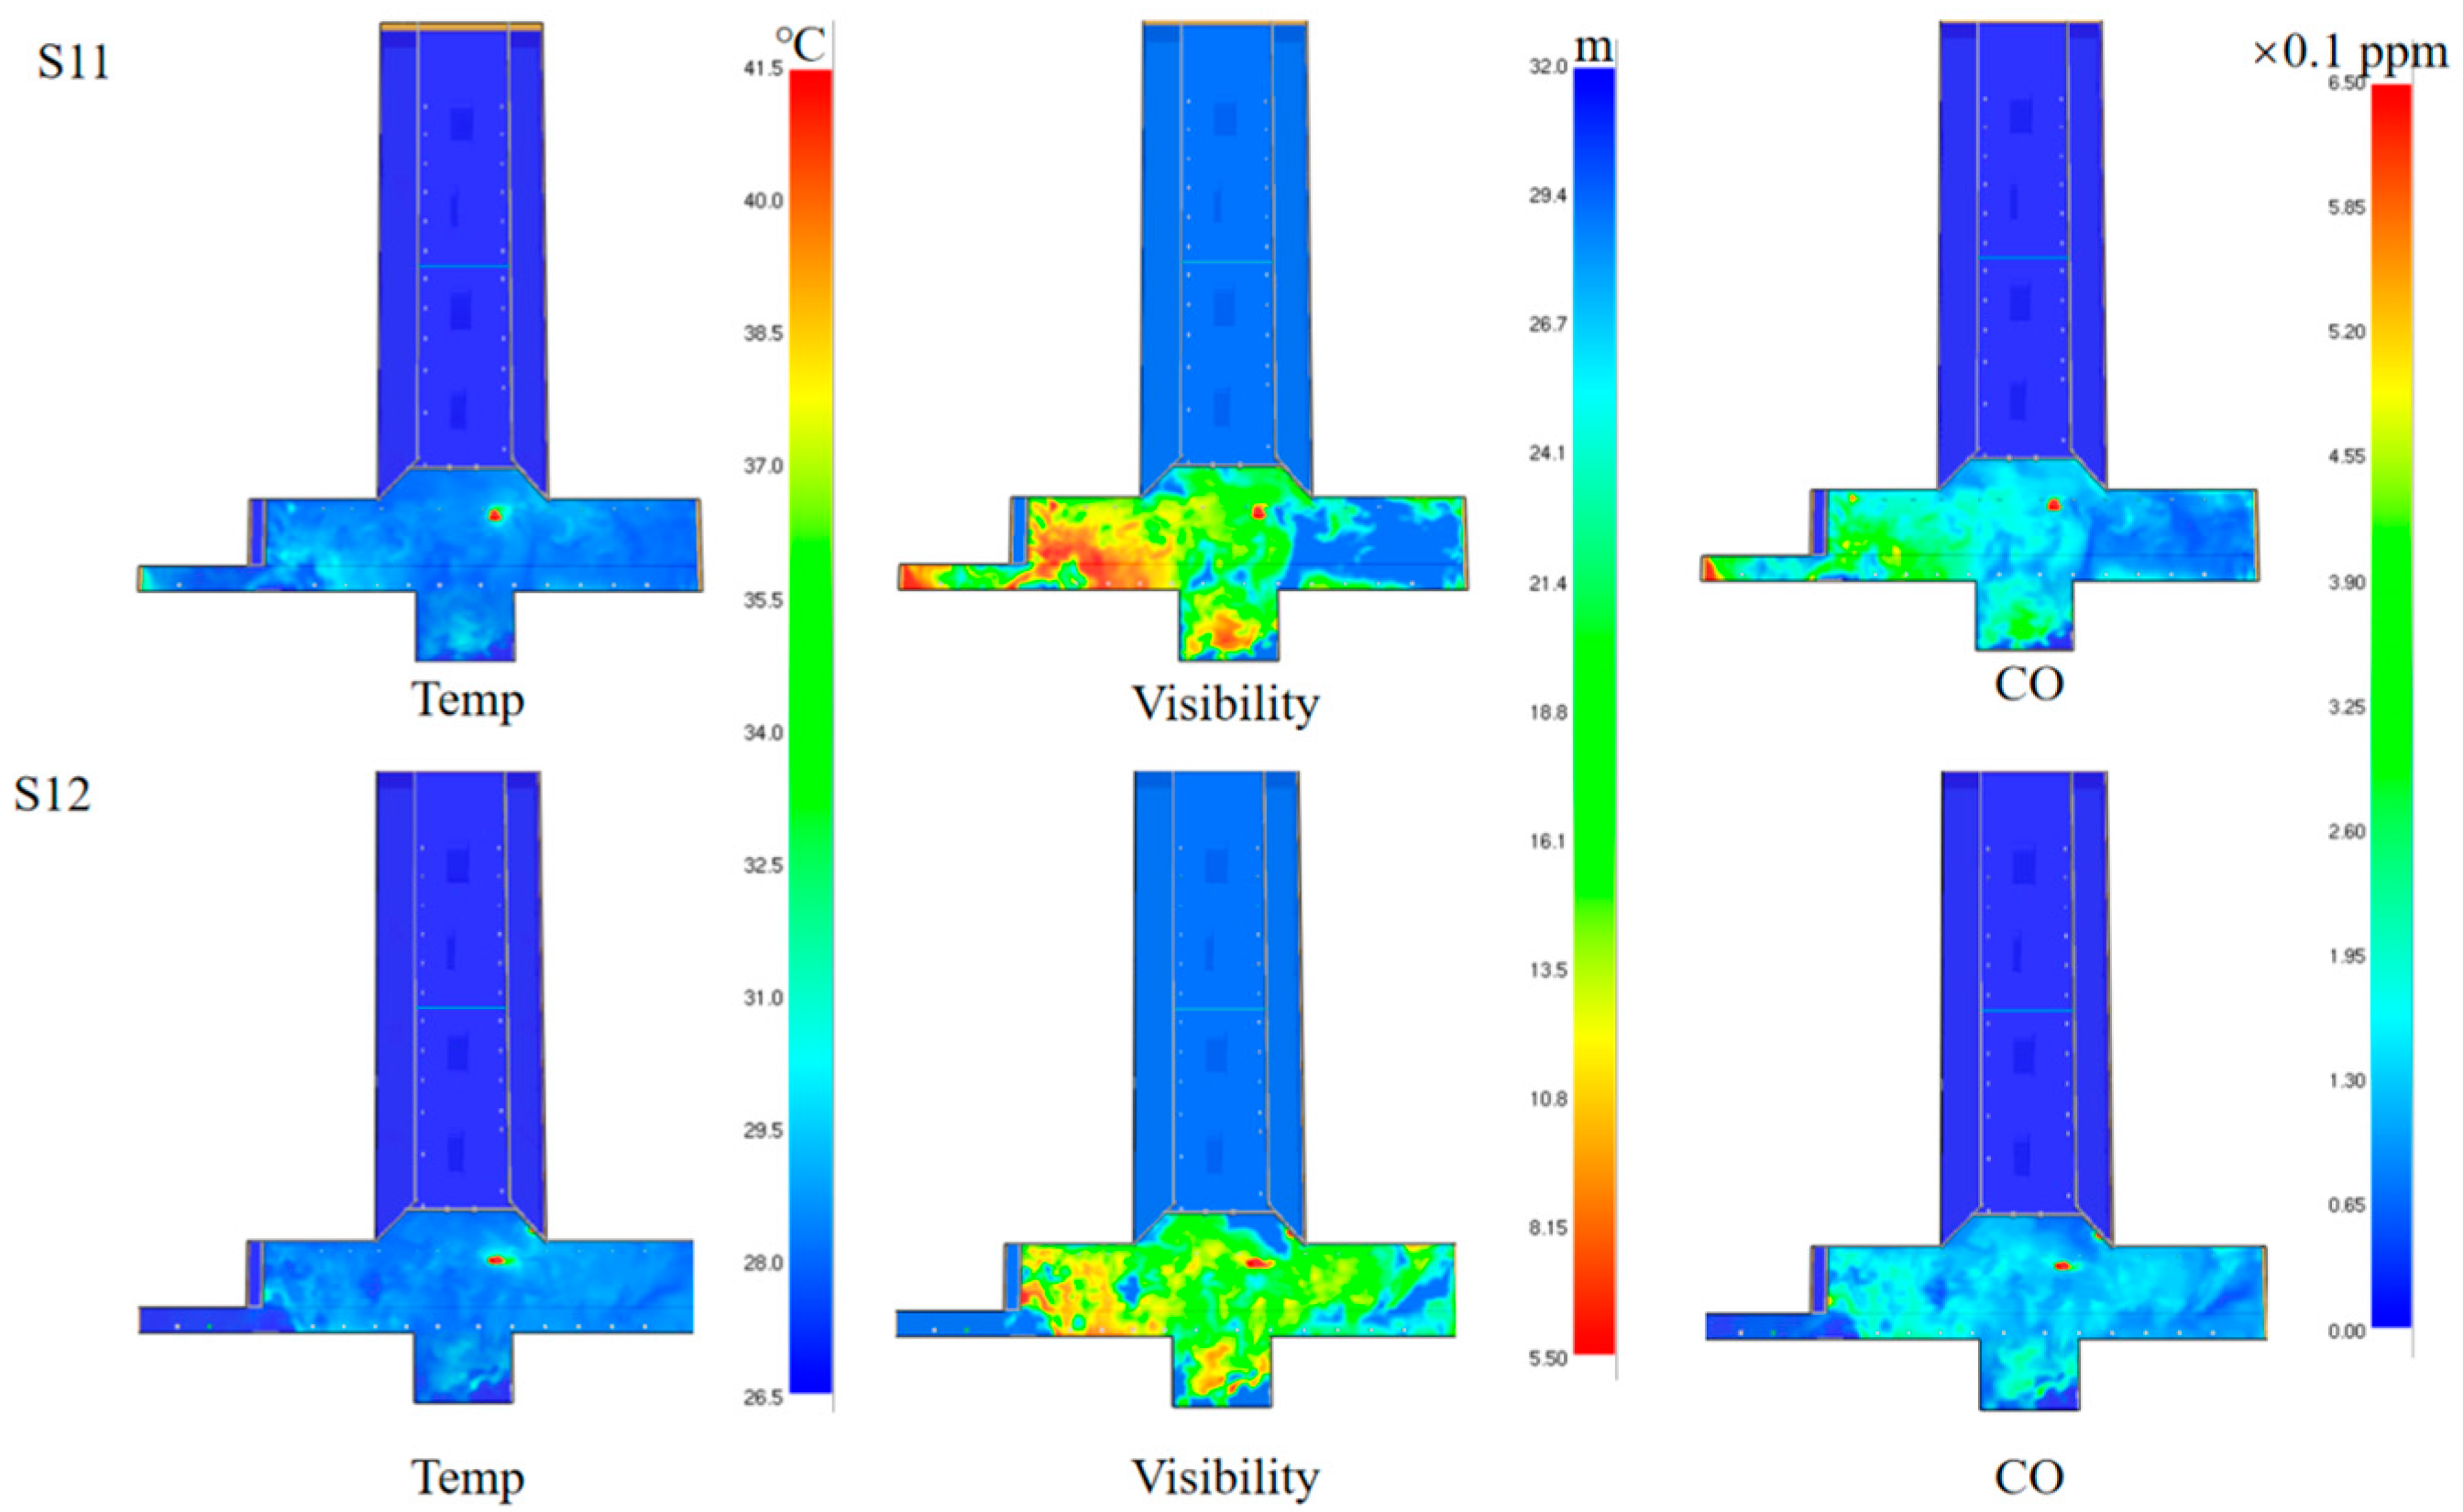
- When a fire occurs in the longitudinal side of ‘T’, the fans at the horizontal side, whether operating forward or in reverse, cannot disrupt the hot smoke flow pattern on the longitudinal side. Coordinated ventilation offers no assistance, making the traditional strategy of closing the fireproof roller shutter the most effective. Conversely, when a fire occurs in the horizontal side of ‘T’, lateral flow introduced by the fans on the longitudinal side can interrupt the propagation pattern, resulting in superior outcomes compared to those of the current strategy.
- (2)
- During coordinated ventilation, when the fan in the non-fire area supplies air, cold air is forced into the fire area; however, this does not prevent hot smoke from spreading from the ceiling. In this case, the closed fireproof roller shutter acts as a ceiling screen, playing a crucial role in inhibiting the spread of smoke.
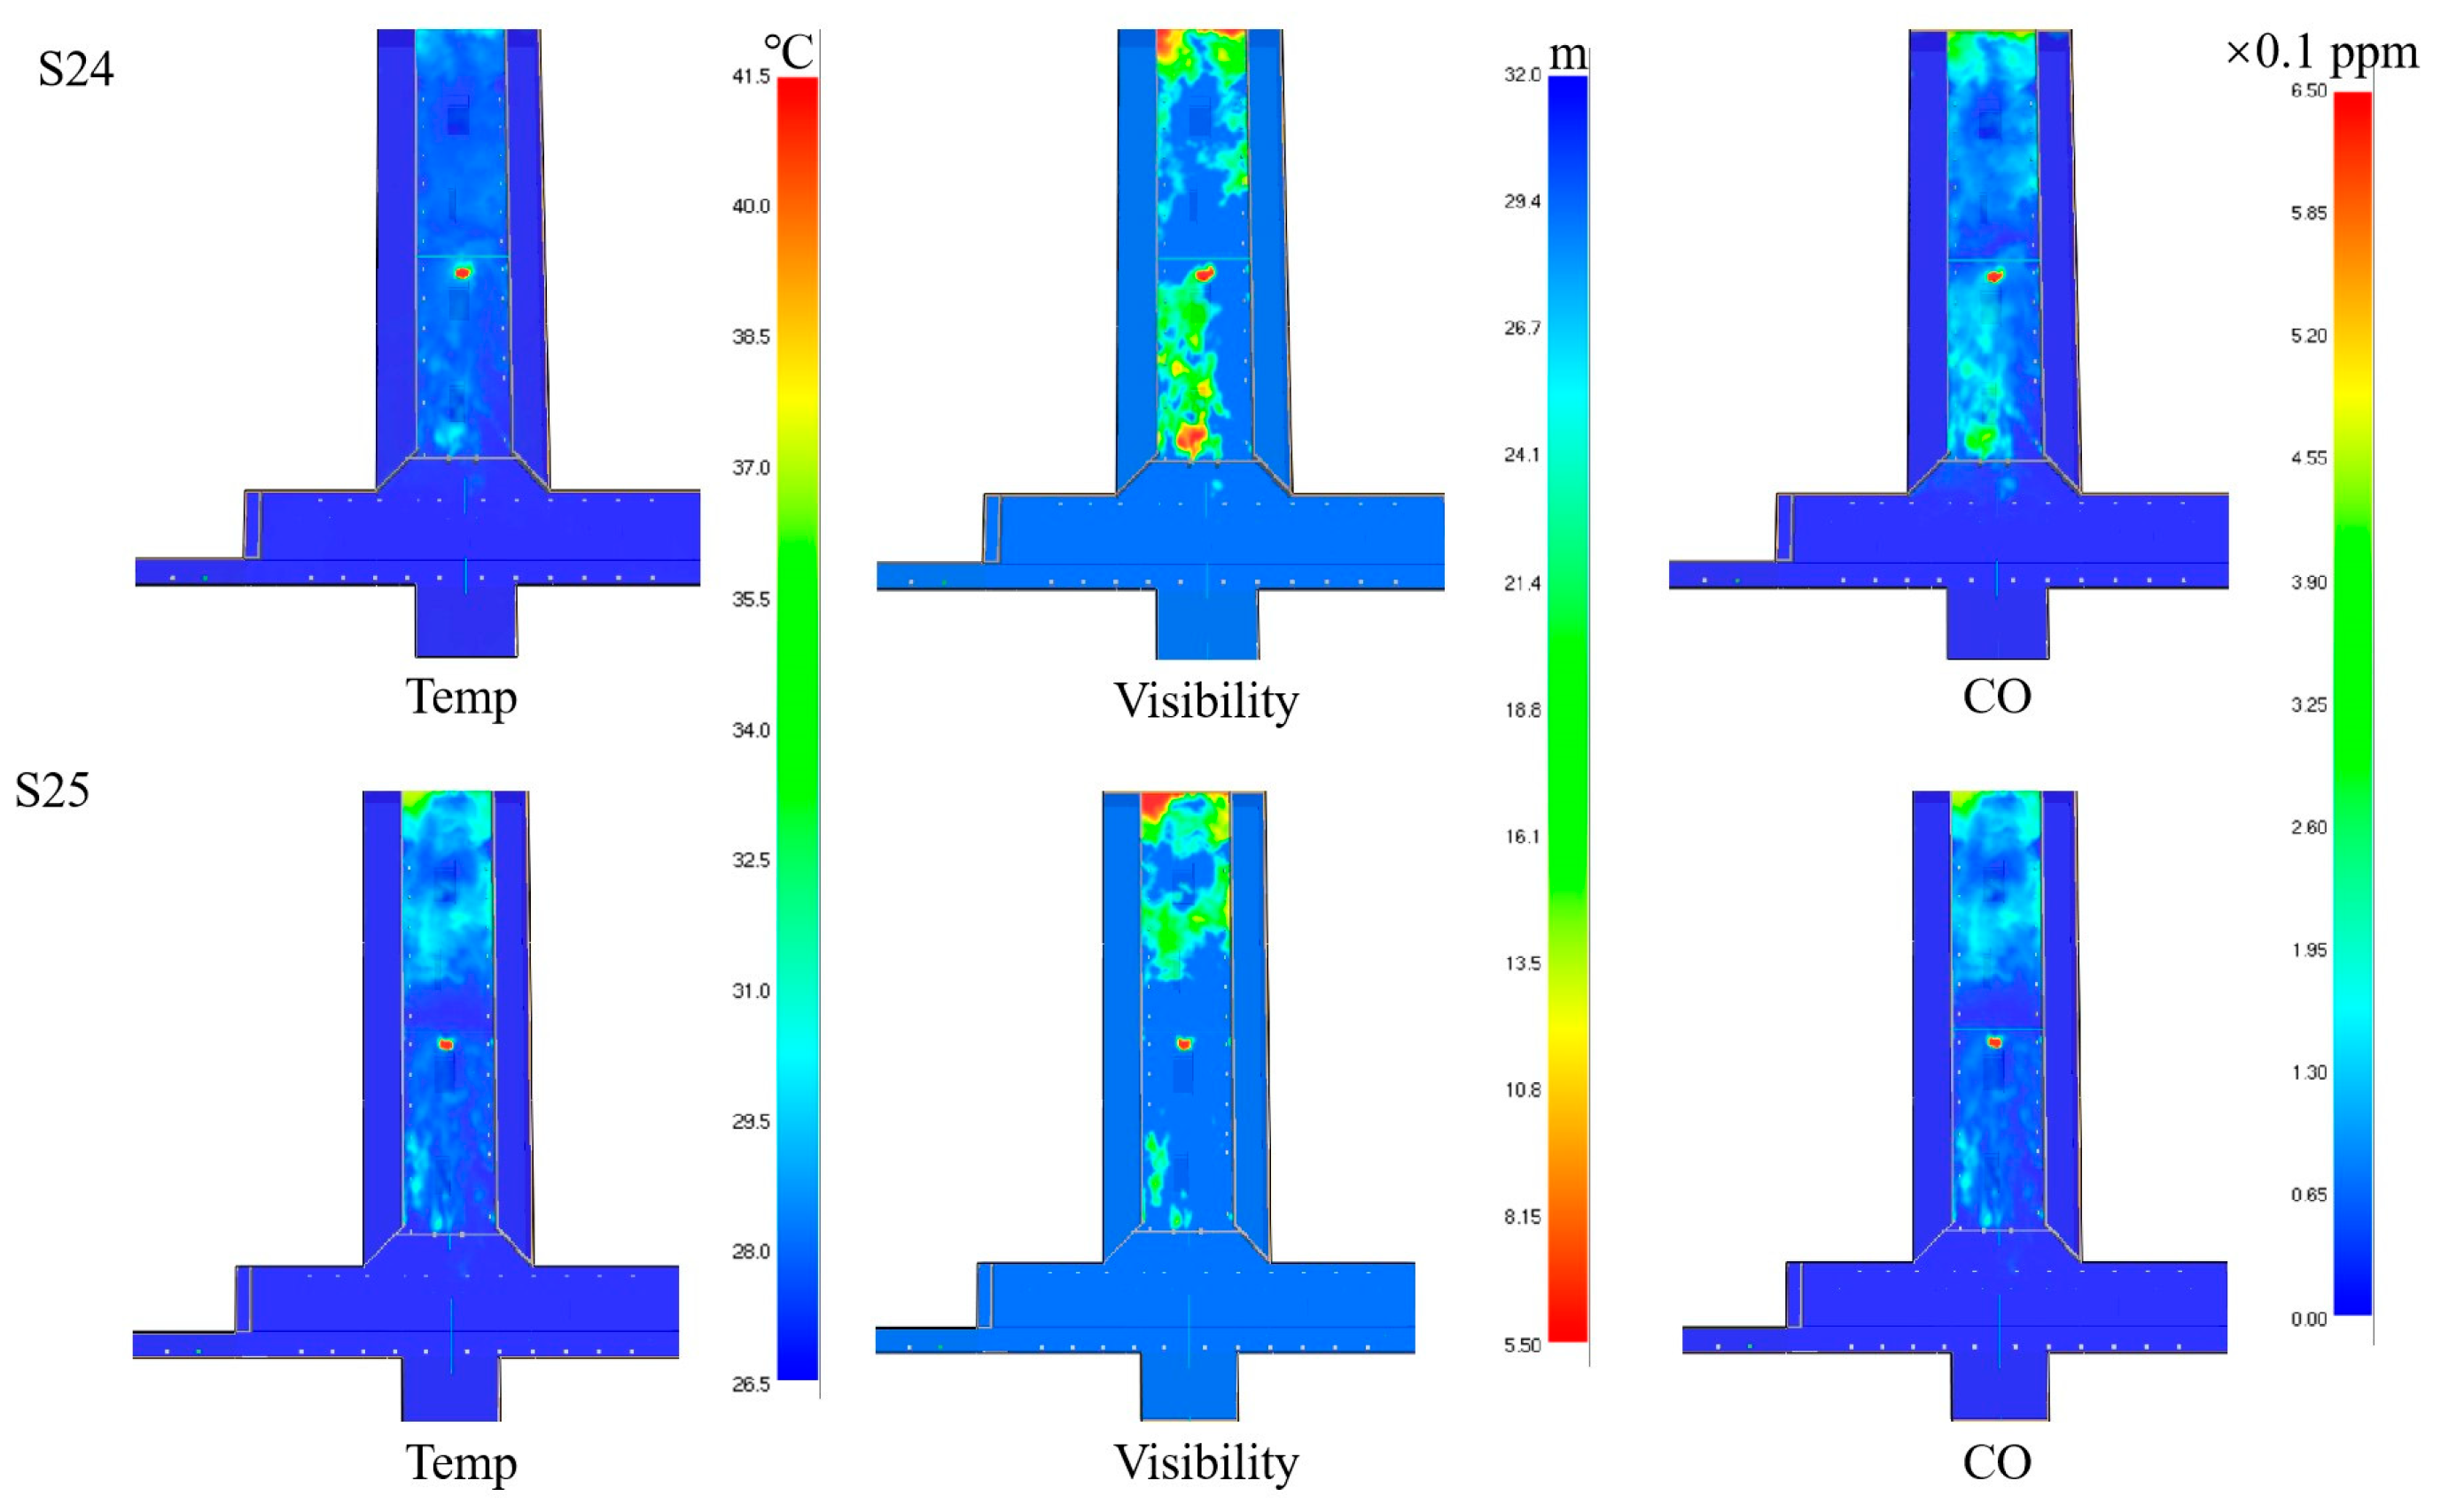
- (3)
- All the fans working simultaneously to extract smoke can effectively distribute hot smoke throughout the station hall. Under the influence of a baggage fire (1.5 MW), the danger zone will not expand, significantly reducing the temperature near the fire source and improving visibility, which helps to create a longer escape window. Supplying air to non-fire areas, while extracting smoke from the fire area is the optimal strategy to prevent outward smoke spread. However, this comes at the cost of the those in the fire area experiencing the highest temperatures and lowest visibility, making it suitable for situations where personnel can easily evacuate. In appropriate scenarios, collaborative ventilation can yield better evacuation conditions than those of independent ventilation.
- (4)
- The smoke flow patterns under the coordinated ventilation modes can also provide a reference for other T-shaped station halls with similar shapes (length-to-width ratio or the length of both sides of T) and exit layouts. In subsequent studies, more detailed discussions on geometric parameters and suggestions for station design can be presented.
Author Contributions
Funding
Institutional Review Board Statement
Informed Consent Statement
Data Availability Statement
Conflicts of Interest
References
- Wu, J. Research on Nanchang Metro Culture Construction. Master’s Thesis, Jiangxi University of Finance and Economics, Nanchang, China, 2022. [Google Scholar]
- Chen, G.; Wang, S.; Ran, Y.; Cao, X.; Fang, Z.; Xu, Z. Intelligent monitoring and quantitative evaluation of fire risk in subway construction: Integration of multi-source data fusion, FTA, and deep learning. J. Clean. Prod. 2024, 478, 143832. [Google Scholar] [CrossRef]
- Long, Z.; Zhong, M. Predicting smoke temperature distribution beneath ceiling for a large subway station fire. J. Build. Eng. 2024, 98, 111138. [Google Scholar] [CrossRef]
- Sun, J.; Lu, Z.; Zhou, D. Optimization analysis of evacuation facility parameters in interval tunnels under subway train fire accidents. Phys. A Stat. Mech. Appl. 2024, 651, 130020. [Google Scholar] [CrossRef]
- Zhou, D.; Hu, T.; Wang, Z.; Chen, T.; Li, X. Influence of tunnel slope on movement characteristics of thermal smoke in a moving subway train fire. Case Stud. Therm. Eng. 2021, 28, 101472. [Google Scholar] [CrossRef]
- Wang, K.; Cai, W.; Zhang, Y.; Hao, H.; Wang, Z. Numerical simulation of fire smoke control methods in subway stations and collaborative control system for emergency rescue. Process Saf. Environ. Prot. Prepublish 2020, 147, 146–161. [Google Scholar] [CrossRef]
- Shi, C.; Li, J.; Xu, X. Full-scale tests on smoke temperature distribution in long-large subway tunnels with longitudinal mechanical ventilation. Tunn. Undergr. Space Technol. Inc. Trenchless Technol. Res. 2021, 109, 103784. [Google Scholar] [CrossRef]
- Wang, X.; Liu, B.; Ma, W.; Feng, Y.; Li, Q.; Sun, T. Simulations on Evacuation Strategy and Evacuation Process of the Subway Train Under the Fire. Fire 2024, 7, 464. [Google Scholar] [CrossRef]
- Yan, X.; Yang, H.; Mo, H.; Xie, Y.; Jin, Z.; Zhou, Y. Numerical Simulation on the Smoke Prevention Performance of Air Curtains in an Island-Type Subway Station. Fire 2023, 6, 177. [Google Scholar] [CrossRef]
- Chen, J.; Long, Z.; Liu, C.; Cai, S.; Xu, B.; Cheng, H.; Zhong, M. Investigation of the performance of lateral ventilation in subway station fires. J. Wind Eng. Ind. Aerodyn. 2022, 228, 105133. [Google Scholar] [CrossRef]
- Peng, M.; Zhang, S.; Yang, H.; He, K.; Cong, W.; Cheng, X.; Zhang, H. Experimental study on confinement velocity in tunnel fires with longitudinal ventilation. J. Wind Eng. Ind. Aerodyn. 2020, 201, 104157. [Google Scholar] [CrossRef]
- Zhang, T.; Han, R. Numerical study on the influence of subway platform air curtains on smoke diffusion. Case Stud. Therm. Eng. 2023, 50, 103439. [Google Scholar] [CrossRef]
- Fan, X.; Yang, J.; Zhang, H.; Wan, Z.; Liu, J.; Liu, Z.; Zheng, W. Prediction of back-layering length in subway tunnel with on-fire train running. Tunn. Undergr. Space Technol. Inc. Trenchless Technol. Res. 2023, 141, 105375. [Google Scholar] [CrossRef]
- Teodosiu, C.; Kubinyecz, V. Platform Screen Doors in a Subway Station with a Train on Fire. Appl. Sci. 2022, 12, 8296. [Google Scholar] [CrossRef]
- Wang, J.; Wang, Y.; Wu, P.; Wu, P.; Jiang, J. Study on emergency ventilation mode for multisource fires in a typical interchange subway station. Int. J. Vent. 2022, 21, 157–176. [Google Scholar] [CrossRef]
- Zhao, H.; Yu, H.; Yuan, Y.; Li, P.; Chen, J. Cyclic loading behavior of a repaired subway station after fire exposure. Tunn. Undergr. Space Technol. Inc. Trenchless Technol. Res. 2019, 84, 210–217. [Google Scholar] [CrossRef]
- Zhang, J.; Li, Y.-F.; Dai, B.-Q.; Li, X.-J.; Huang, Y.-B. The Effect of Exhaust Velocity on Smoke Exhaust in Subway Platform Fire. Procedia Eng. 2018, 211, 1018–1025. [Google Scholar] [CrossRef]
- Wu, F.; Jiang, J.-C.; Zhou, R. Smoke Flow Temperature beneath the Ceiling in an Atrium-style Subway Station with Different Fire Source Locations. Procedia Eng. 2018, 211, 794–800. [Google Scholar] [CrossRef]
- Chen, J.; Zhong, M.; Qiu, P.; Long, Z.; Cheng, H. A study of repeatability of hot smoke test in a subway station. Case Stud. Therm. Eng. 2023, 41, 102666. [Google Scholar] [CrossRef]
- Lan, B.; Li, Y.R.; Li, P.C.; Gong, H.F. Numerical simulation of the chimney effect on smoke spread behavior in subway station fires. Case Stud. Therm. Eng. 2022, 39, 102446. [Google Scholar] [CrossRef]
- Long, Z.; Zhong, M.; Chen, J.; Cheng, H. Study on emergency ventilation strategies for various fire scenarios in a double-island subway station. J. Wind Eng. Ind. Aerodyn. 2023, 235, 105364. [Google Scholar] [CrossRef]
- Long, Z.; Chen, J.; Qiu, P.; Zhong, M. Study on the smoke layer height in subway platform fire under natural ventilation. J. Build. Eng. 2022, 56, 104758. [Google Scholar] [CrossRef]
- Chen, J.; Li, G.; Pan, R.; Long, Z.; Zhong, M. Numerical study on the airflow characteristics and smoke control condition in stair area of subway stations. J. Build. Eng. 2024, 84, 108577. [Google Scholar] [CrossRef]
- Junfeng, C.; Jijian, L.; Xiangliang, T.; Ling, Z.; Huihang, C.; Maohua, Z. Study on the effect of obstacles on smoke diffusion and airflow structure in subway stations. Build. Environ. 2023, 242, 110553. [Google Scholar] [CrossRef]
- Wei, C.; Kun, H.; Hui, Y.; Long, S.; Xudong, C. Experimental study on temperature characteristics in a subway train carriage with lateral openings in a longitudinally ventilated tunnel. Tunn. Undergr. Space Technol. Inc. Trenchless Technol. Res. 2023, 131, 104814. [Google Scholar]
- Liu, Y.; Li, Y.Z.; Ingason, H.; Liu, F. Control of thermal-driven smoke flow at stairways in a subway platform fire. Int. J. Therm. Sci. 2021, 165, 106937. [Google Scholar] [CrossRef]
- Feng, Z. Smoke control of side platform and the same concourse of metro transfer station. Fire Sci. Technol. 2020, 39, 213–216. [Google Scholar]
- Xie, Y. Numerical simulations on fire control of subway transfer station sharing one concourse. Fire Sci. Technol. 2017, 36, 1233–1235. [Google Scholar]
- Yuan, J.P.; Liao, Y.J.; Zhou, S.D. Smoke exhaust mode for large metro transfer station hall. Eng. J. Wuhan Univ. 2015, 48, 805–808. [Google Scholar]
- Cheng, H. Model experimental study on fire in metro multi-line transfer station-(4)fire in transfer channel. J. Saf. Sci. Technol. 2021, 17, 12–19. [Google Scholar]
- Chen, J.; Zhong, M.; Cheng, H.; Long, Z.; Yang, Y. Model experimental study on fire in metro multi-line transfer station:(2)fire in cross-transfer station. J. Saf. Sci. Technol. 2020, 16, 5–11. [Google Scholar]
- Weng, M.C.; Yu, L.X.; Liu, F.; Nielsen, P.V. Full-scale experiment and CFD simulation on smoke movement and smoke control in a metro tunnel with one opening portal. Tunn. Undergr. Space Technol. Inc. Trenchless Technol. Res. 2014, 42, 96–104. [Google Scholar] [CrossRef]
- Qin, J.; Liu, C.; Huang, Q. Simulation on fire emergency evacuation in special subway station based on Pathfinder. Case Stud. Therm. Eng. 2020, 21, 100677. [Google Scholar] [CrossRef]
- Long, Z.; Liu, C.; Yang, Y.; Qiu, P.; Tian, X.; Zhong, M. Full-scale experimental study on fire-induced smoke movement and control in an underground double-island subway station. Tunn. Undergr. Space Technol. Inc. Trenchless Technol. Res. 2020, 103, 103508. [Google Scholar] [CrossRef]
- Liu, F.; Liu, Y.; Xiong, K.; Weng, M.; Wang, J. Experimental and numerical study on the smoke movement and smoke control strategy in a hub station fire. Tunn. Undergr. Space Technol. Inc. Trenchless Technol. Res. 2020, 96, 103177. [Google Scholar] [CrossRef]
- Shi, C. Experimental and Numerical Analysis of Fire in Deeply Buried Underground Stations; Science Press in BeiJing: Beijing, China, 2009. [Google Scholar]
- Zhang, L.; Wu, X.; Liu, M.; Liu, W.; Ashuri, B. Discovering worst fire scenarios in subway stations: A simulation approach. Autom. Constr. 2019, 99, 183–196. [Google Scholar] [CrossRef]
- GB/T 43392-2023; Safety performance test and assessment method for metro disaster prevention system. Standards Press of China: Beijing, China, 2023.


| Smoke Compartment ID | Smoke Compartment Area (m2) | Designed Exhaust Flow Rate (m3/h) | Air Volume of Exhaust Fan (m3/h) |
|---|---|---|---|
| 1 | 1500 | 90,000 | 130,000 |
| 2 | 1500 | 90,000 | 130,000 |
| 3 | 1750 | 105,000 | 151,200 |
| 4 | 1750 | 105,000 | 151,200 |
| Sim. Case | Fire Source Location | Fireproof Roller Shutters | PY-A1 | PY-B1 | PY-A2 | PY-B2 |
|---|---|---|---|---|---|---|
| S11 | B | Down | S | F | S | S |
| S12 | F | F | S | S | ||
| S13 | Up | F | F | S | S | |
| S14 | F | F | F | S | ||
| S15 | F | F | F | F | ||
| S16 | F | F | R | S | ||
| S17 | F | F | R | R | ||
| S21 | A | Down | S | S | F | S |
| S22 | S | S | F | F | ||
| S23 | Up | S | S | F | F | |
| S24 | F | F | F | F | ||
| S25 | R | R | F | F |
| Grid Size (m) | MAE (°C) | CPU Time (h) |
|---|---|---|
| 1.0 × 1.0 × 1.0 | 6.91 | 0.274 |
| 0.50 × 0.50 × 0.50 | 1.96 | 5.23 |
| 0.25 × 0.25 × 0.25 | - | 71.9 |
Disclaimer/Publisher’s Note: The statements, opinions and data contained in all publications are solely those of the individual author(s) and contributor(s) and not of MDPI and/or the editor(s). MDPI and/or the editor(s) disclaim responsibility for any injury to people or property resulting from any ideas, methods, instructions or products referred to in the content. |
© 2025 by the authors. Licensee MDPI, Basel, Switzerland. This article is an open access article distributed under the terms and conditions of the Creative Commons Attribution (CC BY) license (https://creativecommons.org/licenses/by/4.0/).
Share and Cite
Hou, Y.; Ding, W.; Hou, Z.; Li, X.; Li, L.; Yang, Z.; Shi, C. Study on Performance of Coordinated Ventilation Strategies during T-Shaped Subway Station Hall Fire. Fire 2025, 8, 56. https://doi.org/10.3390/fire8020056
Hou Y, Ding W, Hou Z, Li X, Li L, Yang Z, Shi C. Study on Performance of Coordinated Ventilation Strategies during T-Shaped Subway Station Hall Fire. Fire. 2025; 8(2):56. https://doi.org/10.3390/fire8020056
Chicago/Turabian StyleHou, Yanan, Wei Ding, Zhengbo Hou, Xingcheng Li, Ling Li, Zhihao Yang, and Congling Shi. 2025. "Study on Performance of Coordinated Ventilation Strategies during T-Shaped Subway Station Hall Fire" Fire 8, no. 2: 56. https://doi.org/10.3390/fire8020056
APA StyleHou, Y., Ding, W., Hou, Z., Li, X., Li, L., Yang, Z., & Shi, C. (2025). Study on Performance of Coordinated Ventilation Strategies during T-Shaped Subway Station Hall Fire. Fire, 8(2), 56. https://doi.org/10.3390/fire8020056