Communication

Research of Characteristics of the Thermal Runaway Process of Full-Size Prefabricated Cabin Energy Storage System

1
China Academy of Building Research, Beijing 100013, China
2
CABR Fire Technology Co., Ltd., Beijing 100013, China
3
Building Fire Research Institute, China Academy of Building Research, Beijing 100013, China
4
Inner Mongolia Urban Renewal Research and Development Co., Ltd., Hohhot 010011, China
*
Author to whom correspondence should be addressed.
Fire 2025, 8(5), 164; https://doi.org/10.3390/fire8050164
Submission received: 26 March 2025 / Revised: 14 April 2025 / Accepted: 19 April 2025 / Published: 22 April 2025
(This article belongs to the Special Issue Intrinsic Fire Safety of Lithium-Based Batteries)

Abstract

:
In order to study the characteristics of the thermal runaway process of a full-size prefabricated cabin energy storage system, a full-scale prefabricated cabin energy storage physical fire test platform was designed using 100% SOC energy storage battery packs as the thermal runaway object, and full-scale prefabricated cabin energy storage system physical fire experiments were conducted. This experiment analyzes the early change rules of parameters such as temperature, voltage, CO, and VOC after the energy storage system enters thermal runaway and explores the technical methods to improve the fire protection of electrochemical energy storage systems. The results show that the time when the surface temperature of the runaway cell undergoes a sudden change is 37 s later than the time when the voltage undergoes a sudden change; the CO at the bottom and middle of the runaway cluster reaches the alarm threshold 25 s and 39 s earlier than that at the top of the cluster, respectively, and the peak concentration of CO at the bottom and middle of the cluster is more than three times that at the top of the cluster. The opening of the fan causes the CO concentration on the left side of the thermal runaway cluster to be higher than that of the runaway cluster; before the battery thermal runaway, the VOC concentration at the middle and top of the runaway cluster is generally higher than that at the bottom of the cluster. After thermal runaway occurs, the VOC concentration at the bottom of the thermal runaway cluster exceeds that at other positions of the runaway cluster and the adjacent cluster; the tVOC at the top, middle, and bottom of the thermal runaway cluster is 2296 s, 1681 s, and 1464 s earlier than the tCO, respectively, but the initial detection value of VOC fluctuates more than that of CO.

1. Instruction

With the large-scale application of lithium battery energy storage prefabricated cabins, their safety issues have become increasingly prominent. In recent years, multiple fire accidents have occurred at energy storage power stations worldwide, resulting in significant casualties and economic losses. For example, in April 2021, a fire and explosion at the Beijing Dahongmen Energy Storage Power Station caused the deaths of one staff member and two firefighters [1]. On 18 April 2022, a fire at an energy storage power station in Arizona, USA, resulted in substantial economic losses [2]. Fire prevention and control have become one of the critical issues in the development of the lithium battery energy storage industry. Research on thermal runaway fire prevention and control for prefabricated cabin energy storage power stations is urgently needed, particularly through full-scale fire experiments to study the characteristics of thermal runaway and related prevention strategies.
Research on the characteristics of lithium battery thermal runaway can be divided into three levels: cell-level, module-level, and system-level. In one study at the cell level, Feng et al. [3] derived the propagation speed of the thermal runaway front, quantitatively characterizing the thermal runaway propagation process in large lithium-ion batteries. In one study at the module level, Zhang et al. [4] studied the thermal runaway propagation characteristics within battery packs, analyzing temperature, voltage, and gas production to establish a three-dimensional thermal runaway propagation model. Jin et al. [5] conducted overcharge experiments on an 8.8 kWh lithium iron phosphate module, showing that among the six common gases (H2, CO, CO2, HCl, HF, and SO2) released during thermal runaway, H2 was detected 639 s earlier than smoke detectors and 769 s before the fire. Koch et al. [6] used a series of sensors (including voltage, temperature, gas, smoke, and pressure sensors) to analyze the LIB thermal runaway process, demonstrating that gas signals are the earliest detectable in any battery abuse mode. Many scholars [7,8,9,10,11] have compared the effects of different thermal runaway conditions on the propagation characteristics within modules, with variables including ambient pressure, cathode materials, lithium battery size, thermal runaway trigger conditions, and series-parallel configurations. In studies at the system level, some scholars [12,13] conducted full-scale fire tests for electric vehicles, but these research findings cannot be directly applied to lithium battery energy storage prefabricated cabins. Sun et al. [14] conducted overcharge tests on battery modules in an actual energy storage cabin. However, since the cabin only contained a single battery module with ample open space, the results failed to fully reflect the thermal runaway scenarios in real-world projects where battery modules densely fill the entire cabin. However, there are few public reports on the fire characteristics of energy storage prefabricated cabins, especially full-scale physical fire research. Most experiments are conducted using scaled-down, partial simulations and numerical modeling [15,16], with few real batteries and battery packs and the insufficient placement of dummy packs, leading to differences from actual engineering scenarios and making it difficult to accurately guide fire protection system design.
The novelty of this manuscript includes the following: (i) a full-size experiment was innovatively conducted to explore the characteristics of the thermal runaway of an energy storage prefabricated cabin, in which vacancies were filled with real or dummy packs; (ii) the concentration of VOC and CO was detected by a composite gas detector to compare the detection time of two types of gas; (iii) the concentration of CO was detected by a composite gas detector to reveal the influence of fan operation on the dispersion of CO.
This paper investigates the temperature and voltage data of cells within battery packs, as well as changes in CO, VOC, and other parameters inside and outside the battery pack, through full-scale fire experiments on prefabricated cabin energy storage systems. It explores the early accident characteristics of actual fires in energy storage power stations, providing a data foundation for the design of fire prevention and detection strategies.

2. Experimental Design

This study established a cabin-level fire test platform using a full-scale 20-foot energy storage prefabricated cabin. The platform incorporated an engineering-accurate fire protection system layout and housed one fully-charged battery pack as the thermal runaway unit. To realistically simulate actual gas distribution patterns during thermal runaway while controlling for experimental costs and losses, placeholder dummy packs were used to fill other battery pack positions in the cabin.
The test apparatus and methodology were designed in compliance with the CEC 373 Technical Specification for the Fire Protection of a Lithium Iron Phosphate Battery Energy Storage Power Station Based on a Prefabricated Cabin.

2.1. Test Materials and Equipment

A 1:1 full-scale 20-foot lithium iron phosphate energy storage prefabricated cabin was used. The battery cabin had two air inlets at the middle–lower right side and an outlet/fan at the top left. The exhaust fan had a rated airflow capacity of 1200 m3/h, operated at 2800 revolutions per minute (rpm), and consumed 120 watts (W) of power. The cabin could accommodate two rows of battery clusters (front and back), with five clusters per row, totaling ten clusters. Each cluster consisted of eight battery packs and one high-voltage electrical box, with the high-voltage box located at the bottom of each cluster. The battery packs included real packs and dummy packs. Real packs contained 52 fully charged cells (1P52S), while dummy packs were sealed shells without cells. The dummy packs were identical to functional battery packs in both exterior dimensions and material composition, with the only difference being the absence of internal battery cells. The lithium iron phosphate cells had a nominal voltage of 3.25 V and a capacity of 280 Ah. Mica sheets were used for insulation between cells.
During the test, a CW1310-07A composite gas detector produced by YantaiChungway New Energy Technology Co., Ltd. (Yantai City, China) was used to monitor VOC and CO concentration signals during the test. The CO measurement range is 0–1000 ppm with an accuracy of 1 × 10⁻⁶ ppm, while the VOC measurement range is 1–1000 ppm with an accuracy of 1 × 10⁻⁶ ppm.
The composite gas detector from this company classifies CO and VOC detection values into different warning levels in accordance with local fire safety regulations [17,18] and uploads the warning levels to the fire control panel. The fire control panel then activates the fan based on the warning level. When the composite gas detector reaches a Level 2 warning (i.e., CO concentration reaches 190 ppm or VOC meets specific trend criteria), the fire control panel starts the fan for exhaust ventilation.
A high-voltage electrical box was used to collect battery cell voltage signals during the test, with a measurement range of 0–5000 mV and an accuracy of ±1 mV.
K-type thermocouples were employed to record temperature signals during the test, featuring a measurement range of −200 °C to 1300 °C, an accuracy of ±1.5 °C, and a response time of 0.1 s.
A 1000 W heating pad was used to induce thermal runaway through constant power heating.
An electric ignition needle (specific model) was used for ignition, with an input voltage of AC 220 V, an output voltage of no less than 5 kV, and an ignition distance of no more than 5 mm.

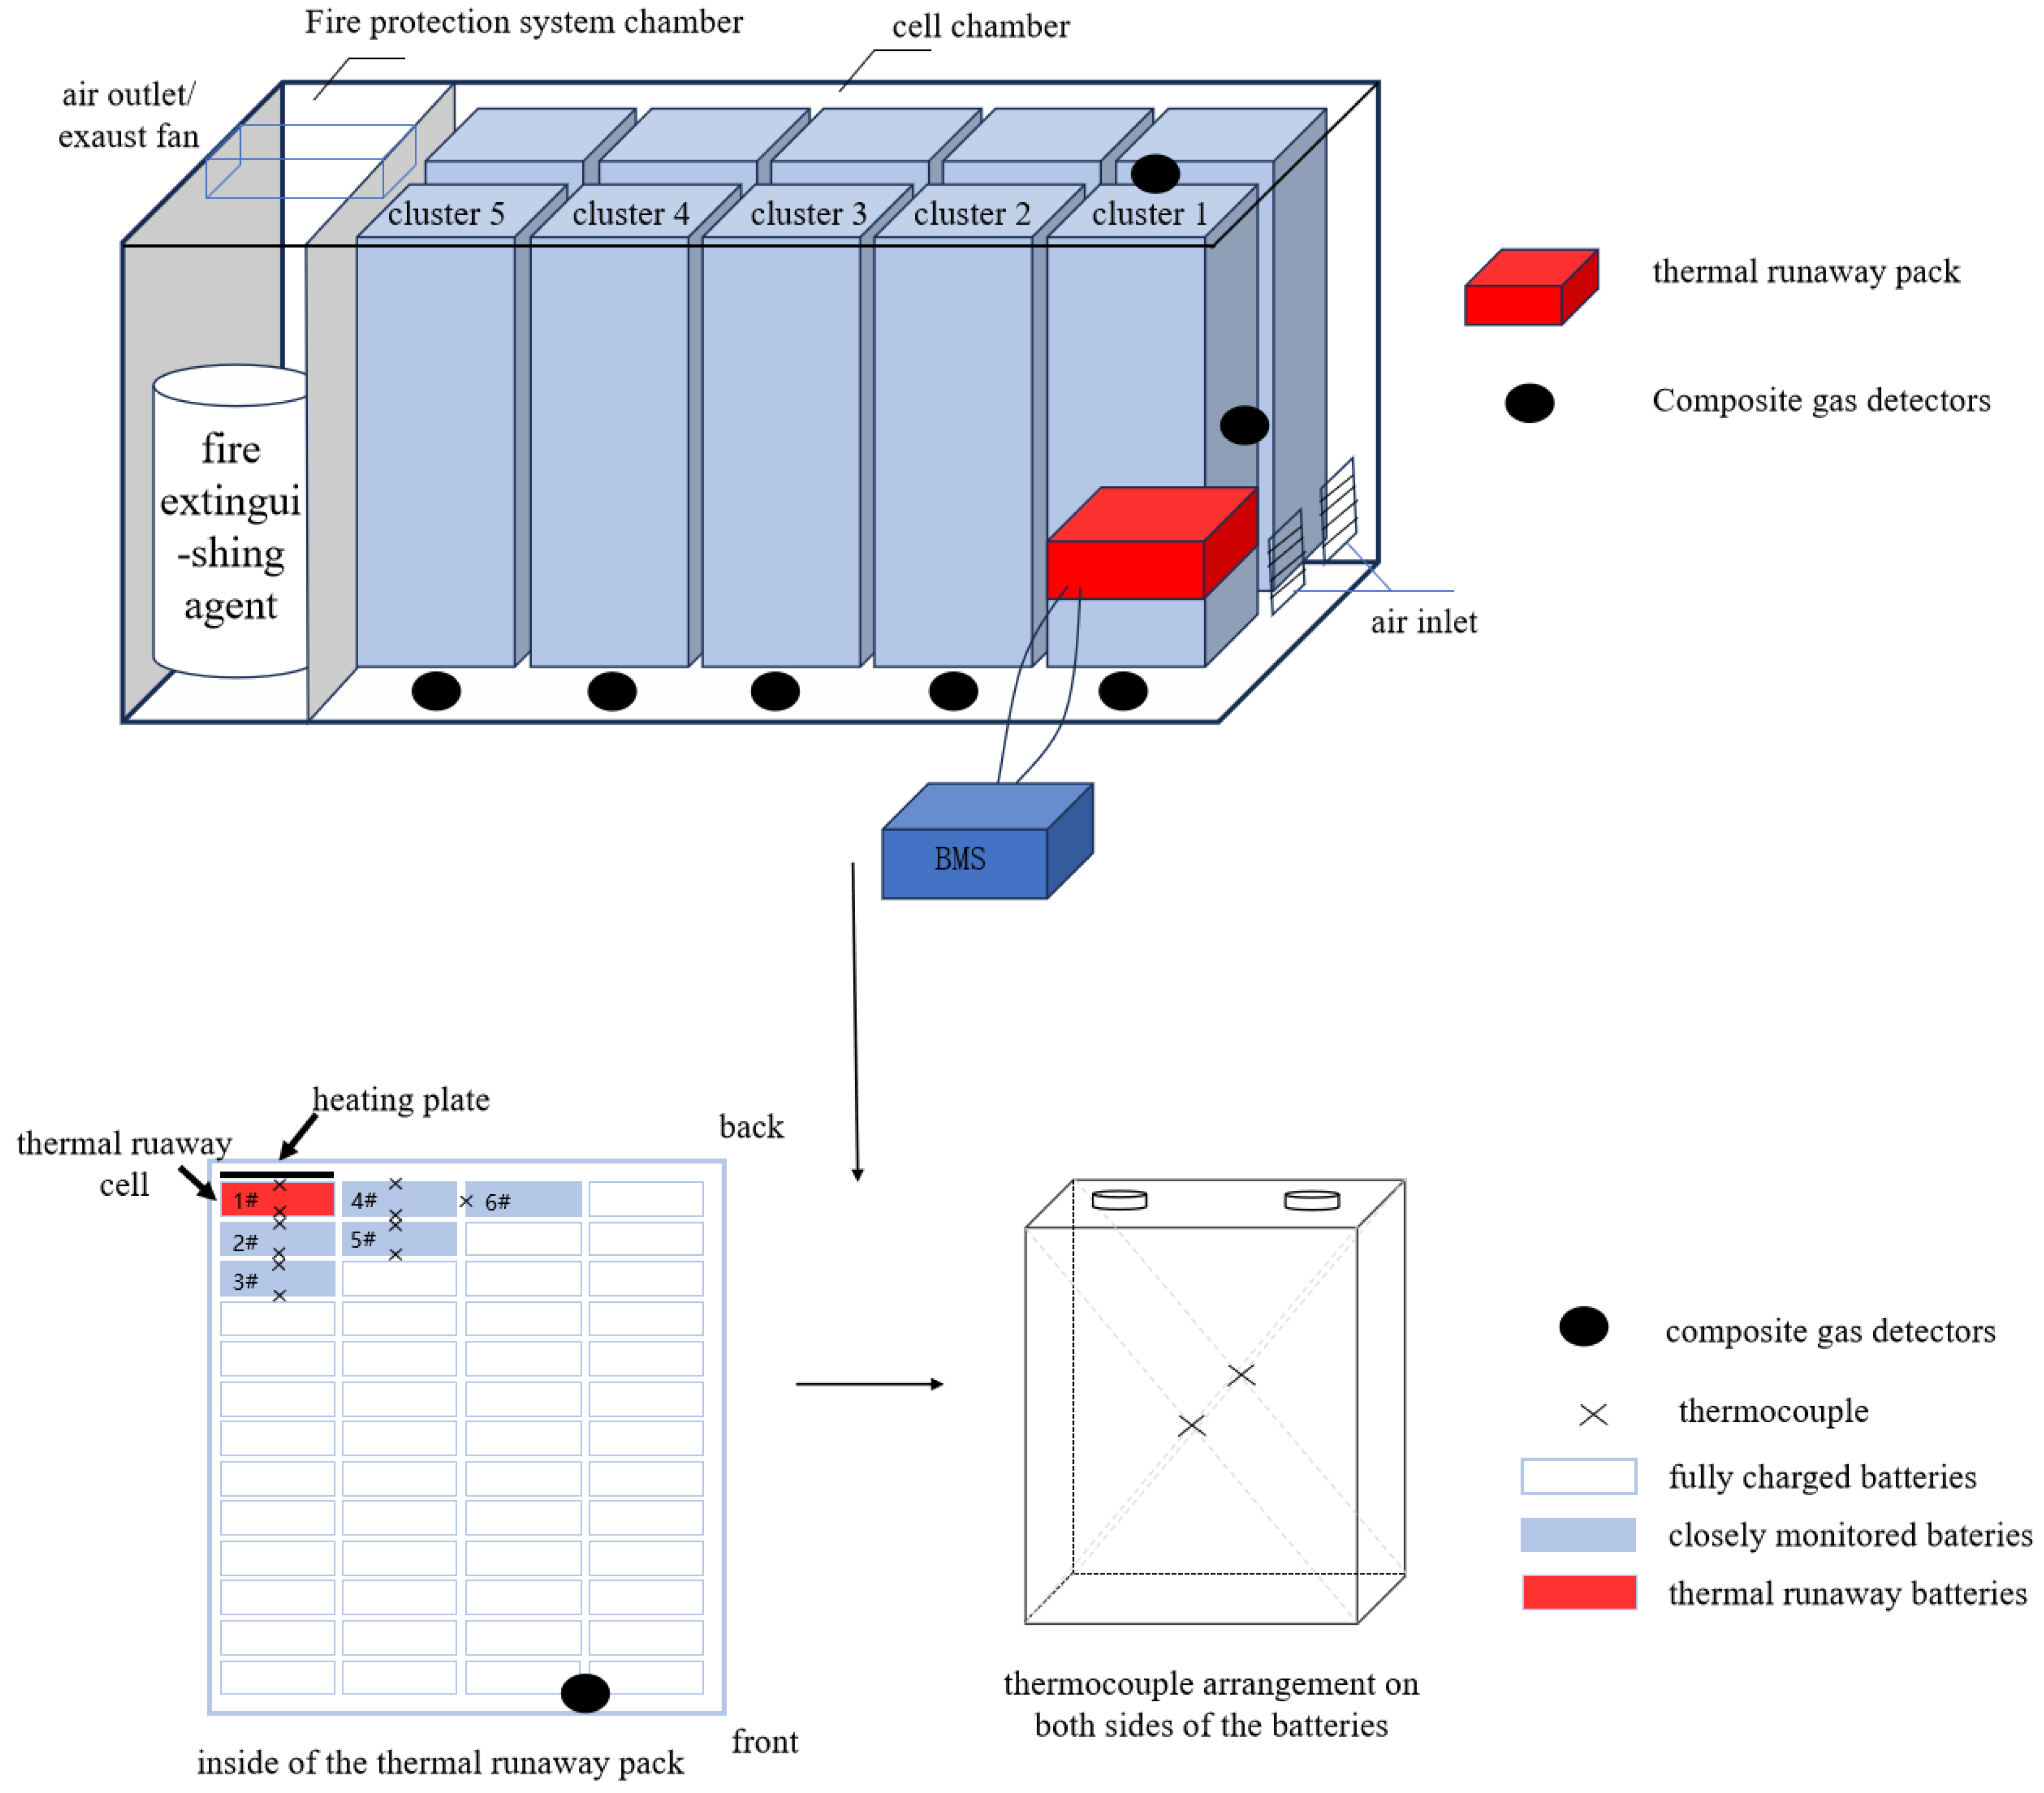
2.2. Experimental Setup

As shown in Figure 1, the thermal runaway cluster was located at the front right, farthest from the fire protection system cabin. The second battery pack from the bottom in the thermal runaway cluster was designated as the thermal runaway pack. Only the thermal runaway pack contained actual battery cells, while all other positions were filled with structurally identical dummy packs (without internal cells). The red-marked cell #1 in the thermal runaway pack was the thermal runaway cell, with five blue-marked surrounding cells as the key monitoring cells, and the rest were fully charged cells.
Composite gas detectors were placed at the bottom, middle, and top of the thermal runaway cluster, as well as at the bottom of the first, second, third, and fourth clusters to the left of the thermal runaway cluster. One detector was also placed inside the thermal runaway pack. Consistent with actual engineering design standards, only the detector at the top of the thermal runaway cluster was connected to the fire control panel, while all other detectors functioned exclusively for CO and VOC concentration monitoring. The heating plate was placed behind cell #1. Eleven K-type thermocouples were arranged on the surfaces of cells #1–#5 and near cell #6 to monitor temperatures. The battery management system (BMS) was placed outside the cabin to prevent damage. Cameras were positioned near the vent openings of the thermal runaway pack and at the top of the cluster to observe the overall situation inside and outside the cabin.

2.3. Test Method

After recording the baseline data, the heating plate was activated at 1000 W constant power. Composite gas detectors measured CO and VOC concentrations, thermocouples recorded temperature data, and the BMS of the high-voltage electrical box recorded cell voltage data. When the CO concentration at the top of the thermal runaway cluster reached 190 ppm or the VOC met specific trends, the fan was activated for ventilation. After smoke reached a certain concentration, ignition was performed, and the fire protection system was activated according to the preset program. After the extinguishing agent was discharged, the system was left undisturbed for 24 h to confirm safety before opening the cabin, concluding the experiment. The fire control panel regulated the exhaust fan’s operation based on early warning signals from the composite gas detector installed at the top of the thermal runaway cluster. Following confirmed battery thermal runaway, the system initiated ignition and ultimately deployed a C6F12O (Novec 1230) fire suppressant for extinguishment.

3. Test Results and Analysis

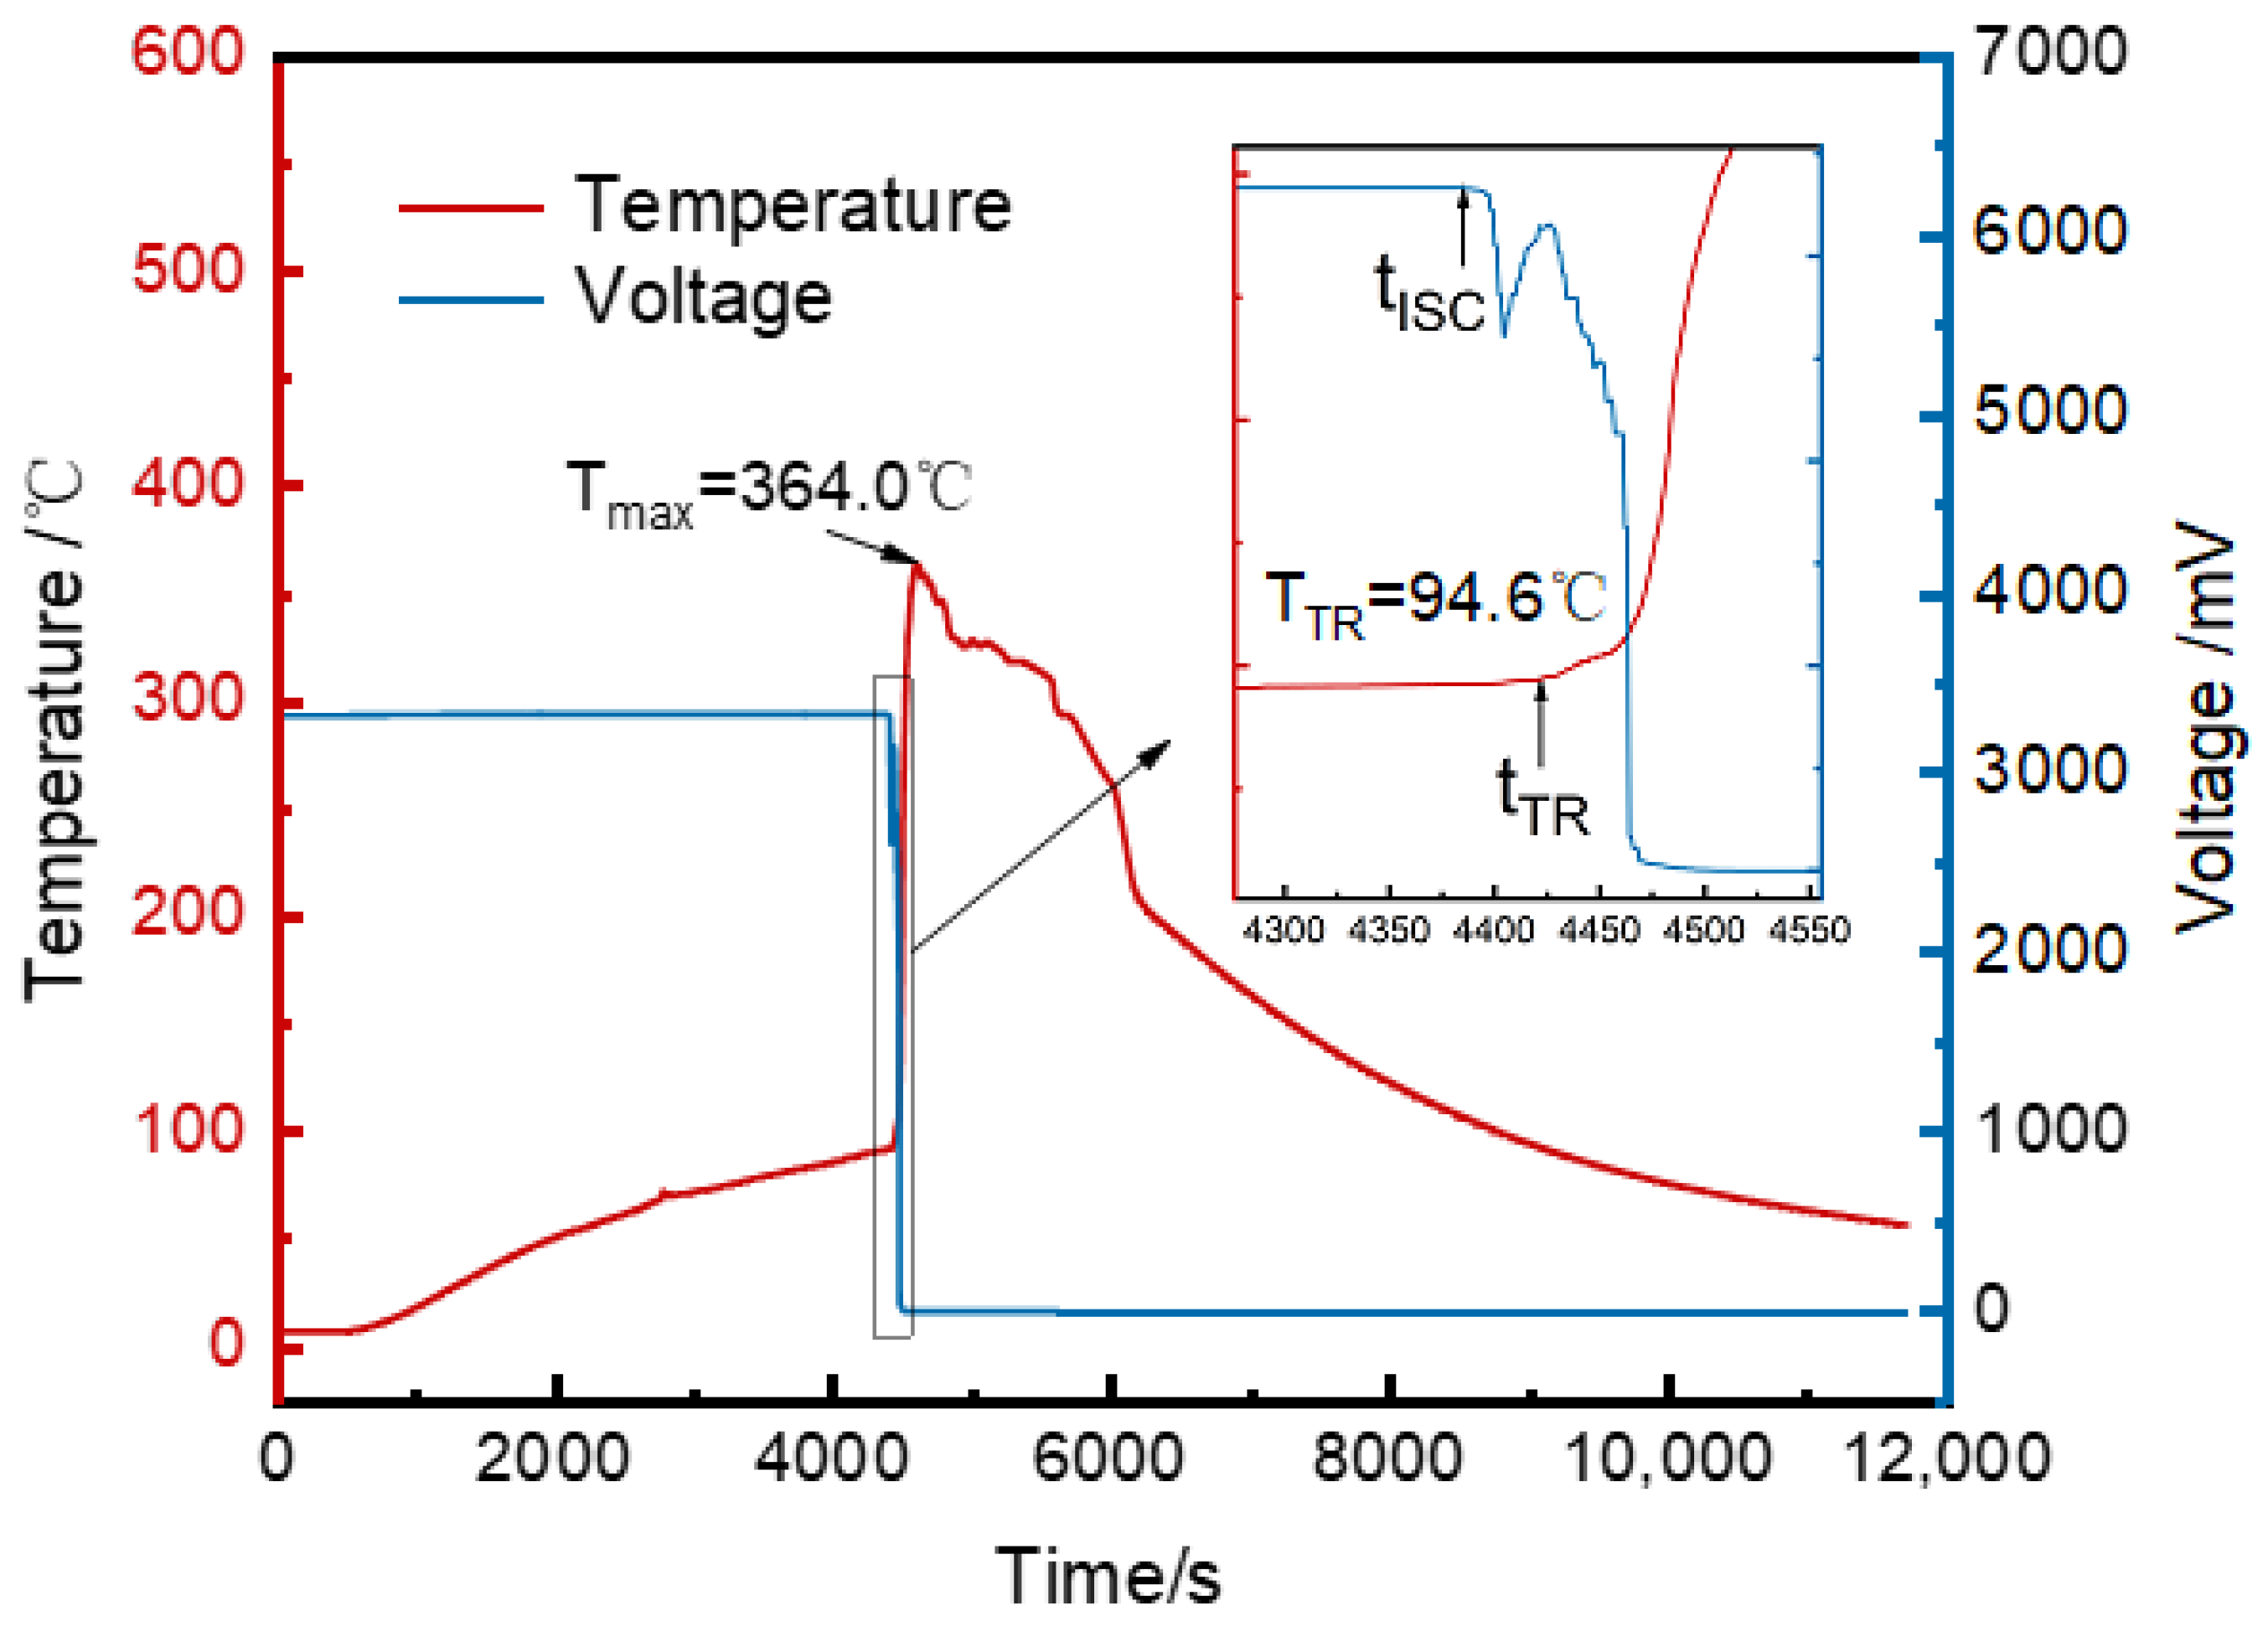
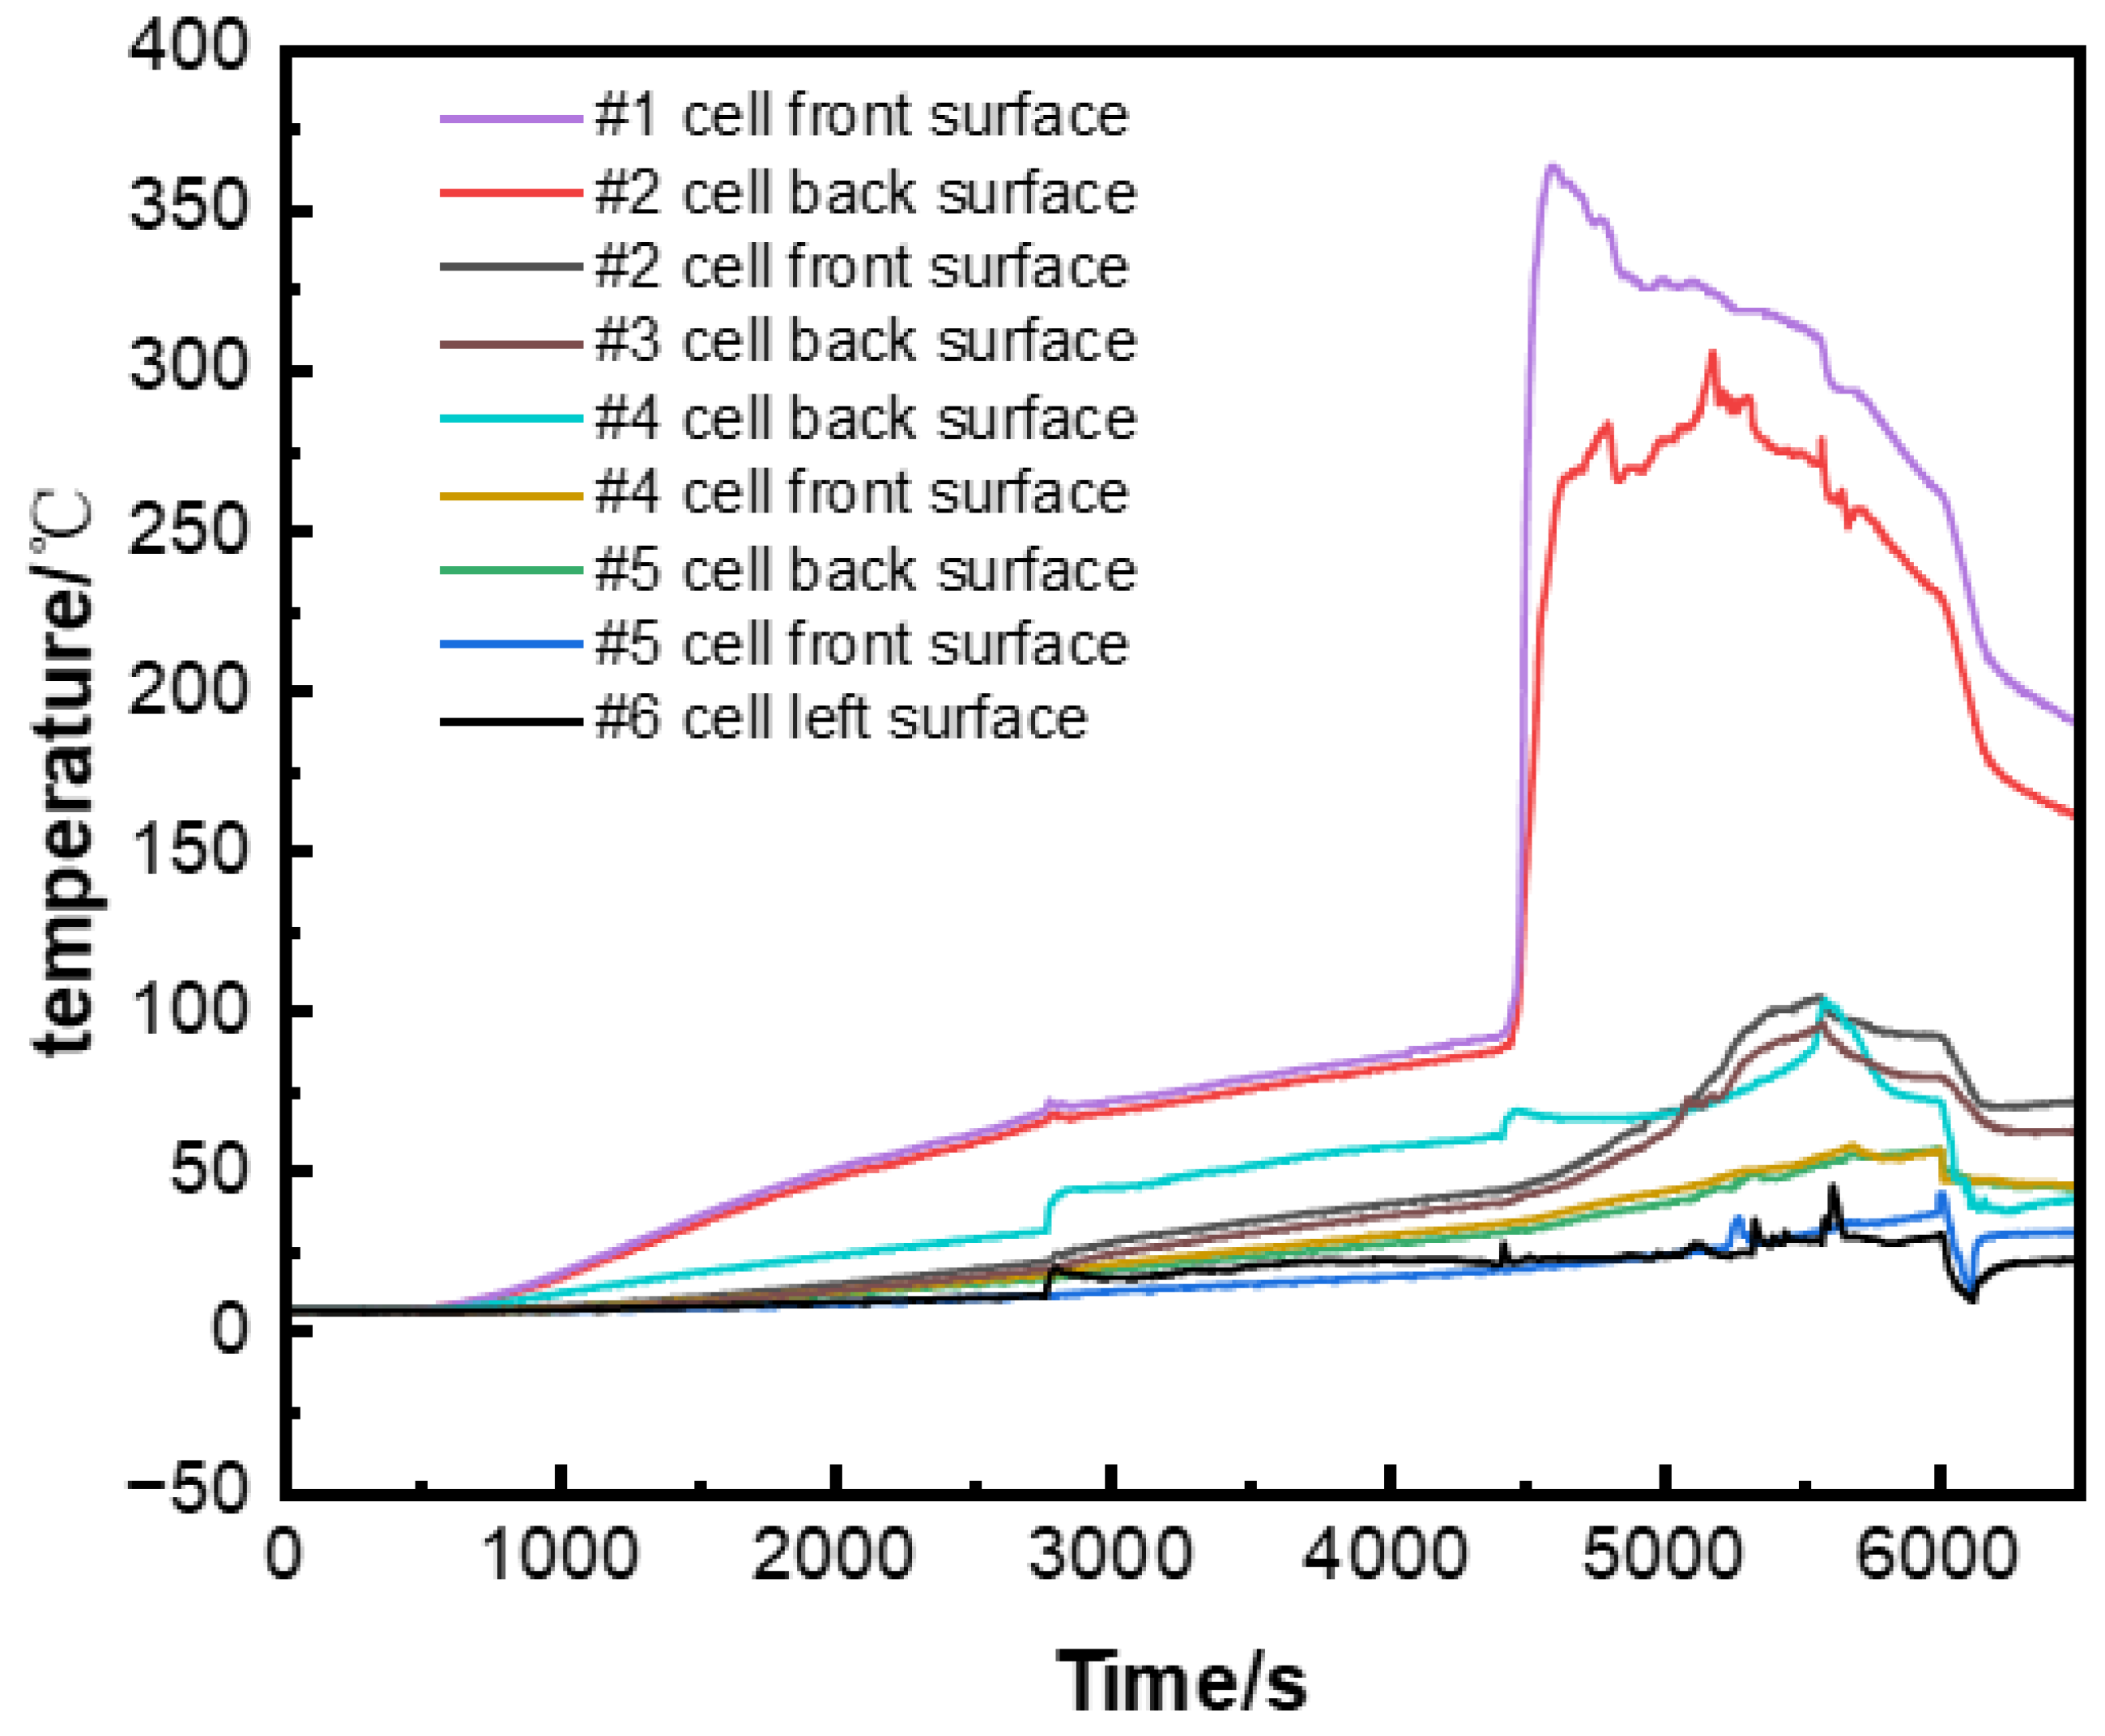
3.1. Temperature and Voltage Changes in the Runaway Cell and Temperature Analysis of Surrounding Cells

Figure 2 shows the voltage and front surface temperature curves of cell #1 over time. After baseline data collection, the heating plate was activated at 316 s. The cell surface temperature rose steadily, while the voltage remained stable at 3.3 V. At 4385 s, the voltage dropped sharply, reaching 0 V within 112 s, indicating a full internal short circuit (tISC = 4385 s). The thermal runaway trigger time (tTR = 4422 s, TTR = 94.6 °C) was defined as the moment when the temperature rise rate exceeded 60 °C/min (1 °C/s). After thermal runaway, the surface temperature rose rapidly from 94.6 °C, peaking at 364.0 °C at 4579 s (Tmax = 364 °C).
Figure 3 shows the temperature curves of the runaway cell and surrounding cells. Due to heat conduction, the rear temperature of cell #2 followed a similar trend to the front temperature of the runaway cell, but its peak temperature was 58 °C lower. The front surface of cell #2 reached a maximum temperature of 105 °C, while cells #3, #4, and #5 showed lower peak temperatures. Throughout the experiment, the voltages of the surrounding cells showed no significant changes.
In summary, the thermal runaway trigger time was 37 s later than the voltage drop time. Although the surface temperatures of cells #2, #3, and #4 exceeded the thermal runaway trigger temperature (94.6 °C), thermal runaway did not occur because the internal temperature distribution was uneven [19,20,21]. The heat released by cell #1 caused surface temperature increases in cells #2 and #4, but their internal temperatures remained too low to trigger thermal runaway.

3.2. CO and VOC Concentration Analysis Inside the Pack and at Different Positions in the Cabin

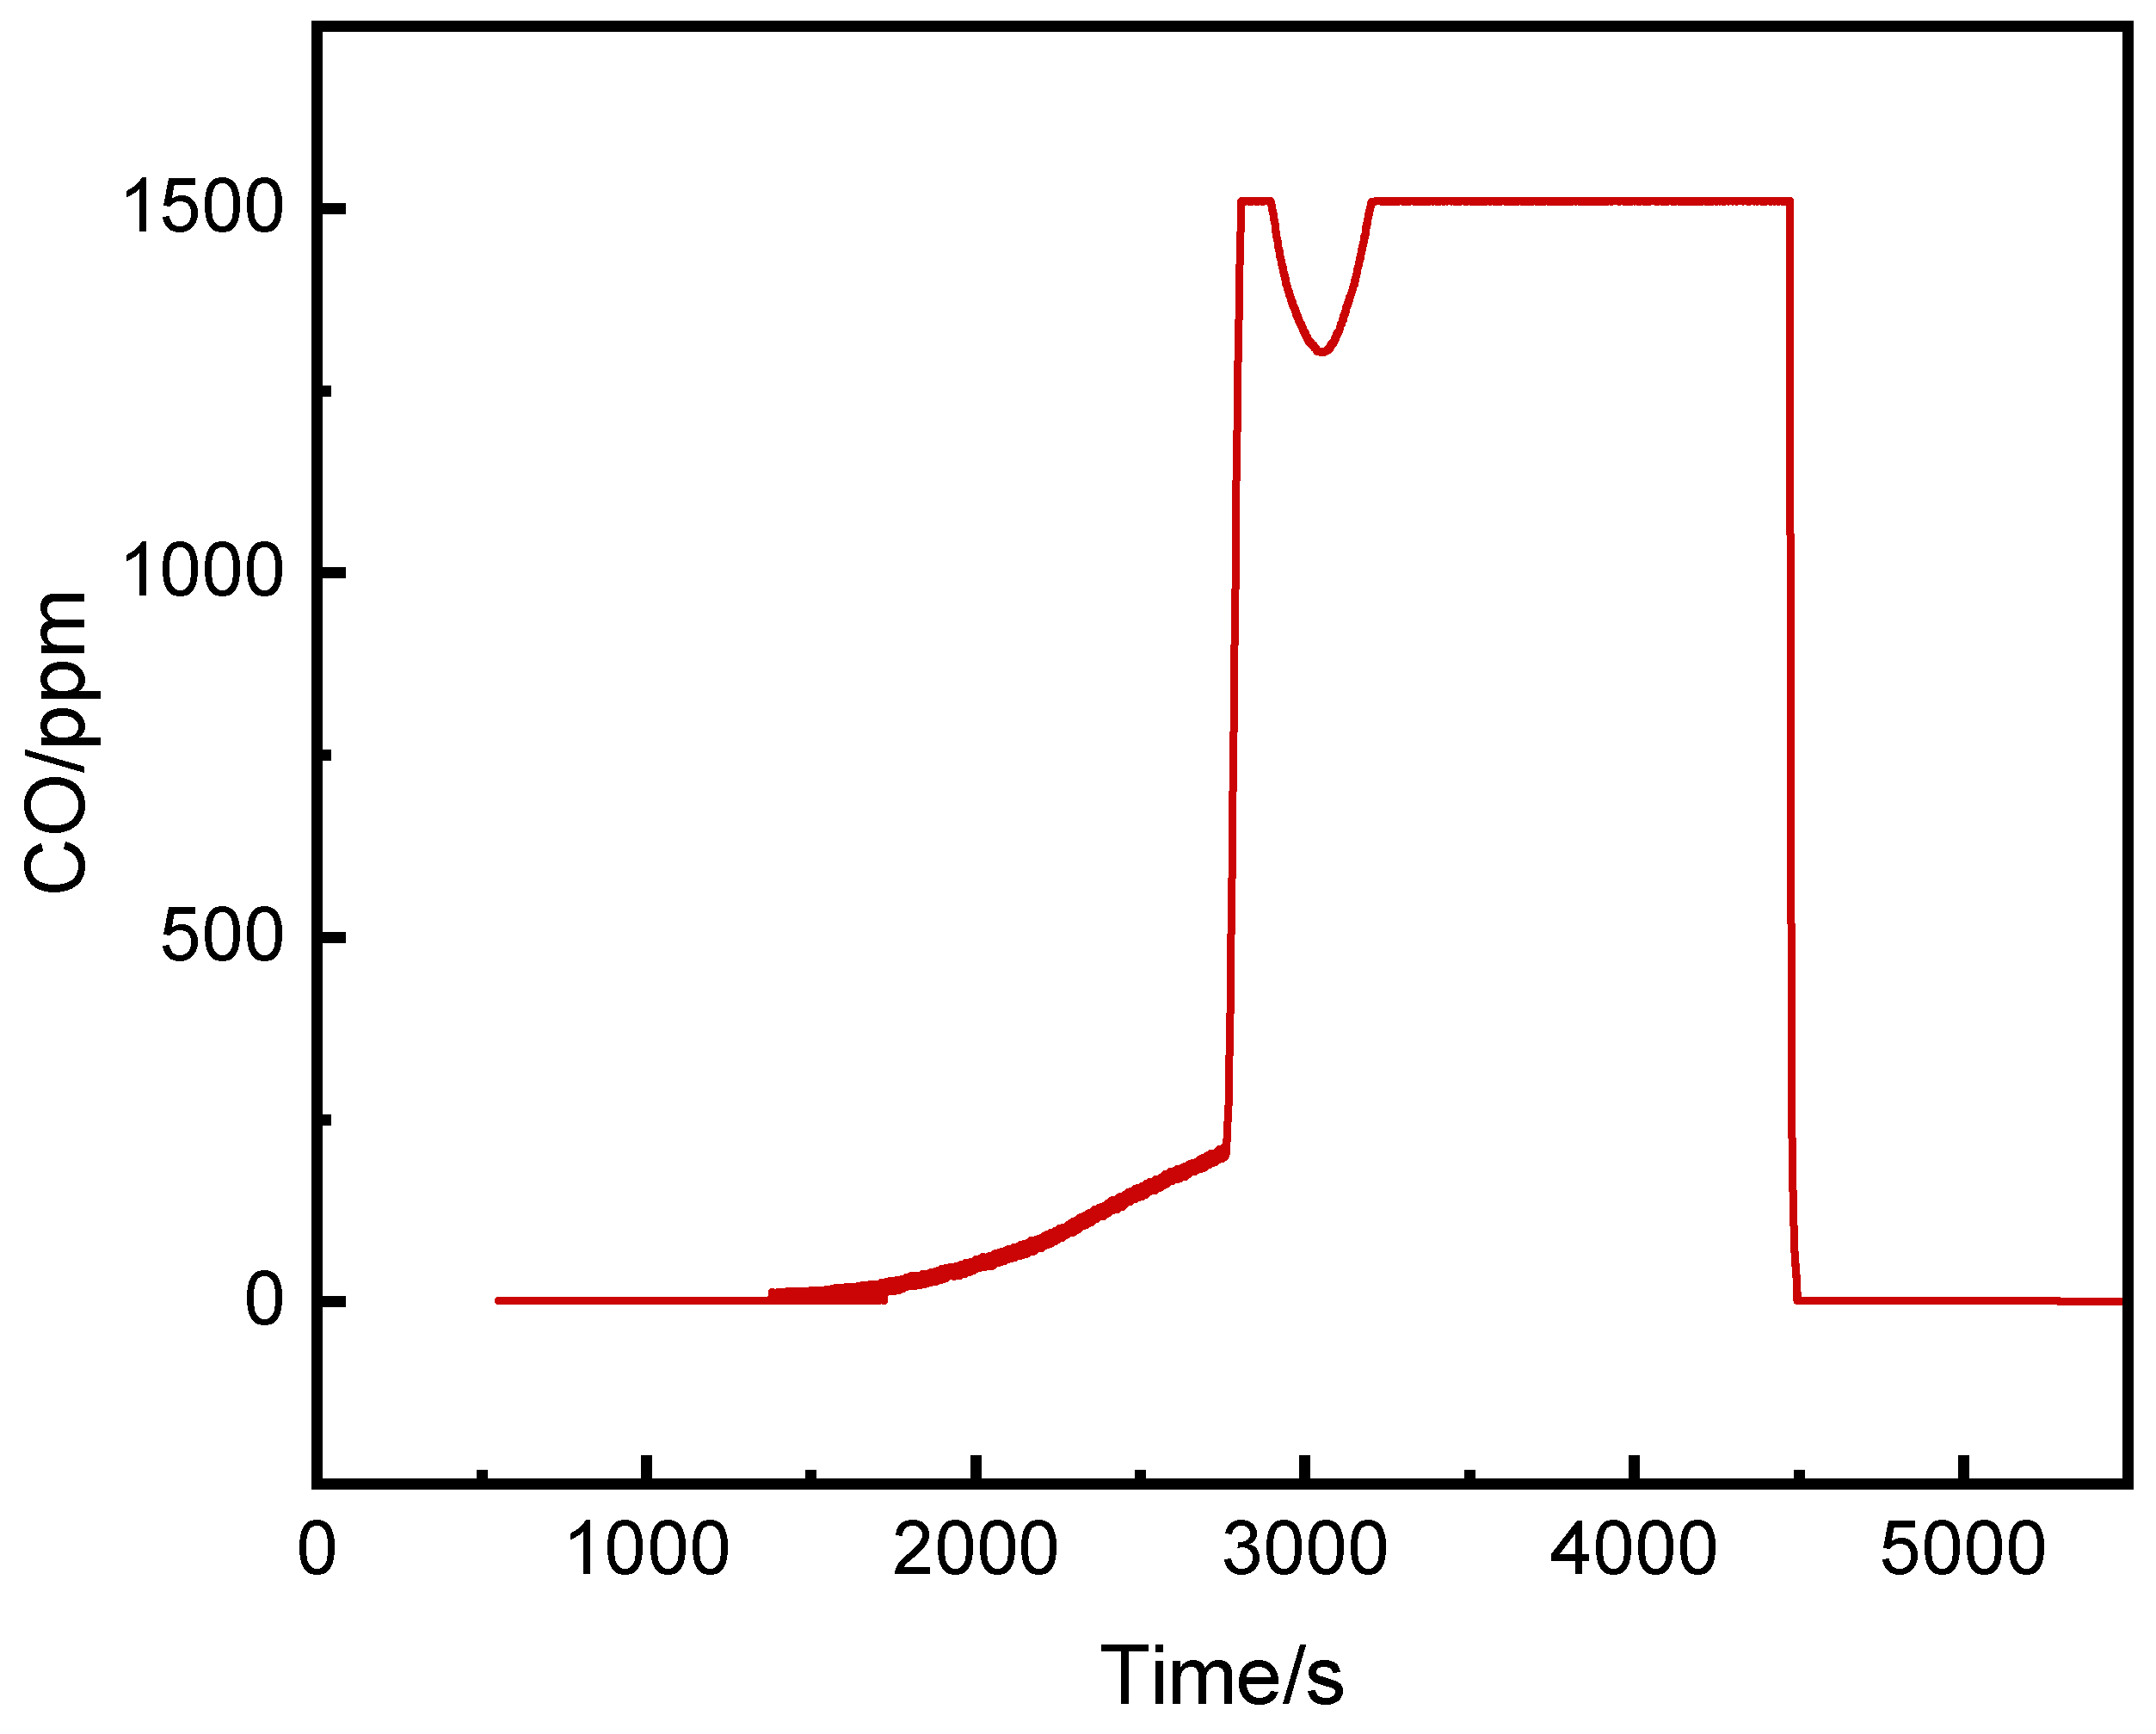
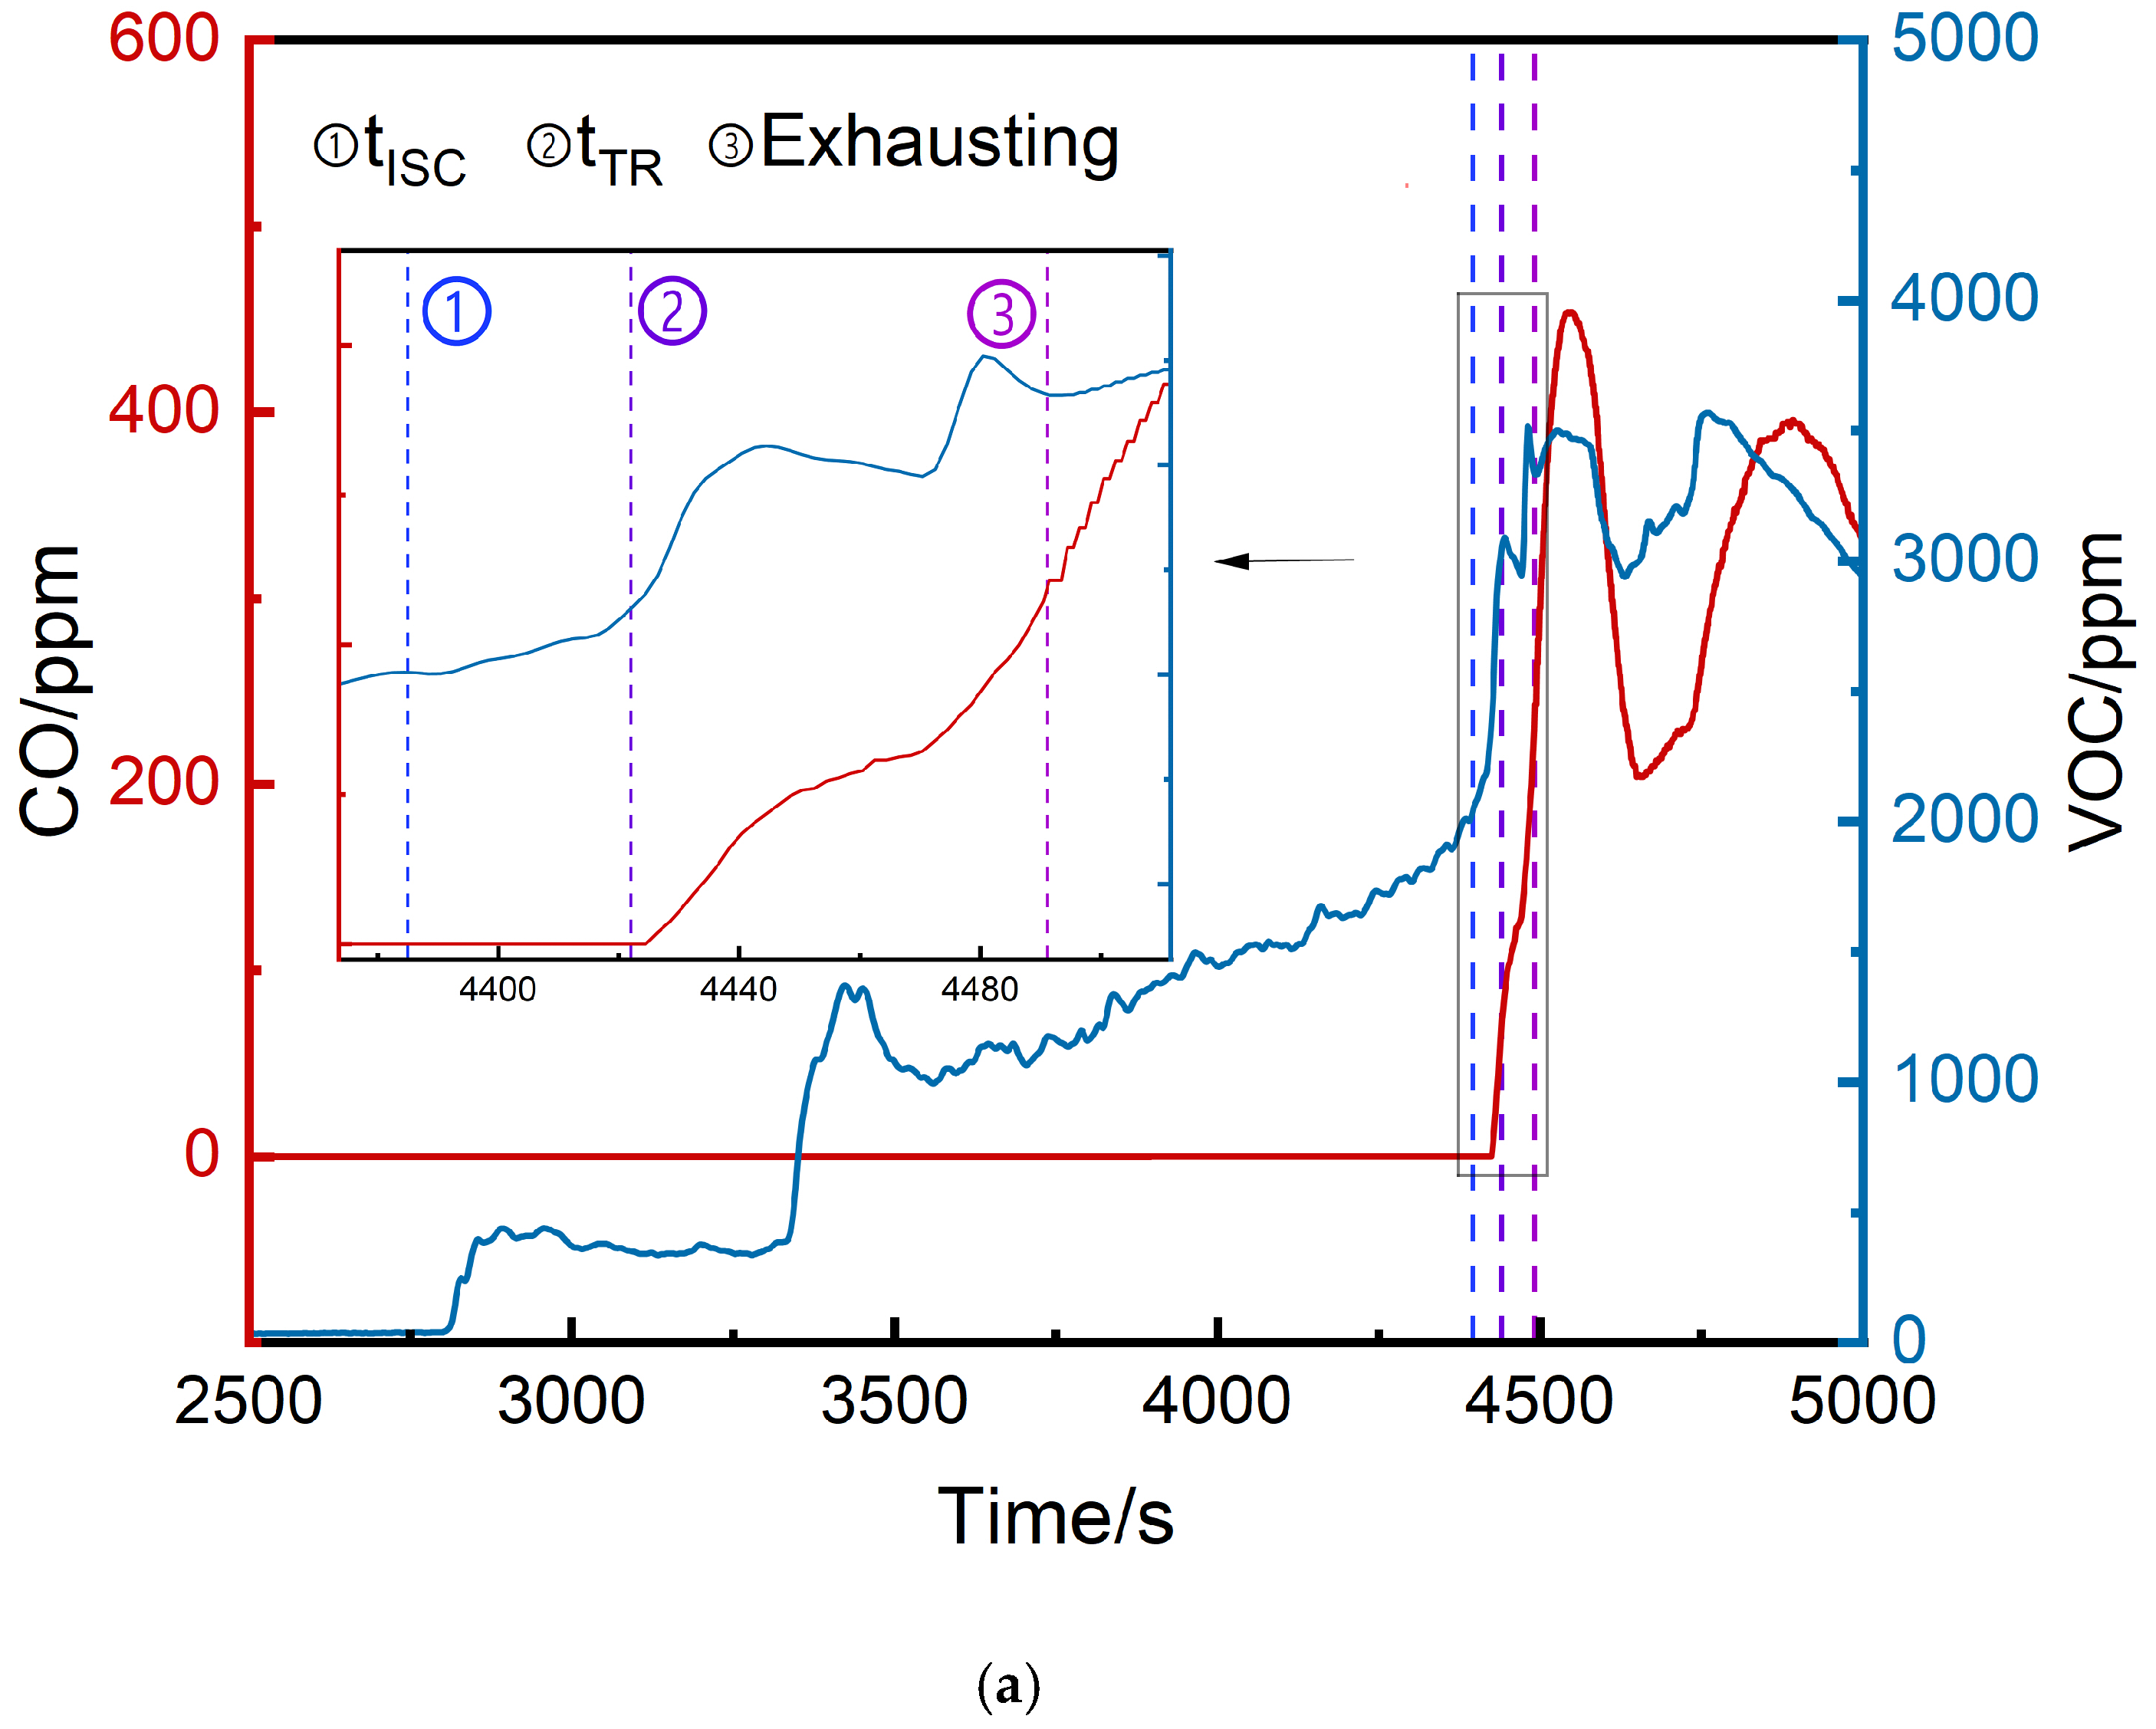
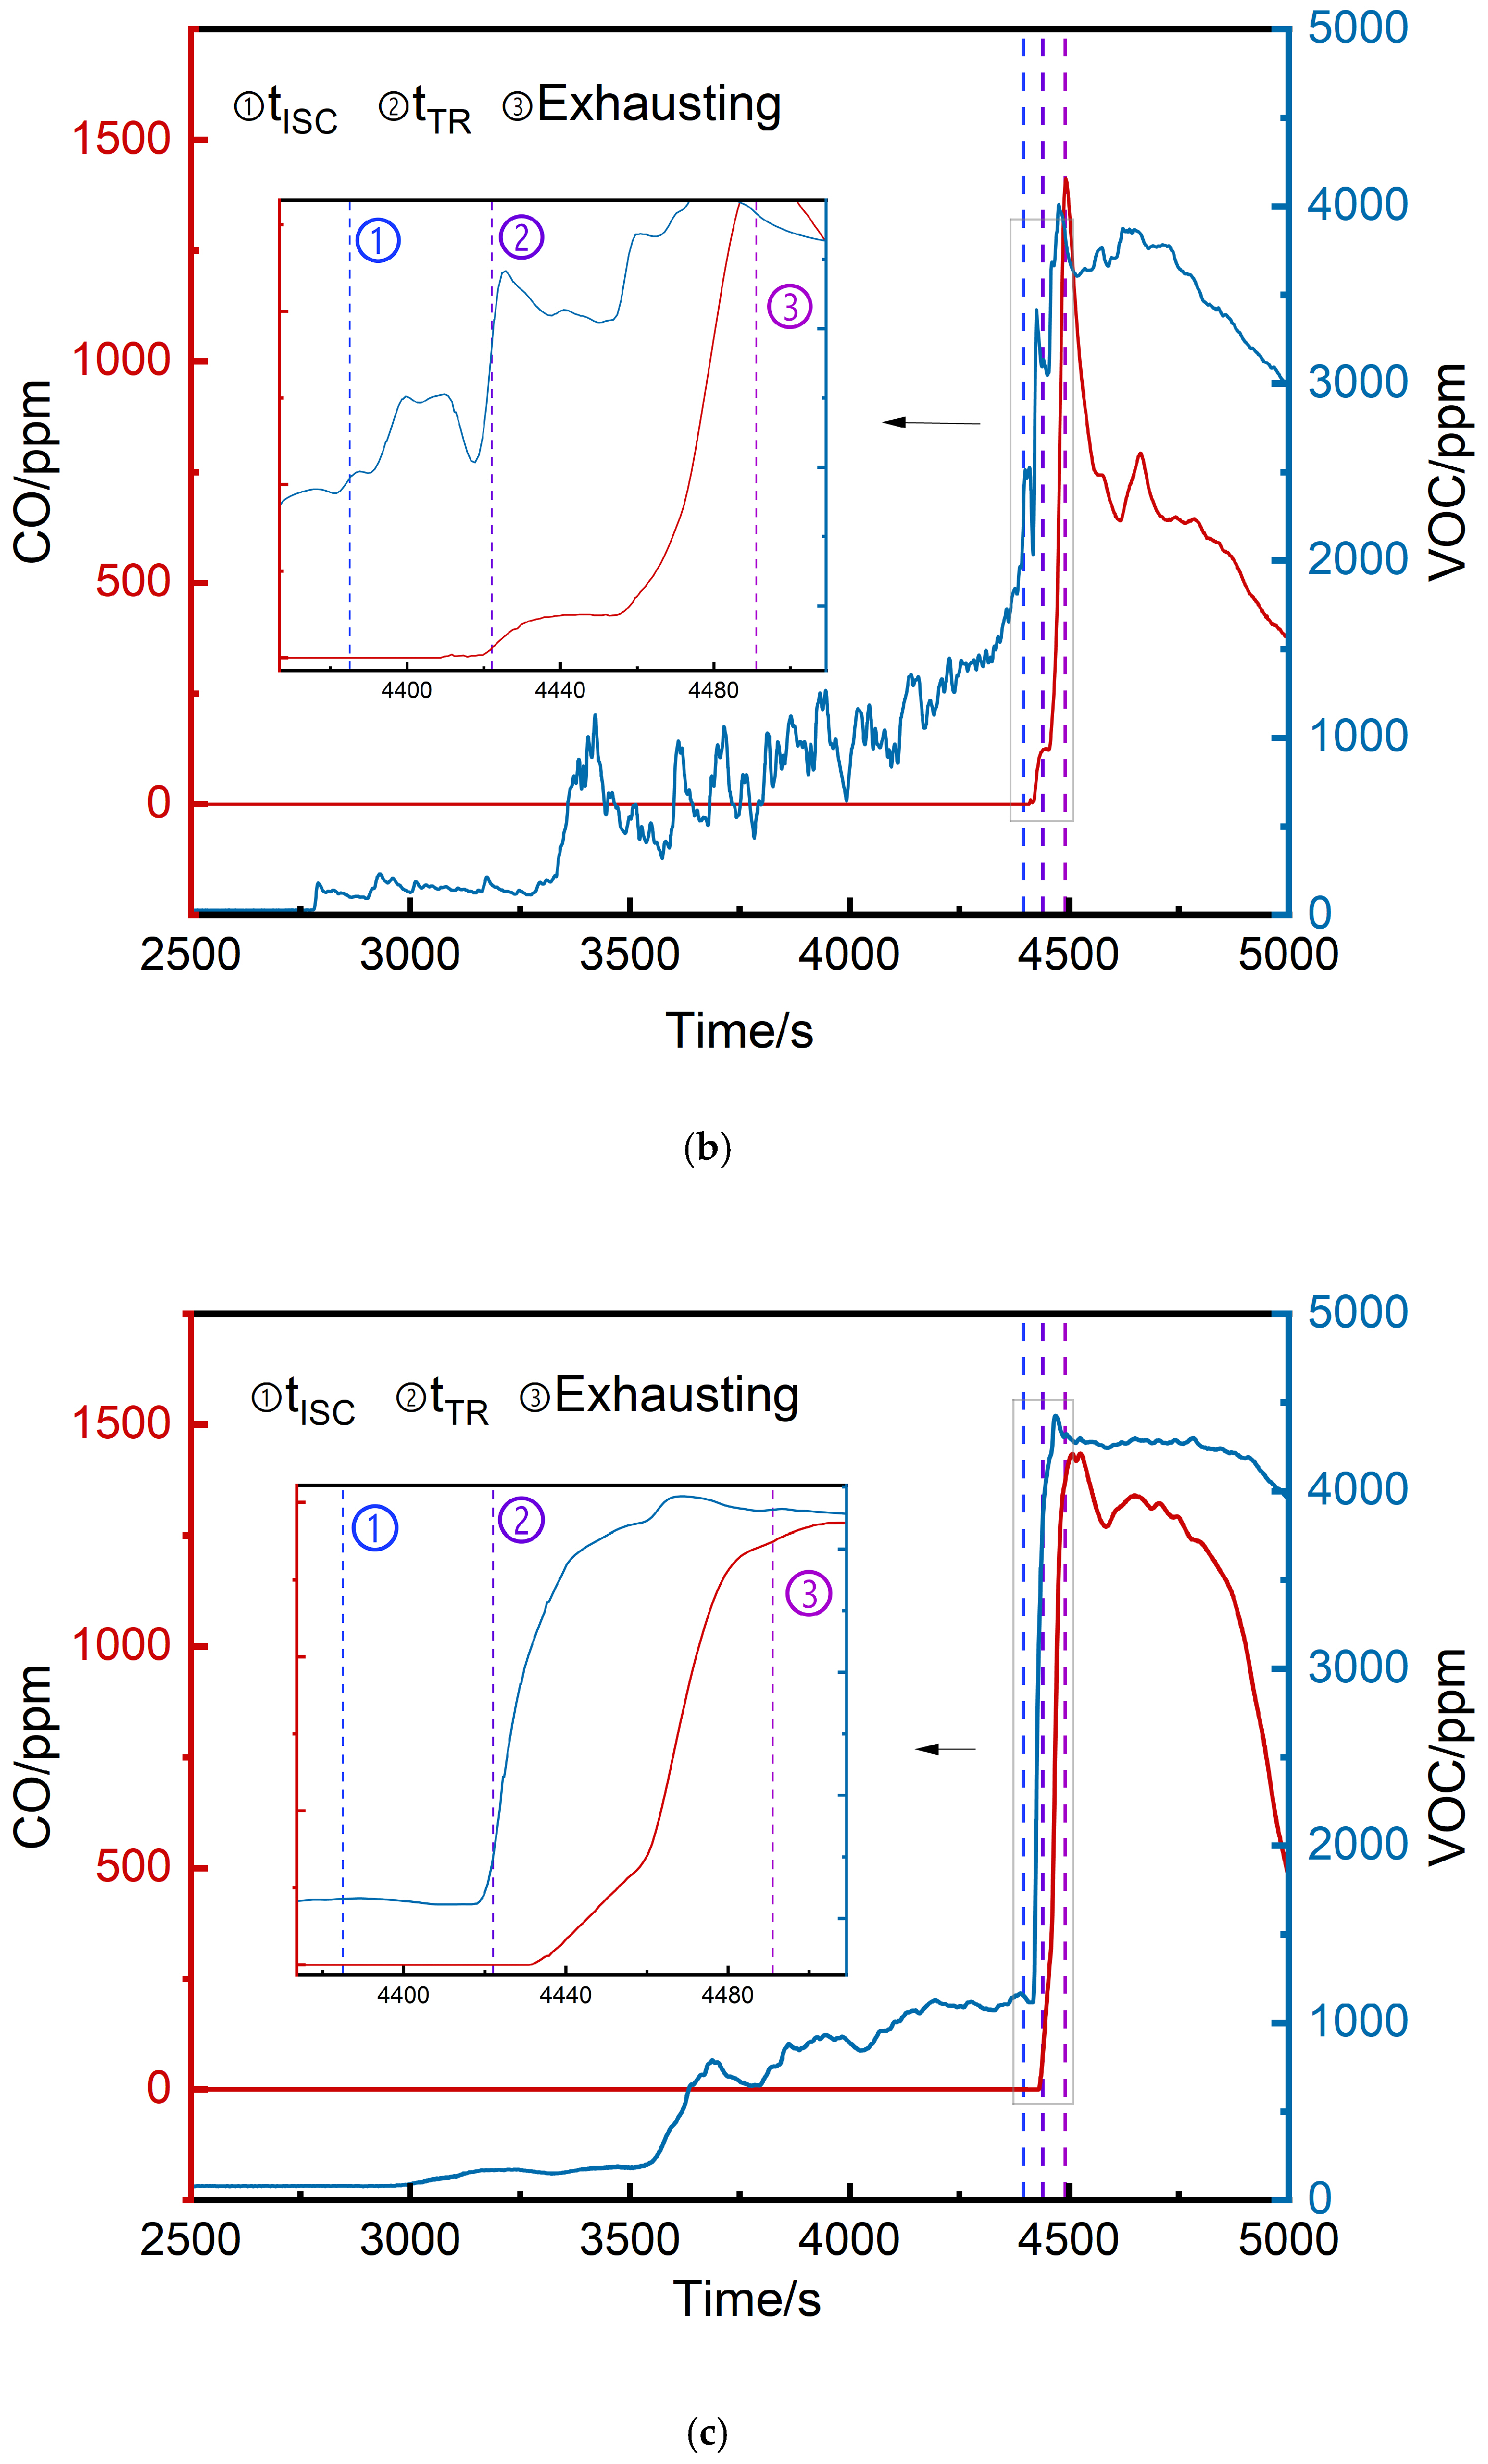
3.2.1. CO Concentration Analysis

(1)
CO Concentration Inside the Pack
Figure 4 shows the CO concentration curve inside the pack. Studies [22,23] indicate that before full thermal runaway, continuous gas release and venting occur. In this experiment, trace CO was first detected at 1382 s when the surface temperature of the runaway cell was only 32.7 °C, while the heating plate had reached 296 °C. The CO concentration rose slowly until 2780 s, when it surged at over 40 ppm/s, exceeding the detector’s range. This corresponded to a small peak in the temperature–time curve (Figure 3), suggesting vent opening, which occurred 1642 s before thermal runaway.
(2)
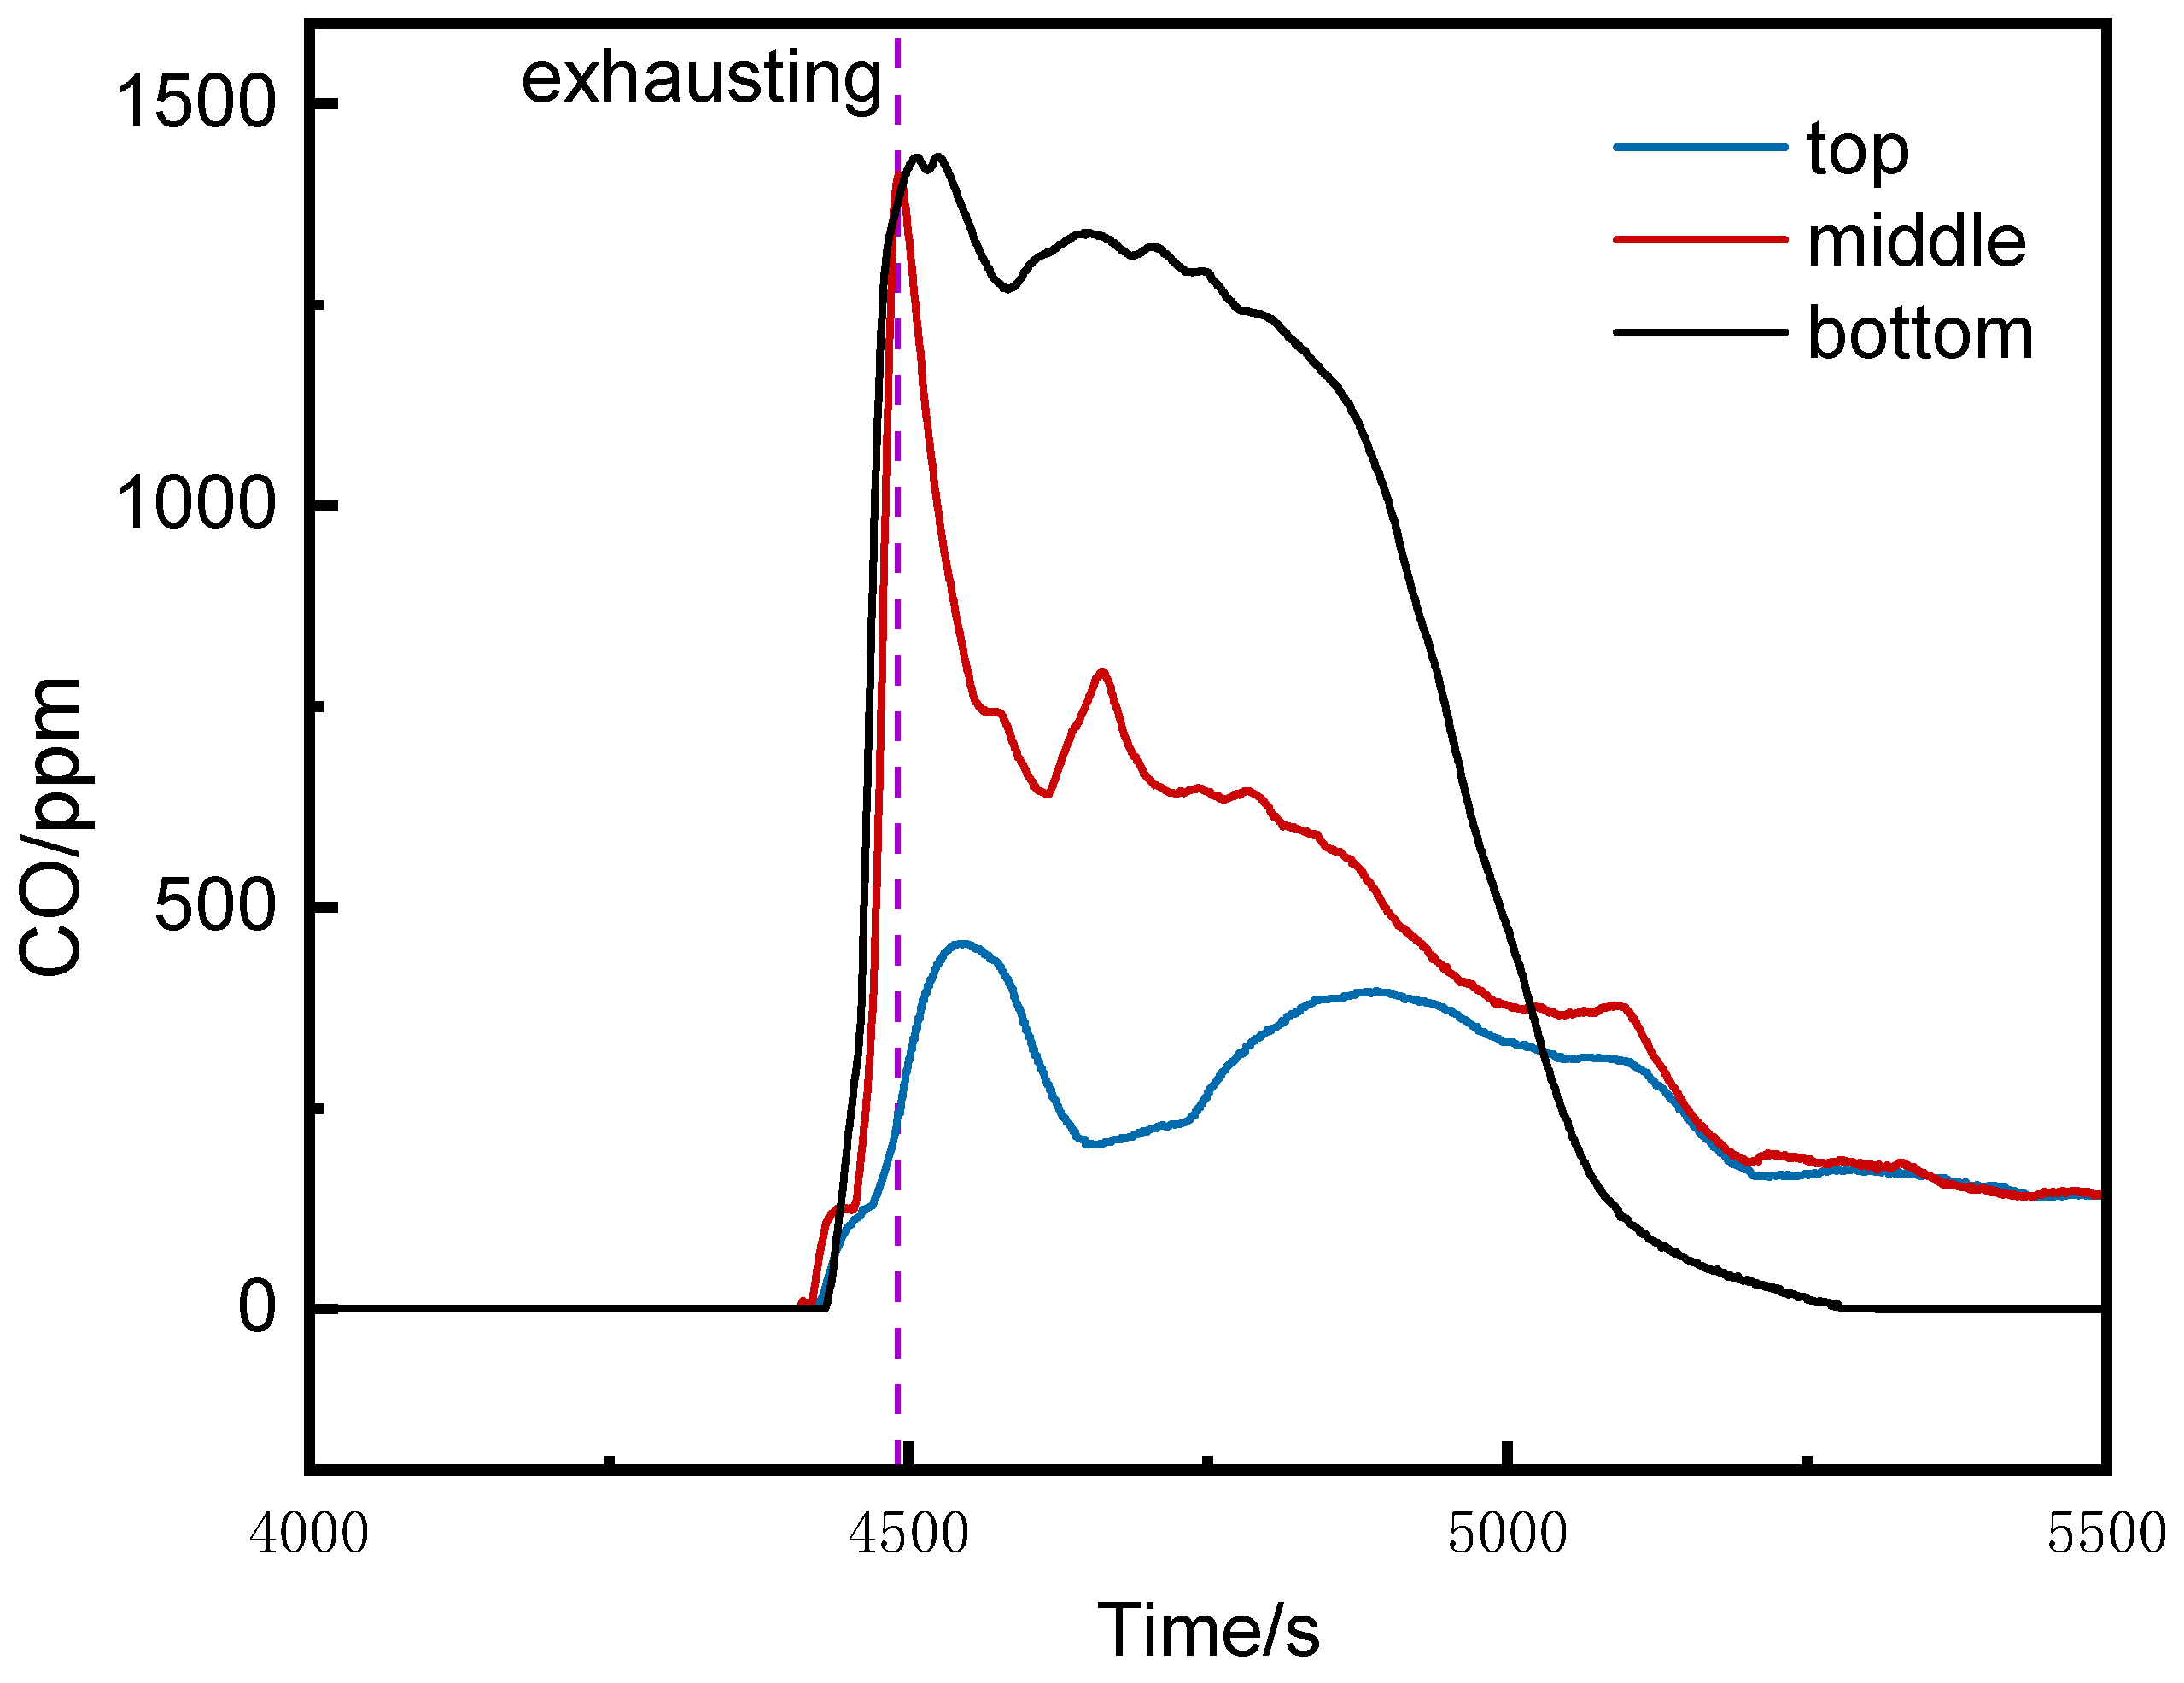
CO Concentration at Different Positions in the Runaway Cluster
Figure 5 shows the CO concentration curves at the bottom, middle, and top of the runaway cluster. After thermal runaway, the CO concentrations at the bottom and middle rose rapidly, reaching alarm thresholds at 4452 s and 4464 s, respectively. The top detector triggered the alarm at 4491 s, activating ventilation. The peak CO concentrations at the middle and bottom were 1413 ppm and 1434 ppm, respectively, while the top peaked at 454 ppm. The bottom and middle detectors reached the alarm threshold 25 s and 39 s earlier than the top, respectively, and their peak concentrations were over three times higher.
(3)
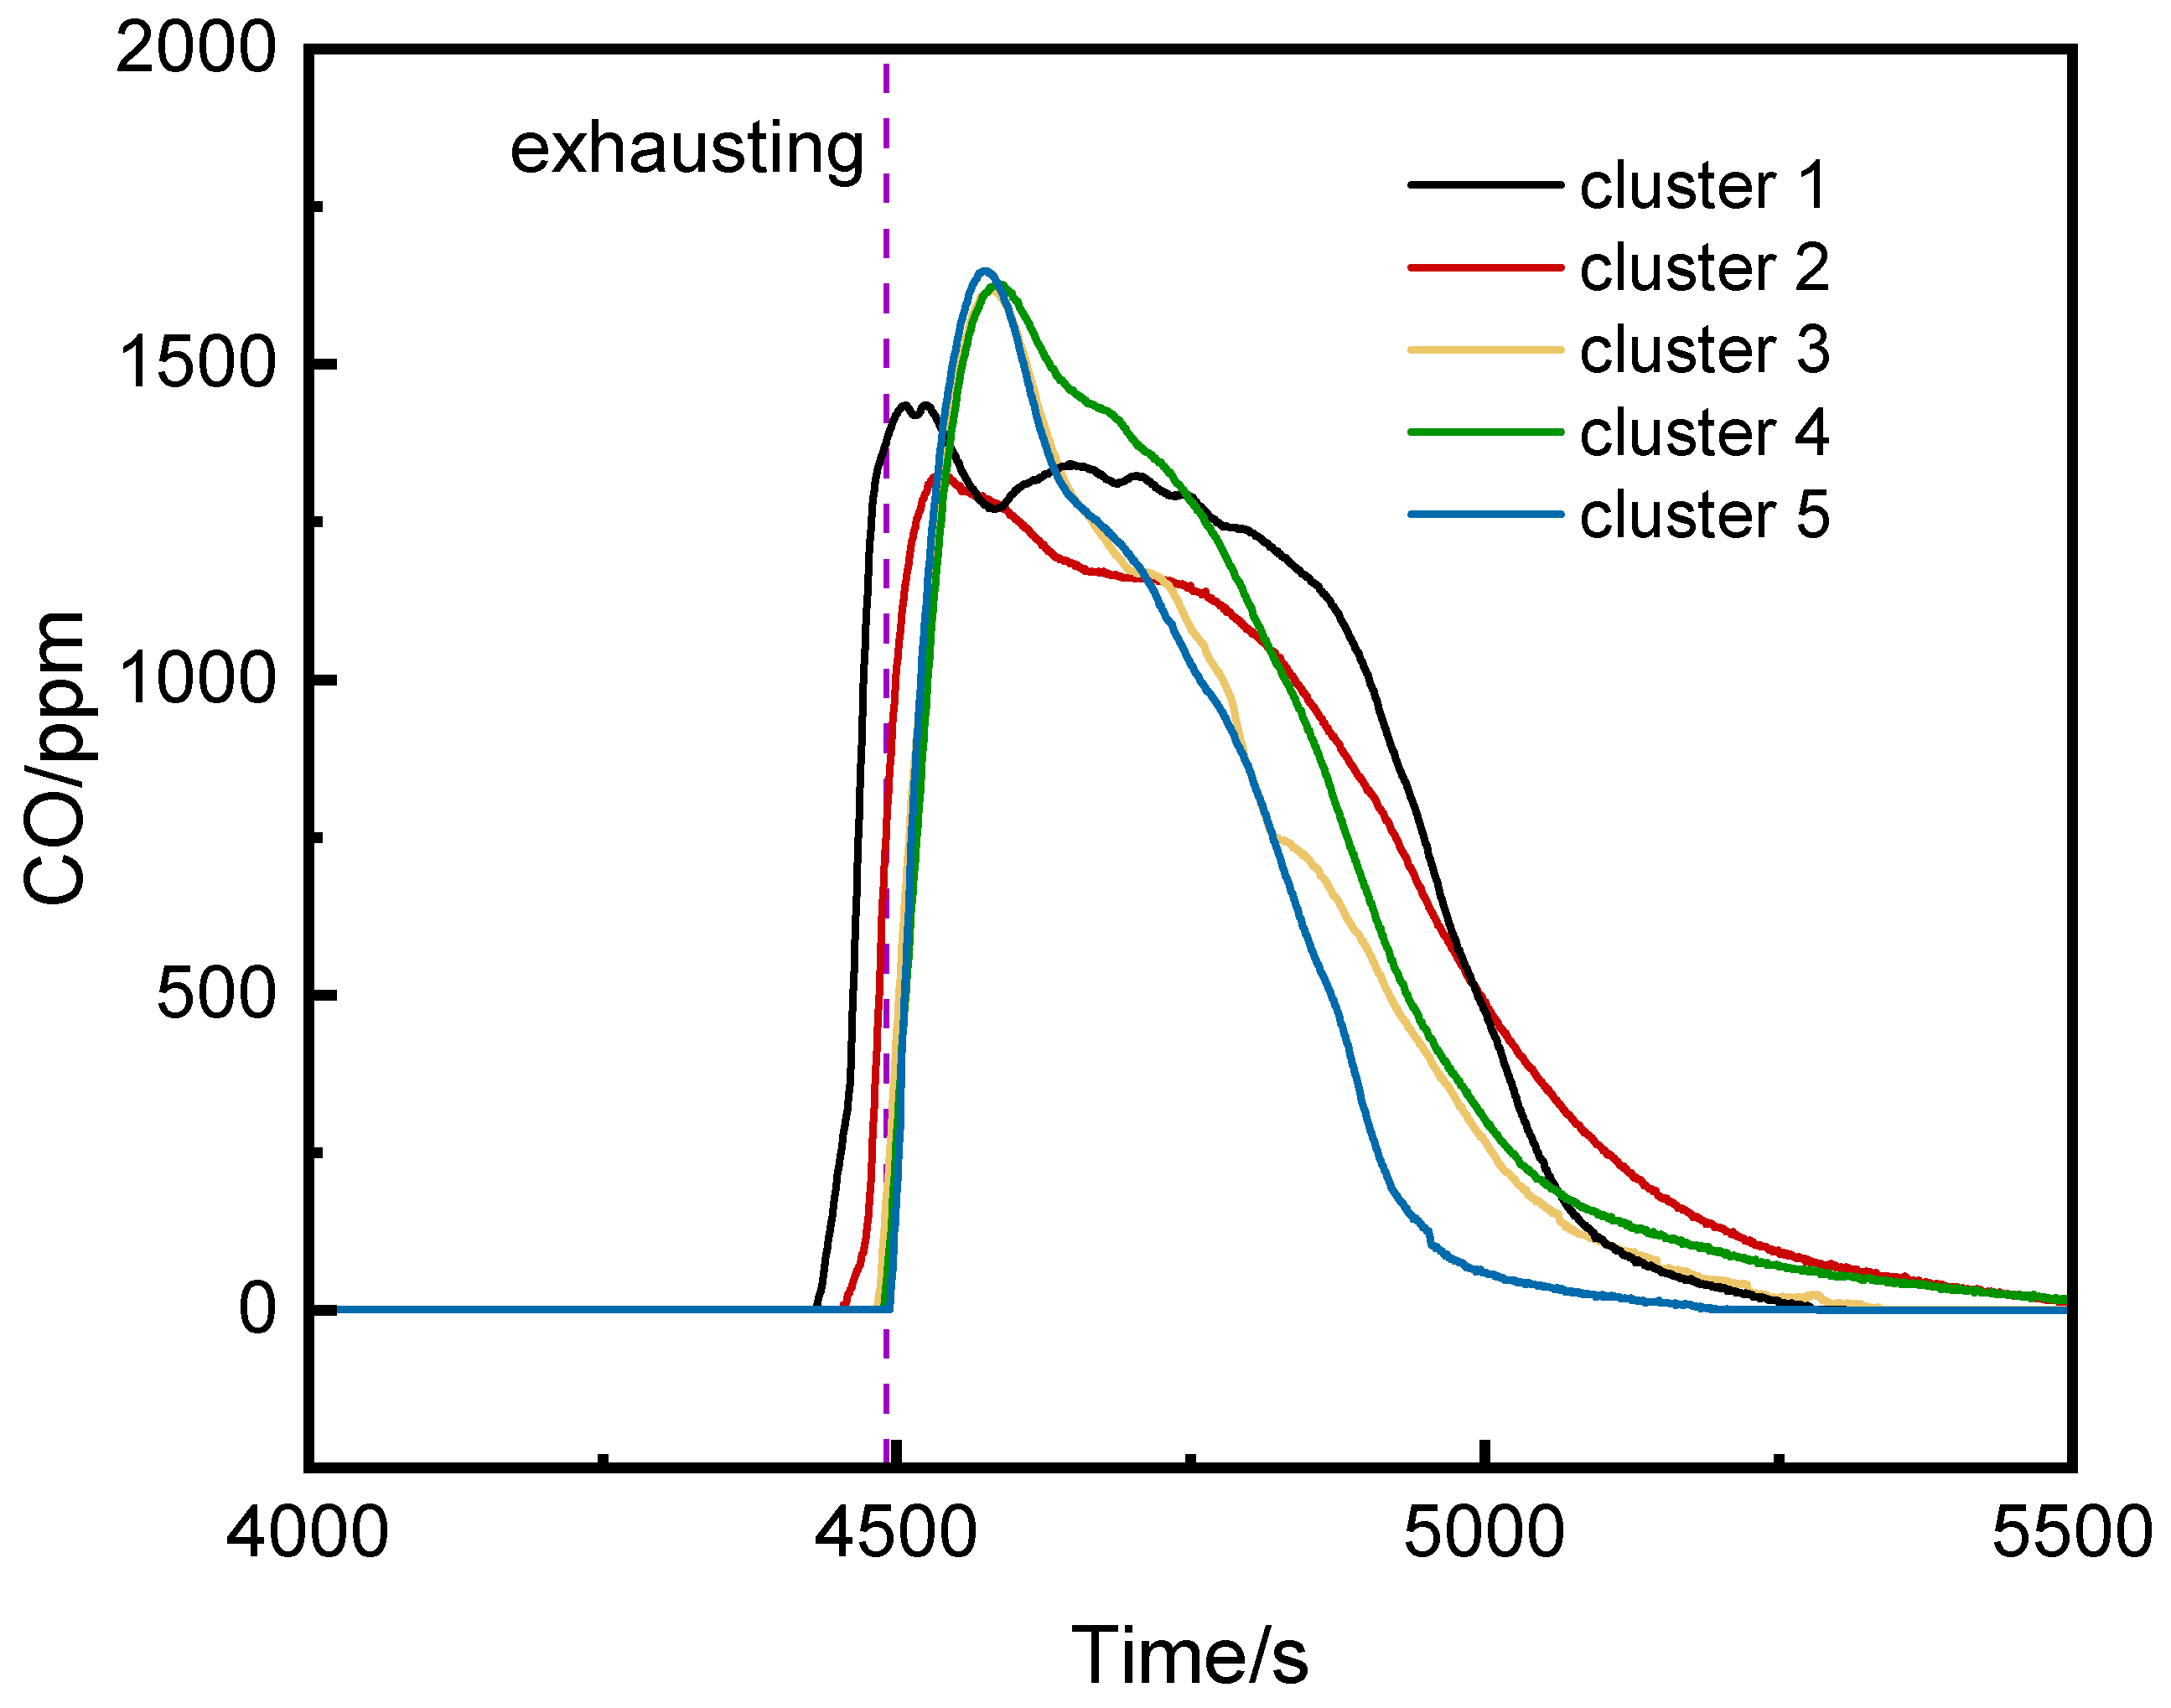
CO Concentration in the Runaway and Left Clusters
Figure 6 shows the CO concentration curves at the bottoms of the runaway cluster and adjacent clusters. After thermal runaway, CO was detected first at the bottom of the runaway cluster and the second cluster, rising rapidly to peak concentrations. Ventilation caused CO concentrations on the left side of the runaway cluster to exceed those in the runaway cluster, potentially affecting fire system judgments.

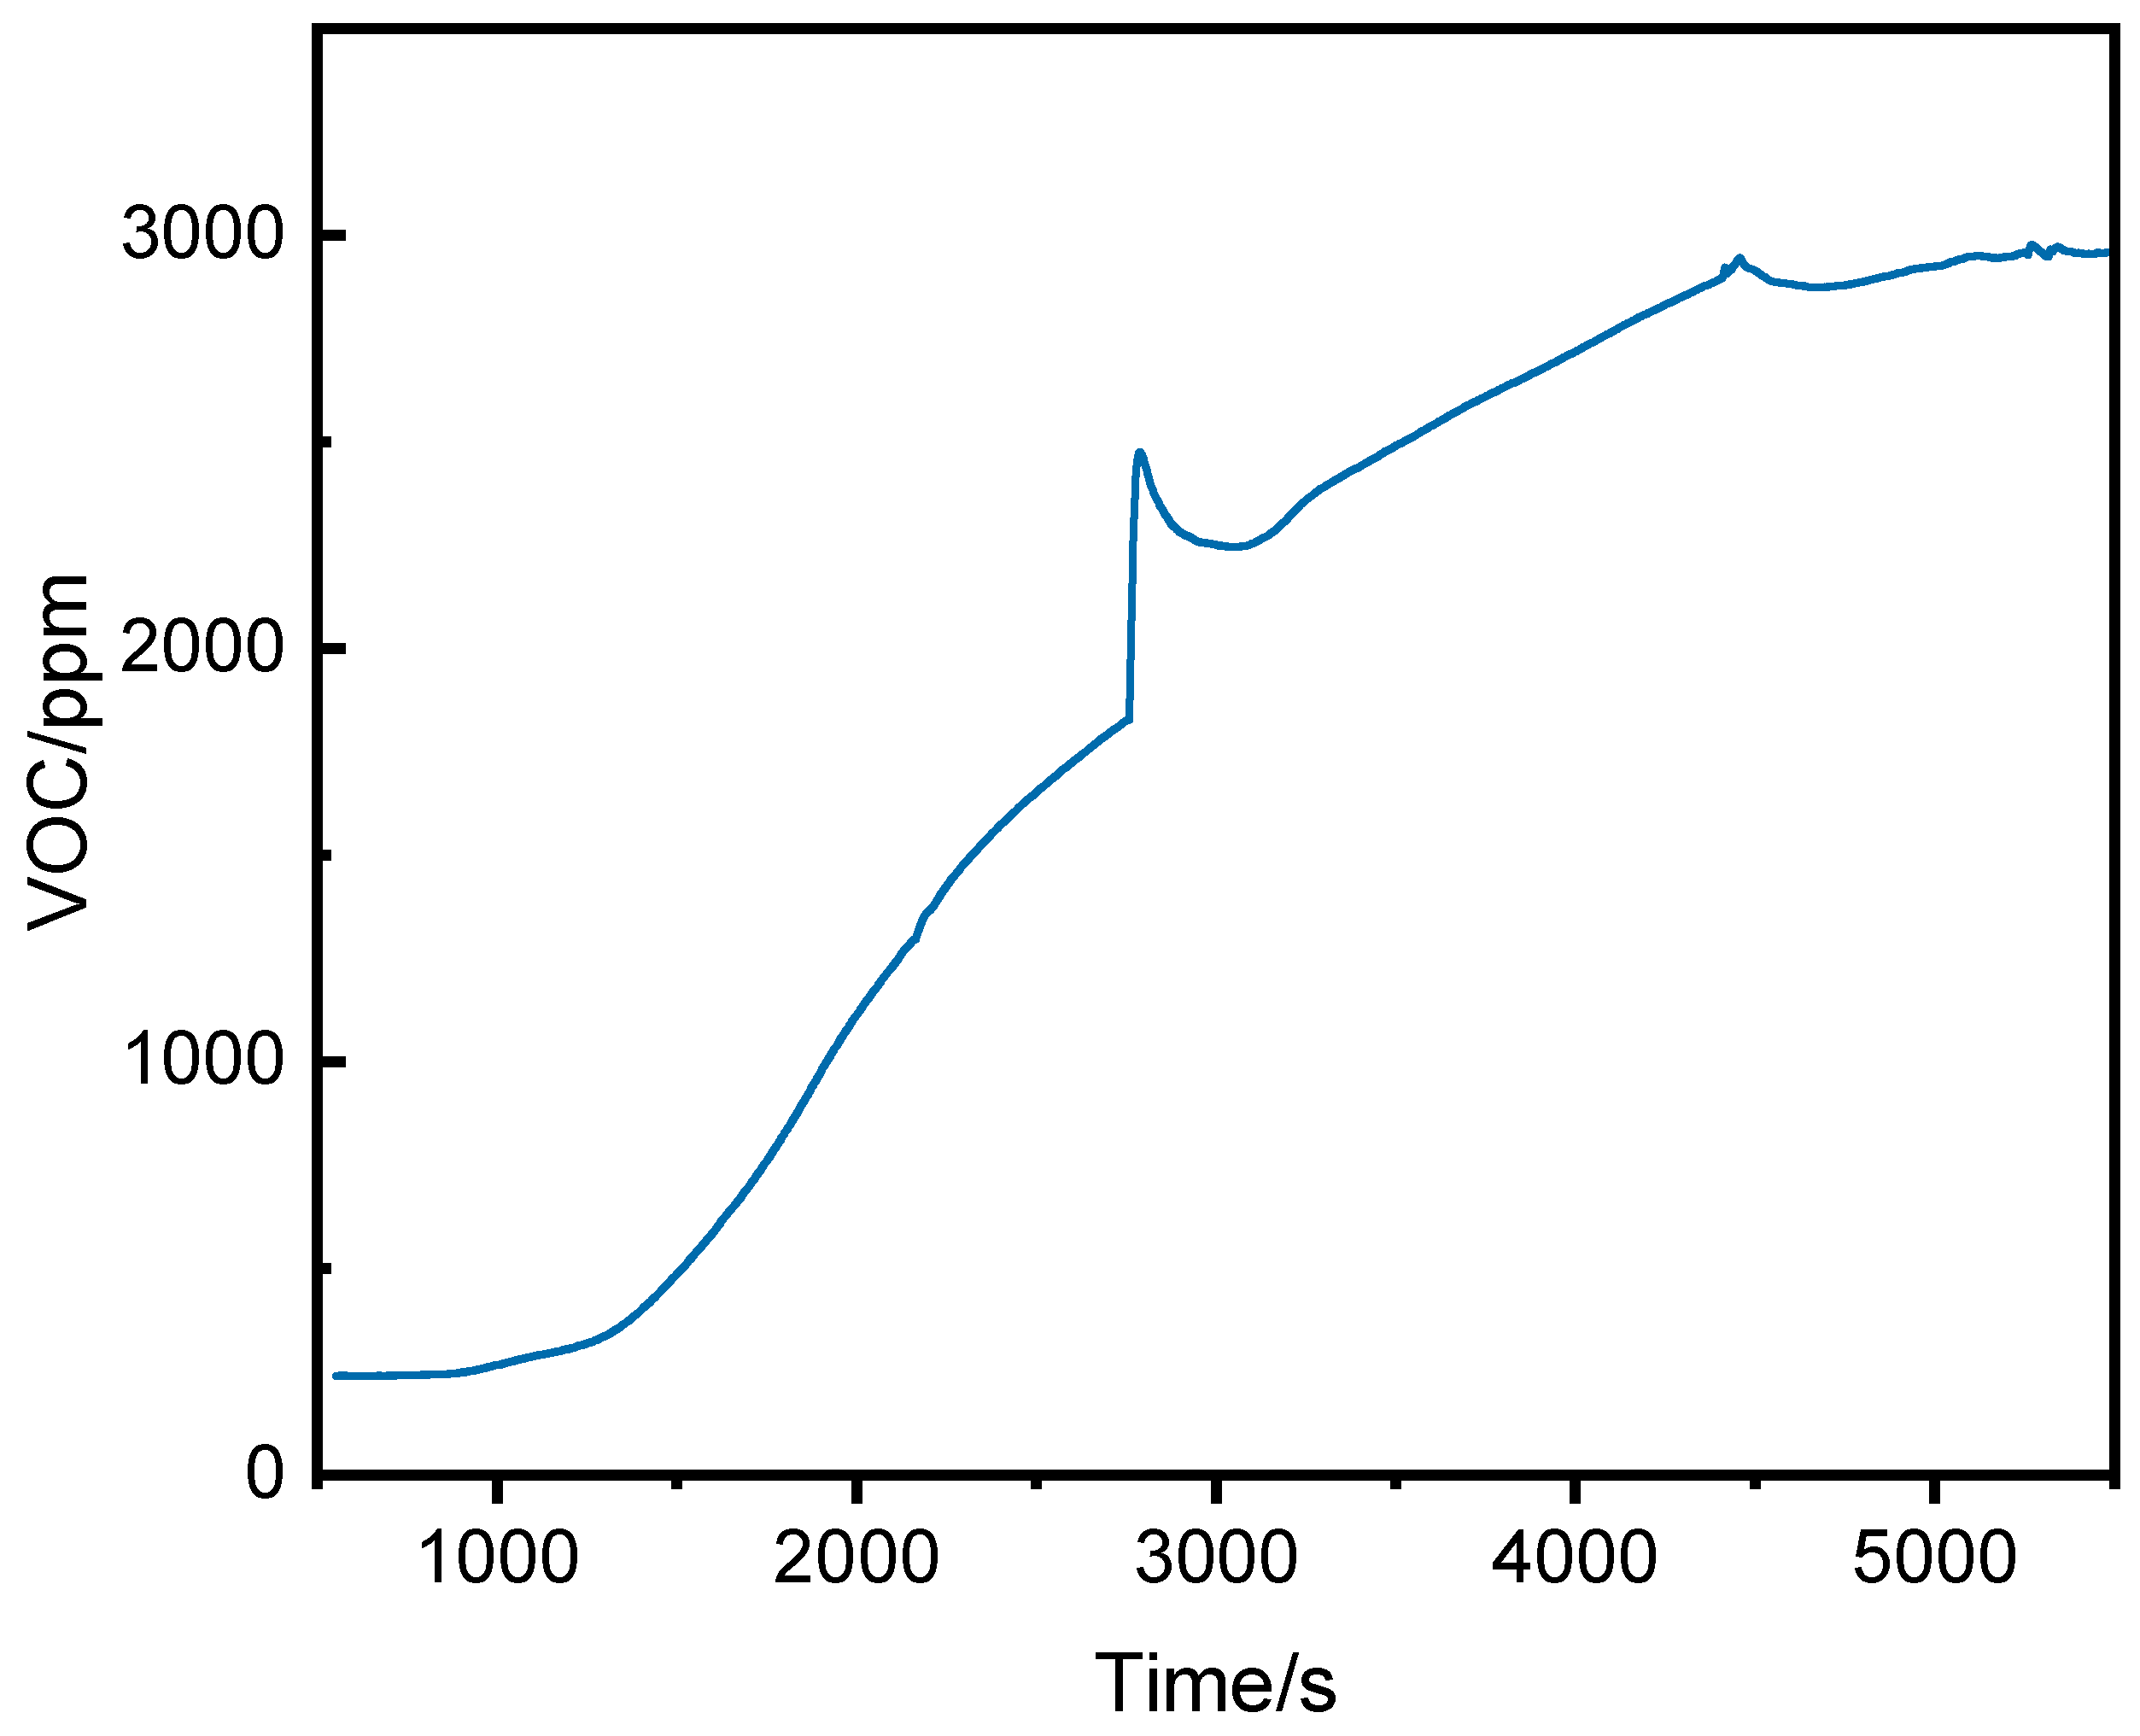
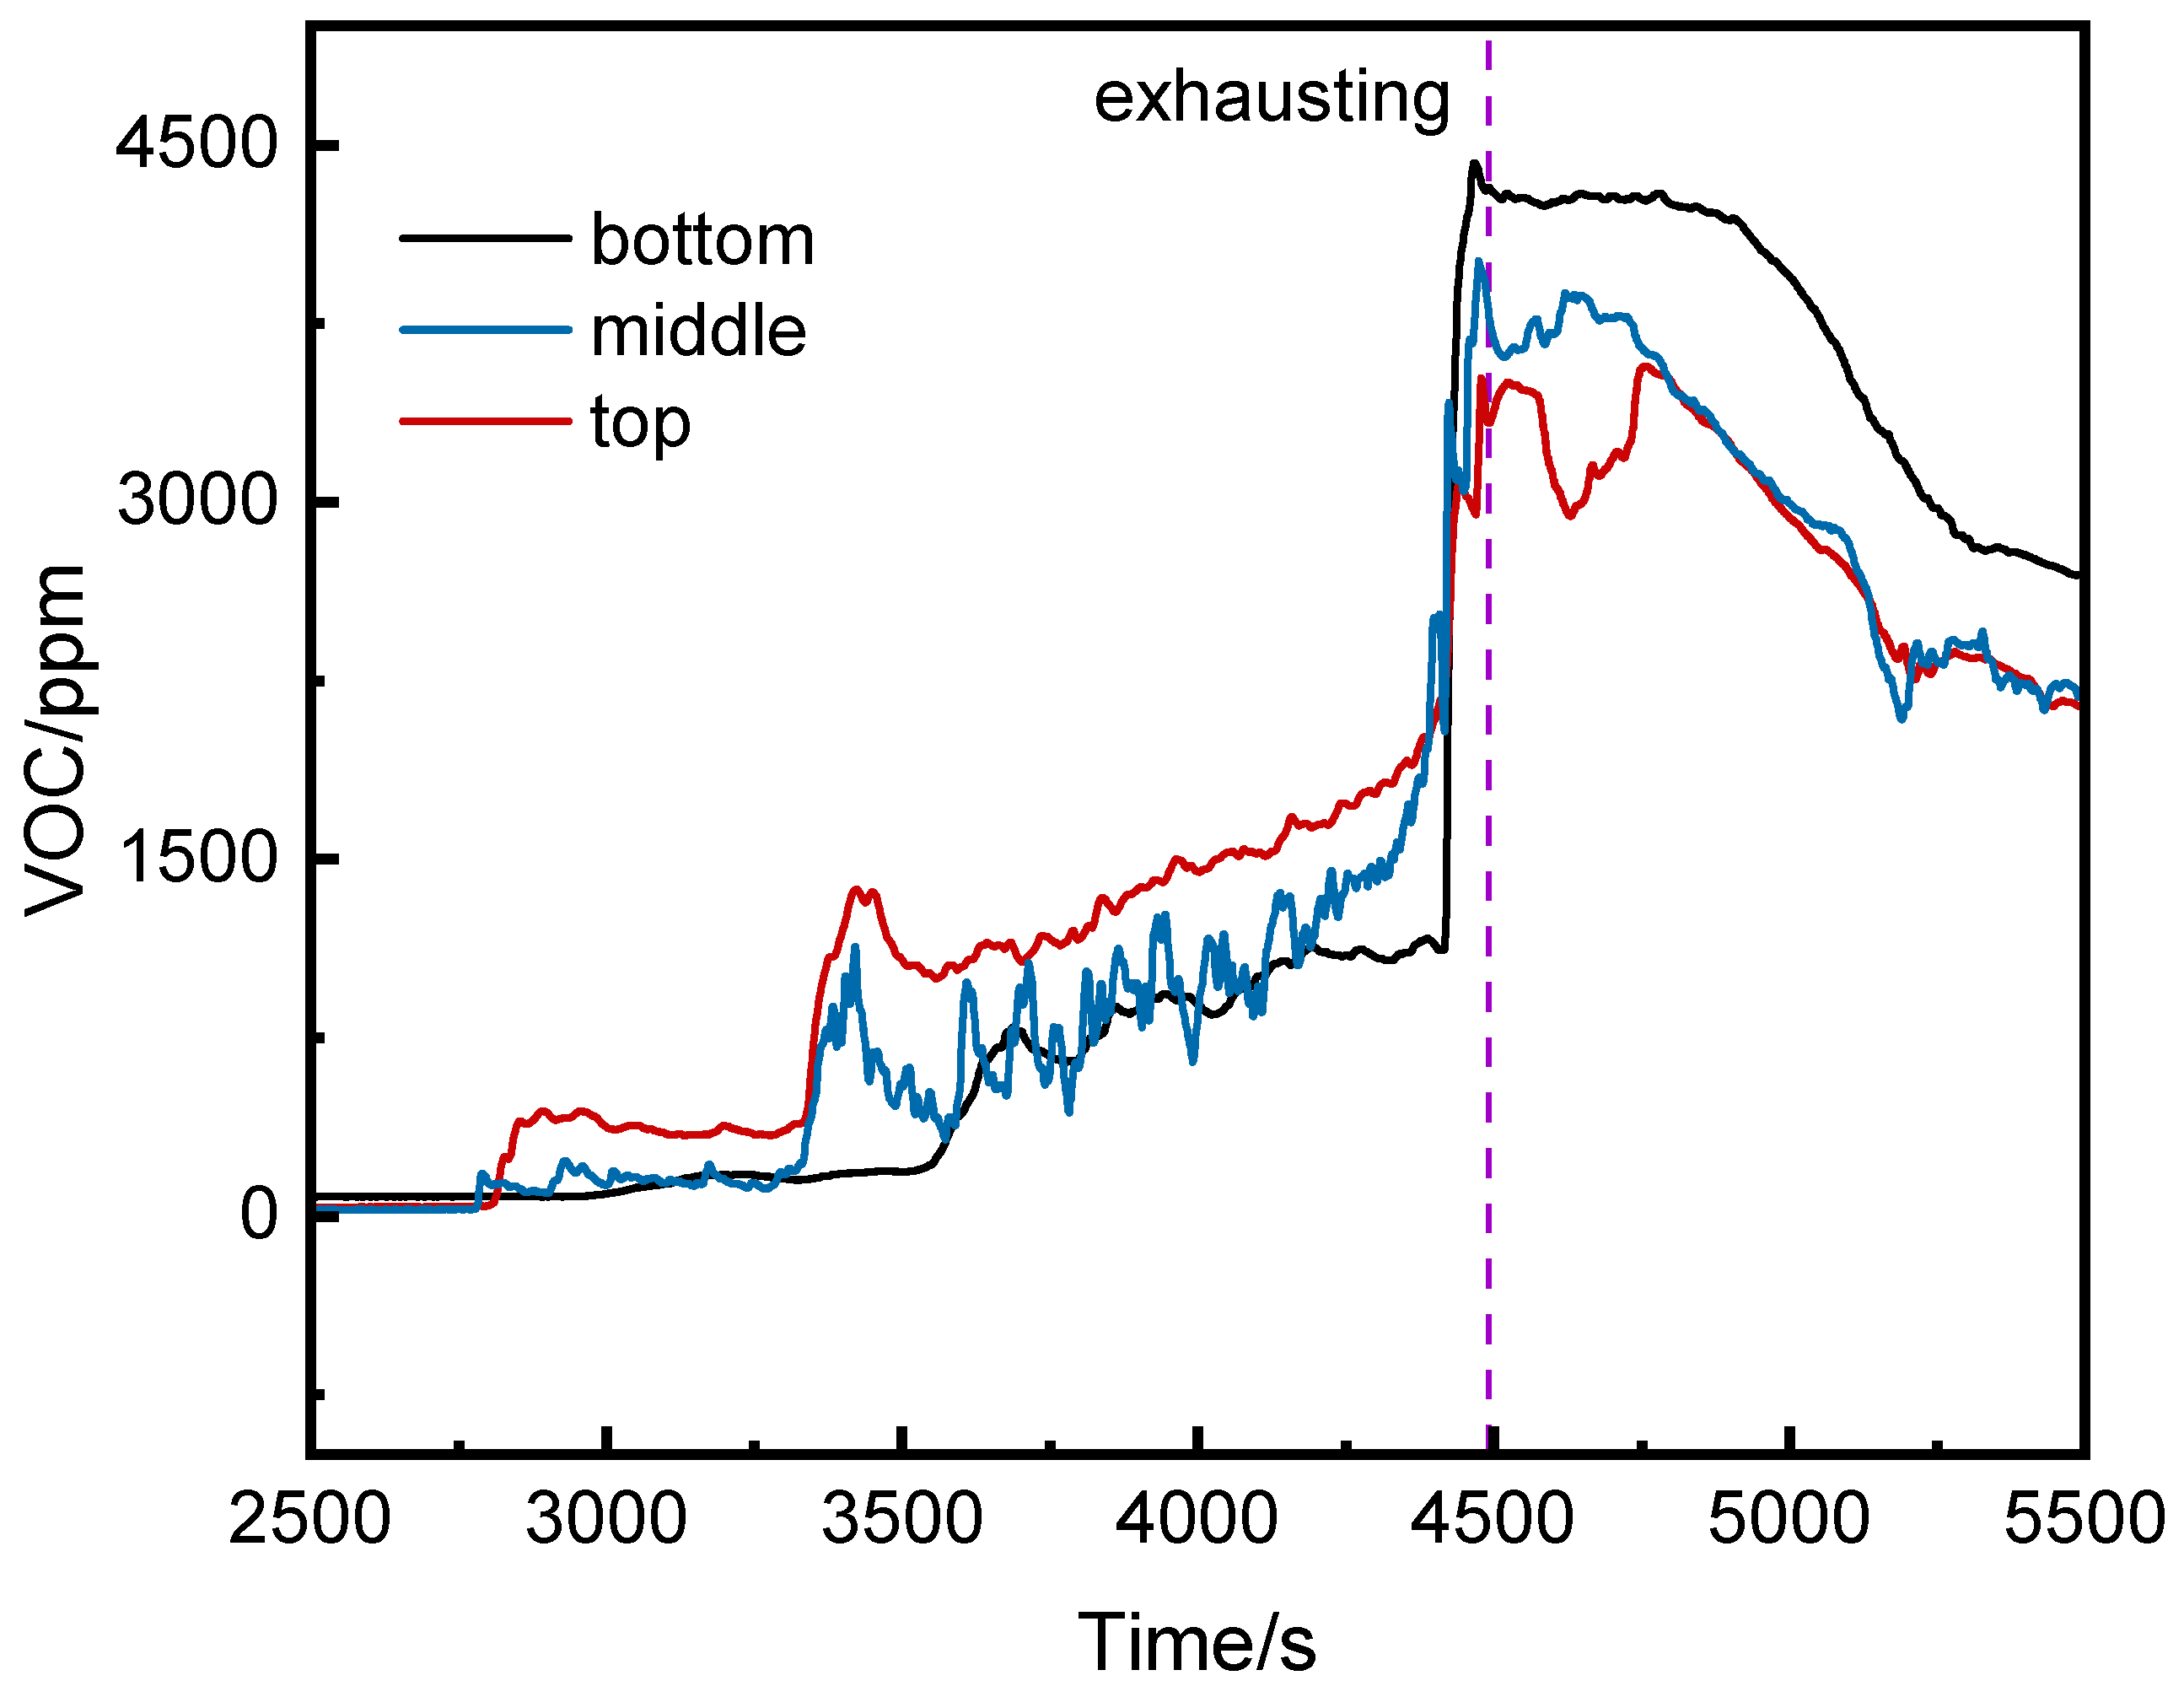
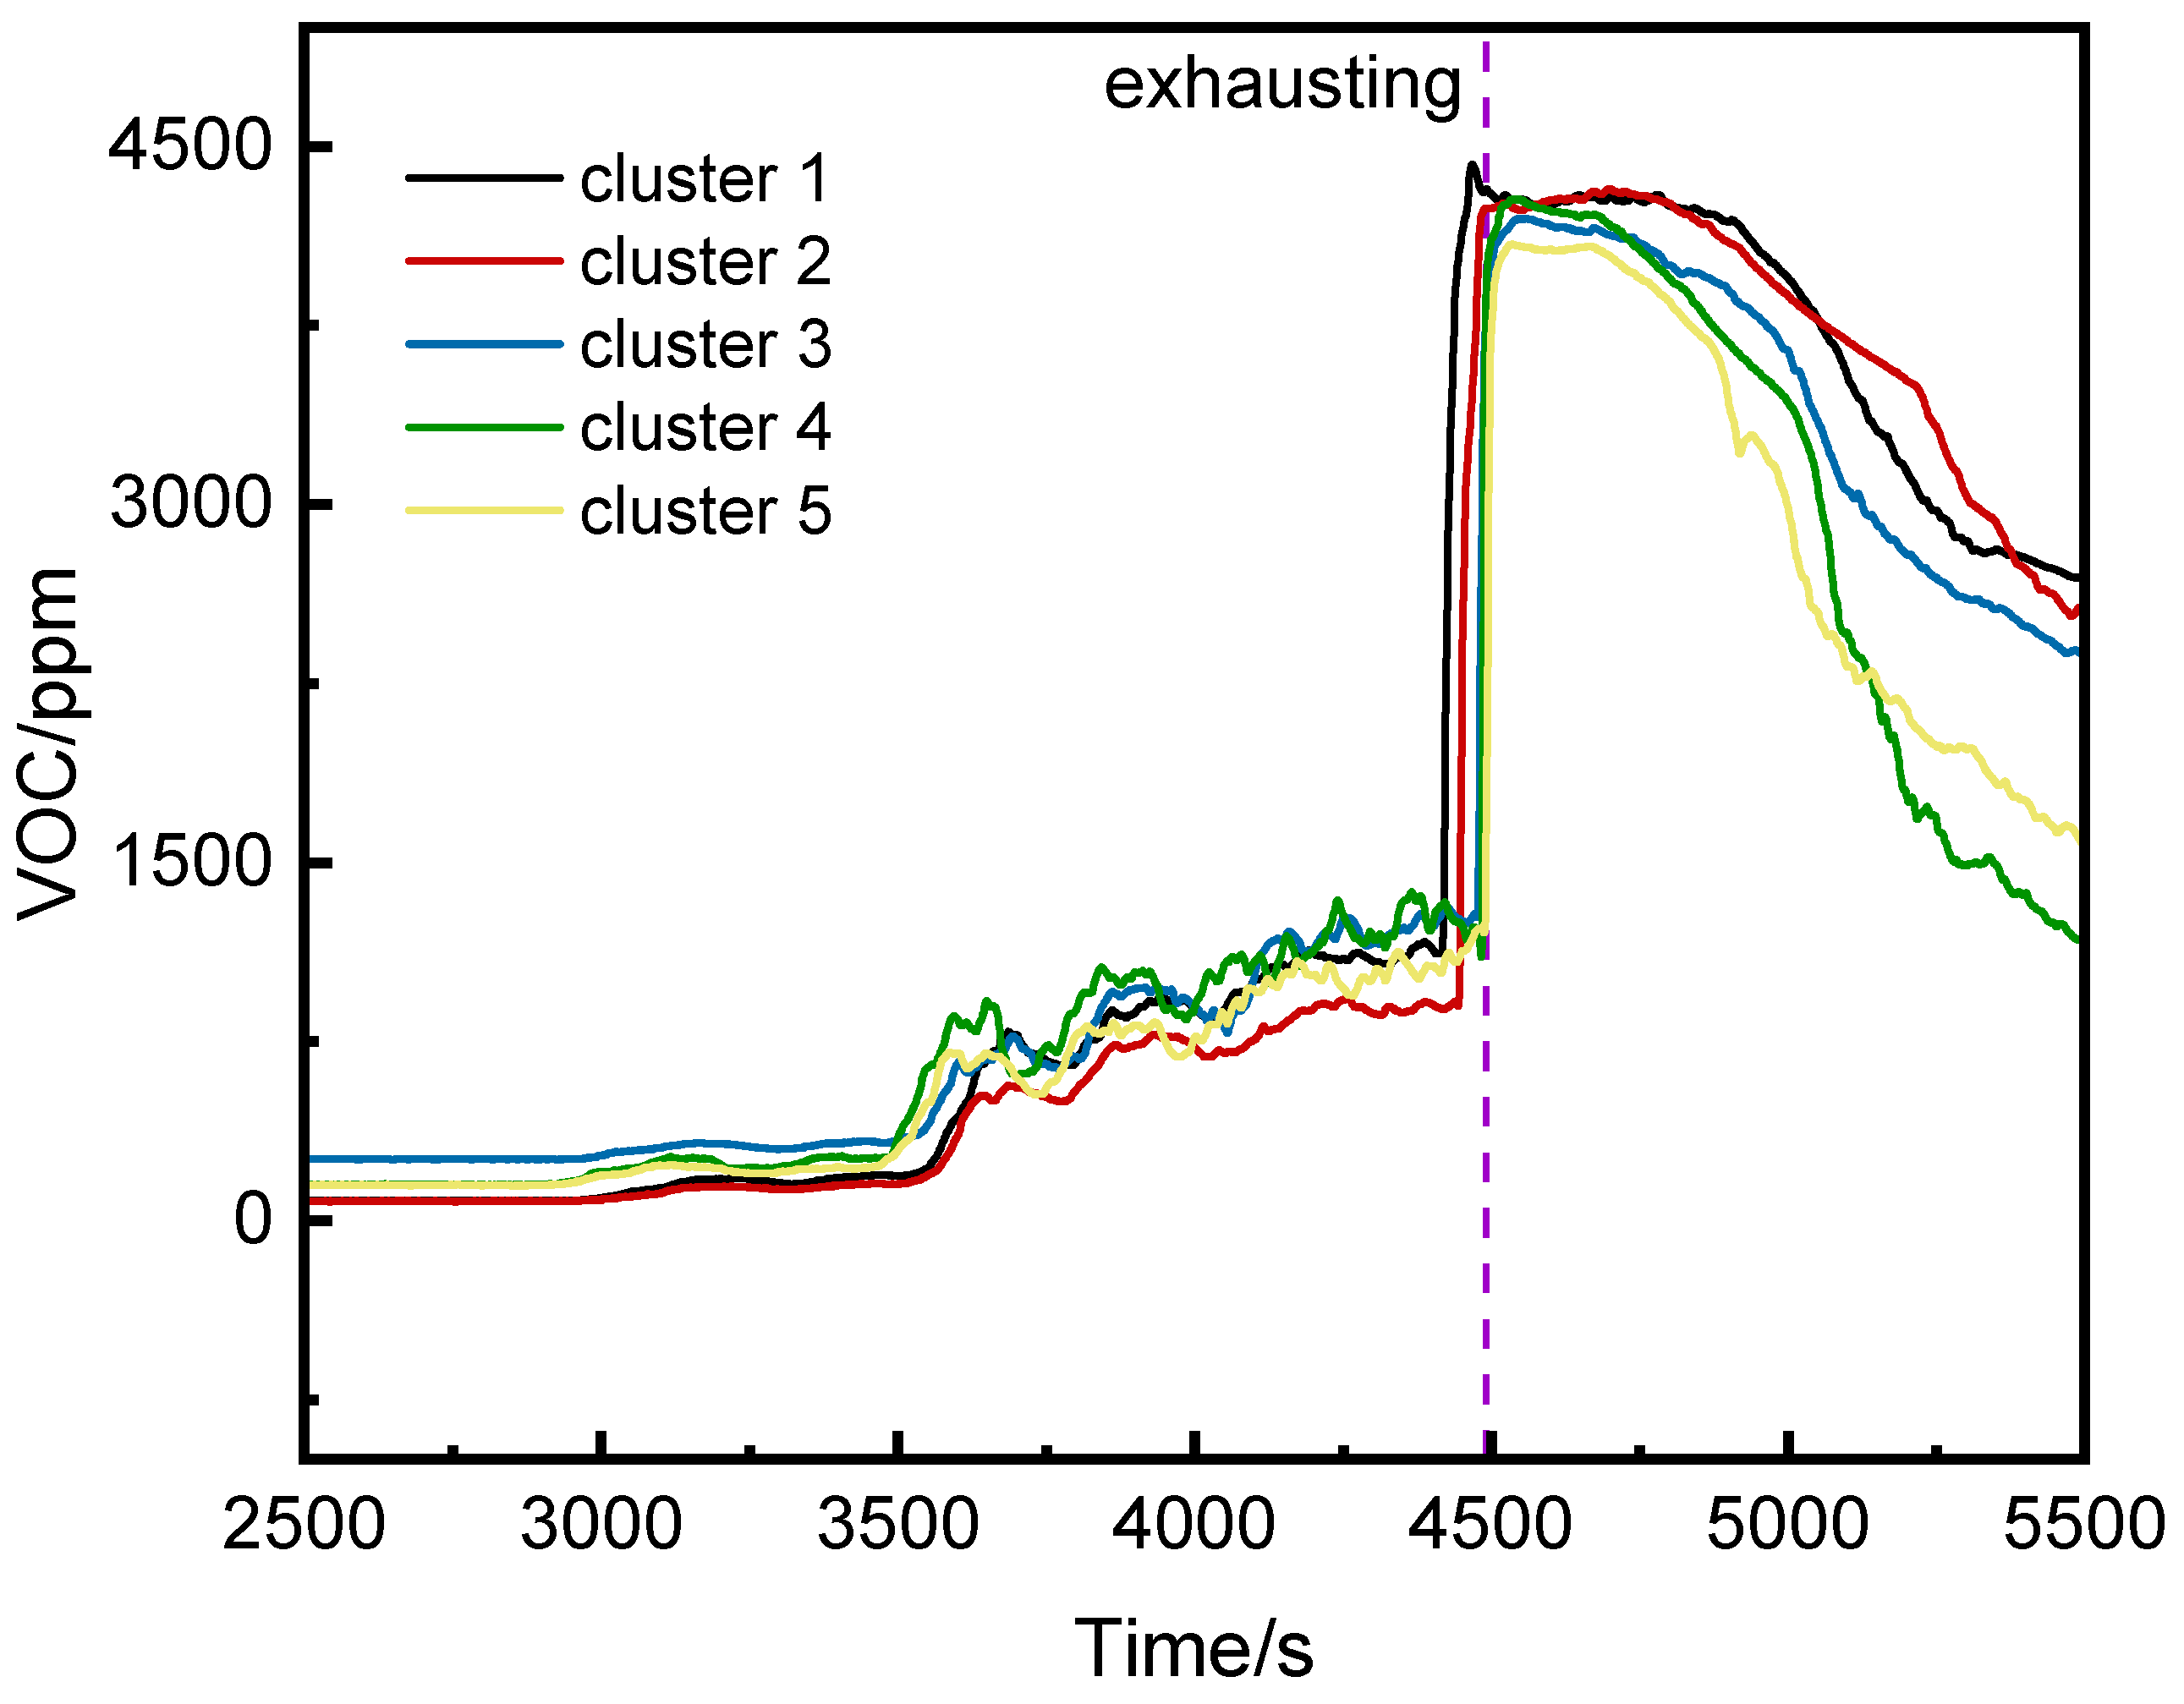
3.2.2. VOC Concentration Analysis

Figure 7 shows the VOC concentration curve inside the pack. The initial VOC concentration was stable at 238 ppm. As the heating plate temperature rose, organic compounds decomposed or volatilized, causing the VOC concentration to rise steadily. At 2780 s, small-scale combustion led to a rapid increase. During thermal runaway, the VOC concentration peaked at 2944 ppm at 4459 s.
Figure 8 shows the VOC concentration curves at the top, middle, and bottom of the runaway cluster. Before thermal runaway, the middle and top VOC concentrations were generally higher than at the bottom. After thermal runaway, the bottom VOC concentration exceeded other positions, peaking at 4425 ppm at 4468 s.
Figure 9 shows the VOC concentration curves for the runaway cluster and adjacent clusters. The trends were similar, with fluctuations starting around 3000 s. Before thermal runaway, airflow caused the bottom VOC concentration of the runaway cluster to not be the highest. After thermal runaway, it rose rapidly and surpassed the other clusters.

3.2.3. Comparison of VOC and CO Concentrations

The CO and VOC concentrations at the top, middle, and bottom of the runaway cluster and the bottom of the first adjacent cluster were compared (Figure 10). Initially, VOC and CO remained at ambient levels. VOC began fluctuating upward first (recorded as tVOC). After full thermal runaway, VOC and CO concentrations rose rapidly (recorded as tCO). The time of the full internal short circuit was recorded as tISC. Table 1 compares VOC and CO at different positions. At the top, middle, and bottom of the runaway cluster, tVOC lagged behind tISC by 31 s, 14 s, and 36 s, respectively, while tVOC preceded tCO by 2265 s, 1667 s, and 1428 s, respectively.
In summary, tVOC at the top, middle, and bottom of the runaway cluster preceded tCO by 2296 s, 1681 s, and 1464 s, respectively, but the initial VOC detection values fluctuated more than CO. VOC can serve as an early warning signal, providing significantly earlier warnings than CO. However, due to their volatility and potential cross-sensitivity to other organic compounds (as noted by Hildebrand et al. [24]), VOC detectors require careful threshold settings to avoid false alarms caused by fluctuations.

4. Conclusions and Recommendations

This study designed a full-scale physical fire test platform for lithium iron phosphate prefabricated cabin energy storage systems, analyzing temperature, voltage, CO, and VOC concentration changes during thermal runaway. The conclusions are as follows:
  • The thermal runaway trigger time was 37 s later than the voltage drop time and 1642 s earlier than vent opening.
  • The CO concentrations at the middle and bottom of the runaway cluster reached alarm thresholds 25 s and 39 s earlier than at the top, with peak concentrations over three times higher. Ventilation caused higher CO concentrations on the left side of the runaway cluster.
  • Before thermal runaway, VOC concentrations at the middle and top of the runaway cluster were generally higher than at the bottom. After thermal runaway, the bottom VOC concentration exceeded other positions.
  • VOC provided earlier warnings than CO (2296 s, 1681 s, and 1464 s earlier at the top, middle, and bottom, respectively) but its initial detection values were more volatile.
The results show that detectors inside the pack can help predict thermal runaway earlier. Fire protection strategies for cabin-level energy storage systems should be scientifically designed based on airflow distribution.

Author Contributions

Methodology, Y.Z. and R.F.; formal analysis, Y.Z.; investigation, R.F.; writing—original draft preparation, Y.Z.; writing—review and editing, Y.Z. and X.W.; supervision, M.W. and X.S.; project administration, R.F. and M.W.; funding acquisition, M.W. and X.S. All authors have read and agreed to the published version of the manuscript.

Funding

This research was funded by General Project of National Natural Science Foundation of China “Unsteady Combustion Behavior of New Energy Vehicle Fire in Tunnel and Flue Gas Transportation and Control” (Project No.: 52378412).

Institutional Review Board Statement

Not applicable.

Informed Consent Statement

Not applicable.

Data Availability Statement

The original contributions presented in this study are included in the article. Further inquiries can be directed to the corresponding author.

Conflicts of Interest

Authors Yufei Zhao, Rong Fan and Maohai Wang was employed by the company CABR Fire Technology Co., Ltd. Author Xuefeng Wang was employed by the company Inner Mongolia Urban Renewal Research and Development Co., Ltd. The remaining authors declare that the research was conducted in the absence of any commercial or financial relationships that could be construed as a potential conflict of interest.

References

  1. Wang, G.; Ping, P.; Peng, R.; Lv, H.; Zhao, H.; Gao, W.; Kong, D. A semi reduced-order model for multi-scale simulation of fire propagation of lithium-ion batteries in energy storage system. Renew. Sustain. Energy Rev. 2023, 186, 113672. [Google Scholar] [CrossRef]
  2. Lai, X.; Yao, J.; Jin, C.; Feng, X.; Wang, H.; Xu, C.; Zheng, Y. A review of lithium-ion battery failure hazards: Test standards, accident analysis, and safety suggestions. Batteries 2022, 8, 248. [Google Scholar] [CrossRef]
  3. Feng, X.; Zhang, F.; Feng, J.; Jin, C.; Wang, H.; Xu, C.; Ouyang, M. Propagation dynamics of the thermal runaway front in large-scale lithium-ion batteries: Theoretical and experiment validation. Int. J. Heat Mass Transf. 2024, 225, 125393. [Google Scholar] [CrossRef]
  4. Zhang, X.; Yao, J.; Zhu, L.; Wu, J.; Wei, D.; Wang, Q.; Chen, H.; Li, K.; Gao, Z.; Xu, C.; et al. Experimental and simulation investigation of thermal runaway propagation in lithium-ion battery pack systems. J. Energy Storage 2024, 77, 109868. [Google Scholar] [CrossRef]
  5. Jin, Y.; Zheng, Z.K.; Wei, D.H.; Jiang, X.; Lu, H.F.; Sun, L.; Tao, F.B.; Guo, D.L.; Liu, Y.; Gao, J.F.; et al. Detection of micro-scale Li dendrite via H2 gas capture for early safety warning. Joule 2020, 4, 1714–1729. [Google Scholar] [CrossRef]
  6. Koch, S.; Birke, K.P.; Kuhn, R. Fast thermal runaway detection for lithium-ion cells in large scale traction batteries. Batteries 2018, 4, 16. [Google Scholar] [CrossRef]
  7. Wang, H.; Xu, H.; Zhao, Z.; Wang, Q.; Jin, C.; Li, Y.; Sheng, J.; Li, K.; Du, Z.; Xu, C.; et al. An experimental analysis on thermal runaway and its propagation in Cell-to-Pack lithium-ion batteries. Appl. Therm. Eng. 2022, 211, 118418. [Google Scholar] [CrossRef]
  8. Kurzawski, A.; Gray, L.; Torres-Castro, L.; Hewson, J. An investigation into the effects of state of charge and heating rate on propagating thermal runaway in Li-ion batteries with experiments and simulations. Fire Saf. J. 2023, 140, 103885. [Google Scholar] [CrossRef]
  9. Li, Z.; Zhang, P.; Shang, R. Effects of heating position on the thermal runaway propagation of a lithium-ion battery module in a battery enclosure. Appl. Therm. Eng. 2023, 222, 119830. [Google Scholar] [CrossRef]
  10. Li, Z.; Guo, Y.; Zhang, P. Effects of the battery enclosure on the thermal behaviors of lithium-ion battery module during thermal runaway propagation by external-heating. J. Energy Storage 2022, 48, 104002. [Google Scholar] [CrossRef]
  11. Huang, Z.; Liu, J.; Zhai, H.; Wang, Q. Experimental investigation on the characteristics of thermal runaway and its propagation of large-format lithium ion batteries under overcharging and overheating conditions. Energy 2021, 233, 121103. [Google Scholar] [CrossRef]
  12. Kang, S.; Kwon, M.; Choi, J.Y.; Choi, S. Full-scale fire testing of battery electric vehicles. Appl. Energy 2022, 332, 120497. [Google Scholar] [CrossRef]
  13. Svetlík, J.; Tancos, Z.; Tancos, P.; Markova, I.; Slastan, K. Large-Scale Fire Tests of Battery Electric Vehicle (BEV): Slovak Case Study. Appl. Sci. 2024, 14, 4013. [Google Scholar] [CrossRef]
  14. Sun, L.; Wei, C.; Guo, D.; Liu, J.; Zhao, Z.; Zheng, Z.; Jin, Y. Comparative study on thermal runaway characteristics of lithium iron phosphate battery modules under different overcharge conditions. Fire Technol. 2020, 56, 1555–1574. [Google Scholar] [CrossRef]
  15. Zhang, M.; Yang, K.; Zhang, Q.; Chen, H.; Fan, M.; Geng, M.; Wei, B.; Xie, B. Simulation of Dispersion and Explosion Characteristics of LiFePO4 Lithium-Ion Battery Thermal Runaway Gases. ACS Omega 2024, 9, 17036–17044. [Google Scholar] [CrossRef]
  16. Lou, Z.; Huang, J.; Wang, M.; Zhang, Y.; Lv, K.; Yao, H. Inhibition performances of lithium-ion battery pack fires by fine water mist in an energy-storage cabin: A simulation study. Phys. Fluids 2024, 36, 045141. [Google Scholar] [CrossRef]
  17. GB 15322.1-2019; Combustible Gas Detectors-Part 1: Point-Type Combustible Gas Detectors for Industrial and Commercial Use. Standardization Administration of China: Beijing, China, 2019.
  18. GB 50116-2013; Code for Design of Automatic Fire Alarm System. Standardization Administration of China: Beijing, China, 2013.
  19. Parhizi, M.; Ahmed, M.; Jain, A. Determination of the core temperature of a Li-ion cell during thermal runaway. J. Power Sources 2017, 370, 27–35. [Google Scholar] [CrossRef]
  20. Zhang, Y.; Song, L.; Tian, J.; Mei, W.; Jiang, L.; Sun, J.; Wang, Q. Modeling the propagation of internal thermal runaway in lithium-ion battery. Appl. Energy 2024, 362, 123004. [Google Scholar] [CrossRef]
  21. Liu, H.; Wei, Z.; He, W.; Zhao, J. Thermal issues about Li-ion batteries and recent progress in battery thermal management systems: A review. Energy Convers. Manag. 2017, 150, 304–330. [Google Scholar] [CrossRef]
  22. Mao, B.; Fear, C.; Chen, H.; Zhou, H.; Zhao, C.; Mukherjee, P.P.; Sun, J.; Wang, Q. Experimental and modeling investigation on the gas generation dynamics of lithium-ion batteries during thermal runaway. eTransportation 2022, 15, 100212. [Google Scholar] [CrossRef]
  23. Jia, Z.; Qin, P.; Li, Z.; Wei, Z.; Jin, K.; Jiang, L.; Wang, Q. Analysis of gas release during the process of thermal runaway of lithium-ion batteries with three different cathode materials. J. Energy Storage 2022, 50, 104302. [Google Scholar] [CrossRef]
  24. Hildebrand, S.; Ferrario, F.; Lebedeva, N. Comparative Overview of Methods for the Detection of Airborne Electrolyte Components Released from Lithium-Ion Batteries. Energy Technol. 2023, 12, 2300647. [Google Scholar] [CrossRef]
Figure 1. Test layout diagram.
Fire 08 00164 g001
Figure 2. Curve of the voltage and front surface temperature of the #1 cell with time.
Fire 08 00164 g002
Figure 3. Temperature curve of thermal runaway cell and surrounding cells with time.
Fire 08 00164 g003
Figure 4. Curve of the concentration of CO inside the pack with time.
Fire 08 00164 g004
Figure 5. Curve of the concentration of CO at the bottom, middle, and top of the thermal runaway cluster with time.
Fire 08 00164 g005
Figure 6. Curve of CO concentration with time at the bottom of each cluster on the left of the runaway cluster.
Fire 08 00164 g006
Figure 7. Curve of the concentration of VOC inside the pack with time.
Fire 08 00164 g007
Figure 8. Curve of the concentration of VOC at the top, middle, and bottom of the thermal runaway cluster with time.
Fire 08 00164 g008
Figure 9. Curve of VOC concentration with time at the bottom of each cluster on the left of the runaway cluster.
Fire 08 00164 g009
Figure 10. Comparison of CO and VOC of the thermal runaway cluster. (a) Comparison of CO and VOC at the top of the thermal runaway cluster. (b) Comparison of CO and VOC at the middle of the thermal runaway cluster. (c) Comparison of CO and VOC at the bottom of the thermal runaway cluster.
Fire 08 00164 g010aFire 08 00164 g010b
Table 1. Comparison of CO and VOC at different positions.
PositionInitial VOC Detection Values (ppm)Initial CO Detection Values (ppm)tVOC (s)tCO (s)
top29021304426
middle23027284409
bottom80029674431
Disclaimer/Publisher’s Note: The statements, opinions and data contained in all publications are solely those of the individual author(s) and contributor(s) and not of MDPI and/or the editor(s). MDPI and/or the editor(s) disclaim responsibility for any injury to people or property resulting from any ideas, methods, instructions or products referred to in the content.

