Article

Examining the Existing Criteria for the Evaluation of Window Ejected Plume Attachment

1
School of Civil Engineering and Architecture, Wuhan University of Technology, Wuhan 430070, China
2
Hainan Nuclear Power Co., Ltd., Haikou 572732, China
*
Author to whom correspondence should be addressed.
Fire 2025, 8(5), 168; https://doi.org/10.3390/fire8050168
Submission received: 22 March 2025 / Revised: 21 April 2025 / Accepted: 21 April 2025 / Published: 23 April 2025

Abstract

:
Both single-skin and double-skin glass facades are extensively employed in commercial high-rise buildings and are gaining increasing popularity. However, the capability to deploy firefighting agents in such ultra-high structures remains limited and has been minimally investigated. To provide guidance for single-layer exterior wall fire protection, this study examines the impact of vertical walls on window ejected plumes by simulating the upper portion of jet plumes using a square burner flame. Experimental and numerical simulations were conducted. The findings revealed that plumes from propane burners could attach to the wall even when LE. burner fire > 0.7W, contradicting previous criteria. This discrepancy arises because prior studies underestimated the induced pressure difference in large fires. This pressure difference propels the plume toward the wall, behaving like a rigid body.

1. Introduction

1.1. The Existing Criteria for the Evaluation of Plume Attachment

When there is a wall above the opening, window ejected plumes can be categorized into attached plumes and separated plumes [1,2,3,4,5]. It is believed that the induced pressure difference between the two sides of the plume, i.e., by the wall side and the ambient side, was the factor driving the plume toward the wall.
The induced pressure difference should become larger when the plume is closer to the wall, or when it is slender in the direction parallel to the wall [1,3]. Thus, the existing criteria for evaluating plume attachment are mainly based on the length scale related to plume cross-section and the horizontal distance between the wall and the plume trajectory. For compartment fires with small openings, the plume cross-section was thought to be determined primarily by the opening geometry. The ratio of the opening width to the opening height, therefore, was once recognized as the criterion by which to evaluate whether or not the plume would attach to the wall. By studying the behavior of ejected plume from a model compartment of 0.4 m (W) by 0.4 m (L) by 0.2 m (H) with different openings, Yokoi [1] found that the plume might attach to the wall when WH > 1.25, where W is the opening width and H is the opening height. For balcony-type ejected plume, instead of using the opening height (room height), the depth of the smoke layer under the ceiling (ds) was used as the length scale [4,6], and the behavior of ejected plume was found to be affected by the ratio of Wds: when Wds < 3, the plume separated from the wall; otherwise, the plume adhered or re-attached to the wall. Himoto et al. [3] directly measured the distance between the wall and the equilibrium point (LE). Taking the distance as a characteristic length scale, it was found that when the ratio of this characteristic length scale to the opening width is less than 0.7 (i.e., LE/W < 0.7) the plume would attach to the wall; otherwise, the plume detached from the wall.
In recent years of studies, Zhou et al. [7] discussed the vertical wall temperature profile of buoyant window spill plumes from intermediate-scale compartments and then developed many new models [8,9]. Additionally, Fang et al. [10] analyzed the influence of sidewalls on facade fire plume temperature through flame entrainment, subsequent research also involved the influence of surface inclination [11,12], opening position [13], compartment fires [14], and exterior wall materials [15] on flame height. Miao et al. [16] conducted experimental studies on the vertical temperature distribution of window plumes with visible external flames. They devised an empirically-based formula using mean flame characteristics to calculate the vertical temperature distribution of ejected plumes in single- and double-skin facade scenarios.

1.2. Disagreements in Recent Studies

Although the three criteria are all obtained from the experimental results, and the one proposed by Yokoi has been widely accepted, some disagreements were found in recent studies [2,17,18]. In compiling the results of ejected plume from openings with the same aspect ratio (WH = 0.5), Figure 1a–c show a similar trend that the plume detached from the wall; while, Figure 1d gives an opposite trend with the plume attached to the wall. Obviously, the results contradict the criterion proposed by Yokoi [1]. The one proposed by Himoto et al. [3] has improved a lot in accuracy and appears to be more reasonable, however, there were still discrepancies.
Another point to note is that the size of the measured region might mislead the judgment of plume attachment. For example, if the measured region in Figure 1d is shrunk to 0.2 (x) by 0.4 (z) m, i.e., only considering the results within 0.0 < z < 0.4 m, the plume “departs” from the wall. That is to say, if the measured region was extended to a certain point, the so called “separated plume” may also attach to the wall at a higher position. Figure 2 demonstrates the critical influence of the measurement region on plume attachment judgment. As shown in Figure 2, the plume trajectory labeled as 3, 4, and 5 can be noted as a non-attaching plume if just considering the part in the measured region; however, when further considering the part in the extended region, trajectory 2 finally attaches to the wall. This suggests that existing criteria (e.g., Yokoi’s W/H > 1.25) may misclassify plumes as “detached” if the measurement domain is insufficient. The measured data may cheat!

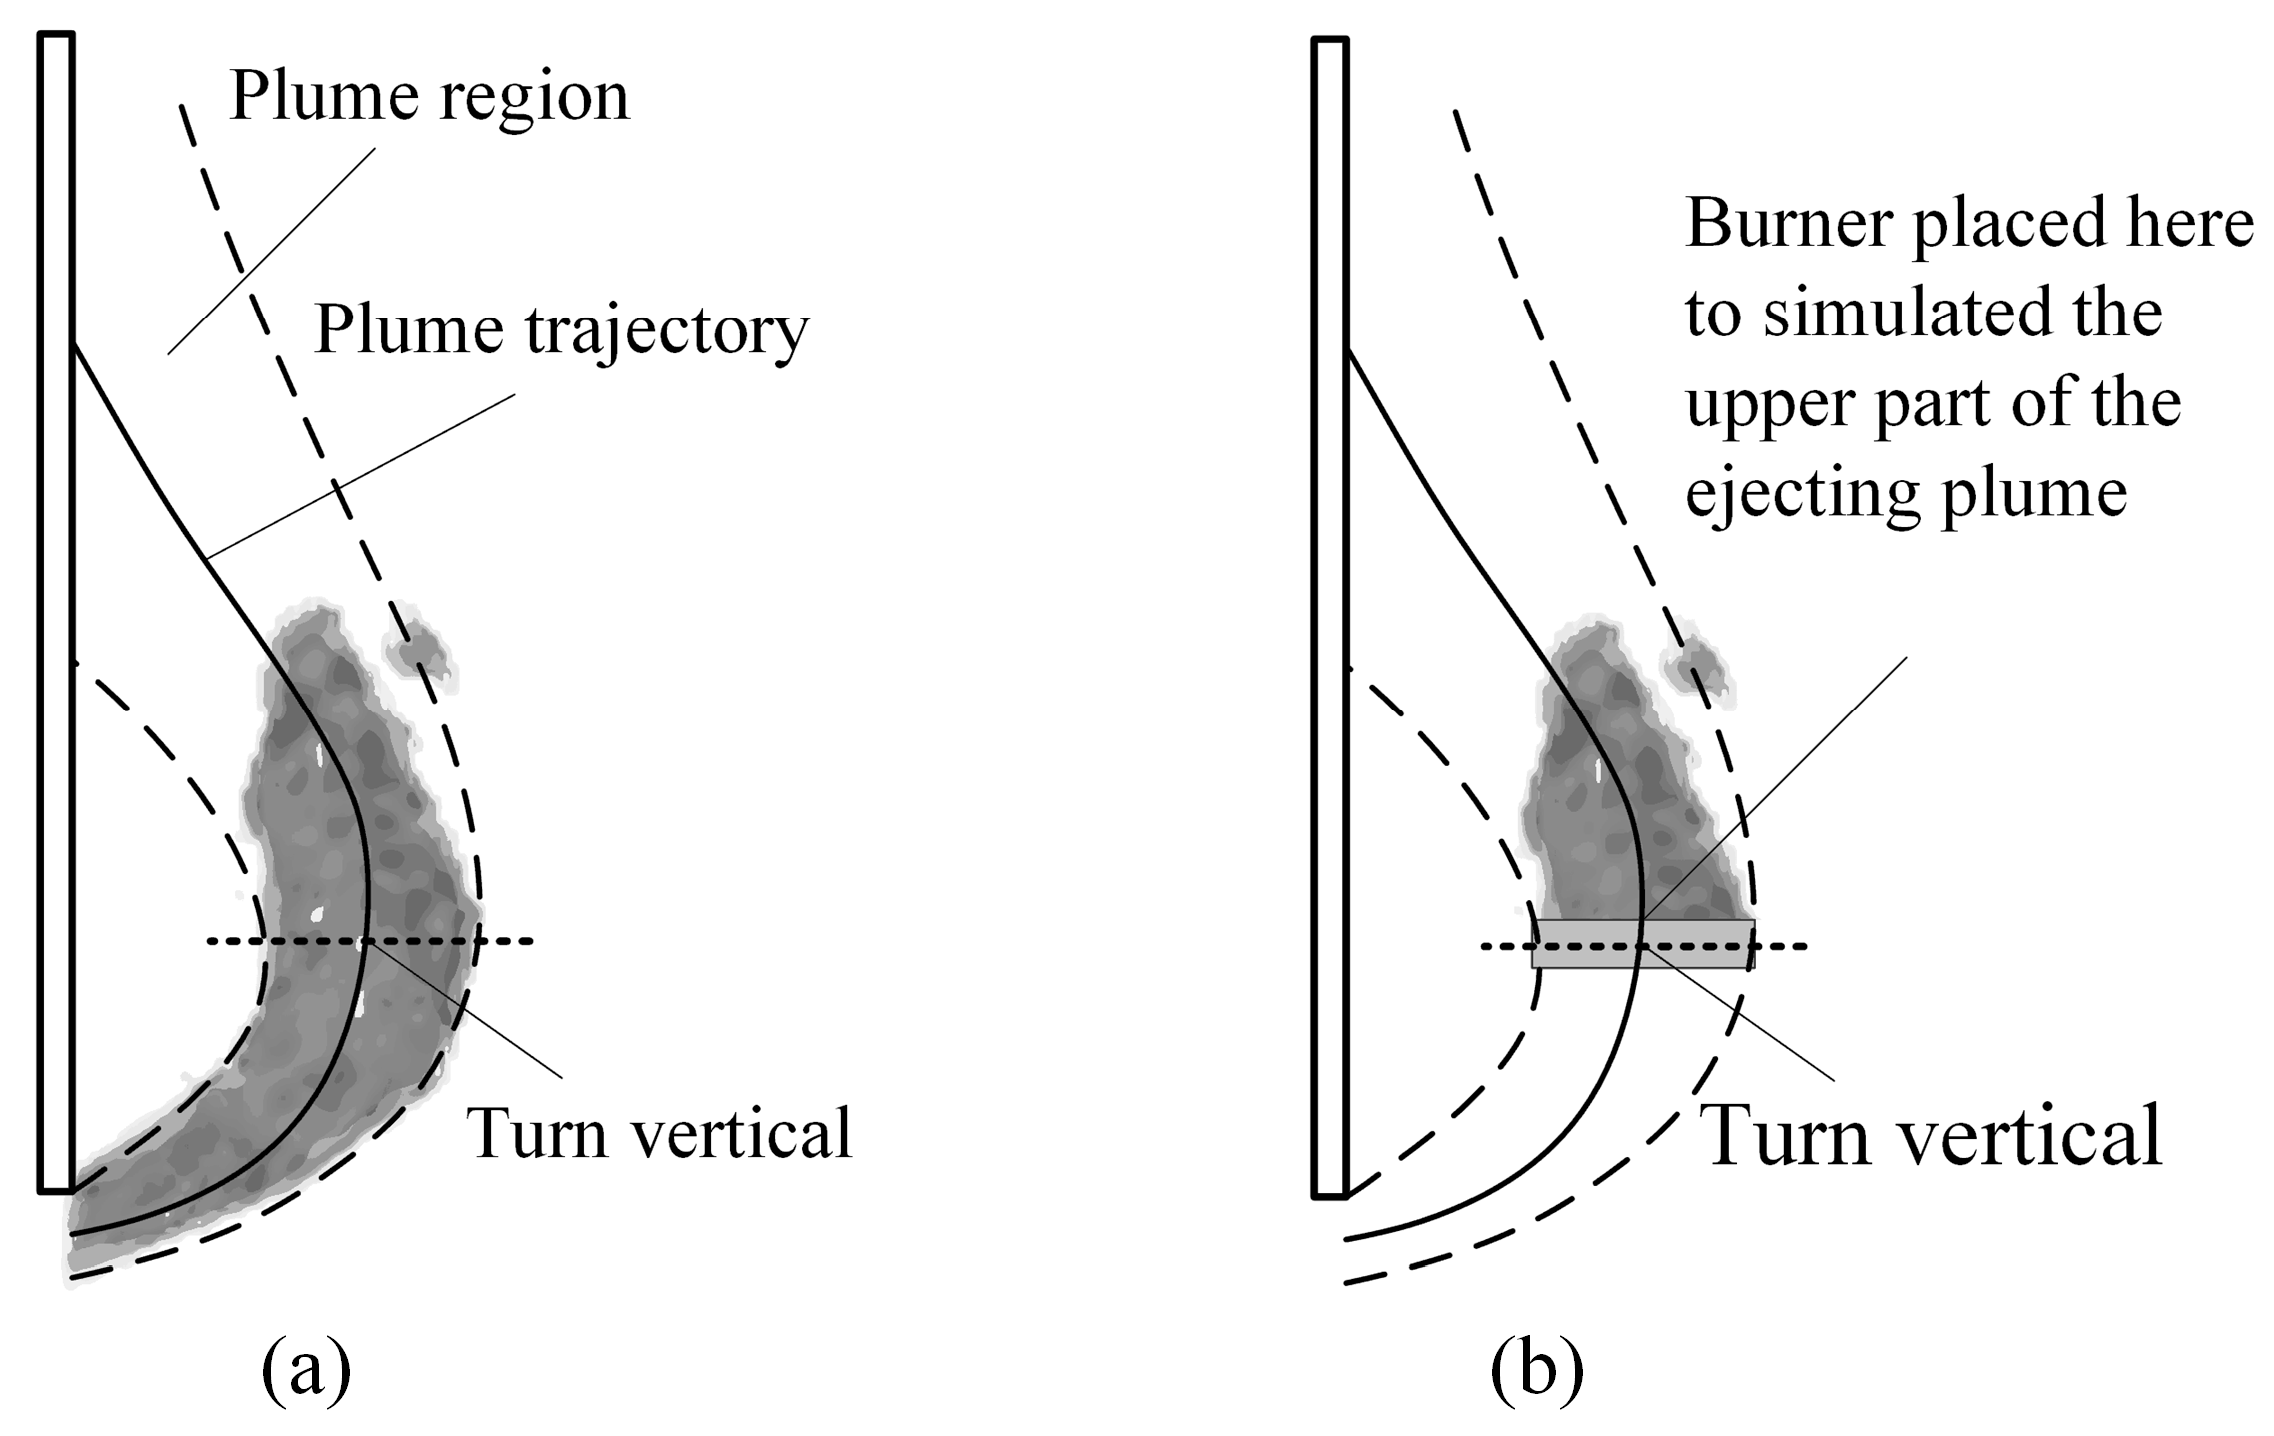
1.3. Simulating the Upper Part of Ejected Plume Using Square Pool Fires

To obtain insights into plume attachment, better understanding of the interaction between the wall and the near-wall plume is needed. As discussed above, the measuring region should be large enough to show a complete picture of the ejected plume. However, just extending the measuring region costs too many resources, and is inconvenient or even impossible to control the plume position and shape which have a significant influence on plume attachment. Recently, Lee and Delichatsios et al. [19,20] proposed a new theory, i.e., the virtual rectangular fire source theory, which assumed that there was a horizontal rectangular fire source existing at the neutral plane of the opening (≈0.4H), with the lengths of the two edges being defined as: l 1 = ( A H ) 2 / 5 , parallel to the opening; l 2 = ( A H 2 ) 1 / 4 , perpendicular to the opening. The model has been widely recognized and was considered as a classical model for window ejected flame. The model was later validated in subsequent experimental studies by Tang [21], Cui [17], and Tarek [22] who have validated the flame height models. Thus, an alternative method was proposed: a burner is assumed to be set at the position where the ejected plume right turns to a vertical direction to simulate the upper part of the ejected plume as in Figure 3. Once the simulated upper part is inclined or attached to the wall, the original window ejected plume should also attach to the wall at some point and should be categorized as an attaching plume. One thing to note, although the square burner method simulates the upper plume trajectory well, it cannot precisely reproduce the flow field of an ejected plume—particularly interactions near the vent opening or initial turbulent mixing zones. Therefore, conclusions drawn are primarily valid for post-turning vertical flow regions. The fundamental principle of this approach lies in identifying cases with similar boundary conditions that nevertheless violate established criteria. By systematically analyzing these discrepancies between simulated and actual flow patterns, researchers aim to uncover the underlying reasons for the observed differences.
This study addresses the inconsistency in existing criteria by simulating large fire scenarios through controlled burner experiments. It fills the gap in understanding how induced pressure differences drive plume attachment beyond traditional small-scale fire models. We aim to provide a revised framework for evaluating plume behavior in high-rise building facades.

2. Details of Experimental Apparatus and Simulation Conditions

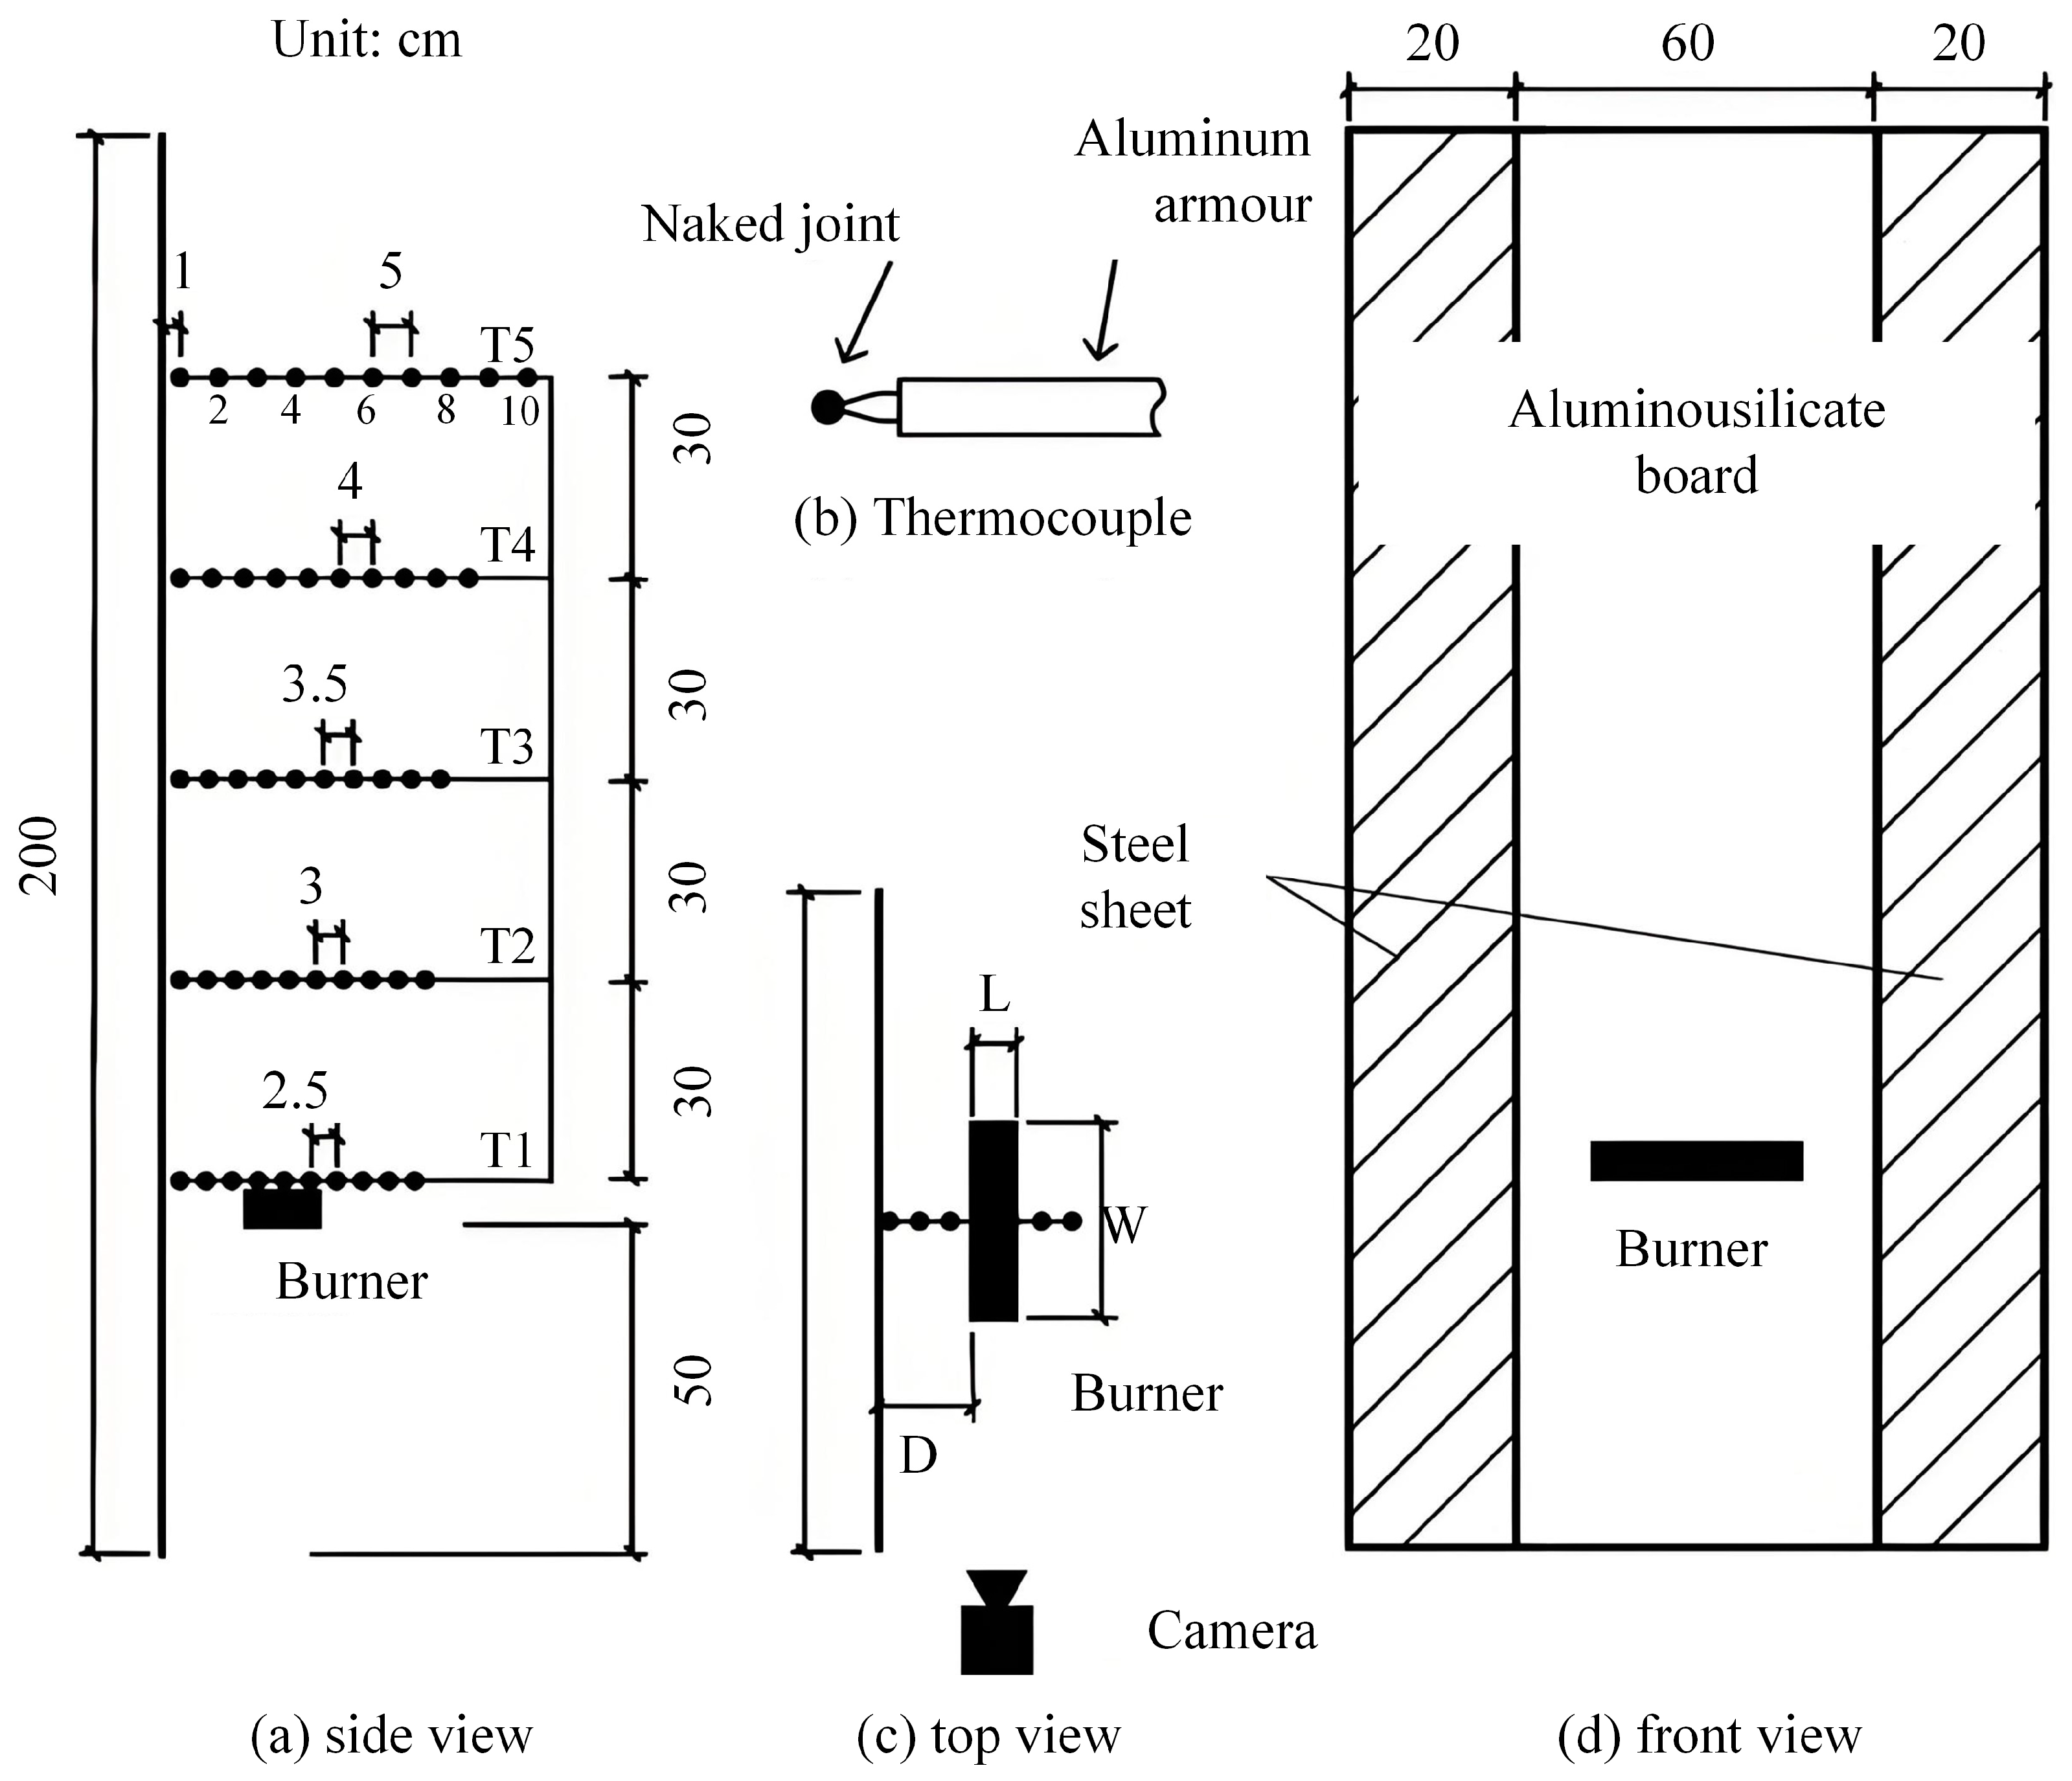
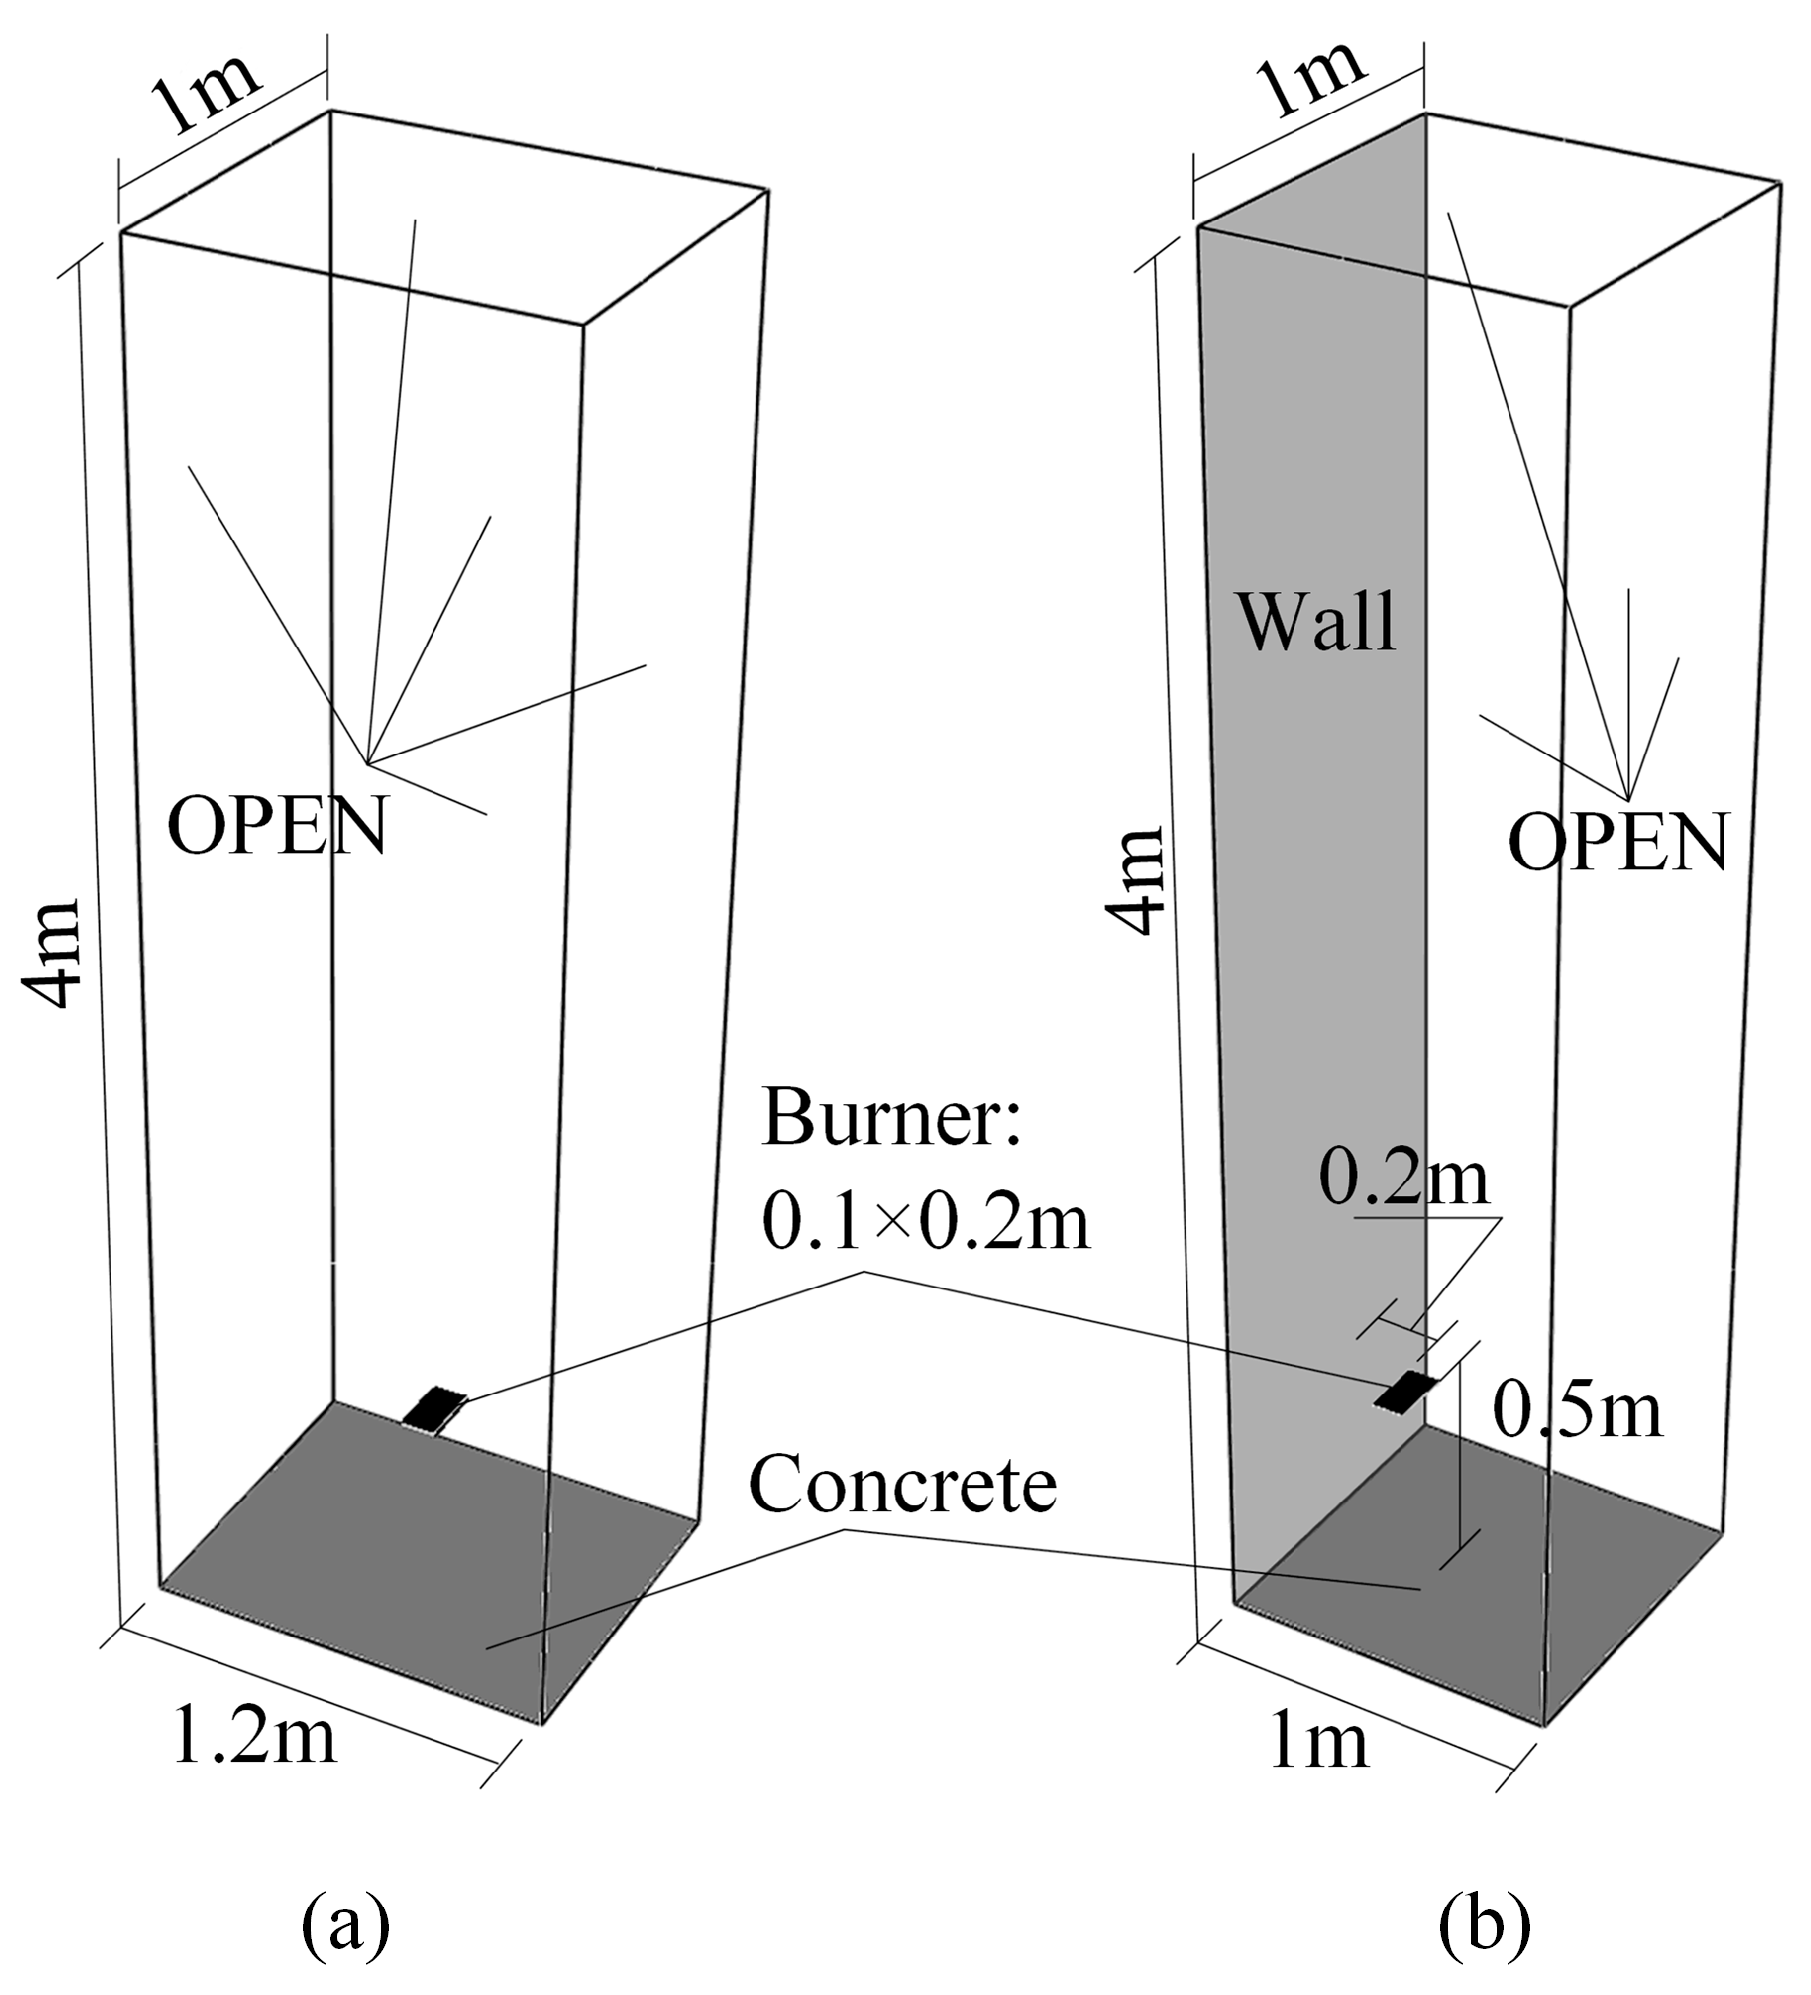
2.1. Experimental Apparatus

The experimental arrangement is shown in Figure 4. The vertical wall (1.0 m by 2.0 m) was constructed with 3 cm thick aluminosilicate mineral wool board (bulk density 280–320 kg/m3, conductivity (W/(m·K)) 0.09 (400 °C), 0.12 (600 °C), 0.15 (800 °C), 0.20 (1000 °C), specific heat capacity 900 J/(kg·K), and 1 mm thick steel sheet. The burner was installed 0.5 m above the ground and placed at a distance (D) away from the vertical wall. D represents the distance between the wall and the near wall edge of the burner. Propane was chosen for its stable combustion properties and relevance to compartment fire simulations. Two types of propane burners were used, i.e., with burner width of 8 cm and 10 cm. Propane was used with the flow rate regulated by a glass rotameter.
Similar to the methods employed by Yokoi [1], Ohimiya et al. [23], and Himoto et al. [3], this study processes flame temperature and flame height to characterize the trajectory of the plume. Measuring instruments are shown in Figure 4. Naked-joint armored thermocouples were used to shorten the response time. The diameter of the thermocouple armor was 1 mm, and the diameter of the thermocouple wires was 0.15 mm. Accuracy of the thermocouple was ±0.75%t, where t is the measured temperature. A movable thermocouple grid (TC grid) was used, which consists of 5 TC trees with 10 thermocouples in each tree; the vertical interval was 30 cm, and the horizontal intervals were 2.5 cm, 3.0 cm, 3.5 cm, 4 cm, and 5 cm, respectively. In the experiment, each thermocouple is numbered according to its vertical position (from bottom to top as T1X-T5X) and horizontal position (from near to far as TY1-TY10), as shown in Figure 4. The lowest TC tree was set at 1 cm above the burner surface at the beginning; then the TC grid was moved upward two times in a step size of 10 cm during the testing period which lasted for 8 min (2 min for the first stage, 3 min for the second and the third stage). Angilent 34970A was used for data logging at a sampling time-interval of three seconds.
A video camera was set parallel to the vertical wall as in Figure 4b, which records 30 frames per second. A piece of black cloth was hung on the opposite side of the camera and served as background.
The experimental conditions are summarized in Table 1. The distance between the wall and the burner was varied between 0 and 25 cm. The two basic principles in determining the HRR are that: firstly, the HRR should not be too large that the resulting flame/plume deviates too much from a real ejected flame/plume; secondly, the HRR should not be too small that the flame cannot cover the whole burner surface. Or in other words, the heat release rate should be as small as possible, so that the resulted plume resembles a real ejected plume. The selection of HRRPUA is based on previous studies [24,25,26,27], where the dimensionless heat release rate of window ejected fire, Q / Q c , is within the range of 1.1 to 1.6. This corresponds to the excess heat release rate Q e x of 3.68–16.8 kW, which is equivalent to HRRPUA values in the range of 460–560 kW/m2. This ensures that the flame behavior is analogous to ejected plumes while avoiding excessive turbulence, thereby simulating realistic external wall fire scenarios. The low HRRPUA ensured flame behavior. Therefore, the HRRPUA in Table 1 were used.
Typical temperature histories are shown in Figure 5. The data were collected in the case with: opening geometry of 0.1 m × 0.2 m; Q/Qc = 2.7; and in single-wall system. It shows that the time-interval of three minutes used in the present work is enough for the thermocouples to reach quasi-steady state. The three average periods were 30–110 s, 210–290 s, and 390–470 s.

2.2. Simulation Conditions

Simulations used the open-source CFD package FDS6 that was developed by NIST for simulating fire and smoke movement. The simulation setup replicated the experimental structure, as shown in Figure 6, following the methodology of Miao et al. [28] who compared velocity-based and temperature-based plume trajectories.
Geometry of the burner was 0.1 × 0.2 m, and HRRPUA was set as 560 kW/m2. In the case with a wall, the burner was placed 0.2 m away from the vertical wall, and the computational domain was 1.0 m (W) by 1 m (L) by 4 m (H). In the case without the wall, the burner was placed at the center of computational domain, and the domain size was 1.2 m (W) by 1 m (L) by 4 m (H).
Grid size was 1 cm all over the computational domain. A grid sensitivity analysis confirmed that a 1 cm resolution met the criterion D*/δx > 4 (where D* is the characteristic fire diameter), ensuring sufficient accuracy for plume dynamics. The ambient temperature was 20 °C. The ground was set as “concrete” boundary condition. Similar studies have been conducted by Himoto [29] and Sun et al. [27,30,31] in the case with a wall, the wall was set as “3 cm thick aluminosilicate board”, and the other boundary was set as “OPEN”. In the case without the wall, the other boundary was set as “OPEN”. The “open” boundary condition in FDS assumes environmental pressure equilibrium, where the airflow can freely enter and exit the boundary without generating local pressure gradients. Referencing the study by Hu et al. [32,33], in this paper, the closest distance between the combustor and the “open” boundary is set to 40D to ensure that it does not affect the combustion process.
Prior to conducting fire simulations using FDS (Fire Dynamics Simulator), it is essential to perform grid sensitivity testing on the designated simulation domain to establish an optimized grid resolution design for fire-related computations. This procedure enhances output accuracy and minimizes computational errors. The characteristic flame diameter ( D * ) can be calculated using the following formula:
D * = Q ˙ ρ c p T g 2 5
As indicated in the FDS User Manual for grid sensitivity analysis [34], empirical studies suggest that appropriate grid dimensions should range between 1/16 and 1/4 of the characteristic flame diameter. When this dimensionless parameter falls within the specified range, the grid resolution is considered appropriate for achieving reliable simulation results. Through calculations, the D * value in this study is determined to be 0.157 m. The appropriate grid size ranges from 0.01 m to 0.04 m. To enhance computational accuracy, the final grid size selected is 0.01 m.
Figure 7 compares the plume temperature distributions under experimental and simulation conditions, with cross-sectional temperatures at two selected heights (z = 0.5 m and z = 1.0 m) being analyzed. As observed from the figure, the temperature distributions at both selected heights exhibit similar patterns.
Figure 8 presents a temperature comparison between simulation and experimental results at selected height cross-sectional positions without wall. The detailed parameters of the experimental setup adhered to the methodology established by Miao et al. [28]. In the experimental setup, the flame was emitted through a 20 × 20 cm opening, while in the simulation, the flame was assumed to originate from a hypothetical square burner. As shown in Figure 8, the flame temperature at the 0.5 m height position exhibits similar variation patterns in both simulation and experimental scenarios, demonstrating the feasibility of using a square propane burner to simulate ejected plume behavior.

3. Results and Discussion

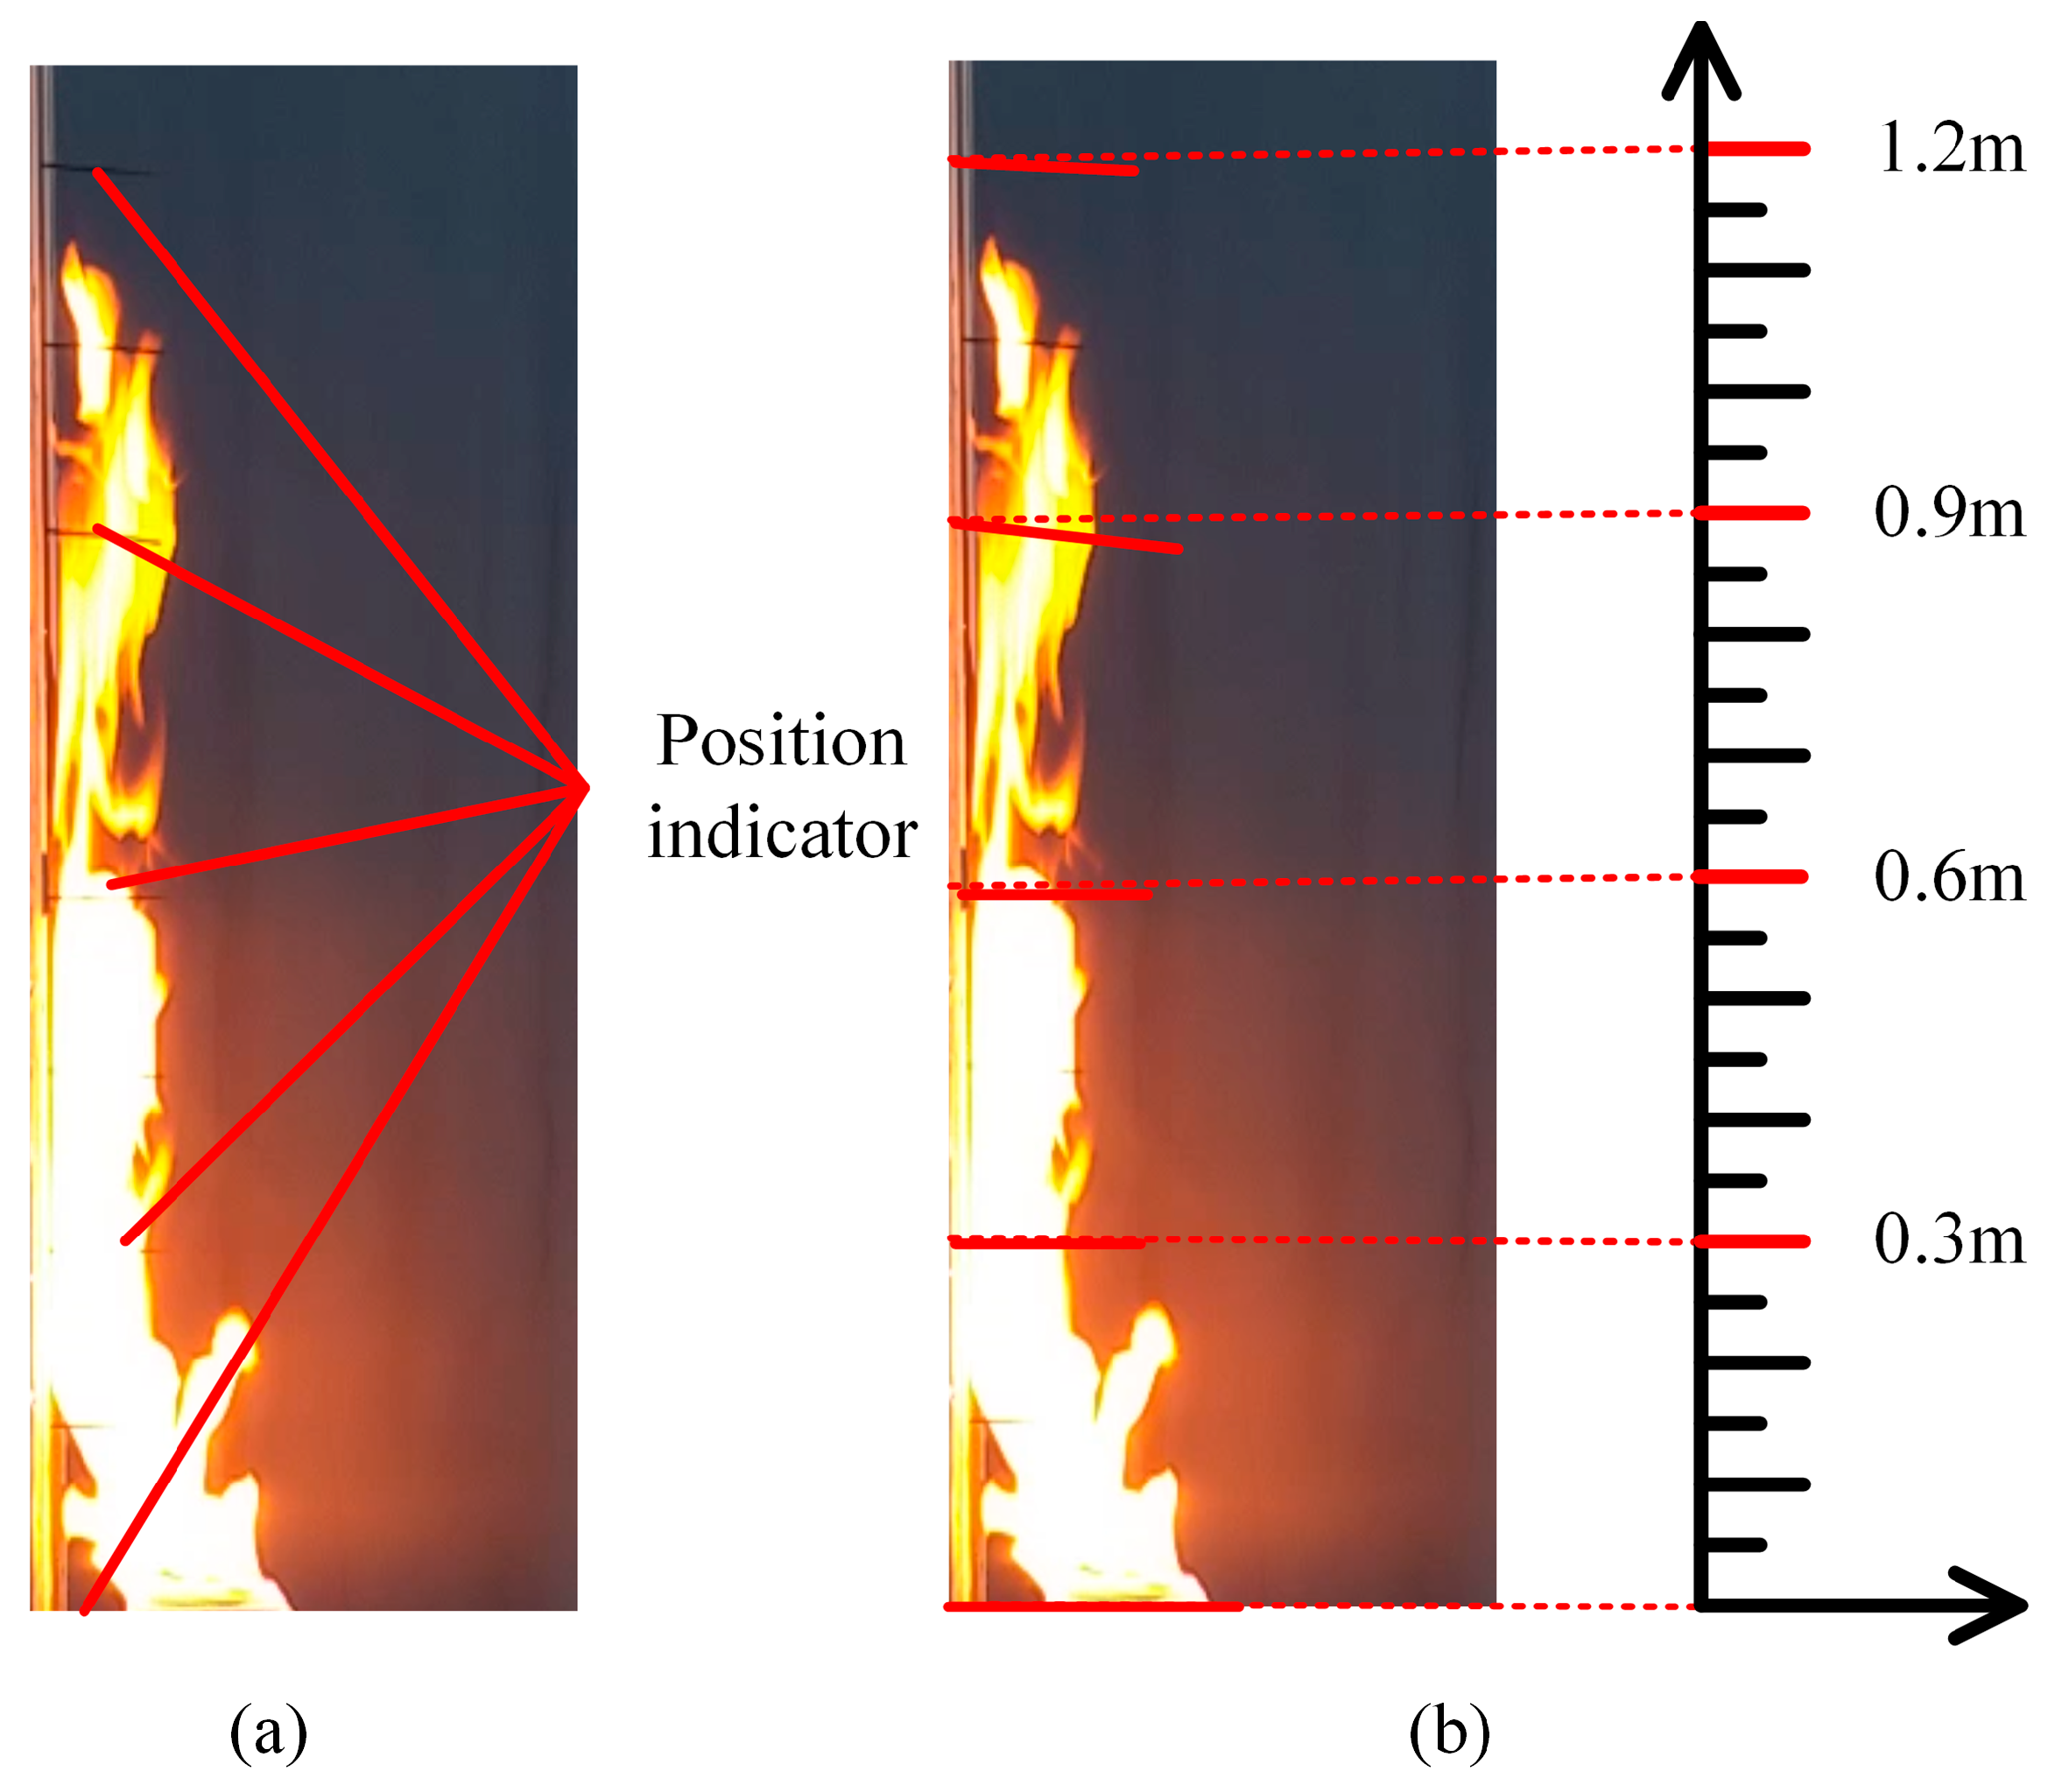
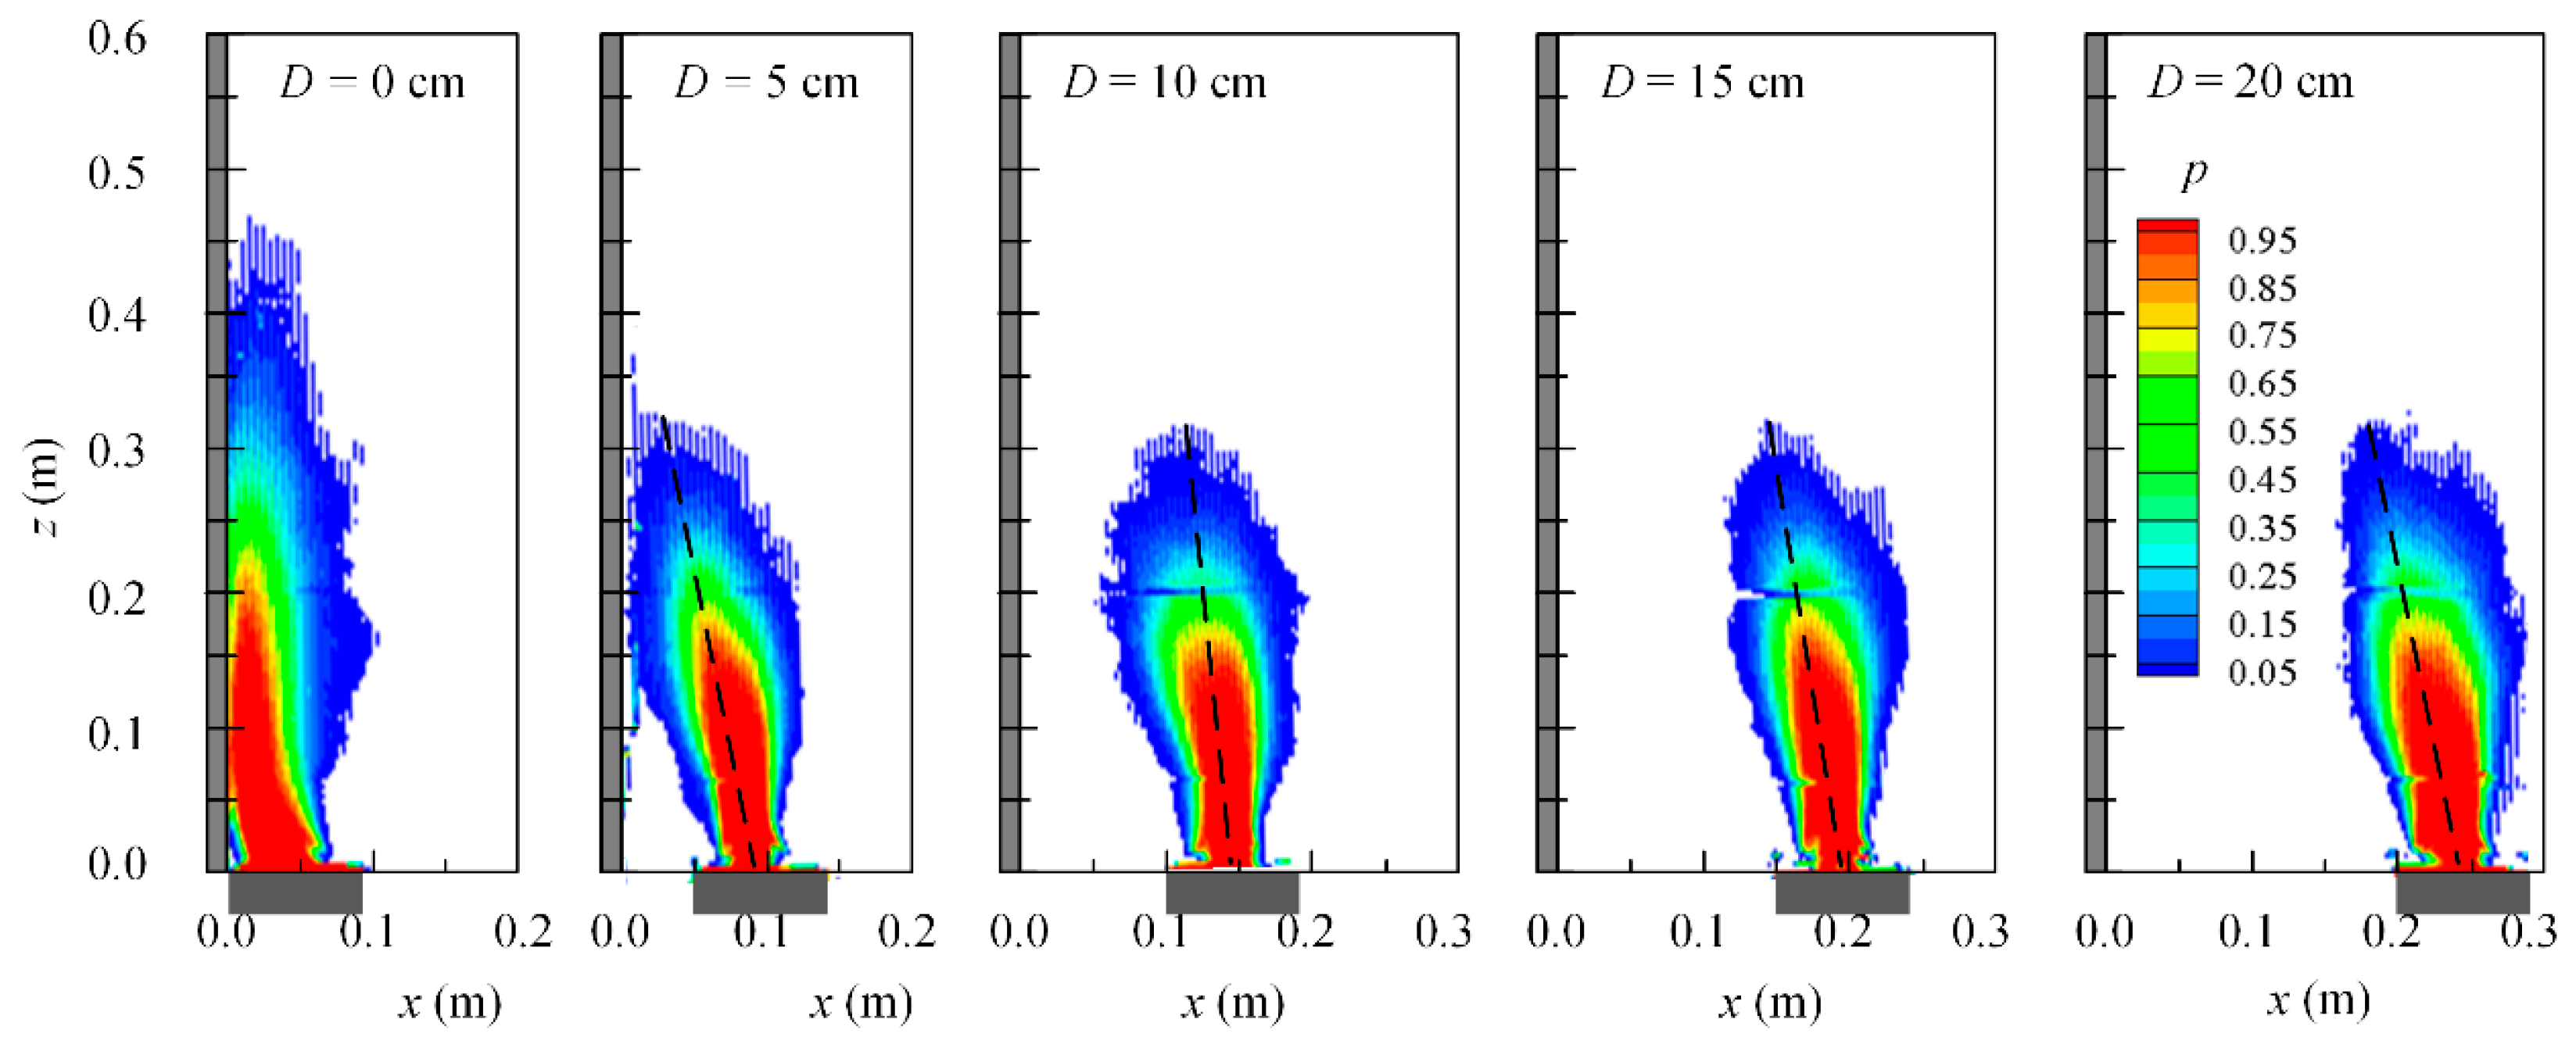
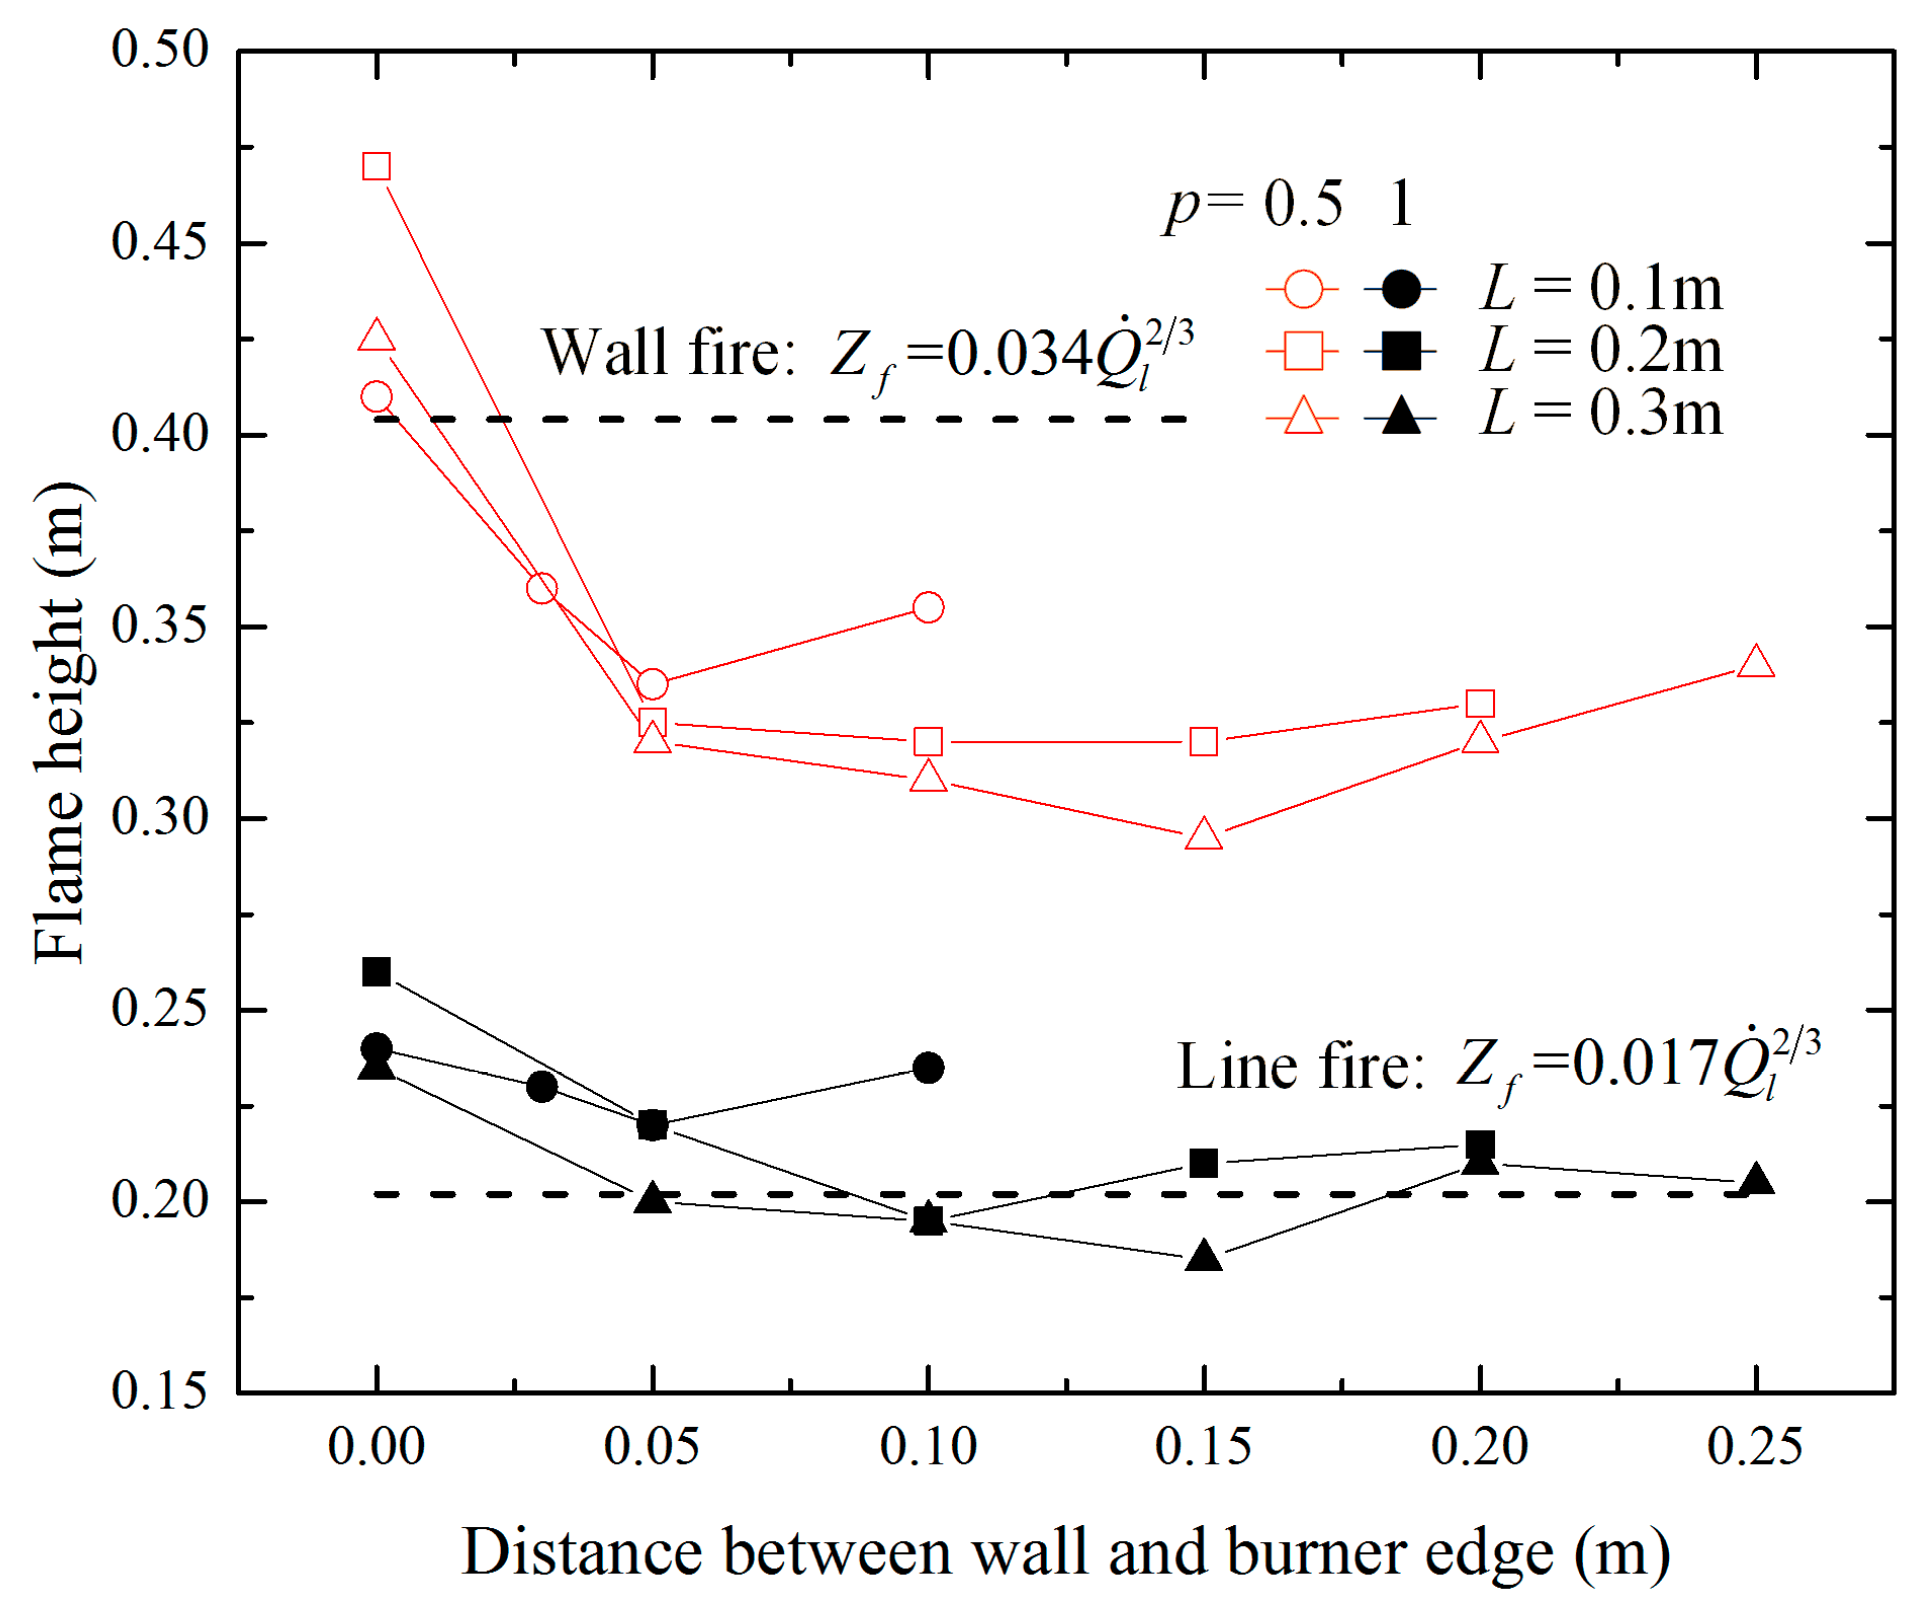
3.1. Flame Shape and Flame Height Obtained in Experiments

Video records were analyzed using the open source C++ library OpenCV. Data in the green channel were selected to minimize disturbance due to lens flare, and the OTSU [35] method was applied to obtain the threshold value in each frame. To correct the distortion, a relatively simple method was adopted in the present work. Four iron bars were placed with fixed vertical intervals and served as position indicators, as shown in Figure 9. The ticks between two adjacent position indicators were assumed evenly distributed. In each case, 500 frames (around 17 s) were counted.
A flame occurrence probability map of experiments in group A2 is shown in Figure 10. The flame height obtained in group A is shown in Figure 11. The two horizontal dash lines represent the calculated flame height of wall fire (the upper line) and line fire (the lower line) [36]. The variation of flame height with D indicates that the near wall region can be divided into three regions: the first region is D < 0.05 m, where the flame height decreases rapidly when D is increased; the second region is 0.05 m < D < func(L), where the flame height continues to decrease with the increase in D but at a smaller rate; and the third region is D > func(L), where the flame height increases with the increase in D and gradually reaches the calculated flame height of line fire.

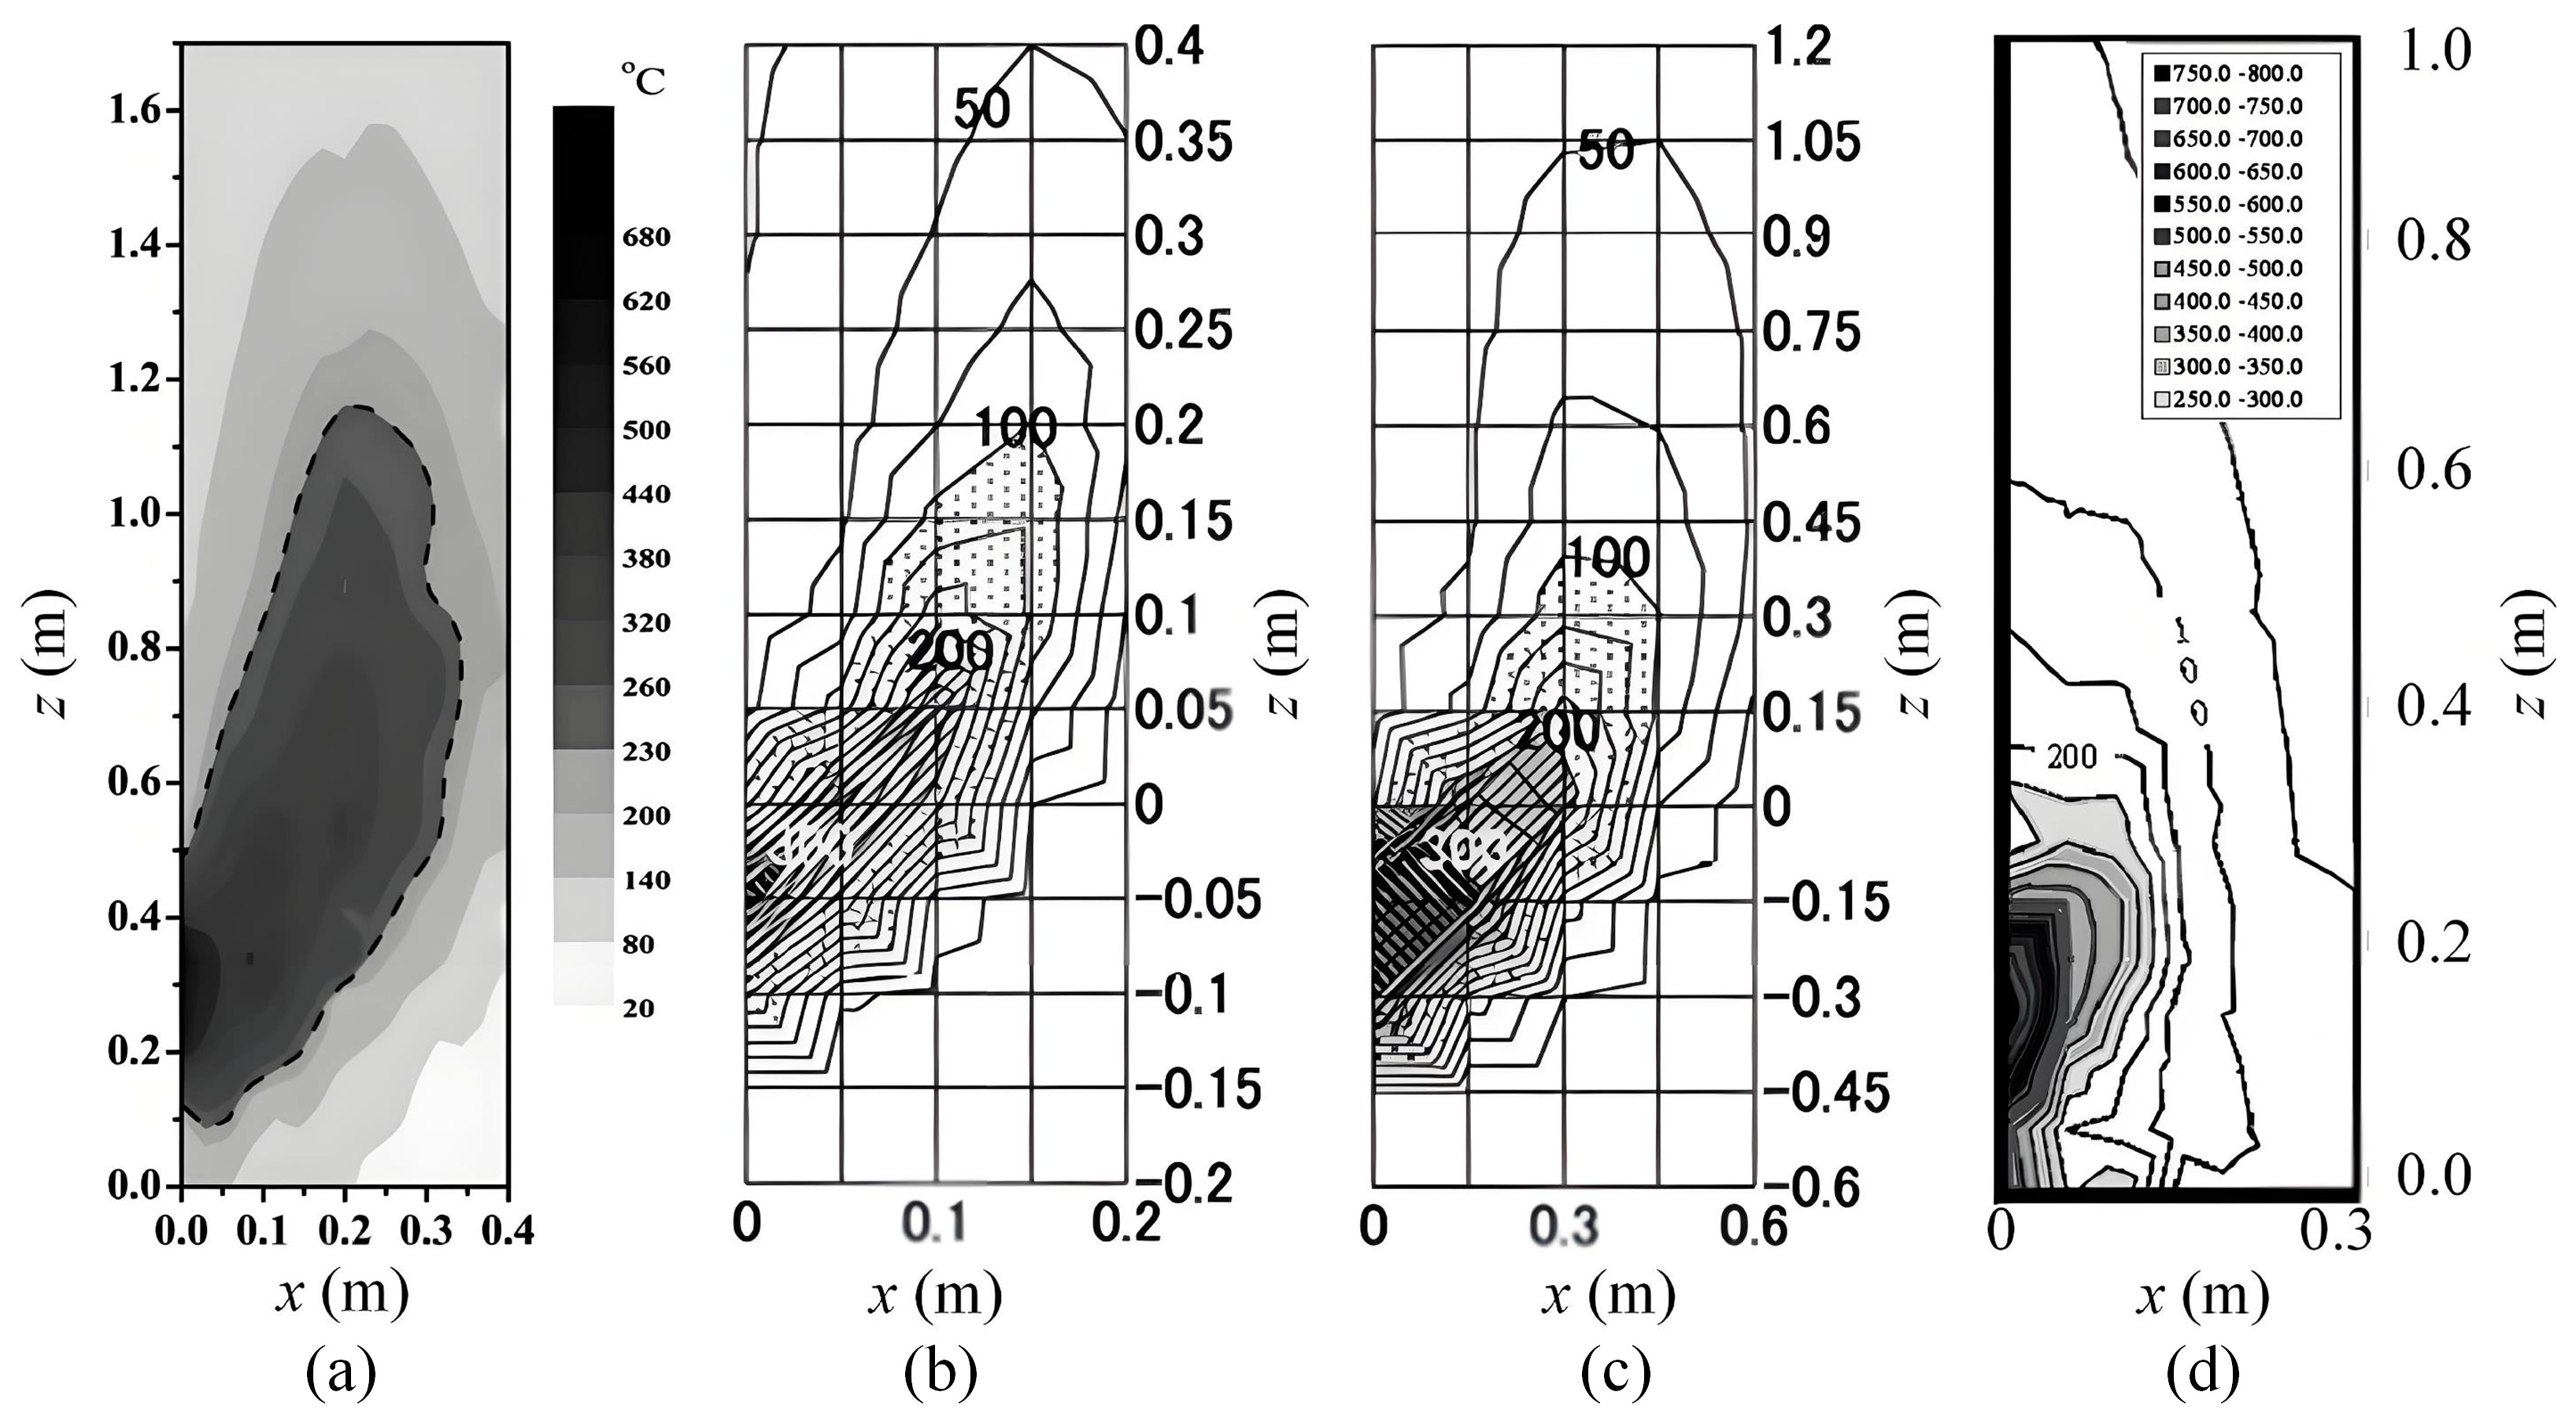
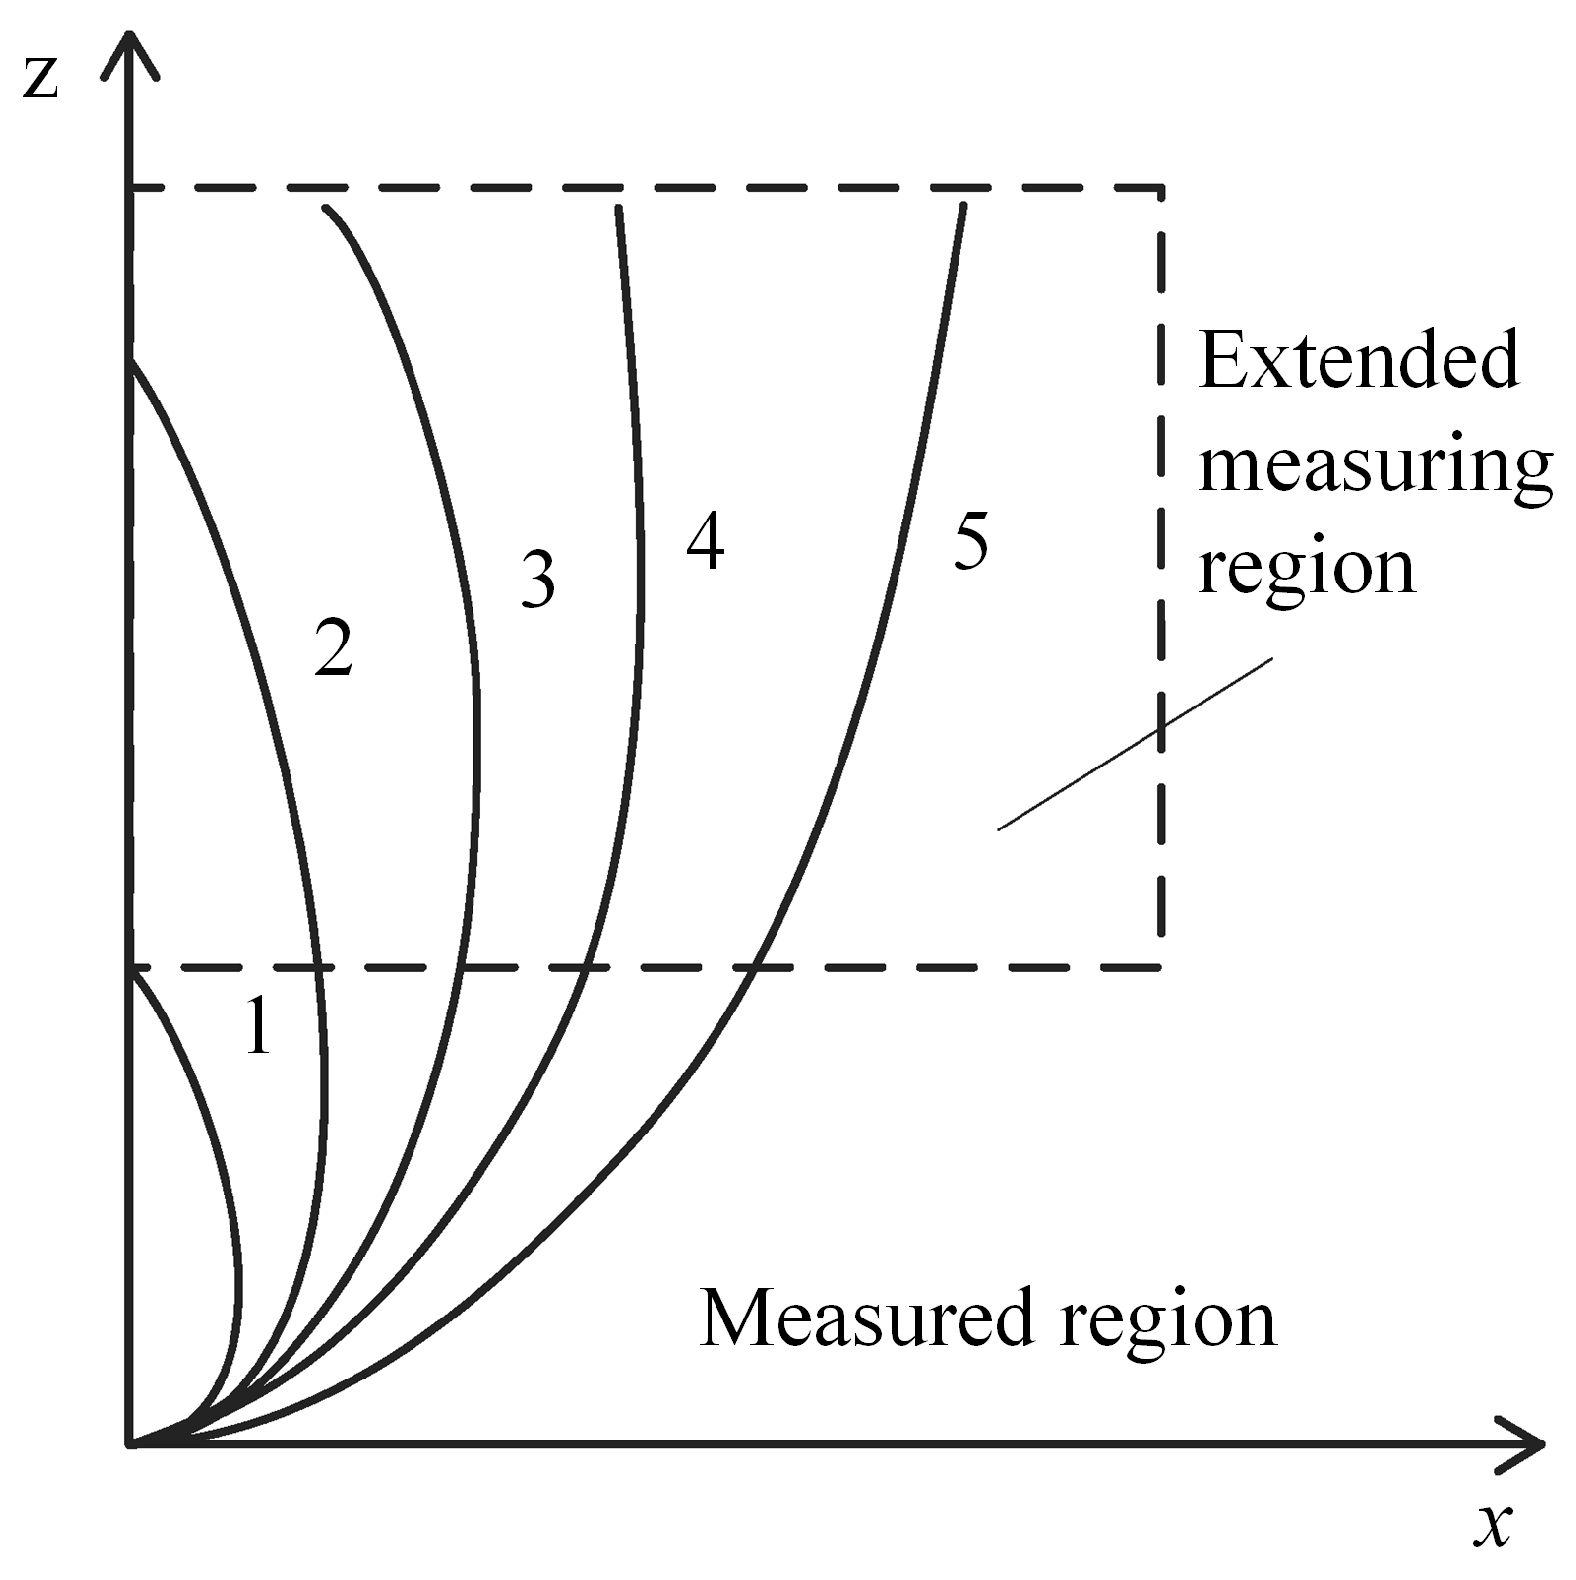
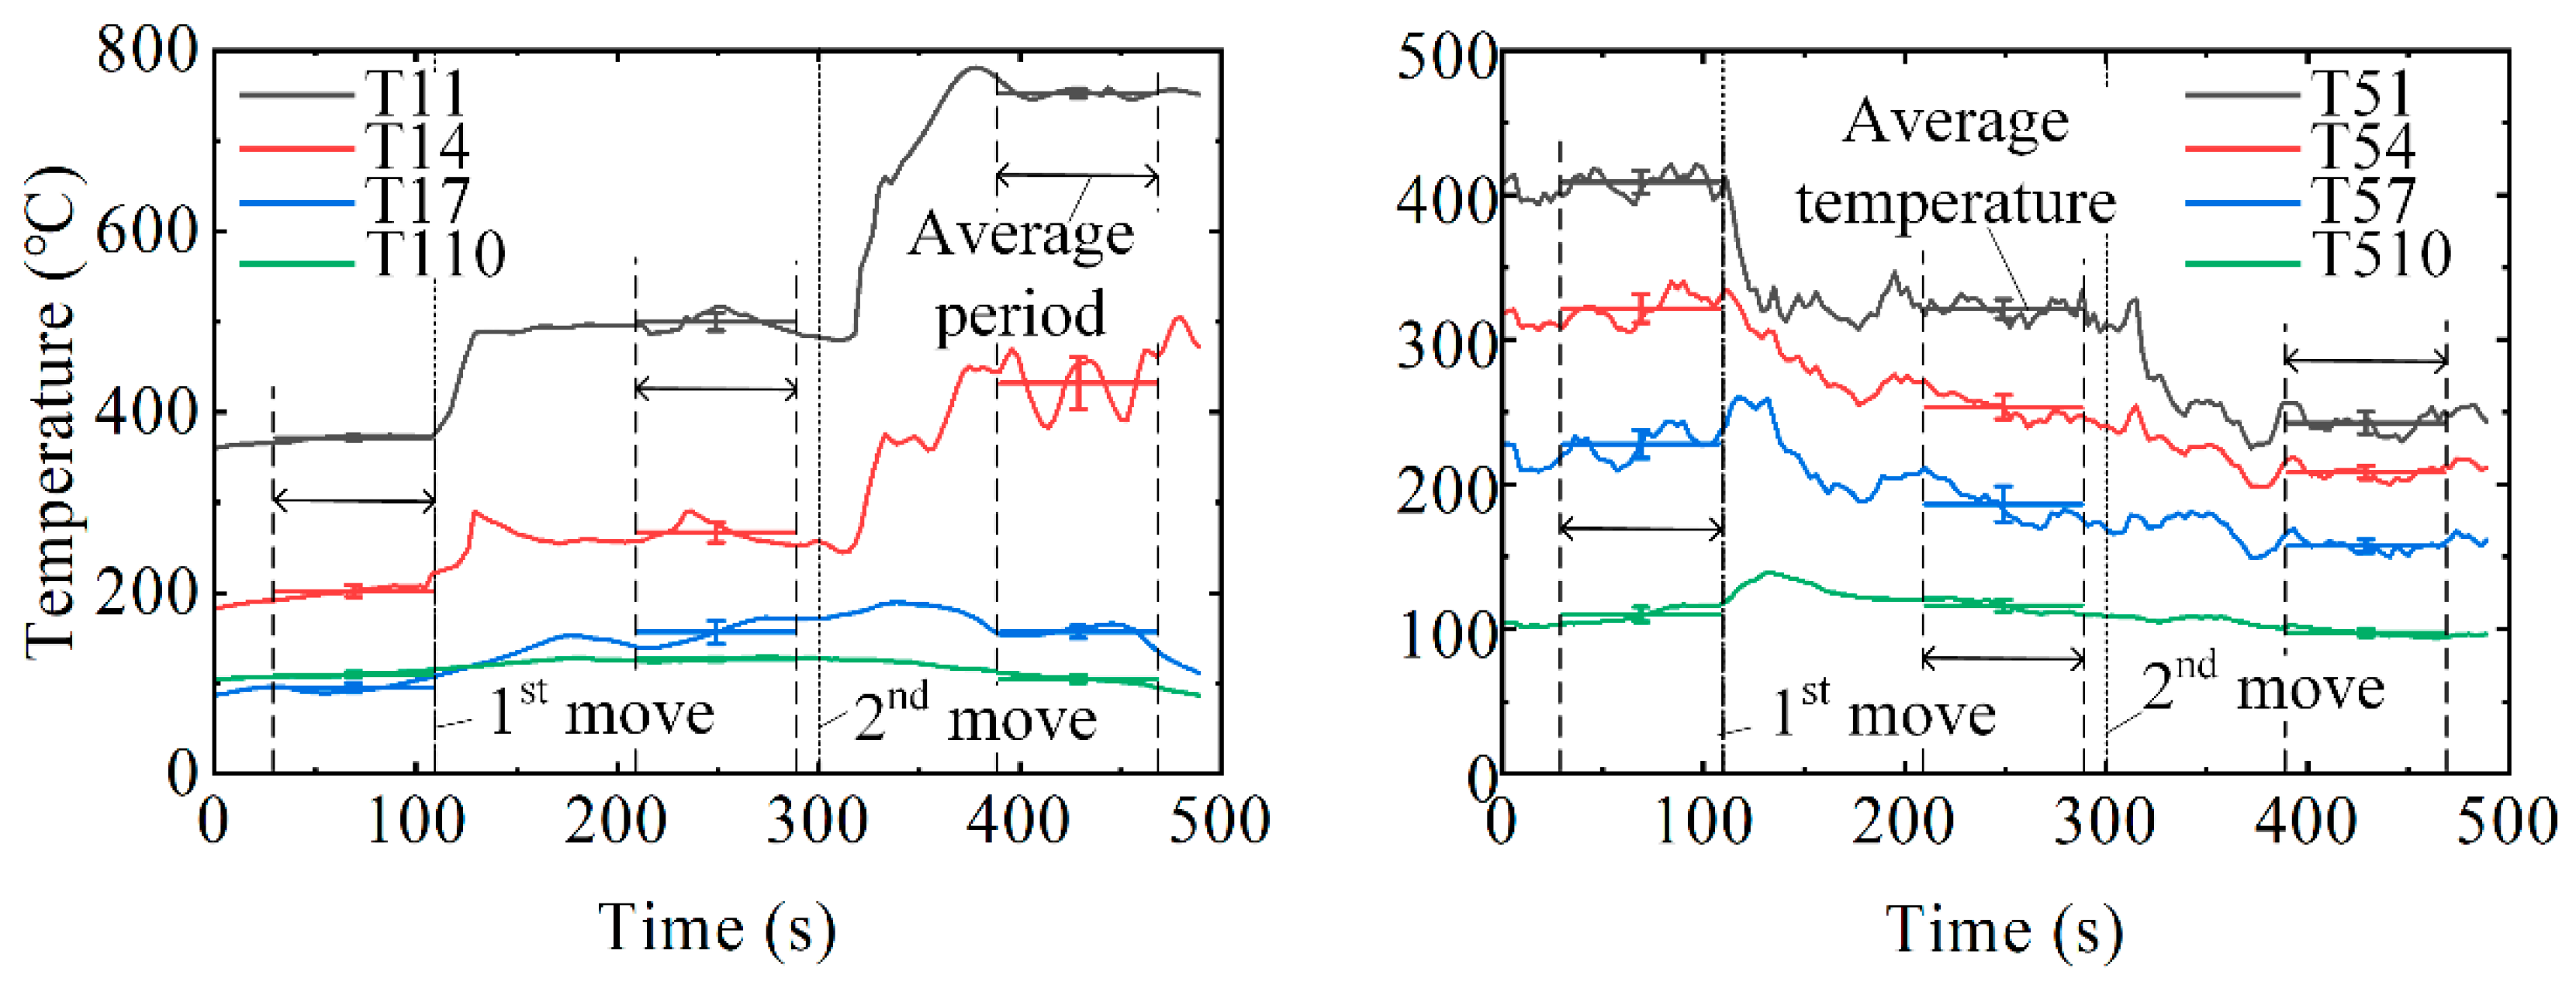
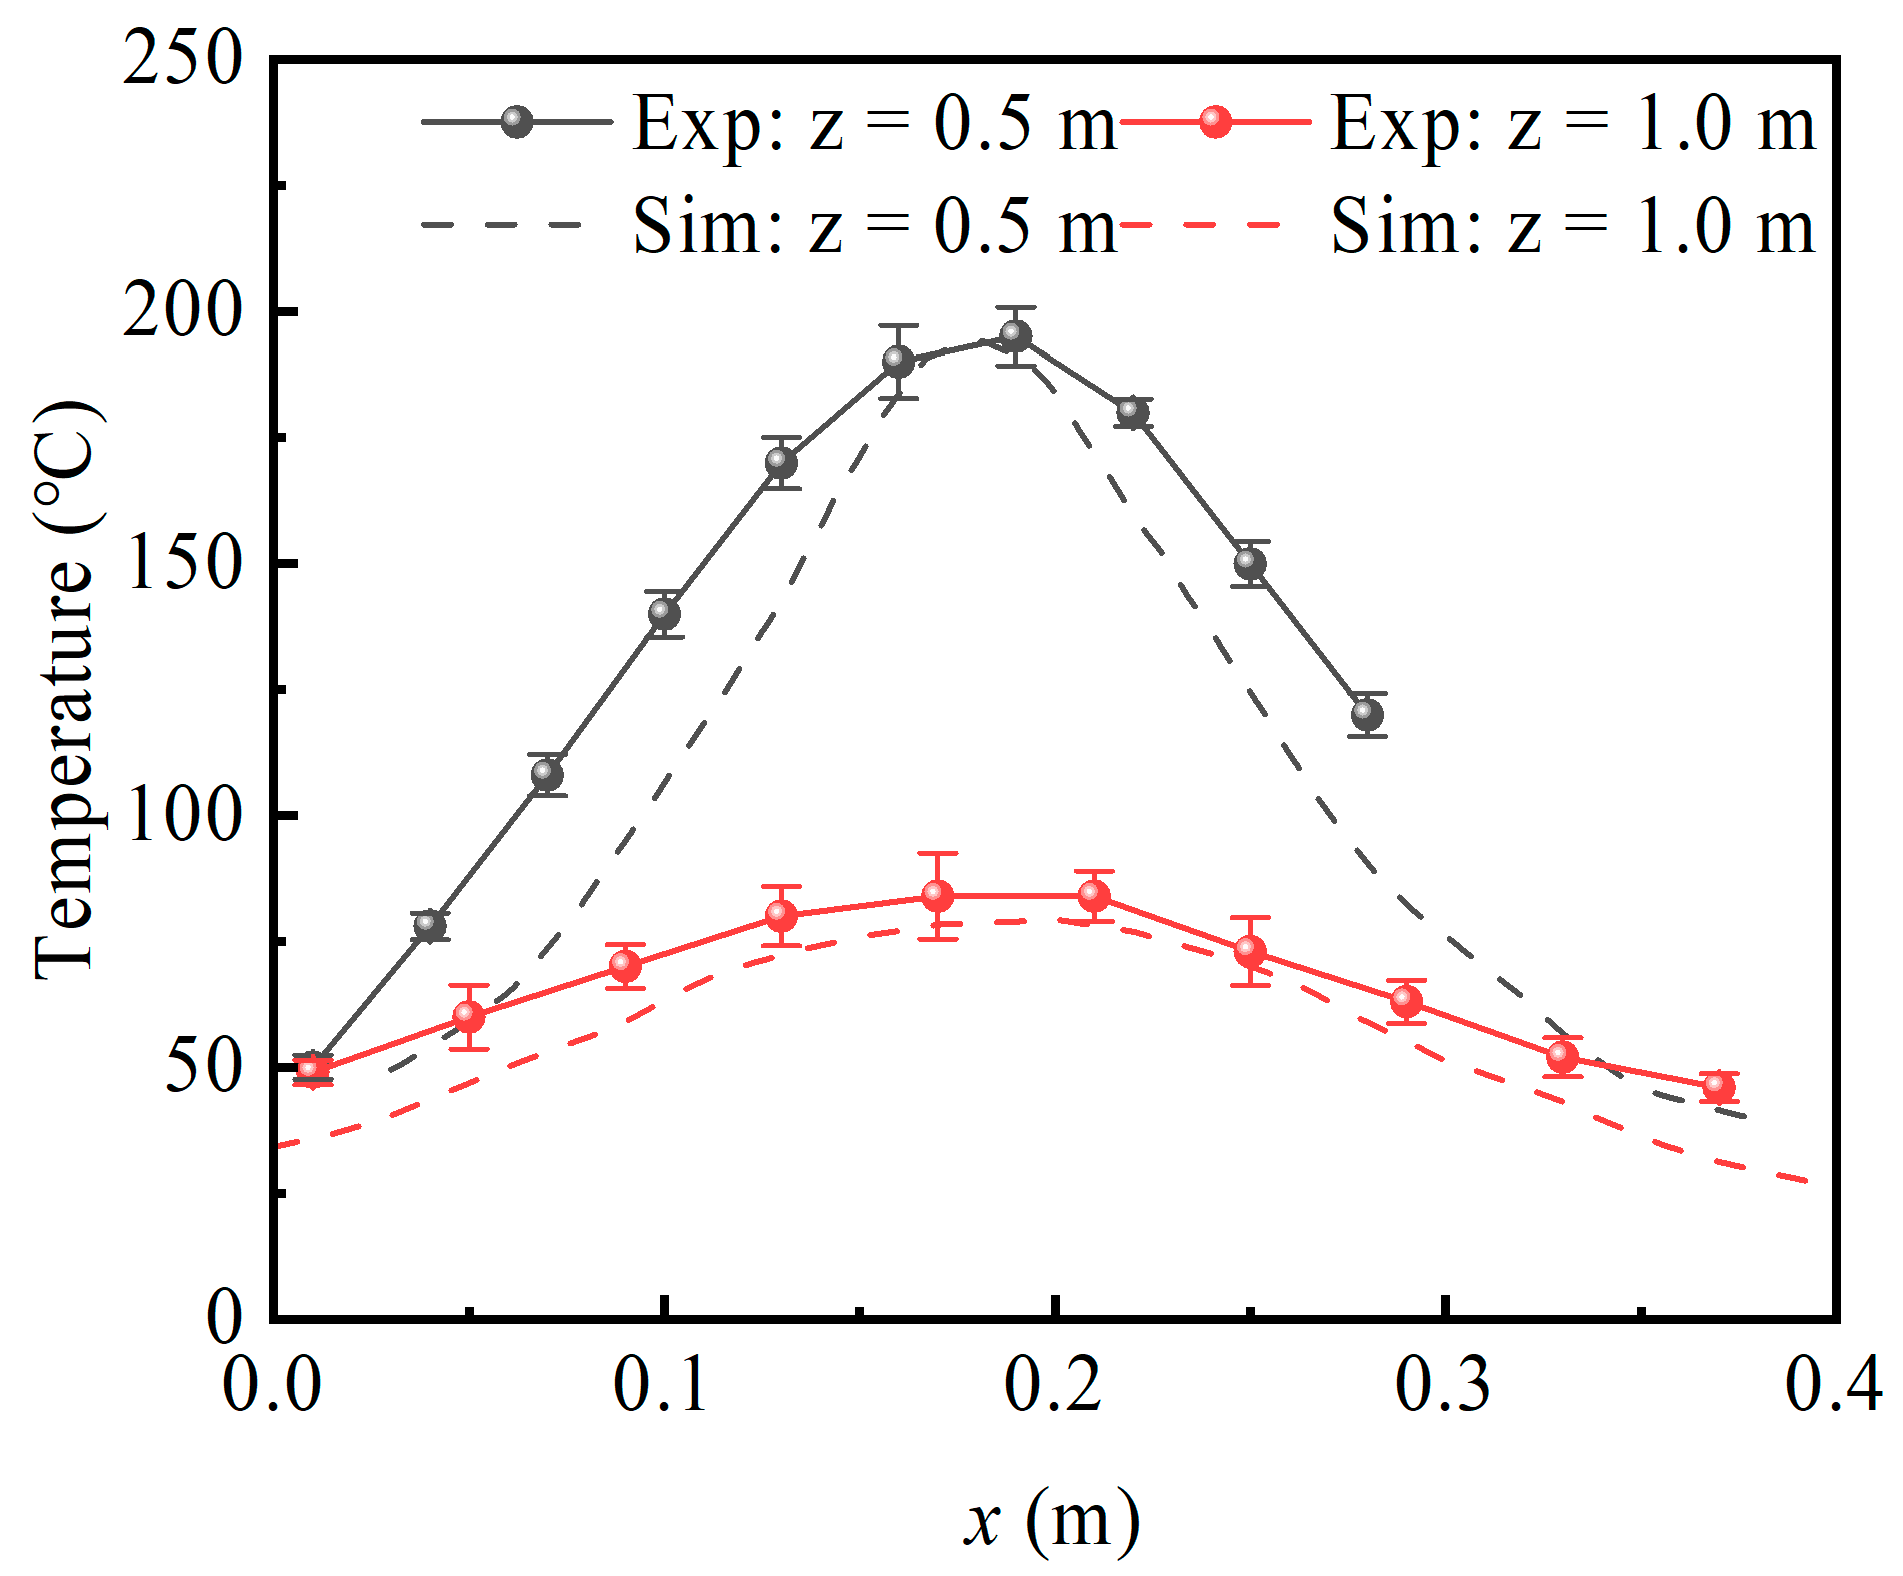
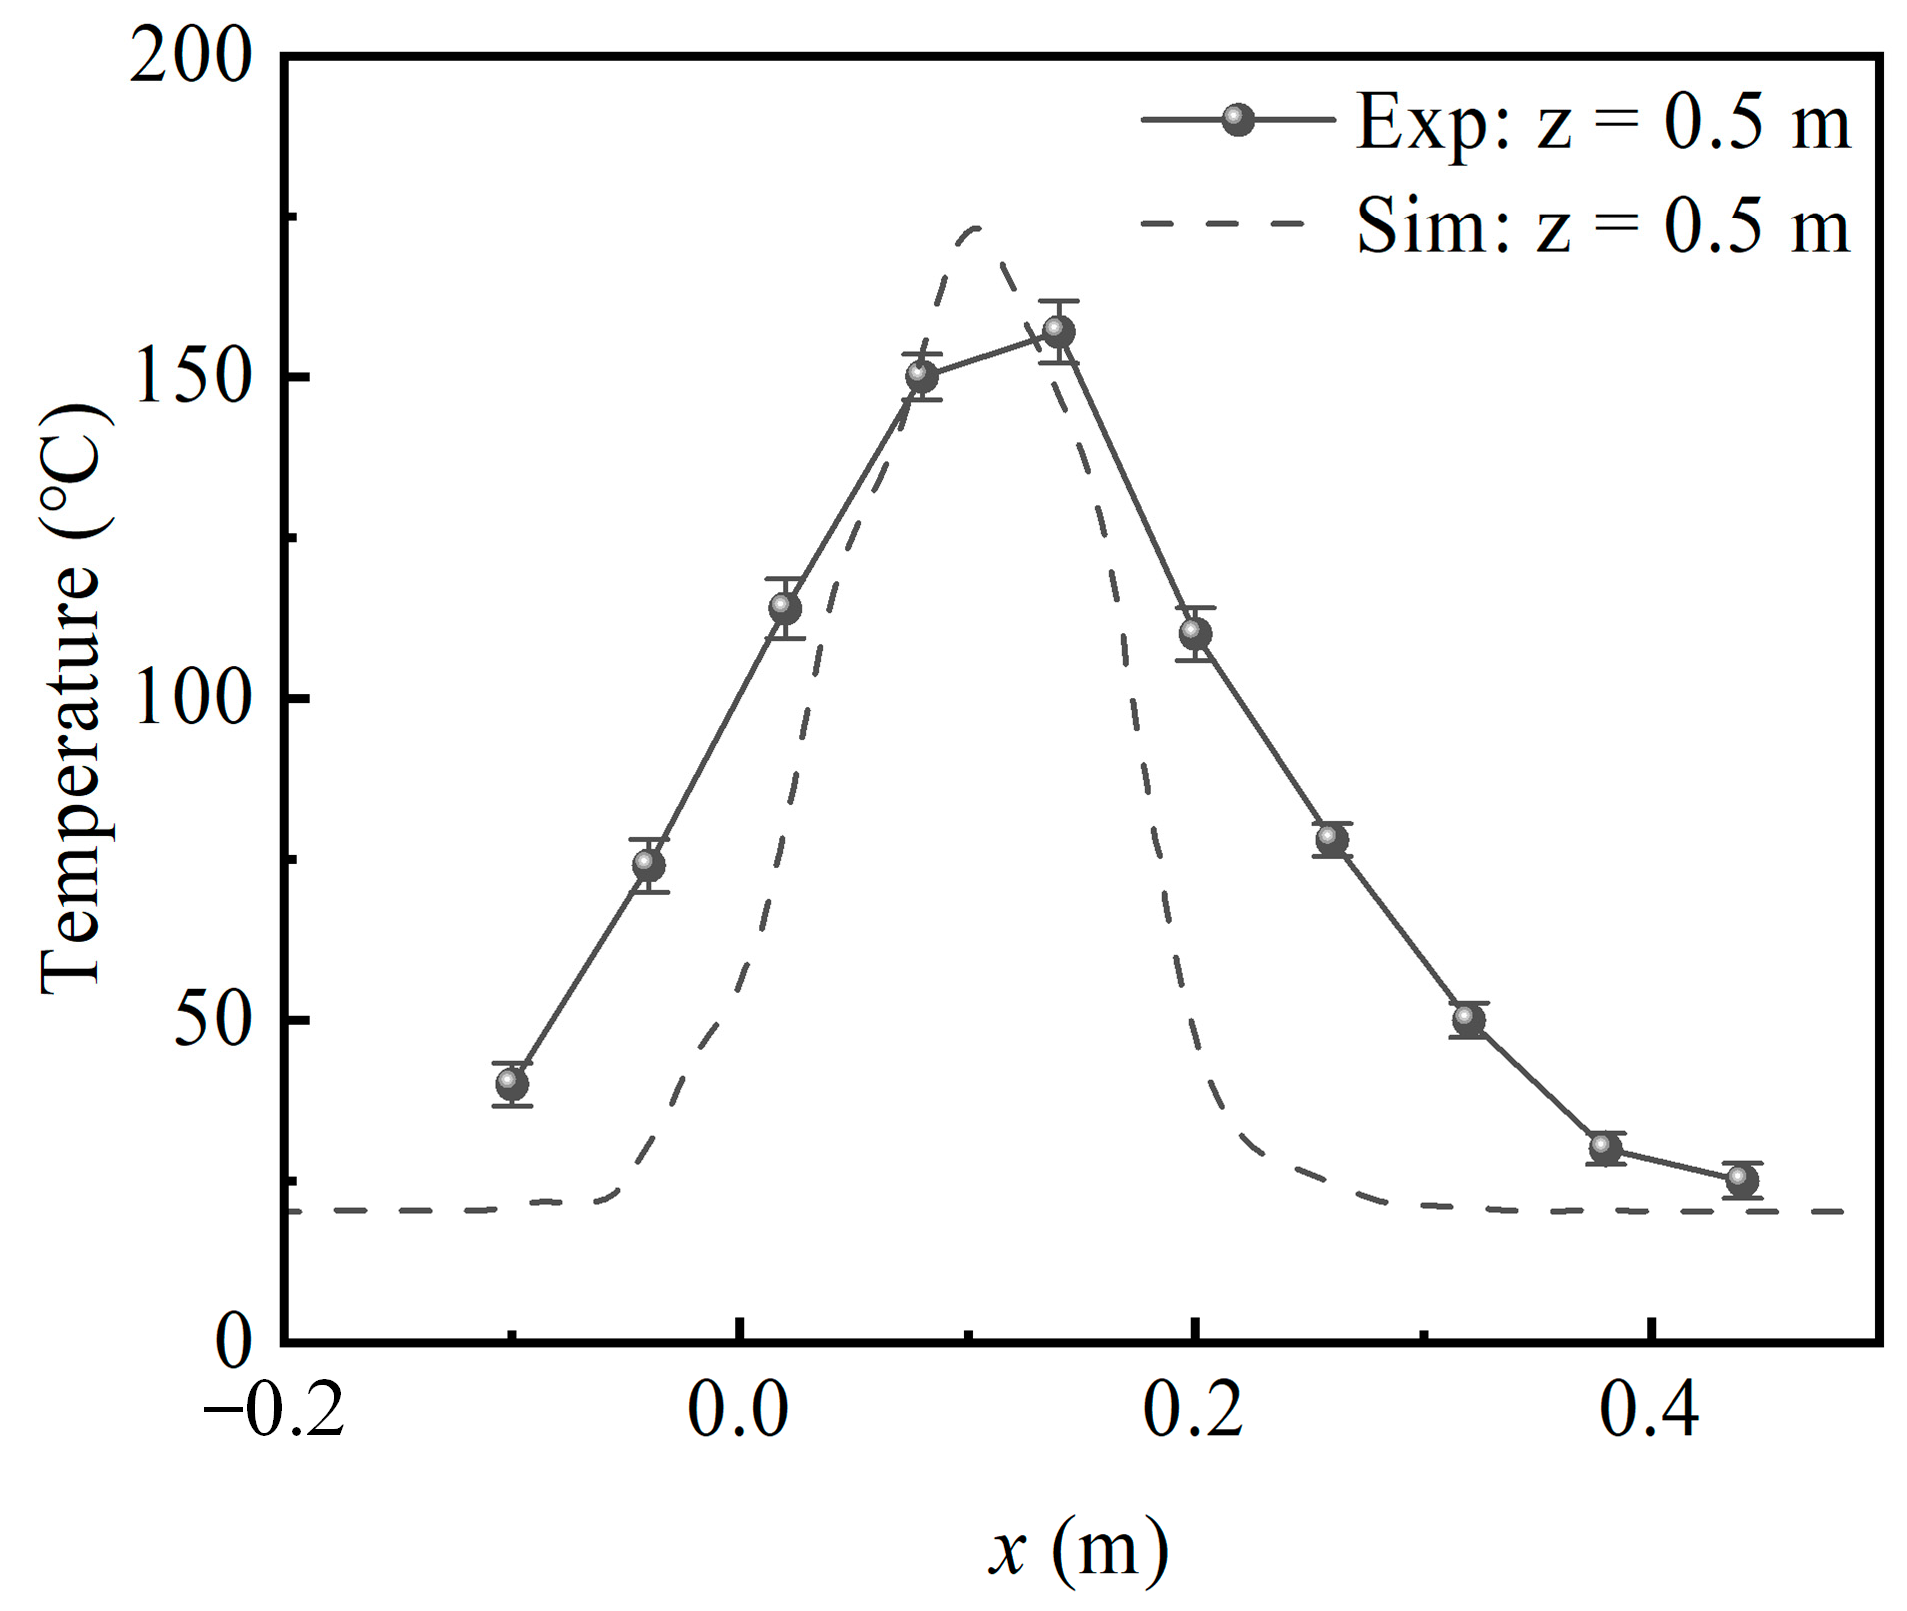
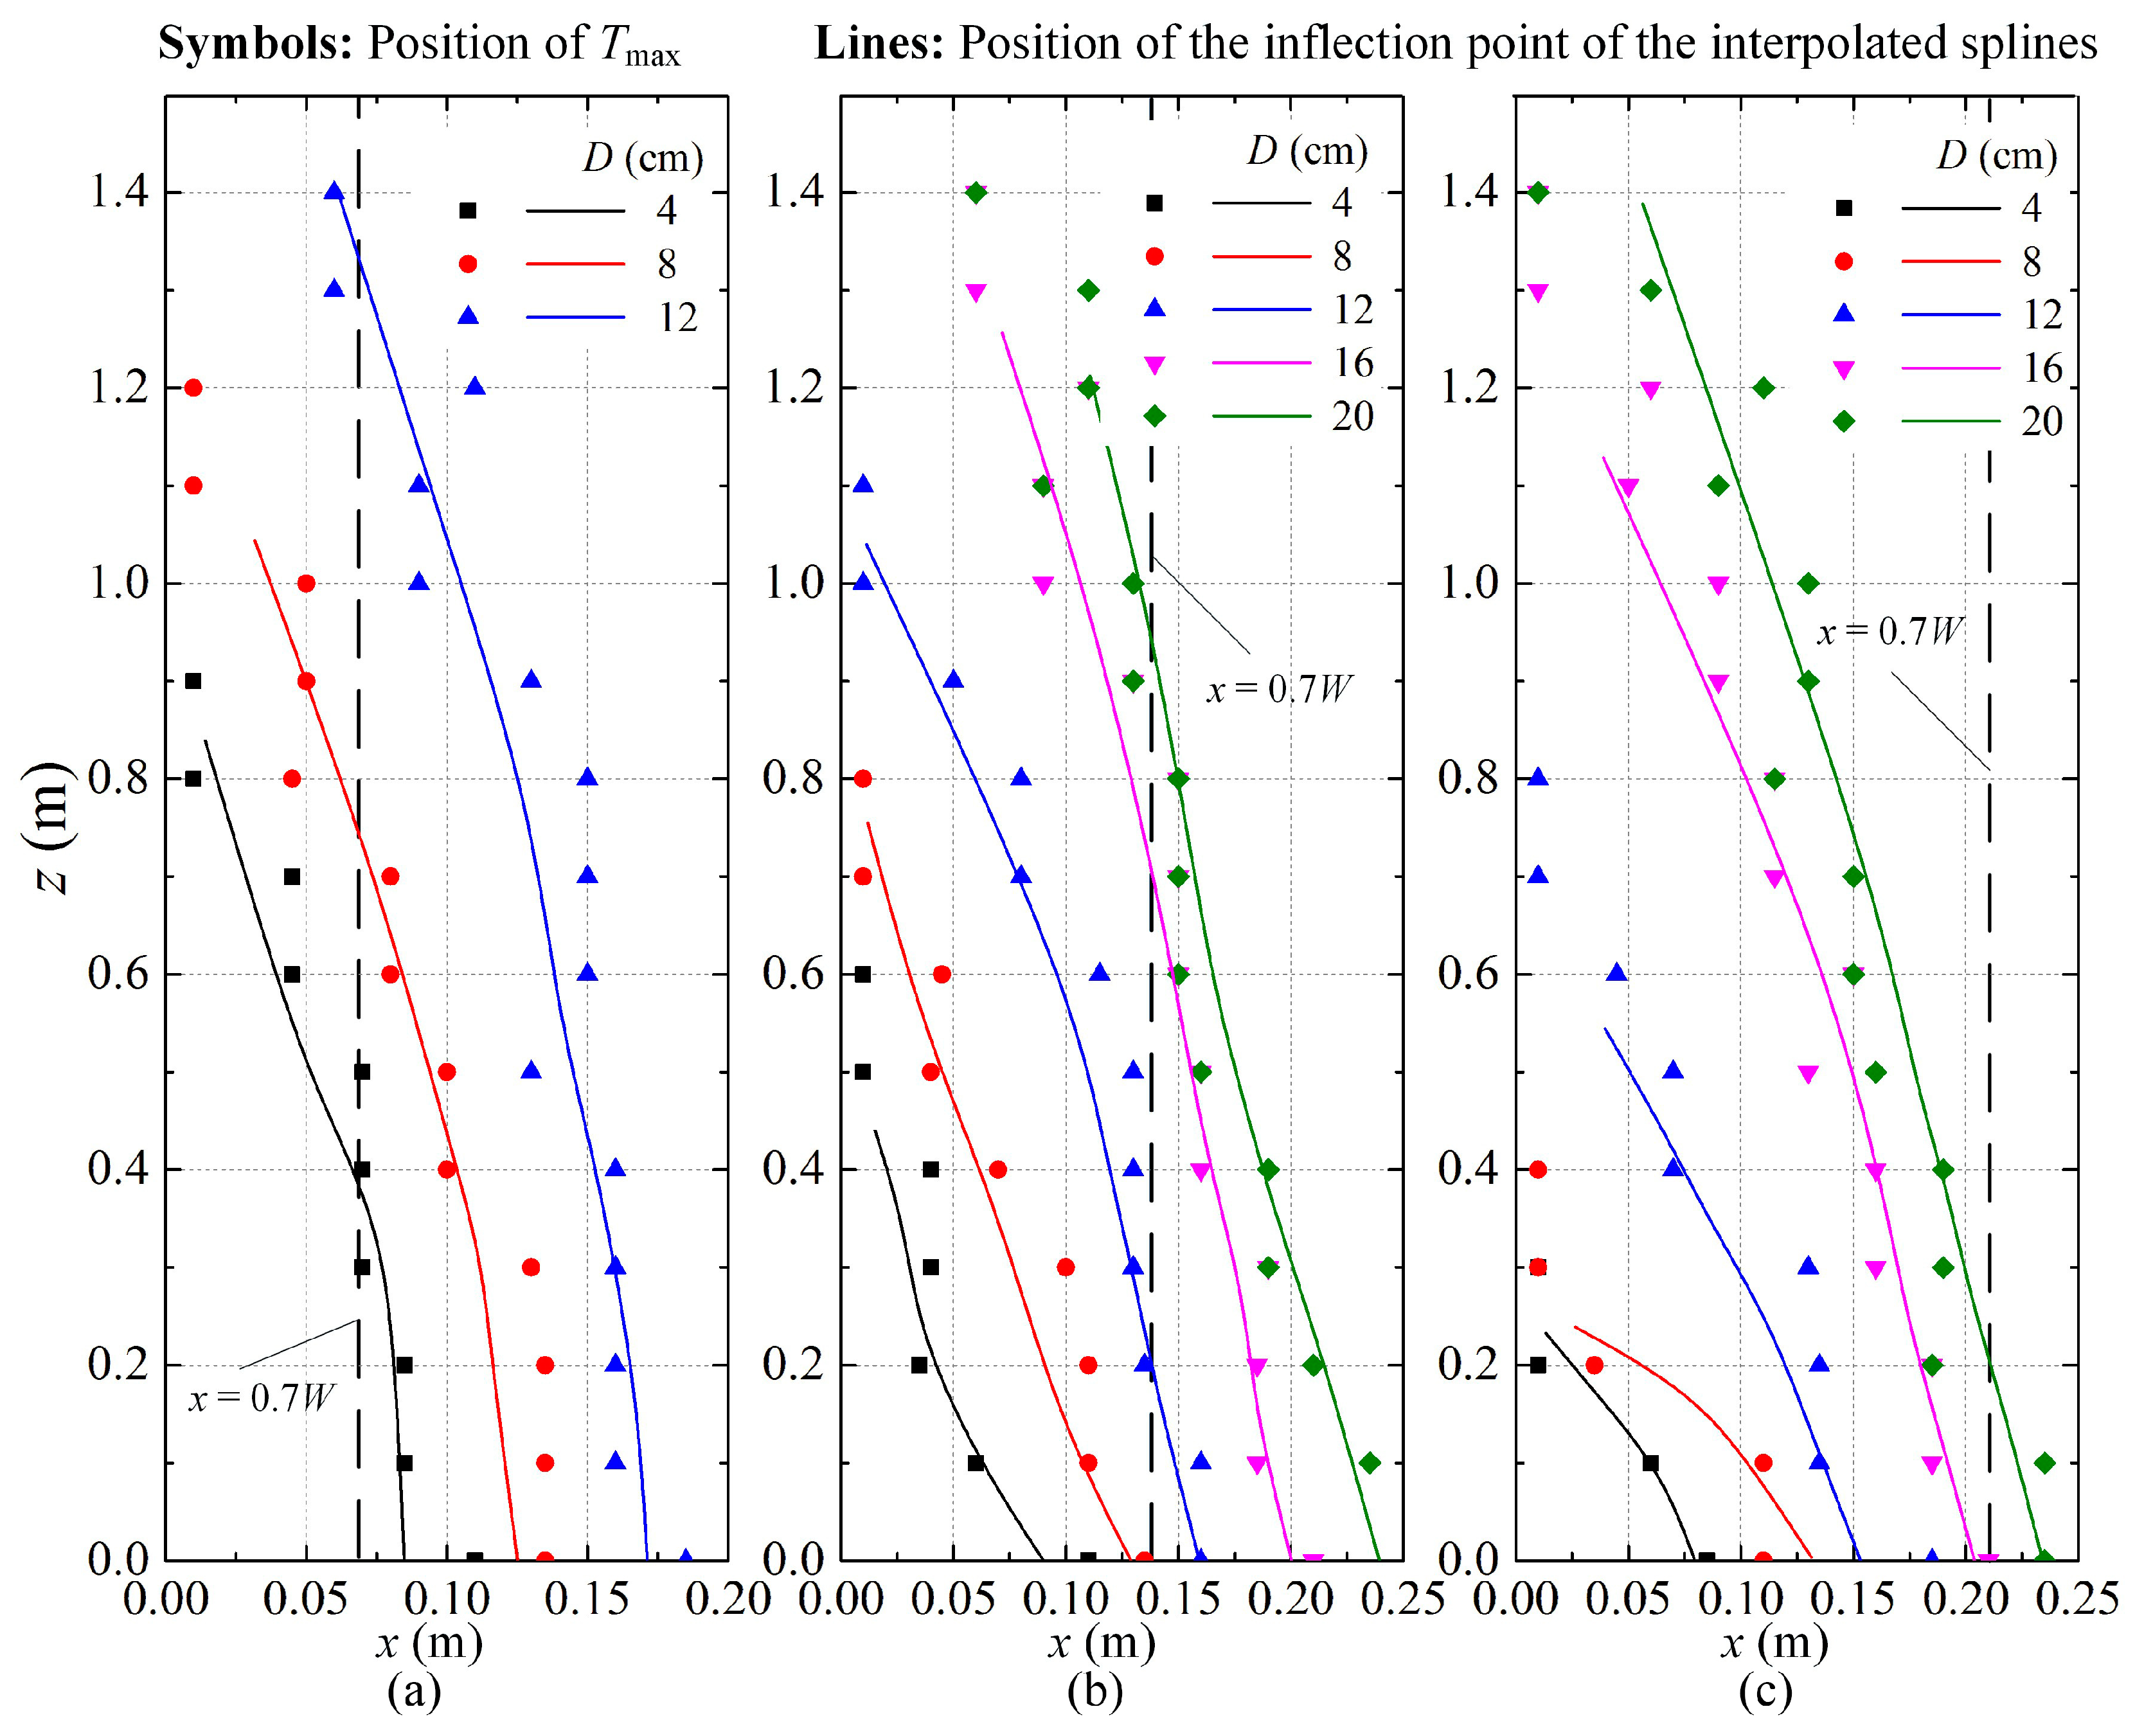
3.2. Time-Averaged Temperature Profile and Plume Trajectory

Time-averaged temperature profiles of experiments in group B2 are shown in Figure 12. Obviously, all the plumes incline to the wall.
Plume trajectories of experiments in group B are summarized in Figure 13. The symbols represent the positions of the thermocouple that recorded the highest temperature in each tree. The lines were obtained by doing spline interpolation on the temperature data of each TC tree, and the horizontal position of the inflection point was taken as its horizontal position at a given height.
Surprisingly, all the plume trajectories inclined to the wall. When the three burners were installed at the same distance from the wall, the plumes originating from longer burners approached the wall more rapidly and attached to the wall at lower positions. The results indicated that the distance between the wall and the plume and the length of the plume cross-section both affected the plume trajectory, which agree with Yokoi [1] and Himoto et al. [3]. However, there were some discrepancies between the experimental results and the two criteria as will be discussed in the following section.

3.3. A Discussion on the Criteria for Evaluating Plume Attachment

To make a comparison between the ejected plumes and the simulated plumes with burner fires, the following assumptions are made: Wejected plume = Wburner = Wopening; Lejected plume = Lburner = 0.5Hopening; the distance between the wall and the burner center (LE. burner fire) is equal to LE. ejected plume.
Yokoi [1] concluded that, when the value of WH was larger than 1.25, the plume should attach to the wall; otherwise, the plume departs from the wall. Thus, the ejected plume should depart from the wall when the opening geometry is 0.1 × 0.2 m.
However, the plumes originating from the square propane burner (0.1 × 0.1 m) all attached to the wall, even in the case of D = 0.12 m where LE. burner fire > LE. ejected plume (referring to the results in Figure 1b, LE. ejected plume ≈ 0.15 m).
Himoto et al. [3] showed that the ejected plume should attach to the wall when LE/W < 0.7; otherwise, the plume departs from the wall. The dash lines in Figure 13 represent LE/W = 0.7. Results in Figure 13 show that the plume originating from propane burners can attach to the wall when LE/W > 0.7.
The results contradict the criteria proposed by Yokoi and Himoto et al. Considering that the burner fire can attach to the wall when LE. burner fire > LE. ejected plume, there might be some other factors affecting the plume attachment. Thus, we must review how the criteria were established. It was found that both the two criteria were based on the observations in reduced-scale compartment fires. In addition to the opening geometry, the criterion proposed by Himoto et al. indicates that HRR should also affect the ejected plume trajectory: Himoto et al. found that LE = 0.21F*, where F * is another dimensionless parameter which is defined as
F * u 0 g W 2 Q ˙ ρ c p T g W H Z N 3 2 2 3
where u 0 is the maximum flow velocity at the opening (m/s); Q ˙ is the apparent heat release rate of the window flame (kW); Z N is the height of the neutral plane (m). Considering that u0 and (HZN) are insensitive to the increase in Q ˙ when Q ˙ > Q ˙ C , thus, LE Q ˙   2 / 3 ; in other words, ejected plumes approach closer to the wall when HRR is increased. The introduction of Q ˙ into the calculation of LE by Himoto et al. greatly improved the accuracy of the prediction of plume attachment. However, the shortcoming of this criterion is also related to LE: the criterion relies too heavily on LE. To understand the excessive dependence on LE, we may consider the fire scenarios where the ejected flame is large enough to cover the equilibrium point (large fire scenarios). Large fire scenarios are defined as cases where the continuous flame region extends beyond the equilibrium point (LE), resulting in HRR-dependent induced pressure differences.
Under the aforementioned conditions, temperature along the plume trajectory is approximately constant from the venting point to the equilibrium and should be insensitive to the increase in HRR; that is to say, the plume trajectory between the venting point and the equilibrium is unchanged when we further increase HRR. Thus, the equation, LE = 0.21F*, is thought to be invalid in large fires. Based on the analysis, we may conclude that Yokoi’s criterion only considers the effect of opening geometry and does not include the influence of HRR; Himoto’s criterion introduces the influence of HRR but is valid only in small fire scenarios where the continuous flame region does not surpass the equilibrium point.
Now we understand the shortcomings of these two criteria, and next we turn to find the reason for the discrepancies. It is easy to understand that the determining factor of plume attachment is the induced pressure difference: whether or not it is large enough to “push” the plume towar the wall. As suggested by Himoto et al., the induced pressure difference Δ p can be estimated as
Δ p 1 2 ρ α u m 2 ( 1 1 + 2 x / W 2 )
Based on Equation (3), in addition to the distance between the wall and the plume trajectory (x) and the width of the plume cross-section (W, the edge parallel to the wall), the plume trajectory velocity (um) also affects the induced pressure difference.
Once again, we consider large fire scenarios. Readers should notice that the burner fires introduced in this chapter simulate these large fire scenarios, i.e., the flame exists above the equilibrium point. Under such conditions, although x and W at the equilibrium point do not change with the increase in HRR, um should become larger because the high-temperature region is elongated (longer flame height) which then leads to larger buoyancy. Thus, the induced pressure difference becomes larger when the HRR is further increased, and it makes it possible that the burner fires attach to the wall when LE. burner fire > 0.7W.
Now we can explain the discrepancy: as the criteria proposed by Yokoi and Himoto et al. are based on observations in small fire scenarios, the estimated effect of the induced pressure difference is lower, especially in large fire scenarios.

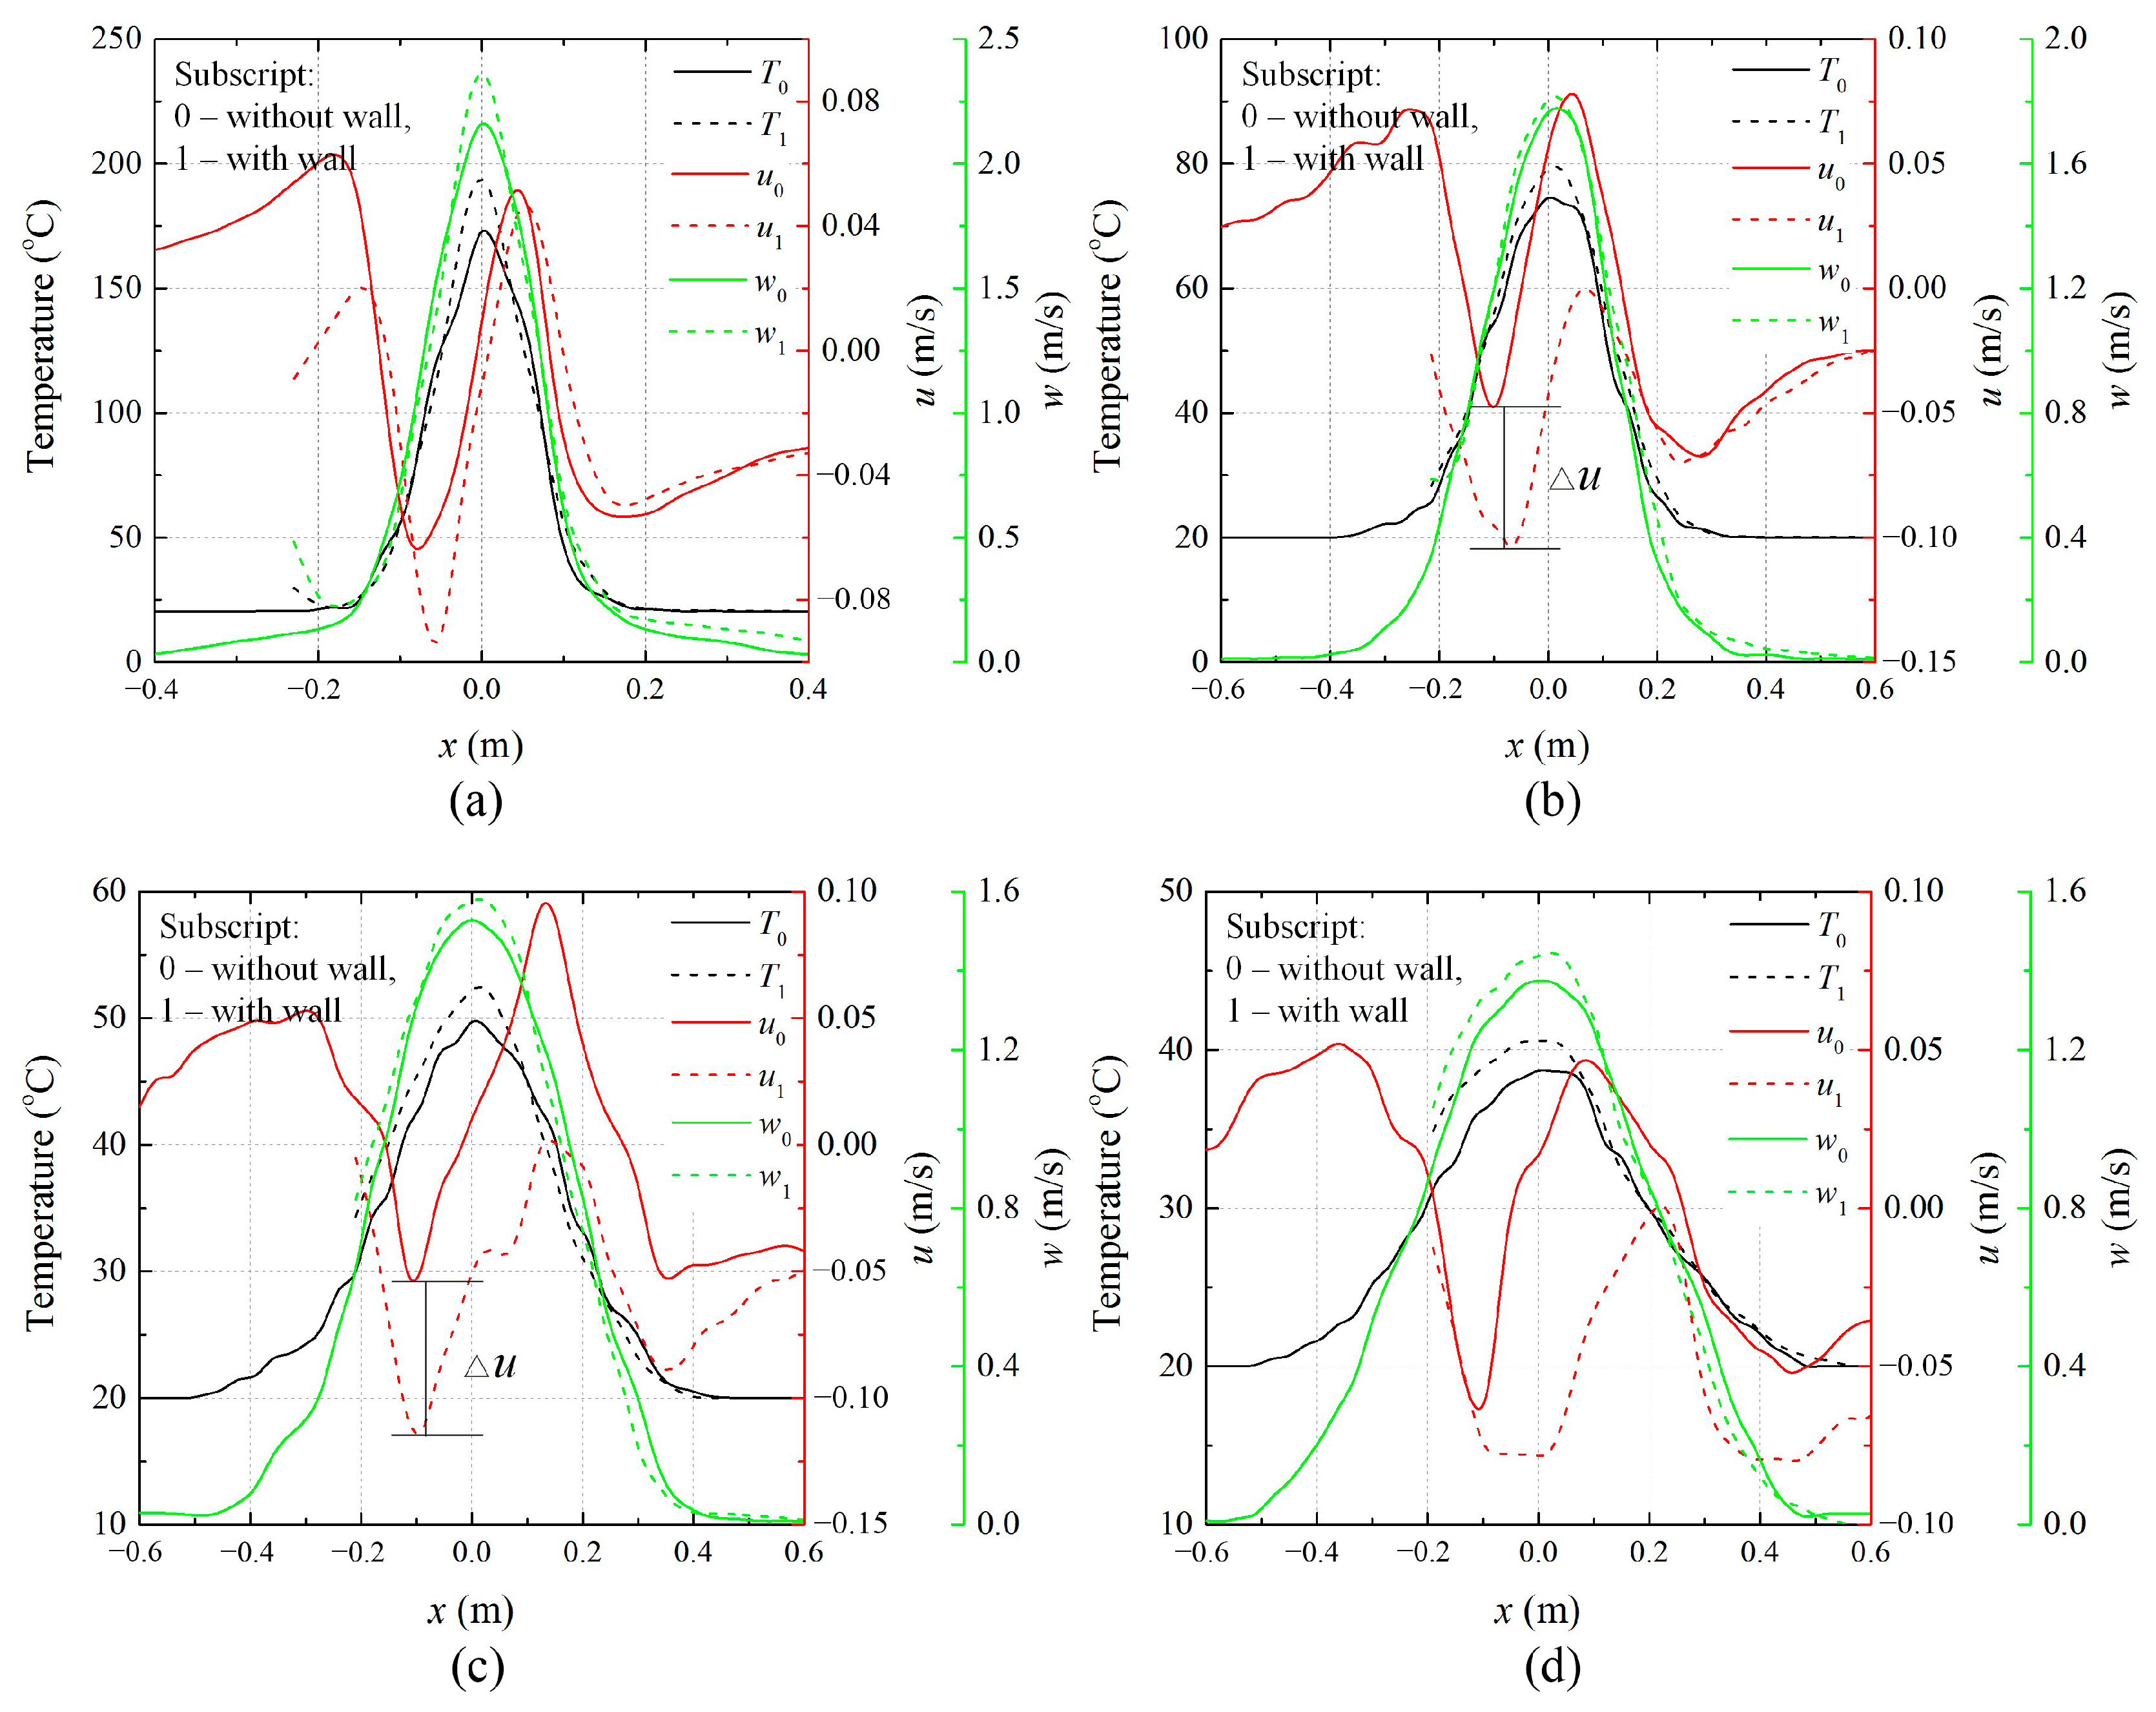
3.4. Velocity Generated by the Induced Pressure Difference

To gain a deeper understanding of the induced pressure difference and the induced horizontal velocity, numerical simulations were conducted with FDS6, and the results are shown in Figure 14. The temperature profiles, u-velocity profiles, and w-velocity profiles were aligned at the plume trajectory with reference to the temperature distribution. The results show that the temperature, u-velocity, and w-velocity (the velocity of the cross-sectional area at the selected height) followed a similar distribution law, both with and without the wall; the magnitudes of the peak temperature and peak w-velocity were slightly affected by the wall, while the magnitudes of the u-velocity changed greatly in these two cases. The results indicate that a u-velocity difference exists (labeled as Δu in Figure 14), which should be the induced horizontal velocity. The u-velocity difference appears to exist in the whole plume and is nearly uniform at a given height, indicating that the plume moves toward the wall as a whole. In other words, the induced pressure difference pushes the plume toward the wall like a rigid body.

4. Conclusions

In this study, the effects of the vertical wall on the near wall plume were studied by using a square burner fire to simulate the upper part of the ejected plumes. Both experiments and numerical simulations were carried out. The main conclusions are as follows.
  • The burner fire tilted to the wall even if LE. burner fire > 0.7W, which contradicts the existing criteria for estimating plume attachment. The reason is that the estimated effect of the induced pressure difference is lower in large fire scenarios.
  • The criterion proposed by Yokoi [1] does not include the effect of HRR. The criterion proposed by Himoto et al. [3] considers the effect of HRR but relies too heavily on LE, so that it does not suit large fire scenarios.
  • The induced pressure difference drives the plume toward the wall like a rigid body.
This study employs a square fire source, which can approximate the upper flow of an overflow fire, to conduct a decoupling investigation of multiple parameters significantly influencing the wall-hugging effect of fire overflow. While various methods have been utilized to validate the effectiveness of the square fire source as a substitute for an overflow fire, it must be emphasized that the square fire source cannot fully replicate real overflow fire scenarios. Therefore, the current conclusions are presented as qualitative descriptions. In future work, we aim to conduct further research to establish detailed criteria for evaluation.

Author Contributions

Conceptualization, L.M. and J.X.; methodology, L.M.; resources, B.Z.; data curation, J.X. and C.N.; writing—original draft preparation, J.X.; writing—review and editing, L.M.; visualization, J.X. and C.N. All authors have read and agreed to the published version of the manuscript.

Funding

This research received no external funding.

Institutional Review Board Statement

Not applicable.

Informed Consent Statement

Not applicable.

Data Availability Statement

The original contributions presented in this study are included in the article. Further inquiries can be directed to the corresponding author.

Conflicts of Interest

Author Bin Zheng was employed by the company Hainan Nuclear Power Co., Ltd. The remaining authors declare that the research was conducted in the absence of any commercial or financial relationships that could be construed as a potential conflict of interest.

References

  1. Yokoi, S. Study on the Prevention of Fire-Spread Caused by Hot Upward Current; The Building Research Institute, Ministry of Construction: Tokyo, Japan, 1960. [Google Scholar]
  2. Yamaguchi, J.I.; Tanaka, T. Temperature Profiles of Window Jet Plume. Fire Sci. Technol. 2004, 24, 17–38. [Google Scholar] [CrossRef]
  3. Himoto, K.; Tsuchihashi, T.; Tanaka, Y.; Tanaka, T. Modeling the trajectory of window flames with regard to flow attachment to the adjacent wall. Fire Saf. J. 2009, 44, 250–258. [Google Scholar] [CrossRef]
  4. Harrison, R.; Spearpoint, M. The horizontal flow of gases below the spill edge of a balcony and an adhered thermal spill plume. Int. J. Heat Mass Transf. 2010, 53, 5792–5805. [Google Scholar] [CrossRef]
  5. Harrison, R. Entrainment of Air into Thermal Spill Plumes. Ph.D Thesis, University of Canterbury, Christchurch, New Zealand, 2009. [Google Scholar]
  6. Harrison, R.; Spearpoint, M. Physical scale modelling of adhered spill plume entrainment. Fire Saf. J. 2010, 45, 149–158. [Google Scholar] [CrossRef]
  7. Zhou, B.; Yoshioka, H.; Noguchi, T.; Ando, T. Experimental study on vertical temperature profile of buoyant window spill plume from intermediate-scale compartments. Fire Mater. 2020, 44, 516–529. [Google Scholar] [CrossRef]
  8. Lu, K.H.; Wang, Z.C.; Ding, Y.M.; Wang, J.; Zhang, J.P.; Delichatsios, M.A.; Hu, L.H. Flame behavior from an opening at different elevations on the facade wall of a fire compartment. Proc. Combust. Inst. 2021, 38, 4551–4559. [Google Scholar] [CrossRef]
  9. Sun, X.; Zhang, X.; Lv, J.; Chen, X.; Fang, X.; Tang, F.; Ren, F.; Hu, L. Transverse and lateral temperature profiles of the window-ejected thermal plume along the facade. J. Build. Eng. 2023, 76, 107303. [Google Scholar] [CrossRef]
  10. Fang, X.; Zhang, X.L.; Yi, J.W.; Sun, X.P.; Tang, F.; Ren, F.; Hu, L.H. Experimental study on vertical temperature of facade fire plume ejected from compartment constrained by adjacent single sidewall. Int. J. Therm. Sci. 2023, 193, 108470. [Google Scholar] [CrossRef]
  11. Zhang, Y.; Zhang, W.; Lin, Y.F.; Chen, Y.; Li, K.Y. Flame attachment effect on the distributions of flow, temperature and heat flux of inclined fire plume. Int. J. Heat Mass Transf. 2021, 174, 121313. [Google Scholar] [CrossRef]
  12. Xu, T.; Tang, F. Predicting the vertical buoyant spill -plume temperature along building facade with an external sloping facing wall. Int. J. Therm. Sci. 2020, 152, 106307. [Google Scholar] [CrossRef]
  13. Zhang, X.L.; Yang, Y.; Sun, X.P.; Ren, F.; Fang, X.; Hu, L.H. A reduced-scale experimental investigation of facade flame behavior ejected from a top-hung window of fire compartment. Proc. Combust. Inst. 2023, 39, 3673–3681. [Google Scholar] [CrossRef]
  14. Ji, J.; He, M.M.; Li, L.J.; Zhou, Y.L. Experimental and theoretical study on the characteristics of the spill plume in a compartment fire with high-low opposing openings. Int. J. Therm. Sci. 2023, 187, 108204. [Google Scholar] [CrossRef]
  15. Duny, M.; Dhima, D.; Wang, H.Y.; Garo, J.P.; Manescau, B. Impact of facade type on an ejected flame propagation from a compartment opening-Experimental and numerical studies. J. Build. Eng. 2022, 46, 103660. [Google Scholar] [CrossRef]
  16. Miao, L.; Chow, C.L. Thermal behavior of window plume generated by fully developed compartment fires in single-skin and double-skin façade scenarios. Int. J. Therm. Sci. 2020, 153, 106359. [Google Scholar] [CrossRef]
  17. Cui, Y.; Cheng, X.; Gong, L.; Li, L.; Zhang, H.; Zhao, Y. Effect of Opening Geometry on the Heat Transfer Characteristics for External Flames Impinging on an Exterior Wall. Exp. Heat Transf. 2014, 27, 213–230. [Google Scholar] [CrossRef]
  18. Yanagisawa, A.; Goto, D.; Ohmiya, Y.; Delichatsios, M.A.; Lee, Y.P.; Wakatsuki, K. Effect of a facing wall on façade flames. Fire Saf. Sci. 2009, 9, 801–811. [Google Scholar] [CrossRef]
  19. Lee, Y.-P.; Delichatsios, M.A.; Silcock, G.W.H. Heat fluxes and flame heights in façades from fires in enclosures of varying geometry. Proc. Combust. Inst. 2007, 31, 2521–2528. [Google Scholar] [CrossRef]
  20. Lee, Y.P.; Delichatsios, M.M.; Silcock, G.W.H. Heat Flux Distribution and Flame Shapes on the Inert Facade. Fire Saf. Sci. 2008, 9, 193–204. [Google Scholar] [CrossRef]
  21. Tang, F.; Hu, L.H.; Delichatsios, M.A.; Lu, K.H.; Zhu, W. Experimental study on flame height and temperature profile of buoyant window spill plume from an under-ventilated compartment fire. Int. J. Heat Mass Transf. 2012, 55, 93–101. [Google Scholar] [CrossRef]
  22. Beji, T.; Ukleja, S.; Zhang, J.; Delichatsios, M.A. Fire behaviour and external flames in corridor and tunnel-like enclosures. Fire Mater. 2012, 36, 636–647. [Google Scholar] [CrossRef]
  23. Ohmiya, Y.; Hori, Y.; Sagimori, K.; Wakamatsu, T. Predictive method for properties of flame ejected from an opening incorporating excess fuel. Power Demand Side Manag. 2000, 7, 688–694. [Google Scholar]
  24. Miao, L.; Yang, Y.; Chow, C.L. Experimental study on the variation regimes of window ejecting flame height. Fire Saf. J. 2019, 109, 102864. [Google Scholar] [CrossRef]
  25. Liu, Q.; Xu, Z.; Gan, F.; Tao, H.; Zhao, J. Facade flame height ejected from window of a compartment fire under a single sidewall constraint boundary condition. Case Stud. Therm. Eng. 2023, 45, 103004. [Google Scholar] [CrossRef]
  26. Han, Y.; Sun, X.P.; Yang, Y.; Chen, X.T.; Lv, J.; Wang, X.H.; Zhang, X.L.; Hu, L.H. An experimental study of wall smoke pattern characteristics adjacent to fire source. Int. J. Therm. Sci. 2025, 214, 109865. [Google Scholar] [CrossRef]
  27. Fang, X.; Sun, X.; Tang, F.; Ren, F. Experimental investigation on morphology of window-ejected flame without facade effect. J. Build. Eng. 2024, 91, 109520. [Google Scholar] [CrossRef]
  28. Miao, L.; Chow, C.L. Influence of heat release rate and wall heat-blocking effect on the thermal plume ejected from compartment fire. Appl. Therm. Eng. 2018, 139, 585–597. [Google Scholar] [CrossRef]
  29. Himoto, K.; Tsuchihashi, T.; Tanaka, Y.; Tanaka, T. Modeling thermal behaviors of window flame ejected from a fire compartment. Fire Saf. J. 2009, 44, 230–240. [Google Scholar] [CrossRef]
  30. Sun, X.; Hu, L.; Lv, J.; Fang, X.; Chen, X.; Zhang, X. Experimental study on the heat flux profile upon the building facade of the window-ejected fire plume. Int. J. Heat Mass Transf. 2023, 214, 124391. [Google Scholar] [CrossRef]
  31. Sun, X.; Tang, F.; Lu, K.; Ren, F.; Shi, C.; Merci, B.; Hu, L. Fundamentals of window-ejected fire plumes from under-ventilated compartment fires: Recent progresses and perspectives. Prog. Energy Combust. Sci. 2023, 94, 101039. [Google Scholar] [CrossRef]
  32. Chen, Y.; Miao, Y.; Tao, S.; Li, Q.; Yuan, Y.; Zhang, X.; Hu, L. Flame structure and dynamics in pool fires of different geometries: Experimental and numerical investigation. Energy 2024, 304, 131996. [Google Scholar] [CrossRef]
  33. Li, Y.; Sun, X.; Chen, Y.; Hu, L.; Zhang, X. Experimental and numerical studies on flame radius, temperature profile and heat flux of axi-symmetric ceiling fires under various sub-atmospheric pressures. Int. J. Therm. Sci. 2025, 211, 109697. [Google Scholar] [CrossRef]
  34. McGrattan, K.; McDermott, R.; Weinschenk, C.; Forney, G. Fire Dynamics Simulator, Technical Reference Guide, 6th ed.; Special Publication (NIST SP); National Institute of Standards and Technology: Gaithersburg, MD, USA, 2013. [Google Scholar] [CrossRef]
  35. Otsu, N. A threshold selection method from gray-level histograms. Automatica 1975, 11, 23–27. [Google Scholar] [CrossRef]
  36. Budnick, E.K.; Evans, D.D.; Nelson, H. Simplified Fire Growth Calculations. In Fire Protection Handbook; Natl Fire Protection Assn: Quincy, MA, USA, 1997. [Google Scholar]
Figure 1. Temperature profiles compiled from literature results with the same opening aspect ratio. (a) Opening: 0.2 × 0.4 m, Cui et al., 2014 [17]; (b) Opening: 0.1 × 0.2 m, Yamaguchi and Tanaka, 2005 [2]; (c) Opening: 0.3 × 0.6 m, Yamaguchi and Tanaka, 2005 [2]; (d) Opening: 0.1 × 0.2 m, Yanagisawa et al., 2008 [18].
Fire 08 00168 g001
Figure 2. Effect of measuring region dimensions on the judgement of plume attachment.
Fire 08 00168 g002
Figure 3. Using square burners to simulate the upper part of ejected flame. (a) Real fire; (b) Gas burner simulated fire.
Fire 08 00168 g003
Figure 4. Experimental setup.
Fire 08 00168 g004
Figure 5. Typical temperature history of thermocouples in T1 and T5.
Fire 08 00168 g005
Figure 6. Models used in simulations. (a) Without wall; (b) With vertical wall.
Fire 08 00168 g006
Figure 7. Comparison of the experimental and simulated plume temperature.
Fire 08 00168 g007
Figure 8. Comparison of the experimental and simulated plume temperature (without wall).
Fire 08 00168 g008
Figure 9. Perspective distortion correction. (a) Position indicators; (b) Corrected length scale.
Fire 08 00168 g009
Figure 10. Flame occurrence probability map for A2.
Fire 08 00168 g010
Figure 11. Flame height obtained in group A.
Fire 08 00168 g011
Figure 12. Temperature profile obtained in group B2. (a) D = 0 cm; (b) D = 4 cm; (c) D = 8 cm; (d) D = 12 cm; (e) D = 16 cm; (f) D = 20 cm.
Fire 08 00168 g012
Figure 13. Plume trajectories obtained in group B. (a) Burner geometry 0.1 × 0.1 m; (b) Burner geometry 0.1 × 0.2 m; (c) Burner geometry 0.1 × 0.3 m.
Fire 08 00168 g013
Figure 14. Comparison of the plume temperature and velocity profile at given height above the burner surface in cases with and without wall. The profiles were aligned at the plume trajectory. (a) z = 0.5 m; (b) z = 1.0 m; (c) z = 1.5 m; (d) z = 2.0 m.
Fire 08 00168 g014
Table 1. Summary of experimental conditions using square pool fires.
No.LWDHRRPUA *
cmcmcmkW/m2
A18100, 3, 5, 10460
A28200, 5, 10, 15, 20
A38300, 5, 10, 15, 20, 25
B110100, 4, 8, 12, 16, 20560
B21020
B31030
Note: * HRRPUA stands for Heat Release Rate Per Unit Area.
Disclaimer/Publisher’s Note: The statements, opinions and data contained in all publications are solely those of the individual author(s) and contributor(s) and not of MDPI and/or the editor(s). MDPI and/or the editor(s) disclaim responsibility for any injury to people or property resulting from any ideas, methods, instructions or products referred to in the content.

