

Forecasting 2025, 7(2), 18; https://doi.org/10.3390/forecast7020018 - 9 Apr 2025
Abstract
Accurate Day-Ahead Energy Price (DAEP) forecasting is essential for optimizing energy market operations. This study introduces a machine learning framework to predict the DAEP with a 24 h lead time, leveraging historical data and forecasts available at the prediction time. Hourly DAEP data
[...] Read more.
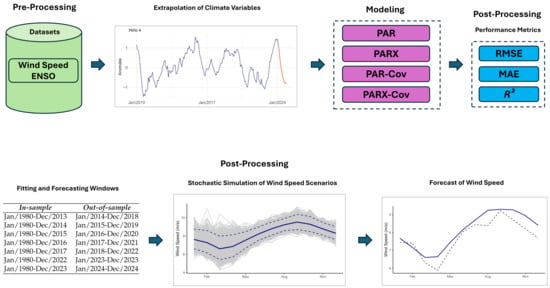
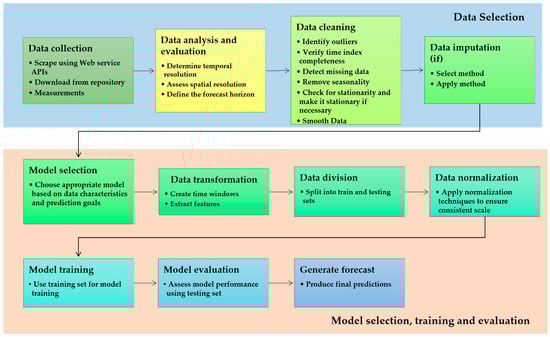
Accurate Day-Ahead Energy Price (DAEP) forecasting is essential for optimizing energy market operations. This study introduces a machine learning framework to predict the DAEP with a 24 h lead time, leveraging historical data and forecasts available at the prediction time. Hourly DAEP data from the California Independent System Operator (January 2017 to July 2023) were integrated with exogenous and engineered endogenous features. A custom rolling window cross-validation, with 24 h validation blocks sliding daily across 2372 folds, evaluates an Extreme Gradient Boosting (XGBoost) model’s performance under diverse market conditions, achieving a median mean absolute error of 6.26 USD/MWh and root mean squared error of 8.27 USD/MWh, with variability reflecting market volatility. The feature importance analysis using Shapley additive explanations highlighted the dominance of engineered endogenous features in driving the 24 h lead time forecasts under relatively stable market conditions. Forecasting the DAEP at a runtime of 10 AM on the prior day was used to assess model uncertainty. This involved training random forest, support vector regression, XGBoost, and feed forward neural network models, followed by stacking and voting ensembles. The results indicate the need for ensemble forecasting and evaluation beyond a static train–test split to ensure the practical utility of machine learning for DAEP forecasting across varied market dynamics. Finally, operationalizing the forecast model for bidding decisions by forecasting the DAEP and real-time prices at runtime is presented and discussed.
Full article
(This article belongs to the Special Issue New Challenges in Energy and Finance Forecasting in the Era of Big Data)
►
Show Figures
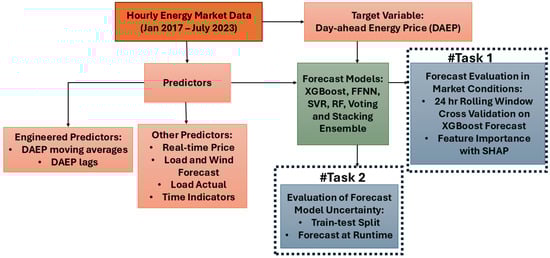
Figure 1


