Abstract
The accurate identification of pigments is of principal relevance in the field of cultural heritage conservation and restoration practices. In this preliminary study, a first attempt to set up a procedure for accurate red pigment identification, based on the assessment of the correlations existing between visible reflectance spectrometry (vis-RS) and Raman data, is presented. The proposed approach involved the realization of a library consisting of data acquired on a set of 35 pure red historical pigments supplied by ©Kremer Pigmente. In particular, vis-RS data, collected through a Konica Minolta CM-2600d spectrophotometer, were registered, together with the position of the Extrema Points (E.P.s) encompassing both the maximum and minimum points of the first derivative of the % spectral reflectance factor (SRF%) curves. Portable Raman spectroscopy measurements were collected by a B&W Tek Inc. portable Raman spectrometer equipped with a 785 nm laser. For each tested pigment, the positions and relative intensities of the characteristic Raman peaks were considered. The library was then tested for the characterization of the red/reddish painted areas of the medieval wall painting located within The Norman Castle of Aci Castello (Catania, Italy), and was shown to be essential for the unambiguous identification of the pigment used. It is worth noting that this study represents the first novel attempt to establish a reliable and efficient methodology for pigment identification, offering promising prospects in reducing uncertainties and ambiguities arising from the application of a single stand-alone approach.
1. Introduction
The accurate identification of pigments, through the employment of a combination of advanced analytical techniques and interdisciplinary collaborations, provides insights into the understanding of an artist’s creative process and helps in finding solutions to art historical research questions, including conservation, restoration, and authentication [1,2,3,4,5,6,7]. In fact, it enables restorers to authentically preserve the original intentions of artists, while enhancing our comprehension of historical techniques and cultural contexts. This process sheds light on the evolution of artistic practices and materials, tracing the development of pigments from ancient civilizations to modern times. Over the recent years, much interest has been notably directed towards the development of methodologies and novel strategies aimed at the comprehensive characterization of historical inorganic/organic pigmenting agents, alongside the identification of possible degradation products originating from the interaction of such agents with the surrounding environment [8,9,10,11,12,13,14,15,16]. These aspects play a fundamental role not only in estimating the choice and style of the artist but also in reproducing similar materials in accordance with ancient recipes which can be used for restoration interventions [17,18,19,20,21,22,23,24]. As is well known, the preservation and conservation of pigmented artworks generally require the employment of techniques that provide valuable information while minimizing the potential risk of damage. In this sense, a good strategy consists of the use of complementary non-invasive or, at least, micro-destructive methodologies able to perform in situ measurements with portable equipment that ensures the acquisition of useful data in conservation and restoration programs [25,26,27,28]. In this context, non-destructive techniques such as diffuse reflectance spectrometry, operating in the visible range (vis-RS) [29,30,31], and portable Raman spectroscopy [32,33,34,35,36,37] have proved to be essential and easily accessible for the assessment of various components in paintings [38]. In particular, since the beginning of the twenty-first century, vis-RS has become pivotal in the study of cultural heritage materials, i.e., in the ability to potentially discriminate both organic/inorganic materials [39,40], in the direct analysis of color discoloration on surfaces, as well as for the validation test of novel protective and cleaning consolidant products to be applied for conservation and preservation purposes. Notably, the reflection spectrum of a pigment has a behavior that strongly depends on the particle size, suspending medium, and refractive index of the investigated sample [41,42]. Nowadays, the ability to collect the reflectance contribution originating from small surface areas, in conjunction with easy-to-use, portable, and low-cost features, makes such methodology appealing in the characterization of artwork pure pigments [43]. Additionally, Raman spectroscopy has been largely utilized in the study of the molecular composition of pigment mixtures in paintings [13,44,45], ceramics [46,47,48], manuscripts [49,50], and wall paintings [51,52]. However, it is worth remarking that, in most cases, the presence of ground materials and binding agents, typically made up of organic-based compounds, is responsible for the onset of a high fluorescence background which may cover the weak Raman signal emitted by the pigment, making its identification a very challenging task. Currently, portable Raman spectrometers are commercially available. Despite the beneficial cost-effectiveness and user-friendly properties of portable instruments, which make them particularly appealing, their spectral resolution and signal-to-noise ratio cannot be compared with those of typical benchtop settings [53]. Nevertheless, the management of immovable objects of high artistic–historical value, i.e., frescoes and wall paintings, makes the employment of portable Raman instruments a fundamental requirement for their proper characterization [26,54,55,56,57] due to bureaucratic difficulties in relocating/transferring the artwork from the site to the laboratory. Whether using either vis-RS or portable Raman, the identification of the pigment “fingerprint” utilized in colored artworks may be challenging, especially for the characterization of objects affected by a poor preservation state. Accordingly, all measurement surveys should always be accompanied by a detailed comparison with a proper database for a feasible and unambiguous identification process. In this context, this paper mainly focuses on the description of an approach for accurate red pigment identification based on the association of the obtained data with those supplied by a home-made database containing vis-RS and portable Raman data of 35 pure red historical pigments provided by ©Kremer Pigmente (GmbH & Co. KG (Aichstetten, Germany)), achieved through the employment of portable instrumentations usable in situ. The aim was to establish a comprehensive repository capable of streamlining the red pigment identification process directly in the field, starting from a systematic comparison of the reference dataset with those achieved in a real context. This is extremely useful in all those cases in which unexpected challenges, such as instrumental issues, sample limitations, or ambiguous results, can impede a conclusive and reliable pigment recognition. In particular, the first step was devoted to the realization of a database consisting of integrated vis-RS and portable Raman data aimed at identifying potential “smart markers”, defined as a single, or an ensemble, of potential values/data characteristic of the sample which could serve as a strategical indicator for correlation analysis, thus enabling its insightful and unambiguous identification. The constructed database was then tested for the in situ multi-technique characterization of the red areas of a wall painting within The Norman Castle of Aci Castello (Catania, Italy), representing Mary with child, with the aim to validate and establish a reliable and efficient approach to pigment identification. Specifically, the state of preservation of the wall painting does not allow an easy reconstruction of the represented subject. No specific studies have been devoted to its analysis and no information about its existence inside the castle is available in the historical sources.
A further objective of this work is the improvement of the database of historical pigments available at the PH3DRA (PHysics for Dating Diagnostics Dosimetry Research and Applications) labs, in terms of vis-RS and portable Raman data, in agreement with the goals set in a previously published paper by some of the authors [58,59].
2. Materials and Methods
2.1. Materials
2.1.1. Red Pigments Used for Library
The set of pigments used for this study, composed of 35 powdered samples supplied in 3 mL containers, was purchased from ©Kremer Pigmente (Germany). The commercial names and reference numbers are specified in Table 1. The reference materials were studied without any further treatment. The examined set includes both pigments used in the past centuries, such as cinnabar (ID codes: 10620, 10621 and 10622), madder lake (ID code: 37202), and ochres (ID codes: 11574, 11575, 11576, 11577, 11584 and 11585), as well as modern and contemporary ones, i.e., alizarine (ID code: 23610) and carmine naccarat (ID code: 42100).

Table 1.
Identification code, color index, product name, and a brief description of the red pigments used in this paper (provided by the sales company).
2.1.2. Wall Painting Located within the Norman Castle of Aci Castello (Catania, Italy)
Few traces of a wall painting survive inside a long rectangular room of the Castle, named “Byzantine Chapel”, but, chronologically consistent with the rest of the building, no traces of Byzantine architecture survive. As said above, no specific analysis was carried out on the wall painting, whose state of preservation makes the complete reading of the scene and the style particularly difficult. Traces of a seated subject survive, evidently Mary, bearing a small naked figure on her legs, Christ. Evanescent traces of a third figure, a Saint, are preserved to the right, while, on the left, the painting is too damaged. Mary wears a red dress and a black-bluish mantle. A light pink-yellowish color, at some points converting into white, is used for naked portions of the figures: the hand for Mary and the legs for Jesus. The scene is framed by a thin red rim.
A total of 10 different areas of the wall painting were analyzed in situ, representative of red finishing layers (R#, with # = 1, …, 10), as summarized in Table 2 and indicated in Figure 1.
Table 2.
Description of the investigated areas with the position within the wall painting.
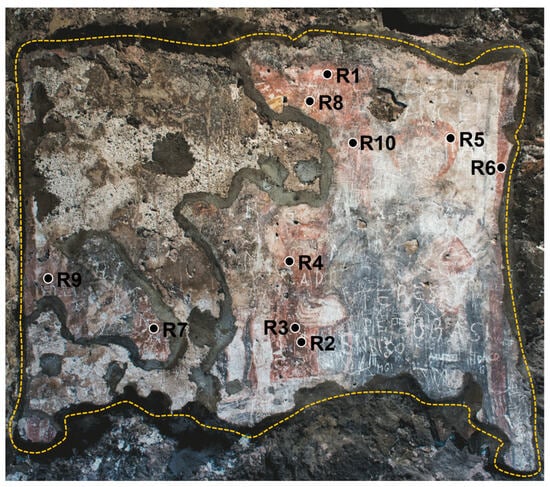
Figure 1.
Investigated polychrome wall painting located within The Norman Castle of Aci Castello (Catania, Italy), with an indication of the analyzed areas. The yellow-dashed line indicates the painted area. The surface area is ~2 m2.
2.2. Methods
2.2.1. Visible Reflectance Spectrometry (Vis-RS) Measurements
Vis-RS measurements were carried out by a Konica Minolta® model CM-2600d spectrophotometer (Konica Minolta, Tokyo, Japan), working in the 360–740 nm spectral range with a 10 nm acquisition step. The measurement geometry was d/8°, and the chosen measured area was 6 mm in diameter (SAV condition). The light provided by a Xenon lamp was diffused through an integrating sphere, uniformly illuminating the specimen. The light reflected by the sample then reached the optical system, where it was split into 10 nm-pitch components each processed by an analog processing circuit for the detection. In our case, a white calibration plate (CM-A145) and a black box (Zero-Calibration Box CM-A32 Minolta) were employed to perform the scale adjustment, as targets for the maximum and minimum lightness values [60]. The data elaboration, regarding SPEX/100 values (SPecular component EXcluded and UV included), was performed by dedicated software (SpectraMagic®, ver. 3.6), while the Origin® software (OriginPro 8) was used for data processing. The mean values for all data were obtained from three measurements, together with their respective uncertainties. The total uncertainty was then calculated using uncertainty propagation theory, which involves the square root of the sum of the squared standard deviation and the instrumental error. In particular, the instrumental error was evaluated considering the L*a*b* coordinates of the white calibration plate related to the 2° standard observer and D65 standard illuminant after the adjustment procedure.
The analysis involved first the behavior of the spectral reflectance factor (SRF%), accounting for the reflected/incident intensity percentage ratio, in the 400–700 nm range. Then, from the first derivative curves d(SRF%) of the spectral trends, the Extrema Points (E.P.s) related to the maximum, minimum, and inflection points were registered following the methodology proposed by Bacci et al. [39,61,62,63]. In particular, the high (absolute maxima, p-h) and low (relative maxima, p-l) peaks were recorded, together with the positions of valleys (absolute/relative minima, v) and shoulders (inflection points, sh).
For the evaluation of the derivative profiles, the Origin® software (OriginPro 8) was used, which performed, before the calculation of the first derivative, a smoothing on the two preceding and two following points of the discrete data related to the SRF% curves using a third-degree polynomial function.
2.2.2. Raman Measurements
Raman measurements were performed, both for the realization of the laboratory database and for the in situ analysis, through a portable modular setup consisting of a BTC162E Glacier® T (B&W TEK Inc., Newark, DE, USA) high-resolution double pass transmission-based spectrometer (BTC162E), an FC-D-785 laser module (CNI, Changchun, China), and a lab-grade probe. The instrument is characterized by an excitation wavelength of 785 nm (diode laser), a 350 mW maximum laser excitation power, and a response-enhanced linear CCD detector (thermoelectric cooled, TE). The laser output power was continuously regulated in order to maximize the signal-to-noise ratio while avoiding thermal effects on the sample. For our measurements, the laser power was maintained at between 3% and 10% of the maximum power, corresponding to ~10.5–35 mW, depending on the specific sample. The spot size was 85 μm in diameter at a working distance of 5.5 mm. Spectra have been registered in the 60–3150 cm−1 wavenumber range, by using different acquisition times and a nominal resolution of ~5 cm−1, adding several scans for each spectrum in order to improve the signal-to-noise ratio. Data elaboration, such as a baseline correction and a smoothing process, has been performed using the BWSpec 3.27 software.
3. Results and Discussion
3.1. Database Analysis Results
The proposed database involves the extraction of systematical information derived from the analysis of both the vis-RS and portable Raman data collected for each pigment within a limited range of wavelengths (i.e., visible) and using a single Raman excitation wavelength, respectively.
In Figure 2 we report, as an example, the Raman spectrum (Figure 2a) and the behavior of the SRF% (Figure 2b) together with the first derivative curve d(SRF%) vs. wavelength (Figure 2c) at SPEX/100 condition, obtained for sample ID code: 11300, red jasper, a glass-like transparency amorphous quartz, colored red by iron (III). This pigment was also rarely employed in historical painting layers [64] and in mosaics [65]. However, the selected sample was chosen mainly because it is particularly suitable for describing the database as it encompasses a wide range of different vis-RS and Raman features.
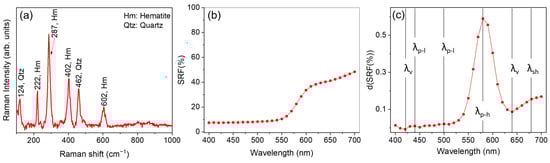
Figure 2.
(a) Portable Raman spectrum, (b) spectral reflectance factor (SRF%), and (c) d(SRF(%)) curve obtained for sample ID code 11300—Red jasper.
It is worth noting that the CM2600d instrument has a high degree of accuracy and precision. In terms of SRF%, the relative percentage error obtained was <1%, considering the instrumental error and the average of the three measurements. Thus, the true uncertainty is related to the position of the peak of the first derivative, which is ±10 nm.
The detected Raman profile (Figure 2a) revealed, as main features, intense peaks at 222 cm−1 (A1g), 287 cm−1 (Eg), 402 cm−1 (Eg), and 604 cm−1 (Eg), associated with ferric oxide (hematite, Fe2O3) [66], together with a contribution at 124 cm−1 and 462 cm−1 ascribable to quartz (SiO2) [66].
In particular, the general consistency between the observed compositions retrieved for all the investigated red pigments with those warranted in the datasheets provided by the pigment manufacturer was verified by comparing the experimental data with both the relevant scientific literature [67,68,69,70,71,72,73] and the accessible online databases, IRUG [74] and RRuff [75]. In our case, the collected Raman spectra (see Figure 3) have revealed distinct fingerprint features, whose positions are listed in Table 3 together with their relative intensities, in compliance with the certified composition of the investigated set.
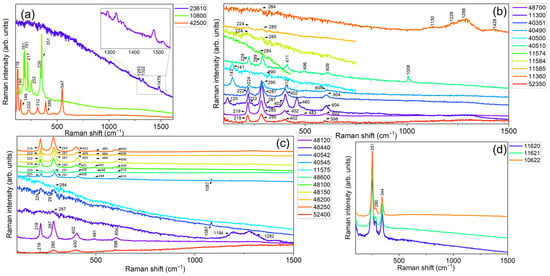
Figure 3.
Measured portable Raman spectra of the 28 powdered samples reported in Table 3, using an excitation wavelength of 785 nm in the 100–1500 cm−1 spectral range. Spectra were vertically offset for clarity and divided into four different panels, respectively displaying measurements collected on: (a) three unique pigments based on organic (23610—Alizarine crimson dark), As-(10800—Realgar), and Pb-based (42500—Red lead, minium) compounds, (b) natural (color index: PR102) and (c) synthetic (color index: PR101) iron oxide-based pigments, and (d) Hg-based ones.
Table 3.
Main Raman signals (wavenumber and relative intensity) and E.P. positions extracted from the analysis of the d(SRF(%)) vs. λ profiles associated with the 35 powdered red pigments supplied by ©Kremer Pigmente.
In more detail, the portable Raman spectra of the three unique pigments (See Figure 3a) based on organic (23610—Alizarine crimson dark), As-(10800—Realgar), and Pb-based (42500—Red lead, minium) compounds (See Table 1 and Table 3) display the typical Raman signature of the components involved in the manufacture of the pigment, thus demonstrating uniform composition within the measurements. Red organic colors are typically challenging to analyze with the used set-up and excitation wavelength. Nevertheless, the portable Raman spectrum of 23610—Alizarine crimson dark (organic synthetic monoazo, naphthol) shows distinctive peaks at 1293 cm−1, 1322 cm−1, and 1479 cm−1, despite a strong fluorescence background and low signal-to-noise ratio, allowing for its proper identification. Concerning sample 10800—Realgar (As4S4), major features at 140 cm−1, 181 cm−1, 191 cm−1, 217 cm−1, 252 cm−1, 339 cm−1, and 351 cm−1 can be easily distinguished, corresponding to the vibrational modes of the arsenic–sulfur bonds present in the compound, while, in the case of 42500—Red lead, minium (Pb3O4), a portable-Raman profile with characteristic peaks at 118 cm−1, 149 cm−1, 222 cm−1, 312 cm−1 (lattice modes of the crystal structure) 389 cm−1, and 547 cm−1 (stretching and bending vibrations of the Pb-O bonds) was observed, in agreement with the literature.
Going on, the comparison of the portable Raman spectra related to natural (color index: PR102) iron oxide-based pigments (Figure 3b) revealed an almost uniform composition based on iron(III) oxide–hematite, recognized by its typical stretching bands corresponding to the Fe–O bond centered at 222 cm−1 and 494 cm−1, and deformation modes at 287 cm−1, 402 cm−1, and 604 cm−1. A mixture of hematite and gypsum (CaSO4·2H2O, main peak at 1008 cm−1) was identified in the case of sample 40510—Venetian red, as expected by the well-known and certified composition of this pigment, while, in the case of sample 40490—Satorius red and 40500—Red bolus, a mixture of hematite and minium (lead(II,IV) oxide) can be recognized, besides the main vibrational bands of iron(III) oxide, with a contribution at 143 cm−1. Finally, the portable Raman spectrum of the 11360—Brown-red slate sample only showed a distinguishable band at 287 cm−1 due to hematite, in addition to a series of broad bands falling within the 1130–1500 cm−1 range whose attribution remains doubtful.
Similarly, the portable Raman spectra collected on the synthetic (color index: PR101) iron oxide-based references (see Figure 3c) revealed, even in this case, an almost uniform composition based on iron(III) oxide–hematite according to the presence of the previously described modes. Some exceptions were recognized in the case of samples 40542 and 40545, respectively associated with light and deep English red, where a combination of hematite + gypsum and hematite + calcite was observed. Finally, with reference to the Hg-based pigments (11620—Natural Cinnabar, 11621—Natural Cinnabar, light, and 11622—Natural Cinnabar, powder), the portable Raman spectra (Figure 3d) revealed the three main contributions of vermilion, falling at 251 cm−1 (A1g), 280 cm−1 (Eg), and 344 cm−1 (Eg), in compliance with the certified datasheet provided by the manufacturer. Noteworthy, the employment of a red laser enables the acquisition of the highest-quality Raman spectrum in the case of vermilion due to a close matching of the laser frequency with an electronic transition of such compound. Consequently, resonant, or pre-resonant, Raman scattering phenomena are likely to occur, significantly amplifying the Raman signal by a factor ranging from 102 to 106.
However, in the case of Carmine naccarat (ID code: 42100), Dragon’s blood (ID code: 37000), Madder lake (ID code: 37202), Lac dye (ID code: 36020), and Resina kamala (ID code: 37030), the occurrence of a strong fluorescence background made the assessment of a reliable assignment difficult and, for this reason, their Raman signals will not be listed in the database. The same considerations can also be made for the pigment Burgundy red ochre deep 0–80 µ (ID code: 11576) and Burgundy red ochre deep 0–120 µ (ID code: 11577).
Concerning the vis-RS data, the SRF% curve reported in Figure 2b shows an increase for λ > 550 nm, typical of red-colored specimens, as expected. From a qualitative point of view, the behaviors of the SRF(%) profiles observed for the whole set were found to be slightly different from each other (See Figure 4), as it is known, they strongly depend on the specific properties of the pigment, including the particle size and crystal structure [76,77].
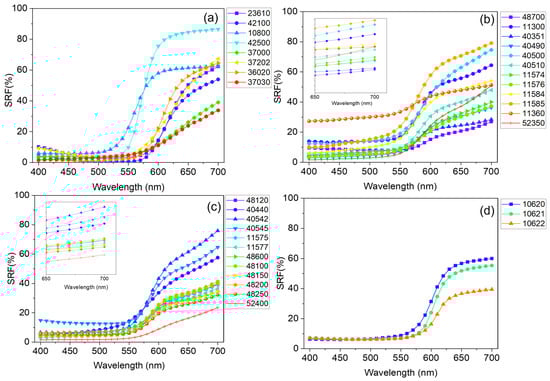
Figure 4.
Spectral reflectance factor (SRF%) behavior of the 35 powdered samples reported in Table 3. Spectra were sorted into four different panels, respectively representative of (a) eight unique pigments respectively based on organic (23610—Alizarine crimson dark, 42100—carmine nacarat, 37000—Dragon’s blood, powder, 37202—Madder lake, 36020—Lac dye, and 37030—Resina kamala), As-(10800—Realgar), and Pb-based compounds (42500—Red lead, minium), (b) natural (color index: PR102) and (c) synthetic (color index: PR101) iron oxide-based pigments, and (d) Hg-based ones.
For pigments characterized by the same hue, the possibility to discern differences in their reflectance curves becomes challenging. In fact, the red pigments employed in this study show similar SRF(%) behavior characterized by the typical increase upon 550 nm < λ < 575 nm, with varying intensities. With the aim to provide further details, a first derivative calculation applied to the whole set of data was undertaken (see Supplementary Material (Figure S1)) for the assessment of the positions of the E.P.s characteristic of each red pigment. The set of E.P. positions for all the investigated red samples is listed in Table 3. An example is reported in Figure 2c, where the profile of d(SRF(%)) vs. λ is shown. The analysis of the d(SFR(%)) aids in identifying key wavelengths that contribute significantly to the hue of the pigment and mainly involves the identification of the most prominent maxima, accounting for the wavelength at which the pigment absorbs light mostly (). In the case of Red jasper (sample ID code 11300) the was found to be equal to 580 nm. A value of was also found for all the natural and synthetic iron oxide-based pigments, with the only exception being sample 52400—translucent red medium for which . Higher values in the position of were found for all the organic-based red pigments (23610—Alizarine crimson dark, 42100—carmine nacarat, 37000—Dragon’s blood, powder, 37202—Madder lake, 36020—Lac dye, and 37030—Resina kamala) ranging from 610 nm in the case of sample 42100—carmine nacarat to 640 nm for sample 37000—Dragon’s blood.
A more detailed analysis allowed for the identification of relative maxima (), valleys (absolute/relative minima, ), and shoulders (), described in Section 2.2.1, whose assessment provides refined insights into the spectral behavior of each investigated pigment. Notably, the identification of such features in the d(SRF(%)) turns out to be crucial in the validation phase, as we will discuss in the following, in order to formulate hypotheses on the pigment color and production technique. In our example, an inspection of Figure 2c revealed the occurrence of two valleys and two relative maxima, respectively located at 420 and 640 nm, and 440 nm and 500 nm, together with a slight shoulder, concave in shape, located at 680 nm [78].
3.2. On-Site Measurement Results
Vis-RS and portable Raman spectra were collected from the 10 different red spots shown in Figure 1 and Table 2 (see points R#). The comparison of the obtained data with those present in the laboratory database helped validate the model and establish a reliable and efficient methodology for red pigment identification.
In Figure 5 the obtained portable Raman spectra (Figure 5a), SRF% trends (Figure 5b), and calculated first derivate curves (Figure 5c) are reported, the latter obtained only for five representative red pigmented areas, lighter and darker, respectively.
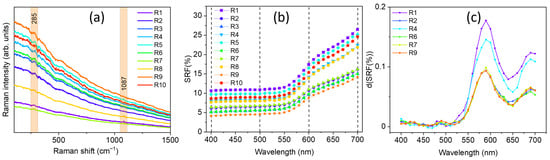
Figure 5.
(a) Portable Raman spectra, (b) spectral reflectance factor (SRF%), and (c) calculated first derivate curves d(SRF(%)) (of five representative points for a feasible comparison) related to the red areas of the wall painting located at The Norman Castle of Aci Castello.
By looking at the collected portable Raman spectra, the presence of calcite (CaCO3), from its main Raman contribution centered at 1086 cm−1, can be identified in R1, R4, R5, R8, and R10. The detection of calcium carbonate should be attributed to the inherent chemical composition of the background layer. The primary constituent of this layer is a calcite-based compound grounded in the Italian ‘fresco’ technique, in which pigments were applied directly on freshly laid mortar. However, the presence of calcite could be ascribed, other than to the background layer, to the possible use by the artist of a calcium carbonate-based white pigment, in a mixture with a pure red one, to obtain the desired lighter red hue observed by the naked eye in such areas (see Figure 1). Notably, in the case of the R2, R3, R6, R7, and R9 areas, no Raman signal at 1086 cm−1 can be distinguished.
Besides the presence of calcite, however, the high fluorescence background in the collected Raman spectra did not allow for the unambiguous identification of any other significant feature, except for a small signal around 285 cm−1 likely arising from the presence of iron oxides, making the identification of the red pigmenting a challenging task. In fact, from the database, a class of 14 different pigments display a Raman signature which can be comparable with those measured in situ. To overcome such limitation, a comparison of the d(SRF(%)) profiles, derived from the behavior of the corresponding spectral reflectance factor curves (Figure 5b,c), with those stored in the laboratory database allowed for the possibility to discriminate a set of 15 different red pigments with an absolute maximum in the d(SRF(%)) profile centered at 590 nm (p-h), i.e., pigment ID code: 48700, 48120, 40440, 40500, 40542, 40545, 11574, 11575, 11576, 11577, 48600, 48100, 48150, 48250, and 52350, well evident in the red areas of the wall painting.
To further refine the analysis, we compared the observed , and features in the d(SRF(%)) of Figure 5c with those associated with the previously identified 15 red pigments recorded in the database (see Table 3). An inspection of Figure 5c reveals, besides the absolute maximum at 590 nm (λp-h), a relative minimum around 470 nm, and two relative maxima at 490 nm and 690 nm. The correlation of the Raman profiles, which exhibit a comparable signature with such features in the d(SRF(%)), together with the position of the absolute maximum, allowed us to discriminate the employment of red ochre as a red pigmenting agent based on similarity criteria, according to the scheme of Figure 6.
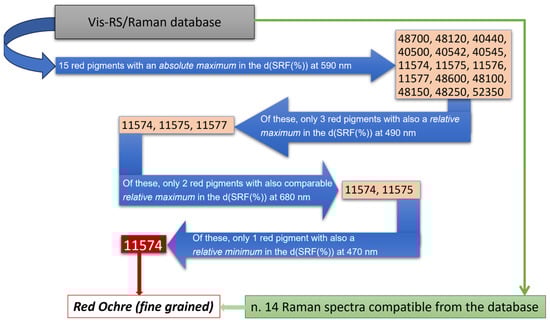
Figure 6.
Flowchart utilized for the red pigment identification. Blue and green arrows refer, respectively, to vis-RS and portable Raman data.
In Figure 7, we report the comparison of the d(SRF(%)) vs. λ between R1, R2, R4, R6, R7, and R9 and sample ID code 11574.
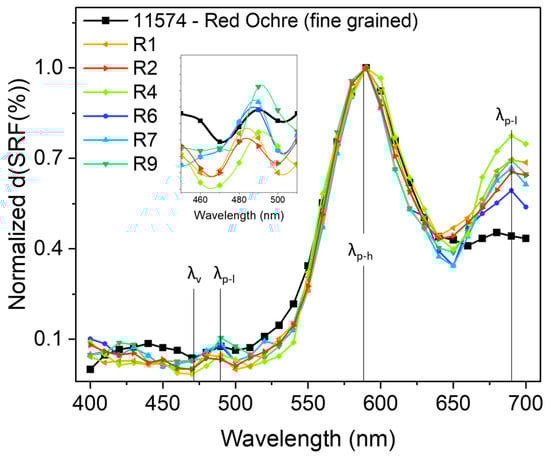
Figure 7.
d(SRF(%)) vs. λ profiles related to the selected red areas and sample ID code 11574 (taken from the library), with the positions of the , and features indicated. All curves were normalized to the 590 nm absolute maximum value for a better comparison.
The presence of red ochre is supported by the fact that natural pigments were commonly used in wall painting from the Byzantine period to the Medieval one, sometimes associated with iron oxide.
It is worth noting that the aforementioned and features in the d(SRF(%)) curves represent more specific smart markers since they allow for the precise identification of a specific reference pigment which is otherwise not possible to uniquely accomplish from the absolute maximum at 590 nm () or from the small signal around 285 cm−1 observed in the Raman profile. This is useful not only for pigment recognition, allowing us to overcome a series of limitations related to the use of portable Raman spectroscopy as a single stand-alone approach, but also for making assumptions about the manufacturing technique. The fine-grained red ochre d(SRF(%)) profile (ID code: 11574) appears more compatible if compared, for example, to that of the coarse-grained red ochre (ID code: 11575).
4. Conclusions
In this work, we proposed a methodology for the accurate identification of red pigments used in historical–artistic contexts thanks to the evaluation of correlations that exist between vis-RS and portable Raman data, achieved through the employment of portable instrumentation. In particular, starting from the position of the Extrema Points (E.P.s) observed in the first derivative of the spectral reflectance factor (SRF%) curves and the Raman main vibrational signals collected for 35 pure red pigments supplied by ©Kremer Pigmente, a laboratory database was realized. The proposed database was then tested for the characterization of the red areas of a polychrome surface located within The Norman Castle of Aci Castello (Catania, Italy). As the main results, the comparison of the database data with those achieved in situ allowed us to discriminate, thanks to the identification of specific smart markers, the employment of fine-grained red ochre as a red pigmenting agent among a class of almost 15 different compatible pigments. In particular, it was shown that the identification of specific low-intensity features, i.e., relative maxima, relative minima, and shoulders in the d(SRF(%)) curves, which represent more specific smart markers, allowed us to validate the proposed procedure in cases in which ambiguous results can hinder a reliable pigment recognition.
Pigments of other hues will be analyzed and implemented in the database with the aim of verifying, in a more systematic manner, the proposed approach in different case studies.
Supplementary Materials
The following supporting information can be downloaded at: https://www.mdpi.com/article/10.3390/heritage7040102/s1, Figure S1: Profiles of the first derivative of spectral reflectance factor behavior of the 35 powdered samples reported in Table 1.
Author Contributions
Conceptualization, A.M.G., G.P. (Giuseppe Paladini) and G.S.; methodology, A.M.G., G.P. (Giuseppe Paladini) and G.S.; software, G.P. (Giuseppe Paladini) and G.S.; validation, E.P. and G.P. (Giuseppe Politi); formal analysis, G.P. (Giuseppe Paladini) and A.I.; investigation, R.G., G.P. (Giuseppe Paladini) and A.I.; resources, A.M.G. and G.S.; data curation, A.M.G., G.P. (Giuseppe Paladini) and G.S.; writing—original draft preparation, G.P. (Giuseppe Paladini), E.P. and G.S.; writing—review and editing, G.P. (Giuseppe Politi) and A.M.G.; visualization, A.M.G. and G.S.; supervision, A.M.G. and G.S.; project administration, G.S.; funding acquisition, A.M.G. All authors have read and agreed to the published version of the manuscript.
Funding
This research activity was funded by the European Union (NextGeneration EU), through the MUR-PNRR project SAMOTHRACE (ECS00000022).
Data Availability Statement
The data presented in this study are available on request from the corresponding author.
Acknowledgments
This research activity was funded by the European Union (NextGeneration EU), through the MUR-PNRR project SAMOTHRACE (ECS00000022) “SiciliAn MicronanOTecH Research And Innovation CEnter”–Ecosistema dell’innovazione (PNRR, Mission 4, Component 2 Investment 1.5, Avviso n. 3277 del 30-12-2021), Spoke 1–Università di Catania-Work Package 6 Cultural Heritage. The authors also wish to acknowledge the Aci Castello Municipality, the Ecomuseo Riviera dei Ciclopi, and, in particular, Major Carmelo Camillo Scandurra.
Conflicts of Interest
The authors declare no conflicts of interest.
References
- Miguel, C.; Claro, A.; Gonçalves, A.P.; Muralha, V.S.F.; Melo, M.J. A study on red lead degradation in a medieval manuscript Lorvão Apocalypse (1189). J. Raman Spectrosc. 2009, 40, 1966–1973. [Google Scholar] [CrossRef]
- Steger, S.; Stege, H.; Bretz, S.; Hahn, O. A complementary spectroscopic approach for the non-invasive in-situ identification of synthetic organic pigments in modern reverse paintings on glass (1913–1946). J. Cult. Herit. 2019, 38, 20–28. [Google Scholar] [CrossRef]
- Angelin, E.M.; Bacci, M.; Bartolozzi, G.; Cantisani, E.; Picollo, M. Contemporary artists’ spinel pigments: Non-invasive characterization by means of electronic spectroscopy. Spectrochim. Acta Part A Mol. Biomol. Spectrosc. 2017, 173, 510–515. [Google Scholar] [CrossRef]
- Daniel Martin-Ramos, J.; Zafra-Gómez, A.; Vílchez, J.L. Non-destructive pigment characterization in the painting Little Madonna of Foligno by X-ray Powder Diffraction. Microchem. J. 2017, 134, 343–353. [Google Scholar] [CrossRef]
- Crupi, V.; La Russa, M.F.; Venuti, V.; Ruffolo, S.; Ricca, M.; Paladini, G.; Albini, R.; Macchia, A.; Denaro, L.; Birarda, G.; et al. A combined SR-based Raman and InfraRed investigation of pigmenting matter used in wall paintings: The San Gennaro and San Gaudioso Catacombs (Naples, Italy) case. Eur. Phys. J. Plus 2018, 133, 369. [Google Scholar] [CrossRef]
- Venuti, V.; Fazzari, B.; Crupi, V.; Majolino, D.; Paladini, G.; Morabito, G.; Certo, G.; Lamberto, S.; Giacobbe, L. In situ diagnostic analysis of the XVIII century Madonna della Lettera panel painting (Messina, Italy). Spectrochim. Acta Part A Mol. Biomol. Spectrosc. 2020, 228, 117822. [Google Scholar] [CrossRef]
- Pellis, G.; Bertasa, M.; Ricci, C.; Scarcella, A.; Croveri, P.; Poli, T.; Scalarone, D. A multi-analytical approach for precise identification of alkyd spray paints and for a better understanding of their ageing behaviour in graffiti and urban artworks. J. Anal. Appl. Pyrolysis 2022, 165, 105576. [Google Scholar] [CrossRef]
- Moura, L.; Melo, M.J.; Casanova, C.; Claro, A. A study on Portuguese manuscript illumination: The Charter of Vila Flor (Flower town), 1512. J. Cult. Herit. 2007, 8, 299–306. [Google Scholar] [CrossRef]
- Melo, M.J.; Claro, A. Bright Light: Microspectrofluorimetry for the Characterization of Lake Pigments and Dyes in Works of Art. Acc. Chem. Res. 2010, 43, 857–866. [Google Scholar] [CrossRef]
- Melo, M.J.; Otero, V.; Vitorino, T.; Araújo, R.; Muralha, V.S.F.; Lemos, A.; Picollo, M. A Spectroscopic Study of Brazilwood Paints in Medieval Books of Hours. Appl. Spectrosc. 2014, 68, 434–444. [Google Scholar] [CrossRef]
- Longoni, M.; Bruni, S. Identification of Synthetic Organic Pigments in Contemporary Artists’ Paints by FT-IR and FT-Raman: An Advanced Analytical Experiment. J. Chem. Educ. 2021, 98, 966–972. [Google Scholar] [CrossRef]
- Liu, Y.; Lyu, S.; Hou, M.; Gao, Z.; Wang, W.; Zhou, X. A novel spectral matching approach for pigment: Spectral subsection identification considering ion absorption characteristics. Remote Sens. 2020, 12, 3415. [Google Scholar] [CrossRef]
- Kogou, S.; Lucian, A.; Bellesia, S.; Burgio, L.; Bailey, K.; Brooks, C.; Liang, H. A holistic multimodal approach to the non-invasive analysis of watercolour paintings. Appl. Phys. A 2015, 121, 999–1014. [Google Scholar] [CrossRef]
- Eisnor, M.M.; McLeod, K.E.R.; Bindesri, S.; Svoboda, S.A.; Wustholz, K.L.; Brosseau, C.L. Electrochemical surface-enhanced Raman spectroscopy (EC-SERS): A tool for the identification of polyphenolic components in natural lake pigments. Phys. Chem. Chem. Phys. 2022, 24, 347–356. [Google Scholar] [CrossRef]
- Gueli, A.M.; Pasquale, S.; Politi, G.; Stella, G. The Role of Scale Adjustment in Color Change Evaluation. Instruments 2019, 3, 42. [Google Scholar] [CrossRef]
- Pasquale, S.; Zimbone, M.; Ruffino, F.; Stella, G.; Gueli, A.M. Evaluation of the Photocatalytic Activity of Water-Based TiO2 Nanoparticle Dispersions Applied on Historical Painting Surfaces. Heritage 2021, 4, 1854–1867. [Google Scholar] [CrossRef]
- D’Amico, S.; Comite, V.; Paladini, G.; Ricca, M.; Colica, E.; Galone, L.; Guido, S.; Mantella, G.; Crupi, V.; Majolino, D.; et al. Multitechnique diagnostic analysis and 3D surveying prior to the restoration of St. Michael defeating Evil painting by Mattia Preti. Environ. Sci. Pollut. Res. 2022, 29, 29478–29497. [Google Scholar] [CrossRef]
- Andreotti, A.; Izzo, F.C.; Bonaduce, I. Archaeometric Study of the Mural Paintings by Saturnino Gatti and Workshop in the Church of San Panfilo, Tornimparte (AQ): The Study of Organic Materials in Original and Restored Areas. Appl. Sci. 2023, 13, 7153. [Google Scholar] [CrossRef]
- Armetta, F.; Giuffrida, D.; Ponterio, R.C.; Falcon Martinez, M.F.; Briani, F.; Pecchioni, E.; Santo, A.P.; Ciaramitaro, V.C.; Saladino, M.L. Looking for the original materials and evidence of restoration at the Vault of the San Panfilo Church in Tornimparte (AQ). Appl. Sci. 2023, 13, 7088. [Google Scholar] [CrossRef]
- Colantonio, C.; Pelosi, C.; Calabrò, G.; Spizzichino, V.; Partenzi, I.; Lanteri, L. Scientific Investigation of Contemporary Pastel Painting by Roberto Sebastian Matta: Characterization of Original Materials through Multispectral Imaging and Spectroscopic Techniques. Heritage 2023, 6, 2541–2558. [Google Scholar] [CrossRef]
- Iwanicka, M.; Moretti, P.; Pilz, K.; Doherty, B.; Cartechini, L.; Geldof, M.; de Groot, S.; Miliani, C.; Targowski, P. Congregation leaving the Reformed Church in Nuenen by Vincent van Gogh: A combined multi-instrumental approach to analyse the painting’s stratigraphy in support of varnish removal. Herit. Sci. 2022, 10, 167. [Google Scholar] [CrossRef]
- Pagnin, L.; Brunnbauer, L.; Wiesinger, R.; Limbeck, A.; Schreiner, M. Multivariate analysis and laser-induced breakdown spectroscopy (LIBS): A new approach for the spatially resolved classification of modern art materials. Anal. Bioanal. Chem. 2020, 412, 3187–3198. [Google Scholar] [CrossRef] [PubMed]
- Lama, E.; Prieto-Taboada, N.; Etxebarria, I.; Bermejo, J.; Castro, K.; Arana, G.; Rodríguez Laso, M.D.; Madariaga, J.M. Spectroscopic characterization of xx century mural paintings of punta begoña’s galleries under conservation works. Microchem. J. 2021, 168, 106423. [Google Scholar] [CrossRef]
- Germinario, G.; Talarico, F.; Torre, M. Microanalyses and Spectroscopic Techniques for the Identification of Pigments and Pictorial Materials in Monet’s Pink Water Lilies Painting. Microsc. Microanal. 2022, 28, 27–41. [Google Scholar] [CrossRef] [PubMed]
- Pappalardo, G.; Costa, E.; Marchetta, C.; Pappalardo, L.; Romano, F.P.; Zucchiatti, A.; Prati, P.; Mandò, P.A.; Migliori, A.; Palombo, L.; et al. Non-destructive characterization of Della Robbia sculptures at the Bargello museum in Florence by the combined use of PIXE and XRF portable systems. J. Cult. Herit. 2004, 5, 183–188. [Google Scholar] [CrossRef]
- Vandenabeele, P.; Castro, K.; Hargreaves, M.; Moens, L.; Madariaga, J.M.; Edwards, H.G.M. Comparative study of mobile Raman instrumentation for art analysis. Anal. Chim. Acta 2007, 588, 108–116. [Google Scholar] [CrossRef] [PubMed]
- Angelini, E.; Grassini, S.; Corbellini, S.; Ingo, G.M.; de Caro, T.; Plescia, P.; Riccucci, C.; Bianco, A.; Agostini, S. Potentialities of XRF and EIS portable instruments for the characterisation of ancient artefacts. Appl. Phys. A 2006, 83, 643–649. [Google Scholar] [CrossRef]
- Perez-Alonso, M.; Castro, K.; Martinez-Arkarazo, I.; Angulo, M.; Olazabal, M.A.; Madariaga, J.M. Analysis of bulk and inorganic degradation products of stones, mortars and wall paintings by portable Raman microprobe spectroscopy. Anal. Bioanal. Chem. 2004, 379, 42–50. [Google Scholar] [CrossRef] [PubMed]
- Casadio, F.; Toniolo, L. The analysis of polychrome works of art: 40 years of infrared spectroscopic investigations. J. Cult. Herit. 2001, 2, 71–78. [Google Scholar] [CrossRef]
- Leona, M.; Casadio, F.; Bacci, M.; Picollo, M. Identification of the Pre-Columbian Pigment Mayablue on Works of Art by Noninvasive UV-Vis and Raman Spectroscopic Techniques. J. Am. Inst. Conserv. 2004, 43, 39–54. [Google Scholar] [CrossRef]
- Delaney, J.K.; Ricciardi, P.; Glinsman, L.D.; Facini, M.; Thoury, M.; Palmer, M.; Rie, E.R. de la Use of imaging spectroscopy, fiber optic reflectance spectroscopy, and X-ray fluorescence to map and identify pigments in illuminated manuscripts. Stud. Conserv. 2014, 59, 91–101. [Google Scholar] [CrossRef]
- Bonizzoni, L.; Bruni, S.; Gargano, M.; Guglielmi, V.; Zaffino, C.; Pezzotta, A.; Pilato, A.; Auricchio, T.; Delvaux, L.; Ludwig, N. Use of integrated non-invasive analyses for pigment characterization and indirect dating of old restorations on one Egyptian coffin of the XXI dynasty. Microchem. J. 2018, 138, 122–131. [Google Scholar] [CrossRef]
- Sfarra, S.; Ibarra-Castanedo, C.; Tortora, M.; Arrizza, L.; Cerichelli, G.; Nardi, I.; Maldague, X. Diagnostics of wall paintings: A smart and reliable approach. J. Cult. Herit. 2016, 18, 229–241. [Google Scholar] [CrossRef]
- D’Amico, S.; Venuti, V.; Colica, E.; Crupi, V.; Majolino, D.; Paladini, G.; Guido, S.; Mantella, G.; Zumbo, R. Scientific investigation of the Conversion of St Paul painting (Mdina, Malta). In Proceedings of the 2019 IMEKO TC4 International Conference on Metrology for Archaeology and Cultural Heritage, Florence, Italy, 4–6 December 2019; 2019; pp. 330–334. [Google Scholar]
- Barone, G.; Crupi, V.; Longo, F.; Majolino, D.; Mazzoleni, P.; Raneri, S.; Venuti, V. A multi-technique approach for the characterization of decorative stones and non-destructive method for the discrimination of similar rocks. X-Ray Spectrom. 2014, 43, 83–92. [Google Scholar] [CrossRef]
- Appolonia, L.; Vaudan, D.; Chatel, V.; Aceto, M.; Mirti, P. Combined use of FORS, XRF and Raman spectroscopy in the study of mural paintings in the Aosta Valley (Italy). Anal. Bioanal. Chem. 2009, 395, 2005–2013. [Google Scholar] [CrossRef] [PubMed]
- Rosi, F.; Burnstock, A.; Van den Berg, K.J.; Miliani, C.; Brunetti, B.G.; Sgamellotti, A. A non-invasive XRF study supported by multivariate statistical analysis and reflectance FTIR to assess the composition of modern painting materials. Spectrochim. Acta Part A Mol. Biomol. Spectrosc. 2009, 71, 1655–1662. [Google Scholar] [CrossRef] [PubMed]
- de Faria, D.L.A.; Venâncio Silva, S.; de Oliveira, M.T. Raman microspectroscopy of some iron oxides and oxyhydroxides. J. Raman Spectrosc. 1997, 28, 873–878. [Google Scholar] [CrossRef]
- Bacci, M.; Casini, A.; Cucci, C.; Picollo, M.; Radicati, B.; Vervat, M. Non-invasive spectroscopic measurements on the Il ritratto della figliastra by Giovanni Fattori: Identification of pigments and colourimetric analysis. J. Cult. Herit. 2003, 4, 329–336. [Google Scholar] [CrossRef]
- Plutino, A.; Richard, N.; Deborah, H.; Fernandez-Maloigne, C.; Ludwig, N.G. Spectral Divergence for Cultural Heritage applications. Color Imaging Conf. 2017, 25, 141–146. [Google Scholar] [CrossRef]
- Cavaleri, T.; Giovagnoli, A.; Nervo, M. Pigments and Mixtures Identification by Visible Reflectance Spectroscopy. Procedia Chem. 2013, 8, 45–54. [Google Scholar] [CrossRef][Green Version]
- Dupuis, G.; Menu, M. Quantitative evaluation of pigment particles in organic layers by fibre-optics diffuse-reflectance spectroscopy. Appl. Phys. A 2005, 80, 667–673. [Google Scholar] [CrossRef]
- Cosentino, A. Effects of different binders on technical photography and infrared reflectography of 54 historical pigments. Int. J. Conserv. Sci. 2015, 6, 287. [Google Scholar]
- Gutiérrez-Neira, P.C.; Agulló-Rueda, F.; Climent-Font, A.; Garrido, C. Raman spectroscopy analysis of pigments on Diego Velázquez paintings. Vib. Spectrosc. 2013, 69, 13–20. [Google Scholar] [CrossRef]
- Briani, F.; Caridi, F.; Ferella, F.; Gueli, A.M.; Marchegiani, F.; Nisi, S.; Paladini, G.; Pecchioni, E.; Politi, G.; Santo, A.P.; et al. Multi-Technique Characterization of Painting Drawings of the Pictorial Cycle at the San Panfilo Church in Tornimparte (AQ). Appl. Sci. 2023, 13, 6492. [Google Scholar] [CrossRef]
- de Waal, D. Raman investigation of ceramics from 16th and 17th century Portuguese shipwrecks. J. Raman Spectrosc. 2004, 35, 646–649. [Google Scholar] [CrossRef]
- Striova, J.; Lofrumento, C.; Zoppi, A.; Castellucci, E.M. Prehistoric Anasazi ceramics studied by micro-Raman spectroscopy. J. Raman Spectrosc. 2006, 37, 1139–1145. [Google Scholar] [CrossRef]
- Moioli, P.; Seccaroni, C. Analysis of Art Objects Using a Portable X-ray Fluorescence Spectrometer. X-Ray Spectrom. 2000, 29, 48–52. [Google Scholar] [CrossRef]
- Mosca, S.; Frizzi, T.; Pontone, M.; Alberti, R.; Bombelli, L.; Capogrosso, V.; Nevin, A.; Valentini, G.; Comelli, D. Identification of pigments in different layers of illuminated manuscripts by X-ray fluorescence mapping and Raman spectroscopy. Microchem. J. 2016, 124, 775–784. [Google Scholar] [CrossRef]
- Muralha, V.S.F.; Miguel, C.; Melo, M.J. Micro-Raman study of Medieval Cistercian 12–13th century manuscripts: Santa Maria de Alcobaça, Portugal. J. Raman Spectrosc. 2012, 43, 1737–1746. [Google Scholar] [CrossRef]
- Angelini, I.; Asscher, Y.; Secco, M.; Parisatto, M.; Artioli, G. The pigments of the frigidarium in the Sarno Baths, Pompeii: Identification, stratigraphy and weathering. J. Cult. Herit. 2019, 40, 309–316. [Google Scholar] [CrossRef]
- Guglielmi, V.; Comite, V.; Andreoli, M.; Demartin, F.; Lombardi, C.A.; Fermo, P. Pigments on Roman Wall Painting and Stucco Fragments from the Monte d’Oro Area (Rome): A Multi-Technique Approach. Appl. Sci. 2020, 10, 7121. [Google Scholar] [CrossRef]
- Crocombe, R.A. Portable Spectroscopy. Appl. Spectrosc. 2018, 72, 1701–1751. [Google Scholar] [CrossRef]
- Colomban, P. The on-site/remote Raman analysis with mobile instruments: A review of drawbacks and success in cultural heritage studies and other associated fields. J. Raman Spectrosc. 2012, 43, 1529–1535. [Google Scholar] [CrossRef]
- Lauwers, D.; Hutado, A.G.; Tanevska, V.; Moens, L.; Bersani, D.; Vandenabeele, P. Characterisation of a portable Raman spectrometer for in situ analysis of art objects. Spectrochim. Acta Part A Mol. Biomol. Spectrosc. 2014, 118, 294–301. [Google Scholar] [CrossRef] [PubMed]
- Vandenabeele, P.; Edwards, H.G.M.; Jehlička, J. The role of mobile instrumentation in novel applications of Raman spectroscopy: Archaeometry, geosciences, and forensics. Chem. Soc. Rev. 2014, 43, 2628. [Google Scholar] [CrossRef] [PubMed]
- Vandenabeele, P.; Weis, T.L.; Grant, E.R.; Moens, L.J. A new instrument adapted to in situ Raman analysis of objects of art. Anal. Bioanal. Chem. 2004, 379, 137–142. [Google Scholar] [CrossRef] [PubMed]
- Gueli, A.M.; Bonfiglio, G.; Pasquale, S.; Troja, S.O. Effect of particle size on pigments colour. Color Res. Appl. 2017, 42, 236–243. [Google Scholar] [CrossRef]
- Gueli, A.M.; Pasquale, S.; Troja, S.O. Influence of vehicle on historical pigments colour. Color Res. Appl. 2017, 42, 823–835. [Google Scholar] [CrossRef]
- Burrafato, G.; Troja, S.; Gueli, A.M.; Stella, G.; Zuccarello, A. Ruolo della calibrazione nella valutazione delle varia-zioni cromatiche, Colore e Colorimetria contributi multidis-ciplinari. Quad. Di Fotonica E Ottica 2007, 13, 211–218. [Google Scholar]
- Bacci, M.; Picollo, M.; Trumpy, G.; Tsukada, M.; Kunzelman, D. Non-Invasive Identification of White Pigments on 20Th-Century Oil Paintings by Using Fiber Optic Reflectance Spectroscopy. J. Am. Inst. Conserv. 2007, 46, 27–37. [Google Scholar] [CrossRef]
- Montagner, C.; Bacci, M.; Bracci, S.; Freeman, R.; Picollo, M. Library of UV–Vis–NIR reflectance spectra of modern organic dyes from historic pattern-card coloured papers. Spectrochim. Acta Part A Mol. Biomol. Spectrosc. 2011, 79, 1669–1680. [Google Scholar] [CrossRef] [PubMed]
- Bacci, M.; Casini, A.; Picollo, M.; Radicati, B.; Stefani, L. Integrated non-invasive technologies for the diagnosis and conservation of the cultural heritage. J. Neutron Res. 2006, 14, 11–16. [Google Scholar] [CrossRef]
- Liu, Z.; Zhang, H.; Zhou, W.; Hao, S.; Zhou, Z.; Qi, X.; Shi, J. Pigment identification on an undated Chinese painting by non-destructive analysis. Vib. Spectrosc. 2019, 101, 28–33. [Google Scholar] [CrossRef]
- Palamara, E.; Palles, D.; Kamitsos, E.I.; Pratim Das, P.; Tirado, J.I.; Nicolopoulos, S.; Zacharias, N. Fragments of luxury: Opaque glass from the Palace of Mystras, Greece. J. Archaeol. Sci. Rep. 2023, 51, 104145. [Google Scholar] [CrossRef]
- Lin, C.H.; Chang, Y.F. Comparison and characterization of pigments and dyes by Raman spectroscopy. Anal. Sci. 2022, 38, 483–495. [Google Scholar] [CrossRef] [PubMed]
- Bell, I.M.; Clark, R.J.H.; Gibbs, P.J. Raman spectroscopic library of natural and synthetic pigments (pre- ≈ 1850 AD). Spectrochim. Acta Part A Mol. Biomol. Spectrosc. 1997, 53, 2159–2179. [Google Scholar] [CrossRef] [PubMed]
- Lafuente, B.; Downs, R.T.; Yang, H.; Stone, N. The power of databases: The RRUFF project. In Highlights in Mineralogical Crystallography; Armbruster, T., Danisi, R.M., Eds.; De Gruyter: Berlin, Germany, 2015; pp. 1–30. ISBN 9783110417104. [Google Scholar]
- Baraldi, P.; Fagnano, C.; Ghittoni, A.L.; Tassi, L.; Zannini, P. Vibrational spectra of some pigments from Pompeii. Acta Univ. Carol. Geol. 2002, 1, 49–65. [Google Scholar] [CrossRef]
- Baraldi, P.; Baraldi, C.; Curina, R.; Tassi, L.; Zannini, P. A micro-Raman archaeometric approach to Roman wall paintings. Vib. Spectrosc. 2007, 43, 420–426. [Google Scholar] [CrossRef]
- Bruni, S.; Cariati, F.; Consolandi, L.; Galli, A.; Guglielmi, V.; Ludwig, N.; Milazzo, M. Field and Laboratory Spectroscopic Methods for the Identification of Pigments in a Northern Italian Eleventh Century Fresco Cycle. Appl. Spectrosc. 2002, 56, 827–833. [Google Scholar] [CrossRef]
- Amadori, M.L.; Poldi, G.; Germinario, G.; Arduini, J.; Mengacci, V. Spectroscopic and Imaging Analyses on Easel Paintings by Giovanni Santi. Appl. Sci. 2023, 13, 3581. [Google Scholar] [CrossRef]
- Amadori, M.L.; Baraldi, P.; Barcelli, S.; Poldi, G. New Studies on Lorenzo Lotto ’ S Pigments: Non-Invasive and Micro-Invasive Analyses. In AI Ar. 2012 Modena, VII Congresso Nazionale di Archeometria, Atti del Congresso; Pàtron Editore: Bologna, Italy, 2011. [Google Scholar]
- IRUG. Keyword Search IRUG Spectral Database. Available online: http://www.irug.org/search-spectral-database (accessed on 10 November 2023).
- RRUFF. Search RRUFF Sample Data. Available online: http://rruff.info/ (accessed on 10 November 2023).
- Aceto, M.; Fenoglio, G.; Labate, M.; Picollo, M.; Bacci, M.; Agostino, A. A fast non-invasive method for preliminary authentication of mediaeval glass enamels using UV–visible–NIR diffuse reflectance spectrophotometry. J. Cult. Herit. 2020, 45, 33–40. [Google Scholar] [CrossRef]
- Elias, M.; Chartier, C.; Prévot, G.; Garay, H.; Vignaud, C. The colour of ochres explained by their composition. Mater. Sci. Eng. B 2006, 127, 70–80. [Google Scholar] [CrossRef]
- Marey Mahmoud, H.H. Colorimetric and spectral reflectance access to some ancient Egyptian pigments. J. Int. Colour Assoc. 2019, 24, 35–45. [Google Scholar]


Disclaimer/Publisher’s Note: The statements, opinions and data contained in all publications are solely those of the individual author(s) and contributor(s) and not of MDPI and/or the editor(s). MDPI and/or the editor(s) disclaim responsibility for any injury to people or property resulting from any ideas, methods, instructions or products referred to in the content. |
© 2024 by the authors. Licensee MDPI, Basel, Switzerland. This article is an open access article distributed under the terms and conditions of the Creative Commons Attribution (CC BY) license (https://creativecommons.org/licenses/by/4.0/).