Article

Prediction of Noise Levels According to Some Exploitation Parameters of an Agricultural Tractor: A Machine Learning Approach

Faculty of Agrobiotechnical Sciences Osijek, Josip Juraj Strossmayer University of Osijek, Vladimira Preloga 1, 31000 Osijek, Croatia
*
Author to whom correspondence should be addressed.
AgriEngineering 2024, 6(2), 995-1007; https://doi.org/10.3390/agriengineering6020057
Submission received: 28 February 2024 / Revised: 12 April 2024 / Accepted: 12 April 2024 / Published: 15 April 2024
(This article belongs to the Special Issue Implementation of Artificial Intelligence in Agriculture)

Abstract

:
The paper presents research on measuring and the possibility of prediction of noise levels on the left and right sides of the operator within the cabin of an agricultural tractor when moving across various agrotechnical surfaces, considering movement velocity and tire pressures while employing machine learning techniques. Noise level measurements were conducted on a LANDINI POWERFARM 100 type tractor, and aligned with standards (HRN ISO 5008, HRN ISO 6396 and HRN ISO 5131). The obtained noise values were divided into two data sets (left and right set) and processed using multiple linear regression (mlr) and three machine learning methods (gradient boosting machine (gbm); support vector machine using radial basis function kernel (svmRadial); monotone multi-layer perceptron neural network (monmlp)). The most accurate method, considering surfaces, from the left side data set—(R2 0.515–0.955); (RMSE 0.302–0.704); (MAE 0.225–0.488)—and the right side—(R2 0.555–0.955); (RMSE 0.180–0.969); (MAE 0.139–0.644)—was monmlp predominantly, and to a lesser extent svmRadial. On analyzing the total data sets from the left and right sides regarding surfaces, gbm emerged as the most accurate method. The application of machine learning methods demonstrated data accuracy, yet in future research, measurements on certain surfaces may need to be repeated multiple times potentially to improve accuracy further.

1. Introduction

Contemporary agricultural technology, through its development, not only leads to increased efficiency but also to the improvement of ergonomically designed operator workspaces. There are numerous factors influencing the operator workspace, and one of the most researched is noise. Noise is any unwanted sound that can have a negative impact on the operator’s health—Chandrappa et al. and Liu et al. [1,2]. An occupational illness that can result from noise exposure is hearing loss. Hearing loss can be of twofold: hearing loss caused by acute acoustic trauma and/or hidden hearing loss. Furthermore, hearing impairments are divided into two types: mechanical hearing impairments and metabolic hearing impairments. Considering that operators are often unaware of the extent of their exposure to noise in their environment and how they can protect themselves from potential hearing damage, it is necessary to raise awareness of the negative effects of noise—Ding et al. [3]. In their research—Araújo Alves et al. [4] (where they prepared a review of all works from 2016 to 2019 on the topic of the impact of low-frequency noise on operator health)—the authors noted that noise has a negative impact on the operator’s health in terms of sleep disorders, insomnia, irritability, discomfort, agitation, occurrence of hearing loss, and cardiovascular disease. They state that the indirect negative consequences of noise may include increased use of sleeping pills and antidepressants.
Noise in and around the tractor cabin is a result of the tractor engine operation, transmission component operation, exhaust gas passage through the exhaust pipe, air passage through the air cleaner, operation of the attached machinery or implements, and the condition of the surface over which the tractor moves, whereby transmitting vibrations to all tractor components which could ultimately lead to the generation of a certain noise level. The negative impact of noise on the operator manifests in reduced concentration and increased irritability. Breathing disorders may occur, errors during work are more frequent, and fatigue sets in more quickly, thereby affecting the performance or productivity of the equipment itself—Sabanci; Brkić et al.; EBSCOhost and Durczak et al. [5,6,7,8].
An extensive study, Scarlett et al. [9], investigates ergonomic factors when operating tractors without attached implements. Different types of surfaces and different tractor speeds significantly influence them and consequently affect the tractor operator. With various surfaces and movement speeds, the authors simulated different agrotechnical operations—plowing, cultivation, spraying, transport—and they carried them out according to the HRN ISO 5008 standard [10].
In addition to the abovementioned factors (different surfaces, speed of movement and air pressure in the tires) that are taken into account in this research, there are, according to Sirin et al., Xiong and Flor et al. [11,12,13], many other factors that influence the produced noise level. Of more importance are the following: types of tires, stiffness of the surface, type of engine, thickness of the asphalt surface, type of exhaust system, and several climatic factors. In this research, the latter were not considered because they were constant throughout.
The unit dB is used to measure noise, but since the human ear does not respond equally to all noise frequencies, the A weighted frequency filter is used (the unit dB(A)). The unit dB(A) is a weighted scale that corresponds to the hearing threshold of the human ear, so that the human ear responds equally to high and low frequencies.
The Regulation on the Protection of Workers from Exposure to Noise at Work [14] (NN, 46/2008) sets out the exposure limit values and exposure warning values during an eight-hour working day, as well as the following peak sound pressure levels:
  • exposure limit value: L(EX,8 h) = 87 dB(A) and p(peak) = 200 Pa (140 dB(C) relative to the reference sound pressure of 20 μPa);
  • upper exposure warning limit: L(EX,8 h) = 85 dB(A) and p(peak) = 140 Pa (137 dB(C) relative to the reference sound pressure of 20 μPa);
  • lower exposure warning limit: L(EX,8 h) = 80 dB(A) and p(peak) = 112 Pa (135 dB(C) relative to the reference sound pressure of 20 μPa).
Butkus et al. [15] indicated that the trend of noise level change is correlated with the year of production, meaning that older tractors tend to have higher noise levels. On average, there was an observed increase in noise of 1 dB(A) for each subsequent year of tractor age. The research covered 50 different agricultural tractors from 1981 to 2015. Measurement results show a wide fluctuation in noise levels inside the cabins. As this study included both modern and old agricultural tractors used, noise levels ranged from 67.7 dB(A) to 94.7 dB(A), with the highest recorded value being 119 dB(A). Mofrad et al. [16] measured noise levels on a MASEY FERGUSON 399 tractor with and without a cabin at 1500, 1750, and 2000 engine revolutions per minute. For tractors without a cabin, the highest measured noise level was 88 dB(A) at 2000 engine revolutions per minute, while for tractors with a cabin, the highest noise level, also at 2000 engine revolutions per minute, was 72 dB(A), significantly lower compared to tractors without cabins. Barač et al. [17] stated that measurements of noise levels on a LANDINI POWERFARM DT100A tractor moving across three agrotechnical surfaces (grass, gravel, and asphalt) did not exceed the permitted level. The tests were performed according to standards that considered internal noise measurements during movement, and the tractor had 5800 operating hours at the time of measurement. Barač et al. [18,19] conducted noise level measurement during operation (when standing and moving) on three FENDT tractors (model 410). During the exploitation experiment, the tractors performed similar agrotechnical operations and had the same number of working hours. The research lasted three years. The obtained values indicate that none of the investigated tractors produced a noise level higher than 80 dB(A), thus not exceeding the permissible limit. Souza et al. [20] measured noise inside and outside the tractor on two tractors of different power. The obtained values did not exceed the permissible limit of 85 dB(A), and it was found that the TL85E tractor had lower measured values compared to the MF265 tractor. Research on noise levels on two types of tractors from 1993 and 2013 was conducted in the largest agricultural region in Romania. It was found that older tractor types produced noise at 95.5 dB(A), exceeding the permissible limit by 10.5 dB(A), while for newer tractor types from 2013, the noise level was lower than the limit at 65.9 dB(A) Picu [21]. Poje et al. [22] stated that the measured noise level on the IMT 565 DV tractor with double-drum winch type LIV with 80 kN capacity under light load did not exceed the permitted noise level, while under heavy load, it could reach higher than 88 dB(A). The tested tractor was 5 years old. Due to its low price and cheap maintenance, this tractor is very often used in the forestry of southeast Europe, where the research was carried out.
The application of machine learning in ergonomics is becoming increasingly recognized for predicting data accuracy, especially in terms of the safety and health of agricultural workers as stated by Son et al. and Nath et al. [23,24]. This is especially the case when predicting results when considering a significantly larger number of factors (which do not necessarily have to be exploitative, but include also health), and where the data set of input values is very big.
The aim of this research was to measure the noise level inside the cabin of an agricultural tractor as it moves across various agrotechnical surfaces, at different speeds, and with changes in air pressure in the tires, and to apply, using multiple linear regression (mlr), three machine learning methods (gbm, svmRadial, monmlp) to determine which machine learning method can most accurately predict the level of generated noise in the tractor under various working conditions and to comprehensively assess the importance of independent variables.

2. Materials and Methods

The workflow of the proposed tractor noise prediction approach based on machine learning regression consisted of three primary steps (Figure 1): (1) Exploratory analysis of input tractor noise datasets from its left and right side according to six evaluated surfaces. (2) Machine learning prediction of noise levels and accuracy assessment based on 10-fold cross-validation. (3) Variable importance analysis according to three independent variables used for prediction.

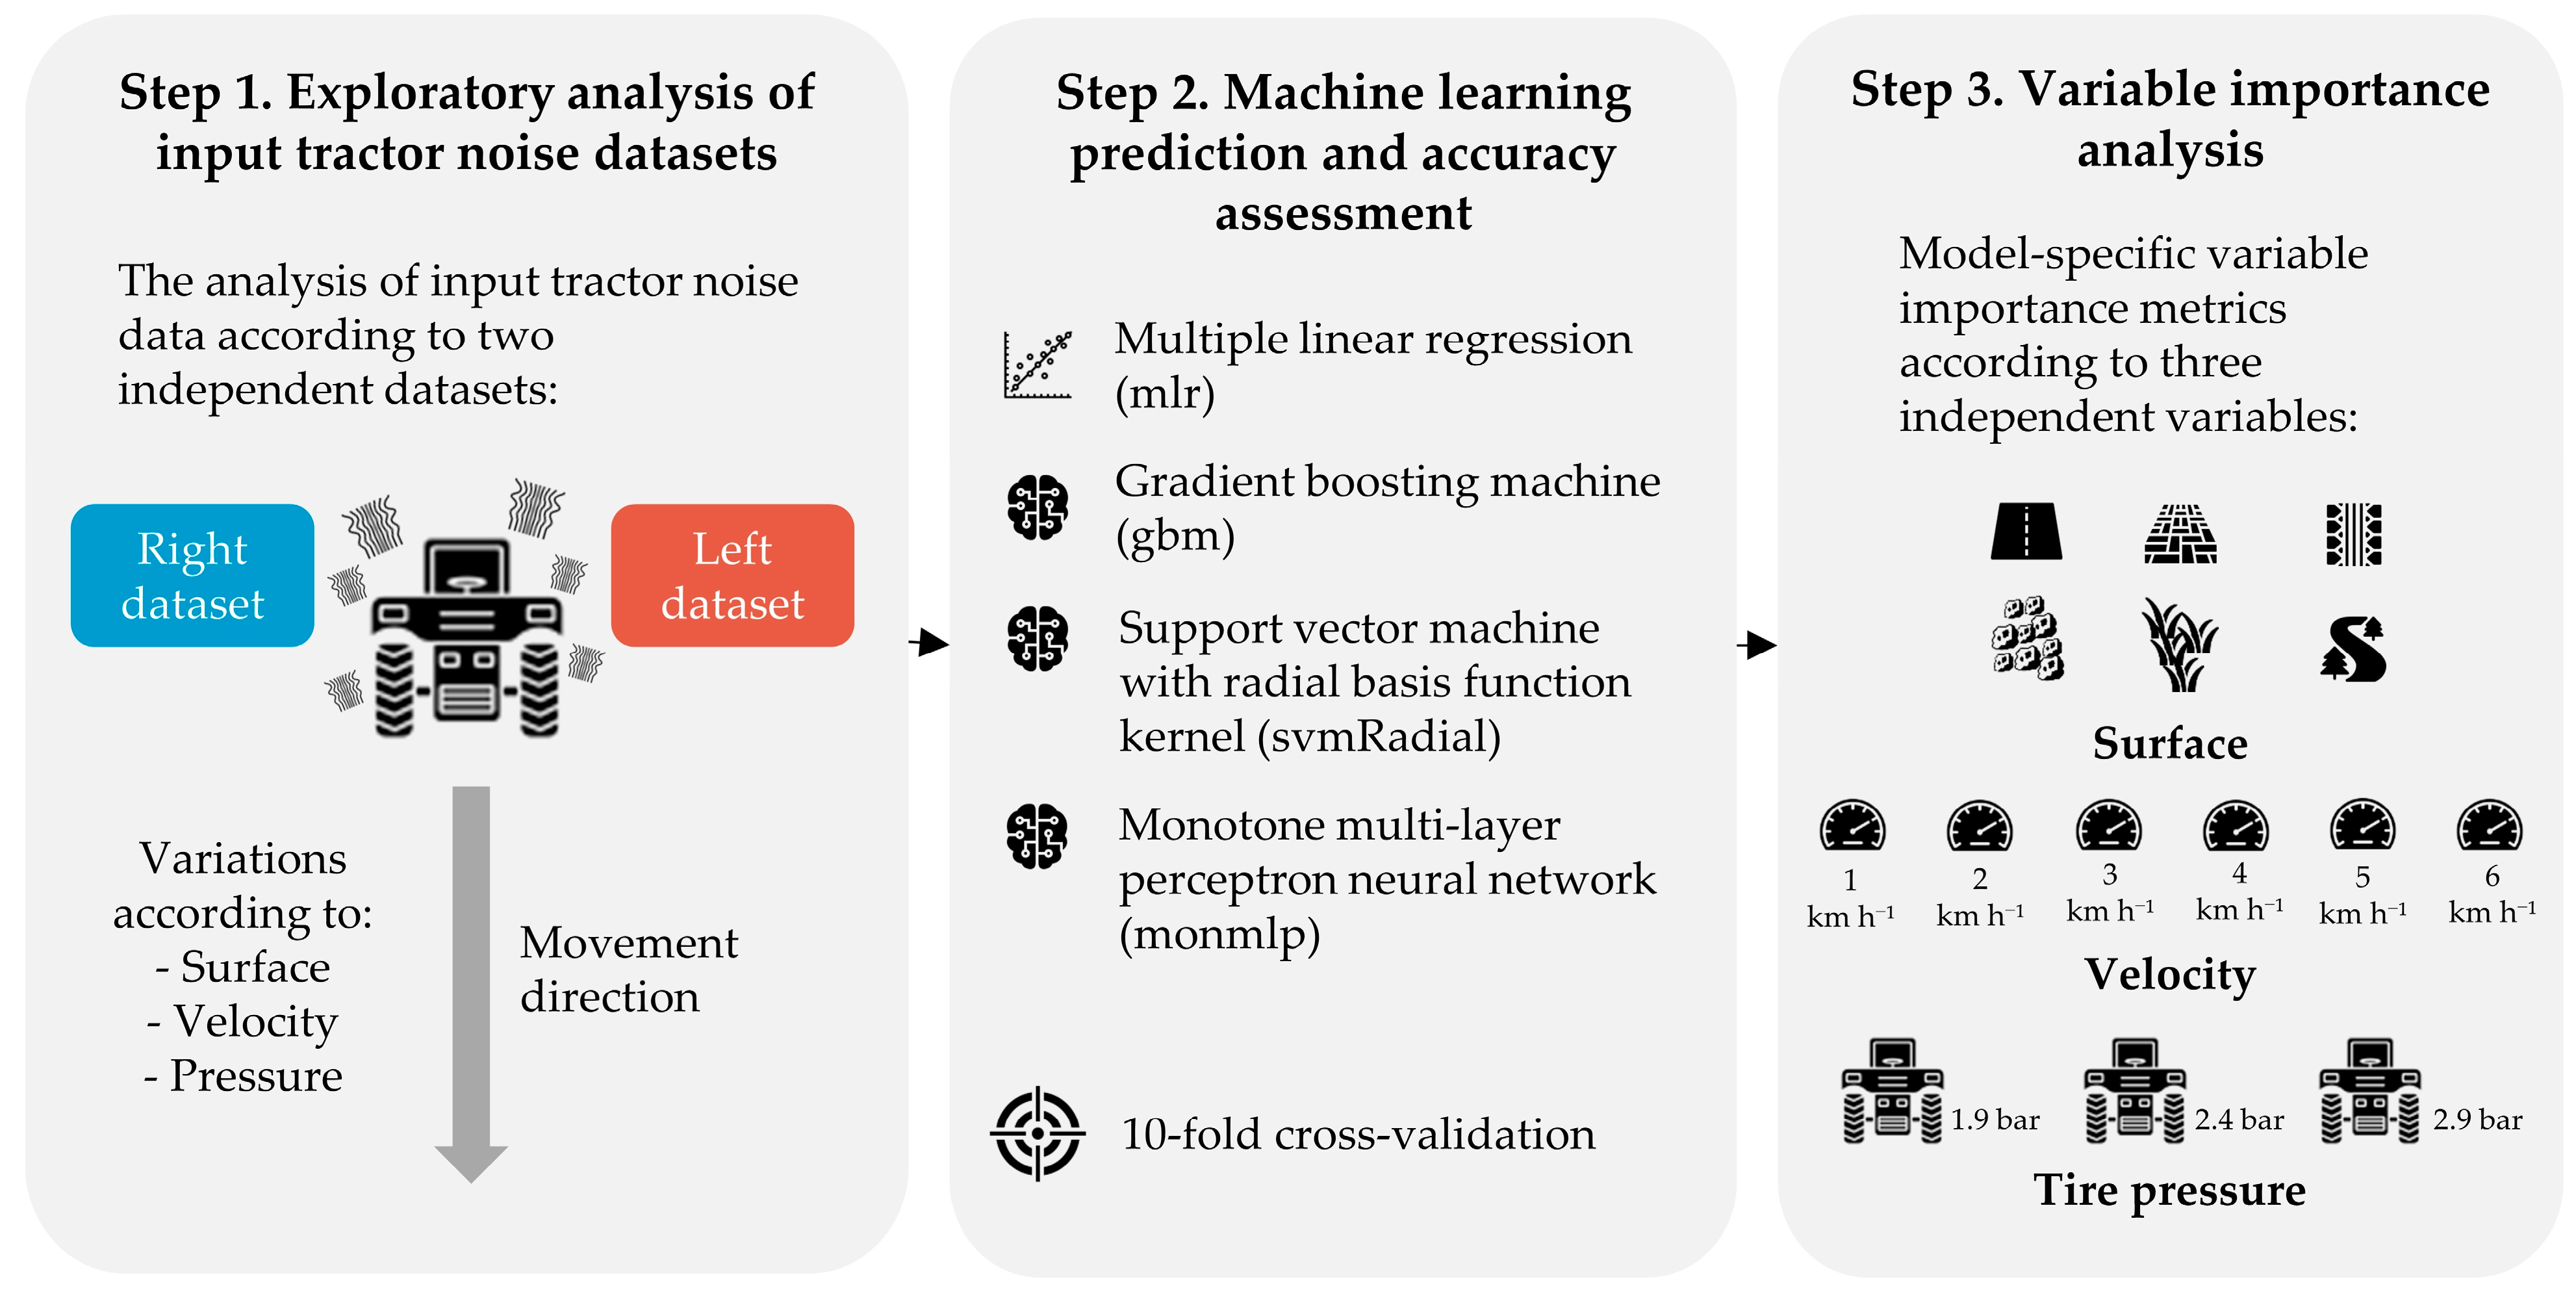
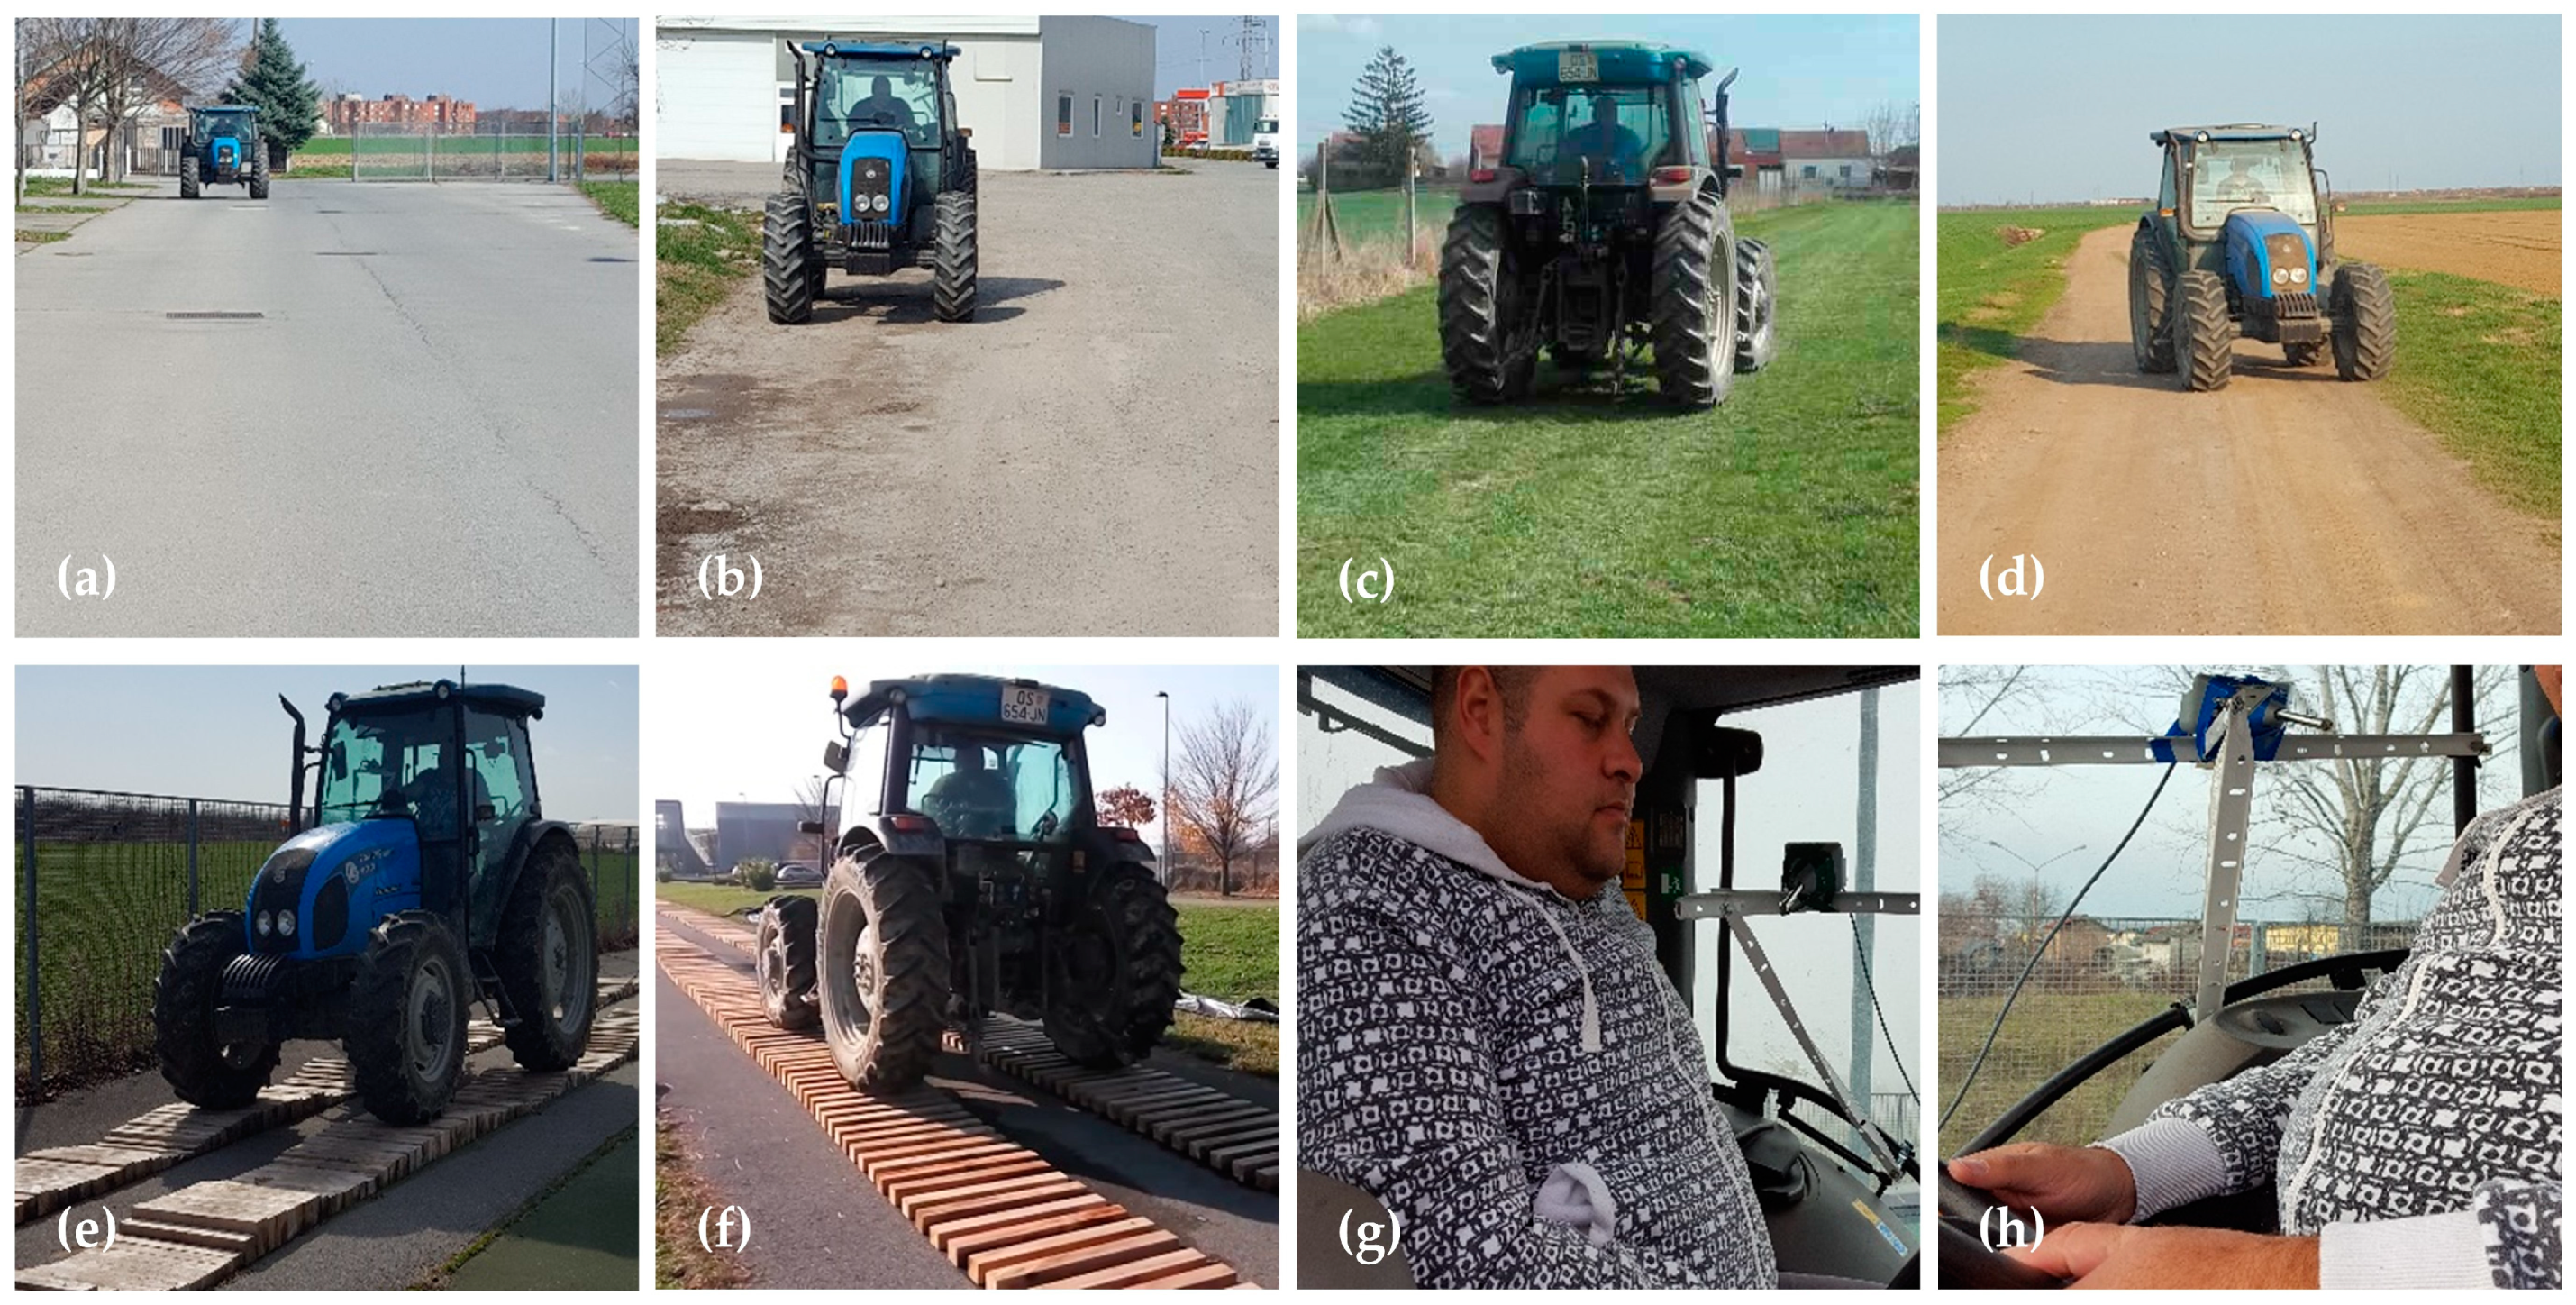
2.1. Exploitation Research

The research was conducted on productive agricultural areas and access roads of the Agricultural and Veterinary School Osijek (45°32′16.32632″ N, 18°40′48.18666″ E) using a LANDINI POWERFARM 100 tractor, with a nominal power of 68 kW (without any attached implements). Noise level measurement was performed while traversing four different agrotechnical surfaces (asphalt, gravel, grass, and dirt road) and two standardized test tracks (smooth and rough) according to standard HRN ISO 5008 [10] (Figure 2). These two test tracks were made in accordance with the mentioned standard, with the smooth test track being 100-m long and the rough one 35-m long. The tracks were constructed separately for each wheel track using rubber, which served as the base, and wooden slats of various dimensions to simulate unevenness.
During the research, tire air pressure was set as follows: prescribed (2.4 bar), lower than prescribed (1.9 bar), and higher than prescribed (2.9 bar). Tractor speeds on the selected surfaces were chosen according to the standard [10] and ranged from 6, 5, 4, 3, 2, to 1 kmh−1. Recommended speeds on the smooth test track were up to 12 kmh−1 and up to 5 kmh−1 on the rough track [10].
Noise was measured using a METREL brand sound level meter type MI 6201 MULTINORM equipped with the corresponding A-filter microphone. The Class 1 microphone has a measurement range of 30 to 140 dB(A) with a resolution of 0.1 dB(A). According to EN 61672 accuracy at the reference frequency of 1 k Hz, the tolerance limits are +/−1.1 dB(A). At the lower and upper extremities of the frequency range, the tolerances are wider. At 20 Hz, the tolerances are +/−2.5 dB(A). At 16 Hz, the tolerances are +2.5 dB(A) and −4.5 dB(A). The instrument measures the Leq (or LAeq)—the equivalent continuous sound pressure level. During measurement, it was in the sound level meter mode (SLM), which simultaneously measures and calculates 19 measurements on two independent channels. That is 13 measurements on the first channel (LAF1, LAeq1, LAFmax1, LAFmin1, LApeak1, LAE1, L01, L05, L10, L50, L90, L95, and L99) and 6 on the second (LAF2, LAeq2, LAFmax2, LAFmin2, LApeak2, LAE2), which is in accordance with the standard HRN ISO 61672 [25]. In each channel, time evaluation FAST and frequency evaluation A were set. The interval of measurement values of collecting was 170 millisecond or approximately 6 times per second. The sound level meter was positioned according to standard HRN ISO 6396 [26], which dictates that measurement be conducted inside the tractor cabin while in motion. Throughout the measurements, doors, windows, or any other openings on the tractor cab were closed. The ventilation did not produce airflow that could affect the microphone during measurements. The tractor operator did not wear clothing that could produce additional noise or mitigate noise, and no helmet was worn. The operator’s height in the seated position ranged within the specified values, from 800 mm to 960 mm, measured from the seating surface of the seat to the top of the operator’s head.
Standard HRN ISO 5131 [27] dictates that the sound level meter microphone must be positioned 250 mm ± 20 mm from the center of the operator’s head and at a height of 700 mm ± 20 mm above the seat’s reference point and 100 mm ± 20 mm forward from the seat’s reference point. The microphone was placed according to these dimensions on both the left and right sides of the operator during measurements (Figure 2). During testing, there were no buildings or similar obstacles within a 20-m radius of the tested tractor, and thus there was no influence of surrounding noise on the measurement during the research. During the measurement, no other source of noise was present. Wind speed did not exceed 5 m/s. The temperature during noise measurement was also within the specified range of −5 °C to 30 °C, and only the tractor operator was present in the cabin.

2.2. Machine Learning Prediction and Accuracy Assessment

The machine learning prediction of tractor noise was performed independently for left and right input datasets using three independent variables for regression: surface, velocity, and tire pressure. Gradient boosting machine, support vector machine with radial basis function kernel, and monotone multi-layer perceptron neural network were evaluated for the prediction, having achieved high prediction accuracy in previous studies related to ergonomics—Hota et al. and Singh et al. [28,29] and agriculture in general Saleem et al. and Varga et al. [30,31]. These methods are also mutually complimentary, representing three of the fundamental machine learning prediction principles: decision trees (gradient boosting machine), support vector machines, and artificial neural networks (monotone multi-layer perceptron neural network). The conventional multiple linear regression (mlr) was performed to provide reference prediction accuracy, which was used to assess the efficiency of the evaluated machine learning prediction methods according to the conventional approach. Machine learning predictions were performed in R v4.0.3 using caret library.
The gradient boosting machine (gbm) merged the results of several weak learners from decision trees into a strong predictive model on an iterative basis—Konstantinov and Utkin [32]. It successively trained a number of decision trees, each one improving on the mistakes made by the one before it, utilizing a stochastic approach. A mini-batch, sometimes referred to as a random subset of the input noise data, is sampled for each iteration, defined by the number of trees built during the training process (n.trees). A higher number of n.trees raises the possibility of overfitting since the model can start to fit prediction noise in the data. In addition, gbm has a learning rate (shrinkage) that regulates how much each tree contributes to the overall model, with the two hyperparameters being tuned and set jointly since smaller shrinkage values require larger n.trees to obtain comparable performance. While larger learning rates can produce faster convergence but may result in overfitting, smaller learning rates can prevent the algorithm from overfitting and may necessitate the use of more trees to achieve comparable performance—Konstantinov and Utkin [29]. The maximum depth of interaction between variables in each tree was controlled by the interaction-depth hyperparameter, while the minimal number of observations needed in a terminal node of a decision tree was specified by n.minobsinnode. The ensemble often converges to a powerful predictive model, and the final prediction is a weighted mixture of the predictions from all the trees. These properties result in the advantage of gbm in managing complicated, high-dimensional data, capturing non-linear correlations, and automatically choosing pertinent characteristics—Ayyadevara [33].
Support vector machine using radial basis function kernel (svmRadial) determined the appropriate hyperplane for separating input noise data points in a high-dimensional feature space—Scholkopf and Smola [34]. The original input noise data were implicitly mapped into a higher-dimensional space using the radial basis function kernel, sometimes referred to as the Gaussian kernel, so that the data may be linearly separated—Müller et al. [35]. The svmRadial seeked to locate a hyperplane in this converted space that optimizes the margin between the points, with the margin being the separation between the closest data points—Scholkopf and Smola [34]. The radial basis function kernel was defined with a width that was controlled by sigma hyperparameter, establishing how each training example affects the decision margin. The decision border becomes smoother as sigma values increase because a larger Gaussian curve indicates that data points have a greater overall impact—Müller et al. [35]. The regularization parameter, or cost in svmRadial, was denoted by C. It managed the trade-off between minimizing the regression error on the training data, allowing greater regularization by smaller values of C, increasing the margin but perhaps enabling some training instances to be mispredicted.
The monotone multi-layer perceptron neural network (monmlp) provide a flexible machine learning model that can identify complex patterns in input noise data by introducing monotonicity requirements into its design, expanding the conventional multi-layer perceptron—Eskandarian et al. [36]. Its major objective is to simulate relationships between the input characteristics and the target noise variable in a way that ensures the predictions retain a steady directional trend, anticipating output consistently as the values of specific input attributes increase or decrease—Kamala and Nawaz [37]. The number of neurons in the hidden layer of the monotonic multi-layer perceptron model was controlled by the hidden1 hyperparameter, which inferred intricate patterns and representations from the input noise data. The number of multi-layer perceptron models to include in the ensemble was controlled by the hyperparameter n.ensemble. In order to increase prediction accuracy and decrease overfitting, assembling entails, training many models individually and integrating their predictions with an ensemble having a higher value of n.ensemble, can be more reliable and accurate, but may also demand more hardware computational efficiency.
To ensure the optimal predictive performance of the gbm, svmRadial, and monmlp machine learning methods evaluated in the study, the automated hyperparameter tuning in caret was performed to determine their optimal configuration. The root mean square error was used as a hyperparameter tuning criterion, prioritizing prediction accuracy by selecting the model configuration with the minimum root mean square error. The impact of certain predictor variables on the result of a machine learning regression model was assessed using model-specific variable importance metrics (https://topepo.github.io/caret/variable-importance.html (accessed on 27 February 2024)). The variable importance of the mlr model was quantified using the absolute value of the resulting t-statistic, while gbm summed variable importances over each boosting iteration. The svmRadial variable importance was determined indirectly by quantifying the impact on the decision boundary support vectors, while monmlp did not provide a functionality for quantifying variable importance, which is one of its main disadvantages. Despite the differences of absolute value ranges for these metrics across evaluated prediction approaches in this study, their relative relationship enabled comprehensive evaluation of the importance of independent variables—Bonaccorso [38].
The accuracy assessment of machine learning regression predictions for noise in agricultural tractors was performed with a 10-fold cross-validation. This included an iterative process containing predictions using 90% of training and 10% of test data in 10 iterations for each model and independent dataset. Three frequently used metrics were applied for the accuracy assessment: coefficient of determination (R2), root mean square error (RMSE), and mean absolute error (MAE)—Chicco et al. [39]. R2 quantified the percentage of the variation of the noise levels in the agricultural tractor that the particular method successfully explained. The average prediction error was measured using the RMSE formula, which squared the errors before taking their square root to get results in the same units as the noise levels. Another way to assess prediction error is MAE, indicating the average residual between the model’s predictions and the actual noise levels. Since MAE did not square the errors, it was less prone to larger residuals than RMSE. The higher R2 and lower RMSE and MAE indicated higher noise prediction accuracy. These metrics were calculated according to Equations (1)–(3):
R 2 = 1 SSR SST   ,
RMSE = 1 n ( y predicted     y input ) 2 n ,
MAE = 1 n y predicted     y input 2 n   ,
where SSR represented the sum of squares of residuals between input and predicted tractor noise levels, SST represented total sum of squares, n was the number of samples, ypredicted representing the predicted tractor noise values, and yinput represented the input tractor noise values.
The balance between model complexity and generalization for gbm was achieved with n.trees = 150, while the interaction depth had 3 captured significant feature interactions without being too complicated. A relatively small shrinkage value of 0.1 provided the gradual learning process, which enhanced the model’s ability to generalize and avoid overfitting, using a minimum of 10 terminal nodes per decision tree. A sigma of 0.34 for svmRadial implies a good compromise between catching detailed patterns in data and avoiding overfitting, while C of 1 denotes a balanced approach to this trade-off, prioritizing error reduction. The hidden1 hyperparameter of monmlp produced 5 neurons in the first hidden layer, while a single instance of the monmlp was used according to the n.ensemble hyperparameter, without performing ensemble averaging (Table 1).

3. Results and Discussion

The descriptive statistics of left and right noise input datasets are presented in Table 2. Box plots of the left and right input data sets of noise according to the type of surface are visible in Figure 3. The median is higher on the left side for all measured surfaces, except for the rough track and asphalt, where it is higher on the right side. Similarly, the data dispersion is greatest precisely on the rough track. During measurements on the rough track, the greatest unevenness is present on both the left and right sides of the wheels, and since the tractor’s exhaust pipe is located on the right side due to significant and sudden lateral movement of the tractor, the obtained median is higher.
The highest median was obtained during measurements on the grassy surface on the left side, where unevenness on the actual driving surface was observed during measurements. In this case, the tractor moved with minimal lateral displacement, while more movement was achieved in the forward–backward direction of the tractor’s movement. The lowest median was obtained on the right side on the dirt road.
The interquartile range of noise level is higher on the left side for all surfaces. It is highest on the left side on the rough strip, while it is lowest on the right side on the dirt road. It is important to emphasize that none of the data exceeds the permitted noise level according to the Regulation on the Protection of Workers from Exposure to Noise at Work [10]. In the case of the presence of outliers, their highest number is present on the right side, except for the dirt road where the outliers are on the left.
From Table 3 for the input dataset of measured noise levels on the left side, it was determined that monmlp generally performs best for individual surfaces (with a smaller amount of more homogeneous data), while gbm is the best performer for the overall dataset in both cases (due to better integration of heterogeneous data). Furthermore, significant superiority of all machine learning methods over conventional multiple regression was observed for all surfaces and both sides of the measurements, individually and overall. The significance was established across different surfaces and tractor movement speeds, as also noted in the study by Hota et al. [28]. Singh et al. [29] stated that the coefficient of determination ranged from 0.82 to 0.90 (which is a similar case here as well) and highlighted the speed of movement as a variable with significant impact on ergonomic factors. Furthermore, Lashgari and Maleki [40], in their study of the influence of different speeds when mowing grass with a tractor mower on the produced noise level, stated that the coefficient of determination R2 was 0.957, which is also the case in the research of Barac et al. [19], where noise was measured at the operator’s workplace in relation to the age of the tractor. In the aforementioned research, a lower coefficient of determination (R2 = 0.675), was achieved. The lowest accuracy with the monmlp method (R2, RMSE, and MAE) was observed on a smooth track, while the highest was determined for the asphalt surface (R2) and dirt road (RMSE, MAE).
A very similar relative accuracy ratio for all methods from the dataset on the left and right sides of the operator’s cabin is evident. The right dataset (Table 4) resulted in slightly lower overall accuracy compared to the left dataset. Aiello et al. and Irumva et al. [41,42] stated that the research results regarding ergonomic factors provide accuracy in prediction using machine learning, which was also determined in this study. In the author’s research on ergonomic factors—Upadhyay et al. [43]—the gbm machine learning model showed the highest accuracy, which is the case here when considering the overall datasets from the left and right sides of the operator’s cabin on all surfaces. A similar coefficient of determination (R2 = 0.823) when measuring noise on log loaders with and without a cabin at the log dump was stated by Melemez and Tunay [44].The highest accuracy with the monmlp method (R2, RMSE, and MAE) was observed on the asphalt surface, while the lowest was found on the smooth track (R2, RMSE, and MAE) using the svmRadial method.
From the changing metrics of importance for the left and right input datasets of noise in the machine learning prediction method (Figure 4), it was determined that, regardless of the absolute scale of importance of independent variables according to the mentioned method, their relative relationship is stable. Furthermore, for the most accurate method for the overall datasets (gbm), the surface is the most influential parameter. For all three machine learning methods for the right input datasets, the parameters of surface and speed are more important than for the left, while for the tire pressure parameter, it is the opposite.

4. Conclusions

This study aimed to apply machine learning methods to predict the accuracy of the obtained data for measured noise levels in the cabin of an agricultural tractor while moving across various agrotechnical surfaces, at different speeds of movement, and with varying tire air pressure.
By employing machine learning on the measured noise level values within the cabin of the agricultural tractor on the left and right sides of the operator, aiming for more accurate prediction, the following was concluded:
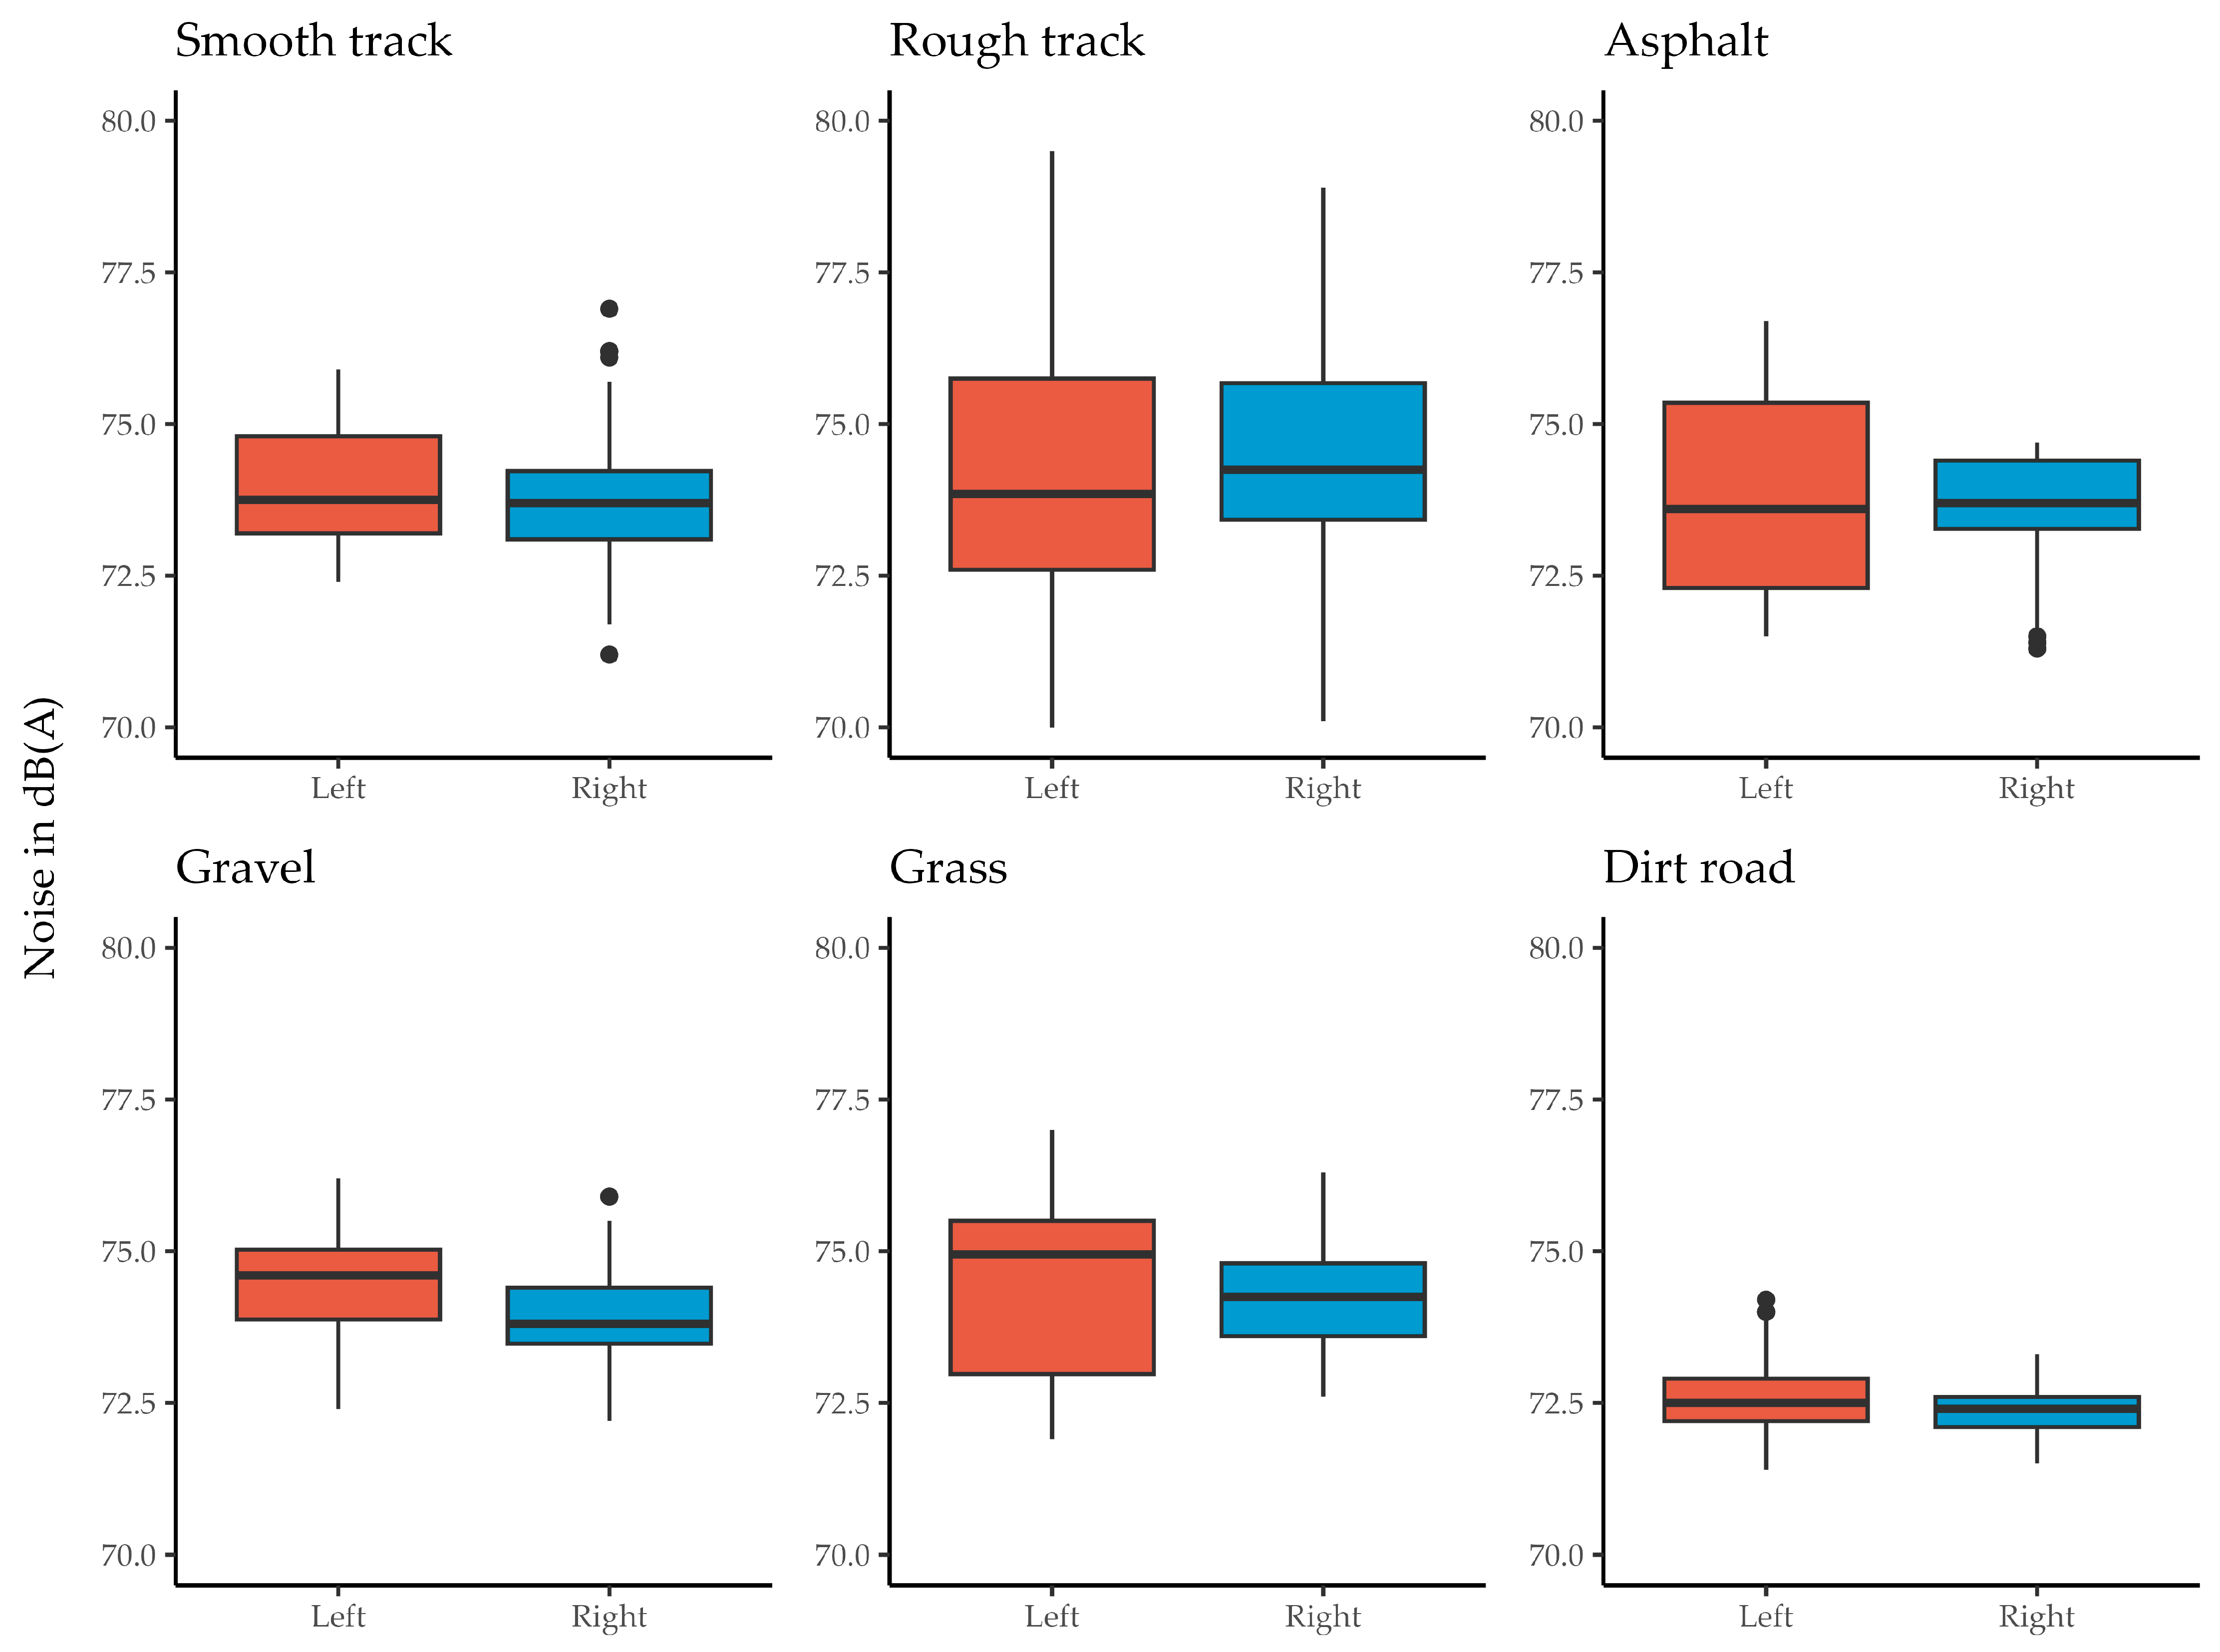
  • From the diagrams of left and right input noise datasets according to the type of surface, it was found that the median and interquartile range are higher for all measurement surfaces on the left side compared to the right side (with the exception of the median on asphalt and rough track where it was higher on the right).
  • Superiority of all machine learning methods over conventional multiple regression was determined for all surfaces, considering each surface individually and collectively.
  • Observing the input dataset of noise on the left side, it was found that the machine learning method, monmlp, is the best for each surface individually, while the gbm method is the best for all surfaces in both cases (left and right).
  • A slightly lower accuracy was observed from the dataset of noise on the right side, overall for all surfaces, compared to the data on the left side.
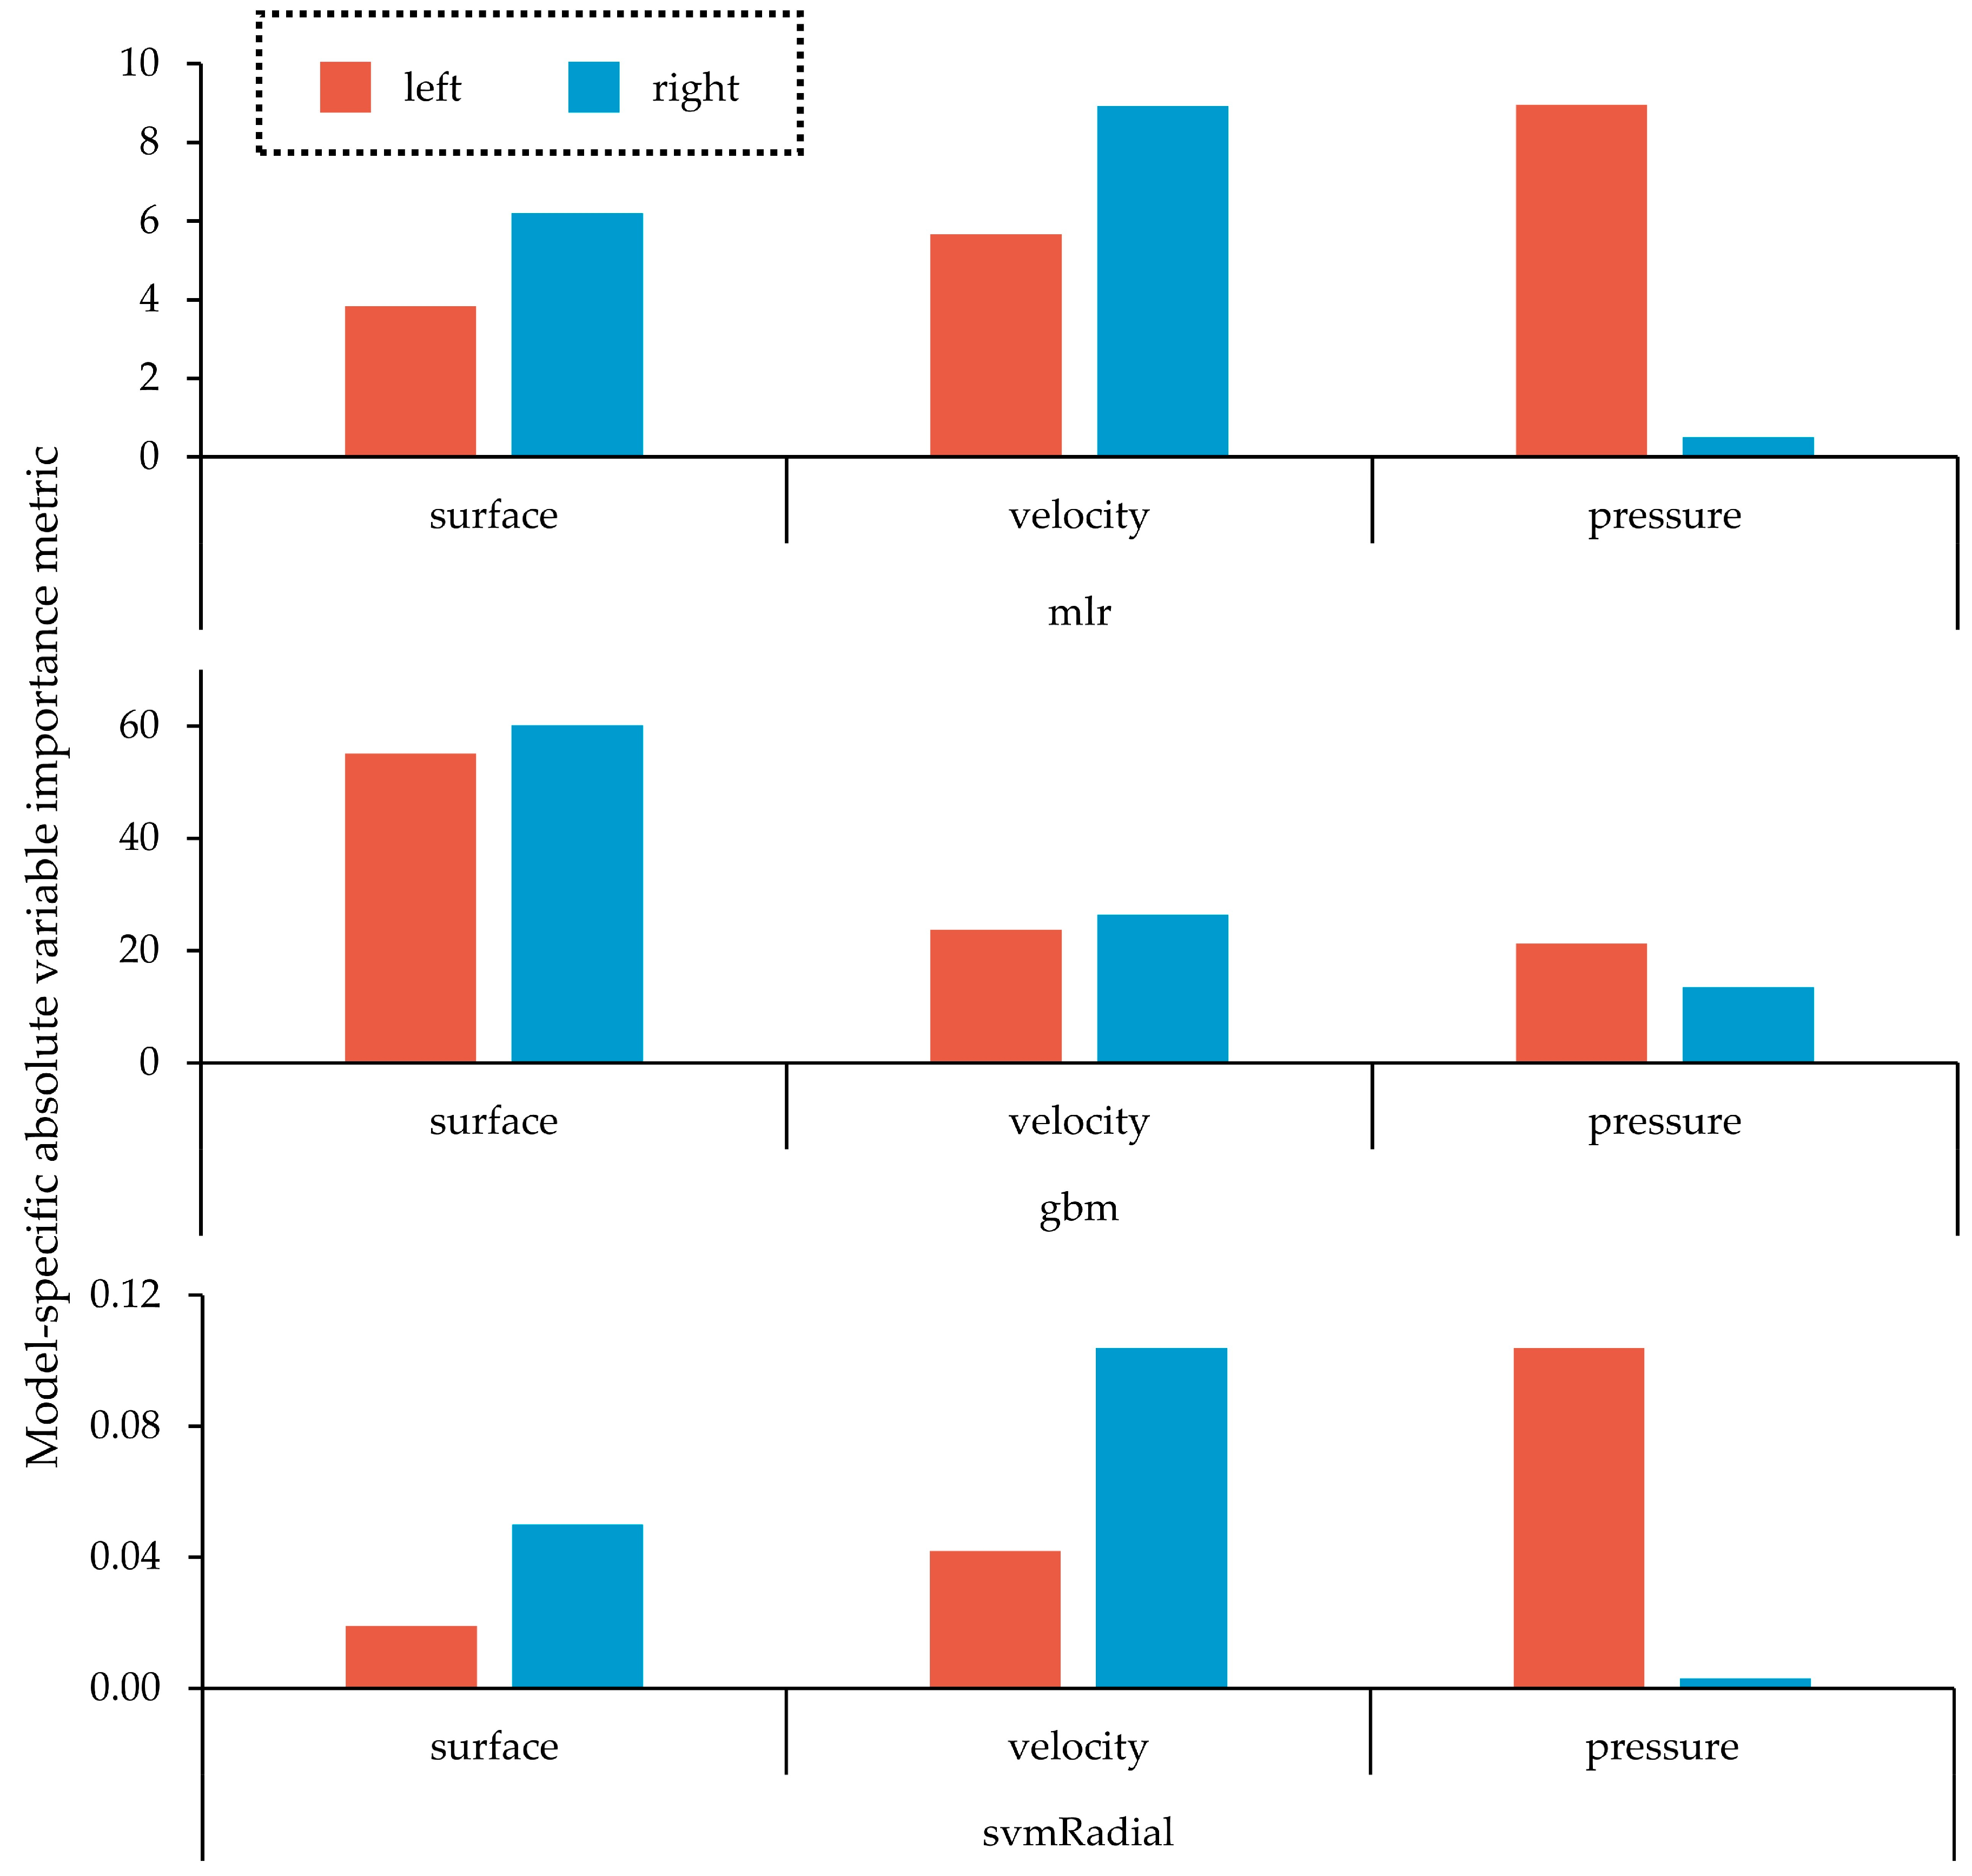
  • From the changing importance metrics for left and right input datasets of noise, for the most accurate method for overall datasets (gbm), it was found that the surface has the highest influence on noise, while for all three methods, surface and speed are more important for the right side than the left, whereas for tire pressure, it is the opposite.
The application of machine learning methods proved accurate in predicting noise values within the cabin of the agricultural tractor on both (left and right) sides of the operator. Furthermore, in future research, it would be advisable to increase the number of measurements (gathered data) on some surfaces to improve the accuracy as much as possible. None of the measured data exceeded the permitted noise exposure limit and thus did not pose a negative impact on the operator’s health.

Author Contributions

Conceptualization, Ž.B. and D.R.; methodology, Ž.B. and D.R.; software, D.R.; validation, Ž.B., D.R., I.P., M.J. and M.M.; formal analysis, Ž.B.; investigation, Ž.B. and D.R.; resources, Ž.B.; data curation, Ž.B. and D.R.; writing—original draft preparation, Ž.B., D.R. and I.P.; writing—review and editing, Ž.B., D.R., I.P., M.J. and M.M.; visualization, D.R.; supervision, I.P.; project administration, M.J.; funding acquisition, Ž.B., D.R., I.P., M.J. and M.M. All authors have read and agreed to the published version of the manuscript.

Funding

This research received no external funding.

Data Availability Statement

The data presented in this study are available on request from the corresponding author.

Conflicts of Interest

The authors declare no conflicts of interest.

References

  1. Chandrappa, R.; Das, D.B. Noise Pollution. In Environmental Health—Theory and Practice: Volume 2: Coping with Environmental Health; Chandrappa, R., Das, D.B., Eds.; Springer International Publishing: Cham, Switzerland, 2021; pp. 141–148. ISBN 978-3-030-64484-0. [Google Scholar]
  2. Liu, F.; Jiang, S.; Kang, J.; Wu, Y.; Yang, D.; Meng, Q.; Wang, C. On the Definition of Noise. Humanit. Soc. Sci. Commun. 2022, 9, 406. [Google Scholar] [CrossRef] [PubMed]
  3. Ding, T.; Yan, A.; Liu, K. What Is Noise-Induced Hearing Loss? Br. J. Hosp. Med. 2019, 80, 525–529. [Google Scholar] [CrossRef] [PubMed]
  4. Araújo Alves, J.; Neto Paiva, F.; Torres Silva, L.; Remoaldo, P. Low-Frequency Noise and Its Main Effects on Human Health—A Review of the Literature between 2016 and 2019. Appl. Sci. 2020, 10, 5205. [Google Scholar] [CrossRef]
  5. Sabanci, A. Ergonomi. Baki Kitapevi, Yayın No: 13. Adana 1999, 7, 343–357. [Google Scholar]
  6. Brkić, D.; Vujčić, M.; Šumanovac, L.; Lukač, P.; Kiš, D.; Jurić, T.; Knežević, D. Eksploatacija Poljoprivrednih Strojeva; Poljoprivredni fakultet u Osijeku: Osijek, Croatia, 2005. [Google Scholar]
  7. EBSCOhost|154991873|Noise and Vibrations Produced by Tractors and Selfpropelled Agricultural Machinery. Available online: https://eds.p.ebscohost.com/abstract?site=eds&scope=site&jrnl=20661843&AN=154991873&h=7bovulthTg4ezud5BW7lnSQzpDxvHAOdzaa%2fDXe0y9SOWfGs7e63j4W8tlmATf2imtlvUSbfpe%2fQIvSDi4XqNg%3d%3d&crl=c&resultLocal=ErrCrlNoResults&resultNs=Ehost&crlhashurl=login.aspx%3fdirect%3dtrue%26profile%3dehost%26scope%3dsite%26authtype%3dcrawler%26jrnl%3d20661843%26AN%3d154991873 (accessed on 27 February 2024).
  8. Durczak, K.; Rybacki, P. Noise Emission in the Cabs of Modern Farm Tractors. Teh. Vjesn. 2023, 30, 669–675. [Google Scholar] [CrossRef]
  9. Scarlett, A.J.; Price, J.S.; Stayner, R.M. Whole-Body Vibration: Evaluation of Emission and Exposure Levels Arising from Agricultural Tractors. J. Terramechanics 2007, 44, 65–73. [Google Scholar] [CrossRef]
  10. HRN4You Agricultural Wheeled Tractors and Field Machinery—Measurement of Whole-Body Vibration of the Operator (ISO 5008:2002+Cor 1:2005). Available online: https://repozitorij.hzn.hr/norm/HRN+ISO+5008%3A2015 (accessed on 27 February 2024).
  11. Sirin, O. State-of-the-Art Review on Sustainable Design and Construction of Quieter Pavements—Part 2: Factors Affecting Tire-Pavement Noise and Prediction Models. Sustainability 2016, 8, 692. [Google Scholar] [CrossRef]
  12. Xiong, J. Study on Optimization of Vehicle Exhaust System Noise and Hook Position Based on Multi-Source Experimental Data Analysis. SN Appl. Sci. 2023, 5, 57. [Google Scholar] [CrossRef]
  13. Flor, D.; Pena, D.; Pena, L.; de Sousa, V.A.; Martins, A. Characterization of Noise Level Inside a Vehicle under Different Conditions. Sensors 2020, 20, 2471. [Google Scholar] [CrossRef]
  14. The Rule on the Protection of Workers from Exposure to Noise at Work. Available online: https://narodne-novine.nn.hr/clanci/sluzbeni/2008_04_46_1577.html (accessed on 27 February 2024).
  15. Butkus, R.; Liegus, M.; Vasiliauskas, G. Tendencies of noise levels in cabs of agricultural tractors. In Proceedings of the 7th International Scientific Conference Rural Development, Kaunas, Lithuania, 19–20 November 2015. [Google Scholar]
  16. Mofrad, F.E.; Lar, M.B.; Kohan, A. Reduce Noise in the Cab of the Tractor MF399 Sugar Transport Operation. Adv. Environ. Biol. 2014, 8, 3035–3038. [Google Scholar]
  17. Barač, Ž.; Plaščak, I.; Jurić, T.; Jurišić, M.; Zimmer, D.; Čuković, I. The influence of various agrotechnical surfaces on the noise generated from agricultural tractor in exploatation. In Proceedings of the 9th International Scientific/Professional Conference “Agriculture in Nature and Environment Protection”, Vukovar, Republic of Croatia, 6–8 June 2016; pp. 78–81. [Google Scholar]
  18. Barač, Ž.; Plaščak, I.; Jurić, T.; Jurišić, M. The influence of tractor exploitation time on the generated noise level. Teh. Vjesn. 2016, 23, 1505–1510. [Google Scholar] [CrossRef]
  19. Barač, Ž.; Plaščak, I.; Jurišić, M.; Tadić, V.; Zimmer, D.; Duvnjak, V. Noise in the Cabin of Agricultural Tractors. Teh. Vjesn. 2018, 25, 1611–1615. [Google Scholar] [CrossRef]
  20. De Souza, C.M.A.; Junior, G.M.; da Silva, R.R.; Rafull, L.Z.L.; Orlando, R.C.; Ale, L.P. Occupational Noise Level Exposures Outside and inside Agricultural Tractor Cabs. Obs. De La Econ. Latinoam. 2023, 21, 4968–4987. [Google Scholar] [CrossRef]
  21. Picu, M. Risk to the Health of Agricultural Equipment Drivers in Romania Caused by Exposure to Vibration and Noise. Analele Universității ”Dunărea de Jos” din Galați. Fascicula II, Matematică, fizică, mecanică teoretică/Annals of the “Dunarea de Jos” University of Galati. Fascicle II Math. Phys. Theor. Mech. 2021, 44, 103–110. [Google Scholar] [CrossRef]
  22. Poje, A.; Potočnik, I.; Danilović, M.; Antonić, S.; Poje, A.; Potočnik, I.; Danilović, M.; Antonić, S. A Case Study of the Impact of Skidding Distance on Tractor Operator Exposure to Noise. Balt. For. 2016, 22, 357–364. [Google Scholar]
  23. Son, H.; Lim, J.W.; Park, S.; Park, B.; Han, J.; Kim, H.B.; Lee, M.C.; Jang, K.-J.; Kim, G.; Chung, J.H. A Machine Learning Approach for the Classification of Falls and Activities of Daily Living in Agricultural Workers. IEEE Access 2022, 10, 77418–77431. [Google Scholar] [CrossRef]
  24. Nath, N.D.; Chaspari, T.; Behzadan, A.H. Automated Ergonomic Risk Monitoring Using Body-Mounted Sensors and Machine Learning. Adv. Eng. Inform. 2018, 38, 514–526. [Google Scholar] [CrossRef]
  25. HRN4You Electroacoustics—Sound Level Meters—Part 1: Specifications (ISO 61672-1:2013). Available online: https://repozitorij.hzn.hr/norm/HRN+EN+61672-1%3A2014 (accessed on 27 February 2024).
  26. HRN4You Earth-Moving Machinery—Determination of Emission Sound Pressure Level at Operator’s Position—Dynamic Test Conditions (ISO 6396:2008+Cor 1:2009). Available online: https://repozitorij.hzn.hr/norm/HRN+ISO+6396%3A2018 (accessed on 27 February 2024).
  27. HRN4You Tractors for Agriculture and Forestry—Measurement of Noise at the Operator’s Position—Survey Method (ISO 5131:2015). Available online: https://repozitorij.hzn.hr/norm/HRN+ISO+5131%3A2018 (accessed on 27 February 2024).
  28. Hota, S.; Tewari, V.K.; Chandel, A.K. Workload Assessment of Tractor Operations with Ergonomic Transducers and Machine Learning Techniques. Sensors 2023, 23, 1408. [Google Scholar] [CrossRef]
  29. Singh, A.; Nawayseh, N.; Singh, H.; Dhabi, Y.K.; Samuel, S. Internet of Agriculture: Analyzing and Predicting Tractor Ride Comfort through Supervised Machine Learning. Eng. Appl. Artif. Intell. 2023, 125, 106720. [Google Scholar] [CrossRef]
  30. Saleem, M.H.; Potgieter, J.; Arif, K.M. Automation in Agriculture by Machine and Deep Learning Techniques: A Review of Recent Developments. Precis. Agric. 2021, 22, 2053–2091. [Google Scholar] [CrossRef]
  31. Varga, I.; Radočaj, D.; Jurišić, M.; Markulj Kulundžić, A.; Antunović, M. Prediction of Sugar Beet Yield and Quality Parameters with Varying Nitrogen Fertilization Using Ensemble Decision Trees and Artificial Neural Networks. Comput. Electron. Agric. 2023, 212, 108076. [Google Scholar] [CrossRef]
  32. Konstantinov, A.V.; Utkin, L.V. Interpretable Machine Learning with an Ensemble of Gradient Boosting Machines. Knowl. -Based Syst. 2021, 222, 106993. [Google Scholar] [CrossRef]
  33. Ayyadevara, V.K. Gradient Boosting Machine. In Pro Machine Learning Algorithms: A Hands-On Approach to Implementing Algorithms in Python and R; Ayyadevara, V.K., Ed.; Apress: Berkeley, CA, USA, 2018; pp. 117–134. ISBN 978-1-4842-3564-5. [Google Scholar]
  34. Scholkopf, B.; Smola, A.J. Learning with Kernels: Support Vector Machines, Regularization, Optimization, and Beyond; MIT Press: Cambridge, MA, USA, 2018; ISBN 978-0-262-53657-8. [Google Scholar]
  35. Müller, K.R.; Mika, S.; Tsuda, K.; Schölkopf, K. An Introduction to Kernel-Based Learning Algorithms. In Handbook of Neural Network Signal Processing; CRC Press: Boca Raton, FL, USA, 2002; ISBN 978-1-315-22041-3. [Google Scholar]
  36. Eskandarian, S.; Bahrami, P.; Kazemi, P. A Comprehensive Data Mining Approach to Estimate the Rate of Penetration: Application of Neural Network, Rule Based Models and Feature Ranking. J. Pet. Sci. Eng. 2017, 156, 605–615. [Google Scholar] [CrossRef]
  37. Kamala, J.; Nawaz, G.M.K. Secure Communication Using Multi-Layer Perceptron Neural Network and the Adaptive-Network-Based Fuzzy Inference System in Wireless Network. SN Comput. Sci. 2023, 4, 732. [Google Scholar] [CrossRef]
  38. Bonaccorso, G. Machine Learning Algorithms; Packt Publishing Ltd.: Birmingham, UK, 2017; ISBN 978-1-78588-451-1. [Google Scholar]
  39. Chicco, D.; Warrens, M.J.; Jurman, G. The Coefficient of Determination R-Squared Is More Informative than SMAPE, MAE, MAPE, MSE and RMSE in Regression Analysis Evaluation. PeerJ Comput. Sci. 2021, 7, e623. [Google Scholar] [CrossRef] [PubMed]
  40. Lashgari, M.; Maleki, A. Evaluation of Lawn Tractor Noise Using Acoustic and Psychoacoustic Descriptors. Eng. Agric. Environ. Food 2016, 9, 116–122. [Google Scholar] [CrossRef]
  41. Aiello, G.; Catania, P.; Vallone, M.; Venticinque, M. Worker Safety in Agriculture 4.0: A New Approach for Mapping Operator’s Vibration Risk through Machine Learning Activity Recognition. Comput. Electron. Agric. 2022, 193, 106637. [Google Scholar] [CrossRef]
  42. Irumva, T.; Mwunguzi, H.; Pitla, S.K.; Lowndes, B.; Yoder, A.M.; Siu, K.C. Agricultural Machinery Operator Monitoring System (Ag-OMS): A Machine Learning Approach for Real-Time Operator Safety Assessment. Assessment. J. Agric. Saf. Health 2023, 29, 85–97. [Google Scholar] [CrossRef]
  43. Upadhyay, R.; Senapati, A.; Bhattacherjee, A.; Patra, A.; Chatterjee, S. A Comparison of Multiple Machine Learning Algorithms to Predict Whole-Body Vibration Exposure of Dumper Operators in Iron Ore Mines in India. Int. J. Stat. Med. Res. 2021, 10, 169–182. [Google Scholar] [CrossRef]
  44. Melemez, K.; Tunay, M. The Investigation of the Ergonomic Aspects of the Noise Caused by Agricultural Tractors Used in Turkish Forestry. Afr. J. Agric. Res. 2010, 5, 243–249. [Google Scholar]
Figure 1. The workflow of the proposed tractor noise prediction approach based on machine learning regression.
Agriengineering 06 00057 g001
Figure 2. Exploitation measuring on the following: (a) asphalt; (b) gravel; (c) grass; (d) dirt road; (e) rough track; (f) smooth track; with (g) microphone on left side; (h) microphone on right side.
Agriengineering 06 00057 g002
Figure 3. Boxplots of left and right input noise datasets according to surface type.
Agriengineering 06 00057 g003
Figure 4. Variable importance metrics for left and right input noise datasets per machine learning prediction method.
Agriengineering 06 00057 g004
Table 1. The optimal hyperparameters per machine learning prediction method after automatic tuning for both input noise datasets.
MethodHyperparameterTuned Value
gbmn.trees150
interaction depth3
shrinkage0.1
n.minobsinnode10
svmRadialsigma0.34
C1
monmlphidden15
n.ensemble1
Table 2. Descriptive statistics of left and right noise input datasets.
DatasetNMedianMinimumMaximumSDCV (%)SkewnessKurtosis
left64873.869.579.51.6652.25%0.4460.919
right64873.767.678.91.3321.81%0.2812.872
SD: Standard deviation, CV: Coefficient of variation.
Table 3. Machine learning prediction accuracy assessment per surface type for left input noise dataset.
MethodMetricSurface TypeAll Surfaces
Smooth TrackRough TrackAsphaltGravelGrassDirt Road
mlr0.0640.6240.2100.6840.5370.6510.163
RMSE(dB(A))0.9541.7911.3870.5500.9470.3921.526
MAE(dB(A))0.8291.4711.1820.4590.7830.3021.223
gbm0.3460.9430.9210.8590.9130.7470.820
RMSE(dB(A))0.7840.6920.4270.3500.4030.3220.709
MAE(dB(A))0.6190.5220.3160.2830.3060.2590.534
svmRadial0.2410.9320.9360.8920.9180.7580.598
RMSE(dB(A))0.8480.7670.4170.3160.4020.3261.073
MAE(dB(A))0.6320.5790.3140.2550.3200.2620.709
monmlp0.5150.9490.9550.8780.9290.7710.776
RMSE(dB(A))0.7040.6400.3600.3110.3720.3020.785
MAE(dB(A))0.4880.4550.2860.2630.3000.2250.597
The most accurate accuracy assessment metrics per prediction are in bold.
Table 4. Machine learning prediction accuracy assessment per surface type for right input noise dataset.
MethodMetricSurface TypeAll Surfaces
Smooth TrackRough TrackAsphaltGravelGrassDirt Road
mlr0.3390.7290.2930.2760.7380.0590.166
RMSE(dB(A))1.2081.0580.7590.6630.4010.3741.226
MAE(dB(A))0.8540.7960.6190.5210.3240.3090.929
gbm0.4880.8620.9250.7050.8500.6690.724
RMSE(dB(A))1.0140.7130.2670.4340.3440.2380.696
MAE(dB(A))0.7100.5290.1990.3360.2840.1840.470
svmRadial0.5480.8390.9520.6690.7950.7290.507
RMSE(dB(A))0.9690.8000.2090.4640.3610.2060.958
MAE(dB(A))0.6440.5150.1470.3640.2940.1670.608
monmlp0.5550.8700.9550.7170.8130.7470.632
RMSE(dB(A))0.9970.6970.1800.4330.3460.1930.807
MAE(dB(A))0.6540.4580.1390.3410.2800.1570.566
The most accurate accuracy assessment metrics per prediction are in bold.
Disclaimer/Publisher’s Note: The statements, opinions and data contained in all publications are solely those of the individual author(s) and contributor(s) and not of MDPI and/or the editor(s). MDPI and/or the editor(s) disclaim responsibility for any injury to people or property resulting from any ideas, methods, instructions or products referred to in the content.

