Abstract
The production of Explorer roses has historically been attractive due to the acceptance of the product around the world. This species of roses presents high sensitivity to physical contact and manipulation, creating a challenge to keep the final product quality after cultivation. In this work, we present a system that combines the capabilities of intelligent computer vision and unmanned aerial vehicles (UAVs) to identify the state of roses ready for cultivation. The system uses a deep learning-based approach to estimate Explorer rose crop yields by identifying open and closed rosebuds in the field using videos captured by UAVs. The methodology employs YOLO version 5, along with DeepSORT algorithms and a Kalman filter, to enhance counting precision. The evaluation of the system gave a mean average precision (mAP) of 94.1% on the test dataset, and the rosebud counting results obtained through this technique exhibited a strong correlation (R2 = 0.998) with manual counting. This high accuracy allows one to minimize the manipulation and times used for the tracking and cultivation process.
1. Introduction
Precision farming has experienced significant progress thanks to the incorporation of technology, especially through the utilization of robotics and artificial intelligence. Ever since the inception of industrial robots, there has been a noticeable surge of interest within the agricultural industry, resulting in swift advancements and implementations across diverse agricultural contexts [1]. The floriculture industry, particularly in the cultivation of specialized varieties like Explorer roses, has felt the profound effects of technological advancements. This is largely driven by the continuously growing demand for premium-quality flowers [2]. One crucial aspect in the assessment of flower quality is the vase life of roses. Achieving optimal vase life requires roses to be grown in ideal conditions, which in turn has created a pressing need for expedited processes from harvest to delivery to the end consumer [3]. To confront these challenges head-on, the industry has embraced automated systems incorporating mechatronics and automatic control technologies. These systems play a pivotal role in the classification of roses, streamlining the production process and reducing the time-to-market. By leveraging automation, floriculture businesses can better uphold product quality standards while efficiently meeting the demands of the market [4,5].
Drone technology, especially lightweight UAVs (5 to 50 kg), has propelled agriculture forward by enhancing precision and efficiency in crop management compared with similar remote sensing platforms such as satellites, manned aircraft, or ground-based platforms [6]. Equipped with multispectral cameras, drones can capture detailed images of different sizes and color targets (tomatoes, palm trees, grapes, apples, citrus, and vegetables) [7], providing a depth of information on crop health and needs that was previously unattainable due to manual monitoring times [8]. The drone technology, along with machine vision algorithms, has been utilized in floriculture to gather information from an aerial perspective, especially in large crops, aiding farmers and growers in improving the efficiency and profitability of their operations through the image processing for early detection of events [6]. The application of artificial intelligence (AI) and computer vision in agriculture has demonstrated effectiveness for the real-time identification of objects within images and videos, particularly for perishable products like flowers, where AI-driven autonomous greenhouses can lead to increased yields and enhanced control over production [9]. Computer vision allows the monitoring of plant growth and detection of any adverse effects at an early stage, thus leading to optimized agricultural resource use and higher yields [10,11,12].
Deep convolutional neural networks (CNNs) have been used for image segmentation and classification, addressing environmental variability challenges and improving accuracy in applications such as disease detection and floral identification, and has obtained an average accuracy of over 90% [7,8,9,10,11,12,13]. The convergence of UAVs with CNNs and detection techniques like YOLO holds the promise of significant improvements in capturing essential information for production and greenhouse efficiency, which can translate to increased profitability and sustainability in the agricultural industry [14,15]. By employing deep learning algorithms, rose growers can classify rosebuds more accurately by their maturity and quality, leading to a substantial impact on production efficiency and business profitability [16]. Notable works such as those by [10,14,17,18] have demonstrated innovative and effective approaches to employing machine learning and image processing techniques within the agricultural industry. These techniques have proven capable of enhancing crop detection, accurate monitoring, and thereby offering a more effective alternative to traditional methods.
The purpose of demonstrating the usability of a combination of UAVs and image classification is to estimate the state of Explorer roses. In this work, we implemented an intelligent computer vision system to count the open and closed rosebuds in a greenhouse. We provided a work sequence based on an image acquisition process, a dataset retrieval method, and the development of the rose detection model. For the identification of roses, we developed a methodology based on three detection areas for roses: tracking, counting based on the crossline method, and models training.
2. Materials and Methods
A four-stage sequence was defined to develop this work (Figure 1). The data acquisition stage included the implementation of a DJI Mini SE drone with its integrated camera, telemetry sensors, remote control, and data acquisition from the state of roses by high-resolution video. The data transmission stage oversaw interconnecting the video information captured by the drone in the previous stage through streaming. For this purpose, the connection of the remote control with the drone was used by the Real Time Messaging Protocol (RTMP) for MonaServer v2.723, VideoLAN Client (VLC) v3.0.18 Vetinari, and Open Broadcaster Software (OBS) v29.1.3 (64 bit). This stage was focused on ensuring real-time data transmission, which allows discriminating between closed and open roses with the drone’s point of view and labeling them accurately with experience, differentiating the cutting status by the field staff. The stage of data processing included the data analysis, the selection of models, and image processing to give results about the count and the rosebuds. For the presentation stage, the results of the state of rosebuds were displayed with the percentage of confidence and individual results for each bed. In this stage, we used Visual Studio Version 1.84 and Python 3.10 to create the output window with a monitoring interface.
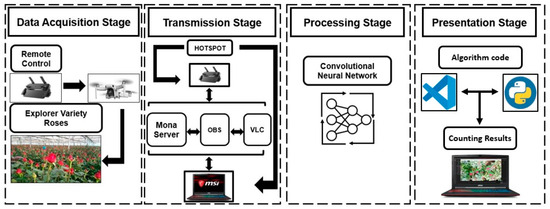
Figure 1.
General scheme of methodology sequence for data acquisition, transmission, data processing, and the presentation of results.
2.1. Data Acquisition and Transmission Stage
2.1.1. System Implementation and Conditions
The system was implemented by using a drone with an integrated high-resolution camera capable of capturing videos at 30 frames per second. Due to an 83-degree field of view (FOV), the camera allows to cover two blocks of roses. To ensure stable imaging, the camera unit was mounted on a 3-axis stabilizer to minimize unwanted vibrations during data collection. Visual data, including images and videos, was collected from several Explorer rose crops, following the standard schedule for manually monitoring roses: morning time. Table 1 shows the parameters of the detection system and conditions in the greenhouse.

Table 1.
Parameters and condition for the detection system and for the greenhouse, respectively.
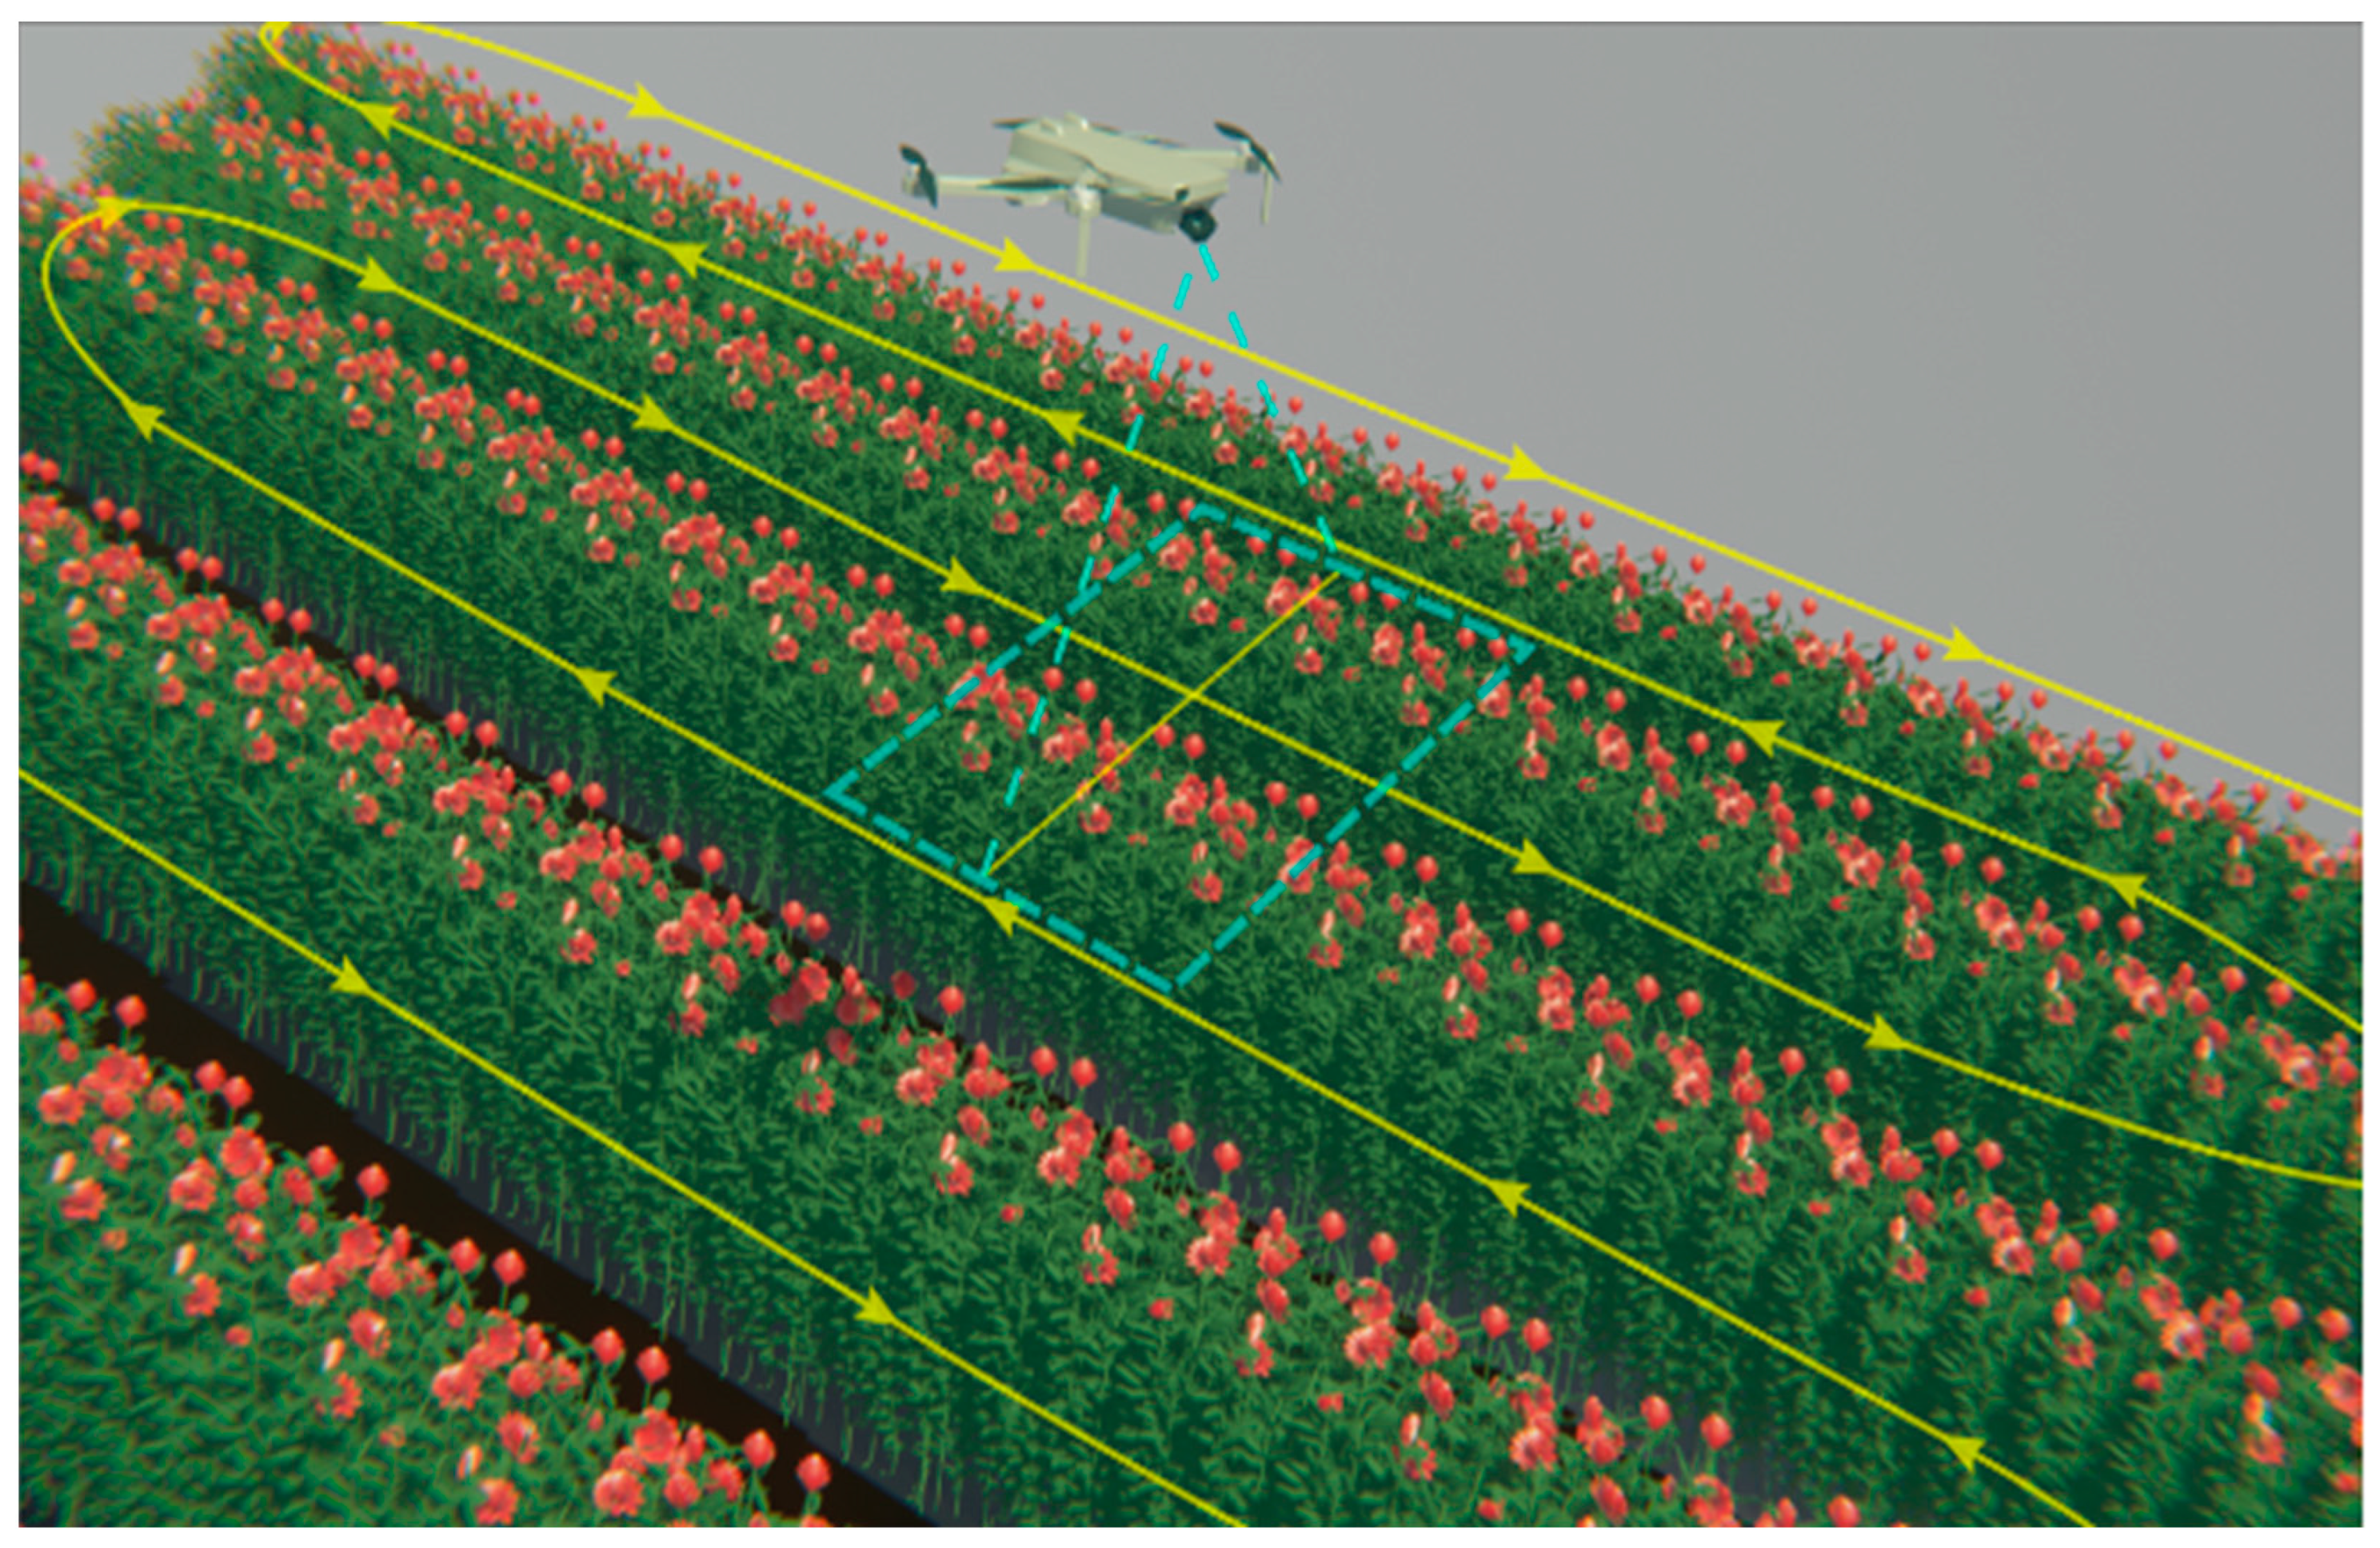
The image acquisition process was established to perform in a closed greenhouse; Figure 2 depicts a typical arrangement of an Explorer rose block, considering the space between the rosebuds and the greenhouse top. The dotted area in Figure 2 represents the camera’s field of view during the UAV’s flight, ensuring precise image capture for further analysis. The path of detection was established under the same conditions for manual tracking for comparison purposes.

Figure 2.
Flight path of the UAV for image acquisition implemented strategy to cover the rose blocks.
2.1.2. Dataset Retrieval Method
The experimenter guided the UAV slowly between the rose beds at a speed of 0.5 m/s and the camera tilted to 90° downward. The capture distance was 30 to 50 cm from the rosebuds to the camera. Table 2 shows the parameters and conditions used for the experiment. One image for every 10 frames of video was extracted, and the rosebuds were labeled with LabelImg. Images with dimensions of 960 × 608 pixels were randomly cropped to facilitate rapid training. A total of 39,250 open rosebuds and 35,875 closed rosebuds were labeled across 3750 images. Then, the labeled images were divided to form a dataset consisting of 60%, 20%, and 20% for training, validation, and testing, respectively.
Table 2.
Dataset overview.
2.1.3. Roses Detection Model
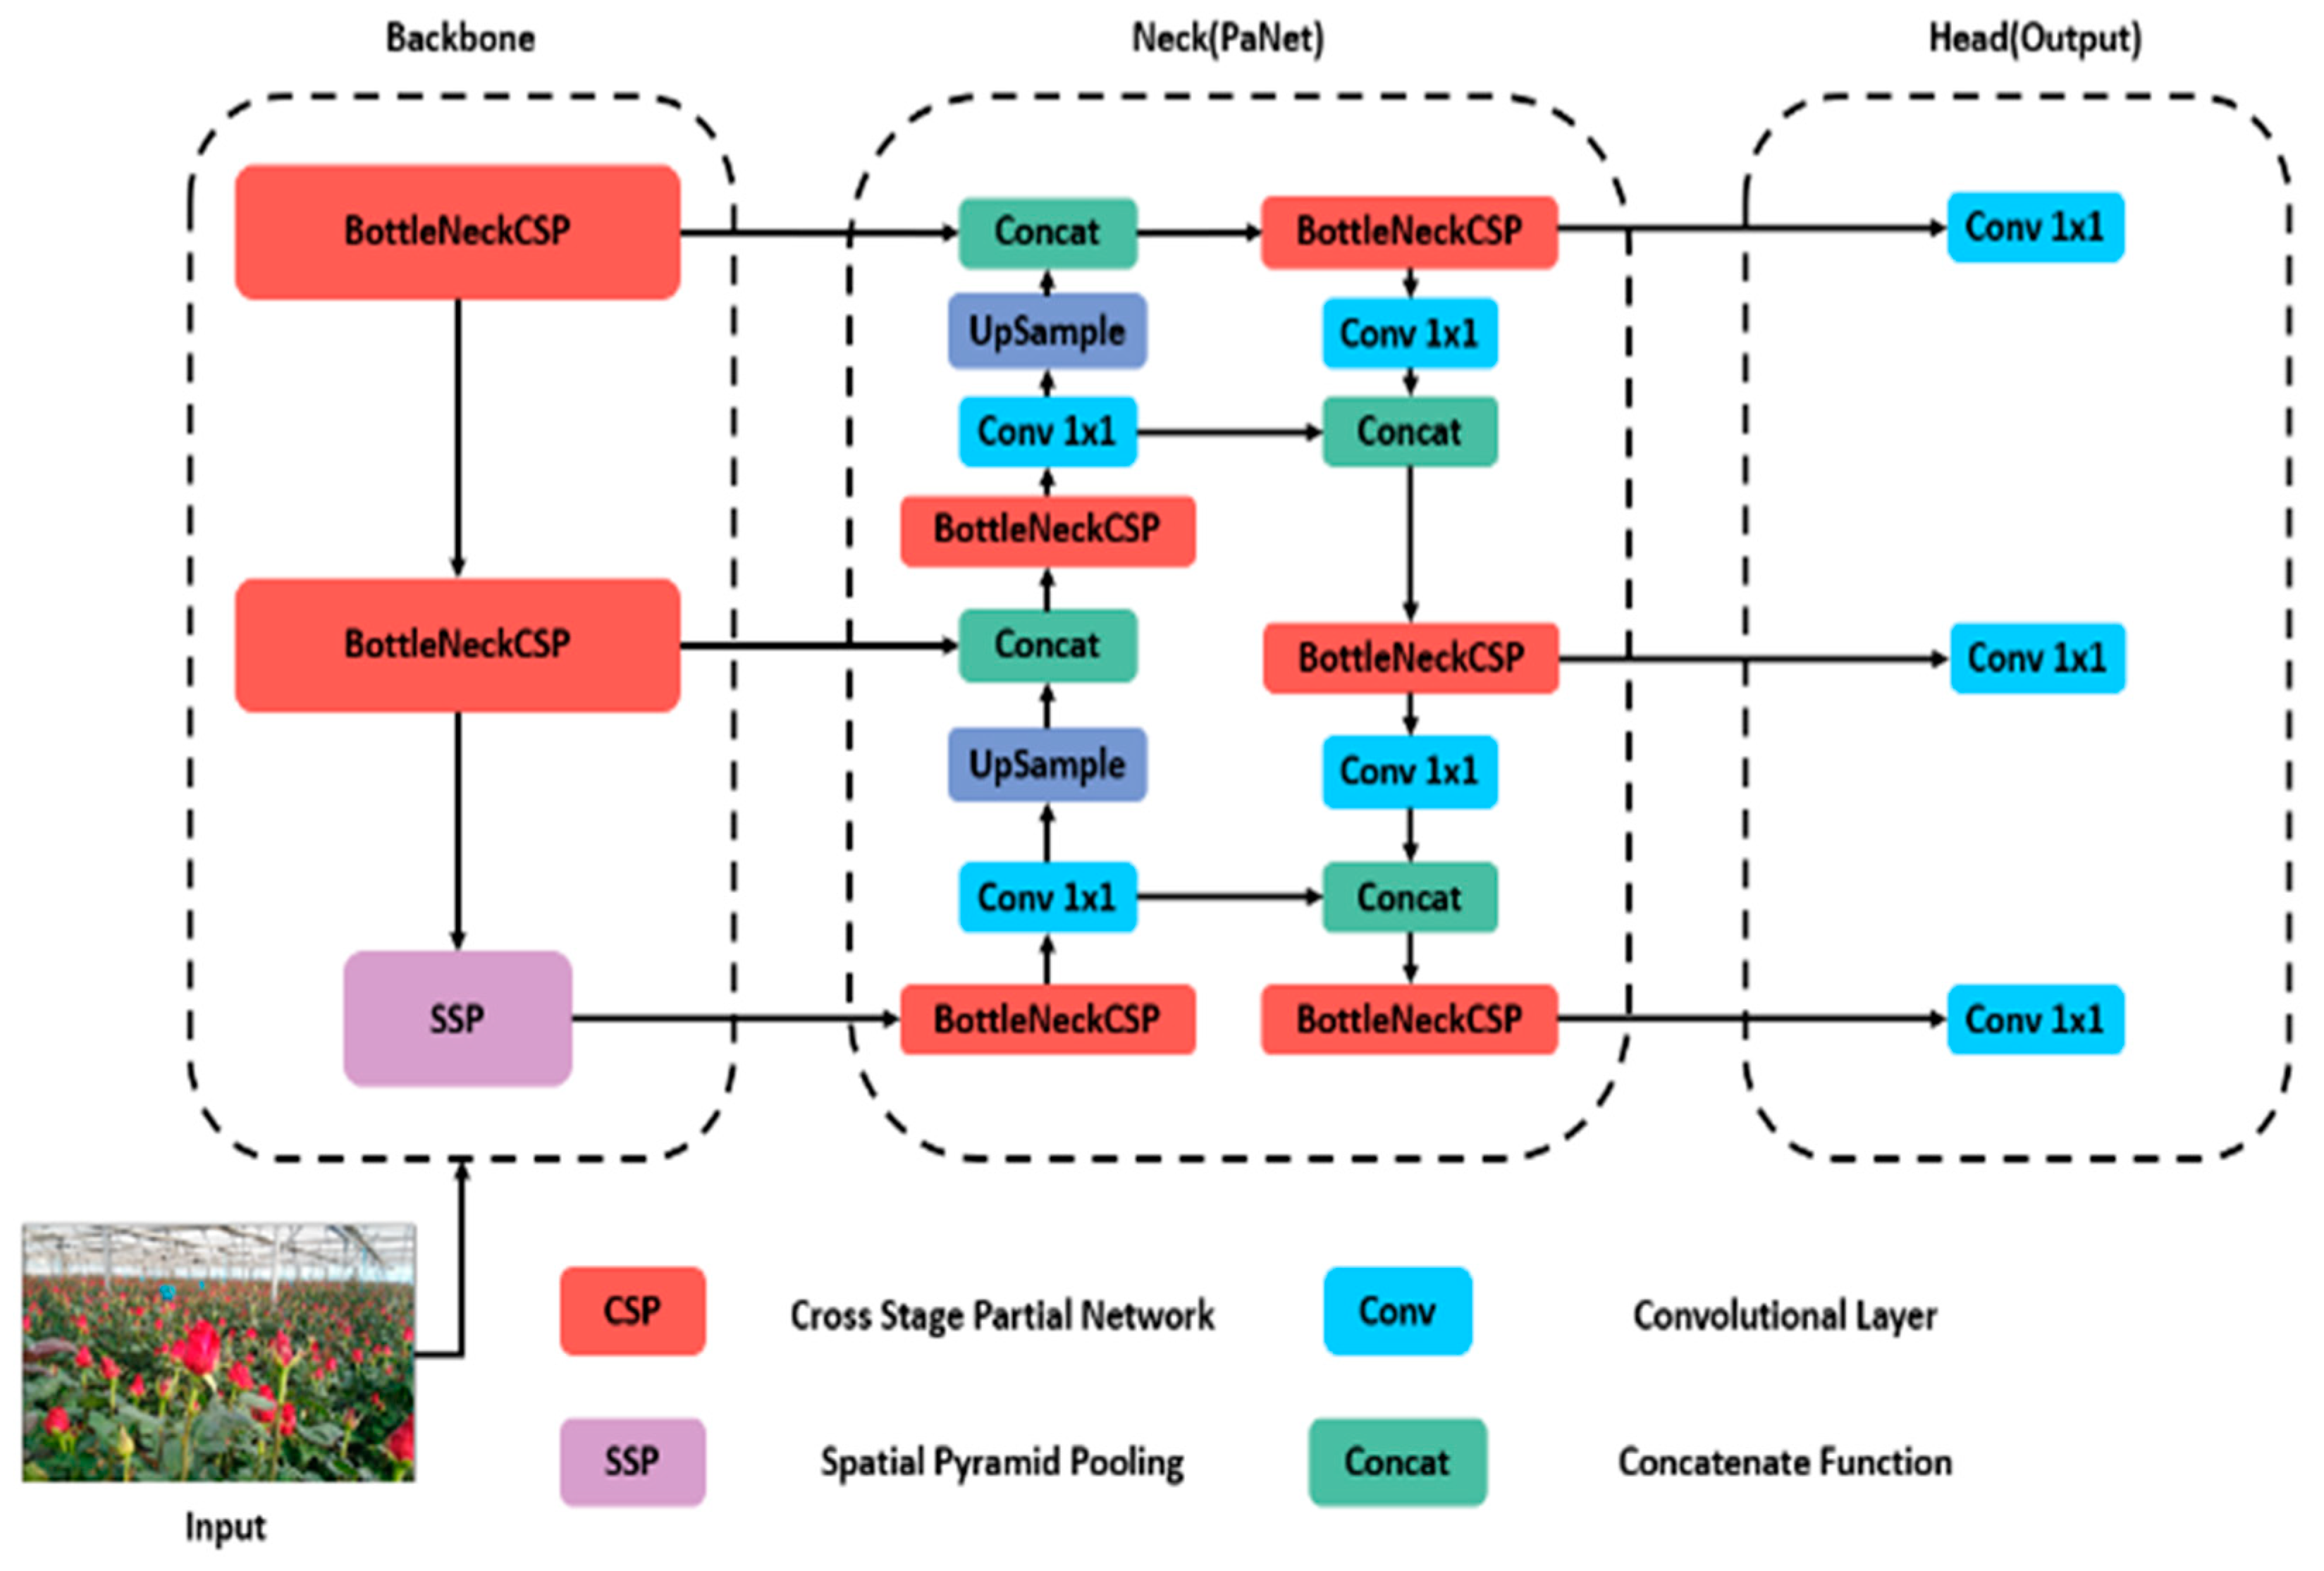
We employed the YOLO model for object detection, a single-stage model known for its computational efficiency. YOLOv5, in particular, has gained widespread adoption in agricultural settings due to its reliability in detecting objects [14]. Unlike previous iterations like sD, YOLOv3, YOLOv4, RetinaNet, and others, YOLOv5 diverges by utilizing PyTorch and CSP-Darknet53 instead of Darknet. The architecture comprises three components: spine, neck, and head, as shown in Figure 3.

Figure 3.
Architecture of the YOLOv5 model used.
The YOLOv5 architecture incorporates a backbone network that produces feature maps of various sizes (152 × 152, 76 × 76, 38 × 38, and 19 × 19 pixels) from the input image. The focus module aids in improved feature extraction by dividing and consolidating images while downsampling. Additionally, the spatial pyramid pooling (SPP) module compresses the input feature map to represent image attributes at a higher level of abstraction. Additionally, the cross-stage partial (CSP) module links the front and back layers of the network, decreasing model size and improving inference speed. The CONV-BN-LeakyRELU (CBL) module handles convolution and normalization tasks.
The neck network combines features extracted from convolutional neural networks. The CSP module replaces residual units with CBL modules, enabling the combination of feature maps to gather more contextual information from the backbone’s feature maps. When combining feature maps at different levels, feature pyramid network (FPN) and path aggregation network (PAN) structures are employed to enhance the feature combination capabilities of the neck structure. The output network was used for object detection and classification by feature maps sized 19 × 19 × 255, suitable for identifying large objects, whereas 76 × 76 × 255 sized maps better identify small objects [19].
The first five architectures of YOLOv5 are commonly used for rose detection (nano, small, medium, large, and extra-large). The performance of these five architectures was compared using the FLORES 2023 dataset. In the evaluation of object detection, the accuracy of an object proposal is typically determined using intersection over union (IoU or IU), as specified in Equation (1). This approach involves taking set A, which comprises proposed object pixels, and set B, which consists of true object pixels, and then computes:
When the intersection over union (IoU) threshold is greater than 0.5, it signifies a successful object detection, while an IoU ≤ 0.5 is deemed a failure. The average precision (AP) for each object class c is computed using Equation (2)
where TP(c) TP(c) indicates the count of true positive instances, while FP(c) represents the count of false positive instances. For any given class value c, an AP(c) = 1 signifies a flawless detection, whereas an AP(c) = 0 indicates a bad one. Consequently, the mean average precision (mAP) can be computed using Equation (3) over the set of all objects (O) within a dataset.
Thus, the mAP0.5:0.95 metric shows mAP across various IoU thresholds ranging from 0.5 to 0.95, with increments of 0.05. Specifically, mAP0.5 denoted an mAP for an IoU > 0.5 [20,21]. YOLOv5 has key benefits, such as simple installation, fast training and reduced experiment costs, inference ports on different platforms, intuitive design based on the standard file folder design, and easy translation to mobile devices. YOLOv5 is available in PyTorch v1.13.1 using Jupyter v7.0.0a12 or Google Colab notebooks.
2.1.4. Roses Tracking
For the roses tracking, we further extracted their characteristics and used the DeepSORT multiple objects tracking algorithm to compare these characteristics with those of other video frames to establish a correlation between the same rose and other similar ones. DeepSORT employs a fusion of the Kalman filter and the Hungarian algorithm to facilitate tracking. The Kalman filter anticipates the present state of a rose by extrapolating from a previous value and furnishes the associated uncertainties of that forecast [22]. These uncertainties are encompassed using the Mahalanobis distance, expressed in Equation (4).
Here, tj denotes target j, yi represents the tracker i, and represents the covariance of t and y. The model assesses the similarity between the target and the tracker using the cosine distance as defined in Equation (5).
In this context, denotes the cosine distance. The cosine distance is utilized to evaluate the apparent attributes of the track and the apparent attributes associated with the detection, aiming to enhance identification accuracy. By merging Equations (4) and (5), the model derives the integral coincidence degree formula as depicted in Equation (6).
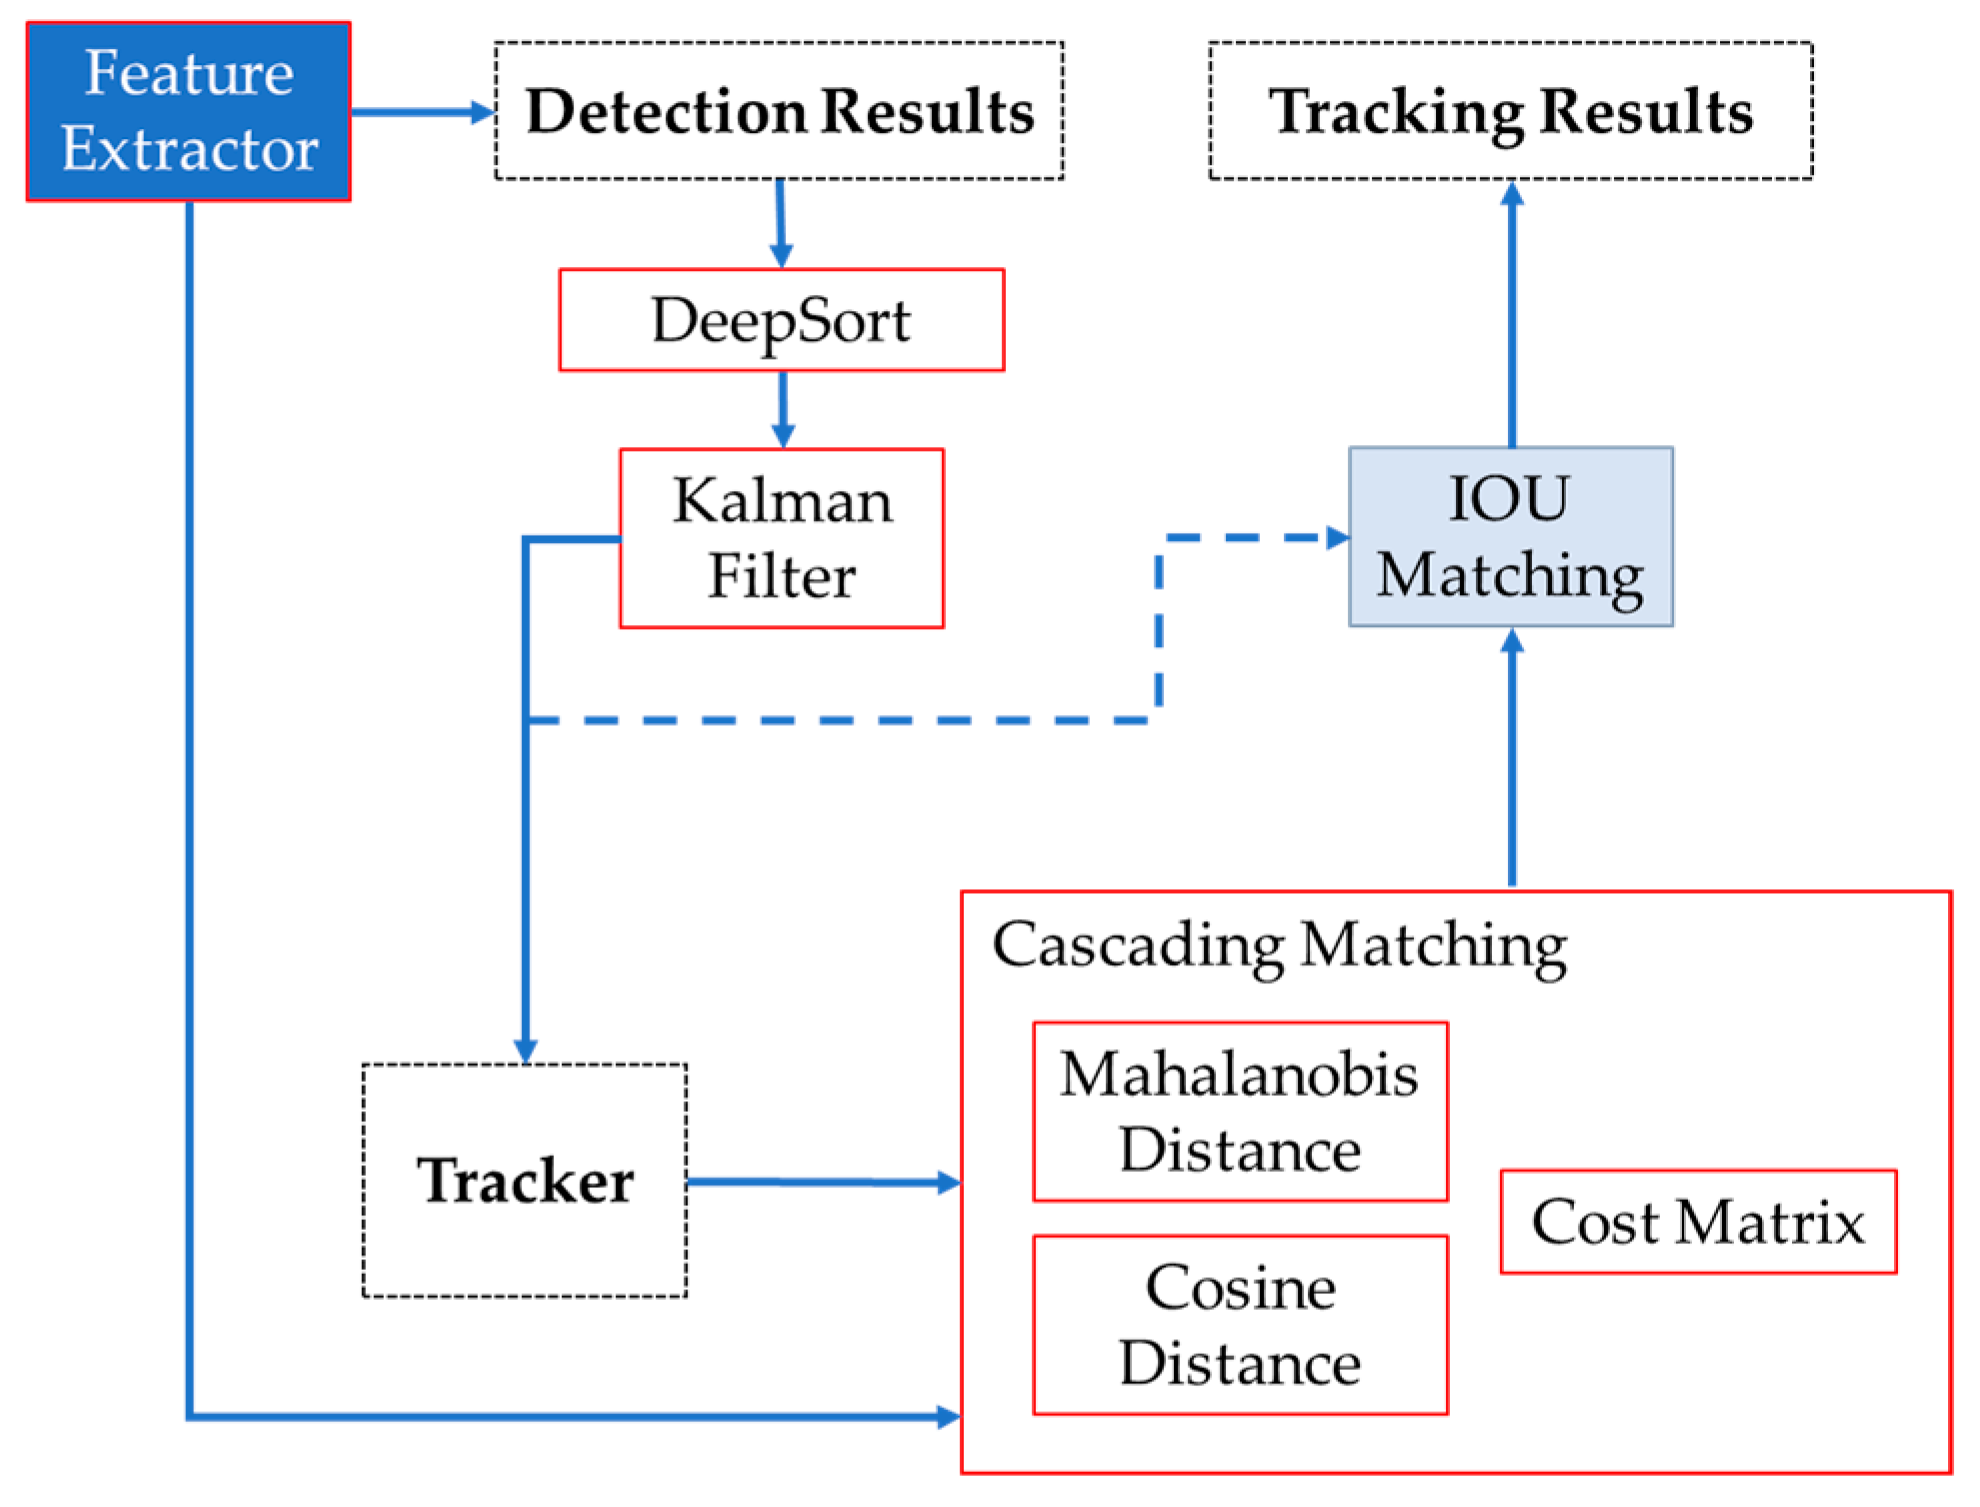
Subsequently, the Hungarian algorithm was used for the association of roses and the attribution of IDs, which assigns a unique identification to the rose and determines whether the rose in the current frame is the same as the one observed in the previous frame. Once the location of the rose has been determined, the DeepSORT algorithm generates a block diagram illustrating the data flow, as depicted in Figure 4.

Figure 4.
Sequence used for roses tracking. Feature Extractor extracts the unique characteristic of each image, giving images with a probability for open and closed buds as detection results. DeepSORT and the Kalman filter help us to refine the accuracy of images for the tracking. The cascading matching compares the detected images’ characteristics with the tracked images based on distance calculations. IOU matching associates the current detections with tracked objects through the frames, giving the final tracking results.
2.2. Processsing Stage
Models Training
All YOLOv5 architectures in this study were trained on a system running Windows 11 operating system, Python 3.10, and PyTorch 2.0. The CPU used was an Intel Xeon W-11855M, and the GPU was an Nvidia RTX A4000. The CUDA and CUDA Deep Neural Network library versions employed were 11.7 and 7.6, correspondingly. For training, distinct parameters including the learning rate, learning rate decay momentum, batch size, optimizer weight decay factor, and epochs were configured to 0.001, 0.937, 16, 0.0005, and 500, respectively. To prevent training stagnation, a patience parameter of 100 epochs was configured to interrupt training if progress ceased. All remaining parameters were adjusted to their suggested values according to the official website recommendations. The model weights were initialized utilizing pre-trained weights acquired from the Microsoft COCO dataset. The training durations for each YOLOv5 model are listed in Table 3, with the YOLOv5l model having the shortest training time at 3.885 h, and the YOLOv5s model having the longest at 11.511 h.
Table 3.
Data of training of YOLOv5 models on the experimental dataset.
3. Results
3.1. Rose Counting Based on the Crossline Method
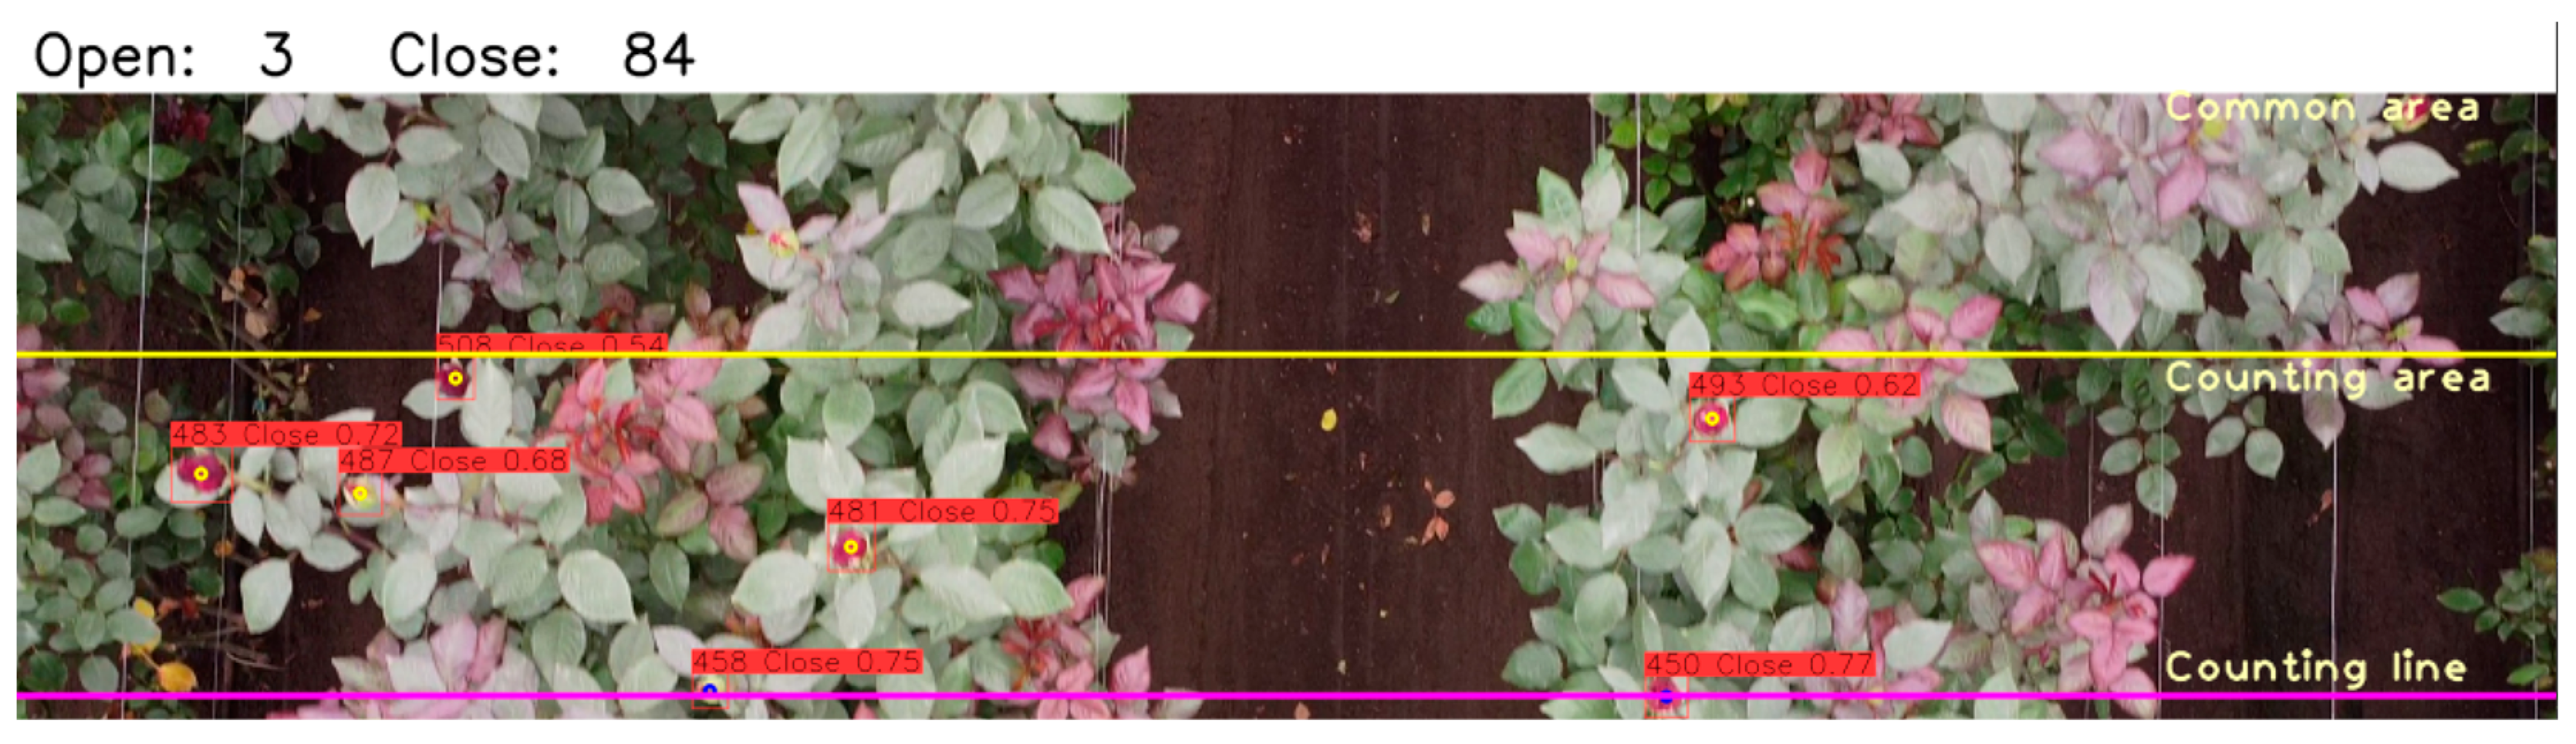
The detection model depicted in Figure 2 enables the capturing of image sequences, each of which is assigned a unique identifier. Tracking identifiers are allocated solely upon the accurate detection of the rose. However, potential distortions may arise when the target is positioned at the border of the image detection, thereby impacting the accuracy and reliability of both the tracker and detector. To enhance the precision of the counting process, two areas (common and counting areas) were delineated, and a counting line was introduced to partition the image into three sections, as illustrated in Figure 5.

Figure 5.
Process of open–closed counting roses according to the defined areas, where 3 roses were counted open and 84 roses were counted closed.
The bounding box was not tracked or tallied while within the common area; tracking commenced only upon entering the counting area. A pink line, denoted as the counting line in the image, served as a marker for rose counting. When a tracked bounding box intersected the counting line, it was registered as a valid count, and the tracker’s center transitioned from yellow to blue, indicating it had been counted. Illustrated in Figure 5, this process ensures a precise and dependable tally of the roses.
3.2. Evaluation of Models
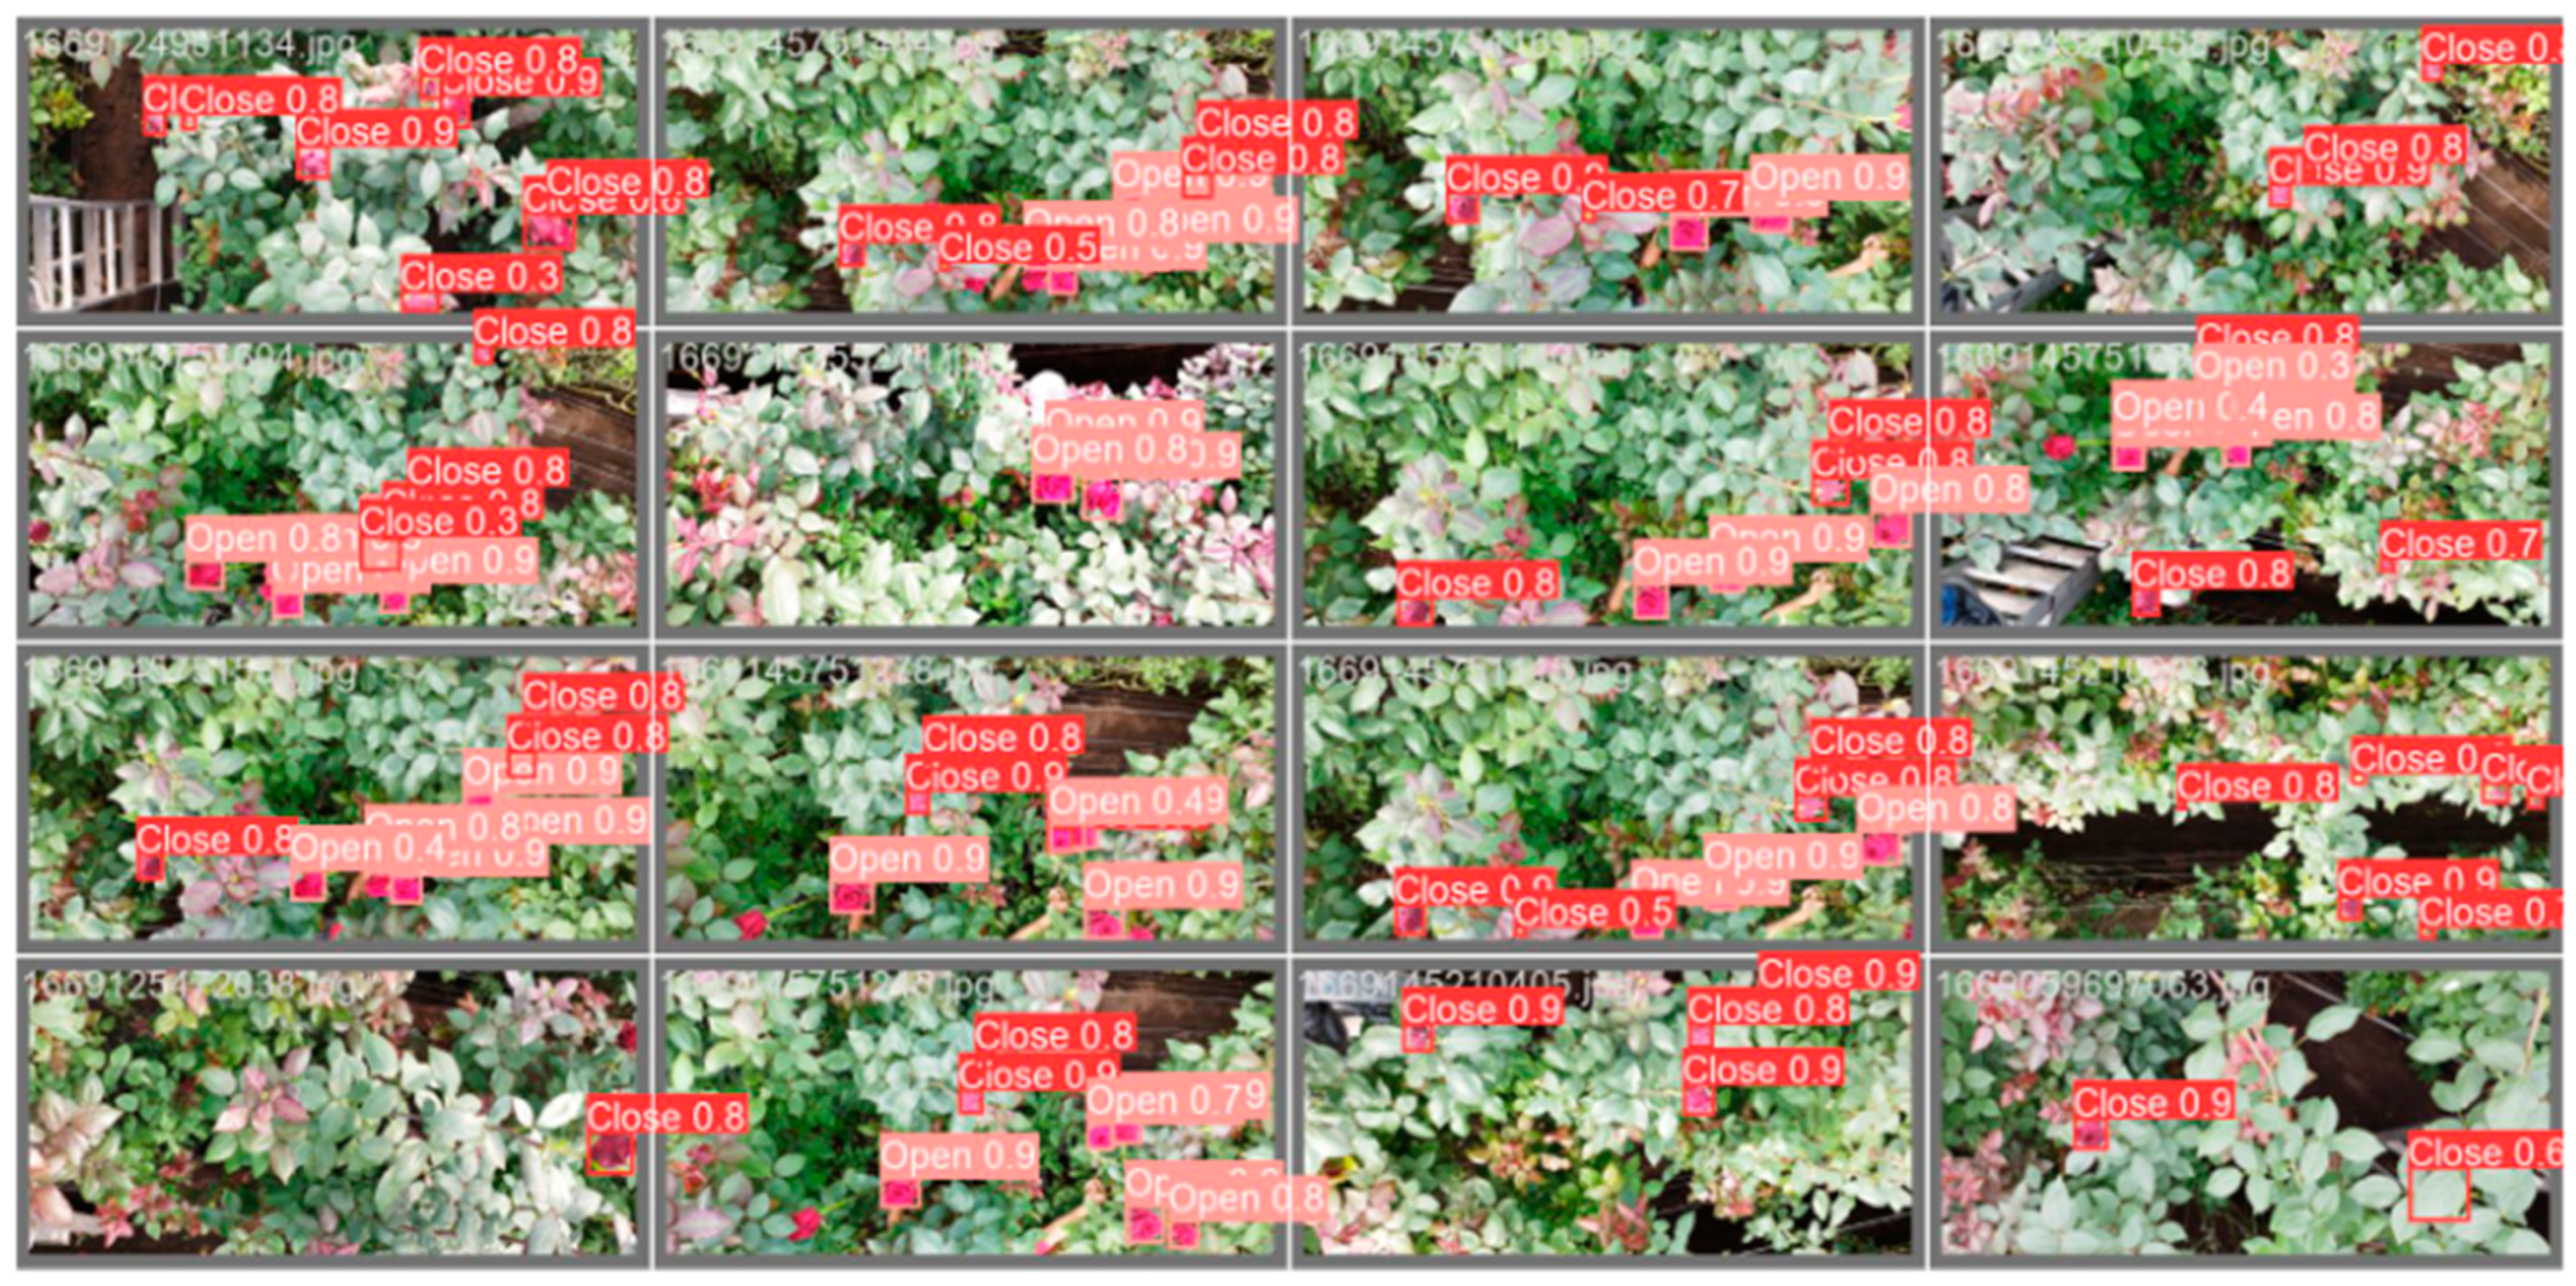
To assess the neural network’s effectiveness, a preliminary test was conducted on a subset of the training data to ascertain if a specific model possesses sufficient learning capability for rose detection. A subset of test data was then used to measure the generalizability of the network and its ability to handle unknown input data. In this classification experiment, five YOLOv5 architectures (n, s, m, l, x) were independently evaluated, first on the training image subsets and then on the test subsets. The results are presented in Figure 6.

Figure 6.
Image classifications as outputs for YOLOv5x model architectures.
The predictions of the open rosebuds class have higher accuracy due to their distinctive color, shape, and size characteristics, as shown in Table 4. In contrast, the accuracy of the closed rosebud class predictions was lower due mainly to the size, and can be confused with the presence of green leaves in almost all the study areas of the greenhouse complex. Furthermore, for assessing the model’s performance, we utilized plots depicting precision, recall, and F1 score with respect to the confidence level, along with the PR curve, as depicted in Figure 7.
Table 4.
Comparative results of rose detection models.
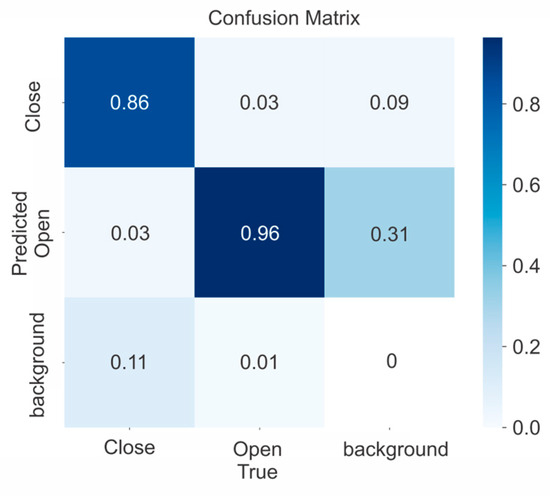
Figure 7.
Confusion matrix for YOLOv5x model.
The results show the best weight obtained at age 197, and mAP 0.5 = 0.941, which corresponded to the model YOLOv5x for all open and closed rosebuds detected.
Figure 7 shows the confusion matrix for the YOLOv5x structure obtained 96% of true positives (TP) for the open class, which has a higher number of examples in the training subset. On the other hand, it achieved 86% for the close class, which has fewer data instances. The results could be partly attributable to the previously mentioned problem of a slightly unbalanced class distribution.
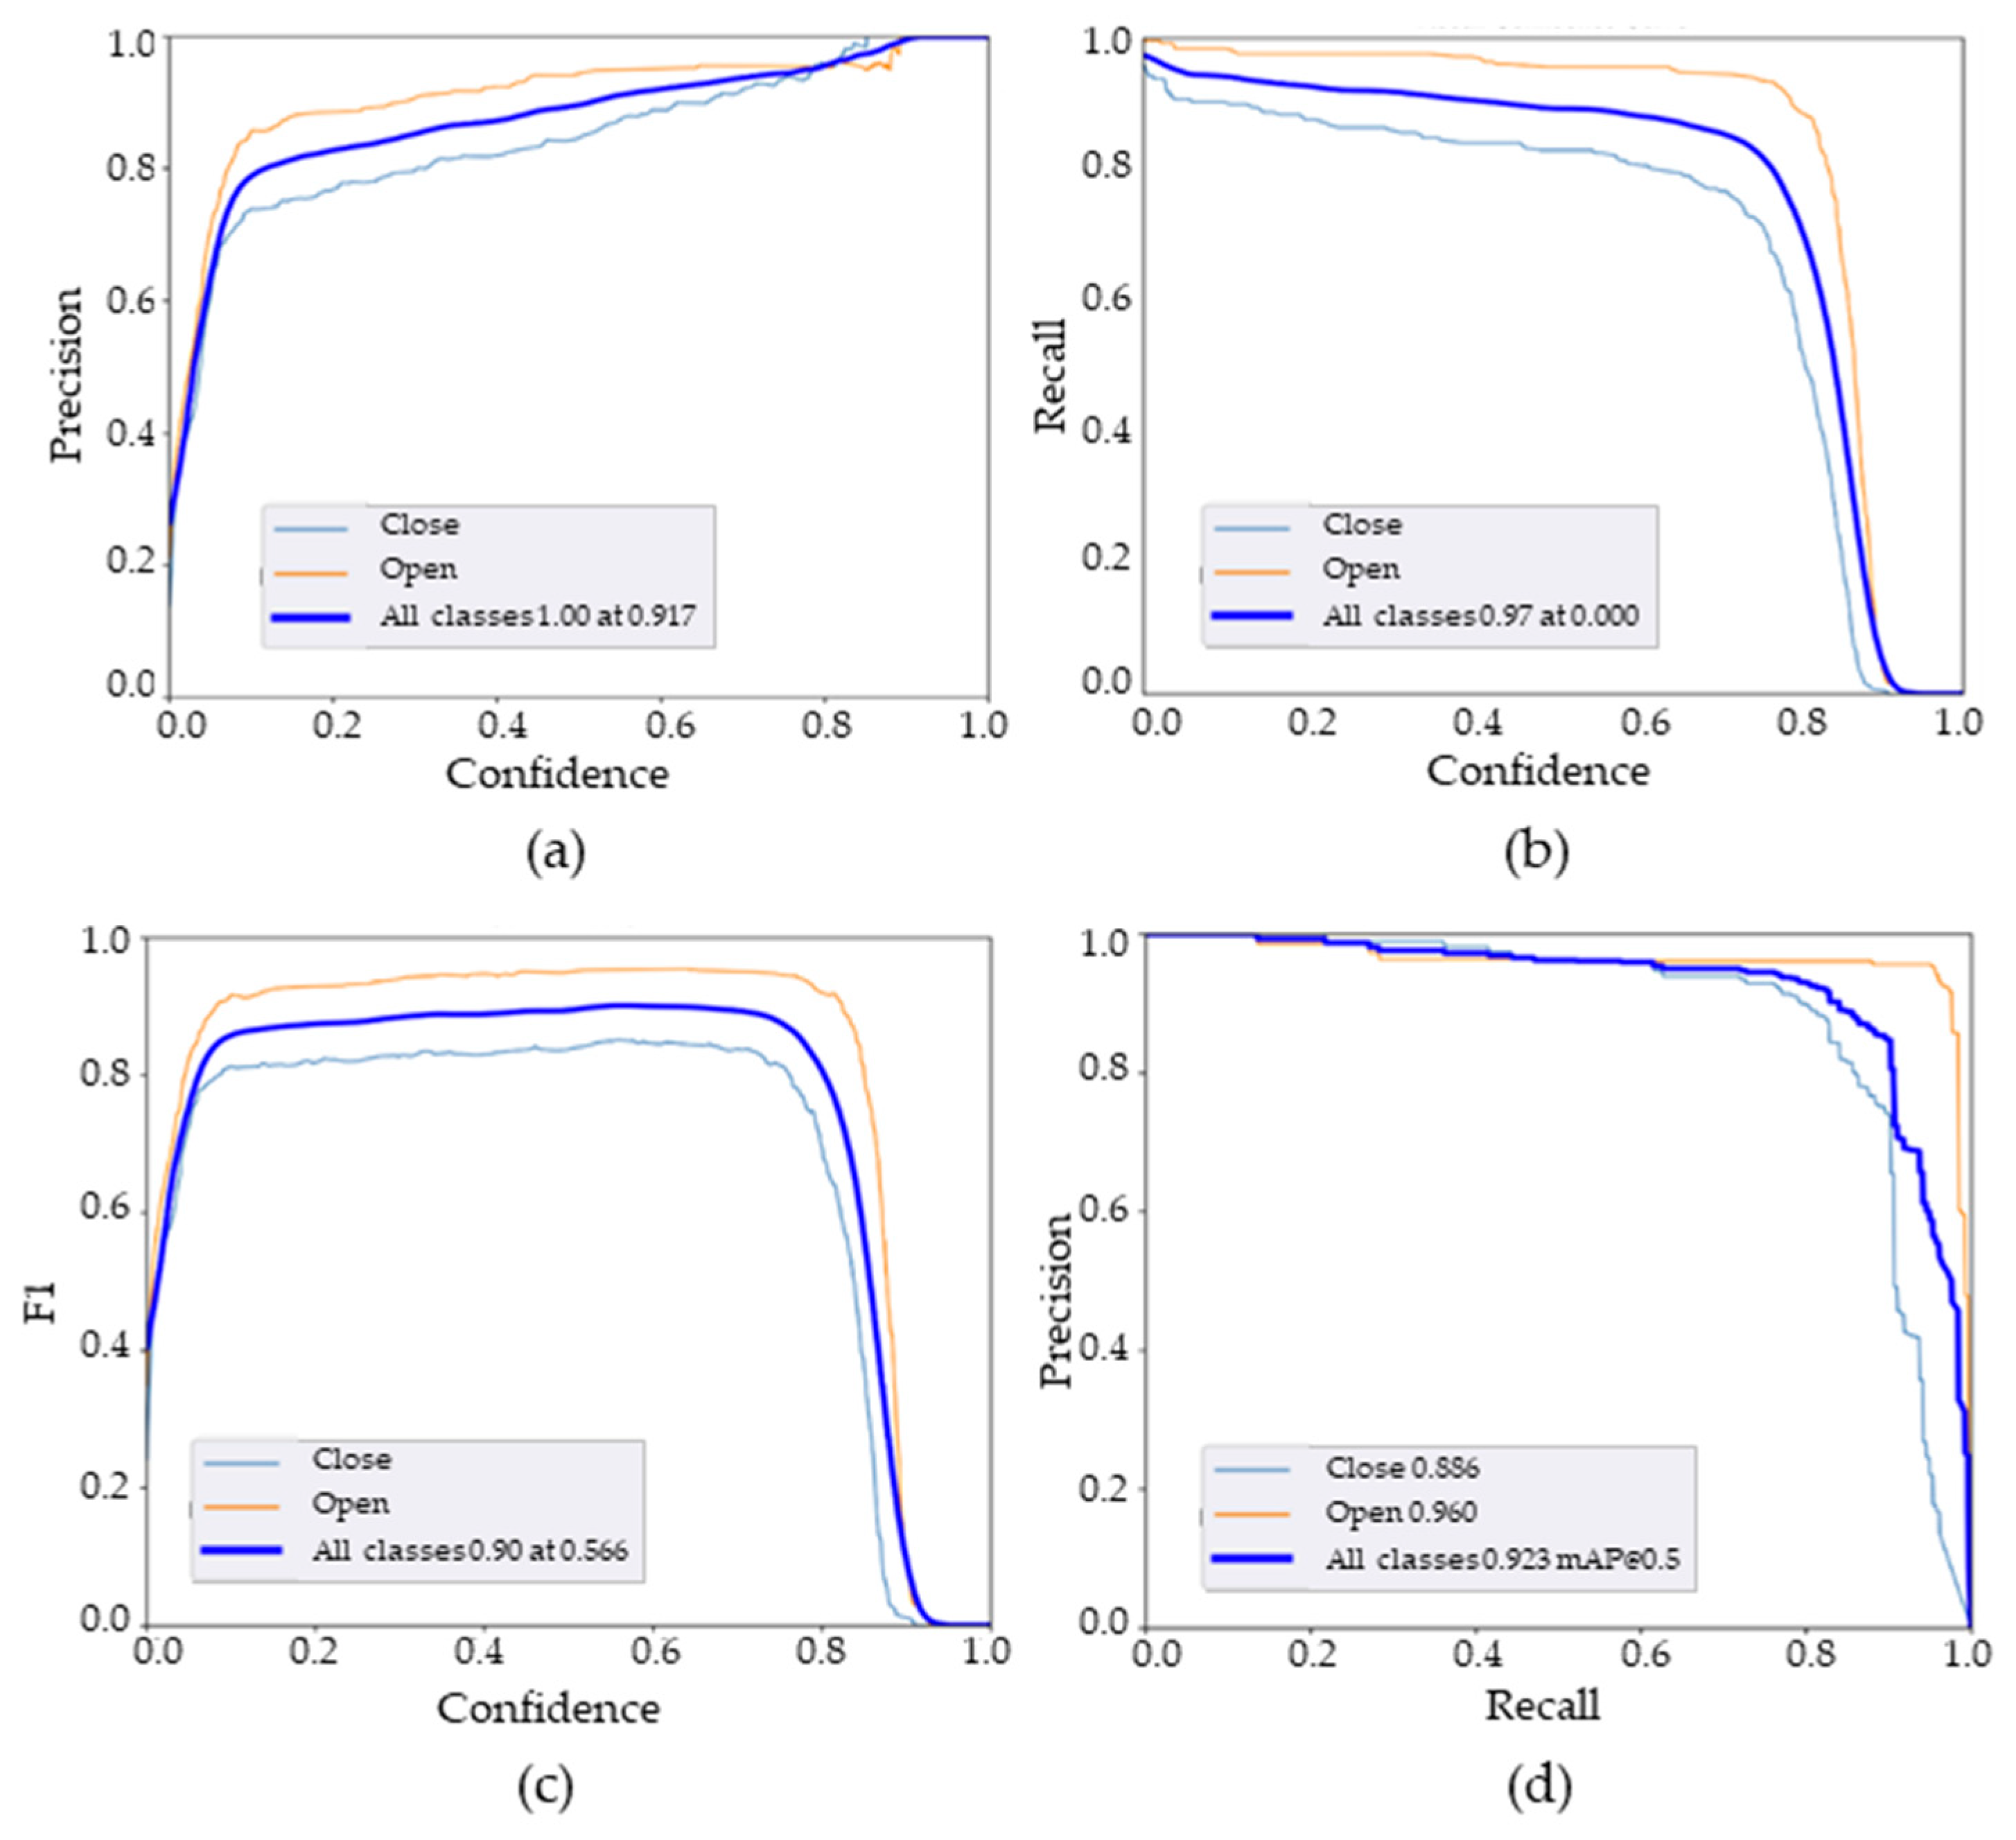
According to Figure 8, the accuracy demonstrates a nearly linear increase as the confidence level approaches 1. At a confidence level of 0.94, the maximum precision is attained, indicating a significant proportion of true positive values across all classes. The recall values also offer insights into the prediction performance. It is noticeable that the recall values gradually decline with higher confidence levels, primarily due to the negative false detection of open rosebuds exerting a greater influence on prediction accuracy. Additionally, the PR curve illustrates how various thresholds impact different classes, with the “closed rosebuds” class exhibiting a lower percentage.

Figure 8.
YOLOv5x performance parameters: (a) precision–confidence curve, (b) recall–confidence curve, (c) F1–confidence curve, (d) precision–recall curve.
The F1 scores for individual categories such as open rosebuds and closed rosebuds stand at 0.96 and 0.82, respectively, when the confidence level is 0.566. Furthermore, at this confidence level, the average F1 score for all categories increases swiftly and reaches a peak of 0.90. However, as the confidence level surpasses 0.96, the F1 score begins to decline gradually, indicating that the most accurate predictions occur between confidence levels of 0.8 and 0.9.
3.3. Evaluation of the Counting Method
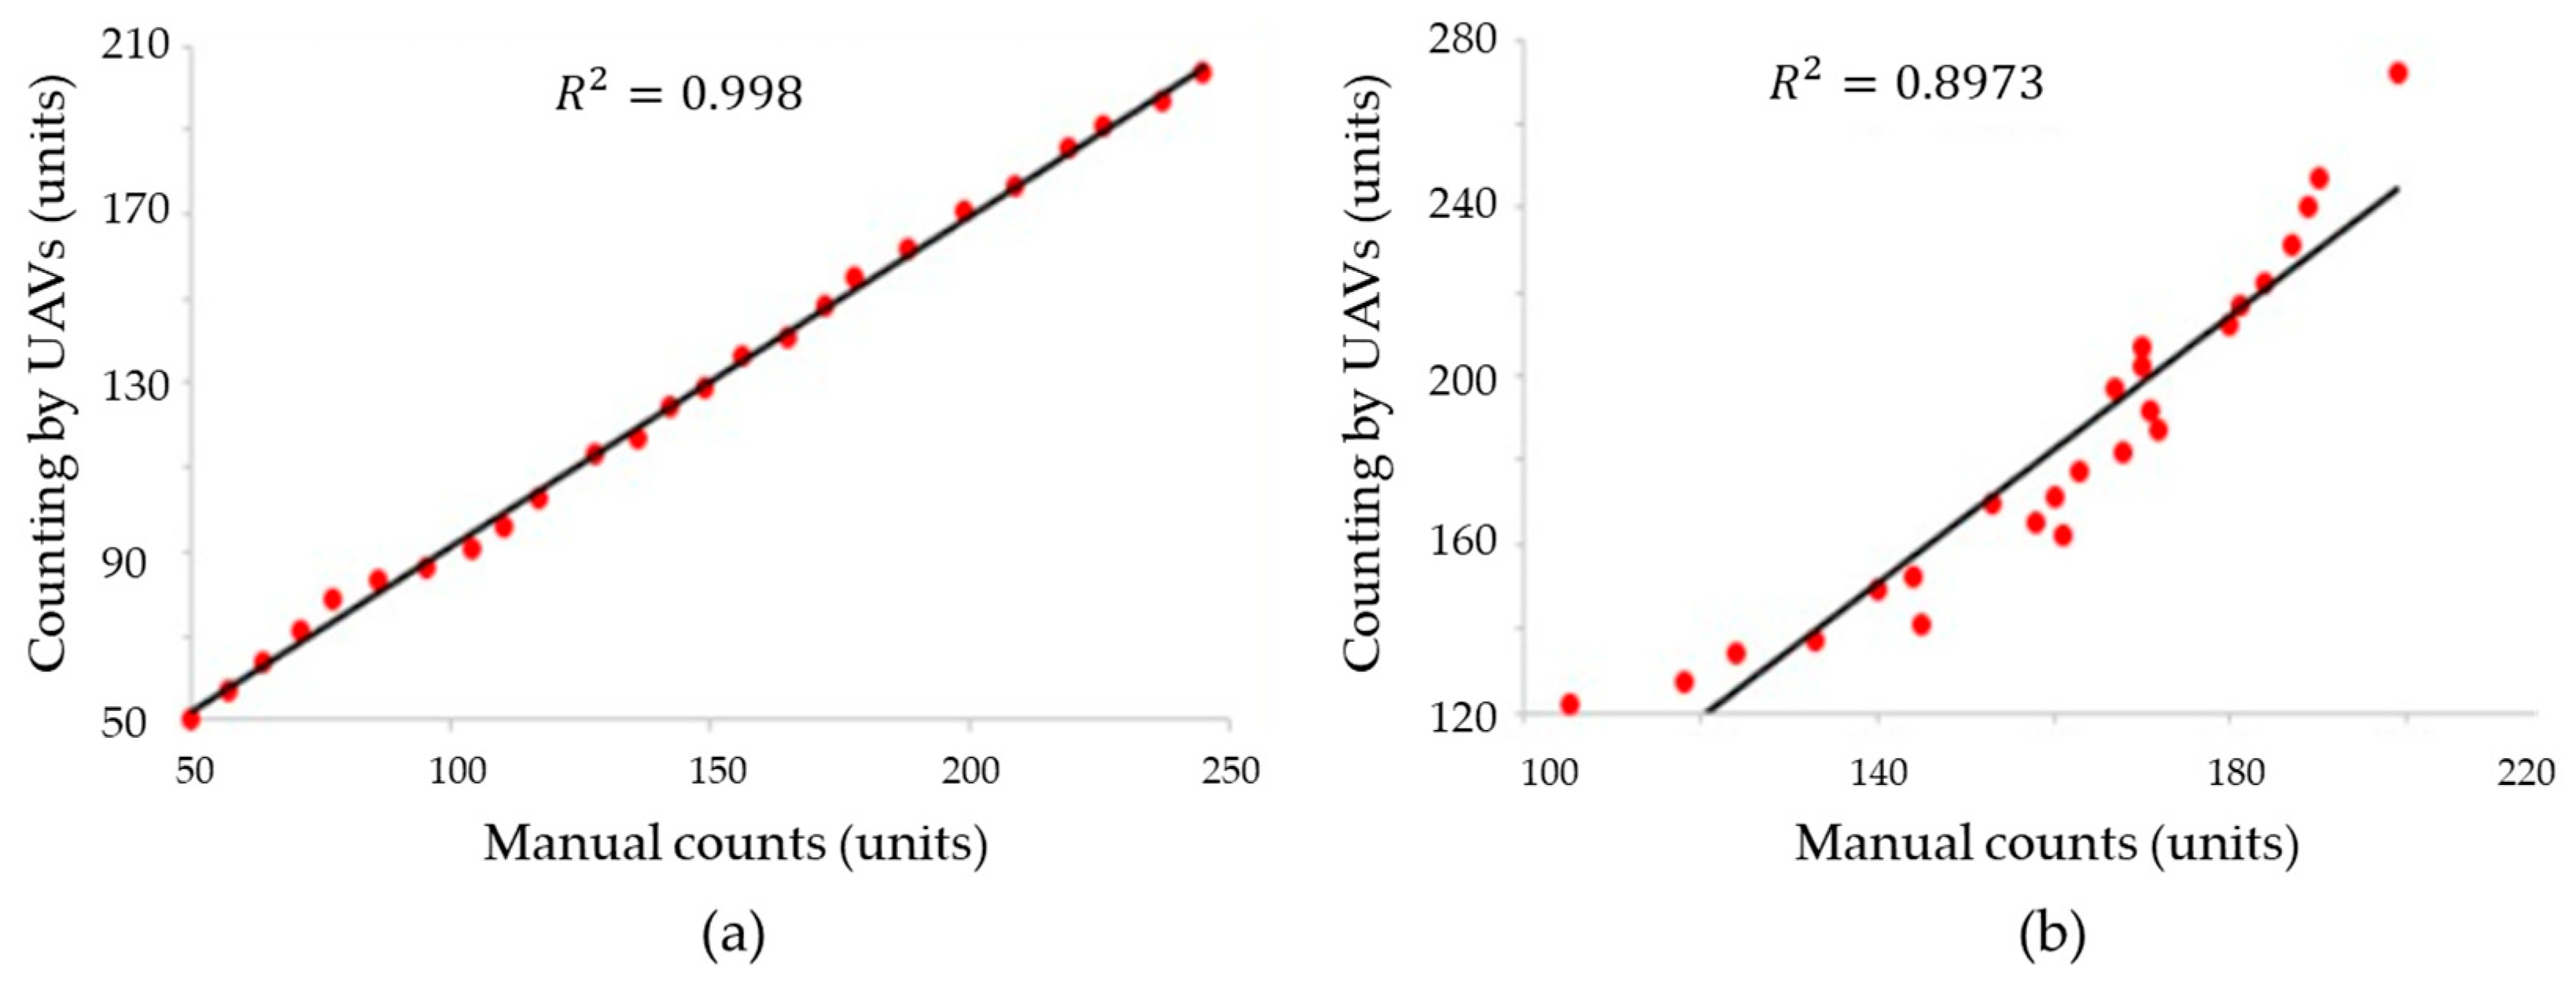
The developed method for counting open rosebuds using artificial vision was evaluated by comparing the counts obtained from the algorithm with manual counts. The coefficient of determination R2 was used to evaluate the correlation between the counts of the developed method and the reference manual counts. The obtained R2 value of 0.997 shows a high correlation between the counts generated by the algorithm and the manual counts, suggesting that the developed method is highly accurate in predicting the number of open rosebuds (Figure 9). However, it is important to keep in mind that other factors, such as the accuracy of the manual counting method and the quality of the images used in the artificial vision system, can also influence the accuracy of the measurement [23].

Figure 9.
Correlation between the counts using the system by UAVs developed in this work, and referential manual count for (a) open buds, and (b) closed buds.
The average of the counts generated by the UAV was , while the average for manual counts was . The variability of the manual counts exceeds the variability obtained by UAV counts. In addition, the coefficient of variation of the UAV count was 36.08%, while for the manual count it was 42.69%. The UAV’s counting method allows us to improve the effectiveness of rose counting in comparison with manual methods. Additional advantages of the UAV’s count allow us to prefer this method, since the UAV and artificial vision reduce the contact with plants for the counting process, which minimizes the invasiveness on roses by manipulation.
The deep learning-based approach for counting open rosebuds has achieved a coefficient of determination (R2) of 0.997, indicating a high correlation between the counts generated by the algorithm and the manual reference counts. This implies that approximately 99.7% of the variability in the counts can be explained through the linear relationship between the two methods. On the other hand, in [24], the plant counting approach using UAVs and object detection algorithms has achieved (R2) values ranging from 0.96 to 0.97, also giving a strong correlation with manual counts. These numerical results confirm the capability of the computer vision and deep learning-based method to achieve an accurate and consistent estimation of the number of open rosebuds, slightly surpassing the cotton plant counting approach in terms of correlation. The approach utilized in this study is based on feature extraction using computer vision techniques and the utilization of deep learning algorithms such as YOLO V5. These methods enable the accurate detection of open rosebuds under different lighting conditions, sizes, and stages of plant development.
Furthermore, the coefficient of determination (R2) of 0.8973 in the count of closed rosebuds reflects a strong relationship between the results obtained through the algorithm and the manual reference counts. This value suggests that approximately 89.73% of the observed variability in the counts of closed buds can be attributed to the accuracy of the developed algorithm. The experimental results of Yolov5-combined DeepSORT in rosebud detection were 99.8% for open rosebuds and 89.73% for closed rosebuds.
4. Discussion
The integration of object detection and aerial imagery systems in agriculture has produced a variety of applications, including the detection of different tree species, tomato counting, and diseased plant identification, among others. Different research has used image processing and deep-learning methods to count and detect fruits and flowers, with accuracy rates varying according to the study. The research published in [25] achieved a prediction accuracy of 86% in fruit counting, and [26] obtained an average error rate of 10% in the counting of strawberry flowers. For [27], the authors obtained a prediction accuracy of over 90% in the detection and counting of pineapple fruits. In [10], the results obtained an accuracy rate of 99% for green tomatoes, 85% for red tomatoes, and 50% for flower counting. Also, in the investigation based on the maturation state of the flowers [28], they proposed a classification method based on deep learning and deep information to rate the quality of rosebuds, obtaining a result for the accuracy of the classification.
The degree of maturation status for the improved model, based on InceptionV3 with depth data, was up to 98%, though it should be mentioned that the recognition was not carried out in the field. For the research reported by [29], transfer learning methods based on CNN were studied for the recognition of flower species, which included rosebuds. This study resulted in the highest accuracy of 92.25%, obtained with the InceptionResNetV2 model for flowers. In this research, an mAP@0.5 of 0.965 for open rosebuds and 0.889 for closed rosebuds was achieved with the YOLOv5x model. The lower accuracy in detecting closed rosebuds is attributed to a lower number of labels and the challenges posed by their size, shape, and confusion with the green color of the leaves in this class of rosebuds. These results are displayed in Table 5.
Table 5.
Comparison between our work and recent research.
5. Conclusions
In this work, we demonstrate the usability of a combination of UAVs and image classification to estimate the state of Explorer roses on a farmer’s greenhouse. The implementation of the system gave us consistent results compared to the traditional methods used for counting open and closed rosebuds. This allows the reduction in the time spent on manual recognition of the state of rosebuds and increases the volume of the sample analyzed in a single read. The model used achieved an mAP of 94.1% under normal conditions of light and temperature for open and closed rosebuds. Compared with similar works reported, the use of YOLOv5 gave us good performance in rose counting. The results obtained allow us to recommend the use of the system to plan harvests with a certain accuracy, despite the image acquisition being enhanced by the development of autonomous trajectory control algorithms to reduce counting time and improve accuracy. This contactless method for rose-state analysis also offers benefits to the floricultural industry. As many types of roses exhibit high sensitivity to manipulation, the use of UAVs minimizes plant damage and affects the final product quality.
Author Contributions
Conceptualization, D.H. and J.V.-A.; methodology, D.H. and P.E.-V.; software, D.H. and E.C.; validation, E.C., M.O. and J.V.-A.; formal analysis, D.H. and J.V.-A.; investigation, D.H.; resources, D.H. and J.V.-A.; data curation, M.O.; writing—original draft preparation, D.H. and M.O.; writing—review and editing, P.E.-V. and J.V.-A.; visualization, E.C. and P.E.-V.; supervision, J.V.-A.; project administration, M.O.; funding acquisition, J.V.-A. All authors have read and agreed to the published version of the manuscript.
Funding
The APC was funded by Universidad Indoamérica with funding number INV-0019-011-005.
Institutional Review Board Statement
Not applicable.
Informed Consent Statement
Not applicable.
Data Availability Statement
The datasets generated during and analyzed during the current study are available from the following link: https://zenodo.org/record/8401174, accessed on 2 October 2023.
Acknowledgments
The authors would like to thank CICHE Research Center and SISAu Research Group for the support in this work. The results of this work are part of the project “Tecnologías de la Industria 4.0 en Educación, Salud, Empresa e Industria” developed by Universidad Indoamérica. This work was supported in part by collaboration with REDTPI4.0 CYTED program.
Conflicts of Interest
The authors declare no conflicts of interest.
References
- Cheng, C.; Fu, J.; Su, H.; Ren, L. Recent Advancements in Agriculture Robots: Benefits and Challenges. Machines 2023, 11, 48. [Google Scholar] [CrossRef]
- Wani, M.A.; Din, A.; Nazki, I.T.; Rehman, T.U.; Al-Khayri, J.M.; Jain, S.M.; Lone, R.A.; Bhat, Z.A.; Mushtaq, M. Navigating the Future: Exploring Technological Advancements and Emerging Trends in the Sustainable Ornamental Industry. Front. Environ. Sci. 2023, 11, 1188643. [Google Scholar] [CrossRef]
- Verdonk, J.C.; van Ieperen, W.; Carvalho, D.R.A.; van Geest, G.; Schouten, R.E. Effect of Preharvest Conditions on Cut-Flower Quality. Front. Plant Sci. 2023, 14, 1281456. [Google Scholar] [CrossRef] [PubMed]
- Ramadhani, W.; Anshari, K.; Febtiningsih, P. The Implementation of Internet of Things-Based Automatic Plant Watering Equipment at Sun Flower Ornamental Plant Shop. AIP Conf. Proc. 2023, 2601, 020041. [Google Scholar] [CrossRef]
- Mahmud, M.S.; Zahid, A.; Das, A.K. Sensing and Automation Technologies for Ornamental Nursery Crop Production: Current Status and Future Prospects. Sensors 2023, 23, 1818. [Google Scholar] [CrossRef] [PubMed]
- Velusamy, P.; Rajendran, S.; Mahendran, R.K.; Naseer, S.; Shafiq, M.; Choi, J.-G. Unmanned Aerial Vehicles (UAV) in Precision Agriculture: Applications and Challenges. Energies 2021, 15, 217. [Google Scholar] [CrossRef]
- Darwin, B.; Dharmaraj, P.; Prince, S.; Popescu, D.E.; Hemanth, D.J. Recognition of Bloom/Yield in Crop Images Using Deep Learning Models for Smart Agriculture: A Review. Agronomy 2021, 11, 646. [Google Scholar] [CrossRef]
- Radoglou-Grammatikis, P.; Sarigiannidis, P.; Lagkas, T.; Moscholios, I. A Compilation of UAV Applications for Precision Agriculture. Comput. Netw. 2020, 172, 107148. [Google Scholar] [CrossRef]
- Maraveas, C. Incorporating Artificial Intelligence Technology in Smart Greenhouses: Current State of the Art. Appl. Sci. 2023, 13, 14. [Google Scholar] [CrossRef]
- Egi, Y.; Hajyzadeh, M.; Eyceyurt, E. Drone-Computer Communication Based Tomato Generative Organ Counting Model Using YOLO V5 and Deep-Sort. Agriculture 2022, 12, 1290. [Google Scholar] [CrossRef]
- Babila, I.F.E.; Villasor, S.A.E.; Dela Cruz, J.C. Object Detection for Inventory Stock Counting Using YOLOv5. In Proceedings of the 2022 IEEE 18th International Colloquium on Signal Processing & Applications (CSPA), Selangor, Malaysia, 12 May 2022; pp. 304–309. [Google Scholar] [CrossRef]
- Jintasuttisak, T.; Edirisinghe, E.; Elbattay, A. Deep Neural Network Based Date Palm Tree Detection in Drone Imagery. Comput. Electron. Agric. 2022, 192, 106560. [Google Scholar] [CrossRef]
- Coutinho Meneguzzi, C.; Fernandes da Silva, G.; Regis Mauri, G.; Ribeiro de Mendonça, A.; Almeida de Barros Junior, A. Routing Model Applied to Forest Inventory Vehicles Planning. Comput. Electron. Agric. 2020, 175, 105544. [Google Scholar] [CrossRef]
- Wang, A.; Peng, T.; Cao, H.; Xu, Y.; Wei, X.; Cui, B. TIA-YOLOv5: An Improved YOLOv5 Network for Real-Time Detection of Crop and Weed in the Field. Front. Plant Sci. 2022, 13, 1091655. [Google Scholar] [CrossRef] [PubMed]
- Dorrer, M.G.; Popov, A.A.; Tolmacheva, A.E. Building an Artificial Vision System of an Agricultural Robot Based on the DarkNet System. IOP Conf. Ser. Earth Environ. Sci. 2020, 548, 32032. [Google Scholar] [CrossRef]
- Tian, M.; Liao, Z. Research on Flower Image Classification Method Based on YOLOv5. J. Phys. Conf. Ser. 2021, 2024, 12022. [Google Scholar] [CrossRef]
- Lin, P.; Li, D.; Jia, Y.; Chen, Y.; Huang, G.; Elkhouchlaa, H.; Yao, Z.; Zhou, Z.; Zhou, H.; Li, J.; et al. A Novel Approach for Estimating the Flowering Rate of Litchi Based on Deep Learning and UAV Images. Front. Plant Sci. 2022, 13, 966639. [Google Scholar] [CrossRef] [PubMed]
- Chen, Z.; Su, R.; Wang, Y.; Chen, G.; Wang, Z.; Yin, P.; Wang, J. Automatic Estimation of Apple Orchard Blooming Levels Using the Improved YOLOv5. Agronomy 2022, 12, 2483. [Google Scholar] [CrossRef]
- Feng, Z.; Guo, L.; Huang, D.; Li, R. Electrical Insulator Defects Detection Method Based on YOLOv5. In Proceedings of the 2021 IEEE 10th Data Driven Control and Learning Systems Conference (DDCLS), Suzhou, China, 14–16 May 2021; pp. 979–984. [Google Scholar] [CrossRef]
- Horvat, M.; Jelečević, L.; Gledec, G. A Comparative Study of YOLOv5 Models Performance for Image Localization and Classification. In Proceedings of the Central European Conference on Information and Intelligent Systems, Dubrovnik, Croatia, 21–23 September 2022; Faculty of Organization and Informatics Varazdin: Varazdin, Croatia, 2022; pp. 349–356. [Google Scholar]
- Padilla, R.; Netto, S.L.; da Silva, E.A.B. A Survey on Performance Metrics for Object-Detection Algorithms. In Proceedings of the 2020 International Conference on Systems, Signals and Image Processing (IWSSIP), Niterói, Brazil, 1–3 July 2020; pp. 237–242. [Google Scholar] [CrossRef]
- Gunjal, P.R.; Gunjal, B.R.; Shinde, H.A.; Vanam, S.M.; Aher, S.S. Moving Object Tracking Using Kalman Filter. In Proceedings of the 2018 International Conference on Advances in Communication and Computing Technology (ICACCT), Sangamner, India, 8–9 February 2018; pp. 544–547. [Google Scholar] [CrossRef]
- Li, Y.; Ma, R.; Zhang, R.; Cheng, Y.; Dong, C. A Tea Buds Counting Method Based on YOLOv5 and Kalman Filter Tracking Algorithm. Plant Phenomics 2023, 5, 0030. [Google Scholar] [CrossRef]
- Oh, S.; Chang, A.; Ashapure, A.; Jung, J.; Dube, N.; Maeda, M.; Gonzalez, D.; Landivar, J. Plant Counting of Cotton from UAS Imagery Using Deep Learning-Based Object Detection Framework. Remote Sens. 2020, 12, 2981. [Google Scholar] [CrossRef]
- Hosseiny, B.; Rastiveis, H.; Homayouni, S. An Automated Framework for Plant Detection Based on Deep Simulated Learning from Drone Imagery. Remote Sens. 2020, 12, 3521. [Google Scholar] [CrossRef]
- Heylen, R.; van Mulders, P.; Gallace, N. Counting Strawberry Flowers on Drone Imagery with a Sequential Convolutional Neural Network. In Proceedings of the 2021 IEEE International Geoscience and Remote Sensing Symposium IGARSS, Brussels, Belgium, 11–16 July 2021; pp. 4880–4883. [Google Scholar] [CrossRef]
- Wan Nurazwin Syazwani, R.; Muhammad Asraf, H.; Megat Syahirul Amin, M.A.; Nur Dalila, K.A. Automated Image Identification, Detection and Fruit Counting of Top-View Pineapple Crown Using Machine Learning. Alex. Eng. J. 2022, 61, 1265–1276. [Google Scholar] [CrossRef]
- Sun, X.; Li, Z.; Zhu, T.; Ni, C. Four-Dimension Deep Learning Method for Flower Quality Grading with Depth Information. Electronics 2021, 10, 2353. [Google Scholar] [CrossRef]
- Bozkurt, F. A Study on CNN Based Transfer Learning for Recognition of Flower Species. Eur. J. Sci. Technol. 2022, 32, 883–890. [Google Scholar] [CrossRef]


Disclaimer/Publisher’s Note: The statements, opinions and data contained in all publications are solely those of the individual author(s) and contributor(s) and not of MDPI and/or the editor(s). MDPI and/or the editor(s) disclaim responsibility for any injury to people or property resulting from any ideas, methods, instructions or products referred to in the content. |
© 2024 by the authors. Licensee MDPI, Basel, Switzerland. This article is an open access article distributed under the terms and conditions of the Creative Commons Attribution (CC BY) license (https://creativecommons.org/licenses/by/4.0/).