Article

Exposure to Noise from Agricultural Machinery: Risk Assessment of Agricultural Workers in Italy

by
Valerio Di Stefano
1,2,*,
Massimo Cecchini
2,3,
Simone Riccioni
3,
Giorgia Di Domenico
1,2,3 and
Leonardo Bianchini
2,3,*
1
Council for Agricultural Research and Economics, Research Centre for Forestry and Wood, Via Valle della Quistione, 27, 00166 Rome, Italy
2
Osservatorio Diritto e Foreste “Juris Silva”, Via Fiorita, 6b, Passignano sul Trasimeno, 06065 Perugia, Italy
3
Department of Agriculture and Forest Sciences (DAFNE), University of Tuscia, Via S. Camillo de Lellis snc, 01100 Viterbo, Italy
*
Authors to whom correspondence should be addressed.
AgriEngineering 2025, 7(3), 87; https://doi.org/10.3390/agriengineering7030087
Submission received: 4 February 2025 / Revised: 4 March 2025 / Accepted: 14 March 2025 / Published: 19 March 2025

Abstract

:
Accidents and deaths at work are a persistent problem, with numbers still worrying. The agricultural and forestry sector is among the most exposed to work risks, with particular attention to noise risk from the use of agricultural machinery and operators. This study aims to analyze the exposure to noise risk during use of wheeled and tracked tractors, with or without a cab, as well as other operating machines. The analysis takes into account the parameters Lpeak (peak sound pressure values), LAeq.T (time-weighted equivalent noise exposure levels) and LAS (maximum and minimum values weighted according to the Slow time constant) in order to assess the noise impact and define strategies for improving the safety and health of workers. This study demonstrates that in multiple cases, the regulatory thresholds for the examined variables are exceeded, regardless of the presence of a cabin. Specifically, Lpeak values approach 140 dB, dangerous to human health, while LAeq.T levels are close to or, in some instances, exceed 87 dB. It is also verified that agricultural and forestry operators who mainly use crawler tractors have greater and constant exposure to noise compared to those who use tractors with a cabin.

1. Introduction

In the agricultural and forestry sector, managing safety at work is particularly complex due to the environmental, infrastructural and organizational characteristics of companies. These vary from large structured companies to micro-family businesses, with operational logics that are often not standardizable. Furthermore, factors such as the advanced age of operators can amplify professional risks [1].
One of the main dangers for agricultural workers is exposure to noise, resulting from the use of machinery such as tractors, chainsaws and other motorized tools [2]. Prolonged and intense noise can cause hearing damage, up to permanent loss, as well as generate stress, fatigue and difficulty concentrating, thus increasing the risk of accidents. Italian legislation, in particular Legislative Decree 81/2008, imposes prevention measures such as risk assessment, the use of personal protective equipment (PPE) and the regular maintenance of machinery to reduce noise emissions [3]. However, the fragmentation of the sector and the presence of small companies often make the effective implementation of these measures difficult, requiring greater institutional commitment to protect workers [4]. The aim of this work is to analyze the conditions of agricultural and forestry workers during the use of agricultural machinery and agricultural operating machines with particular attention to the risk deriving from noise and, based on the results obtained, suggest and promote political and technical actions to improve workers’ safety.
From the data presented (Figure 1), it clearly emerges that the agricultural and forestry sector records a significantly higher incidence of injuries and deaths than other production sectors in the European Union.
One of the main causes of noise risk is the obsolescence of agricultural machinery fleets in particular tractors, which often do not fully meet the minimum safety requirements established by current legislation [5,6]. In Italy, tractor fleets in circulation number approximately 2,000,000 units, of which a significant portion is obsolete [6]. Data indicate that 75% of agricultural tractors currently in service are more than 25 years old [7]. In recent years, however, there has been a growing trend towards renewing machinery fleets by Italian agricultural entrepreneurs and farmers, after the slowing down recorded following the COVID-19 pandemic. In 2021, registrations of new tractors reached 24,400 units, with an increase of more than 36% compared to in 2020. The new-generation tractors not only comply with more stringent safety requirements but also help reduce the environmental impact associated with older models, a particularly relevant aspect given the significant weight of the sector in terms of environmental sustainability.
While implementing the European Directive 2003/10/EC of 6 February 2003 on the minimum health and safety requirements regarding the exposure of workers to the risks arising from physical agents (noise), the Italian government introduced three risk classes:
(a)
Exposure limit values: LEX, 8 h = 87 dB(A); Lpeak = 140 dB(C);
(b)
Upper action values: LEX, 8 h = 85 dB(A); Lpeak = 137 dB(C);
(c)
Lower action values: LEX, 8 h = 80 dB(A); Lpeak = 135 dB(C).
The values must be considered in operators wearing hearing protection devices [8].
Exceeding the lower action values requires the entry of a certain significant percentage of the working population into a risk band that could give rise to permanent effects on auditory apparatus, with a higher probability of prolonged, repeated and continuous exposure to values larger or equal than this threshold; the higher the exposure values are, the greater the percentage of workers who are more likely to show damaging auditory (noise-induced hypoacusis) and extra-auditory effects is.
Furthermore, due to the intrinsic characteristics of the working activity, daily exposure to noise varies significantly from one working day to the next; for the purpose of applying exposure limit values and action values, it is possible to replace the level of daily noise exposure with the weekly exposure level if the following are provided:
  • The weekly noise exposure level does not exceed the exposure limit value of 87 dB(A); however, this condition must be confirmed by a suitable check.
  • Adequate measures are taken to minimize the risks associated with these activities.
The peak value is another important problem; in fact, operations for measuring the noise value are frequently carried out with the machine in motion, not detecting all the data prior to the starting of the machine [9]. Also, in this hypothesis, to safeguard the health of workers, the legislator planned the three risk classes mentioned above (corresponding to sound pressures of 200 Pa, 140 Pa and 112 Pa, respectively).
From some analyses that were carried out by authors in the field, it was observed that during the use of agricultural machines, especially of tractors, the operator is exposed to very high peak noise values even before the machine starts working. These values are, in all probability, due to the closing of the tractor cab doors: at this moment, in fact, the operator is not wearing any personal protective equipment (PPE) and there are high health risks [10].
This study, after a preliminary analysis of accidents in the agricultural and forestry sector and the main regulatory sources that regulate the matter, focused on the “noise risk”. The survey was based on measurements taken by specialized technicians of a sample of 354 different models of tractors, including the related operating machines, operating in approximately 50 agricultural and forestry companies located in central Italy. The main objective was to evaluate the noise exposure of agricultural workers, in accordance with the requirements established by Legislative Decree no. 81/2008, during the use of wheeled and tracked tractors, with or without a cab, as well as other operating machines, with particular attention to the acoustic parameters relevant to the protection of health and safety at work or the following:
(a)
Peak sound pressure values (Lpeak);
(b)
Time-weighted equivalent noise exposure levels (LAeq.T);
(c)
Maximum (LAS max) and minimum (LAS min) values weighted according to the Slow time constant (S).

2. Materials and Methods

2.1. Sampling Techniques and Tools

This study investigated the noise emissions of tractors in agricultural operations, based on data collected from over 50 farms and farmers in central Italy over the period 2011–2019. A total of 354 measurements were taken of 119 distinct tractor models, including both wheeled and tracked configurations, coupled with various agricultural implements and operating machines. The tractors analyzed represent a broad spectrum of manufacturers, ages and technological features, reflecting the diversity of equipment used in the region.
This research aimed to evaluate operator exposure to noise under real-world working conditions, considering different operational scenarios and machine combinations. Noise levels were measured according to standardized procedures, capturing key parameters such as equivalent continuous sound levels (LAeq.T), peak sound pressure levels (Lpeak) and the maximum and minimum sound levels (LASmax and LASmin).
Further parameters that were taken into consideration were the sound pressure levels and peak levels in the presence or absence of a cabin, analyzed with the same methods mentioned below. But, instead of examining each individual frequency, the octave bands were taken into consideration, which grouped the frequencies into intervals and are commonly used to represent noise and vibrations in a more understandable way. An octave represents, in fact, a range of values in which the maximum frequency is double the minimum.
This comprehensive dataset provides valuable insights into the factors influencing noise emissions, such as tractor age, cabin presence or absence, the type of operation and the compatibility of tractors with specific implements. The findings contribute to the understanding of occupational noise exposure in the agricultural sector and offer critical information for improving compliance with safety standards, particularly those outlined in Directive 2003/10/EC and Italy’s Legislative Decree 81/2008.
This study highlights the pressing need for the modernization of agricultural machinery fleets, as well as the importance of adopting noise-reduction technologies and operator training to mitigate the long-term health risks associated with occupational noise exposure. The measurement campaigns were carried out using the following:
(a)
Acoustically competent technicians enrolled in special regional and ministerial (ENTECA) lists, with proven experience;
(b)
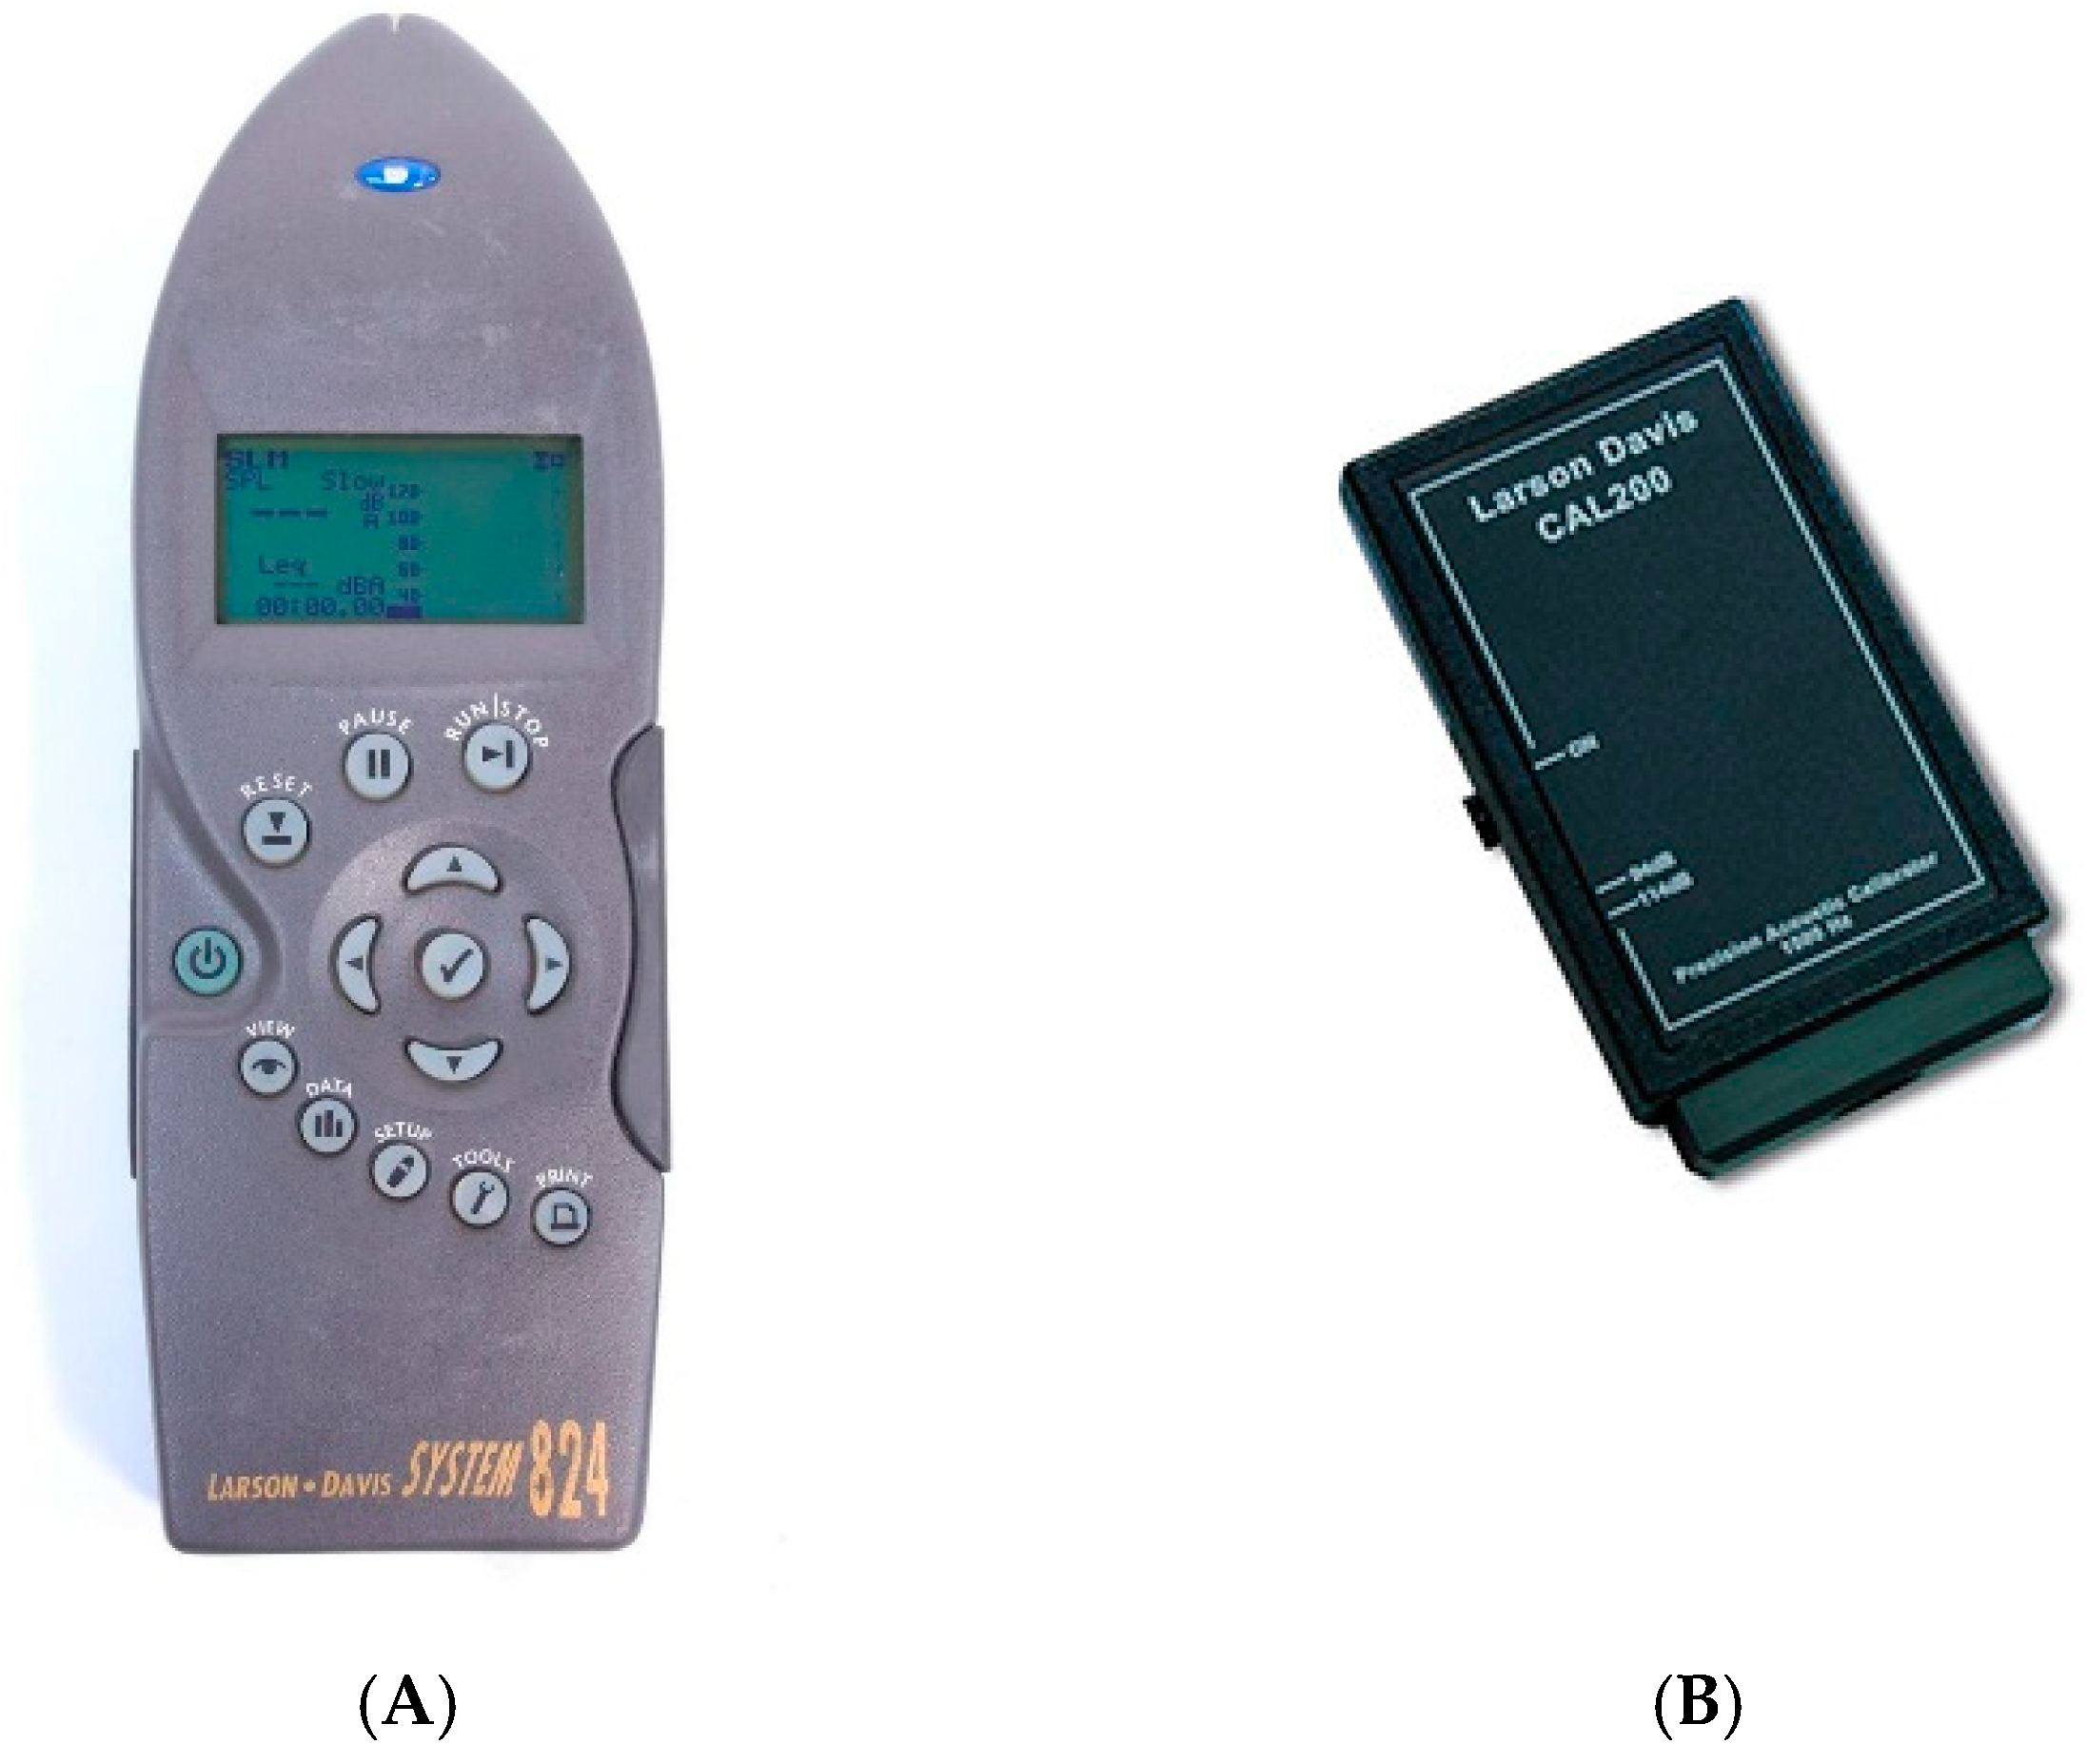
A Larson & Davis 824 Class 1 integrating sound level meter conforming to CEI EN 61672-1 and to IEC no. 651/1979 class 1, IEC no. 804/1985 class 1 and ANSI S.1.4.1983 class 1 and provided with regular calibration certificates (Figure 2);
(c)
Sampling methodologies and subsequent data processing, provided in the UNI EN ISO 9612:2011 technical standards [11].
In accordance with ISO 9612:2011, “Determination of noise exposure in the workplace”, field calibrations were carried out at the beginning and end of each measurement campaign. These procedures were performed at the beginning and at the end of each measurement campaign to verify the absence of deviations greater than 0.5 dB and thus to confirm the validity of the samplings. A class 1 Larson Davis Cal 200 precision calibrator conforming to IEC 60942:2003 was used to carry out the calibrations (Figure 2).
Figure 2. Larson & Davis 824 Class 1 integrating sound level meter (A) and Larson & Davis Cal 200 Class 1 Precision Calibrator (B).
Agriengineering 07 00087 g002
Since the driver of the tractor could not be removed from the driver’s position during the measurement, a special device was used to place the phonometric microphone at 0.1 m to 0.4 m from the entrance of the external auditory canal on the side of maximum exposure, at eye level and parallel and aligned with the axis of the operator’s field of view.
The device in question, shown in Figure 3, is a patent entitled “Wearable kit for measuring noise and vibration” (Patent No. 1425671), developed by Simone Riccioni, Roberto Bedini, Andrea Colantoni e Massimo Cecchini. The device allows operation according to the “Rules of the art” of personal sampling for the evaluation of workers’ noise exposure. It is composed of a helmet on which, by the means of two brackets, two microphone holder clamps are equipped that allow positioning at the right distance from the most exposed auditory canal.
For each measurement, meticulous attention was given to the positioning of the microphone to prevent interference from impacts, shocks or excessive airflow that could have compromised the accuracy of the results. The measurements were conducted during routine work operations performed with the tractors, ensuring that the data reflected real-world conditions. The duration of each measurement was carefully chosen to capture representative noise levels, with a minimum recording time of five minutes for each operation. This approach allowed for the reliable assessment of the noise emissions under typical working scenarios.
The types of tractors and the equipment used during the various work operations are detailed in Table 1 and Table 2, providing a comprehensive overview of the configurations analyzed in this study.
In Figure 4, the frequency of the tractor brands in the analyzed sample is shown.
The various types of tractors identified in the tables above (Table 2) were used with various types of coupled equipment. A full list of the types of implements used is shown in Table 2.
In the sample analyzed, 49% of the tractors were equipped with a cabin and 51% were without. Furthermore, 78% of the tractors were equipped with wheels while 22% were equipped with iron tracks.

2.2. Variables Analyzed

European and national legislation requires, as forementioned, for the correct assessment of the risk of workers’ noise exposure to measure and calculate the following:
  • The A-weighted curve equivalent sound pressure level of workers’ noise exposure, normalized to an eight-hour working day (LEX,8h).
  • The C-weighted curve peak sound pressure level (Lp, Cpeak or ppeak).
The LEX,8h, also known as the daily noise exposure level, is obtained from Equation (1):
L E X , 8 h = L e q A , T e + 10   l o g   T e T 0 ( d B )
where
-
LeqA,Te is the A-weighted equivalent continuous sound pressure level for the time interval Te;
-
Te is the effective duration, in hours, of the working day;
-
T0 is the reference duration, T0 = 8 h.
The A-weighted equivalent continuous sound pressure level for the time interval Te, LeqA,Te, is obtained from Equation (2):
L e q A , T e = 10   l o g 1 t 2 t 1 0 t p A 2 t p 0 2 d t   ( d B )
where
-
pA is the A-weighted sound pressure curve expressed in pascals [Pa];
-
T is the time interval starting at t1 and ending at t2;
-
P0 is the reference sound pressure of 20 μPa.
Lp, Cpeak or ppeak, i.e., the C-curve-weighted peak sound pressure level, is obtained from Equation (3):
L p = 10   l o g   p p e a k p 0 2   ( d B )
where
-
ppeak is the C-curve-weighted peak sound pressure.
-
P0 is the reference sound pressure of 20 μPa.
In order to be able to assign the appropriate range of risk, for which the legislation states specific duties, rights and obligations for both the employers and the workers, the values obtained according to the formulas above must be compared to the exposure limits and action values established by the law itself.

2.3. Data Analysis

Analyses were performed with JMP PRO 17 (Trial version ©SAS Institute Inc.; Cary, NC, USA). Data were tested for normality and homogeneity using the Shapiro–Wilk test and Levene’s test, (p = 0.05 for both). Non-significant factors were compared by one-factor or factorial analysis of variance (ANOVA; p = 0.05). Factors without normality and homogeneity characteristics were compared with the non-parametric Kruskal–Wallis test for each variable (p = 0.05). A cubic smoother spline with lambda = 0.05, standardized x-values and a 95% confidence interval was applied to the octave band curves. This indicates that there was a 95% probability that the true average noise or vibration values for any given machine type or drive type would be within the indicated range.
Further parameters that were taken into consideration were the sound pressure levels and peak levels in the presence or absence of a cabin, analyzed with the same methods mentioned above. But, instead of examining each individual frequency, the octave bands were taken into consideration, which grouped the frequencies into intervals and are commonly used to represent noise and vibrations in a more understandable way. An octave represents, in fact, a range of values in which the maximum frequency is double the minimum.

3. Results and Discussion

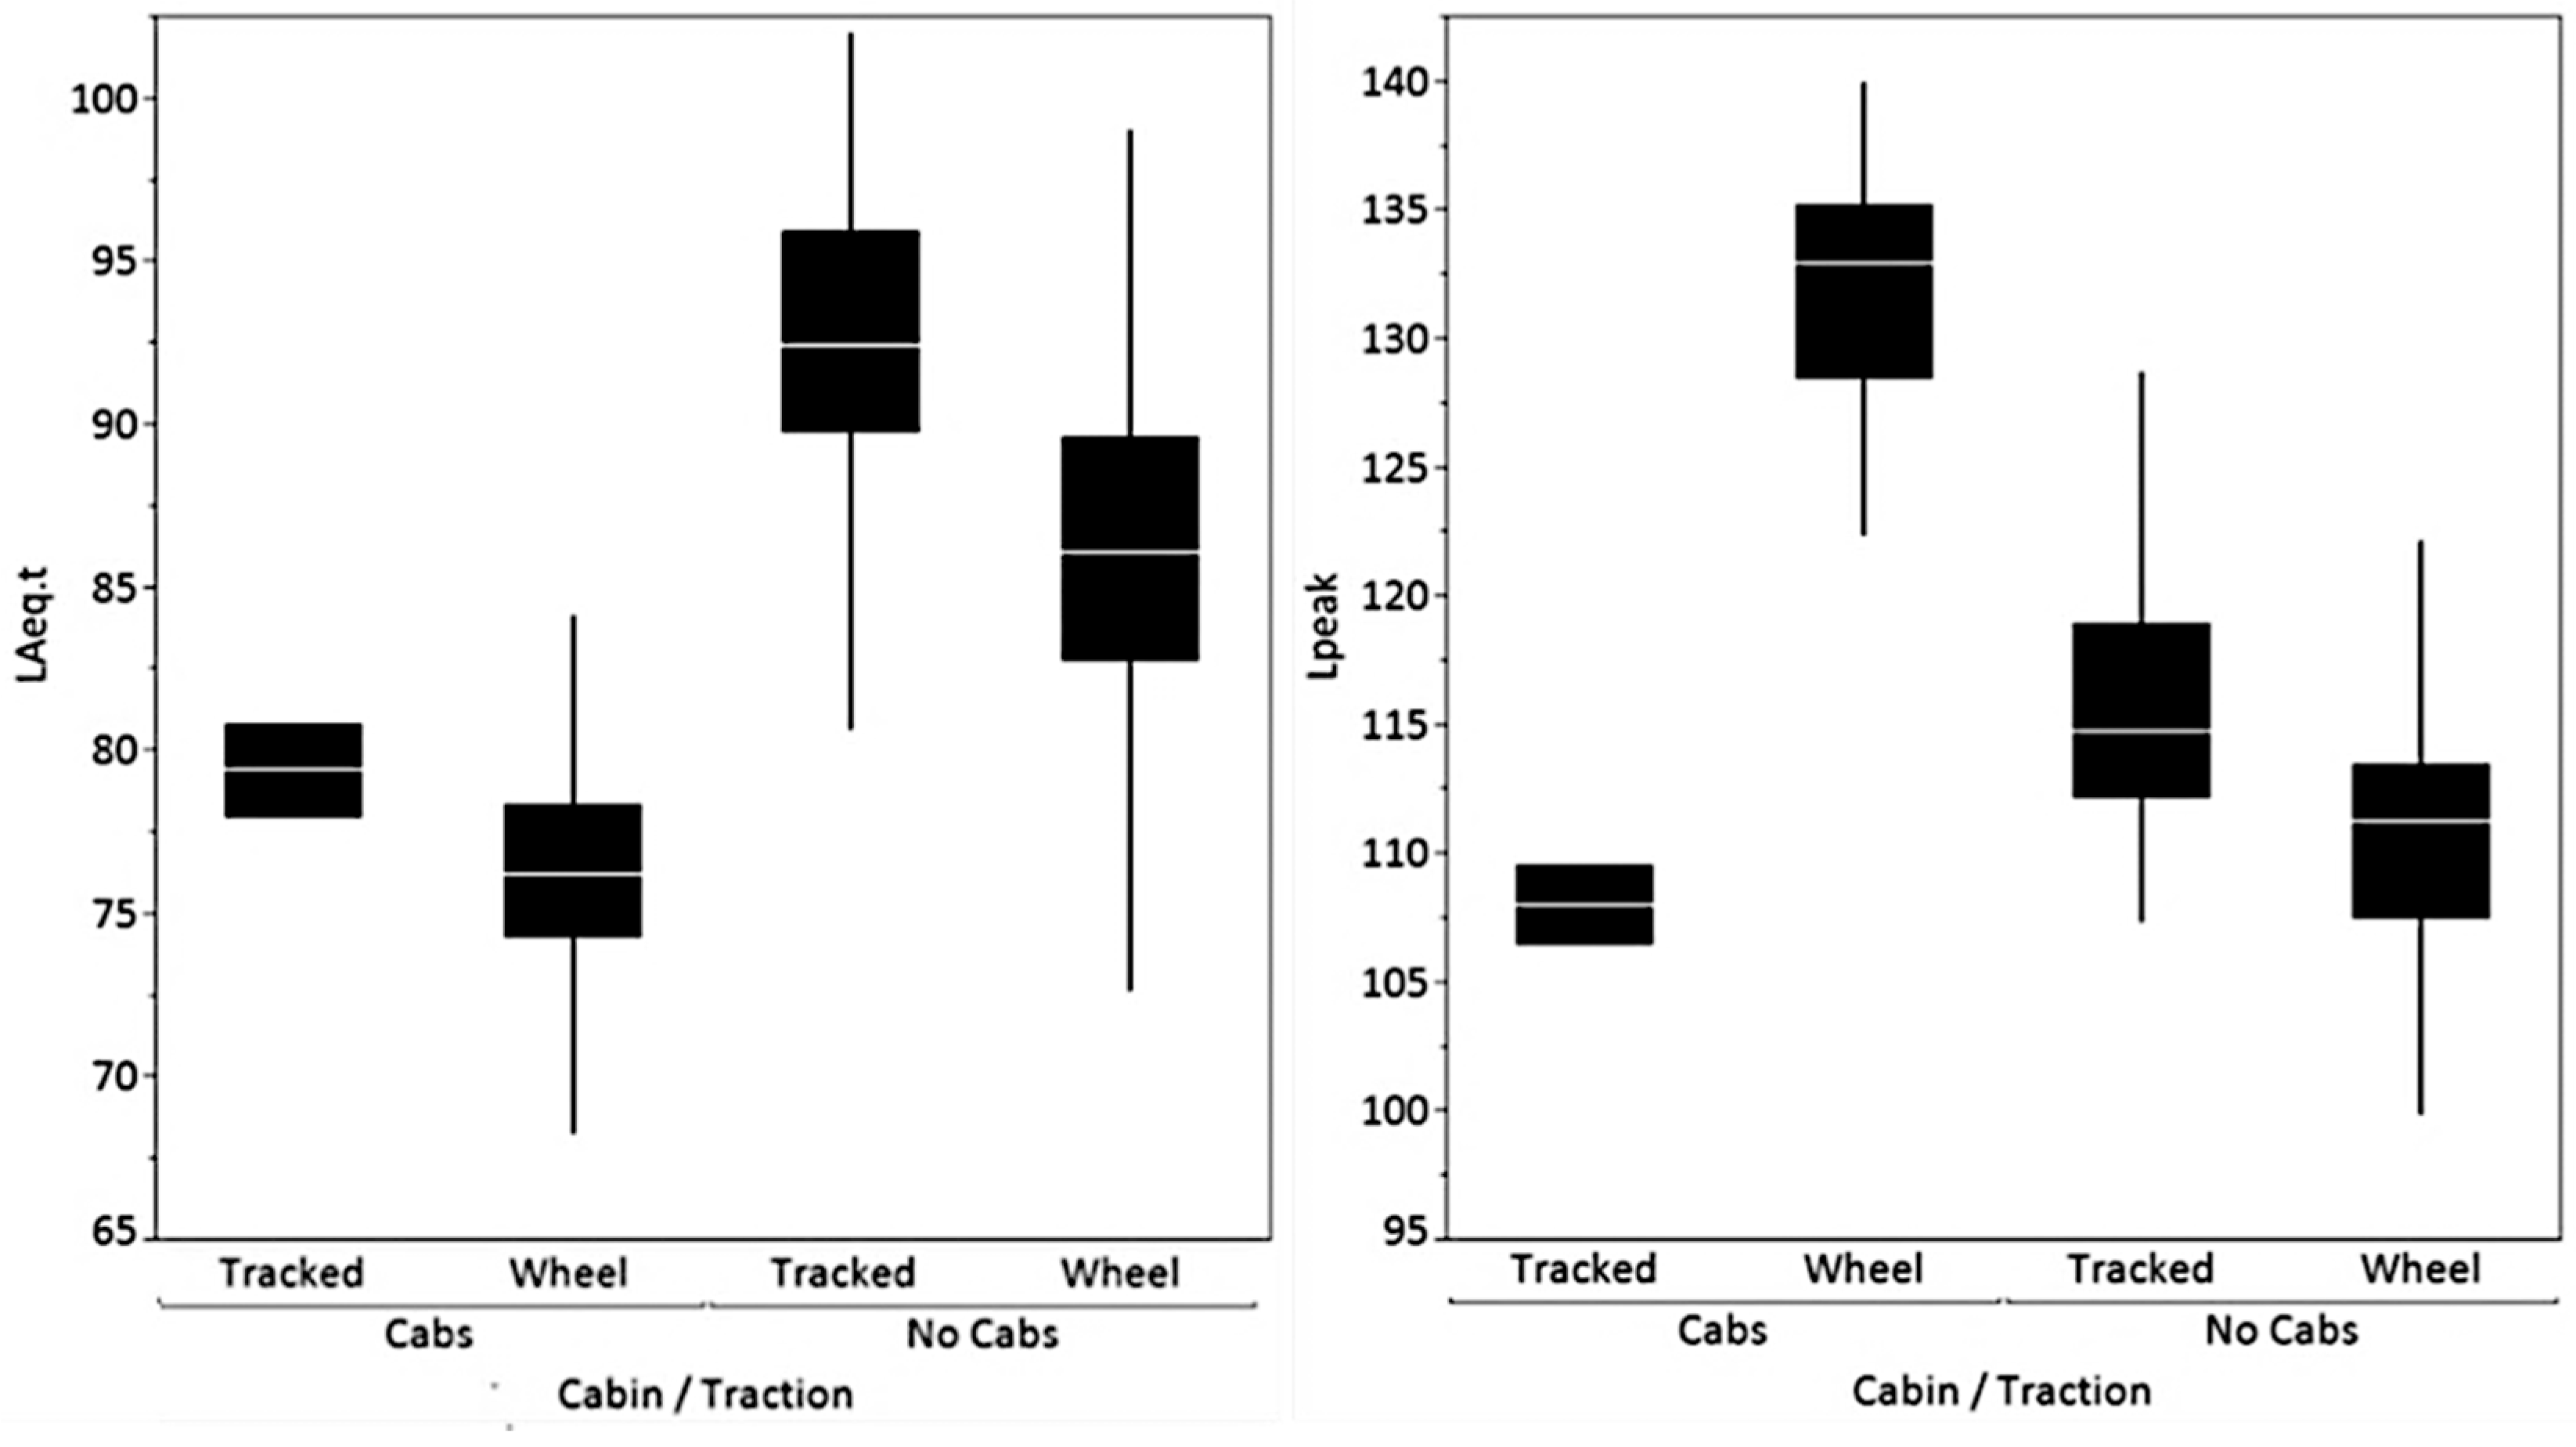
3.1. Noise Levels by Tractor Configuration

The phonometer used sampled the noise coming, as mentioned above, from 354 tractors to which various operating machines were connected. The phonometer recorded, for each tractor, data regarding the following:
-
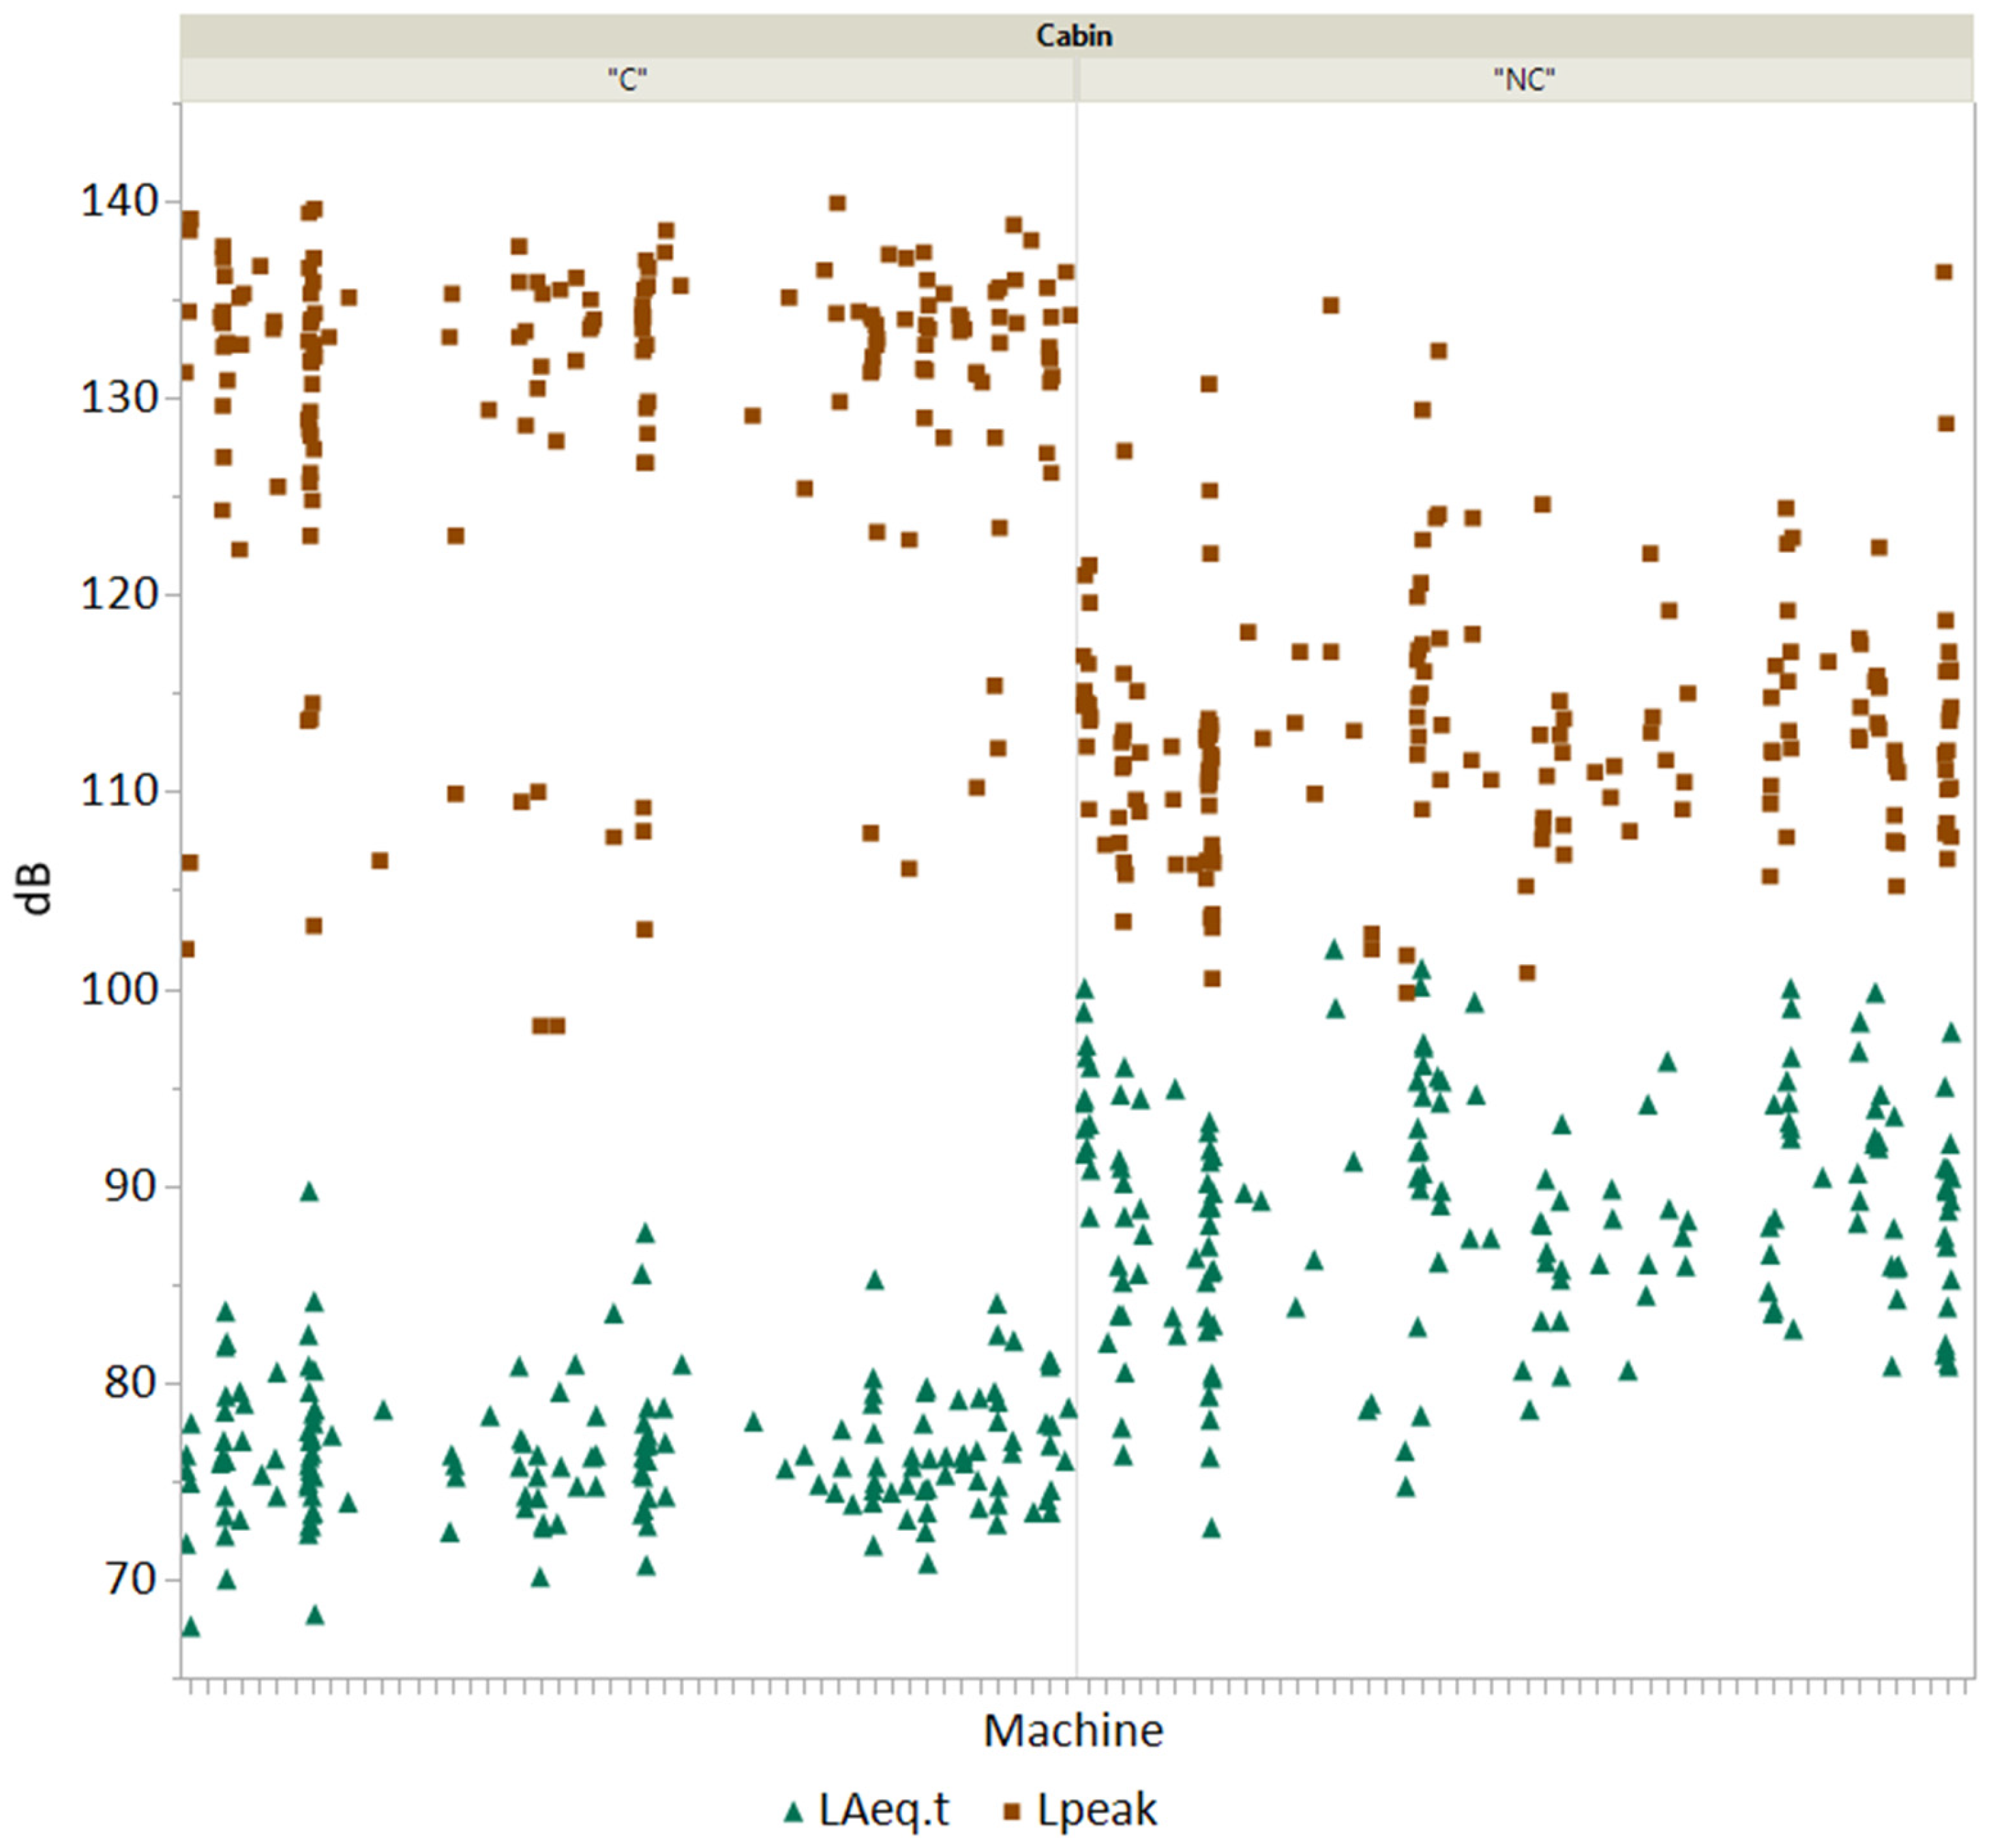
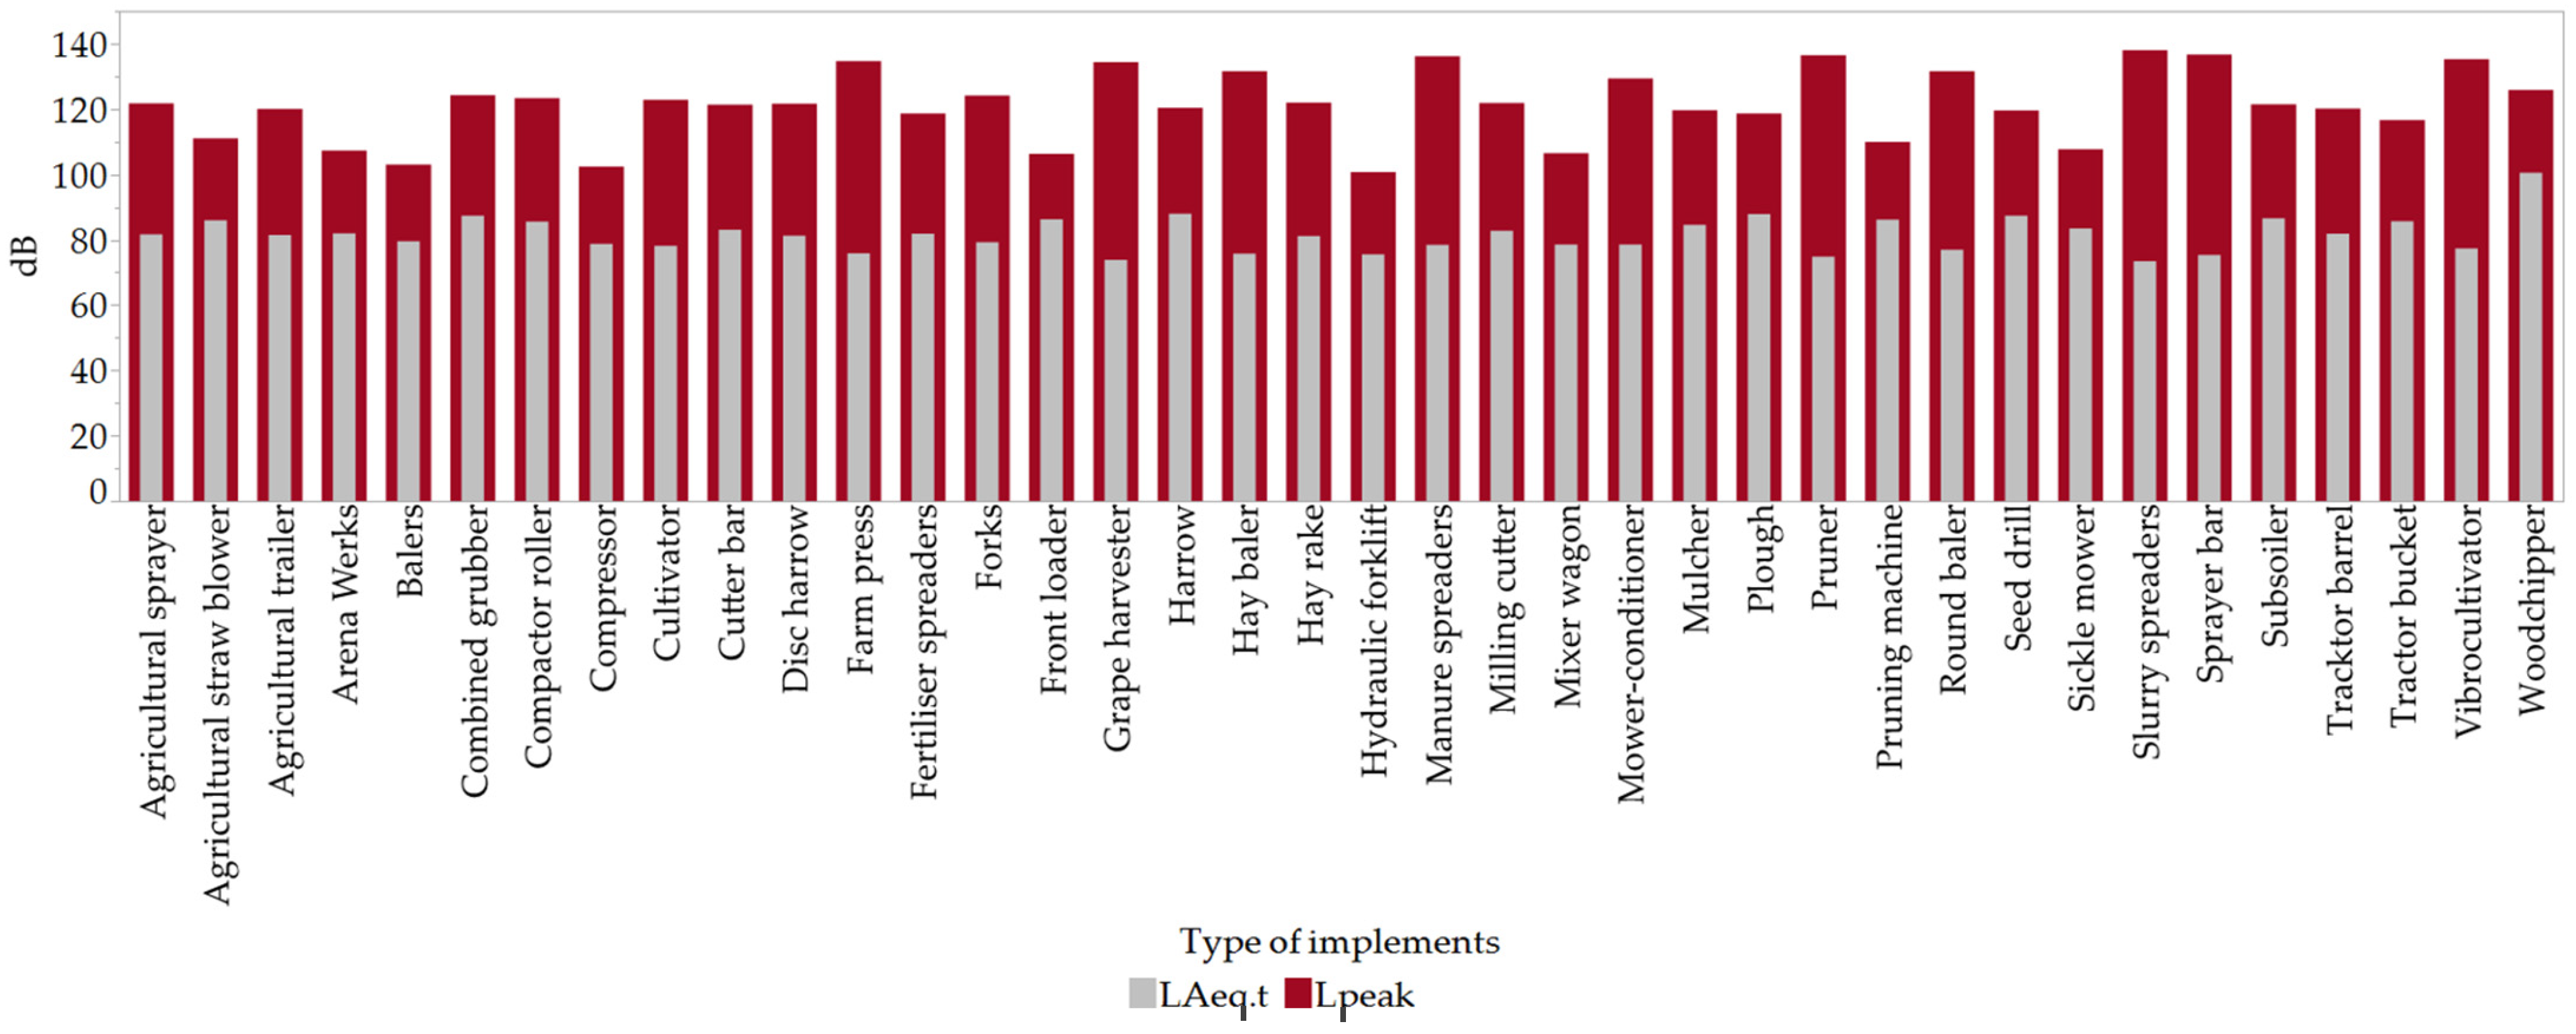
Lpeak = peak sound pressure (Ppeak): the maximum value of the instantaneous sound pressure weighted in the frequency “C”;
-
LAeq.T: the A-weighted value of the equivalent level (LAeq);
-
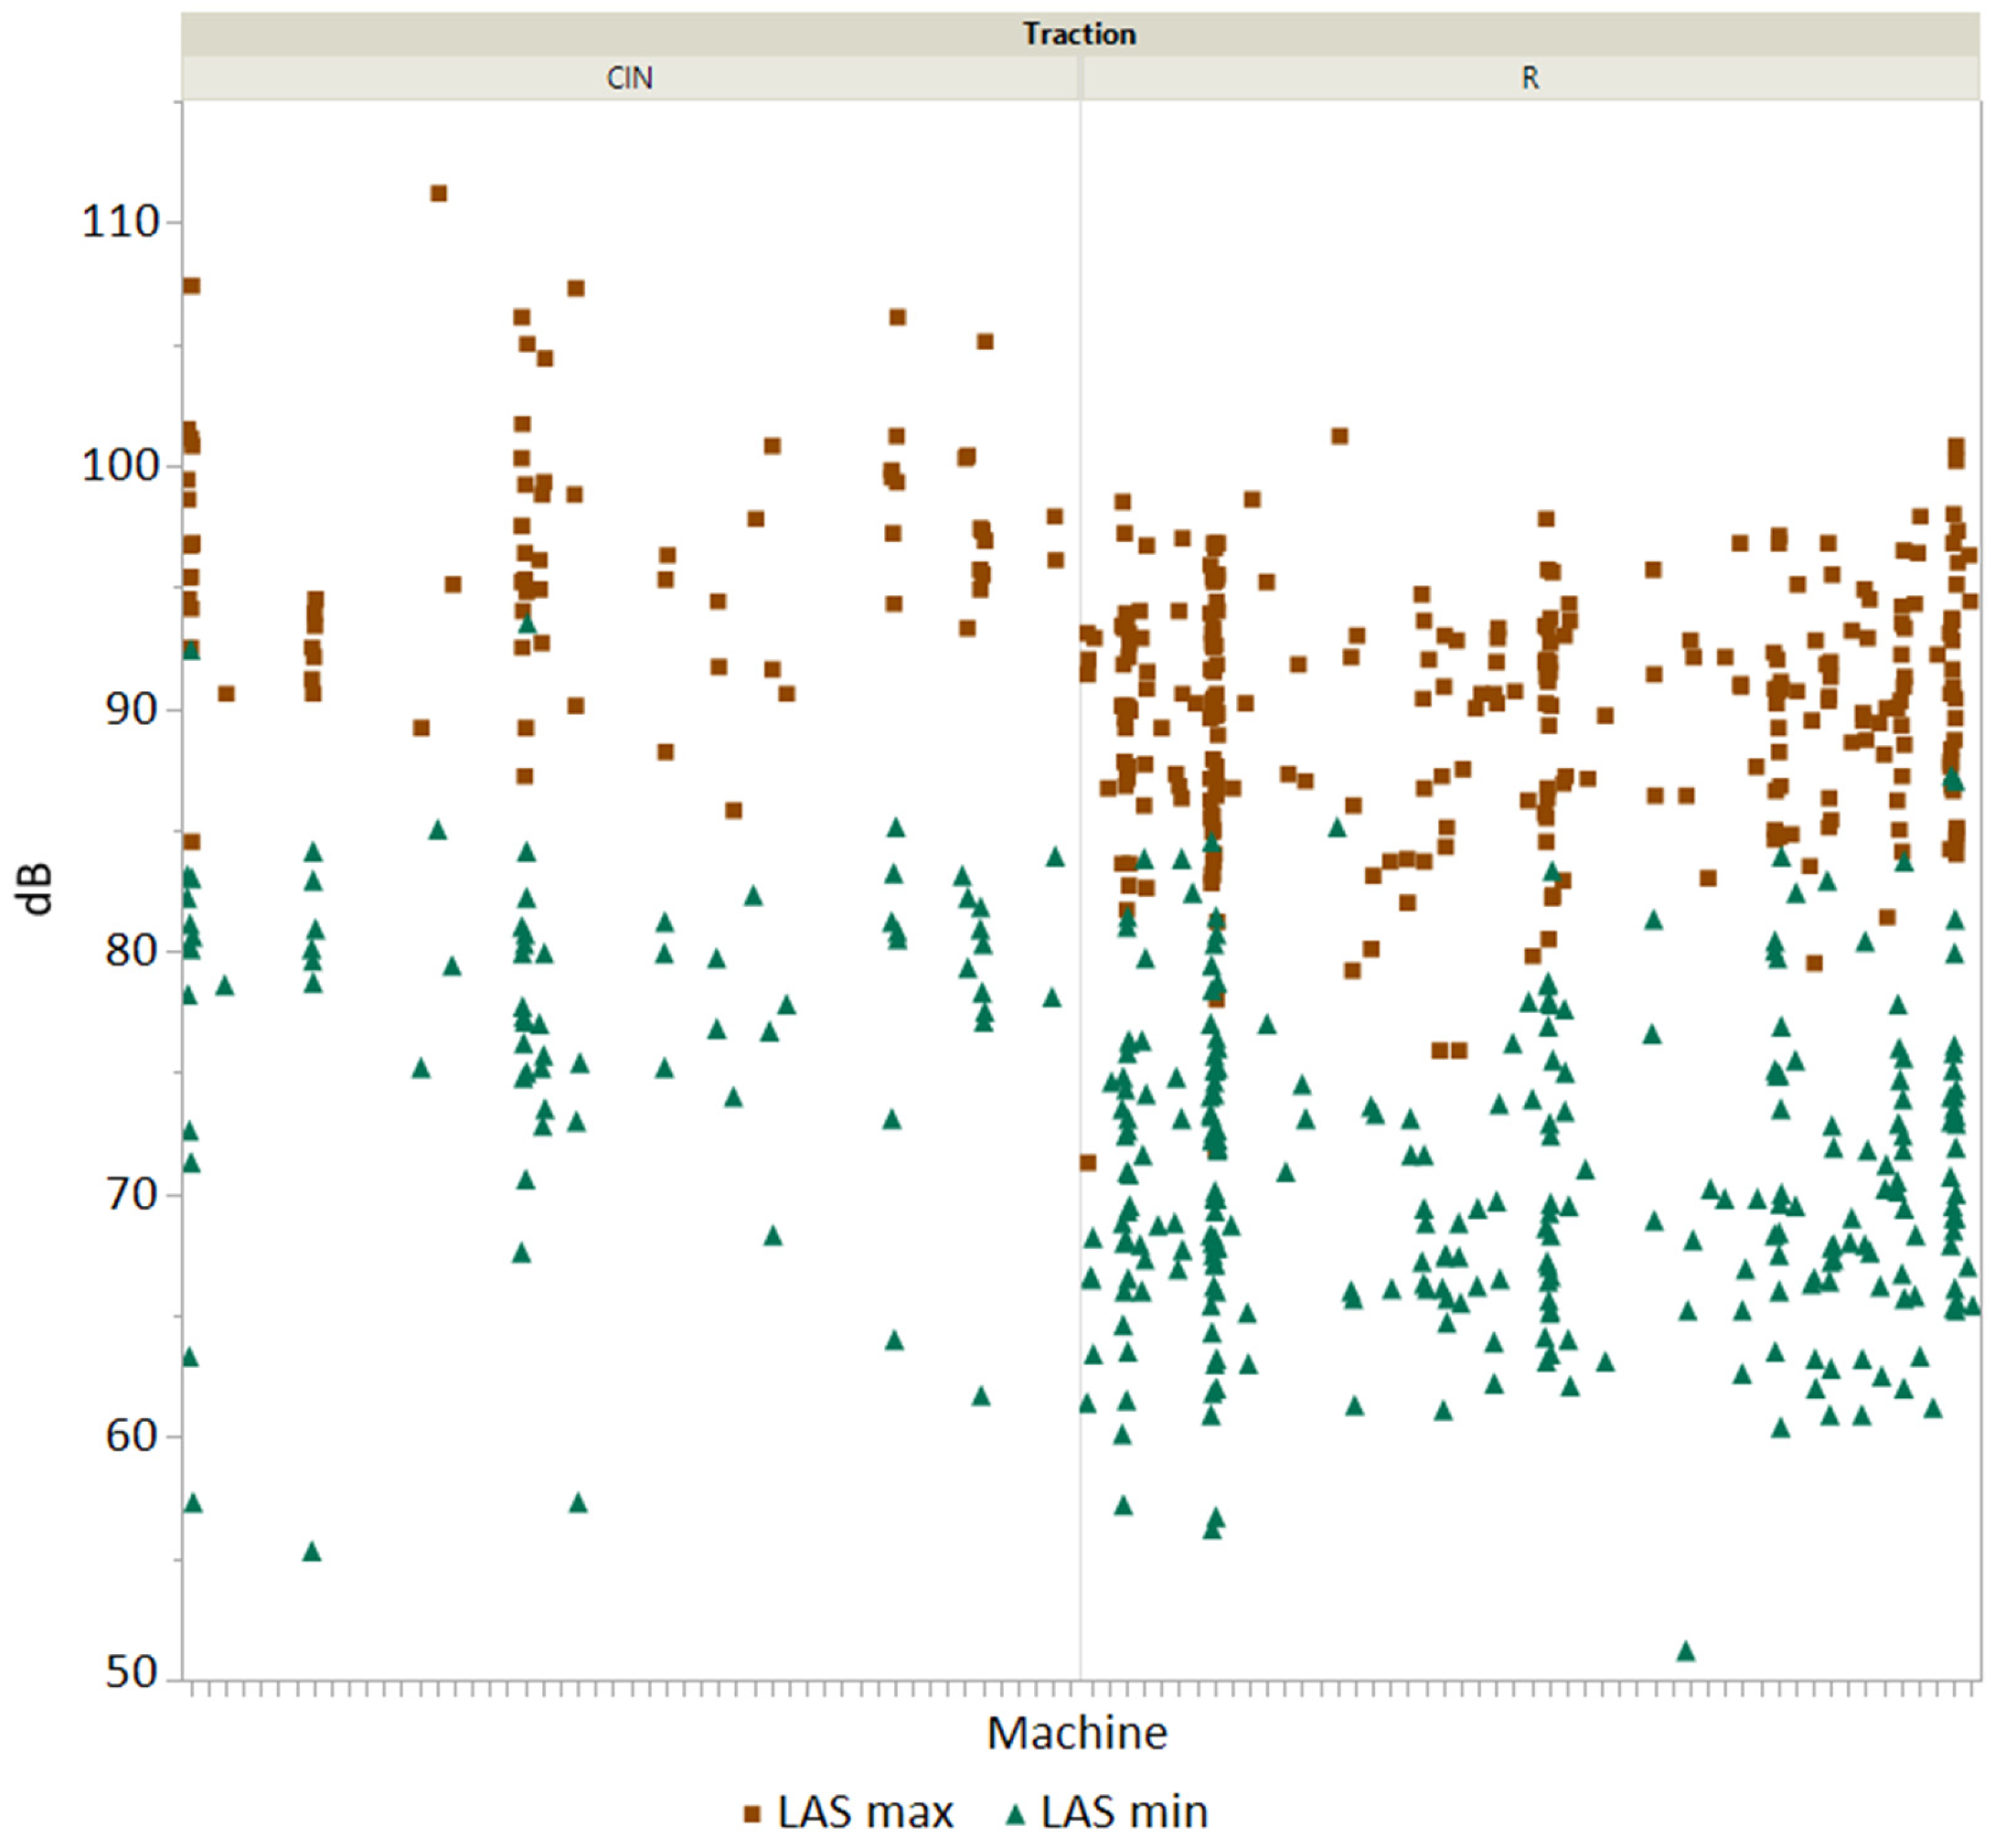
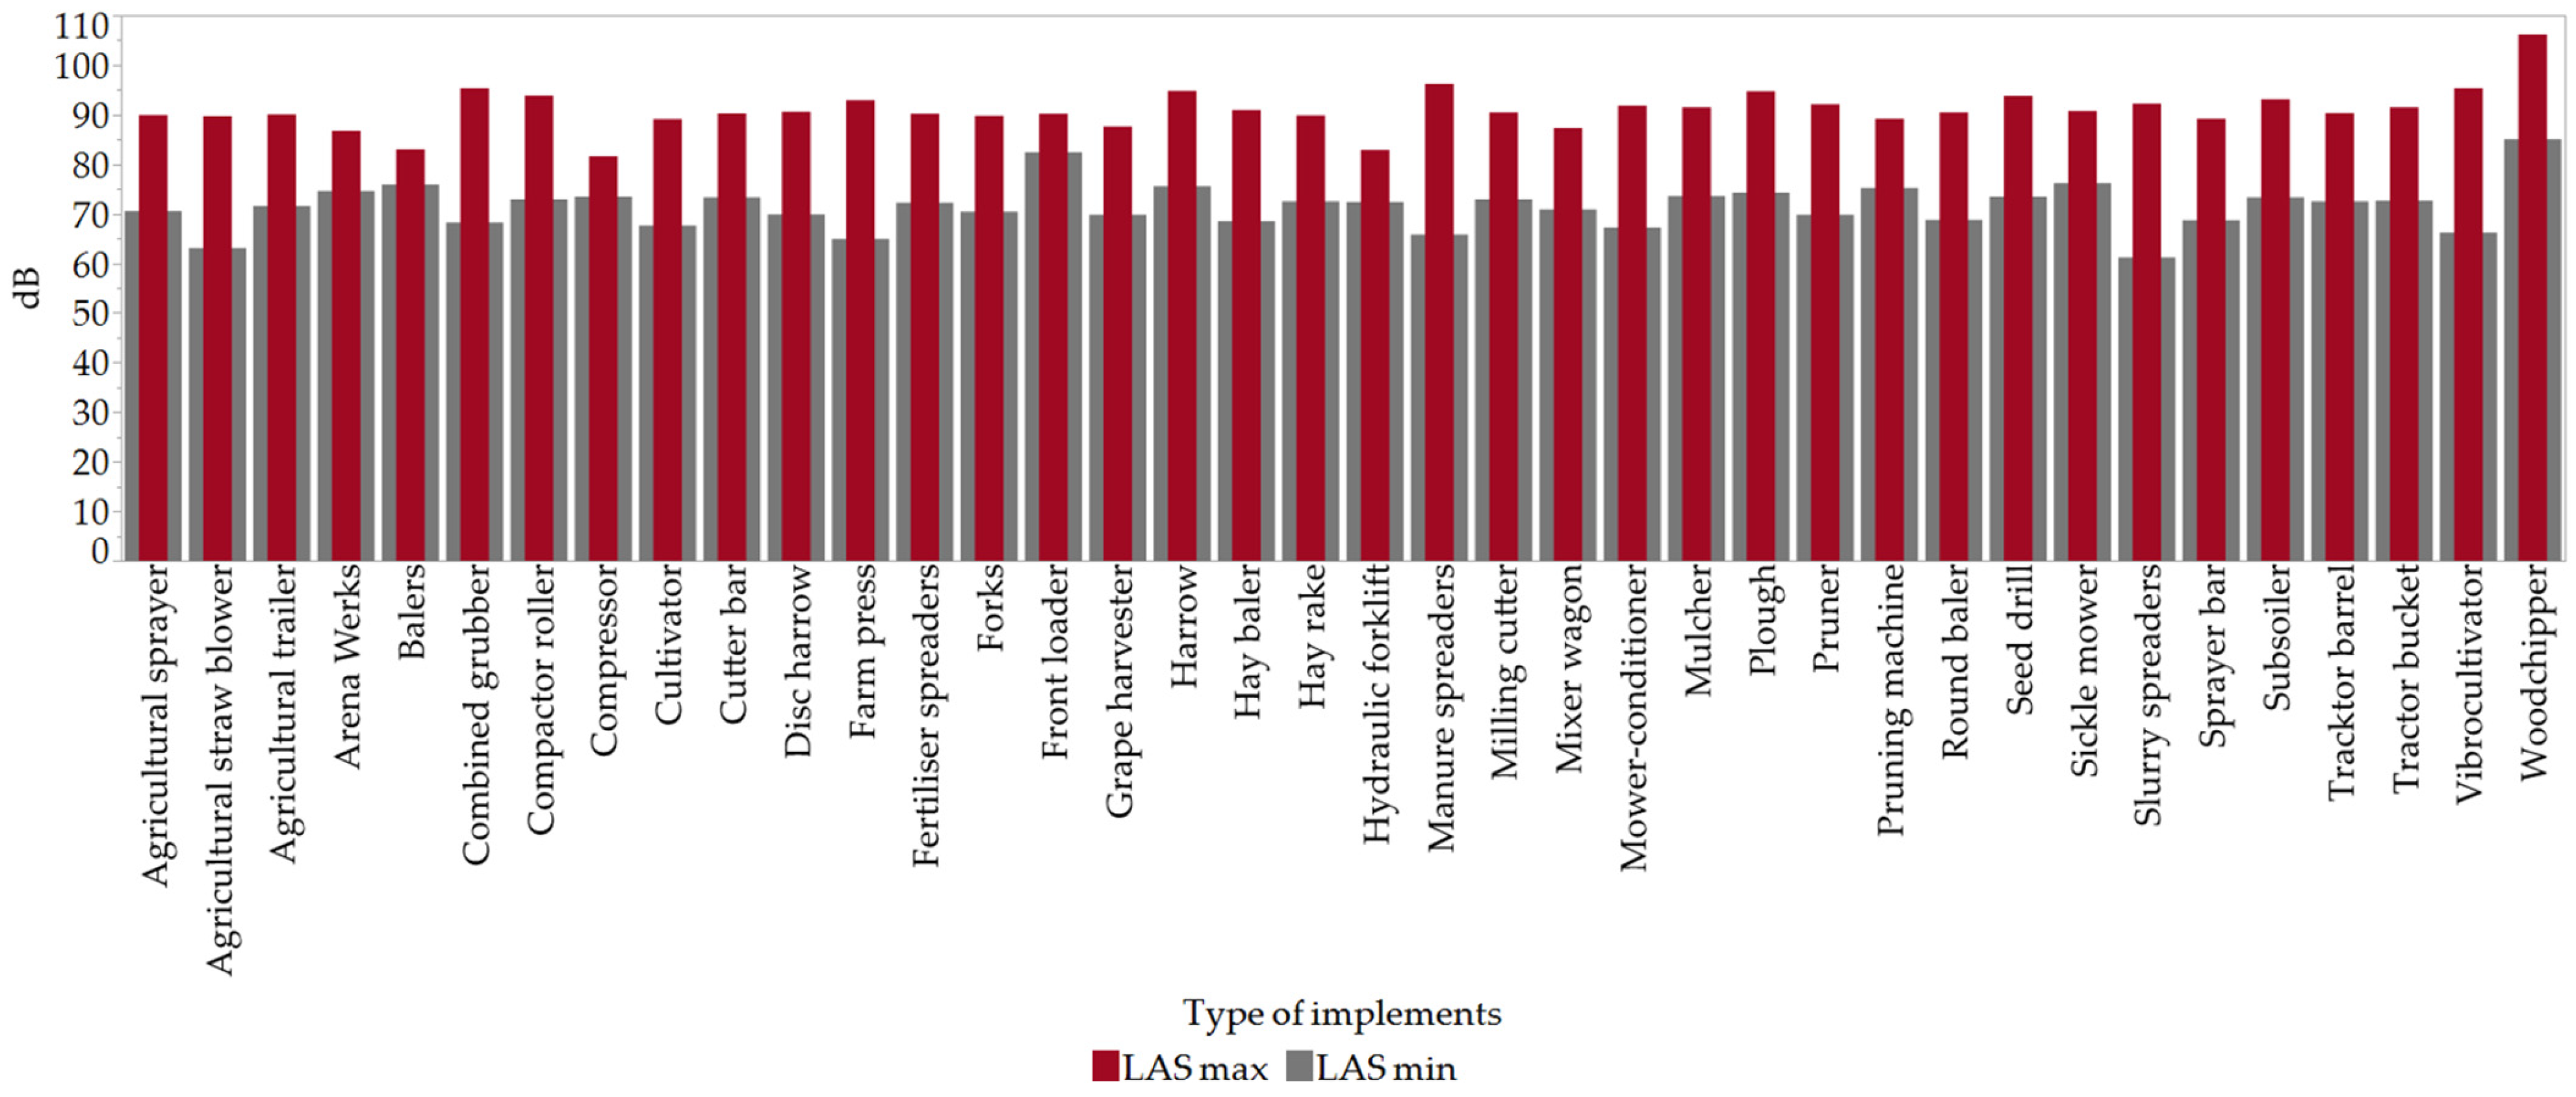
LAS: the maximum value of the maximum sound pressure level;
-
LAS: the minimum value of the minimum sound pressure level.

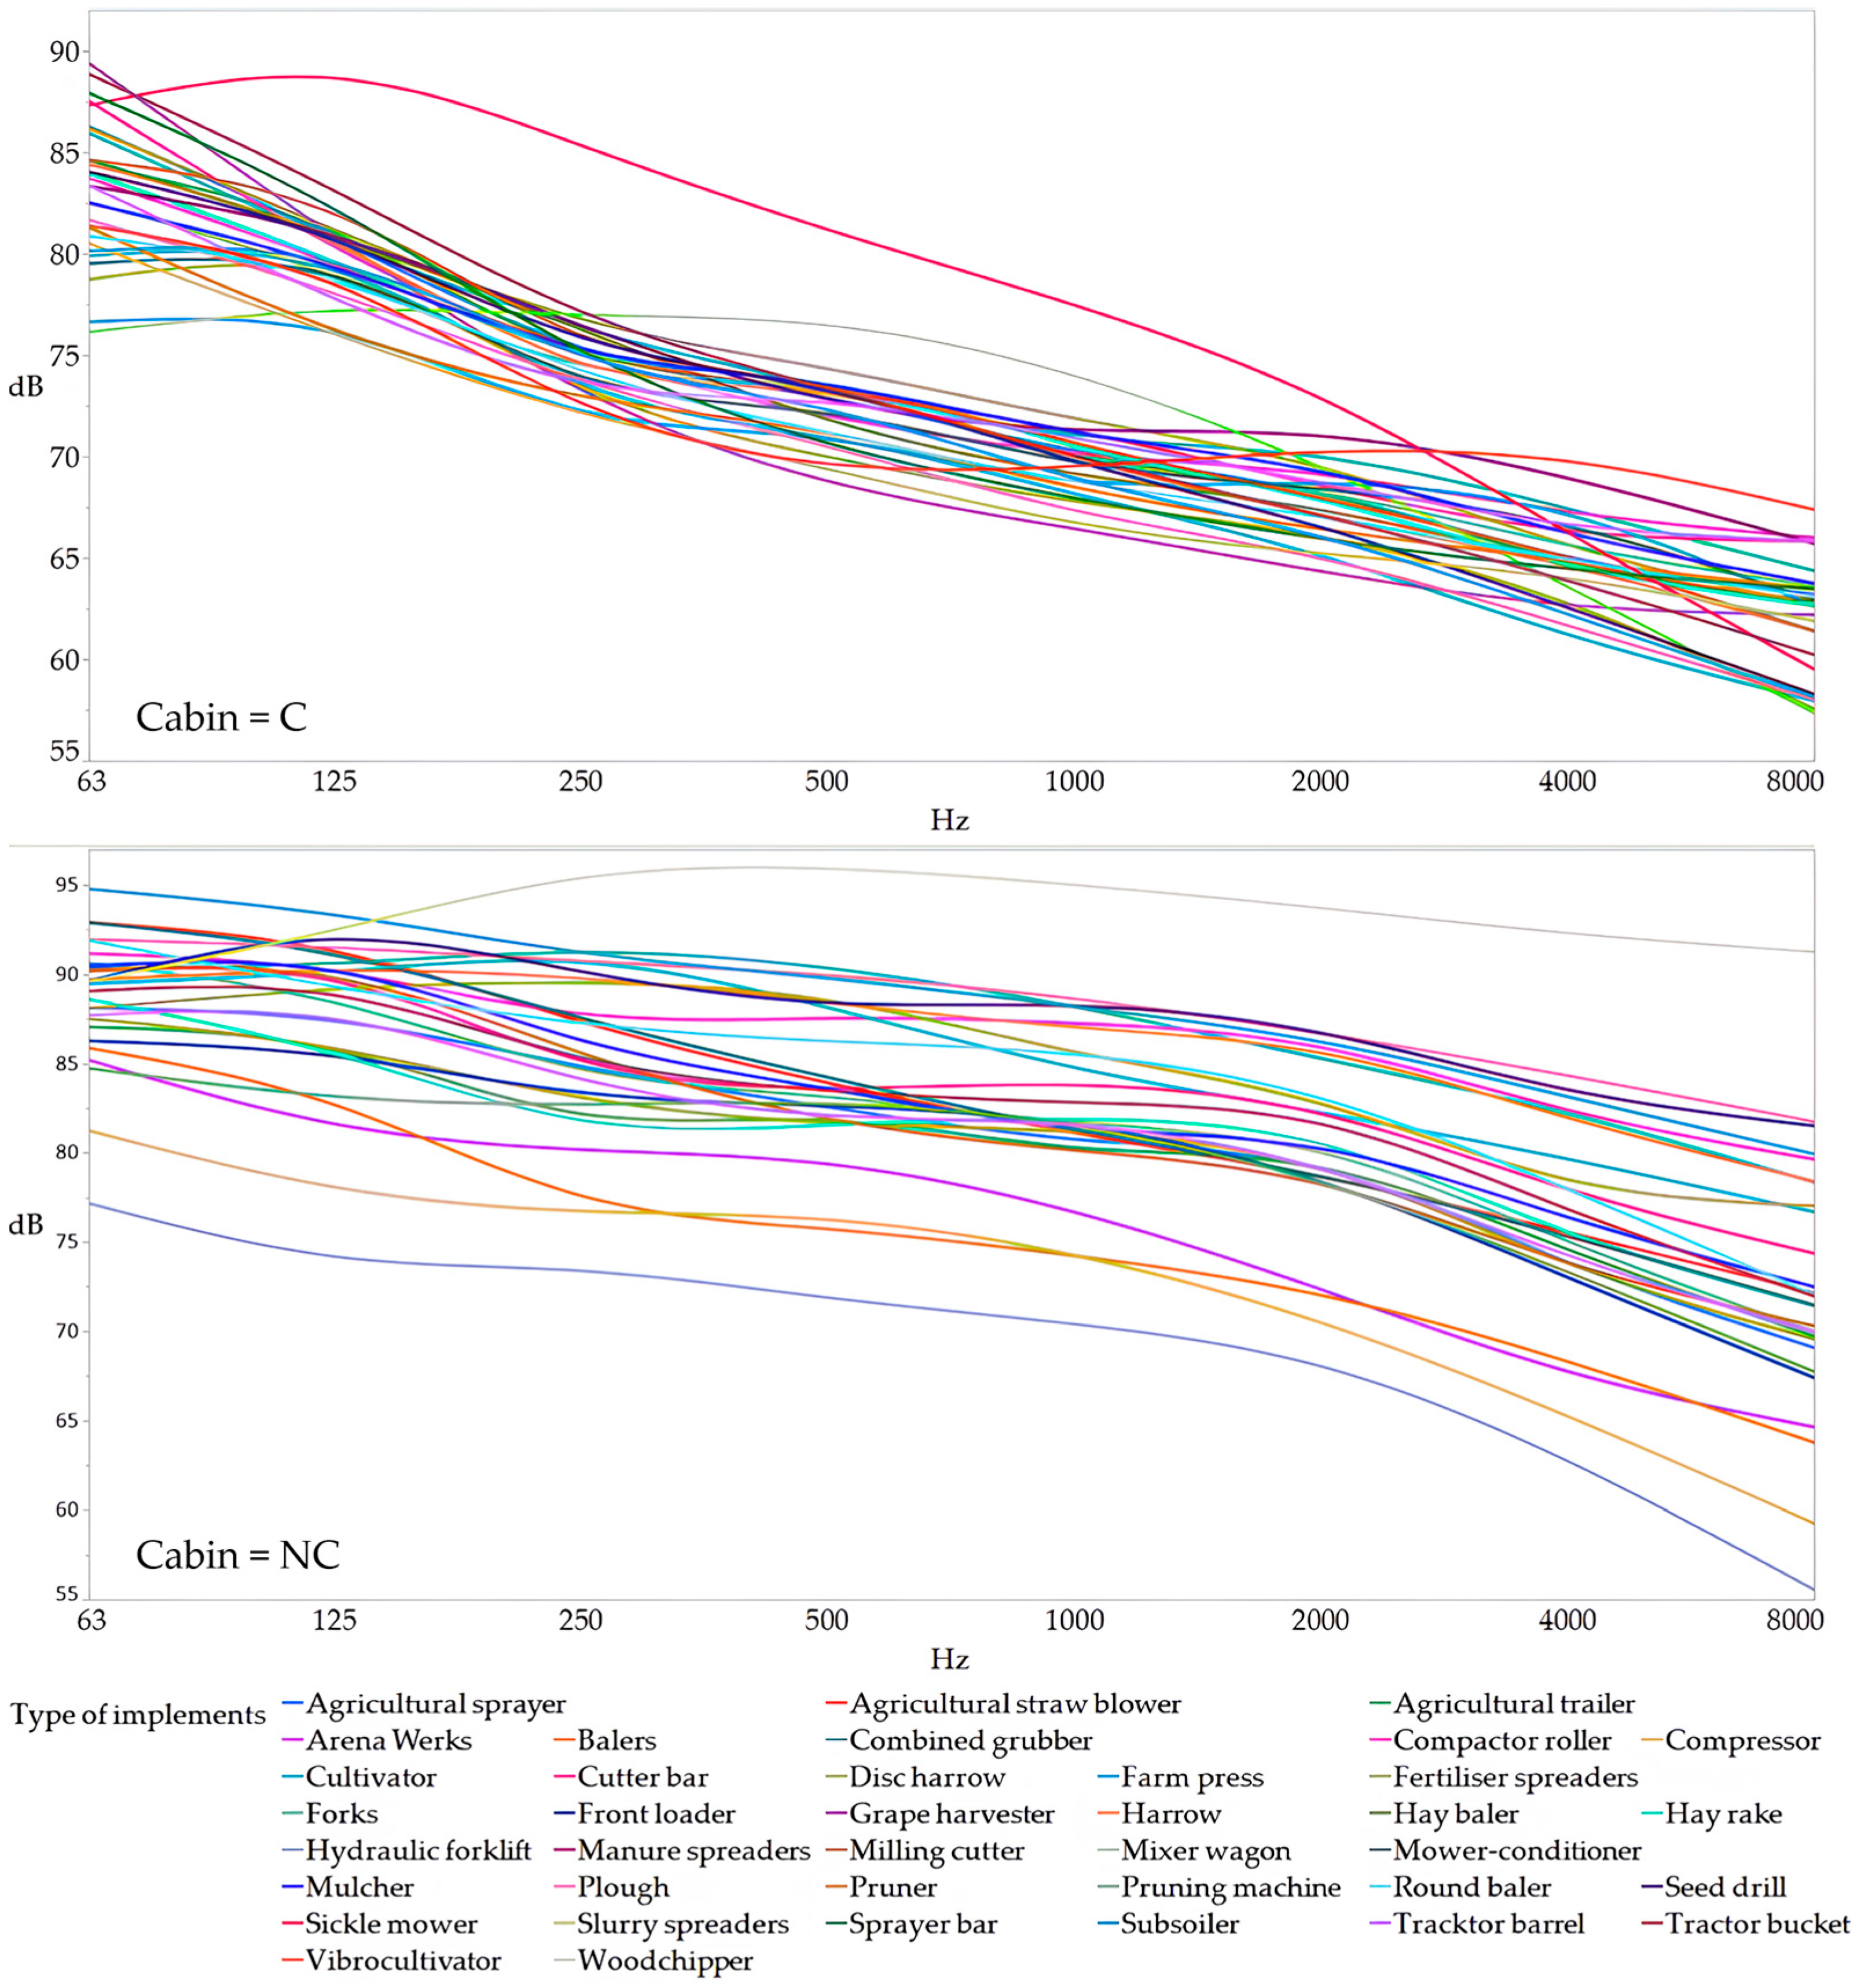
3.2. Tractors with Cabin and Without Cabin

A first analysis of the data was performed by measuring the Lpeak, LAeq.T, LAS max and LAS min values, indicated above, distinguishing the values recorded from tractors equipped with a cabin from those without (Figure 5).
Tests on different tractors generally showed higher peak values for cab tractors than for non-cab tractors. These values were between 97 dB(C) and 139.90 dB(C), a range that, in some cases, included values very close to the maximum noise exposure limit of 140 dB, as established by the legislation (Legislative Decree 81/08, art. 189). The proximity to this limit highlights a significant risk for the operator, since prolonged and repetitive exposure to such high levels can cause irreversible acoustic damage.
For non-cab tractors, the peak values varied from 99 dB(C) to 136.4 dB(C). Although, on average, these tractors showed slightly lower peaks than cab tractors, the values were still high. These were noise peaks that were nevertheless worrying, often exceeding 135 dB(C), a level at which even brief and repeated exposure over time can be harmful.
The equivalent A-weighted sound pressure level (LAeq.T) is another fundamental indicator, which represents the weighted average of the sound intensity during the entire exposure period, considering the sensitivity of the human ear.
The LAeq.T values for cab tractors varied between 67.6 dB(A) and 89.2 dB(A). In several cases, these values were still high and approached and often exceeded the upper action values set by the legislation at 85 dB(A). Prolonged exposure to these levels can not only damage hearing but also contribute to the appearance of extra-auditory phenomena such as stress problems, fatigue, heart disease, sleep disturbances, etc.
In uncabbed tractors, LAeq.T values ranged from 72.6 dB to 102 dB(A). The fact that some uncabbed tractors recorded values above 100 dB(A) is extremely worrying, as this indicates that operators are exposed to noise far above safe limits, with significant risks to their health. The analysis suggests that cab tractors, despite the protection offered by the cab against atmospheric conditions and, to some extent, against vibrations, may paradoxically expose operators to high noise levels. This is probably due to the resonance effect and reflection of sound inside the cab, which amplifies the noise produced by the engine and connected equipment. On the other hand, non-cabbed tractors expose operators to a noisier environment as they do not have a cab, which partially isolates the operator from external noise, showing a less concentrated noise distribution and therefore, on average, higher continuous noise values (LAeq.T) than cab tractors which may pose a greater risk to long-term hearing.
Figure 6 shows the maximum LAS (LAS max) and minimum LAS (LAS min) values for machines with cabins (C_LAS) and without cabins (NC_LAS).
For machines with a cabin, the graph (C_LAS max) shows that the LAS max values ranged from a minimum of 72.8 dB(A) to a maximum of 97.8 dB(A). There were significant peaks, such as 97.8 dB(A) and 95.6 dB(A), which suggests that some machines with a cabin could generate very high noise levels [12]. The LAS min values ranged from 56.7 dB(A) to 80.2 dB(A), with a concentration around 65-70 dB(A). The minimum level of 56.7 dB(A) suggests that, even in the best cases, noise remained significant. Machines without a cabin (NC_LAS) recorded LAS max values that peaked higher than machines with a cabin, with a maximum of 111.2 dB(A) and a minimum of 67.1 dB(A). This highlights the fact that machines without a cabin were generally noisier [13]. The minimum values were also higher than those for machines with a cab, ranging from 51.2 dB(A) to 92.4 dB(A). The higher minimum levels indicated that, on average, machines without a cab had higher base noise levels [13].
The analysis shows that machines without a cab tended to be noisier, with maximum LAS values significantly higher than those with a cab, and that the minimum LAS values for machines without a cab were also generally higher, suggesting that they generated more noise under standard operating conditions. In any case, the general conditions in which the machines operate must also be considered. In fact, the factors that influenced the values of LAS max and LAS min, in addition to the presence of the cab, were represented by the various types of agricultural machines that produced different levels of noise based on their function, their size and complexity and the type of operating machine present. The increase in operating speed and the type of terrain also influenced the production of noise, as did the maintenance status of the machine itself and the presence of worn components. It was also important to take into account the workload (e.g., deep plowing) which caused an increase in noise, especially in LAS max.

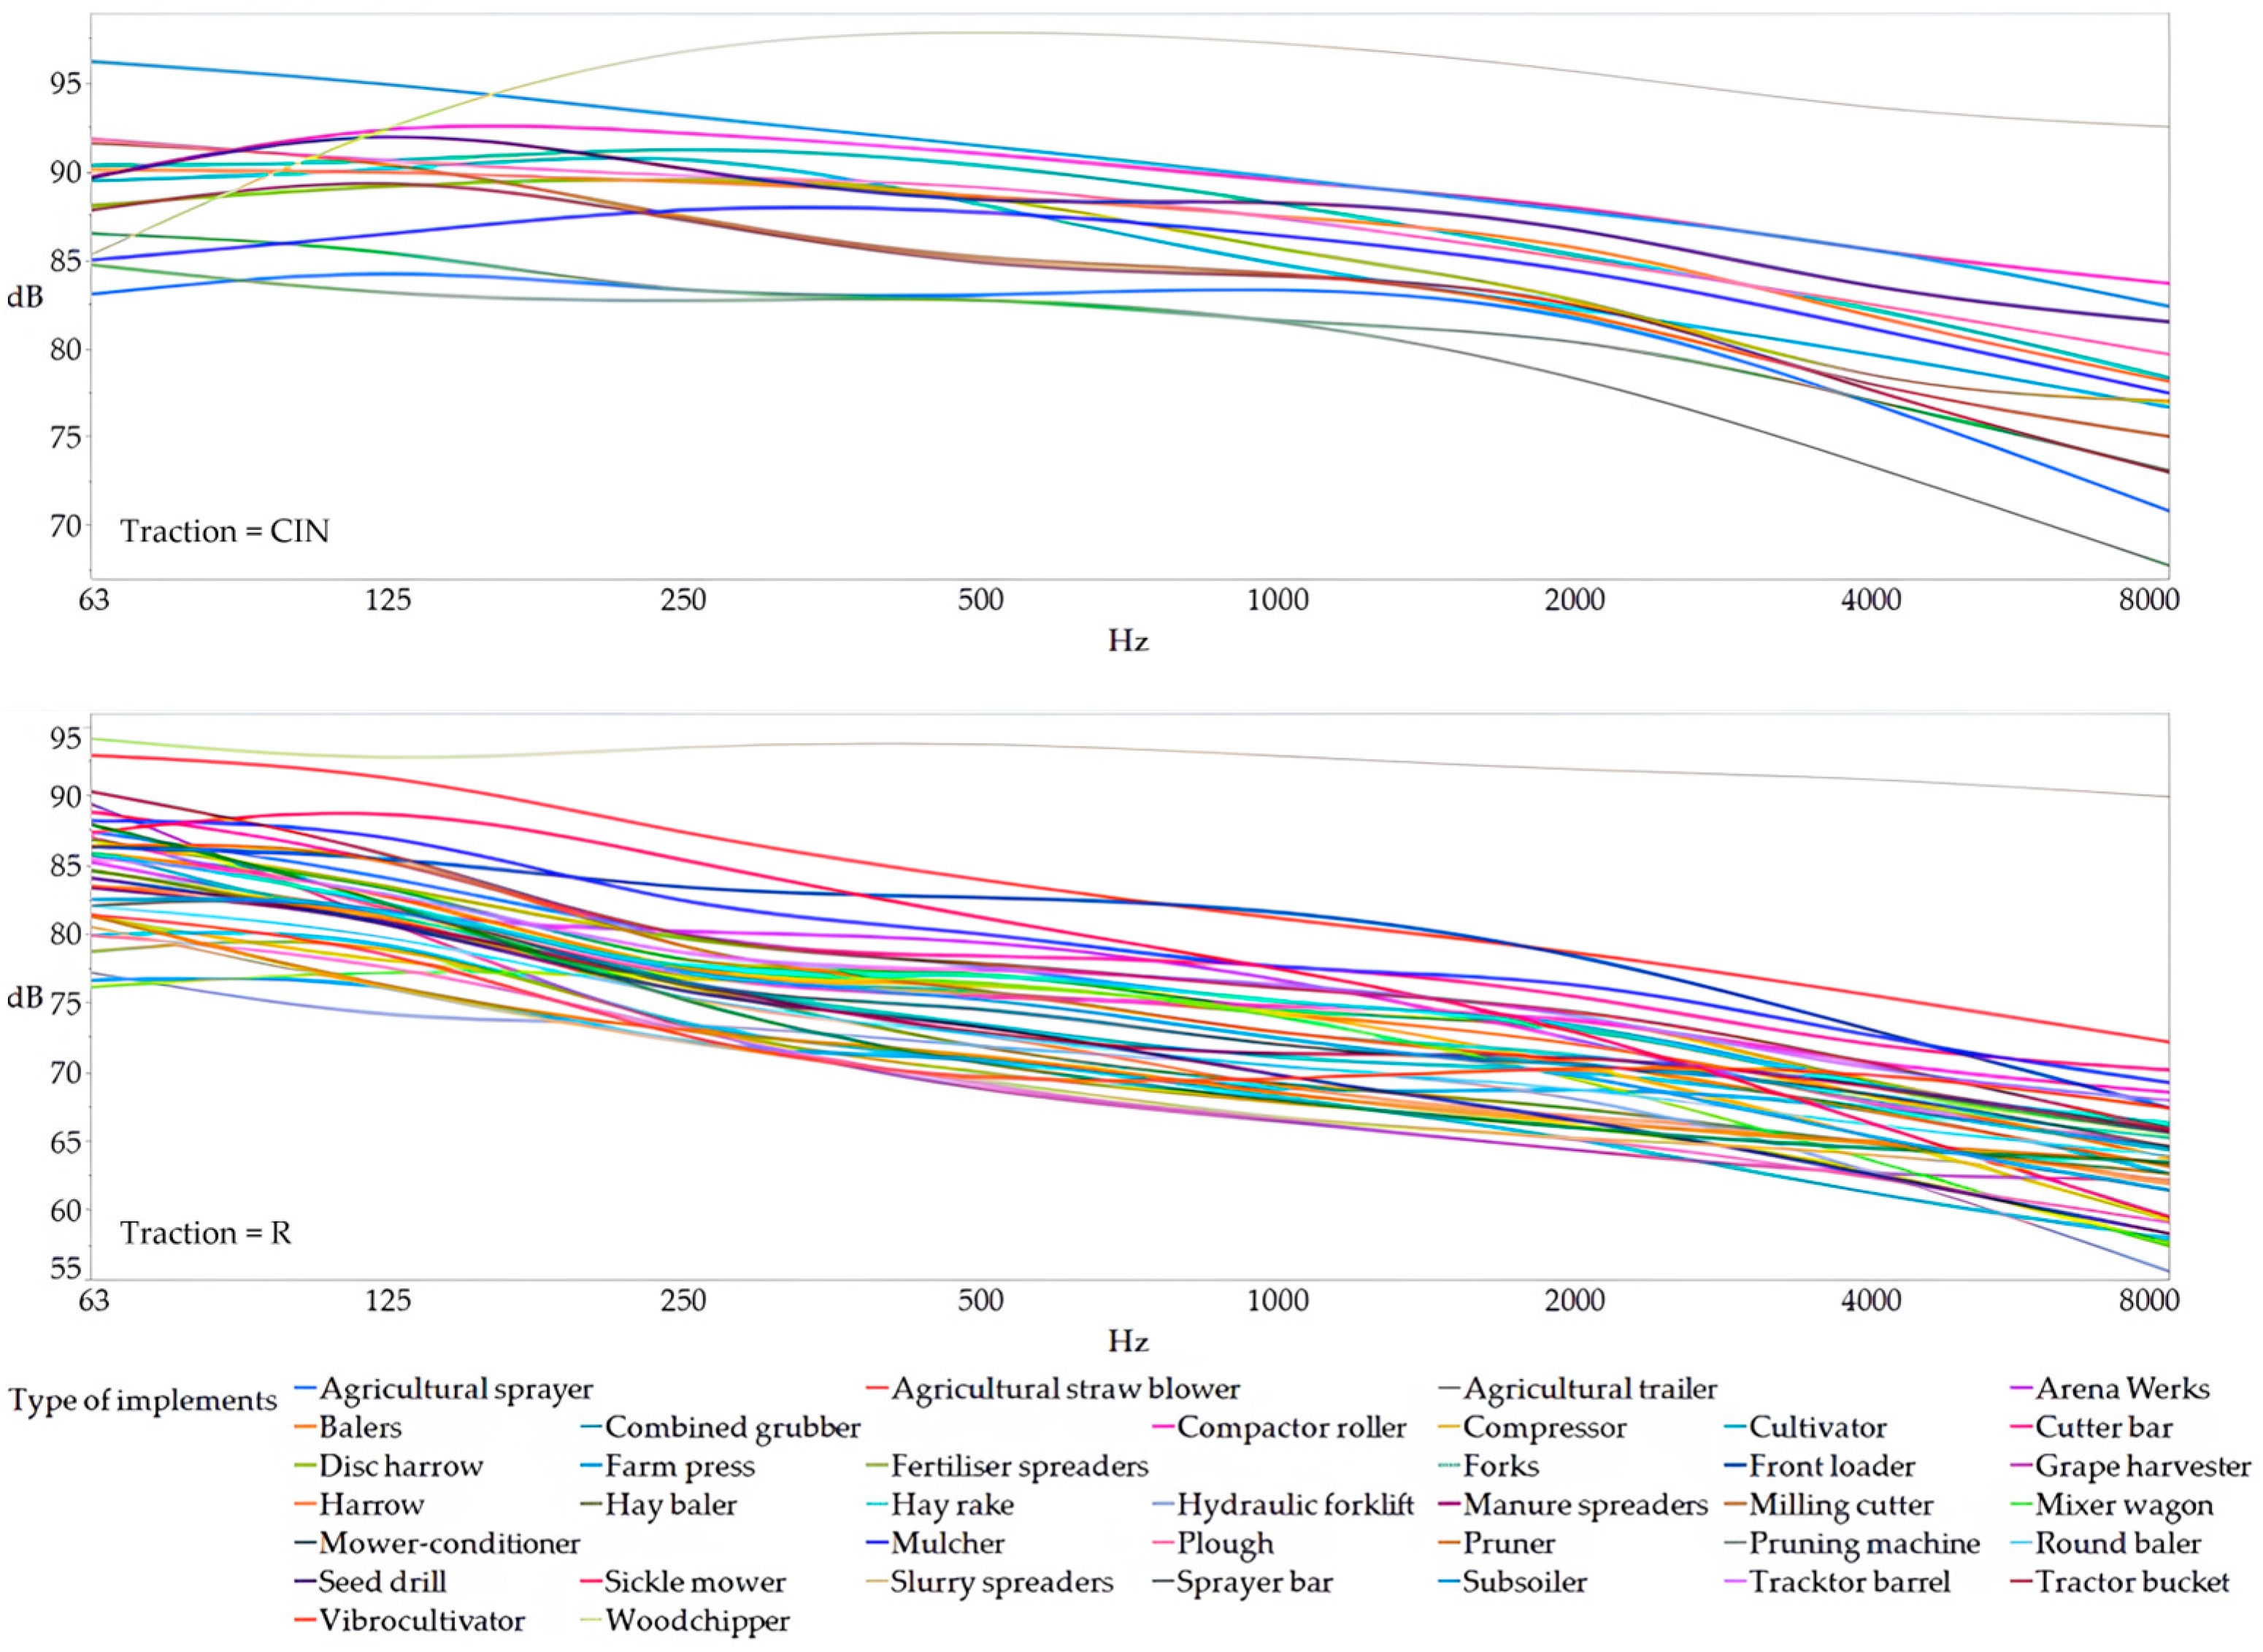
3.3. Noise Level by Traction Type

Figure 7 compares two types of machines, tracked and wheeled machines, considering both the values of the Lpeak parameter, which measures noise peaks, and those of LAeq.T, which highlights the overall exposure to noise in a work environment. The analysis was carried out by comparing the measurements taken from wheeled machines, which, as we saw previously, represented 78% of the sample considered, with those from tracked machines representing 22% of the sample.
In the case of wheeled machines, the Lpeak values varied between 98.1 dB(C) and 139.4 dB(C). These data indicate a significant variability in noise peaks, probably due to the different types of machines present, to variability in operating conditions (higher movement speed) or to variations in contact materials (tires, terrain) and above all to the different operators used. Although tires reduce noise partly due to their flexibility, punctual contact with the ground in some conditions can produce vibrations and high noise peaks [14].
Regarding the analysis of LAeq.T, in wheeled machines, the average noise generated by these machines was generally lower due to the smaller contact surface with the ground and the use of tires that dampened vibrations. The LAeq.T values were between a minimum of 67.6 dB(A) and a maximum of 99 dB(A). In tracked machines, the Lpeak values varied between 103 dB(C) and 136.2 dB(C), therefore with a maximum slightly lower than wheeled machines. This indicates that tracked machines tended to produce noise peaks comparable or slightly lower than wheeled machines. Their noise peak variation range was also narrower than that of wheeled machines, which suggests that, again, tracked machines, designed for difficult terrain, tend to have noise peaks lower than or like those of wheeled machines.
This result could be because tracks distribute weight better and reduce direct impact with the ground [14]. Lpeak values were influenced by the type of terrain since on rougher terrain, tracked machines could record higher Lpeak values due to greater friction and vibrations. Another factor that influenced the trend of this parameter was the speed of movement [14]. In fact, at higher speeds, both tracked and wheeled machines could show an increase in Lpeak, but the impact could be more marked for tracked machines. Other factors that influenced these values could be the jolt of the materials transported or present in tractors or operating machines.
A further element to consider is the weight and maintenance status of the machine itself [15]. In fact, heavier or particularly worn machines tended to generate more noise due to greater friction and weight distributed over a larger contact area, which could be reflected in a higher Lpeak [15].
Both in tracked and wheeled machines, it is necessary to consider the possible presence of technologies aimed at reducing Lpeak, such as acoustic insulation materials, specific tires for noise reduction and improvements in the mechanical design of the tracks to reduce the noise of contact with the ground [16,17].
As regards, instead, the parameter of LAeq.T, the graph shows that the values, due to the continuous and widespread contact of the tracks with the ground, were higher in tracked machines than in wheeled machines, as the vibrations and noise generated by the tracks were constant during operations. Even in situations in which the Lpeak could show high peaks only at certain times, the LAeq.T of a tracked machine could remain high for long periods, indicating higher average exposure to noise than in wheeled machines.
In crawler vehicles, the LAeq.T value ranged from a minimum of 78.3 dB(A) to a maximum of 102 dB(A).
Therefore, the average noise value generated by wheeled machines was generally lower due to the smaller contact surface between the tires and the ground, which reduced the transmission of vibrations [18]. Rubber wheels acted as natural shock absorbers, absorbing part of the vibrations caused by movement, thus reducing the average noise level [19]. However, on hard surfaces, there may have been occasional higher peaks due to the unevenness of the ground or the operating conditions. In the case of tracked machines, however, the analysis performed could be influenced by the limited number of samples.
The LAeq.T parameter values were also greatly influenced by the type of terrain [14,20]. On hard and uneven surfaces, such as rough or rocky terrain, tracked machines generated a greater amount of noise due to the greater contact between the tracks and the roughness of the terrain. Friction, soil deformation and mechanical resistance increased the average noise level [21].
Speed also significantly affected the trend of LAeq.T. In tracked machines, as the speed increased, the noise generated by the tracks amplified, as the continuous and intense interaction with the ground created constant vibrations and a progressive increase was observed with the increase in speed [22]. Wheeled machines also recorded an increase in LAeq.T as the speed increased but to a lesser extent than tracked machines. Tires reduced part of the noise due to rolling, and only at very high speeds was a significant increase in LAeq.T observed.
Technological developments, such as rubber tracks or advanced suspension systems, could help reduce LAeq.T by improving vibration absorption and reducing overall mechanical noise. For wheeled machines, low-pressure tires designed to absorb shock and vibration, or the use of advanced materials, such as special rubbers with noise-damping properties, could further reduce LAeq.T even on harder terrain [16].
In conclusion, wheeled machines tended to have higher Lpeak but lower LAeq.T values, while tracked machines had lower noise peaks but a higher perceived average noise level (Leq(A)). This result reflects the different construction and operating characteristics of the two types of machines: wheels are more suitable for flat terrain and generate less average noise, while tracks are designed for rough terrain which causes higher continuous noise [23]. Higher values for tracked machines suggest that the average noise exposure during use of these machines is higher than for wheeled machines [24]. This can have significant implications for ergonomics and safety, as prolonged exposure to higher noise levels requires the application of technical and organizational measures in addition to protective measures for operators.
The same analysis on tracked and wheeled machines was conducted based on the LAS max and LAS min values (Figure 8).
The analysis clearly shows that tracked tractors had higher maximum LAS values than wheeled tractors, which in some cases exceeded 110 dB. This phenomenon is most likely attributable to the absence of a screen or barrier that adequately isolated the operator from the external environment in tracked tractors.
Similarly, the minimum LAS values were also higher in tracked tractors than in wheeled tractors, less than 90 dB but still high and problematic for the operator’s health. The latter category, in fact, was generally less noisy than tracked models. The causes of this difference are intrinsic to the type of traction adopted, as previously described [25]. Tracks, especially if made of metal, generate higher noise due to the continuous impact with the ground, a factor that is accentuated in the presence of irregular or hard surfaces. Furthermore, the transmission of tracked tractors tends to be noisier than that of wheeled tractors, thus contributing to increasing the general level of noise perceived by the operator [26].
These combined factors create a noisier working environment in crawler tractors, with potential implications for both operator comfort and the need for more stringent noise protection measures. It is therefore crucial to consider these aspects when selecting and using agricultural machinery, especially in operating contexts where acoustic comfort is a key factor for safety and productivity.
To summarize, the results show significant variations in noise exposure levels depending on the configuration of the agricultural machines. The Lpeak values in cab tractors were on average 2.5% higher than in non-cab tractors, with a maximum value of 139.9 dB(C) compared to 136.4 dB(C) recorded in non-cab tractors. The LAeq.T in cab tractors ranged from 67.6 dB(A) to 89.2 dB(A), while in non-cab tractors it varied between 72.6 dB(A) and 102 dB(A), with an average increase of 15% compared to in cab models. The analysis of LAS max differences shows that non-cab tractors had levels about 13.7% higher, with a maximum value of 111.2 dB(A) compared to 97.8 dB(A) in cab tractors. LAS min values also indicated higher average noise exposure for non-cab machines, with an increase of 9.5% compared to in cab-equipped ones.
Regarding the comparison between wheeled and tracked machines, the results indicate that tracked tractors exhibited LAeq.T levels 18% higher than wheeled tractors, with values ranging from 78.3 dB(A) to 102 dB(A), suggesting that the average noise exposure for operators of tracked tractors was significantly higher than for those using wheeled machines.

3.4. Noise Levels by Operating Machine Type

A further analysis of the available data was performed by analyzing the noise exposure of agricultural operators during the use of machines using a very diverse range of equipment in different agricultural operations. The recorded values varied according to the type of operating machine (Figure 9).
High peak values (Lpeak) were sampled for operators such as shredders and disk harrows, used for operations that require greater power and generate high levels of noise due to the efforts of the engine and moving mechanical parts. These values, in some cases, peaked close to 140 dB(C), the maximum limit allowed by the legislation. The continuous use of such machines, especially on difficult terrain, exposes operators to dangerous noise levels.
Sprayers and compressors, which were less noisy than shredders, also showed considerable peak values. Workers who use them are at risk if exposed to noise for long and repeated periods, especially if they do not constantly and correctly use adequate protection. There were also machines such as rollers and compressors that showed high average values of continuous exposure. These, despite having lower noise peaks than other machines, recorded high average noise exposures, with higher LAeq.T values; therefore, we can assume constant noise emission for the entire duration of their use, which exposes the operator to a prolonged risk.
When average exposure values approach or exceed 85 dB(A), as required by current legislation, it is mandatory to adopt adequate protection measures. Prolonged exposure to these levels can cause permanent hearing damage and increase the risk of stress, affecting the concentration and safety of the agricultural operator.
It should also be noted that, while it is true that some machines, such as fertilizer spreaders and forks, showed lower noise peaks, they recorded a high weighted average exposure (LAeq.T) for the entire duration of operations. This is a significant figure for the safety of operators as prolonged exposure, even to moderate-intensity noise, can still cause hearing damage.
The LAS values were also analyzed for female operators. As already mentioned, the LAS value represents the maximum and minimum sound pressure level recorded during the operation of a machine. This value is particularly important as it indicates the noise peaks that can expose the operator to significant acoustic risks. Machinery with high LAS max can generate highly harmful sounds, especially if exposure is prolonged.
The figure relating to the average values of LAS max and LAS min highlights the variations in noise emitted by the different operating machines during their use, providing an overview of the sound conditions in which agricultural operators find themselves working (Figure 10).
Machines with high peaks were represented, for example, by chippers or shredders that tended to record very high LAS max values, often exceeding 100 dB(A). These are high values because the safety threshold for prolonged exposure to noise is set at 85 dB(A) according to current regulations (Legislative Decree 81/08). Above 100 dB(A), the risk of permanent damage to hearing increases significantly and continuous exposure to these levels, without adequate protection, can cause irreversible acoustic trauma.
Then, there were machines characterized by intermittent noise values, such as slurry spreaders. The presence of high peaks alternating with moments of less intense noise suggests that many of these machines operated intermittently, with significant variations in noise generation. This could indicate the need to apply dynamic protection to workers, i.e., a safety measure that adapts to the operating conditions, the movements of the operators and the working context, offering active and flexible protection during the execution of the activities, where periods of rest are alternated with periods of exposure or where hearing protection devices with adequate noise attenuation are used.
The LAS min value, on the other hand, describes the minimum level of sound pressure recorded during the working activity. These values, although less critical from the point of view of acoustic risk, provide important information on noise variations over time. If there are minimal variations, i.e., if the difference between LAS max and LAS min is small, it means that the machine operates with constant noise, creating a working environment with uniform exposure to noise. This type of exposure can be particularly stressful for the operators, as there are no moments of respite. In these cases, it is essential to ensure regular breaks and the continuous use of personal protective equipment.
If, on the other hand, there are high variations, i.e., a large difference between LAS max and LAS min, it means that the noise is produced in a non-constant way, with sudden peaks followed by quieter periods. Although intermittent noise may seem less harmful, sudden sound peaks can still represent a risk.
The fluctuations between LAS max and LAS min allow us to understand the real exposure of operators to noise. Even if a machine has a low LAS min level, frequent peaks of LAS max can still compromise comfort and safety. In fact, high fluctuations can cause auditory overload that increases the probability of hearing damage and stress.
Conversely, a low LAS min could underestimate the real exposure to noise and therefore operators could perceive the environment as less noisy than it actually is, exposing themselves to noise peaks without necessary protection.
Considering these observations, it is essential to adopt preventive measures aimed primarily at training and instructing operators on the correct use of personal protective equipment, especially in environments where noise peaks exceed safety limits. The regular maintenance of agricultural equipment can help reduce noise levels, especially in older and noisier machines. Replacing obsolete machines with more modern and less noisy models, equipped with soundproof cabins, can also significantly reduce noise exposure [27].
With reference to the analysis of the sound pressure level, this was carried out taking into account the operators used during operations and classifying the tractors based on the presence or absence of a cabin and the type of traction. Figure 11 shows the sound pressure levels for the type of operating machine with a cabin (top) and without a cabin (bottom). Figure 12 instead shows the sound pressure levels for the type of traction: tracked (top) and with wheels (bottom).
The effects were evaluated with parametric and non-parametric tests for differences. Figure 12 shows the average sound pressure levels at the mid-octave band frequencies. The upper part shows the sound pressure levels for tractors with cabs and the lower part for tractors without cabs. Machines with cabs seem to show a specific curve in the octave bands, which could indicate a reduction in perceived noise due to the cab itself, which acts as an insulator [28]. However, for both machines with and without cabs, the highest values were recorded in the lower octave bands, 63 Hz and 125 Hz.
At these frequencies, the sound pressure level for tractors without cabs was between approximately 80 and 95 dB(A), depending on the type of operation, while that for tractors with cabs was generally lower, around 75 to 90 dB(A). In both cases, the sound pressure tended to decrease with increasing frequency. Cab tractors generally have a lower sound pressure level, with a greater tendency to decrease with increasing frequency [5]. The cab acts as a sound insulator, reducing the frequencies perceived inside. Random fluctuations also decrease with the cab, resulting in more compact sound pressure levels at various frequencies. Similar results have been found in other studies on farmers’ noise exposure [29]. There are various reasons why cab tractors may amplify low-frequency noise. In particular, the closed volume of the cab may behave as a resonant chamber, selectively amplifying specific low-frequency bands (typically below 250 Hz) based on its size and the construction materials used [30]. Unlike an open environment, where sound waves can disperse freely, inside the cab, noise bounces off rigid surfaces, causing a build-up of sound energy in the low frequencies [5]. Furthermore, the so-called mass-spring-system effect may occur as cab vibration isolation systems are generally optimized to attenuate medium–high frequencies, while low-frequency noise is less effectively damped and may even be amplified due to elastic coupling effects between the cab and the tractor frame. Cabs can absorb noise at high frequencies; however, at lower frequencies below 500 Hz, they are less able to reduce noise as the sounds are caused by the engine and transmission and are radiated through the internal structure of the cab [31]. The octave bands, i.e., the frequency ranges, are expected to show lower values for these machines, especially in the mid-frequency bands (which are more annoying to the human ear) [32]. A possible attenuation of frequencies occurs around 1000–4000 Hz, which is the range in which the cab could be particularly effective, lowering the sound pressure levels.
In machines without a cab, the noise values increase compared to machines with a cab, as the operator is directly exposed to the noise of the engine and the traction system [7]. In fact, in this case, the graph of the octave bands shows a more marked peak in the same frequencies (1000–4000 Hz), in which the noise was generally more perceptible. At the frequency of 4000 Hz, which is very harmful to hearing, cab tractors had sound pressure levels ranging from about 60 dB(A) to 70 dB(A), while tractors without a cab exceeded the lower action value of 80 dB(A) in many operations. Among the different operators used by tractors without a cab, pruning machines and harvesters had the lowest sound pressure levels, below 80 dB at central frequencies above 250 Hz. On the contrary, chippers had the highest sound pressure level, close to 95 dB between 250 and 1000 Hz. Furthermore, this type of operator showed an unusual tendency to maintain high sound pressure values at high frequencies, with a value close to 90 dB at 4000 Hz.
With regard to the type of traction, Figure 12 shows that tracked machines, due to their structure, tended to generate more accentuated noise in the low- and medium-frequency bands. This was due to the continuous contact of the tracks with the ground, which produced intense vibrations and constant background noise. The noise varied between 83 and 97 dB(A) with a range of values that was quite wide, suggesting high and variable noise production based on the operating conditions. The maximum peak of Leq near 96–97 dB(A) indicated a level potentially dangerous for human hearing, especially after prolonged exposure.
The noise was mostly concentrated in the 4000–8000 Hz bands. This is a critical point because the high frequencies are those that are perceived as more “penetrating” by the human ear and could be particularly annoying [33]. The higher frequencies probably came from the friction of the tracks with the ground and from the vibrations produced by the mechanics. The distribution of the noise was also wider, with marked peaks in the high frequencies (4000–8000 Hz) [34]. This translated into a more intermittent and annoying noise, depending on the operating conditions. In machines with wheels, the noise produced tended to concentrate in lower frequency bands (below 4000 Hz). This produced a less penetrating sound, even if the noise at low frequencies could be duller and more continuous. The noise distribution was more balanced and concentrated in the low–medium frequencies, with an acoustic impact that may be less intrusive, but still annoying in the long term [35].
Operators of tracked machines are exposed to higher and more annoying noise, especially at high frequencies, which requires more stringent protection measures [36]. In these cases, hearing protectors with high-frequency reduction capabilities can be particularly useful. In the case of wheeled machines, in the short to medium term, operators work in a relatively quieter environment [37]. However, it must be considered that, since low frequencies are more difficult to block, they can still create discomfort in the long term.
In conclusion, machines with a cabin attenuate noise, especially in the medium and high frequencies, those without a cabin have a higher and more uniform noise profile across the entire octave band spectrum [38]. Tracked machines, on the other hand, tend to produce higher and more concentrated noise in the high frequencies, making exposure more annoying than wheeled machines.
The last figure (Figure 13) shows the peak values of the C-weighted sound pressure, divided according to the presence or absence of the cab and the type of traction (wheeled or tracked). The data were analyzed using the Wilcoxon and Kruskal–Wallis tests, highlighting statistically significant differences for both variables considered (p < 0.0001).
In tractors without a cab, the highest peak values were recorded for the tracked models, with an average of approximately 115 dB(C), compared to the average of 112 dB(C) for the wheeled tractors. However, in none of these cases was the lower action limit of 135 dB(C) exceeded.
In tractors with a cab and wheeled traction, however, the C-weighted peak values were particularly high. In some cases, levels were detected that were above the lower action limit of 135 dB(C) and close to the exposure limit of 140 dB(C). Therefore, it was hypothesized that these high values were due to the closing of the cabin doors. Agricultural tractor cabins are usually equipped with sealing gaskets designed to prevent the entry of airborne contaminants. Furthermore, poor maintenance and the presence of dust, which in turn create resistance in the hinges and handles and locks, can also hinder correct closing and be the cause of high peak values [22]. Consequently, closing the doors requires the application of a significant force, which can generate particularly high sound pressure peaks (Lpeak).
On the contrary, in crawler tractors equipped with a cabin, the peak values recorded were like those observed in tractors without a cabin. This result could depend on the fact that, in this case, the measurements were started after the cabin was closed. It should also be noted that the use of crawler tractors with a cabin in Italy is limited, resulting in poor data availability.
As a result, unexpected events related to noise exposure risk, such as doors closing, may not have been detected.

4. Conclusions

Legislative Decree 81/08 establishes that higher noise-exposure values require the adoption of prevention and protection measures. Specifically, exceeding the threshold of 85 dB(A) requires the mandatory use of hearing protection, while above 140 dB(C), the machinery must be adequately maintained or replaced to avoid irreversible damage to the hearing of operators. This study aimed to analyze the conditions of workers in the agricultural and forestry sector in relation to the risk deriving from exposure to noise, with the aim of providing scientific evidence to support policy and legislative decision makers. By highlighting the serious problem of noise during the use of agricultural vehicles, it aims to promote the implementation of targeted strategies that, on the one hand, incentivize the renewal of machinery fleets through specific financial interventions and, on the other, promote the greater education and training of workers, including the distribution and appropriate use of personal protective equipment (PPE).
In fact, much of the machinery analyzed, as reported in this work, is obsolete, and in addition, approximately 75% of agricultural tractors in Italy are over 25 years old [39]. These machines not only generate more noise but are also less safe. The use of new-generation tractors and machines, with better soundproofed cabins and vibration reduction systems, could significantly lower exposure values. Many modern tractors are equipped with soundproofed cabins, but the operating machines connected to them can still generate high noise, as indicated by the sound pressure peaks recorded. In fact, while it is true that cabins help reduce the noise perceived by the operator and therefore their exposure, it is also true, as emerges from the high values recorded, that it is not always sufficient to guarantee adequate protection as the internal resonance can amplify sounds, especially low-frequency sounds.
For machines that exceed the exposure limits, it is essential to adopt preventive measures, such as improving sound insulation, carrying out appropriate periodic maintenance, replacing obsolete machinery, using hearing protection devices, and reducing exposure times through more frequent work shifts and breaks. It is noted that in machines without a cabin, noise values increase compared to in those equipped with one, as the operator is directly exposed to the noise of the engine and the traction system. Among the various operations performed by tractors without a cabin, pruning machines and harvesters have the lowest sound pressure levels, while other machines, such as chippers, have the highest sound pressure levels.
This analysis provides a clear picture of the most dangerous machines in terms of noise exposure, offering a useful tool for farmers, employers and safety managers in planning corrective measures. As regards the type of traction, the analysis reported in the previous paragraphs shows that tracked machines, due to their structure, tend to generate more accentuated noise in the low- and medium-frequency bands.
The data collected highlight how, despite the adoption of protective measures such as soundproof cabins and personal protective equipment, noise exposure remains a serious problem in agriculture. Operator training, updating machine fleets and improving prevention and protection techniques such as the use of personal protective equipment (PPE) as well as the periodic maintenance of machines are essential elements to reduce risks to the health of operators and improve working conditions.
The results confirm that agricultural workers’ noise exposure frequently exceeds the safety limits established by Legislative Decree 81/08. Lpeak values in cab tractors are on average 2.5% higher than in non-cab models, with a maximum of 139.9 dB(C) compared to 136.4 dB(C). LAeq.T in cab tractors ranges from 67.6 dB(A) to 89.2 dB(A), while in non-cab tractors it varies between 72.6 dB(A) and 102 dB(A), showing an average increase of 15%. The analysis of LAS max values indicates higher exposure in non-cab tractors (+13.7%), with a maximum of 111.2 dB(A) compared to 97.8 dB(A) in cab models. LAS min values are also 9.5% higher on average in non-cab tractors. Regarding traction type, tracked tractors show LAeq.T values 18% higher than wheeled tractors, ranging from 78.3 dB(A) to 102 dB(A), indicating higher continuous exposure.
The purchase of new agricultural machinery represents a significant investment for companies in the sector, especially for small- and medium-sized Italian agricultural companies. The cost of a modern tractor with a cab is around EUR 1000 per horsepower, a significant economic burden that entrepreneurs often struggle to sustain without government contributions or bank financing. Furthermore, the economic support measures provided by the various EU Member States rarely cover 100% of the investment, generally being limited to a small percentage. However, a cost–benefit analysis highlights how an initial investment in more modern machinery, combined with an adequate supply of personal protective equipment (PPE), can generate a positive impact in the long term. The adoption of more advanced technologies would in fact significantly reduce noise exposure, mitigating the risk of hearing damage for agricultural and forestry workers [40]. As a result, there would be a reduction in company costs related to accidents at work, both in terms of insurance premiums and loss of productivity due to worker absence. In this perspective, targeted incentive policies, also aimed at the mandatory training of workers, would not only contribute to improving workers’ health and safety but would also have a positive effect on the competitiveness and economic sustainability of agricultural enterprises.

Author Contributions

Conceptualization, S.R. and M.C.; methodology, S.R., M.C. and L.B.; software, L.B. and G.D.D.; validation, L.B., S.R. and M.C.; formal analysis, V.D.S. and S.R.; investigation, V.D.S.; resources, V.D.S.; data curation, L.B., S.R., G.D.D. and V.D.S.; writing—original draft preparation, V.D.S.; writing—review and editing, L.B., S.R. and M.C.; visualization, M.C. and L.B.; supervision, M.C. All authors have read and agreed to the published version of the manuscript.

Funding

This research received no external funding.

Institutional Review Board Statement

Not applicable.

Data Availability Statement

Data will be made available upon request.

Acknowledgments

This research was carried out under the General Agreement between the Council for Agricultural Research and Economics and University of Tuscia.

Conflicts of Interest

The authors declare no conflicts of interest.

References

  1. Bulat, P.; Somaruga, C.; Colosio, C. Occupational Health and Safety in Agriculture: Situation and Priorities at the Beginning of the Third Millennium. Med. Lav. 2006, 97, 420–429. [Google Scholar] [PubMed]
  2. Jakob, M.C.; Santa, D.; Holte, K.A.; Sikkeland, I.J.; Hilt, B.; Lundqvist, P. Occupational Health and Safety in Agriculture—A Brief Report on Organization, Legislation and Support in Selected European Countries. Ann. Agric. Environ. Med. 2021, 28, 452–457. [Google Scholar] [CrossRef] [PubMed]
  3. Bianchini, L.; Picchio, R.; Colantoni, A.; Scotolati, M.; Di Stefano, V.; Cecchini, M. Tensile Strength of Ropes and Friction Hitch Used in Tree Climbing Work. Forests 2021, 12, 1457. [Google Scholar] [CrossRef]
  4. Di Stefano, V.; Colantoni, A.; Di Domenico, G.; Cecchini, M.; Monarca, D. Lights and Shadows of Agricultural Workplace Safety Legislation in the Main EU Member States. In International Conference on Safety, Health and Welfare in Agriculture and Agro-Food Systems; Springer Nature: Cham, Switzerland, 2024; pp. 85–97. [Google Scholar]
  5. Hwang, S.J.; Nam, J.S. Effects of Noise and Vibration Changes from Agricultural Machinery on Brain Stress Using EEG Measurement. AgriEngineering 2024, 6, 4248–4266. [Google Scholar] [CrossRef]
  6. INAIL Open Data; INAIL: Rome, Italy, 2024; Available online: https://dati.inail.it/portale/it.html (accessed on 15 January 2025).
  7. Barač, Ž.; Plaščak, I.; Jurišić, M.; Tadić, V.; Zimmer, D.; Duvnjak, V. Noise in the Cabin of Agricultural Tractors. Teh. Vjesn. 2018, 25, 1611–1615. [Google Scholar] [CrossRef]
  8. Pessina, D.; Guerretti, M. Effectiveness of Hearing Protection Devices in the Hazard Reduction of Noise from Used Tractors. J. Agric. Eng. Res. 2000, 75, 73–80. [Google Scholar] [CrossRef]
  9. Han, H.W.; Im, W.H.; Choi, H.J.; Cho, S.J.; Lee, S.D.; Park, Y.J. Effect of Sound Insulation on Noise Reduction in an Agricultural Tractor Cab. Sci. Rep. 2022, 12, 22038. [Google Scholar] [CrossRef]
  10. Prendergast, G.; Guest, H.; Munro, K.J.; Kluk, K.; Léger, A.; Hall, D.A.; Heinz, M.G.; Plack, C.J. Effects of Noise Exposure on Young Adults with Normal Audiograms I: Electrophysiology. Hear. Res. 2017, 344, 68–81. [Google Scholar] [CrossRef]
  11. UNI EN ISO 9612:2011; Acoustics—Determination of Occupational Noise Exposure—Engineering Method. Ente Nazionale Italiano di Unificazione (UNI): Milan, Italy, 2011. Available online: https://store.uni.com/en/uni-en-iso-9612-2011 (accessed on 10 January 2025).
  12. Barač, Ž.; Radočaj, D.; Plaščak, I.; Jurišić, M.; Marković, M. Prediction of Noise Levels According to Some Exploitation Parameters of an Agricultural Tractor: A Machine Learning Approach. AgriEngineering 2024, 6, 995–1007. [Google Scholar] [CrossRef]
  13. Chavan, A.; Somasundaram, K.; Gunasekaran, P.; Chaudhari, V.V.; Sati, N. Investigating the Factors Affecting Cabin Comfort for Agricultural Machinery. In Symposium on International Automotive Technology; SAE Technical Papers; SAE: Vancouver, BC, Canada, 2024. [Google Scholar]
  14. Bianchini, L.; Alemanno, R.; Di Stefano, V.; Cecchini, M.; Colantoni, A. Soil Compaction in Harvesting Operations of Phalaris arundinacea L. Land 2022, 11, 1031. [Google Scholar] [CrossRef]
  15. Fornaciari, L.; Del Duca, L.; Pochi, D.; Grilli, R.; Biocca, M.; Bassotti, B.; Moschetto, A.; Benigni, S.; Fanigliulo, R. Investigation on the Applicability of an Active Noise Control System in the Tractor Cabin under Controlled Workload Condition. In International Conference on Safety, Health and Welfare in Agriculture and Agro-Food Systems; Springer Nature: Cham, Switzerland, 2024; pp. 38–48. [Google Scholar]
  16. Aiello, G.; Catania, P.; Vallone, M.; Venticinque, M. Worker Safety in Agriculture 4.0: A New Approach for Mapping Operator’s Vibration Risk through Machine Learning Activity Recognition. Comput. Electron. Agric. 2022, 193, 106637. [Google Scholar] [CrossRef]
  17. Fenske, R.A. New Technologies and Worker Safety in Western Agriculture. J. Agromed. 2009, 14, 417–420. [Google Scholar] [CrossRef] [PubMed]
  18. Mileusnić, Z.I.; Saljnikov, E.; Radojević, R.L.; Petrović, D.V. Soil Compaction Due to Agricultural Machinery Impact. J. Terramech. 2022, 100, 51–60. [Google Scholar] [CrossRef]
  19. Shahgholi, G.; Abuali, M. Measuring Soil Compaction and Soil Behavior under the Tractor Tire Using Strain Transducer. J. Terramech. 2015, 59, 19–25. [Google Scholar] [CrossRef]
  20. Cecchini, M.; Piccioni, F.; Ferri, S.; Coltrinari, G.; Bianchini, L.; Colantoni, A. Preliminary Investigation on Systems for the Preventive Diagnosis of Faults on Agricultural Operating Machines. Sensors 2021, 21, 1547. [Google Scholar] [CrossRef]
  21. Kukharets, S.; Zabrodskyi, A.; Sheludchenko, B.; Jasinskas, A.; Domeika, R.; Šarauskis, E. Assessment of Changes in Soil Contact Stress Depending on Tractor Tire Parameters. Sci. Rep. 2025, 15, 172. [Google Scholar] [CrossRef]
  22. Vallone, M.; Bono, F.; Quendler, E.; Febo, P.; Catania, P. Risk Exposure to Vibration and Noise in the Use of Agricultural Track-Laying Tractors. Ann. Agric. Environ. Med. 2016, 23, 591–597. [Google Scholar] [CrossRef]
  23. ten Damme, L.; Calleja-Huerta, A.; Juhl Munkholm, L.; Schjønning, P.; Keller, T.; Lamandé, M. Traction Modifies the Contact Area and the Vertical and Horizontal Stress Distributions beneath the Tyre. Soil Tillage Res. 2024, 244, 106214. [Google Scholar] [CrossRef]
  24. Lanças, K.P.; Marques Filho, A.C.; Santana, L.S.; Ferraz, G.A.E.S.; Faria, R.O.; Martins, M.B. Agricultural Tractor Test: A Bibliometric Review. AgriEngineering 2024, 6, 2229–2248. [Google Scholar] [CrossRef]
  25. Lie, A.; Skogstad, M.; Johannessen, H.A.; Tynes, T.; Mehlum, I.S.; Nordby, K.C.; Engdahl, B.; Tambs, K. Occupational Noise Exposure and Hearing: A Systematic Review. Int. Arch. Occup. Environ. Health 2016, 89, 351–372. [Google Scholar] [CrossRef]
  26. Suvorov, G.; Denisov, E.; Antipin, V.; Kharitonov, V.; Starck, J.; Pyykkö, I.; Toppila, E. Effects of Peak Levels and Number of Impulses to Hearing among Forge Hammering Workers. Appl. Occup. Environ. Hyg. 2001, 16, 816–822. [Google Scholar] [CrossRef] [PubMed]
  27. Durczak, K.; Rybacki, P. Noise Emission in the Cabs of Modern Farm Tractors. Teh. Vjesn. 2023, 30, 669–675. [Google Scholar] [CrossRef]
  28. Karamousantas, D.C.; Kanakis, A.G.; Dalamagas, B.C. Noise Levels Produced by Farming Processes. In Proceedings of the 16th International Congress on Sound and Vibration 2009, ICSV 2009, Krakow, Poland, 5–9 July 2009; Volume 2, pp. 920–927. [Google Scholar]
  29. Aybek, A.; Kamer, H.A.; Arslan, S. Personal Noise Exposures of Operators of Agricultural Tractors. Appl. Ergon. 2010, 41, 274–281. [Google Scholar] [CrossRef]
  30. Barač, Ž.; Plaščak, I.; Radočaj, D.; Jurišić, M. The Impact of Noise on Agricultural Tractor Operator in Relation to Certain Operational Parameters: An Analytical Hierarchy Process (AHP) Approach. Agriculture 2025, 15, 466. [Google Scholar] [CrossRef]
  31. Han, J.; Kim, E.; Moon, S.; Lee, H.; Kim, J.; Park, Y. Fatigue Integrity Assessment for Tractor-Mounted Garlic-Onion Harvester. J. Terramechanics 2022, 100, 1–10. [Google Scholar] [CrossRef]
  32. Wang, Z.; Zuo, Y.; Sun, L.; Zhao, X. Noise Reduction in Tractor Cabs Using Coupled Resonance Acoustic Materials. IEEE Access 2022, 10, 32689–32695. [Google Scholar] [CrossRef]
  33. Tambs, K.; Hoffman, H.J.; Borchgrevink, H.M.; Holmen, J.; Engdahl, B. Hearing Loss Induced by Occupational and Impulse Noise: Results on Threshold Shifts by Frequencies, Age and Gender from the Nord-Trøndelag Hearing Loss Study. Int. J. Audiol. 2006, 45, 309–317. [Google Scholar] [CrossRef]
  34. Riccioni, S.; Bianchini, L.; Assettati, L.; Coltrinari, G.; Tilesi, F.; Cecchini, M.; Ortenzi, L. Application of ANN for the Identification of Discriminating Variables by Noise Analysis on Portable Motorised Equipmen. In International Conference on Safety, Health and Welfare in Agriculture and Agro-Food Systems; Springer Nature: Cham, Switzerland, 2024; pp. 64–71. [Google Scholar]
  35. Choi, S.-W.; Peek-Asa, C.; Sprince, N.L.; Rautiainen, R.H.; Donham, K.J.; Flamme, G.A.; Whitten, P.S.; Zwerling, C. Hearing Loss as a Risk Factor for Agricultural Injuries. Am. J. Ind. Med. 2005, 48, 293–301. [Google Scholar] [CrossRef]
  36. Catania, P.; Vallone, M. Noise Levels of a Track-Laying Tractor during Field Operations in the Vineyard. J. Agric. Eng. 2013, 44, 764–767. [Google Scholar] [CrossRef]
  37. Humann, M.J.; Sanderson, W.T.; Gerr, F.; Kelly, K.M.; Merchant, J.A. Effects of Common Agricultural Tasks on Measures of Hearing Loss. Am. J. Ind. Med. 2012, 55, 904–916. [Google Scholar] [CrossRef]
  38. Anderson, C.G.; Sabino, P.H.S.; Júnior, G.G.O.; da Silva, G.O.A. Octave Band Sound Pressure Level Emitted by Agricultural Implements in Coffee Plantations|Nível de Pressão Sonora Em Bandas de Oitava Emitido Por Implementos Agrícolas No Cafeeiro. Cienc. Rural 2024, 54, e20230062. [Google Scholar] [CrossRef]
  39. Carnevale, M.; Santangelo, E.; Colantoni, A.; Paris, E.; Palma, A.; Vincenti, B.; Paolini, V.; Petracchini, F.; Salerno, M.; Di Stefano, V.; et al. Thermogravimetric Analysis of Olive Tree Pruning as Pyrolysis Feedstock. In Proceedings of the European Biomass Conference and Exhibition, Virtual, 6–9 July 2020; pp. 581–584. [Google Scholar]
  40. Marinaccio, A.; Gariazzo, C.; Taiano, L.; Bonafede, M.; Martini, D.; D’Amario, S.; de’Donato, F.; Morabito, M.; Ariani, F.; Binazzi, A.; et al. Climate Change and Occupational Health and Safety. Risk of Injuries, Productivity Loss and the Co-Benefits Perspective. Environ. Res. 2025, 269, 120844. [Google Scholar] [CrossRef]
Figure 1. Fatal and non-fatal accidents at work in 2022 by NACE section (source: Eurostat).
Agriengineering 07 00087 g001
Figure 3. Patented device used to place phonometric microphone.
Agriengineering 07 00087 g003
Figure 4. The frequency of the brands in the analyzed sample.
Agriengineering 07 00087 g004
Figure 5. Comparison of LAeq.t and Lpeak values for machines with cabins and machines without cabins.
Agriengineering 07 00087 g005
Figure 6. Comparison of LAS max and LAS min in machines with cab and without cab.
Agriengineering 07 00087 g006
Figure 7. Comparison of Lpeak and LAeq.T values in tracked and wheeled machines.
Agriengineering 07 00087 g007
Figure 8. Comparison of LAS max and LAS min values in tracked and wheeled machines.
Agriengineering 07 00087 g008
Figure 9. Analysis of the mean values of Lpeak and LAeq.T by the type of operating machine.
Agriengineering 07 00087 g009
Figure 10. Average values of LAS max and LAS min by type of operating machine.
Agriengineering 07 00087 g010
Figure 11. Sound pressure by type of operating machine: with cab (top) and without cab (bottom).
Agriengineering 07 00087 g011
Figure 12. Sound pressure by type of operating machine divided by traction type: tracked (top) and wheeled (bottom).
Agriengineering 07 00087 g012
Figure 13. Equivalent (left) and peak (right) sound pressure level divided by cab presence and traction type.
Agriengineering 07 00087 g013
Table 1. List of sampled tractors.
ManufacturerModel
AgrifullToselli
CarraroSRX 8400, Tigrone 7700
Case International105U Farmall, CVX120, MX 135, Optum CVX 300, 1056
CaterpillarChallenger MT, D5, D5B SA
CLAASAres 356, Nectis 267 F
Deutz-Fahr105
Fendt820
FerrariThor AR EP 85, Thor AR EP 86, Thor AR EP 87
Fiat110-90, 666 DT, 70-66 DT, 80-66 DT, 80-90, F115, 100-55, 100C, 120C, 1355C, 605C, 70-65, 80-65, 880 DT, AD 7, FA 150, 100 C, 605 C, 70-75, 1580, 1000 DT Super, 466 DT, 480 DT, 600 DT, 65-66 DT, 666 DT, 670 DT, 72-86, 780 DT H, 880 DT, 980 DT, 55-66 DT
Ford7810, 4830
Goldoni233
John Deere3350, 5100, 5400, 5820, 6210, 6310, 6420, 6520, 7700, 50105 GF, 8320 RT, 3140, 1026R, 2030A
KubotaM135GX, M7060, M9540, V3800-CR-TI-EU10
Lamborghini150, 1489, 2081, 774-80, Crono 554-55, 150
Landini9880, REX 100 GT, Rex 85 GE, 6830, Trekker 100, Trekker 105, Trekker 90 F, Trekker 95, 8550, 10000 S, Mistral 50, Rex 90 GE, Rex 100 GE
Massey Ferguson6480, 500 SA
McCormickCX 95 Extract
New Holland6070, G240, T6, T6.140, T7, T7.210, TL90, TN75DA, TN75F, T4050F, TN65F, TN85FA, TN90F, TN95FA, 88-85, TK 4050M, TK 80 MA
SameFrutteto 100, Explorer 70C, Krypton 105, Dorado75, Explorer 70, Explorer 70, Frutteto 90, Tiger Six 105
ValtraT120
Table 2. List of agricultural implements.
Type of Implements
PlowHarrowSubsoiler
SprayerMower-conditionerRound baler
Cutter barBaler wrapperCompactor roller
Sprayer barMilling cutterSeed drill
Front loaderTractor bucketBroadcast fertilizer spreaders
TrailerPrunerManure spreaders
WoodchipperHay balerSlurry spreaders
CompressorGrape harvesterMulcher
Hydraulic forkliftRakes
Disclaimer/Publisher’s Note: The statements, opinions and data contained in all publications are solely those of the individual author(s) and contributor(s) and not of MDPI and/or the editor(s). MDPI and/or the editor(s) disclaim responsibility for any injury to people or property resulting from any ideas, methods, instructions or products referred to in the content.

