Abstract
The poultry industry faces significant challenges in efficiently monitoring large populations, especially under resource constraints and limited connectivity. This paper introduces the Automated Counting and Monitoring System for Poultry Tracking (ACMSPT), an innovative solution that integrates edge computing, Artificial Intelligence (AI), and the Internet of Things (IoT). The study begins by collecting a custom dataset of 1300 high-resolution images from real broiler farm environments, encompassing diverse lighting conditions, occlusions, and growth stages. Each image was manually annotated and used to train the YOLOv10 object detection model with carefully selected hyperparameters. The trained model was then deployed on an Orange Pi 5B single-board computer equipped with a Neural Processing Unit (NPU), enabling on-site inference and real-time poultry tracking. System performance was evaluated in both small- and commercial-scale sheds, achieving a precision of 93.1% and recall of 93.0%, with an average inference time under 200 milliseconds. The results demonstrate that ACMSPT can autonomously detect anomalies in poultry movement, facilitating timely interventions while reducing manual labor. Moreover, its cost-effective, low-connectivity design supports broader adoption in remote or resource-limited environments. Future work will focus on improving adaptability to extreme conditions and extending this approach to other livestock management contexts.
1. Introduction
As the world changes constantly, so does the way we produce our food. Recent discoveries of various technologies have driven advancements in agro-industrial processes. Among the most revolutionary technologies is edge computing, which has significantly transformed diverse industries by bringing data processing closer to the point of generation, reducing latency, and improving operational efficiency [].
Edge computing is a data processing model that brings computation and storage closer to where the data are generated rather than relying solely on centralized data centers. This technology represents a significant shift in how data is managed and processed, offering faster, more efficient, and more secure solutions for various industries and applications [].
Moreover, artificial intelligence (AI) has revolutionized the way we optimize and automate processes in the agri-food industry. Beyond being a technical tool, AI has been presented as a transformative force reshaping both the economy and social processes through the analysis of large volumes of data [].
AI allows for complex analysis, such as in predicting weather patterns, identifying pests and diseases in crops, and enhancing agricultural yields, by optimizing resources such as water and nutrients. In 2017, Katz highlighted that the resurgence of AI is deeply tied to the use of big data and its ability to interpret metrics, redefining current technological expectations and applications. Furthermore, through the use of machine learning algorithms, AI can identify problems in real time, allowing farmers to make informed decisions and address issues before they become serious threats to production [].
The combination of AI with sensor technologies in the Internet of Things (IoT) has revolutionized the continuous monitoring of critical variables such as soil moisture and temperature. A notable example is the system proposed by Wu et al. [], also presented in [,,], which employs wireless sensors, mobile applications, and advanced deep learning algorithms to measure and predict soil conditions in real time.
Based on systems such as wireless sensor networks and edge computing platforms, this approach delivers fast and accurate results directly in the field, eliminating the need to transmit large volumes of data to remote servers. Additionally, implementing strategies like deep reinforcement learning enhances forecast accuracy, optimizes efficiency, and reduces energy consumption in data processing [].
Edge computing, AI, and IoT are redefining modern agriculture by creating an intelligent and connected ecosystem. These technologies not only enhance farmers’ productivity and profitability but also promote sustainable and environmentally friendly production by minimizing resource waste and reducing environmental impact. Thus, the agriculture industry of the future is shaping up to be a dynamic, innovative, and resilient sector capable of addressing global challenges related to food security and sustainability through the strategic use of cutting-edge technologies.
Broiler farms face various challenges, with the prevention and control of diseases being among the most critical. The rapid spread of illnesses and pathogens in densely populated barns or sheds can lead to high mortality rates. Among these, ESBL-producing E. coli, an opportunistic pathogen, can negatively impact the broiler growth cycle and presents a serious threat to poultry production and public health through zoonotic transmission. Consequently, developing early-stage control strategies is essential []. The inherent susceptibility of chickens to pathogens during early growth renders appropriate interventions at this developmental phase beneficial for microbiome development []. Therefore, there is a pressing need to develop tools for more dynamic health and administrative management, enabling decision making during flock development based on highly reliable data. AI can provide valuable insights through the monitoring of poultry populations, allowing farm managers or those responsible for health management to take timely action.
Poultry facilities and similar hostile environments make it hard to count birds. Therefore, robust and adaptive algorithms are needed to accurately detect and track them over time, ensuring reliable data analysis []. Typically, poultry farmers rely on daily in-person inspections to assess broiler health, using their experience to identify sick birds, which are then manually removed to prevent disease spread [].
As part of health and administrative management, poultry farmers estimate the number of broilers in their population at two stages in the rearing process: at the beginning, when they enter the broiler house, and at the end, when the chickens are sent to the slaughterhouse.
In response to these challenges, this study aims to develop and validate an AI-driven automated poultry flock management system utilizing the YOLOv10 model. The scientific objective of this research is to advance computer vision techniques in poultry monitoring by addressing critical limitations in real-world farm environments. By integrating YOLOv10 with edge computing, our approach enables real-time, high-accuracy detection in resource-constrained settings, distinguishing it from conventional cloud-based monitoring systems that suffer from latency and connectivity issues.
From a practical standpoint, this research introduces a scalable and cost-effective solution that facilitates automated poultry monitoring and data-driven decision making. The proposed system enhances flock management by reducing manual labor, improving tracking accuracy, and optimizing resource allocation. By mitigating economic losses and promoting sustainable agricultural practices, this study offers a practical and impactful solution to modern poultry farming challenges.
2. Background
The poultry industry is undergoing rapid transformation, driven by increasing global demand for poultry products and technological advancements that enhance production efficiency and sustainability. As global populations grow and consumer preferences shift, the poultry sector plays a central role in addressing the rising need for affordable, high-quality protein sources. However, numerous challenges persist, including with respect to mitigating environmental impacts, improving animal welfare, and ensuring food security [,].
To address these challenges, modern technologies are being integrated into poultry farming. Precision livestock farming (PLF) systems, utilizing sensors, cameras, and AI technologies, have emerged as key solutions for improving farm management, monitoring animal welfare, and increasing production efficiency. These systems facilitate real-time decision making, allowing farmers to undertake informed interventions before issues escalate [,]. Sustainability concerns have also driven efforts to reduce the environmental footprint of farming practices by minimizing water use, reducing emissions, and transitioning to more sustainable feed sources. Meanwhile, poultry welfare is being prioritized through housing systems such as by adopting free-range and organic practices, which positively impact bird health and productivity [,]. Research such as that presented in [] focuses on the relationship between stocking density and gut microbiome development, with findings supporting the hypothesis that an increase in space positively correlates with improvements in weight and gut health. Despite their promise, the implementation of these technologies faces barriers, including technical constraints, high initial costs, and the need for skilled management [,].
The increasing adoption of the agricultural Internet of Things (IoT) has necessitated efficient data processing solutions. Traditional cloud computing systems, though effective, often suffer from latency and network congestion due to the vast amount of data generated in large agricultural areas. Edge computing addresses this challenge by processing data closer to the source, reducing latency and alleviating the load on centralized cloud servers [,]. In agriculture, edge computing enhances efficiency and enables immediate decision making, with applications in pest identification, product safety traceability, and agricultural machinery management []. By leveraging AI algorithms at the edge, real-time analysis of sensor data becomes possible, allowing for faster responses to changing farm conditions.
Artificial intelligence (AI) plays a crucial role in modern farming techniques, particularly in crop and livestock management. AI technologies, including machine learning (ML), deep learning (DL), and neural networks, contribute to the prediction of crop yields, the monitoring of plant health, and the detection of pests or diseases [,]. AI-powered drones and sensors provide detailed insights into soil conditions, water usage, and crop health, facilitating targeted interventions []. These capabilities optimize resource use, reduce waste, and enhance yield quality. As shown in [,], the use of computer vision-enabled robotic arms for automated decision making in vegetable and crop handling is becoming more common, applying a YOLO implementation. By analyzing data from IoT devices, AI can recommend optimal planting times, irrigation schedules, and fertilization practices, thereby promoting sustainability []. Furthermore, AI can predict the optimal harvesting time, maximizing productivity and minimizing losses [].
The integration of edge computing and AI offers significant advantages in precision agriculture. By deploying AI algorithms locally on farm devices, real-time data analysis and decision making can occur without reliance on constant cloud connectivity. This integration enhances resource efficiency, improves crop management, and strengthens pest control [,]. For example, AI can analyze data from soil moisture sensors, weather stations, and crop health monitors at the edge, providing immediate feedback on soil conditions, irrigation needs, and pest threats. These advancements help optimize operations and reduce environmental footprints by minimizing water usage, pesticide application, and fertilizer runoff [,]. The combination of these technologies is transforming agriculture, providing farmers with essential tools to improve efficiency, ensure better yields, and promote sustainability.
In 2020, Ren et al. [] analyzed agricultural robotics applications for poultry production and classified them into three functional groups according to their functions: monitors, harvesters, and combined monitor–harvesters. Ren et al. [] reported that neural networks have been employed for image-based detection across a wide range of farm animals, including pigs, goats, and cows. The authors posited that the identified trajectory of research and development will be maintained, with poultry management efficiency representing an increasingly prominent area of scholarly inquiry.
The use of AI and computer vision in poultry farming has revolutionized monitoring and management practices. AI-based object detection models such as YOLO (You Only Look Once) [] and Faster R-CNN [] automate tasks like poultry counting, behavior monitoring, and health assessment. These models demonstrate high accuracy in detecting and tracking chickens, enhancing farm efficiency and resource management. AI-driven monitoring systems using mainly YOLOv5 and YOLOv8 have been particularly effective in poultry counting and health assessments.
A dead chicken detection model utilizing YOLOv4 was trained, achieving a precision of 95.24%, and a mobile robotic system was designed and constructed for the purpose of removing detected carcasses from sheds [].
Likewise, YOLOv5 has successfully classified and counted different chicken breeds, achieving precision and recall rates of 89.9% and 87.2%, respectively, providing a practical alternative to manual counting []. YOLOv5 has seen widespread use in various research areas. In a study published in [], a modified YOLOv5 model was used for chicken detection in farm settings, yielding an mAP of 90.0%. The authors also articulated the shortcomings of current detection methodologies.
Employing YOLOv5 in conjunction with a Kalman filter, researchers have explored chicken tracking to measure activity levels. This approach provides continuous monitoring of chickens’ perching, walking, and environmental interactions [].
An alternative approach to broiler weight estimation involves the integration of a YOLOv5 model and a convolutional neural network employing a regression output []. The system was implemented using a Raspberry Pi board and achieved a 0.87 value.
The detection of diseases utilizing the YOLOv5 architecture was detailed in [], wherein a ResNet50 classification model was integrated to identify visual symptoms of illness in chickens, leading to a 35% improvement in their overall health.
For instance, YOLOv8 models have achieved an F1 score of 0.86, indicating high accuracy in detecting pathological features in chickens and monitoring crucial environmental parameters like temperature and humidity [].
A YOLOv8-based approach incorporating data augmentation was used to predict pathological characteristics in chickens, yielding a test precision of 89.9% []. To keep owners informed, this approach employs IoT devices to send notifications. A model based on the YOLOv8 architecture was developed by Chemme and Alitappeh [] for chicken detection within a cluttered environment, attaining an accuracy of 93%, thereby surpassing the results yielded in [].
The reported in [], aimed to refine automated chicken identification in videos, tackling the dynamic and inconsistent conditions of poultry farms. The YOLOv8n model was selected for its portability in chicken detection. The methodology for chicken tracking, subjected to testing with concurrent combinations of chickens, exhibited an accuracy rate of 98.3% in scenarios characterized by multiple missing and coalescing chickens.
Elmessery et al. [] presented a new method for chicken detection, combining computer vision and YOLO-based algorithms to be applied to both thermal and visual images with diverse, complex backgrounds. The detection was focused on pathological phenomena of broilers. The authors conducted a comparative analysis of YOLO architectures, specifically v8, v7, and v5, and determined that YOLOv8 exhibited the highest performance metrics, achieving mAP50 and mAP50-95 values of 0.829 and 0.679, respectively, for visual images, demonstrating its superiority over the preceding versions.
Recognizing poultry locomotion as a key indicator of health, welfare, and productivity, Yang et al. [] introduced an enhanced Track Anything Model (TAM) for chicken tracking. This model, achieving an RMSE of 0.02 m/s in speed detection, provides a reliable, non-intrusive method for locomotion analysis and outperforms YOLOv5 and YOLOv8 in chicken tracking. Beyond simple counting, AI-powered computer vision systems enhance monitoring by detecting behavioral anomalies and identifying sick birds. These systems integrate with IoT devices to measure environmental parameters, triggering alerts when conditions deviate from optimal ranges. This approach provides real-time, non-intrusive solutions for maintaining a stress-free and healthy environment, leading to improved productivity and welfare standards []. For example, smart poultry management systems based on IoT technology utilize sensors to monitor temperature, humidity, and ammonia levels, automating farm management tasks such as feeding and watering. Remote monitoring through mobile apps and websites further improves operational efficiency and ensures optimal poultry conditions [].
Wireless sensor networks (WSNs) also play a vital role in modern poultry farm management. These networks enable continuous monitoring of environmental conditions, with real-time data transmission to centralized systems that analyze information for informed decision making. WSNs are widely used for the monitoring of temperature, humidity, and ammonia levels, ensuring optimal poultry health []. When integrated with AI models such as Faster R-CNN, these systems can detect dead chickens and count live ones, offering a more automated and efficient approach to farm management []. The combination of AI-driven object detection, IoT sensors, and WSNs represents a powerful solution for modern poultry farming, enhancing farm management, improving poultry welfare, and optimizing resource use, thereby contributing to the future of sustainable poultry farming. A selection of projects employing the YOLO architecture for model training is illustrated in Table 1. These projects concentrate on chicken tracking and detection within agricultural environments. The presented results demonstrate that YOLOv8 tends to display superior performance when compared to prior versions.

Table 1.
Models trained using the YOLO architecture for problems related to chicken detection on farms. NA stands for not available data about this metric in the study.
The review provided in [] examined the diverse applications of the YOLO architecture throughout its development. The study pointed out the different versions of YOLO used in areas such as medicine, autonomous driving, industry, and agriculture. It stated that, specifically in agriculture, YOLOv8 has achieved the most favorable results. Likewise [] concentrated on analyzing the use of YOLO within agriculture, particularly in crop cultivation. The authors detailed the architectural evolution and the enhancements achieved with each subsequent version. Considering this information and the outcomes of earlier studies [], the decision was made to utilize the YOLOv10 architecture, representing the most current version during the development phase. An evaluation of version enhancements, which have consistently yielded better results, justifies this determination. Furthermore, Section 3.2.4 provides evidence that YOLOv10 is compatible with the project’s chosen hardware.
3. Materials and Methods
3.1. Research Methodology
3.1.1. Description of the Approach
This study employs an applied research approach to develop an automated poultry monitoring system using edge computing and artificial intelligence (AI). The system is designed to address the challenges associated with the monitoring of large-scale poultry populations in dynamic farm environments, which include variations in lighting conditions, occlusions, and infrastructure constraints. By leveraging edge computing, data processing is performed locally, reducing latency and dependence on cloud-based solutions—an essential feature for farms with limited network connectivity [].
To achieve real-time monitoring, an object detection model based on the YOLO (You Only Look Once) architecture was deployed on a low-power single-board computer (SBC), an Orange Pi 5B. This device, equipped with a neural processing unit (NPU), enables efficient on-device AI inference. The YOLO-based model has been widely recognized for its superior performance in object identification and counting tasks within agricultural monitoring applications [,].
The integration of edge computing and AI aligns with current advancements in precision agriculture, where real-time decision making is critical for livestock management. Studies have demonstrated that Edge Computing enhances autonomy and reduces operational latency, making it particularly effective for the monitoring of poultry farms [,]. Furthermore, automated detection of behavioral patterns, such as activity levels and mobility changes, enables early interventions to mitigate disease outbreaks or stress-induced anomalies [].
Given the complexity of farm environments, robust object detection models such as YOLO have proven effective for real-time image and video analysis []. The YOLO series is well-suited for high-speed applications, processing entire video frames in a single pass. This makes it an ideal candidate for the tracking and counting of poultry populations with high accuracy. Additionally, deploying YOLO models on energy-efficient single-board computers, such as an Orange Pi with an NPU, optimizes performance while maintaining low power consumption—an essential factor for sustainable and resource-constrained agricultural settings.
3.1.2. Tool Selection Process
The selection of hardware and software for this project was based on efficiency, scalability, and suitability for real-time monitoring in environments with limited network access. A key requirement was ensuring that the system could operate autonomously with minimal reliance on external infrastructure [].
Among various single-board computer (SBC) options, the Orange Pi 5B was chosen due to its Rockchip RK3588S processor, which integrates an eight-core CPU with a neural processing unit (NPU) capable of 6 TOPS (Tera Operations Per Second). This hardware enables low-latency inference of complex models such as YOLOv10, making it ideal for edge computing applications on rural poultry farms, where speed and autonomy are critical []. Furthermore, its architecture supports multiple sensors and cameras, allowing for continuous real-time data collection [].
For object detection, the YOLOv10 (You Only Look Once) model was selected due to its superior balance of accuracy and computational efficiency in agricultural monitoring applications. YOLOv10 efficiently processes video frames in real time, making it well-suited for the tracking and counting of moving poultry. Alternative models, such as SSD and Faster R-CNN, were considered but not chosen due to their higher computational demands, which could reduce performance in resource-constrained environments [].
To ensure high-quality training data, labelImg was used as the annotation tool due to its widespread adoption in the computer vision community and its ability to facilitate precise segmentation []. This step was crucial in maintaining consistency in dataset labeling, particularly under challenging conditions such as occlusion and variable lighting []. Additionally, a manual review of annotations was conducted to further enhance label accuracy.
The selection process prioritized adaptability and scalability. The combination of the Orange Pi 5B and YOLOv10 allows for autonomous, real-time monitoring with minimal connectivity requirements. This design enables poultry farmers to quickly detect changes in bird activity and population dynamics, ultimately improving efficiency and decision making in farm management [].
3.1.3. Dataset Creation
The dataset was developed to ensure the YOLOv10 detection model could accurately and reliably operate in poultry farm environments. Real-time images were captured from a broiler chicken farm using ceiling-mounted cameras to cover the entire rearing area. Over six weeks, 1300 high-resolution images (1920 × 1080 pixels) were collected, representing different chicken growth stages, activities, lighting conditions, and occlusions.
Figure 1 presents sample images from the dataset, categorized by location: the left column corresponds to the small shed, while the right column represents the commercial shed.
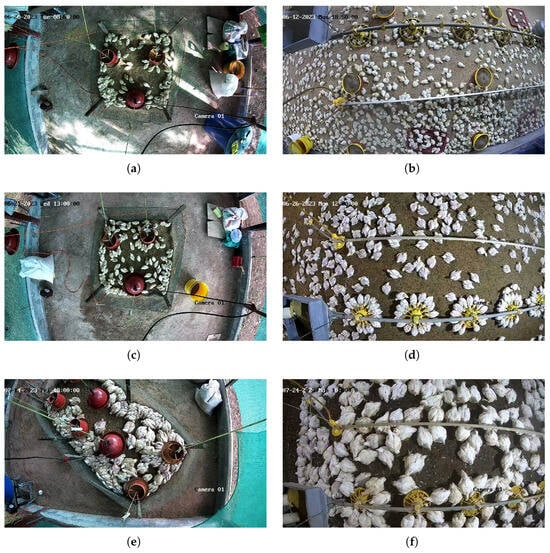
Figure 1.
Sample images of the dataset, depicting different chicken growth stages in the small shed (left column) and commercial shed (right column). The first row (a,b), captures the early growth stage. The middle row, (c,d) illustrates mid-stage clustering. The bottom row, (e,f) shows the fully grown stage with increased crowding and lighting variations.
The dataset encompasses various growth phases: the initial stage (Figure 1a,b) shows less clutter, the middle stage (Figure 1c,d) exhibits increased clustering around feeders, and the final stage (Figure 1e,f) captures fully grown chickens in a crowded environment.
To replicate real farm conditions, image collection included both natural and artificial lighting, as well as shadowed areas, capturing the daily behavioral variations of chickens. This diversity ensures the AI model’s robustness in handling varying environmental factors.
All images were manually annotated using the labelImgtool [], which is widely used in computer vision for precise dataset labeling. Each chicken was marked with a bounding box to ensure accurate detection, even under occlusion and varying viewing angles. To enhance labeling consistency, each annotation was reviewed by at least two individuals based on predefined criteria, ensuring only visible chickens were marked with precise boundaries [].
For model training, the dataset was split into two subsets: 70% for training and 30% for testing and validation. This allocation ensures that the model learns from diverse scenarios while being evaluated on unseen data to assess its generalization ability. Additionally, data augmentation techniques such as rotation, scaling, cropping, and brightness/contrast adjustments were applied to improve model robustness to environmental variations.
The accuracy of the YOLOv10 model relies heavily on the quality of the dataset. This carefully curated dataset enhances detection and counting precision while maintaining adaptability for real-world deployment. Furthermore, the dataset is expandable for future research, enabling applications in other livestock monitoring scenarios.
3.1.4. Structure of the Poultry Sheds
The study was conducted in two different poultry shed environments: a small shed housing 100 chickens and a commercial-sized shed. In the commercial shed, data collection was limited to a designated quarter of the facility, as illustrated in Figure 2a,b. To contextualize the study area, Figure 2b presents a Google Earth image of the shed, where the red square marks the specific region used for image acquisition. The commercial shed features a robust metal-frame structure, equipped with ventilation systems and optimized lighting conditions to ensure effective monitoring of a large poultry population.
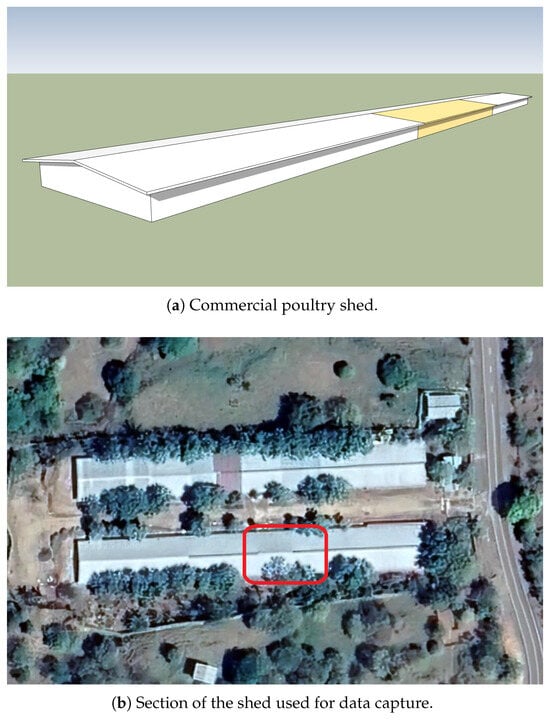
Figure 2.
Schematic views of the commercial poultry shed used during data collection and model testing.
Conversely, the small shed (Figure 3a,b) housed a smaller flock of 100 chickens and was designed for small-scale operations. This environment featured a compact layout with a simplified ventilation and lighting system, making it suitable for detailed behavioral observations. The shed’s smaller dimensions facilitated close monitoring of individual chickens but also posed certain spatial limitations.
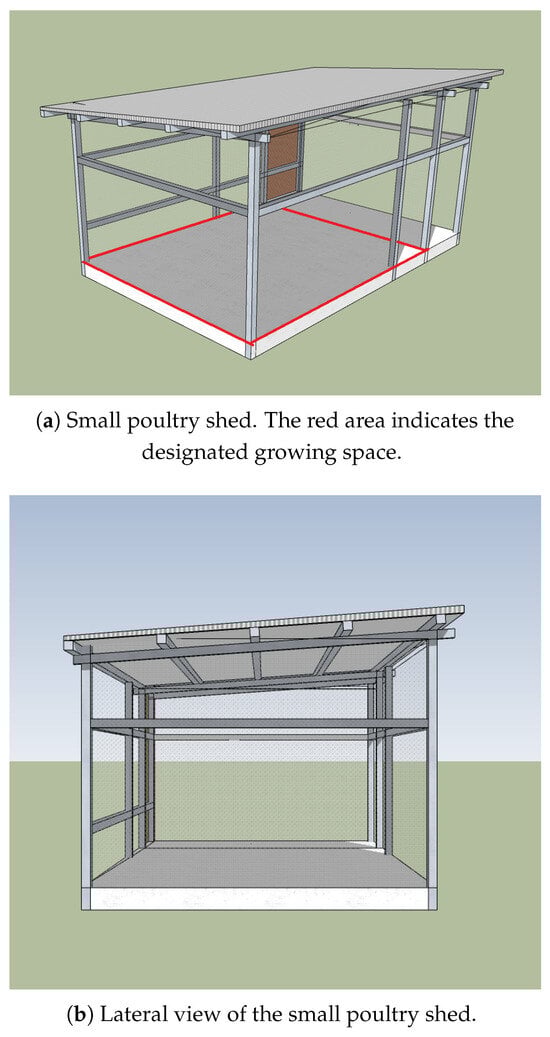
Figure 3.
Schematic views of the small poultry shed used during data capture and model testing.
These two environments (Figure 2 and Figure 3) provided diverse datasets, which were essential for the training of the YOLOv10 detection model to function effectively under different poultry farm conditions.
Figure 4 presents images from the interior of the commercial shed. In Figure 4a, red squares indicate the positions of the installed cameras used for data collection. Figure 4b provides an overview of the camera arrangement on the ceiling, while Figure 4c offers a close-up view of a single camera setup.
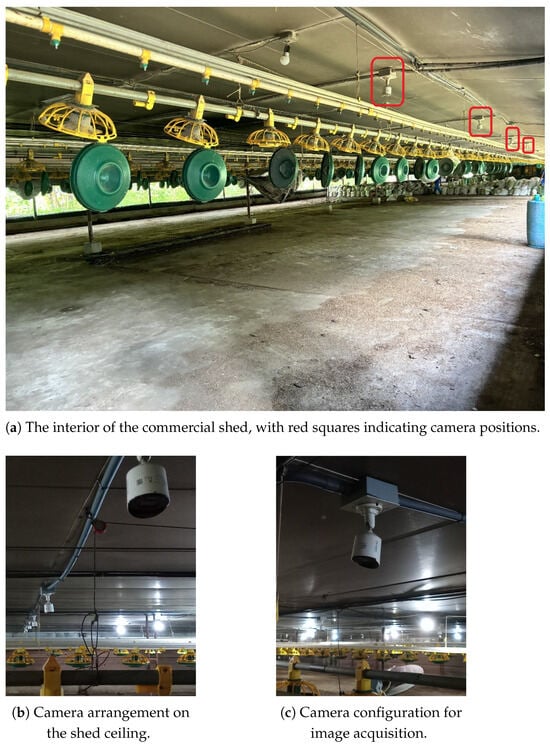
Figure 4.
Interior of the commercial shed used for data capture.
3.2. Project Architecture
3.2.1. General Description
The system architecture follows the edge computing paradigm, ensuring all data processing occurs locally, on-site at the poultry farm. This eliminates reliance on external servers, which is a crucial feature for rural environments where Internet connectivity is often limited or unstable. The system is designed to operate autonomously and efficiently, with the Orange Pi 5B serving as the central processing unit. Equipped with a 6-TOPS (Tera operations per second) neural processing unit (NPU), this device enables low-latency, real-time inference, ensuring continuous and accurate monitoring of poultry activity and population counts.
The hardware infrastructure includes high-resolution surveillance cameras mounted on the shed ceilings, covering the entire breeding area. These cameras, capable of capturing images at a 1920 × 1080 pixel resolution, are connected to a Network Video Recorder (NVR), which centralizes and manages video streams. The Orange Pi 5B, linked to the NVR, processes these images using the YOLOv10 object detection model. The model, pre-optimized on a GPU workstation, is adapted for efficient execution on the device’s NPU, enabling fast on-site analysis.
The YOLOv10 model identifies and counts birds in real time, distinguishing between active and resting chickens. This capability is critical for flock health and welfare monitoring, enabling early detection of potential stress indicators, anomalies, or disease outbreaks. By performing on-device processing, the system provides instant responses, minimizes cloud dependency, enhances data privacy, and reduces bandwidth usage.
In addition to its hardware components, the architecture includes a Web-based user interface accessible from any device within the farm’s local network. This interface provides real-time visualizations of detected chickens, their activity status, and historical data analytics. The system also incorporates time-series analysis, allowing for the early detection of behavioral anomalies that may indicate potential health issues within the flock.
By integrating optimized hardware and software, this scalable and cost-effective solution enables efficient adaptation to varying farm conditions. The system maximizes productivity, reduces operational costs, and ensures autonomous monitoring through an edge computing approach tailored for real-world poultry farming challenges.
3.2.2. System Proposal
The proposed system integrates optimized hardware and software to enable real-time monitoring and counting of chicken activity. Built on an edge computing architecture, the solution deploys an artificial intelligence model on the Orange Pi 5B, ensuring autonomous on-site processing. Each system component is detailed below.
- Hardware ConfigurationThe core hardware consists of the Orange Pi 5B, powered by the Rockchip RK3588S octa-core processor and a 6-TOPS neural processing unit (NPU). This configuration enables efficient AI inference while maintaining low power consumption. The on-device processing capability of the NPU eliminates reliance on external servers, making it ideal for environments with limited connectivity or where data privacy is a key concern.The system also incorporates high-resolution surveillance cameras mounted on the poultry shed ceilings to capture flock images at a 1920 × 1080 pixel resolution. These cameras are connected directly to the Orange Pi 5B via dedicated input ports, ensuring continuous real-time data acquisition across the entire breeding area.
- Software ConfigurationThe software framework is built around YOLOv10, an advanced object detection model that balances speed and precision for real-time monitoring tasks. Initially trained on a GPU workstation, the model is subsequently optimized and deployed on the Orange Pi 5B for efficient on-site inference.YOLOv10 is configured in its small variant, which optimizes computational efficiency while maintaining high detection accuracy. This variant is specifically suited for resource-constrained edge devices, such as the Orange Pi, which requires rapid and continuous inferences to effectively monitor poultry activity in real time.
3.2.3. Model Training
The YOLOv10 model was trained using a dataset of 1300 images captured from the farm, each pre-labeled with bounding boxes to identify individual chickens. To optimize model performance, several key hyperparameters were employed, as summarized in Table 2.
Table 2.
Training hyperparameters for the YOLOv10 model.
- Epochs: The model was trained for 100 epochs, a value determined through preliminary experiments to ensure convergence without overfitting.
- Batch Size: A batch size of 16 images per iteration was chosen to balance GPU memory utilization and maintain stable training.
- Learning Rate: The initial learning rate was set to 0.001, with a gradual decay scheduler to refine model weights and enhance convergence.
- Optimizer: AdamW was selected for its efficiency in computer vision tasks and its ability to handle large datasets with precise, adaptive weight updates.
- Data Augmentation: To improve the model’s generalization capability, various data augmentation techniques were applied, including rotation, scaling, cropping, brightness, and contrast adjustments. These augmentations simulate diverse lighting and occlusion conditions, ensuring robustness in real-world environments.
3.2.4. Deployment on the Orange Pi 5B
After training, the YOLOv10 model was deployed on the Orange Pi 5B, where the neural processing unit (NPU) was configured for real-time inference. To ensure compatibility, the model was first converted to the ONNX format. This conversion addresses the operational compatibility between the original YOLOv10 and the Rockchip NPU integrated on the Orange Pi 5B board. The modifications include replacing operations that were not recognized by the compiler and transforming the single output into three separate outputs. After conversion, the ONNX model was optimized using the rknn-toolkit (https://github.com/airockchip/rknn-toolkit2/, accessed on 30 October 2024) to generate the RKNN format, which is specifically designed for the RK3588S processor’s NPU architecture. The aim of this optimization is to decrease model weight, increase inference speed, and refine convolutional layers and activation functions for optimal inference efficiency. The official model documentation provides support for these procedures [,,,,]. Figure 5 illustrates this conversion process.
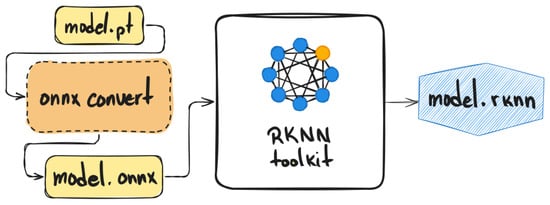
Figure 5.
Diagram of the model conversion process.
Leveraging the Orange Pi 5B’s efficient on-device processing, the system can handle multiple images per second and provide real-time responses to variations in flock activity. This setup enables the detection of movement and inactivity patterns, allowing operators to receive alerts for abnormal behaviors and intervene promptly when necessary.
3.2.5. System Microservices
The system architecture is divided into four key microservices, each handling a specific function:
- Image Processing and Inference Microservice: This microservice receives images from the surveillance cameras, applies preprocessing steps (e.g., color normalization and resizing), and executes YOLOv10 inference (https://docs.ultralytics.com/es/models/yolov10/, accessed on 5 October 2024) for chicken counting and motion detection. The processed data are then filtered and consolidated before being passed to the backend.
- Backend Microservice for Data Management: Acting as an intermediary between the inference microservice and the database, this component receives and processes detection results, forwarding them to a MongoDB database (https://www.mongodb.com/es, accessed on 17 August 2024). Additionally, it manages business logic, including real-time alert generation and notifications for the Grafana dashboard.
- Grafana Microservice for Data Visualization: Responsible for managing the Grafana instance (https://grafana.com/, accessed on 21 June 2024), this microservice extracts stored data from MongoDB and visualizes real-time metrics as interactive graphs and dashboards. Users can monitor chicken activity and receive visual alerts for unusual behaviors.
- Database Microservice (MongoDB): MongoDB serves as the primary data storage system, chosen for its scalability and flexibility in handling unstructured data. It ensures the persistence of historical records, facilitates fast queries, and supports efficient trend analysis over time.
3.2.6. Docker for Container Management
To ensure portability and replicability, all microservices are encapsulated within Docker containers (https://www.docker.com/, accessed on 13 June 2024). Docker simplifies deployment across different environments by maintaining consistent dependencies and configurations. This modular approach is particularly beneficial for resource-constrained agricultural settings, allowing the entire system to run on a single Orange Pi 5B unit while ensuring scalability.
3.2.7. Data Visualization in Grafana
The Grafana interface provides real-time visual monitoring of key poultry parameters, including the following:
- Number of chickens detected;
- Motion status (active vs. inactive birds);
- Average movement speed.
The dashboard also features line and bar charts displaying behavioral trends over time, helping farmers identify potential health issues. Automated alerts notify operators of abnormal inactivity levels or sudden changes in movement patterns, enabling quick intervention when necessary.
3.2.8. Access to Historical Data and Automated Reports
Grafana, integrated with MongoDB, allows for quick access to historical data, supporting long-term behavioral analysis. Users can generate automated reports at configurable intervals (daily, weekly, or monthly) and export them in formats such as CSV or PDF. This feature facilitates external data analysis and integration with other farm management systems, providing a comprehensive monitoring solution.
3.2.9. User Interface
The system features a user interface accessible via the local network, enabling operators to monitor real-time poultry activity, including chicken count and movement status, as well as access historical data. Designed with an intuitive dashboard, the interface incorporates charts and visual alerts to facilitate quick and informed decision making for flock management.
As illustrated in Figure 6, the system architecture consists of three main components:
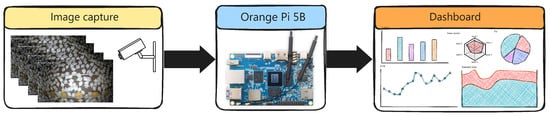
Figure 6.
System architecture: Image capture, processing via Orange Pi 5B, and data visualization on the dashboard.
- Image Capture System: Surveillance cameras continuously capture poultry activity.
- Processing Unit (Orange Pi 5B): The YOLOv10 model performs real-time object detection and data analysis.
- Dashboard for Visualization: Displays real-time insights using Grafana.
The interface is implemented using Grafana, providing real-time visualization and historical analysis. Operators can access the dashboard from any device on the local network, enabling centralized monitoring of chicken population dynamics and behavioral trends on the farm.
The system infrastructure follows a microservices architecture, with all services encapsulated in Docker containers to enhance scalability, portability, and dependency management. This design ensures the system remains modular and easy to manage, allowing for flexible deployment across different farm setups.
The integration of Grafana and MongoDB delivers a comprehensive, user-friendly experience, supporting both real-time monitoring and historical analysis of poultry activity, providing valuable insights for farm management.
4. Results
4.1. Workflows
Testing Process
The system’s testing process was designed to verify the functionality and accuracy of the AI model, as well as the integration and communication between the various microservices that comprise the system’s architecture. This process included a series of steps for model inference and evaluation, as well as the testing of each microservice under simulated production conditions. Below are the key steps and components:
- Preprocessing, Inference, and Postprocessing Microservice:This microservice performs three integrated functions:
- Preprocessing: Upon receiving an image captured by the cameras, the microservice conducts initial preprocessing, including color normalization, resizing, and formatting of the image to ensure that the input data for the YOLOv10 model are consistent and optimized.
- Inference: The preprocessed image is sent to the YOLOv10 model, which performs real-time object detection, identifying and counting chickens in the capture area.
- Postprocessing: Once the inference results are obtained, the microservice applies postprocessing to consolidate the information, removing redundant detections and adjusting the bounding-box coordinates. Additionally, extra metrics are calculated, such as movement status (active or inactive chickens) and average movement speed.
This microservice ensures that the data are fully prepared before being sent to the backend for storage and visualization. - Backend Microservice (API):The back end functions as an API service responsible for receiving the postprocessed data from the image processing microservice and sending them to the MongoDB database. This service acts as an intermediary, connecting the image processing microservice with the storage system, ensuring smooth and real-time data communication. The backend also manages the business logic necessary to store the data correctly, making it accessible later for visualization in Grafana.
- Database Microservice (MongoDB):MongoDB stores all the postprocessed data it receives from the backend. This database not only saves real-time information but also facilitates access to historical data. The data structure in MongoDB is designed to support fast and efficient queries, allowing for optimal integration with Grafana, which is used for visual data representation.
- Visualization Microservice (Grafana):Grafana is responsible for displaying the results stored in MongoDB, providing a complete visual interface for the user. Through interactive dashboards and charts, Grafana enables farm operators to monitor real-time chicken counts, movement status, and other relevant metrics. It also offers the ability to generate visual alerts when values exceed certain thresholds and allows for access to historical data for analysis of flock activity patterns.
4.2. Performance Metrics
The performance of the proposed model is evaluated using multiple metrics to demonstrate its robustness and efficiency under various conditions.
4.2.1. F1–Confidence Curve
The analysis of the F1–confidence curve demonstrated an optimal model performance with an average F1 score of at a confidence threshold of . This result highlights the model’s ability to maintain a proper balance between precision and recall in real-time inferences (Figure 7a).
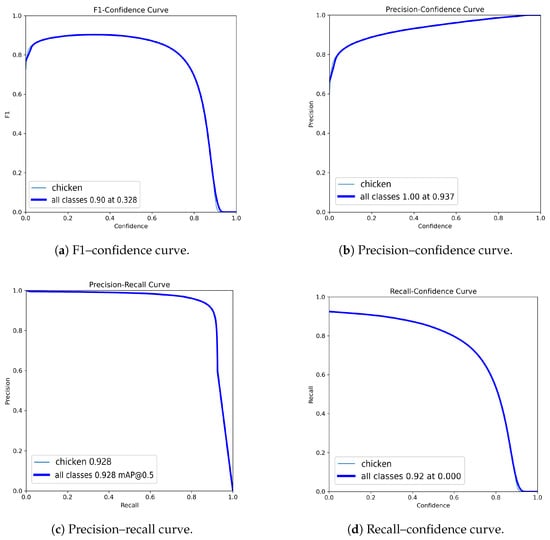
Figure 7.
Visual representation of the performance metrics of the proposed model: (a) F1–confidence curve, showing an average F1 score of at a confidence threshold of ; (b) precision–confidence curve, achieving a maximum precision of at a confidence threshold of 0.937; (c) precision–recall curve, indicating an average precision of 0.928 at a threshold; (d) recall–confidence curve, with an average recall of and an optimal threshold of 0.
4.2.2. Precision–Confidence Curve
The model’s performance in terms of precision reached a maximum value of at a confidence threshold of , indicating the system’s ability to correctly identify detected objects without compromising prediction quality (Figure 7b).
4.2.3. Precision–Recall Curve
The analysis of the precision–recall curve reflects an average precision of at a threshold, validating the model’s robustness in handling data with variability in capture conditions (Figure 7c).
4.2.4. Recall–Confidence Curve
The recall–confidence curve showed an average recall of , with an optimal threshold at 0. This result indicates the system’s ability to minimize false negatives, detecting most of the objects of interest present in the images (Figure 7d).
4.2.5. Real-Time Detection Visualization
In addition to numerical metrics, Figure 8 demonstrates the model’s real-time detection capability in a complex barn environment. Bounding boxes represent identified poultry with associated confidence scores, illustrating the model’s practical implementation and its ability to handle variable conditions such as changes in lighting and occlusion.
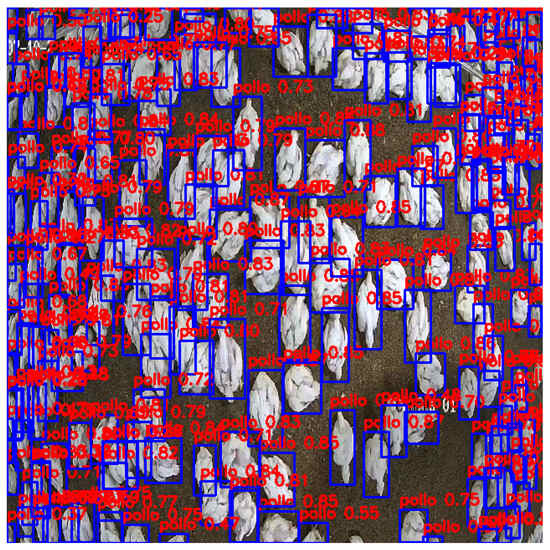
Figure 8.
Example of poultry detection using the YOLOv10 model in real time. Bounding boxes and associated confidence scores highlight the model’s successful identification and monitoring of individual poultry in a complex farm environment.
The YOLOv10 model demonstrated a precision of and recall of under real-time farm conditions, with an average inference time below 200 milliseconds. Additionally, during a test run of 5 min, the system processed 2359 images. This translates to the following metrics:
- Average Inference Time per Image: s.
- Inference Speed: FPS (Frames Per Second).
These results confirm the efficiency of the YOLOv10 model in real-time poultry detection and counting tasks, meeting the demands of low-latency, high-accuracy requirements in agricultural environments.
4.2.6. Real-World Testing
Real-world tests were conducted for one hour with a camera installed in a commercial poultry barn. During this period, the system detected 1548 chickens, corresponding to the birds that entered the camera’s field of view. These results demonstrate the system’s effectiveness in an operational environment, under real-world lighting and movement conditions. The YOLOv10 detection model’s ability to accurately identify and count the birds remained high, showcasing the system’s robustness under changing conditions.
The tests validated the model’s accuracy for automatic bird counting, a key feature of the system that enables efficient and precise management of poultry populations in real time, minimizing the need for manual intervention. The system is designed to operate within a closed, isolated network, disconnected from the Internet due to the geographical constraints of the available poultry shed. This isolation provides a fundamental level of security by restricting access to only those devices that are physically connected to the network. For deployment in varied locations, a careful evaluation is crucial to implement security and data access strategies that achieve a balance among usability, efficiency, and safeguarding against unauthorized access.
Figure 9 presents the results panel and the hardware setup used during testing. Figure 9a displays the captured image with labeled chickens alongside the Orange Pi’s operational status at the time of execution. Figure 9c provides an overview of the complete system, while Figure 9b offers a detailed view of the hardware components. An architectural overview of the constructed system is depicted in Figure 9d, showcasing the input image source, storage device, and processing node powered by an Orange Pi board running the adapted YOLOv10 model.
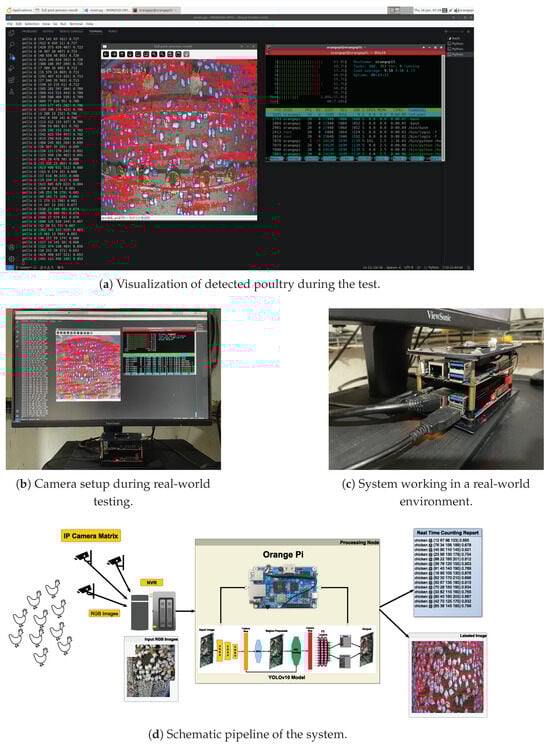
Figure 9.
The experimental setup employed for real-world testing. This setup runs on a non-Internet-connected network.
5. Discussion
The findings of this study emphasize the significant potential of integrating advanced AI models like YOLOv10 with edge computing for poultry monitoring. The evaluation of our system highlights its high precision and recall, demonstrating its applicability for real-world farm environments. However, a thorough discussion of its relevance, as well as comparisons with existing approaches, limitations, and future implications, is necessary.
5.1. Relevance of the Results
The ACMSPT system achieved a precision of 93.1% and recall of 93.0% for poultry detection and tracking, positioning it as a highly reliable tool for automated poultry monitoring. Similar AI-driven systems have been reported in the literature. For instance, Liu et al. (2021) developed a YOLOv4-based dead chicken detection system with a precision of 95.24% [], while in 2024, Sun et al. [] applied YOLOv5 for classified poultry counting, with an accuracy of 89.9% []. Our results align with these studies, confirming the system’s ability to address key challenges such as occlusions and variable lighting conditions.
The integration of edge computing plays a crucial role in real-time monitoring applications. Unlike traditional cloud-based architectures, which often introduce network latency, edge AI solutions can process data locally, reducing dependency on high-bandwidth networks []. This approach enhances the efficiency of automated livestock monitoring, making it a viable solution for farms in resource-limited settings [].
5.2. Comparison with Previous Studies
Existing poultry monitoring solutions primarily rely on cloud-based architectures, which can introduce latency and require robust network infrastructure. Ren et al. (2020) emphasized the need for real-time processing in poultry automation, stating that cloud-based methods often face delays []. Our approach significantly improves upon these issues by achieving an inference time of less than 200 milliseconds, outperforming cloud-based alternatives which range between 500 and 1000 milliseconds [].
Furthermore, alternative deep learning models, such as Faster R-CNN and SSD, have been used for poultry monitoring, but their computational demands are significantly higher []. In contrast, YOLO-based models, particularly YOLOv10, provide a balance between speed and accuracy, making them more practical for real-time edge computing applications, as shown in Table 3 where several architectures are compared with the results obtained by the ACMSPT approach.
Table 3.
Comparison of poultry monitoring approaches.
5.3. Implications for Poultry Welfare and Productivity
Automated monitoring systems have been recognized for their potential to enhance poultry welfare. AI-based behavioral analysis tools can identify anomalies in movement patterns, which may indicate health concerns. Mohialdin et al. (2023) demonstrated that real-time tracking and analysis of chicken behavior contribute to early disease detection and improved flock management []. Furthermore, AI-driven environmental control has been shown to optimize conditions such as temperature, ventilation, and humidity, thereby reducing stress and improving growth rates [].
Additionally, studies have explored the impact of stocking density on poultry health. Kim et al. (2025) [] reported that increasing the available space per bird positively influenced weight gain and gut microbiome health, highlighting the importance of precision monitoring to optimize space utilization []. Our system’s ability to provide real-time tracking supports precision agriculture strategies that enhance poultry welfare while maintaining operational efficiency.
5.4. Limitations and Future Research
While the ACMSPT system has demonstrated promising results, several limitations should be addressed. The dataset used for model training was limited to a specific farm environment. To improve generalizability, future research should expand the dataset to include different lighting conditions, poultry breeds, and environmental settings.
Another limitation concerns hardware scalability. Although the Orange Pi 5B provides a cost-effective edge computing platform, larger-scale farms may require more powerful hardware solutions, such as NVIDIA Jetson or FPGA-based implementations []. Future research should explore the trade-offs between computational efficiency and scalability to optimize system performance for large-scale applications.
Furthermore, while the current system focuses on tracking and counting, integrating predictive analytics for disease detection would enhance its functionality. Recent studies on gut microbiome analysis suggest that microbiome composition can serve as an early indicator of poultry health []. Incorporating such data sources could improve early intervention strategies and reduce disease-related losses in poultry farming.
5.5. Section Conclusion
This study contributes to AI-driven livestock management by demonstrating the feasibility of a low-latency, edge AI-based poultry monitoring system. By leveraging YOLOv10 and edge computing, ACMSPT achieves real-time poultry tracking with high precision and recall, outperforming conventional monitoring approaches. The system’s advantages in speed, scalability, and operational autonomy make it a viable solution for modern poultry farming.
Future work should focus on expanding dataset diversity, integrating predictive analytics for disease detection, and optimizing hardware for large-scale deployment. With continued advancements in AI and IoT, automated livestock monitoring systems hold significant potential to revolutionize the agricultural industry.
6. Conclusions
The proposed and implemented automated monitoring system based on artificial intelligence and edge computing has proven to be an effective and efficient tool for managing chicken populations on poultry farms. Its main benefits include the ability to perform accurate real-time counts, identify movement patterns, and issue alerts for abnormal behaviors, enabling timely interventions. Additionally, the system reduces reliance on human resources and operational costs while enhancing animal welfare through constant monitoring.
In the future, the system could benefit from the integration of additional sensors to evaluate environmental parameters such as temperature and humidity, providing a more comprehensive view of farm conditions. Moreover, the implementation of more advanced AI models could improve the system’s accuracy in complex environments. Exploring ways to miniaturize the hardware could also make the technology more accessible for small farms, while integrating predictive capabilities could help anticipate health or behavioral issues.
This work contributes to the advancement of technologies applied to the agribusiness sector, offering an innovative and scalable solution for automated animal monitoring on farms. By combining artificial intelligence, edge computing, and IoT, the system not only enhances operational efficiency but also establishes a sustainable and replicable model for other applications in precision agriculture. Furthermore, it promotes a transition toward more modern and responsible practices in the agricultural industry, improving sustainability and animal welfare.
Author Contributions
E.C. and M.H.-R.: These authors contributed equally to this work. E.C.: conceptualization, funding acquisition, project administration, resources, software, writing—original draft, and writing—review and editing. M.H.-R.: Conceptualization, software, data curation, formal analysis, methodology, writing—original draft, and writing—review and editing. A.M.A.-R.: resources, validation, supervision, and writing—review and editing. J.C.R.: investigation, data curation, visualization, and writing—original draft. K.B.: validation, formal analysis, and writing—review and editing. F.G.-O.: formal analysis, investigation, visualization, and writing—review and editing. All authors have read and agreed to the published version of the manuscript.
Funding
This research was funded by Project IDDS22-28 of the National Secretariat for Science, Technology, and Innovation (SENACYT), Panama. José Carlos Rangel and Edmanuel Cruz were supported by SENACYT’s National Research System (SNI). Keyla Boniche received a scholarship from SENACYT’s Program for the Strengthening of National Graduate Programs for a Master’s Degree in Mechanical Engineering Sciences.
Institutional Review Board Statement
Not applicable.
Data Availability Statement
Data are available upon request due to restrictions.
Acknowledgments
The authors thank the IDDS Program and the National Research System (SNI) of SENACYT, as well as CEMCIT, the Veraguas Regional Center of the Universidad Tecnológica de Panamá, and Agropecuaria El Buen Pastor, for their invaluable support.
Conflicts of Interest
The authors declare that the research was conducted in the absence of any commercial or financial relationships that could be construed as a potential conflicts of interest.
References
- Baktir, A.C.; Ozgovde, A.; Ersoy, C. How Can Edge Computing Benefit From Software-Defined Networking: A Survey, Use Cases, and Future Directions. IEEE Commun. Surv. Tutorials 2017, 19, 2359–2391. [Google Scholar] [CrossRef]
- Katz, Y. Manufacturing an Artificial Intelligence Revolution. 2017. Available online: https://dash.harvard.edu/handle/1/37370311 (accessed on 3 March 2025).
- Wu, Y.; Yang, Z.; Liu, Y. Internet-of-things-based multiple-sensor monitoring system for soil information diagnosis using a smartphone. Micromachines 2023, 14, 1395. [Google Scholar] [CrossRef] [PubMed]
- Paramathma, M.K.; Kumar, I.B.; Karuppasamypandiyan, M. YOLO Based Automatic Poultry Monitoring System. In Proceedings of the 2024 3rd International Conference for Advancement in Technology (ICONAT), GOA, India, 6–8 September 2024. [Google Scholar] [CrossRef]
- Vidya, N.L.; Meghana, M.; Ravi, P.; Kumar, N. Virtual Fencing using Yolo Framework in Agriculture Field. In Proceedings of the 2021 Third International Conference on Intelligent Communication Technologies and Virtual Mobile Networks (ICICV), Tirunelveli, India, 4–6 February 2021; pp. 441–446. [Google Scholar] [CrossRef]
- Flora, G.D.; Sandhiya, R.; Santhiya, P.; Sindhu, G.; Sribavathaarani, K.; Ramani, U. Smart Monitoring Instrumentation Design for Poultry Farmhouse. In Proceedings of the 2022 7th International Conference on Communication and Electronics Systems (ICCES), Coimbatore, India, 22–24 June 2022; pp. 1551–1554. [Google Scholar] [CrossRef]
- Kasparaviciene, B.; Novoslavskij, A.; Aksomaitiene, J.; Stankeviciene, J.; Kasetiene, N.; Sinkevicius, R.; Malakauskas, M. Prevalence and Antimicrobial Resistance of ESBL E. coli in Early Broiler Production Stage and Farm Environment in Lithuania. Microorganisms 2025, 13, 425. [Google Scholar] [CrossRef]
- Nair, A.; Doijad, S.P.; Suryavanshi, M.V.; Dey, A.; Singh Malik, S.V.; Dutilh, B.E.; Barbuddhe, S.B. Unveiling the Kadaknath Gut Microbiome: Early Growth Phase Spatiotemporal Diversity. Microbiol. Res. 2025, 16, 54. [Google Scholar] [CrossRef]
- Mehdizadeh, S.A.; Siriani, A.L.R.; Pereira, D.F. Optimizing Deep Learning Algorithms for Effective Chicken Tracking through Image Processing. AgriEngineering 2024, 6, 2749–2767. [Google Scholar] [CrossRef]
- Liu, H.; Chen, C.; Tsai, Y.; Hsieh, K.; Lin, H. Identifying Images of Dead Chickens with a Chicken Removal System Integrated with a Deep Learning Algorithm. Sensors 2021, 21, 3579. [Google Scholar] [CrossRef]
- Bist, R.B.; Bist, K.; Poudel, S.; Subedi, D.; Yang, X.; Paneru, B.; Mani, S.; Wang, D.; Chai, L. Sustainable poultry farming practices: A critical review of current strategies and future prospects. Poult. Sci. 2024, 103, 104295. [Google Scholar] [CrossRef]
- Rao, D.R.S. Trends and challenges of poultry industry. Int. J. Eng. Technol. Manag. Res. 2015, 1, 8–13. [Google Scholar]
- Rowe, E.; Dawkins, M.S.; Gebhardt-Henrich, S.G. A Systematic Review of Precision Livestock Farming in the Poultry Sector: Is Technology Focused on Improving Bird Welfare? Animals 2019, 9, 614. [Google Scholar] [CrossRef]
- Fritz, S.; See, L.; Bayas, J.C.L.; Waldner, F.; Jacques, D.; Becker-Reshef, I.; Whitcraft, A.; Baruth, B.; Bonifacio, R.; Crutchfield, J.; et al. A comparison of global agricultural monitoring systems and current gaps. Agric. Syst. 2018, 168, 258–272. [Google Scholar] [CrossRef]
- Moura, D.J.; Nääs, I.A.; Pereira, D.F.; Silva, R.B.T.R.; Camargo, G.A. Animal Welfare Concepts and Strategy for Poultry Production: A Review. Braz. J. Poult. Sci. 2006, 8, 137–148. [Google Scholar] [CrossRef]
- Kim, E.B.; Choi, S.; Park, J.; Xuan, B. Effects of Increased Housing Space Without Altering Stocking Density on Body Weight, Stress, and Gut Microbiome in Broiler Chickens. Animals 2025, 15, 441. [Google Scholar] [CrossRef]
- Zhang, X.; Cao, Z.; Dong, W. Overview of Edge Computing in the Agricultural Internet of Things: Key Technologies, Applications, Challenges. IEEE Access 2020, 8, 141748–141759. [Google Scholar] [CrossRef]
- Akhtar, M.N.; Shaikh, A.J.; Khan, A.; Awais, H.; Bakar, E.A.; Othman, A.R. Smart Sensing with Edge Computing in Precision Agriculture for Soil Assessment and Heavy Metal Monitoring: A Review. Agriculture 2021, 11, 475. [Google Scholar] [CrossRef]
- Javaid, M.; Haleem, A.; Khan, I.H.; Suman, R. Understanding the Potential Applications of Artificial Intelligence in Agriculture Sector. Adv. Agrochem. 2023, 2, 15–30. [Google Scholar] [CrossRef]
- Ren, G.; Lin, T.; Ying, Y.; Chowdhary, G.; Ting, K. Agricultural robotics research applicable to poultry production: A review. Comput. Electron. Agric. 2020, 169, 105216. [Google Scholar] [CrossRef]
- Gardezi, M.; Joshi, B.; Rizzo, D.M.; Ryan, M.; Prutzer, E.; Brugler, S.; Dadkhah, A. Artificial Intelligence in Farming: Challenges and Opportunities for Building Trust. Agron. J. 2023, 116, 1217–1228. [Google Scholar] [CrossRef]
- Kaleem, A.; Hussain, S.; Aqib, M.; Cheema, M.J.M.; Saleem, S.R.; Farooq, U. Development Challenges of Fruit-Harvesting Robotic Arms: A Critical Review. AgriEngineering 2023, 5, 2216–2237. [Google Scholar] [CrossRef]
- Khan, H.A.; Farooq, U.; Saleem, S.R.; Rehman, U.u.; Tahir, M.N.; Iqbal, T.; Cheema, M.J.M.; Aslam, M.A.; Hussain, S. Design and development of machine vision robotic arm for vegetable crops in hydroponics. Smart Agric. Technol. 2024, 9, 100628. [Google Scholar] [CrossRef]
- Kalyani, Y.; Collier, R. A Systematic Survey on the Role of Cloud, Fog, and Edge Computing Combination in Smart Agriculture. Sensors 2021, 21, 5922. [Google Scholar] [CrossRef]
- Redmon, J.; Divvala, S.; Girshick, R.; Farhadi, A. You Only Look Once: Unified, Real-Time Object Detection. In Proceedings of the IEEE Conference on Computer Vision and Pattern Recognition (CVPR), Las Vegas, NV, USA, 27–30 June 2016. [Google Scholar]
- Ren, S.; He, K.; Girshick, R.; Sun, J. Faster R-CNN: Towards Real-Time Object Detection with Region Proposal Networks. IEEE Trans. Pattern Anal. Mach. Intell. 2017, 39, 1137–1149. [Google Scholar] [CrossRef] [PubMed]
- Sun, E.; Xiao, Z.; Yuan, F.; Wang, Z.; Ma, G.; Liu, J. Method of Classified Counting of Mixed Breeding Chickens Based on YOLOV5. In Proceedings of the 2023 42nd Chinese Control Conference (CCC), Tianjin, China, 24–26 July 2023. [Google Scholar] [CrossRef]
- Zhang, X.; He, K.; Zhao, M.; Jin, X. Object Detection Method and its Application Based on YOLOv5. In Proceedings of the 2023 2nd International Conference on Artificial Intelligence, Human-Computer Interaction and Robotics (AIHCIR), Tianjin, China, 8–10 December 2023; pp. 441–445. [Google Scholar]
- Neethirajan, S. ChickTrack—A quantitative tracking tool for measuring chicken activity. Measurement 2022, 191, 110819. [Google Scholar] [CrossRef]
- Hewe, T.R.A.; Mondia, K.M.J.; Empas, P.E.G. Advancing Poultry Farming Efficiency Through YOLOv5 and Image Regression-Based Broiler Weight Estimation. In Proceedings of the 2024 15th International Conference on Information and Communication Technology Convergence (ICTC), Jeju Island, Republic of Korea, 16–18 October 2024; pp. 7–12. [Google Scholar] [CrossRef]
- Ali, W.; Ud Din, I.; Almogren, A.; Rodrigues, J.J.P.C. Poultry Health Monitoring With Advanced Imaging: Toward Next-Generation Agricultural Applications in Consumer Electronics. IEEE Trans. Consum. Electron. 2024, 70, 7147–7154. [Google Scholar] [CrossRef]
- Chemme, K.S.; Alitappeh, R.J. An End-to-End Model for Chicken Detection in a Cluttered Environment. In Proceedings of the 2024 13th Iranian/3rd International Machine Vision and Image Processing Conference (MVIP), Tehran, Iran, 6–7 March 2024; pp. 1–7. [Google Scholar] [CrossRef]
- Elmessery, W.M.; Gutiérrez, J.; Abd El-Wahhab, G.G.; Elkhaiat, I.A.; El-Soaly, I.S.; Alhag, S.K.; Al-Shuraym, L.A.; Akela, M.A.; Moghanm, F.S.; Abdelshafie, M.F. YOLO-Based Model for Automatic Detection of Broiler Pathological Phenomena through Visual and Thermal Images in Intensive Poultry Houses. Agriculture 2023, 13, 1527. [Google Scholar] [CrossRef]
- Yang, X.; Bist, R.B.; Paneru, B.; Chai, L. Deep Learning Methods for Tracking the Locomotion of Individual Chickens. Animals 2024, 14, 911. [Google Scholar] [CrossRef]
- Cruz, E.; Hidalgo-Rodriguez, M.; Acosta-Reyes, A.M.; Rangel, J.C.; Boniche, K. AI-Based Monitoring for Enhanced Poultry Flock Management. Agriculture 2024, 14, 2187. [Google Scholar] [CrossRef]
- Subedi, K.; Sharma, S.; Paneru, P. IoT Based Smart Poultry Management System. Int. J. Electron. Commun. Eng. 2023, 12, 45–53. [Google Scholar] [CrossRef]
- Sangeetha, M.K.; Kanthimathi, D.M.; Monisha, S.R.; Reethika, M.; Amirthabowmiya, M. Poultry Farm Control and Management System Using Wireless Sensor Networks. In Proceedings of the IEEE 2nd International Symposium on Telecommunication Technologies (ISTT), Chennai, India, 9–10 November 2014. [Google Scholar] [CrossRef]
- Čakić, S.; Popović, T.; Krčo, S.; Nedić, D.; Babić, D. Developing Object Detection Models for Camera Applications in Smart Poultry Farms. In Proceedings of the 2022 IEEE International Conference on Omni-Layer Intelligent Systems (COINS), Barcelona, Spain, 1–3 August 2022. [Google Scholar] [CrossRef]
- Ali, M.L.; Zhang, Z. The YOLO Framework: A Comprehensive Review of Evolution, Applications, and Benchmarks in Object Detection. Computers 2024, 13, 336. [Google Scholar] [CrossRef]
- Alif, M.A.R.; Hussain, M. YOLOv1 to YOLOv10: A comprehensive review of YOLO variants and their application in the agricultural domain. arXiv 2024, arXiv:2406.10139. [Google Scholar]
- Carvalho, G.; Cabral, B.; Pereira, V.; Bernardino, J. Edge computing: Current trends, research challenges and future directions. Computing 2021, 103, 993–1023. [Google Scholar] [CrossRef]
- Terven, J.R.; Cordova-Esparza, D.M. A Comprehensive Review of YOLO Architectures in Computer Vision: From YOLOv1 to YOLOv10 and YOLO-NAS. arXiv 2024, arXiv:2304.00501. [Google Scholar]
- MacPherson, J.; Voglhuber-Slavinsky, A.; Olbrisch, M.; Schöbel, P.; Dönitz, E.; Mouratiadou, I.; Helming, K. Future agricultural systems and the role of digitalization for achieving sustainability goals. Agron. Sustain. Dev. 2022, 42, 70. [Google Scholar] [CrossRef] [PubMed]
- Neethirajan, S. Artificial Intelligence and Sensor Innovations: Enhancing Livestock Welfare with a Human-Centric Approach. Hum.-Centric Intell. Syst. 2023, 4, 77–92. [Google Scholar] [CrossRef]
- Feng, L.; Tung, F.; Ahmed, M.O.; Bengio, Y.; Hajimirsadegh, H. Were RNNs All We Needed? arXiv 2024, arXiv:2410.01201. [Google Scholar]
- Yaseen, M. What is YOLOv10: An In-Depth Exploration of the Internal Features of the Next-Generation Object Detector. arXiv 2024, arXiv:2408.15857. [Google Scholar]
- Tzutalin. LabelImg. 2015. Available online: https://github.com/tzutalin/labelImg (accessed on 15 April 2024).
- Gao, Y.; Xiong, Y.; Gao, X.; Jia, K.; Pan, J.; Bi, Y.; Dai, Y.; Sun, J.; Wang, M.; Wang, H. Retrieval-Augmented Generation for Large Language Models: A Survey. arXiv 2023, arXiv:2312.10997. [Google Scholar]
- Q-engineering. Qengineering/YoloV10-NPU. 2025. Available online: https://github.com/Qengineering/YoloV10-NPU (accessed on 3 March 2025).
- Ultralytics. Despliegue de Ultralytics YOLO11 en Rockchip Para una IA de Borde Eficiente. 2025. Available online: https://www.ultralytics.com/es/blog/deploy-ultralytics-yolo11-on-rockship-for-efficient-edge-ai (accessed on 1 October 2024).
- Ultralytics. Rockchip RKNN. 2025. Available online: https://docs.ultralytics.com/es/integrations/rockchip-rknn (accessed on 2 October 2024).
- airockchip. airockchip/yolov10. 2024. Available online: https://github.com/airockchip/yolov10 (accessed on 2 October 2024).
- airockchip. airockchip/rknn_model_zoo. 2025. Available online: https://github.com/airockchip/rknn_model_zoo (accessed on 2 October 2024).
- Mohialdin, A.; Elbarrany, A.; Atia, A. Chicken Behavior Analysis for Surveillance in Poultry Farms. Int. J. Adv. Comput. Sci. Appl. 2023, 14, 935–942. [Google Scholar] [CrossRef]
- Taleb, H.M.; Mahrose, K.; Abdel-Halim, A.A.; Kasem, H.; Ramadan, G.S.; Fouad, A.M.; Khafaga, A.F.; Khalifa, N.E.; Kamal, M.; Salem, H.M.; et al. Using Artificial Intelligence to Improve Poultry Productivity—A Review. Ann. Anim. Sci. 2025, 25, 23–33. [Google Scholar] [CrossRef]
Disclaimer/Publisher’s Note: The statements, opinions and data contained in all publications are solely those of the individual author(s) and contributor(s) and not of MDPI and/or the editor(s). MDPI and/or the editor(s) disclaim responsibility for any injury to people or property resulting from any ideas, methods, instructions or products referred to in the content. |
© 2025 by the authors. Licensee MDPI, Basel, Switzerland. This article is an open access article distributed under the terms and conditions of the Creative Commons Attribution (CC BY) license (https://creativecommons.org/licenses/by/4.0/).