Abstract
Egyptian cotton fibres have worldwide recognition due to their distinct quality and luxurious textile products known by the “Egyptian Cotton“ label. However, cotton fibre trading in Egypt still depends on human grading of cotton quality, which is resource-intensive and faces challenges in terms of subjectivity and expertise requirements. This study investigates colour vision and transfer learning to classify the grade of five long (Giza 86, Giza 90, and Giza 94) and extra-long (Giza 87 and Giza 96) staple cotton cultivars. Five Convolutional Neural networks (CNNs)—AlexNet, GoogleNet, SqueezeNet, VGG16, and VGG19—were fine-tuned, optimised, and tested on independent datasets. The highest classifications were 75.7%, 85.0%, 80.0%, 77.1%, and 90.0% for Giza 86, Giza 87, Giza 90, Giza 94, and Giza 96, respectively, with F1-Scores ranging from 51.9–100%, 66.7–100%, 42.9–100%, 40.0–100%, and 80.0–100%. Among the CNNs, AlexNet, GoogleNet, and VGG19 outperformed the others. Fused CNN models further improved classification accuracy by up to 7.2% for all cultivars except Giza 87. These results demonstrate the feasibility of developing a fast, low-cost, and low-skilled vision system that overcomes the inconsistencies and limitations of manual grading in the early stages of cotton fibre trading in Egypt.
Keywords:
Egyptian cotton; transfer learning; pre-trained CNN; computer vision; AlexNet; GoogleNet; VGG16; VGG19; SqueezeNet 1. Introduction
1.1. Why Egyptian Cotton Fibres?
Cotton as a crop (Gossypium hirsutum) originated in Mexico and Central America and is the source of cotton fibres, which are cellulosic or polysaccharide fibres [1,2]. The world cotton production in 2020 was 24.2 million tonnes, of which India, China, the USA, Brazil, and Pakistan accounted for more than 79.3% [3]. Egypt has a relatively long history of planting cotton, which started as early as the nineteenth century. Although Egypt’s cotton production accounts for less than 0.5% of the world’s production in 2020, it has a global reputation for high quality. Egypt is mainly distinguished in producing long and extra-long staple cotton cultivars [4]. The long staple cultivars have a fibre length of 14/16 to 15/16 inches (22.2 to 23.8 mm), whereas the extra-long staple has a fibre length of 20/16 to 25/16 inch (31.8 to 39.7 mm) [2]. Long and extra-long cotton fibres produce more durable and high-quality textiles and fabrics, especially in terms of strength and softness [5].
1.2. Quality Attributes of Cotton Lint in General and Egyptian Cotton Fibre in Particular
Cotton classification refers to the systematic approach by which standard criteria are applied to assess the physical properties of cotton fibres, which consequently affect the quality of the final textile products [2]. Assessment of cotton fibre quality is a critical factor influencing subsequent processing (ginning, cleaning, yarning, dyeing, and textile manufacturing) as well as trade value. The quality of cotton fibres can be quantitatively and/or qualitatively evaluated based on several attributes, including micronaire (indication of fineness), maturity, length, strength, colour, trash content, spinning consistency index, and moisture [1]. These traits are affected by the cultivar as well as the environmental conditions during growing, making quality assessment challenging.
Micronaire instruments mainly use changes in airflow rate when passing through a known weight of cotton fibres as an indication of the linear density and maturity of the fibres. Cotton bales with micronaire values lower than 3.5 are considered immature, whereas those higher than 4.9 are considered mature and coarse [1]. The length of cotton fibre is measured based on the distance between the two ends of a fibre under a standard tensile stress, and this relates to the energy required for yarning and the quality of the yarned product [5]. The colour of cotton fibres is measured by the degree of reflectance and the yellowness (i.e., pigmentation) (+b* in CIE LAB colour space). Classifying cotton fibres is conducted via machines, amongst which are the High-Volume Instruments (HVI) by Uster Technologies, the most common equipment used and introduced to the market during the 1960s [1]. However, manual assessment is still common throughout the industry.
The US cotton fibre grading standard developed by the USDA differs from the Egyptian one and is based on fibre length, length uniformity, fibre strength, micronaire, colour grade, trash content, and leaf grade. While these standards are similar for the Upland and Pima cotton fibres, they differ in colour grade as the latter is deeper yellow than the former [1]. Egyptian cotton passes through multiple production stages, starting with hand-picking, as mechanical harvesting is not allowed until the technological quality properties are evaluated using the HVI [6].
Human assessors usually implement cotton grading in Egypt at several stages through the value chain. Human assessors at the aggregating hubs in the producing governorates conduct a manual classification of the raw cotton (i.e., the fibre attached to the seeds) before and after ginning, whereas the HVI is usually used as a final testing procedure [6]. There are two types of cotton fibre assessors in Egypt: the first is hired by the Ministry of Agriculture or agricultural cooperatives and is responsible for monitoring harvesting, field classing, storing, and transporting the raw cotton to the aggregating hubs. The second type is hired by the Cotton Arbitration and Testing General Organisation (CATGO) and is responsible for monitoring raw cotton fibres (before ginning) adulteration, moisture content, supervising the ginning process, and labelling the batches of raw and ginned cotton, sampling ginned fibres to be tested for moisture and HVI. Other assessors belong to the trade and exporting companies and ginning companies [6]. Cotton handling in Egypt is a complicated process, and human errors are likely to occur due to multiple levels and stages of human involvement in assessing raw and ginned fibre quality, in addition to the degradation of assessors’ performance, bias, and the classification environmental conditions, especially lightening [6,7].
While the classification of raw cotton is a fast and approximate process to assess the quality and grade of the ginned fibres, human errors lead to false determination of the grade and, consequently, inaccurate estimation of the profit for the growers and other elements in the cotton production chain. Additionally, there is a noticeable shortage of human experts due to the degradation of the cotton industry in Egypt in the last three decades [8]. In general, the classification of raw cotton fibres in Egypt is based on the colour (white to cream), trash (leaf, soil, weeds’ seeds, and non-cotton strings) ratio, harvesting and postharvest handling and treatments [9]. The post-ginning grade is, in general, higher than the pre-ginning grade due to discarding some of the impurities associated with the former.
The classification of ginned fibres is based on the same criteria as that of raw cotton fibres, with the majority of the results achieved using HVI testing. There are eleven main grades of Egyptian cotton fibres, named from the highest to the lowest as Extra (E), Fully Good to Extra (FGE), Fully Good (FG), Good to Fully Good (GFG), Good (G), Fully Good Fair to Good (FGFG), Gully Good Fair (FGF), Good Fair to Fully Good Fair (GFFGF), Good Fair (GF), Fully Fair to Good Fair (FFGF), and Fully Fair (FF) with the Good as the base grade [10]. Additional sub-grades are located between each of the two consecutive main grades [9]. Fibre classing through human experts is significantly affected by a sample’s conditions (i.e., homogeneity, size, sampling procedure, assessor’s skills, experience, performance degradation with time, and bias, in addition to the assessor’s awareness of growing, and postharvest handling of the raw cotton fibres; and finally, the grading conditions, especially lighting [7].
1.3. Logistic Challenges in Egyptian Cotton Trade
Despite the globally recognised quality of Egyptian cotton fibres, production showed a significant decline from 224,000 tonnes in 2000 to 59,000 tonnes in 2020 [3]. Factors that led to this decrease are related to cultivation (i.e., the lack of certified seeds, increase in input costs, and low productivity) [8,11], handling due to the relatively long time taken for raw cotton to be classified, ginned, and then classified again, which led the growers selling their cotton as raw cotton resulting in lower profits [9], and marketing, which resulted from importing overseas cotton fibres and a smaller market share for Egyptian cotton [12]. Therefore, cotton growers in Egypt switched from to more profitable crops such as rice. Another logistical problem is that the authentication of fibres in Egypt is carried out at CATG, located in the Alexandria Governorate (Northwest of Egypt) [6,7], which creates difficulties for cotton traders in farther regions such as Upper Egypt governorates (Fayoum, Beni Suef, Minya, and Assiut), and Eastern governorates including Ismailia, Sharqia, and Dakahlia. Therefore, it is important to develop low-cost assessment technologies to determine the grade of the raw and/or ginned cotton fibres, which will save significant resources currently spent on handling and manually evaluating the cotton fibre grade. This is aligned with plans Egypt enacted in 2017 to improve cotton production and industry and establish value-added products [13]. Agriculture 4.0 is the application of digital tools in agricultural practices where sensors and machine learning produce data-driven models, which leads to more efficient utilisation of farming inputs and less human intervention [14]. However, digital technologies are still not well adopted in Egyptian agricultural systems, especially when incorporating sensors, GPS, modern farm machinery, cloud computing, and data-driven decision-making. Such deficiency is due to the relatively high cost, lack of government policies, training, digital infrastructure, and skilled personnel [15]. Therefore, there is a negative impact on cotton trading in Egypt through the inadequate deployment of cost-effective sensors to assess cotton fibre quality at the farmer and collection station levels.
1.4. Textile Fibre Quality Assessment Using Optical Sensors
Optical sensors have been used to assess various quality attributes of fresh and processed agricultural products [16]. The common optical sensors utilised in the agri-food domain, either inline or offline, include colour imaging (400–750 nm), visible and near-infrared (780–2500 nm) spectroscopy, hyperspectral and multispectral imaging, and Computer Tomography (CT) X-ray [16,17]. Colour imaging is a relatively low-cost sensing technology and was effectively deployed in agricultural domains for evaluating external quality traits such as colour, size, shape, surface texture, and defects [18]; yield [19]; in-field disease detection [20]; microstructure assessment of grains [21]; quality evaluation of meat cuts [22]; and the quality evaluation of cooked meats [23].
The application of optical sensors to assess the quality traits of cotton fibres was studied. A real-time RGB-based embedded vision system through a Raspberry Pi microcontroller coupled with an enhanced Canny operator for edge detection and YOLO V5 CNN was developed to estimate the impurity of cotton fibre samples [24]. The results showed that the accuracy of impurity identification was 97.3–98.9%, depending on the foreign material (bell housing, cotton branch, weeds, and blackjack). In a separate work, a commercial Automated Visual Inspection (AVI) system was utilised, and the acquired images were processed through a series of edge detection, denoising, and segmentation algorithms to evaluate pseudo-foreign materials within cotton fibres and the segmentation algorithm had an average processing time of 0.67 s per image [25]. VGGNet and PCANet deep learning algorithms and a Gabor filter were utilised for feature extraction, followed by Support Vector Machines (SVMs) for the classification of cotton fibre images graded through the US Upland cotton grading system, yielding a classification accuracy of 68.5–98.9% [26]. In another study, a multi-scaling CNN structure was used to detect six defects in fabrics, and the average accuracy and sensitivity were 96.6% and 96.4, respectively [27].
An online machine vision system was developed to identify foreign materials (cloth, feathers, hair, hemp rope, plastic film, and polypropylene twine) in cotton fibres [28]. Colour, shape, and texture features were extracted from three colour channels, i.e., R, G, and B, and classification was conducted through one-against-one directed acyclic graph multi-class SVM. Foreign materials were detected with an accuracy of 79.6–96.4%. CNN was used for classifying and separating foreign materials (i.e., polypropylene, mulch film, paper, feathers, cloth, transparent film, cotton seed, cotton stalk, and yellow cotton) from cotton using an automated offline machine vision system [29]. The Proposed CNN consisted of seven convolutional layers with two maximum pooling layers, one global pooling layer, and one softmax layer. Foreign materials were classified with an accuracy of 96.0–100%.
Other studies explored the utilisation of Near/Infrared (NIR) (1100–2300 nm) and Visible (Vis)/NIR hyperspectral imaging (400–1000 nm) for distinguishing between cotton fibres and six [30] and fifteen foreign materials [31], respectively. The study used Principal Component Analysis (PCA) for feature selection followed by Soft Independent Modelling of Class Analogy (SIMCA) and achieved 100% detection rates. The latter study concentrated on clustering using PCA followed by Multivariate Analysis of Variance (MANOVA) and achieved separated classes with few overlapping clusters. Visible/NIR hyperspectral imaging accompanied by 1D CNN was applied to classify textile fibres, resulting in a classification accuracy of 98.6% [32]. Additionally, UAV-collected and combined RGB and multispectral temporal data were investigated to assess cotton fibre quality in the field. ENVI-CNN was used for segmenting cotton, and a backpropagation (BP) network was implemented to predict fibre quality. The highest coefficient of determination (R2) was 80.6% [33]. In general, visible colour sensors provide lower-cost machine vision solutions for developing prediction models for external quality traits, making them more suitable for industrial applications than more expensive sensors such as spectroscopic systems.
1.5. Transfer Learning (TL)
Transfer Learning (TL) is based on applying the features learned in a certain domain (i.e., the source domain) to another domain (i.e., the target domain) [34]. TL mainly aims to improve the learning process and reduce data collection and labelling requirements [35]. TL can be categorised into homogenous, where the features and labels of the source and target are similar, and heterogeneous, where they are not [34]. Homogenous TL problems can be treated either through instance-based approaches where source samples are reweighed to compensate for the different marginal distribution between the two domains, feature-based approaches, which can be implemented either by asymmetric or symmetric feature transformation of one of the domains, and parameter-based approaches where ensemble learners are developed from the source domain to improve the learning of the target domain [36,37,38]. In image classification tasks, TL helps use low-level features (i.e., corners, colour, edges) learned from the source domain to segment objects in the target domain [35]. On the other hand, negative transfer learning is also a concern where the information learned from the source domain is not well-adapted in explaining the variability in the target domain, which obligates the study of the transferability between the two domains before implementing TL. It is worth stating that one of the key advantages of deep learning, including TL, is the less dependency on human intervention for feature engineering, which is a regular step in shallow machine learning techniques. The application of pre-trained CNNs for image classification was studied in different domains, including agriculture [39,40,41], medicine [42,43,44,45], and material science [46,47], among others.
Heterogeneous TL problems can be treated through feature-based approaches [48]. Cotton fibre classification in Egypt is still generally conducted by skilled personnel who are required to maintain the same performance over time, especially when classification is performed in gathering stations where sampling consistency is not guaranteed. Combining computer vision with TL will save time and enable more robust and generalised classification methods.
Despite the promising results obtained from the previous studies, there is no study that investigated the utilisation of TL as a deep learning technique for classifying Egyptian cotton fibres into their standard grades without the need for human-intensive feature extraction and optimisation associated with shallow machine learning algorithms, or the necessity of acquiring large imaging data sets. Therefore, the objective of this study is to investigate the potential for applying digital technologies in addressing a challenge that faces the agricultural systems in Egypt by developing classification models for Egyptian cotton fibres sourced from various cultivars using computer vision coupled with Transfer Learning (TL) based on pre-trained CNNs.
2. Materials and Methods
2.1. Materials
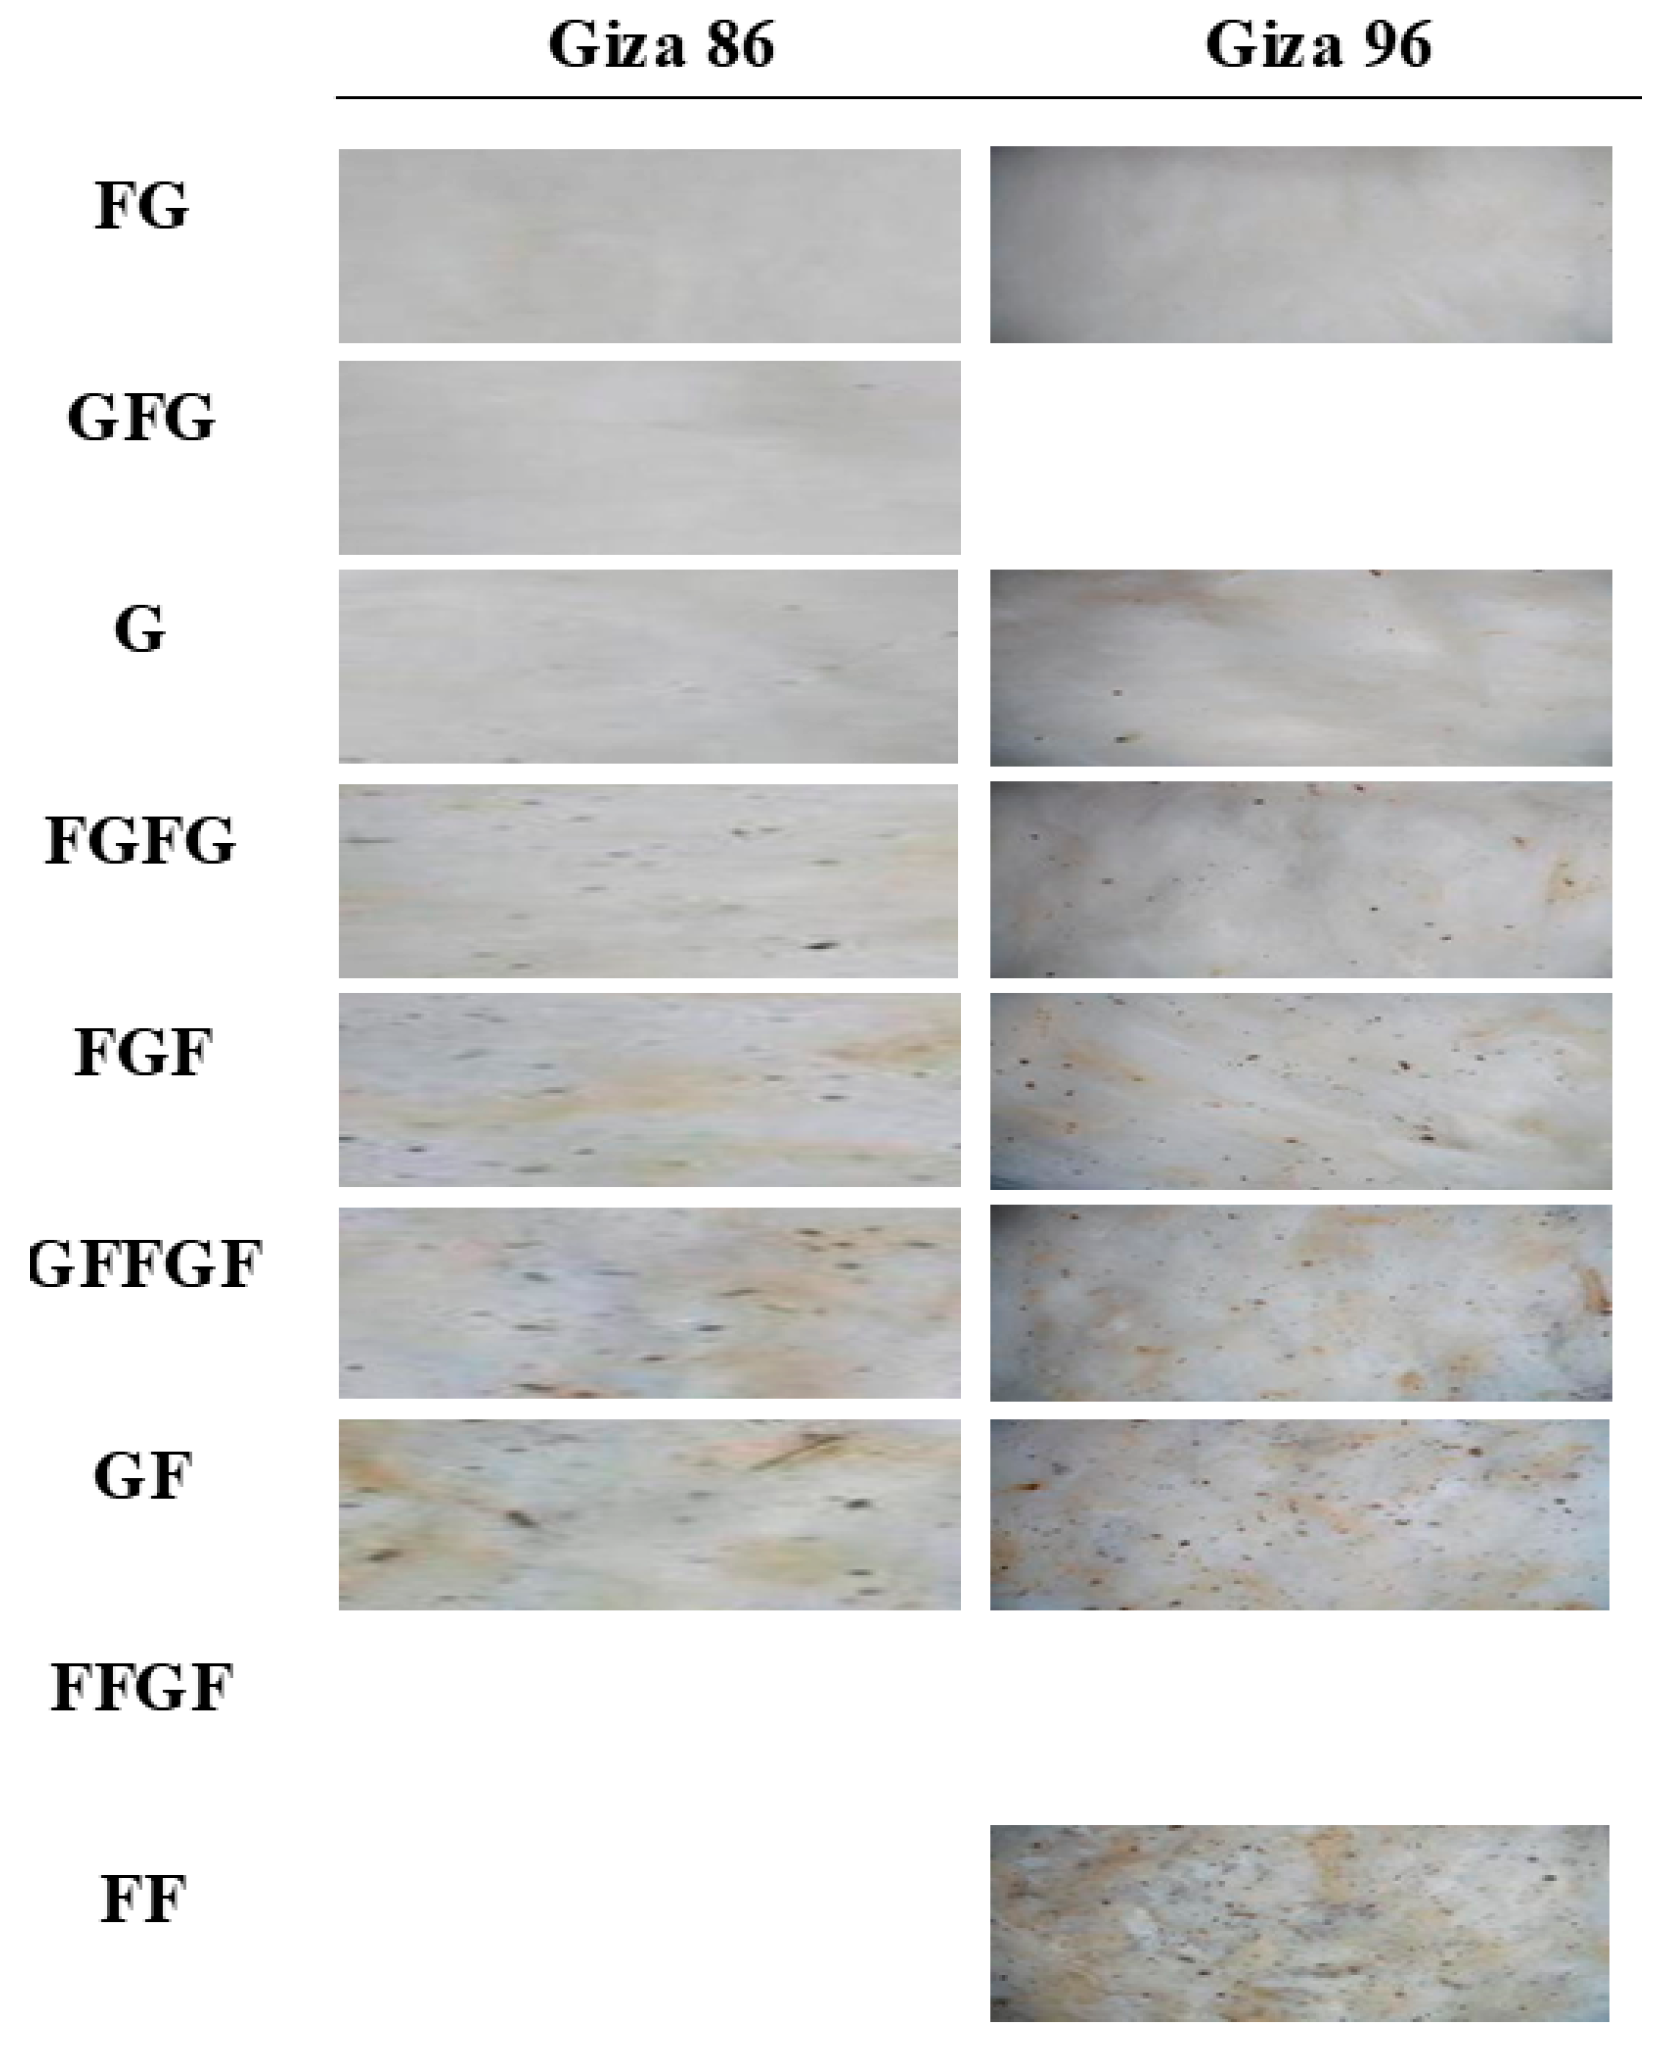
The ginned cotton samples tested in this study contained fibres authenticated and supplied by the Cotton Arbitration & Testing General Organisation (CATGO), Alexandria, Egypt, which is the only government authority responsible for officially grading cotton fibres in Egypt. Each sample was graded by CATGO’s experts into one of the eleven Egyptian cotton grades. The fibres were obtained from five Egyptian cultivars, including three long staple cultivars (Giza 86, Giza 90, and Giza 94) and two extra-long staple cultivars (Giza 87 and Giza 96). Due to the limited availability of samples, it was not possible to collect all eleven grades representing the standard Egyptian cotton fibres. Table 1 details the number of cotton samples for each Egyptian cultivar/grade, where the number of imaged samples was 3447. The basic colour of the cotton fibres studied is white for all cultivars except Giza 90, which has a cream colour. All tested samples are cultivated in the upper, delta and Eastern governorates in Egypt [9,10]. Samples were kept in wooden boxes with glass front sides except when imaged to prevent the samples from collecting dust and other impurities. Figure 1 shows examples of fibres from different cultivars evaluated in this study.

Table 1.
Summary of the number of long and extra-long staple Egyptian cotton fibre cultivars used in the study.

Figure 1.
Examples of different grades of cotton fibres’ images of Giza 86 (long staple) and Giza 96 (extra-long staple). Empty spaces refer to non-available samples in the grade.
2.2. Imaging System and Image Acquisition
Sample imaging was conducted on stationary samples using an RGB digital camera (Fujifilm A850, Fujifilm Corporation, Minato-ku, Tokyo, Japan). The camera has a coupled-charge device sensor, and the imaging configurations included an 11 cm vertical distance between the lens and the sample surface, 8 MP, auto-mode shutter speed, and no focus [10]. Each image had a size of 3264 × 2448 pixels and was saved in a Joint Photographic Experts Group (JPEG) format. The lighting system is composed of a square-shaped, 25.0 × 25.0 mm, dimmable Light Emitting Diode (LED) with 10 W power and was placed at the same vertical level as the camera.
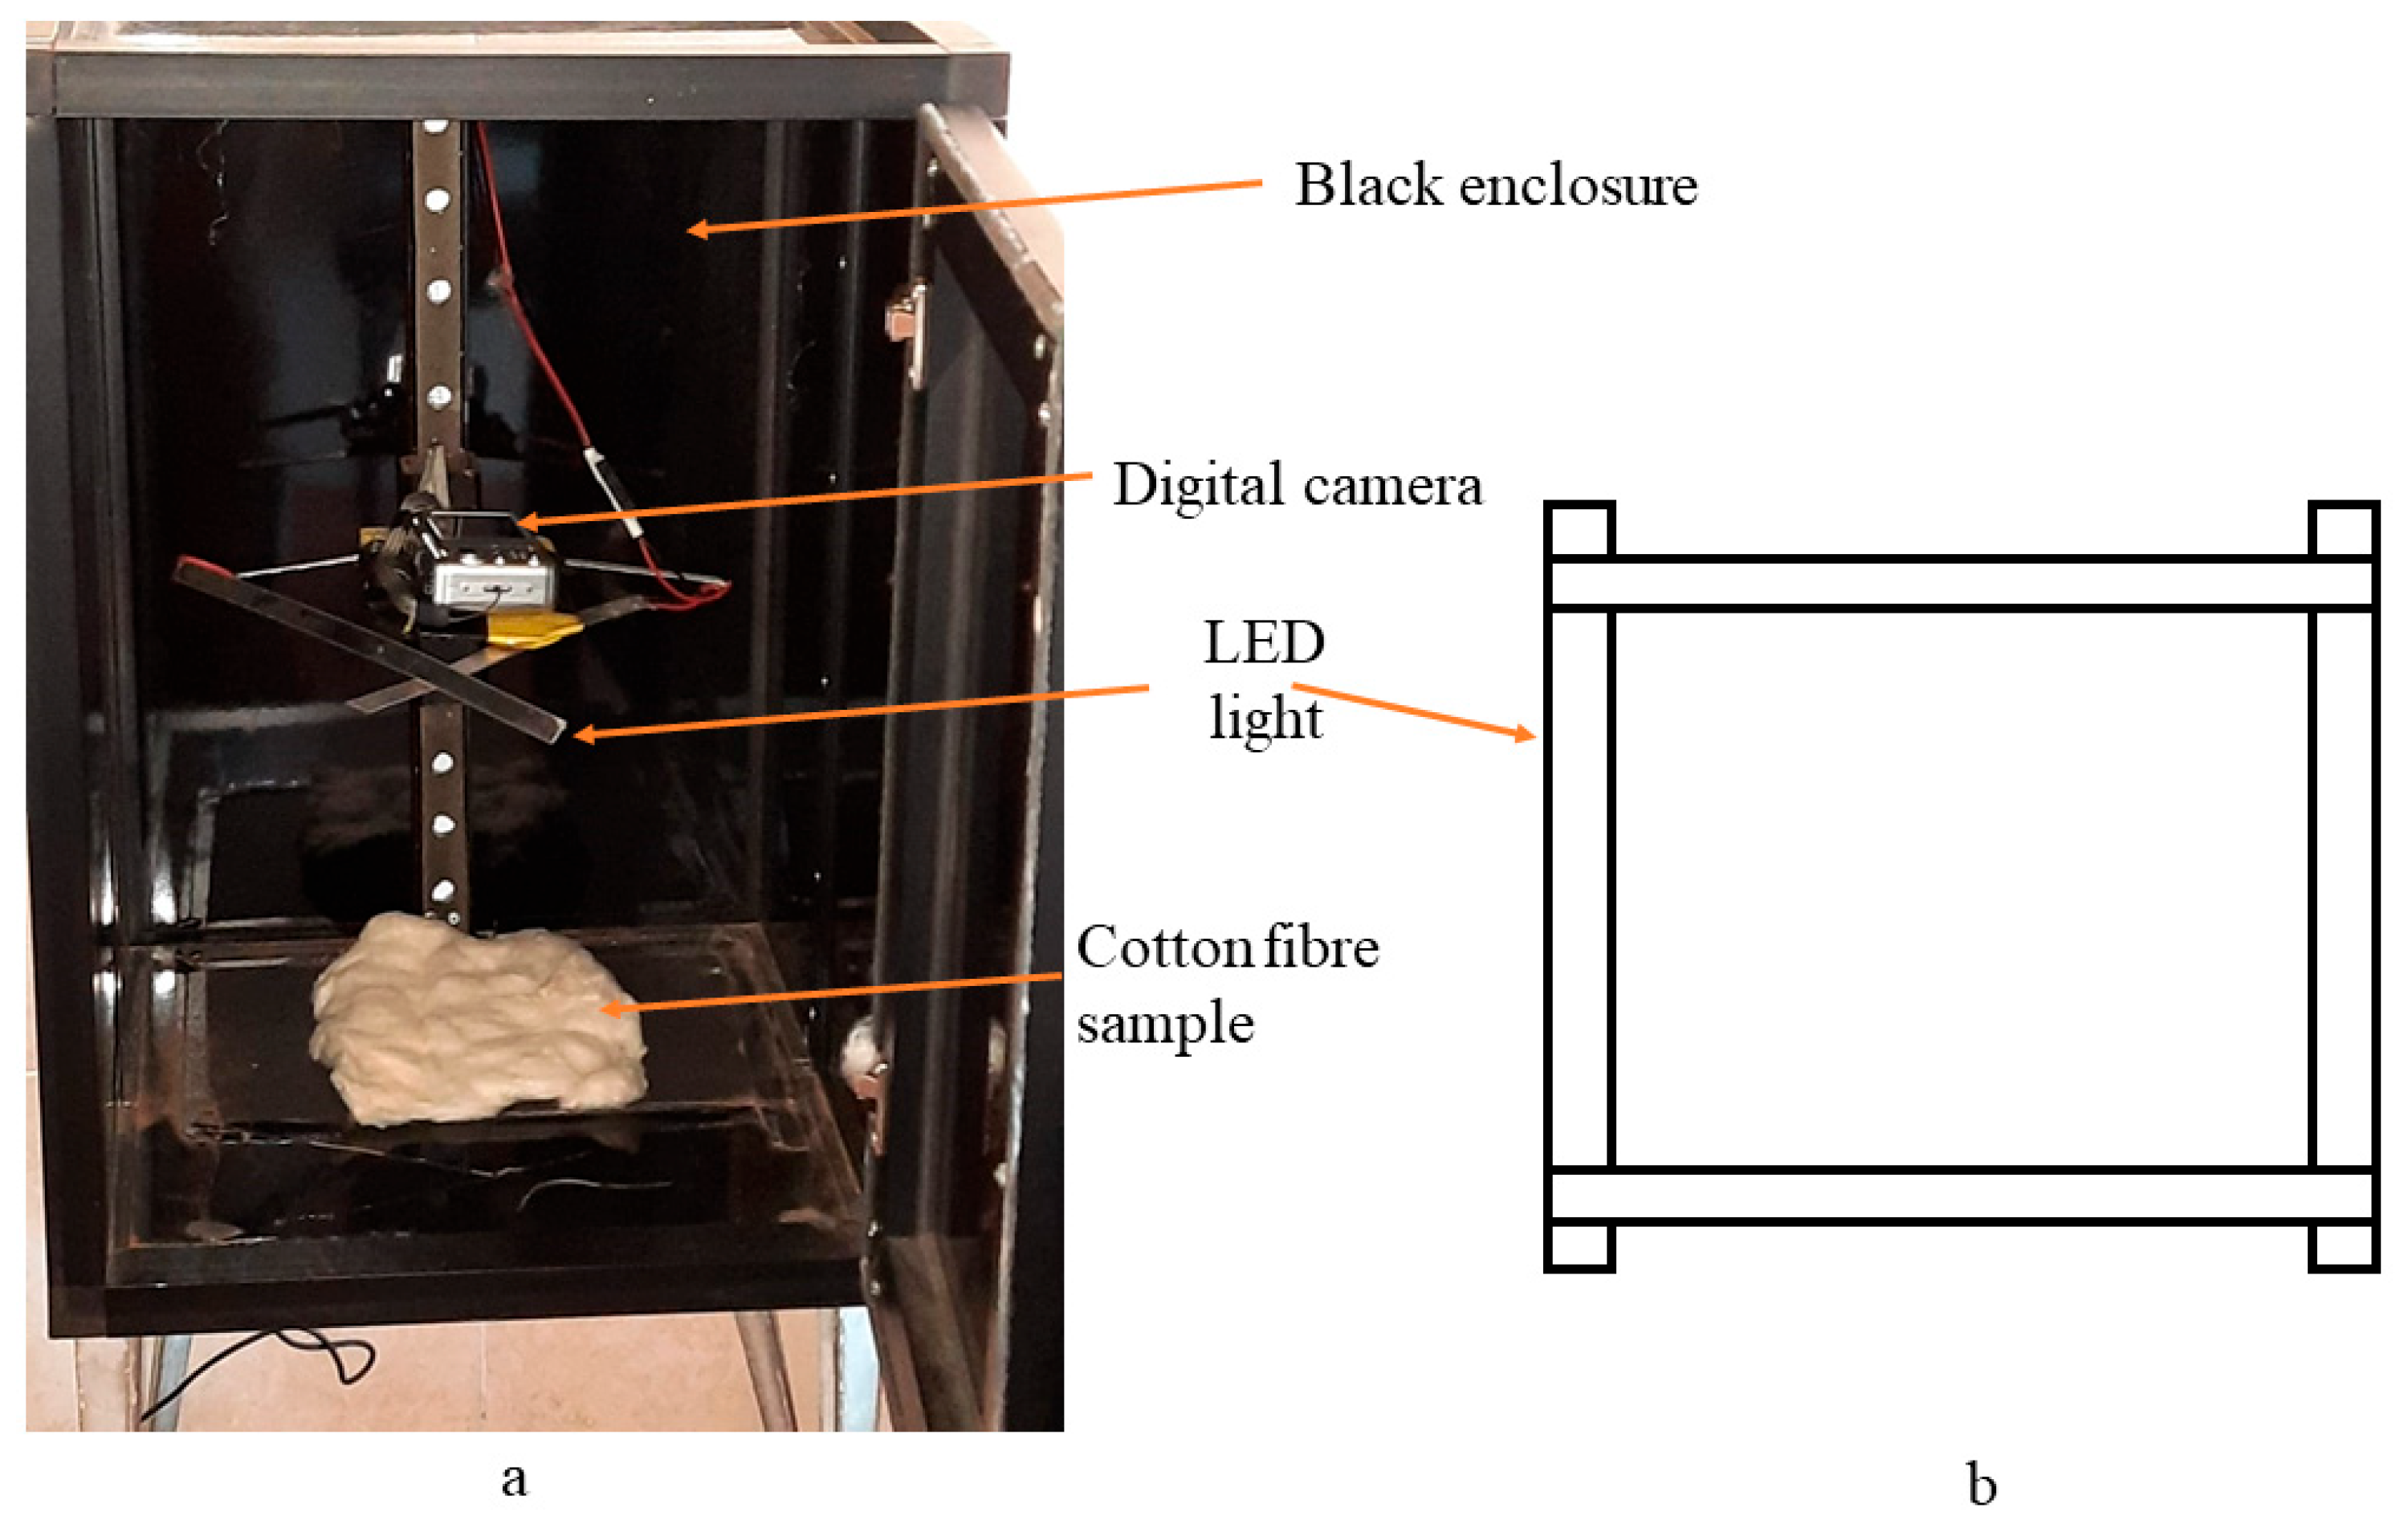
The lighting system was calibrated using a Samsung Galaxy M31 Smartphone (Samsung Group, Suwon-si, South Korea) by measuring the intensity 10 times and recording the average, which was 4879 lux. The camera and lightening system were placed in a black box measuring 54 × 40 × 40 cm with an aluminium frame and black Formica sides. Figure 2 shows the imaging system used to acquire the images. Each sample had approximate dimensions of 18 × 10 × 4 cm and was placed under the camera, as shown in Figure 2a, and the stored images were transferred from the flash memory to the PC for further analysis.
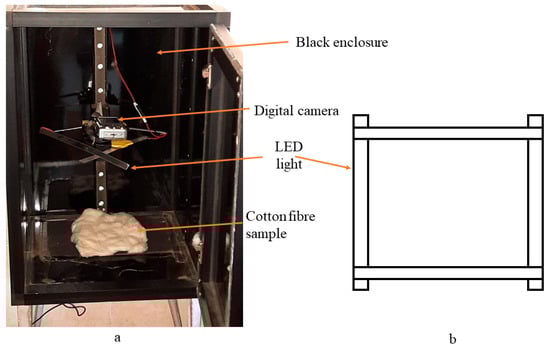
Figure 2.
(a) The system used for acquiring images of Egyptian cotton fibres and (b) the lighting system.
2.3. Transfer Learning
Transfer learning conducted in this study was based on the fine-tuning of pre-trained CNNs, which utilise a pre-trained neural network as a starting point to learn a new task instead of building the network from scratch, which provides a significant reduction of the computational training time. The features learned in the pre-trained CNN can be transferred to retrain using the new training set. Five pre-trained CNNs were used in this study, including AlexNet, GoogleNet (Inception V1), SqueezeNet, VGG16, and VGGNet19. Table 2 shows the basic characteristics of the pre-trained CNNs. These CNNs were chosen for their demonstrated performance in transfer learning [49,50,51]. In this study, transfer learning was conducted by freezing all convolutional layers except the last one, which was used for extracting features specifically related to the problem of interest. A fully connected layer that includes the updated number of classes was also modified to suit the number of classes (i.e., grades) for each cultivar.
Table 2.
Main characteristics of the different pre-trained CNNs used in this study for transfer learning.
2.4. Pretrained CNNs’ Architectures
The general architecture of a CNN includes the number of convolutional, pooling, and fully connected layers. The convolutional layer receives an input image or a feature map along with a filter (i.e., kernel) and results in a feature map that contains the low- or high-level features of the input data. The pooling (i.e., downsampling) layer is used to reduce dimensions and complexity and prevent overfitting. The fully connected layer performs classification by passing the extracted features to a series of layers and yields the assigned class of the image based on the highest probability [17,52]. The hyperparameters of all CNNs retrained in this study included an initial learning rate of 10−5 for all CNNs except for AlexNet, where the initial learning rate was 10−7, a ReLu activation function for convolutional layers and a Softmax activation function for the fully connected layers, number of epochs was 50, Stochastic Gradient Descent with Momentum (SDGM) as a solver with a batch size of 5, and dropout ratios equal to 0.7 for GoogleNet and 0.5 for the other CNNs. It is worth stating that the optimal hyperparameters were chosen based on trial and error in a preliminary analysis phase.
2.4.1. AlexNet
Being known for its revolutionary achievement in image classification, AlexNet was the first CNN that achieved an error rate of as low as 15.3% in the ILSRVC-2012 competition [53]. AlexNet comprises five convolutional layers, three of which are followed by max pooling layers, which yield up to 60 million parameters, 650,000 neurons, and 1000 output classes.
2.4.2. GoogleNet (Inception v1)
The concept of the inception layer yielded a significant improvement in the classification performance in GoogleNet, which comprises 27 deep layers. The inception layer consists of a combination of three convolution layers with different dimensions (1 × 1, 3 × 3, and 5 × 5) in which their output filter banks are concatenated into a single vector that feeds the next layer. This led to a significant reduction in dimensions and, consequently, a shorter computational time [54] compared to earlier pre-trained networks.
2.4.3. SqueezeNet
Based on AlexNet, SqueezeNet has fewer parameters and similar performance accuracy. This was achieved by introducing the fire module, which used a 1 × 1 filter instead of 3 × 3 and decreasing the number of input channels to the 3 × 3 filters by utilising the fire module, which contains 1 × 1 filters feeding into an expanded layer with a mix of 1 × 1 and 3 × 3 filters [55].
2.4.4. VGG16 and VGG19
VGG16 ranked second after GoogleNet in the 2014 ILSVRC challenge with a classification error of 7.3%. The network, known for its relatively simple architecture, contains 13 convolutional layers and three fully connected layers for downsampling. The layers are arranged into blocks, and each block contains two or three convolutional layers followed by a max-pooling layer [56]. Similar to VGG16, in VGG19, three extra convolutional layers were added in three blocks that had four convolutional layers instead of 3 for VGG16 [56].
2.5. Data Processing
All images from all cultivars were divided into two groups: training and validation (70%) and testing (30%). Each grade in the testing group included 10 images to sustain the same performance criteria for all cultivars. This was implemented because of the non-consistency of the number of samples and grades for each cultivar. Data augmentation was applied during the retraining of the CNNs to prevent overfitting of the trained models when applied to independent datasets. Data augmentation techniques applied in this study included reflection and translation around a horizontal and vertical axis, rotation, and scaling in the horizontal direction. Retraining of different CNNs was carried out on a Dell Precision m4800 laptop that has Intel® Core I7 4th Gen. processor, 16 GM DDRam, NVIDIA Quadro K1100M with 2 GB GDDR5 memory. The implementation of TL and subsequent classification and fusion tasks included in this study was conducted via MATLAB R2021a (MathWorks, Natick, MA, USA).
2.6. Fusion of Pretrained CNNs’ Models
Model fusion was carried out between better- the highest performing CNN models to investigate its effect on classification performance. The fusion of classification models was conducted through majority voting [57]. The final vote can be calculated following [57] after modification as follows:
where α is a parameter and k(d) is a function providing additional voting constraints, wj is the weight of each classifier (wj ∈ [0, 1]), and Bj(ci) is the binary characteristic function calculated as follows:
For each sample, decision vector, d, contains the outputs of classifiers and is defined as:
where n and m refer to the number of classifiers and the number of classes, respectively, ci is the label of the i-th class, and r is the rejection of assigning the sample to any given class. Values of k(d) and α were chosen to be 0 and 0.5, respectively. The weight parameter, wj, is subjected to the following constraint: .
To obtain the optimal value of wj for each classifier, wj was assigned values between 0 and 1 with a step of 0.01.
2.7. Evaluation of Classification Models
The performance of individual classifiers was evaluated by calculating accuracy, precision, recall (i.e., sensitivity), and F1-Score. The values of these metrics range from 0 to 100%, where 0 refers to poor performance, and 100% refers to ideal performance. F1-Score combines precision and sensitivity in a single metric and, therefore, accounts for low values for either one, producing an overall balanced measurement of the model performance. Considering each individual class, TP, TN, FP, and FN are the True Positive, True Negative, False Positive, and False Negative, respectively. The metrics are calculated as follows [58]:
3. Results and Discussion
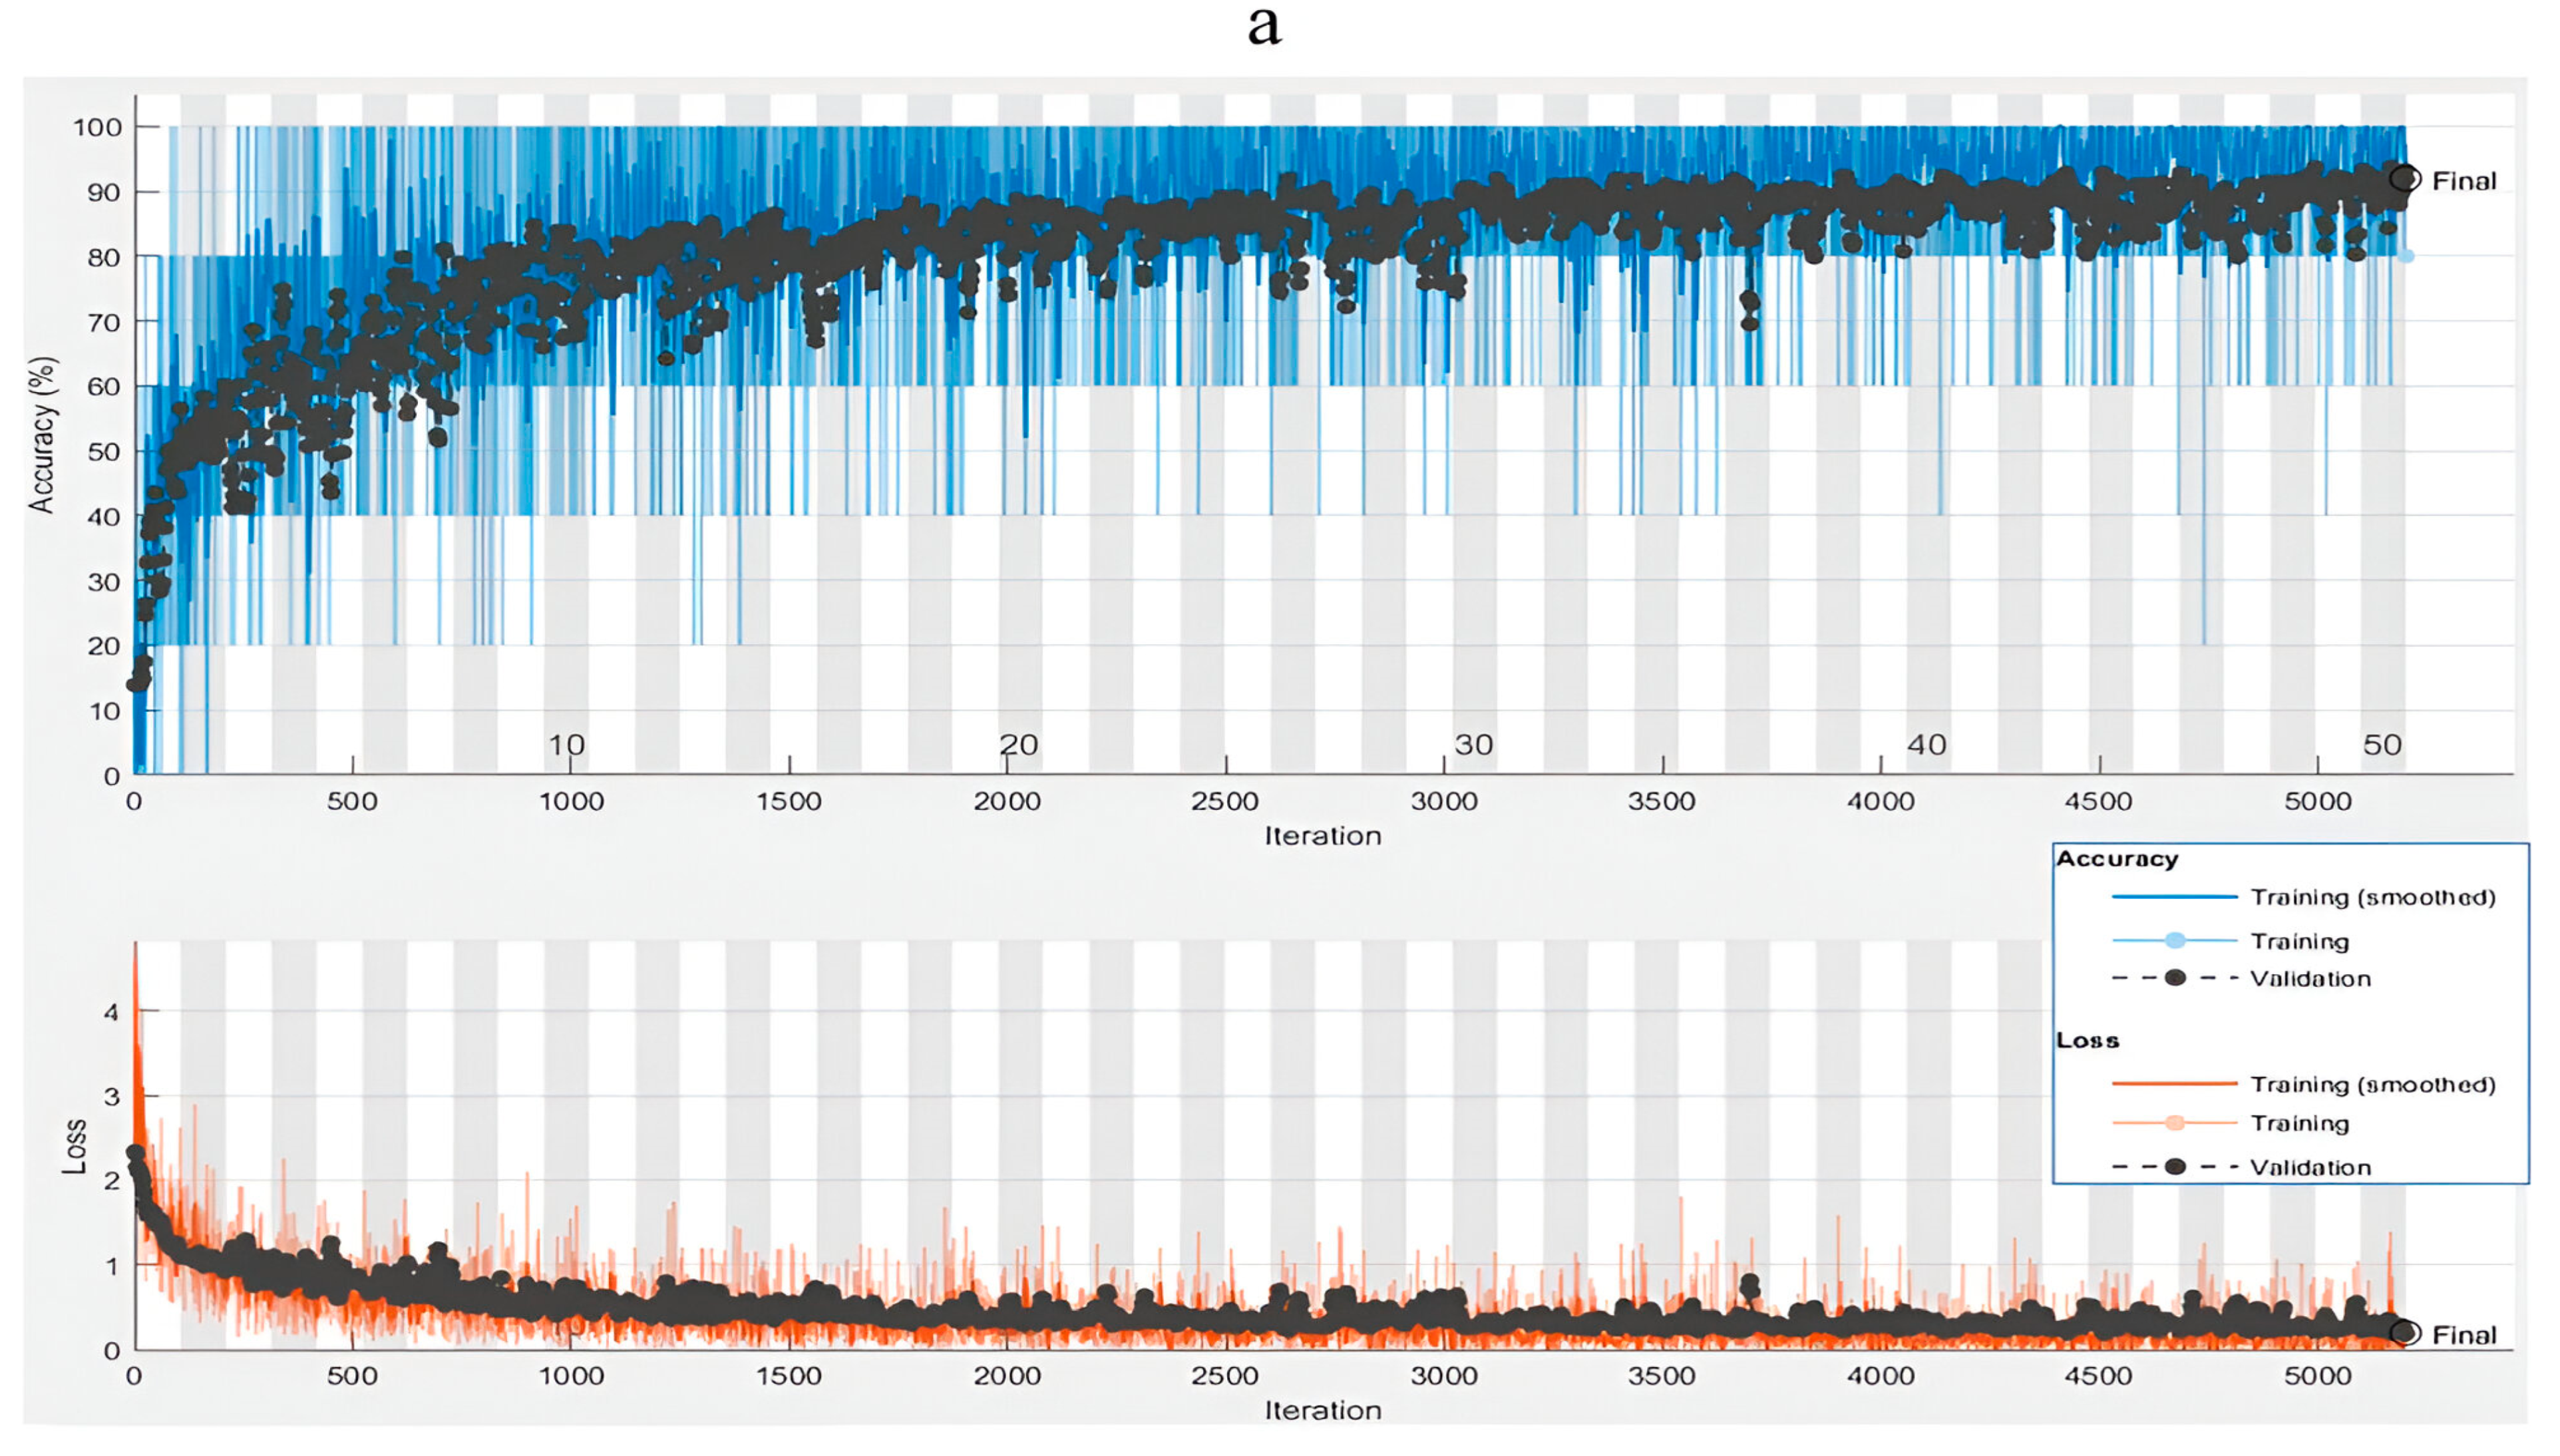
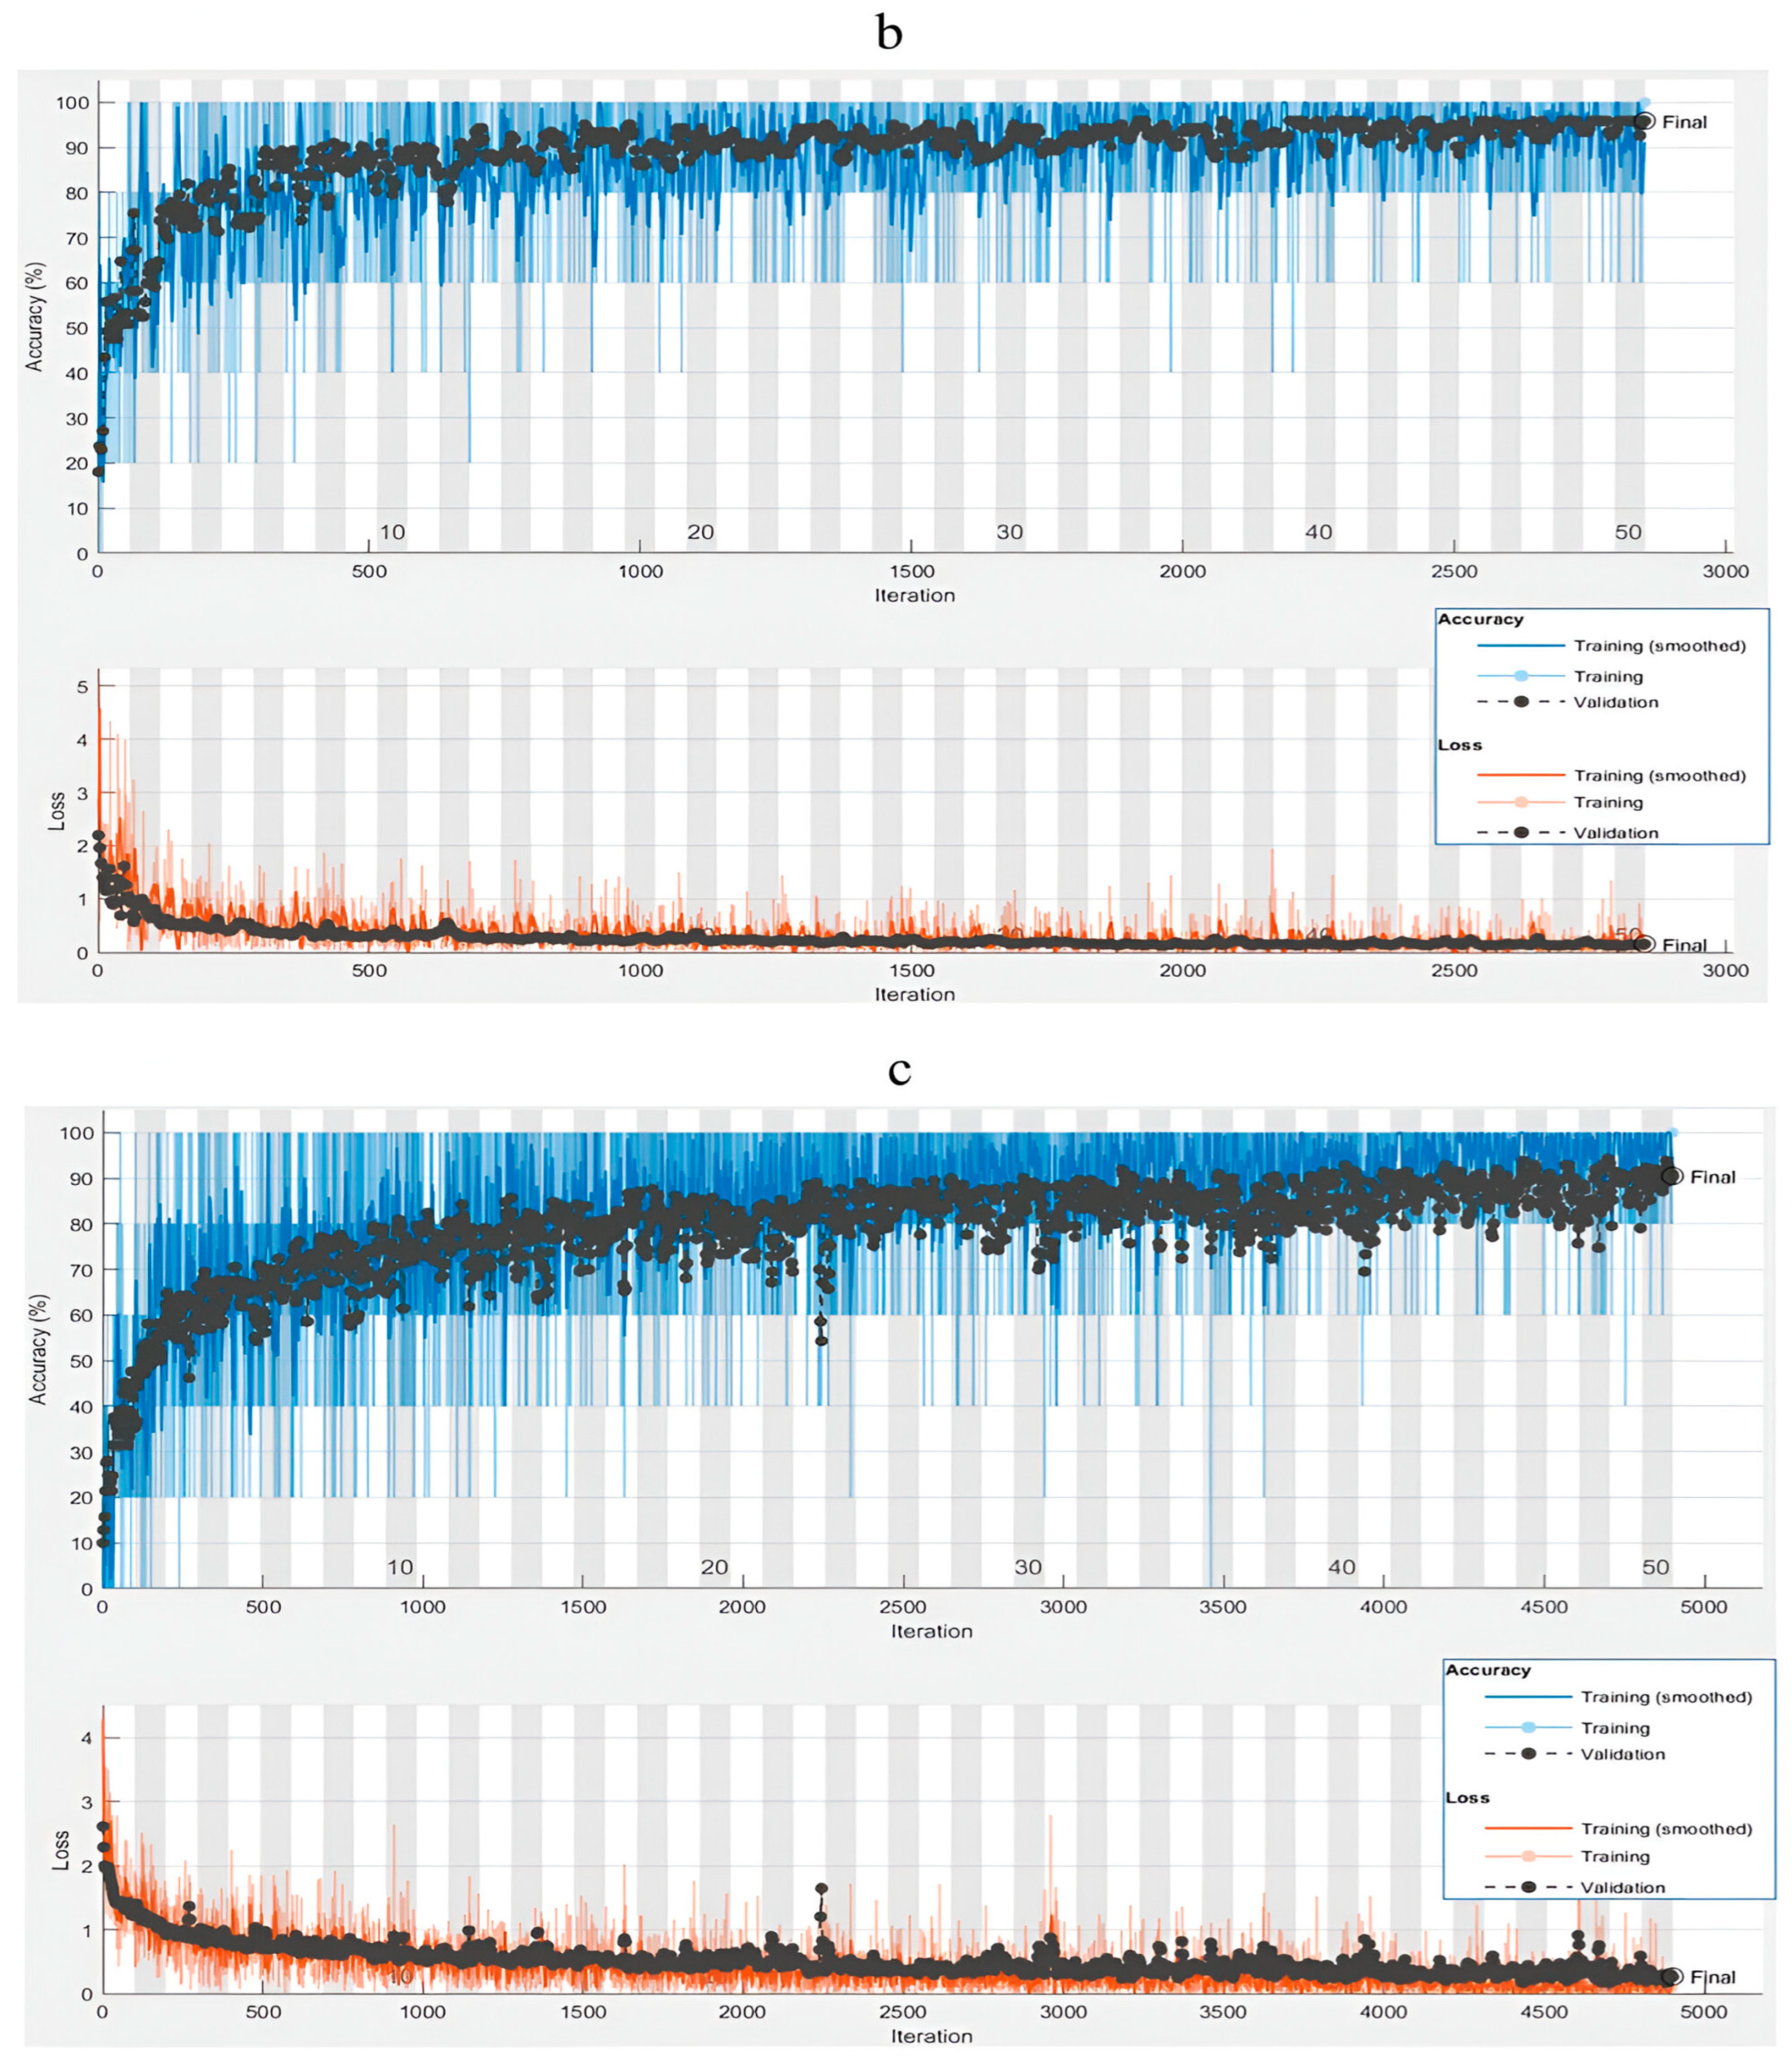
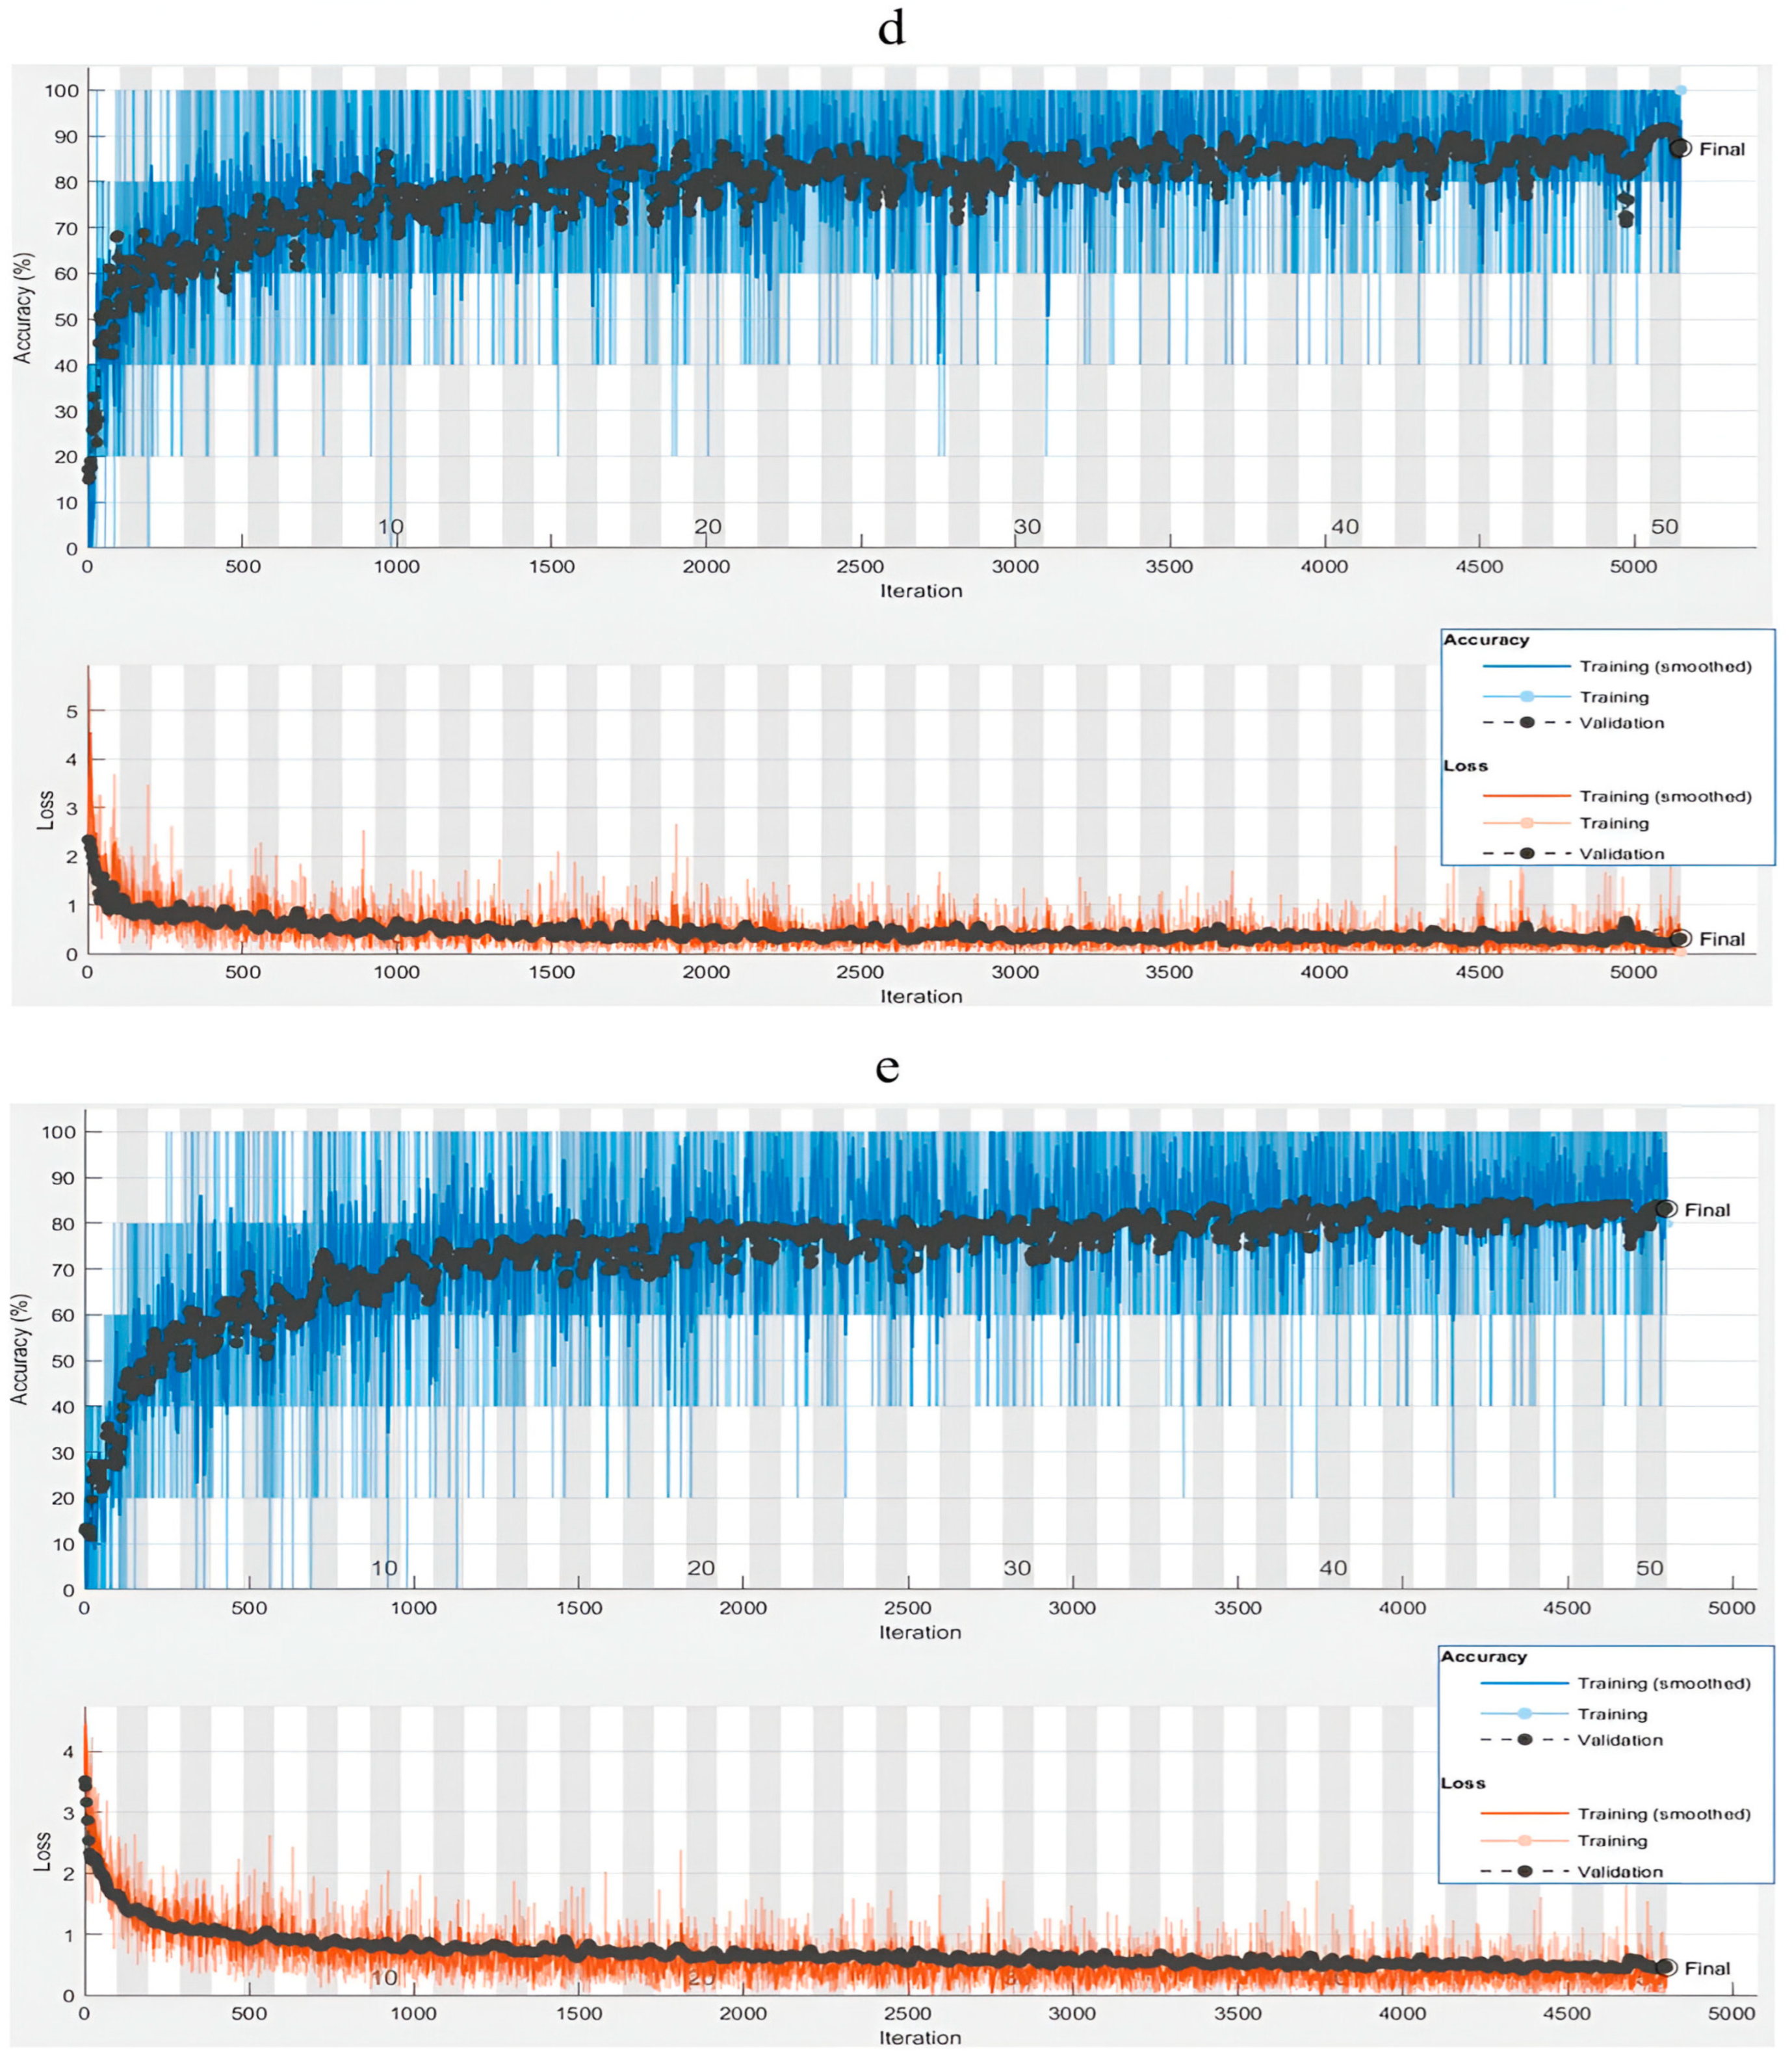
The performance of the optimal pre-trained CNN for each cultivar is presented in Figure 3a–e for the 50 epochs. In general, the convergence of pre-trained CNNs was assessed based on both the accuracy and loss function. All pre-trained CNNs converged to minimal lost values before the 50th epoch without the need to apply an early stopping rule, as depicted in Figure 3a–e. Training patterns for all CNNs presented fluctuations in accuracy as well as loss values with higher fluctuations in the former. The causes of this phenomenon are the small batch size and the SGDM algorithm used for retraining the CNNs; this is consistent with previous work [59].
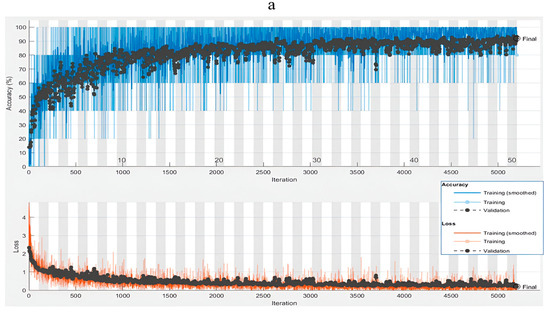

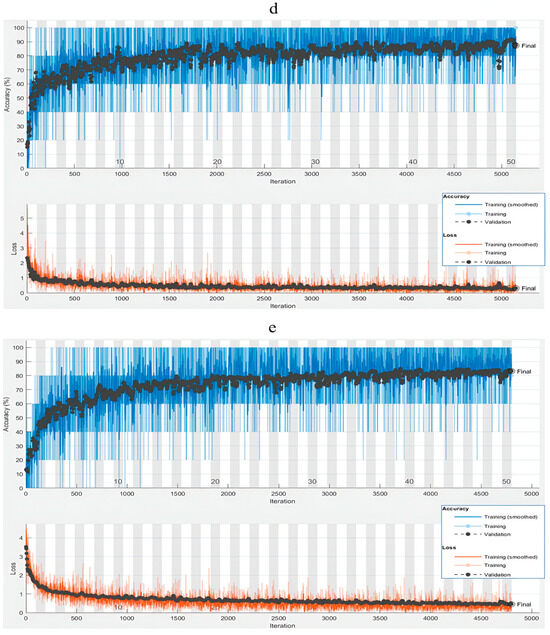
Figure 3.
Optimal training and validation accuracy of colour images for cotton cultivars: (a) Giza 86 (VGG19), (b) Giza 87 (AlexNet), (c) Giza 90 (VGG19), (d) Giza 94 (AlexNet), and (e) Giza 96 (GoogleNet).
The SGDM algorithm uses one training example, or a few examples for mini-batch, to update the model parameters, resulting in faster convergence and minimising convergence to the local minima. However, such an algorithm usually results in noise (i.e., spikes) in the loss function during training, especially with the mini-batch size of 5 training examples used in this study at each iteration [60,61]. The optimal pre-trained CNN for each cultivar was chosen and highlighted based on the accuracy of the testing set, as shown in Table 3.
Table 3.
Classification results for the testing set for cotton fibres colour images of different cultivars using fine-tuned pre-trained CNNs. Highlighted rows refer to optimal CNNs.
VGG19 yielded the optimal accuracy for transfer learning for Giza 86 (75.7%) and Giza 90 (85.0%), whereas AlexNet provided the highest accuracy of the testing set for Giza 87 (80.0%) and Giza 94 (77.1%). GoogleNet provided the highest classification accuracy for Giza 96 with an overall accuracy of 90.0%). Optimal pre-trained CNNs did not reflect shorter training times compared with other CNNs for the same cultivar except for GoogleNet when used for classifying the Giza 96 samples. The training times for the optimal pre-trained CNNs were 202,891 s for Giza 86, 487,345 s for Giza 87, 187,402 s for Giza 90, 134,831 s for Giza 94, and 74,081 s for Giza 96.
It was observed that AlexNet required a significantly longer time to converge for Giza 87 (487,345 s) and Giza 96 (1,182,656 s) cultivars compared with VGGNet19 (688,16 s and 177,943 s, respectively). However, the effect of such a longer training time has not significantly improved accuracy values in the case of Giza 87 (85.0% for AlexNet and 82.5% for VGG19), whereas the longer training time for AlexNet resulted in lower accuracy in the case of Giza 96 (85.7% for AlexNet compared with 87.1% for VGGNet19).
This result can be explained by how relatively less deep AlexNet is against VGG16 or VGG19, which leads to a longer convergence time needed for AlexNet to learn high-level features and reach a global minimum loss. However, a contrasting result was achieved for SqueezeNet and GoogleNet, with faster convergence than the other CNNs for all cultivars used in this study. These results are mainly due to the fewer parameters these two CNNs have compared with other CNNs applied in the study, as shown in Table 2. Additionally, GoogleNet depends on the inception blocks that contain multi-scale convolution filters through splitting and then concatenating, which enables extracting different spatial information at a low computational cost [62].
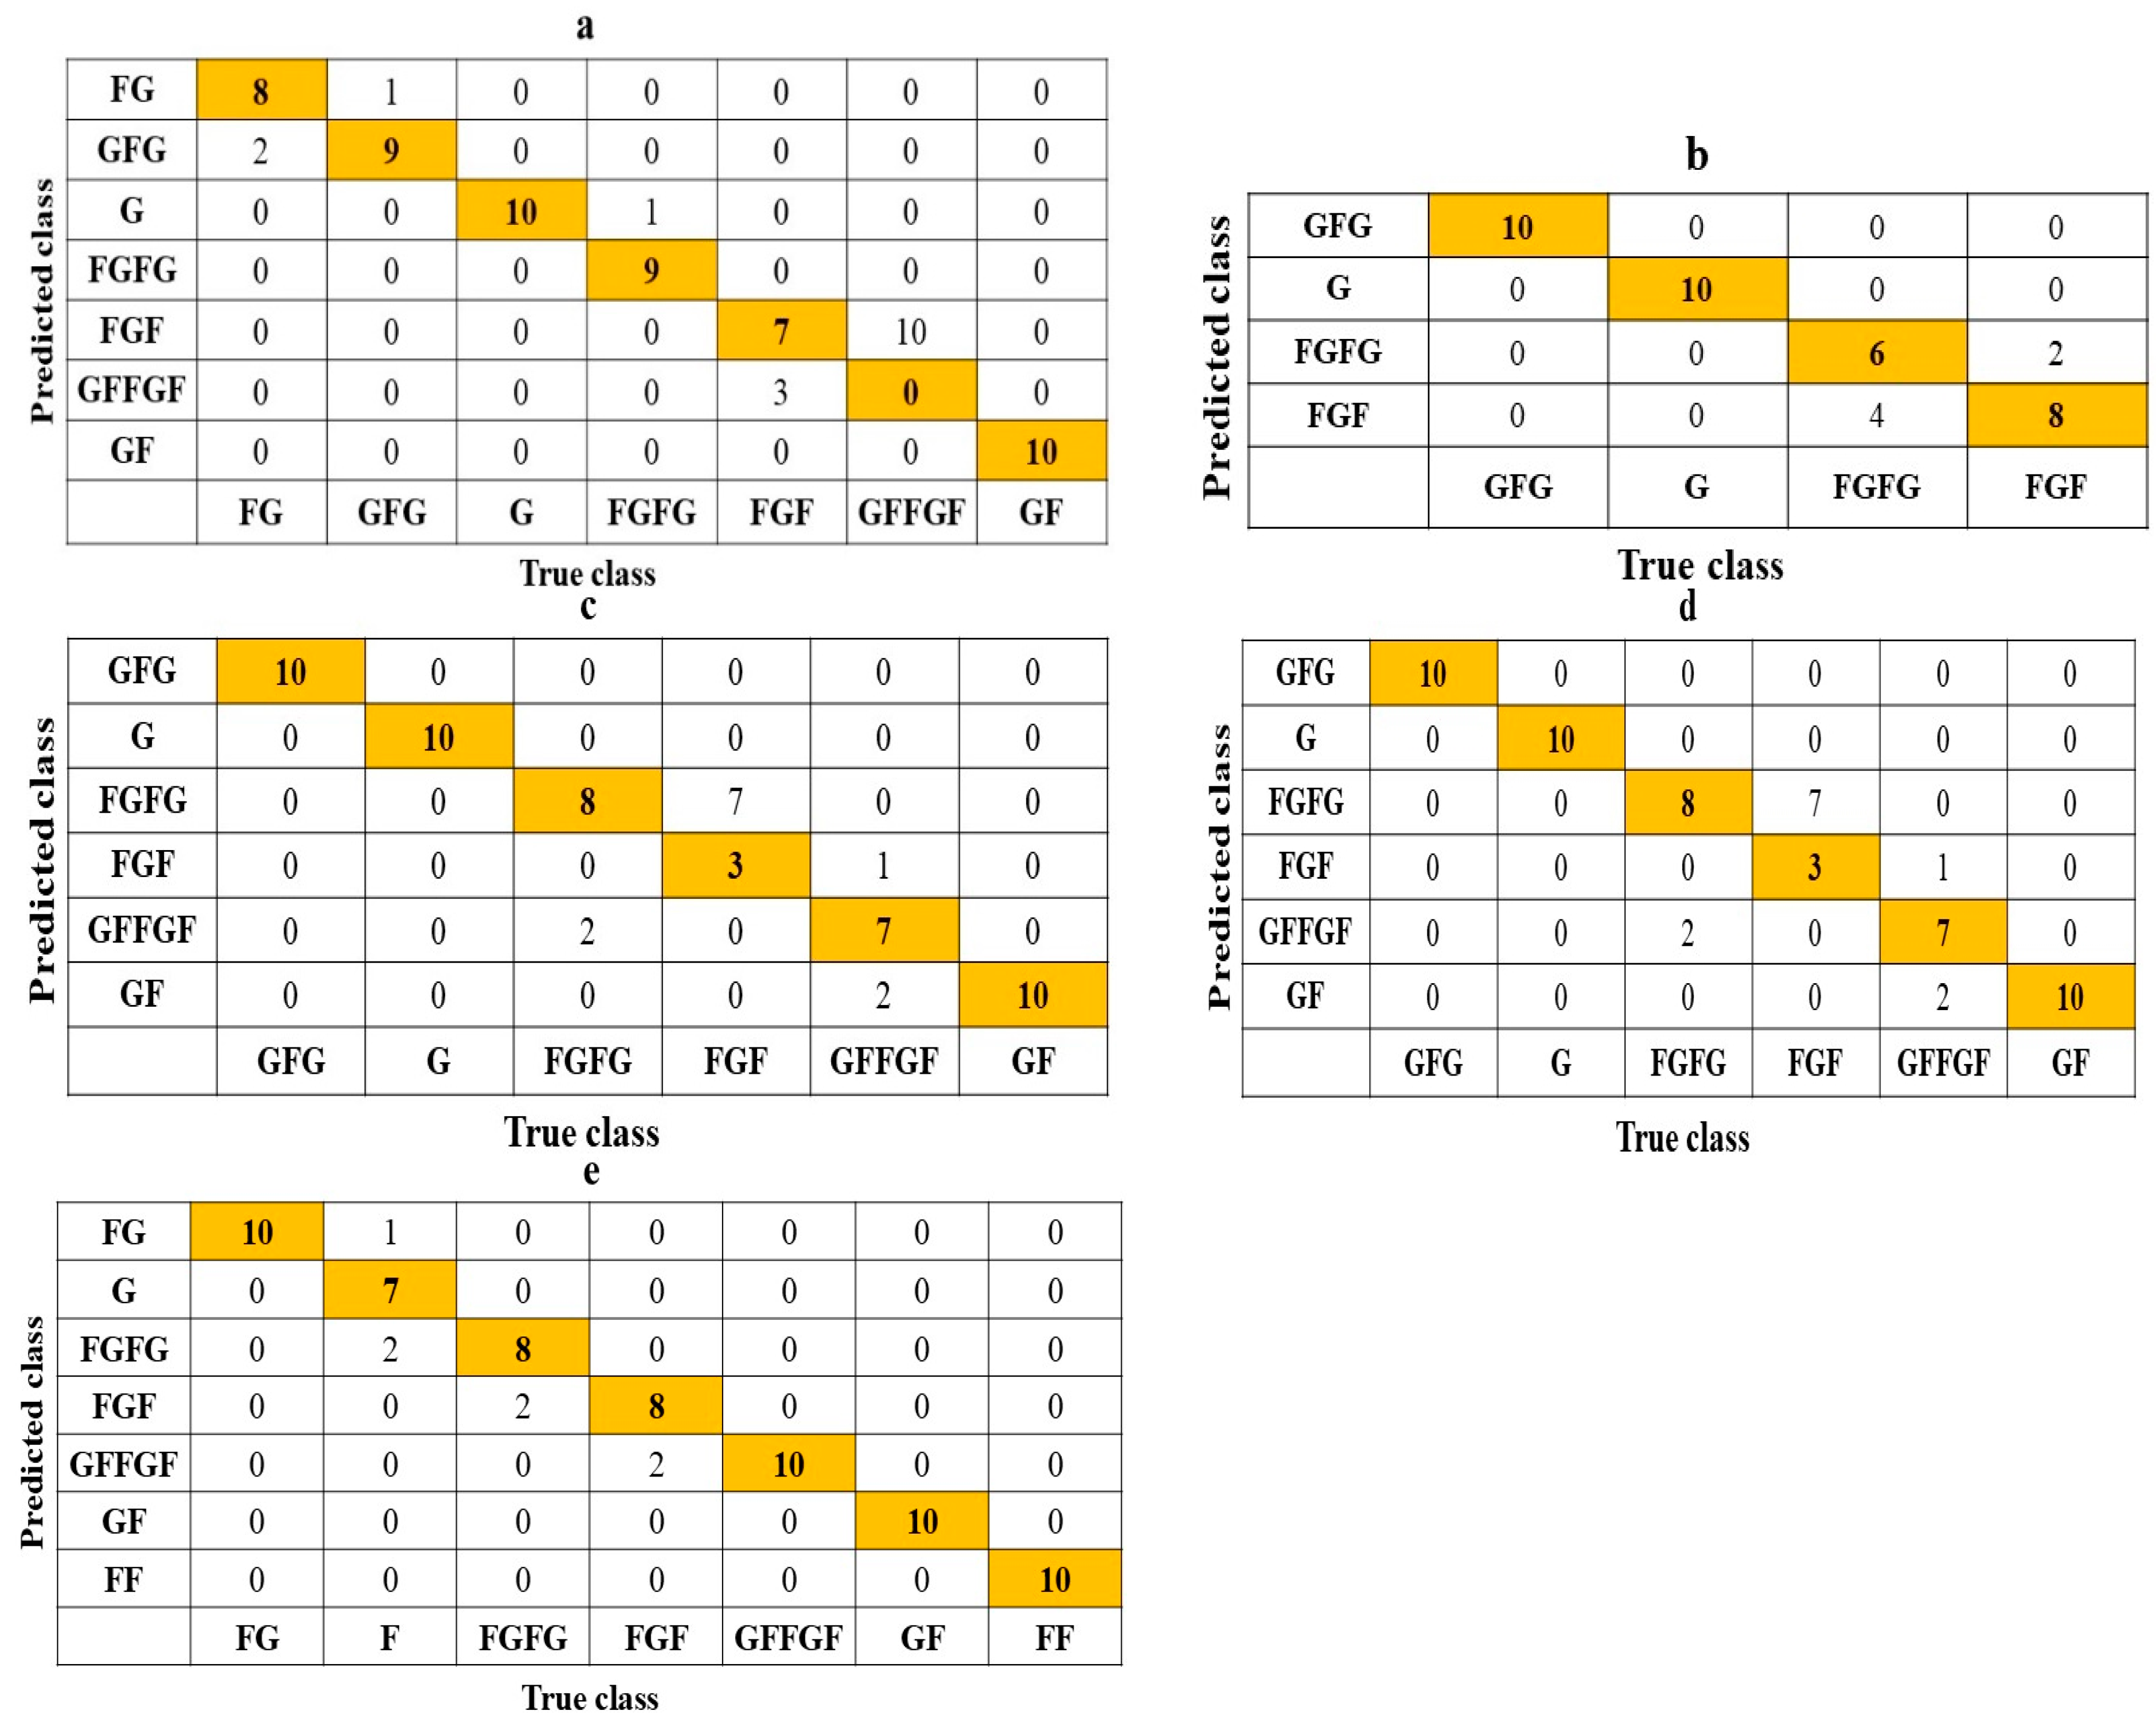
SqueezeNet benefits from the fire modules that contain squeeze and expand layers featuring a significant reduction in the network size and, consequently, shorter convergence time [63]. It is worth stating that the similar convergence time between SqueezeNet and GoogleNet was accompanied by close validation set accuracies for all cultivars. The accuracy values of the testing sets were close for Giza 87 and Giza 94, whereas GoogleNet outperformed SqueezeNet by 12.9% for Giza 86 and 6.6% for Giza 96. The opposite was observed for Giza 90, with 13.4% higher accuracy obtained by SqueezeNet. Giza 86 and Giza 90 showed lower generalisation on the separate testing set obtained through pre-trained CNNs compared with Giza 96 and Giza 94. Confusion matrices for the optimal classification results for all cultivars are shown in Figure 4a–e. Values of precision, recall, and F1 score for each cultivar/grade are shown in Table 4. The F1 scores depicted a strong correlation with precision or recall values. The Fully Good to Fair (FGF) grade had F1 scores lower than 55.0% for Giza 86, Giza 90, and Giza 94 cultivars, which resulted from lower recall or precision values of less than 50.0%.
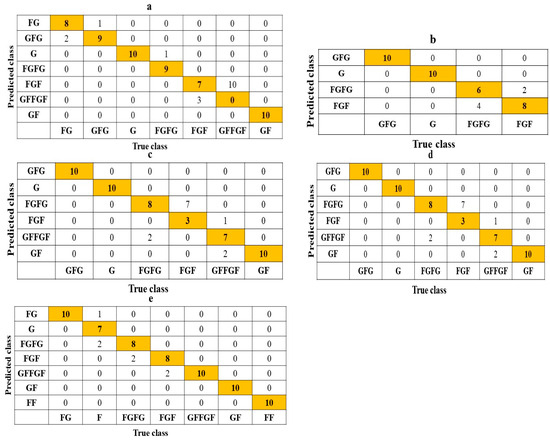
Figure 4.
Confusion matrices of the test sets for the optimal classification models of cotton fibres for cotton cultivars: (a) Giza 86 (VGG19), (b) Giza 87 (AlexNet), (c) Giza 90 (VGG19), (d) Giza 94 (AlexNet), and (e) Giza 96 (GoogleNet).
Table 4.
Classification metrics for the testing set for the optimal pre-trained CNNs to classify cotton fibres from different cultivars into grades.
In the case of Giza 86, all GFFGF samples were predicted as FGF, leading to precision values of 41.2% and 0% for FGF and GFFGF grades, respectively. For Giza 90, 7 FGF samples were predicted as FGFG, leading to a recall value of 53.3% for FGF grade. For Giza 94, FGF samples were predicted as GFFGF, resulting in a recall value of 30.0%. It was also noticed that GFFGF samples for Giza 86 were all predicted as FGF, which eliminated either recall or precision values for this grade. Additionally, FG samples for Giza 94 were predicted as GFG and G, which decreased the recall for the FG grade to 30.0%. The same trend can also be observed to a lesser extent in Giza 87 and Giza 96, which indicates that consecutive grades can be misclassified due to the high similarity and might reveal overfitting (i.e., high variance) in cross-validation, especially for Giza 86, Giza 86, Giza 90, and Giza 94 cultivars. Data augmentation, batch normalisation, and dropout are effective techniques used in this study to minimise overfitting and achieve convergence to a global minimum of the cost function (i.e., error) during pre-training [64]. However, larger data sets required for obtaining robust training in deep learning are also recommended to avoid overfitting [64,65].
Considering the number of studied cultivars and grades, the TL results achieved in this study are comparable to those of past studies. One of which utilised saturation and brightness for segmenting impurities in 80 images of machine-harvested cotton fibres with an accuracy of 92.0% [66]. Other studies applied a Multi-class Support Vector Machine (MSVM) to classify 79 colour images containing six non-fibre categories, reaching a mean accuracy of up to 93.6% using leave-one-out or one-against-one cross-validation [28,67]. Moreover, our results can be compared with those reported by [68] about identifying impurities in cotton fibres using a machine vision system and CIE-Luv colour space that generated a lookup comparison table with pure cotton images. Moreover, the results of grading and detecting foreign materials in fabrics, including pseudo-foreign materials associated with harvested cotton in 110 images, achieved an average training speed of 0.67 s [25]. Random Forest (RF) was applied to the same data set in this study, and classification accuracy was up to 82.1–90.2% [10]. Additionally, active learning was implemented with a resulting accuracy of 82.9–85.3% compared with semi-supervised learning, which achieved 81.4–85.3% accuracy [69]. Comparing results for individual cultivars reveals that RF outperformed TL for Giza 86, Giza 87, and Giza 94. This lack of generalisation may be due to the more complexity associated with CNN models leading to high variance (i.e., overfitting) [70].
Other studies that investigated the application of deep learning for cotton fibre classification outperformed our results. These studies included using PCANet or VGGNet for feature extraction followed by an SVM classifier of 784 or 2634 images, which had an accuracy of 68.5–98.9% using offline and inline systems [26,29], and utilized YOLO V5 after applying different edge detection algorithms for the real-time recognition of impurities in cotton fibres, leading to an accuracy of 97.3–98.9% [24].
Despite the promising results in the aforementioned studies, our study contained larger, more comprehensive and more complex data sets of standard authenticated grades of Egyptian cotton fibres. Additionally, the former two studies [26,29] were based on only seven grades, whereas the latter [24] used cotton fibres with four impurity types. However, our study is based on detecting the standard Egyptian cotton fibre grades, where we focused on investigating a larger number of grades and cultivars compared with the aforementioned studies. Although NIR spectroscopic (1100–2300 nm) [30] and hyperspectral imaging systems (400–1000 nm) [31] revealed distinguishable clusters of cotton and foreign fibres [30] with recognition or rejection rates as high as 100% [31], these systems are not cost-effective and require skilled personnel to operate especially at the early handling stages compared with RGB colour techniques, which limit their suitability for real-world adoption.
Classification Results of Fused CNN Models
The results of fusing classification models from different pre-trained CNNs generally showed higher accuracy values than the optimal individual models, as shown in Table 5. Accuracy increases from 75.7% to 78.6% for Giza 86, from 80.0% to 86.7% for Giza 90, 77.1% to 84.3% for Giza 94, and from 9.0% to 92.9% for Giza 96. Giza 87 showed a drop in accuracy from 85.0% to 82.5%. The weights of CNNs in fused models differ between cultivars. GoogleNet and VGG19 contributed to the fused models more than other CNNs. SqueezeNet had more weights on optimal fused models than AlexNet in contrast to the results of individual models illustrated in Table 3, whereas SqueezeNet had lower accuracy for all cultivars but Giza 90. Enhanced classification performance after applying ensemble models compared with single classifiers is feasible due to the more robustness and generalisation, as well as the higher accuracy resulting from combining different classifiers. However, it is worth stating that the limitation of model generalisation is mostly due to the less explainability and interpretability associated with fusing large models [71,72].
Table 5.
Classification results of fusing models obtained from different pre-trained CNNs to classify cotton fibres from different cultivars.
This study provides a proof of concept for a cost-effective and easy-to-implement imaging and classification solution that requires relatively few technical skills to operate and interpret the results. This computer vision system responds to a critical problem affecting a vital crop in the Egyptian agricultural system. However, obtaining more comprehensive classification models requires studying the majority of cotton cultivars in Egypt to include a broader range of staple lengths, which, therefore, covers different needs of the textile industry and can serve as a robust alternative to human assessors. Additionally, the availability of larger data sets offers the possibility for developing CNN from scratch and comparing the performance with transfer learning models. As the pre-trained CNNs in this study provided reasonably promising classifications, it is also worth utilising state-of-the-art vision-dedicated deep learning models such as ConvNext, CoAtNet, EfficientNetV2, Vision Transformers (ViT), and Swin Transformers [73] to obtain a holistic view of the feasibility of using such well-tuned models for classification or feature extraction purposes. Moreover, deep transfer learning is a more sophisticated technique that can apply the knowledge learned from one domain or task in another domain, which might differ in terms of distribution in an aim to reduce costs related to learning, such as labelling [74].
4. Conclusions
In this study, individual and fused pre-trained CNNs were used to classify RGB colour images of Egyptian cotton fibres from different cultivars. The study focused on tuning AlexNet, GoogleNet, SqueezeNet, VGG16, and VGG19 through transfer learning. Classification models developed through individual CNNs presented accuracy values up to 75.7–90.0% and an F1-Score of 42.9–100% for different grades. Fusing the tuned CNN models yielded an increase in classification accuracy of 2.5–7.2%, except for Giza 87, where the fusion led to a 2.5% reduction in accuracy. Considering the large number of grades and the small differences between consecutive grades, the results of this study can serve as a fundamental step towards the development of a cost-effective and rapid colour imaging system to shorten classification times and reduce the burden on human experts. However, the comprehensiveness of the work will be enhanced by including larger data sets and using modern deep learning approaches either for classification or feature extraction. This technology would also reduce adulteration and provide farmers and small businesses with a fast decision on the quality of their fibres. It would also shorten the time between the farm and ginning, thus reducing the time required to reach the marketplace for domestic products and exports.
Author Contributions
Conceptualisation, A.R., A.A.A.E.-B. and H.H.E.; methodology, A.R., O.F., A.A.A.E.-B., H.H.E. and N.J.W.; software, A.R.; validation, A.R., O.F., A.A.A.E.-B., H.H.E. and N.J.W.; formal analysis, A.R., O.F. and N.J.W.; investigation, A.R., O.F., A.A.A.E.-B., H.H.E. and N.J.W.; resources, A.R., O.F., A.A.A.E.-B., H.H.E. and N.J.W.; data curation, A.R., A.A.A.E.-B. and H.H.E.; writing—original draft preparation, A.R.; writing—review and editing, A.R., O.F. and N.J.W.; visualisation, A.R.; supervision, N.J.W.; project administration, A.R., O.F. and N.J.W.; funding acquisition, A.R., A.A.A.E.-B. and H.H.E. All authors have read and agreed to the published version of the manuscript.
Funding
This project has received funding from the Research Leaders 2025 programme co-funded by Teagasc and the European Union’s Horizon 2020 Research and Innovation Programme under the Marie Skłodowska-Curie grant agreement number 754380.
Institutional Review Board Statement
Not applicable.
Informed Consent Statement
Not applicable.
Data Availability Statement
The data that support the findings of this study are available from the corresponding author (A.R.) upon reasonable request.
Conflicts of Interest
The authors declare no conflicts of interest. The funders had no role in the design of the study; in the collection, analyses, or interpretation of data; in the writing of the manuscript; or in the decision to publish the results.
References
- Messiry, M.E.; Abd-Ellatif, S.A.M. Characterization of Egyptian cotton fibres. Indian J. Fibre Text. Res. 2013, 38, 109–113. [Google Scholar]
- Cotton Incorporated. Textile Fibers; Cotton Incorporated: Cary, NC, USA, 2013. [Google Scholar]
- FAO. Cotton Lint and Ginned Production; FAO: Rome, Italy, 2023. [Google Scholar]
- Norris, P.K. Cotton Production in Egypt; U.S. Department of Agriculture: Washington, DC, USA, 1934. [Google Scholar]
- Shalaby, M.E.S.; Ebaido, I.A.; Abd-El-Rahman, Y.S. Characterization of Egyptian Cotton Fiber Quality Using CCS. Eur. J. Agric. Food Sci. 2021, 3, 45–52. [Google Scholar] [CrossRef]
- Gourlot, J.-P.; Drieling, A. Interpretation and Use of Instrument Measured Cotton Characteristics: A Guideline; International Cotton Advisory Committee (ICAC): Washington, DC, USA, 2020. [Google Scholar]
- CATGO. Natural Characteristics of Egyptian Cotton Cultivars and Their Relationship with Different Grades (Season 2018/2019); CATGO: Cairo, Egypt, 2020; p. 69. [Google Scholar]
- El Saied, H. Egyptian Cotton. Handling and Ginning, and the Factors Affecting the Grade. 2022. Available online: https://misrelzraea.com/43153-2/ (accessed on 21 August 2024).
- Ahmed, Y.N.; Delin, H. Current Situation of Egyptian Cotton: Econometrics Study Using ARDL Model. J. Agric. Sci. 2019, 11, 88. [Google Scholar] [CrossRef]
- Fisher, O.J.; Rady, A.; El-Banna, A.A.; Watson, N.J.; Emaish, H.H. An image processing and machine learning solution to automate Egyptian cotton lint grading. Text. Res. J. 2023, 93, 2558–2575. [Google Scholar] [CrossRef]
- Hassanain, H.T. A Study of The Most Important Economic and Productive Factors Affecting the Relative and Competitive Advantage of Egyptian Cotton Crop (دراسة لأهم العوامل الاقتصادية والإنتاجية المؤثرة علي الميزة النسبية والميزة التنافسية لمحصول القطن المصري). J. Adv. Agric. Res. 2021, 26, 197–212. [Google Scholar]
- Khllil, M.H. Economics of cultivation and production of cotton in Egypt and its contribution to economic development for the period (2000–2009). Univ. Kirkuk J. Adm. Econ. Sci. 2013, 3. [Google Scholar]
- Omar, S.; Morgan, J. Cotton and Products Annual-Egypt; United States Department of Agriculture-Foreign Agricultural Services: Washington, DC, USA, 2023; p. 15.
- Saiz-Rubio, V.; Rovira-Más, F. From smart farming towards agriculture 5.0: A review on crop data management. Agronomy 2020, 10, 207. [Google Scholar] [CrossRef]
- Oxford Business Group. Digitalisation Is Key to Bolstering Egypt’s Food and Water Security. The Report: Egypt 2022. Available online: https://oxfordbusinessgroup.com/reports/egypt/2022-report/economy/tools-of-the-trade-digitalisation-is-key-to-efforts-to-bolster-food-and-water-security (accessed on 22 March 2025).
- Ma, J.; Sun, D.W.; Qu, J.H.; Liu, D.; Pu, H.; Gao, W.H.; Zeng, X.A. Applications of computer vision for assessing quality of agri-food products: A review of recent research advances. Crit. Rev. Food Sci. Nutr. 2016, 56, 113–127. [Google Scholar] [CrossRef]
- Abdullah, M.Z. Image Acquisition Systems. In Computer Vision Technology for Food Quality Evaluation; Elsevier: Amsterdam, The Netherlands, 2016; pp. 3–43. [Google Scholar]
- Hernández-Sánchez, N.; Moreda, G.P.; Herre-ro-Langreo, A.; Melado-Herreros, Á. Assessment of internal and external quality of fruits and vegetables. In Imaging Technologies and Data Processing for Food Engineers; Springer: Cham, Switzerland, 2016; pp. 269–309. [Google Scholar]
- Altunkaynak, A.; Başakın, E.E. Estimation of Wheat Yield Based on Precipitation and Evapotranspiration Using Soft Computing Methods. In Computer Vision and Machine Learning in Agriculture; Springer: Cham, Switzerland, 2022; Volume 2, pp. 83–106. [Google Scholar]
- Rajathi, N.; Parameswari, P. Early Stage Prediction of Plant Leaf Diseases Using Deep Learning Models. In Computer Vision and Machine Learning in Agriculture; Springer: Cham, Switzerland, 2022; Volume 2, pp. 245–260. [Google Scholar]
- Holopainen-Mantila, U.; Raulio, M. Cereal grain structure by microscopic analysis. In Imaging Technologies and Data Processing for Food Engineers; Springer: Cham, Switzerland, 2016; pp. 1–39. [Google Scholar]
- Valous, N.A.; Zheng, L.; Sun, D.W.; Tan, J. Quality evaluation of meat cuts. In Computer Vision Technology for Food Quality Evaluation; Elsevier: Amsterdam, The Netherlands, 2016; pp. 175–193. [Google Scholar]
- Du, C.-J.; Iqbal, A.; Sun, D.-W. Quality measurement of cooked meats. In Computer Vision Technology for Food Quality Evaluation; Elsevier: Amsterdam, The Netherlands, 2016; pp. 195–212. [Google Scholar]
- Zhang, C.; Li, T.; Li, J. Detection of impurity rate of machine-picked cotton based on improved canny operator. Electronics 2022, 11, 974. [Google Scholar] [CrossRef]
- Wang, X.; Yang, W.; Li, Z. A fast image segmentation algorithm for detection of pseudo-foreign fibers in lint cotton. Comput. Electr. Eng. 2015, 46, 500–510. [Google Scholar] [CrossRef]
- Lv, Y.; Gao, Y.; Rigall, E.; Qi, L.; Gao, F.; Dong, J. Cotton appearance grade classification based on machine learning. Procedia Comput. Sci. 2020, 174, 729–734. [Google Scholar] [CrossRef]
- Jeyaraj, P.R.; Samuel Nadar, E.R. Computer vision for automatic detection and classification of fabric defect employing deep learning algorithm. Int. J. Cloth. Sci. Technol. 2019, 31, 510–521. [Google Scholar] [CrossRef]
- Yang, W.; Lu, S.; Wang, S.; Li, D. Fast recognition of foreign fibers in cotton lint using machine vision. Math. Comput. Model. 2011, 54, 877–882. [Google Scholar] [CrossRef]
- Wei, W.; Deng, D.; Zeng, L.; Zhang, C.; Shi, W. Classification of foreign fibers using deep learning and its implementation on embedded system. Int. J. Adv. Robot. Syst. 2019, 16, 1729881419867600. [Google Scholar] [CrossRef]
- Zhou, J.; Yu, L.; Ding, Q.; Wang, R. Textile fiber identification using near-infrared spectroscopy and pattern recognition. Autex Res. J. 2019, 19, 201–209. [Google Scholar] [CrossRef]
- Jiang, Y.; Li, C. Detection and discrimination of cotton foreign matter using push-broom based hyperspectral imaging: System design and capability. PLoS ONE 2015, 10, e0121969. [Google Scholar] [CrossRef]
- Huang, J.; He, H.; Lv, R.; Zhang, G.; Zhou, Z.; Wang, X. Non-destructive detection and classification of textile fibres based on hyperspectral imaging and 1D-CNN. Anal. Chim. Acta 2022, 1224, 340238. [Google Scholar] [CrossRef]
- Xu, W.; Yang, W.; Chen, P.; Zhan, Y.; Zhang, L.; Lan, Y. Cotton fiber quality estimation based on machine learning using time series UAV remote sensing data. Remote Sens. 2023, 15, 586. [Google Scholar] [CrossRef]
- Zhuang, F.; Qi, Z.; Duan, K.; Xi, D.; Zhu, Y.; Zhu, H.; Xiong, H.; He, Q. A comprehensive survey on transfer learning. Proc. IEEE 2020, 109, 43–76. [Google Scholar] [CrossRef]
- Hosna, A.; Merry, E.; Gyalmo, J.; Alom, Z.; Aung, Z.; Azim, M.A. Transfer learning: A friendly introduction. J. Big Data 2022, 9, 102. [Google Scholar] [CrossRef]
- Long, M.; Wang, J.; Ding, G.; Sun, J.; Yu, P.S. Transfer feature learning with joint distribution adaptation. In Proceedings of the IEEE International Conference on Computer Vision, Sydney, Australia, 1–8 December 2013. [Google Scholar]
- Yao, Y.; Doretto, G. Boosting for transfer learning with multiple sources. In Proceedings of the 2010 IEEE Computer Society Conference on Computer Vision and Pattern Recognition, San Francisco, CA, USA, 13–18 June 2010. [Google Scholar]
- Chawla, N.V.; Bowyer, K.W.; Hall, L.O.; Kegelmeyer, W.P. SMOTE: Synthetic minority over-sampling technique. J. Artif. Intell. Res. 2002, 16, 321–357. [Google Scholar] [CrossRef]
- Camgözlü, Y.; Kutlu, Y. Leaf image classification based on pre-trained convolutional neural network models. Nat. Eng. Sci. 2023, 8, 214–232. [Google Scholar]
- Patel, F.; Mewada, S.; Degadwala, S.; Vyas, D. Recognition of Pistachio Species with Transfer Learning Models. In Proceedings of the 2023 International Conference on Self Sustainable Artificial Intelligence Systems (ICSSAS), Erode, India, 18–20 October 2023. [Google Scholar]
- Peng, M.; Liu, Y.; Khan, A.; Ahmed, B.; Sarker, S.K.; Ghadi, Y.Y.; Bhatti, U.A.; Al-Razgan, M.; Ali, Y.A. Crop monitoring using remote sensing land use and land change data: Comparative analysis of deep learning methods using pre-trained CNN models. Big Data Res. 2024, 36, 100448. [Google Scholar] [CrossRef]
- Tasci, B. Automated ischemic acute infarction detection using pre-trained CNN models’ deep features. Biomed. Signal Process. Control 2023, 82, 104603. [Google Scholar] [CrossRef]
- Gao, Z.; Tian, Y.; Lin, S.C.; Lin, J. A CT image classification network framework for lung tumors based on pre-trained mobilenetv2 model and transfer learning, and its application and market analysis in the medical field. arXiv 2025, arXiv:2501.04996. [Google Scholar] [CrossRef]
- Krishnapriya, S.; Karuna, Y. Pre-trained deep learning models for brain MRI image classification. Front. Hum. Neurosci. 2023, 17, 1150120. [Google Scholar] [CrossRef]
- Hassan, E.; Shams, M.Y.; Hikal, N.A.; Elmougy, S. Detecting COVID-19 in chest CT images based on several pre-trained models. Multimed. Tools Appl. 2024, 83, 65267–65287. [Google Scholar] [CrossRef]
- Singh, S.A.; ASKumar Desai, K. Comparative assessment of common pre-trained CNNs for vision-based surface defect detection of machined components. Expert Syst. Appl. 2023, 218, 119623. [Google Scholar] [CrossRef]
- Matarneh, S.; Elghaish, F.; Rahimian, F.P.; Abdellatef, E.; Abrishami, S. Evaluation and optimisation of pre-trained CNN models for asphalt pavement crack detection and classification. Autom. Constr. 2024, 160, 105297. [Google Scholar] [CrossRef]
- Feuz, K.D.; Cook, D.J. Transfer learning across feature-rich heterogeneous feature spaces via feature-space remapping (FSR). ACM Trans. Intell. Syst. Technol. (TIST) 2015, 6, 1–27. [Google Scholar] [CrossRef]
- Kaur, R.; Kumar, R.; Gupta, M. Review on Transfer Learning for Convolutional Neural Network. In Proceedings of the 2021 3rd International Conference on Advances in Computing, Communication Control and Networking (ICAC3N), Greater Noida, India, 17–18 December 2021. [Google Scholar]
- Dewan, J.H.; Das, R.; Thepade, S.D.; Jadhav, H.; Narsale, N.; Mhasawade, A.; Nambiar, S. Image Classification by Transfer Learning using Pre-Trained CNN Models. In Proceedings of the 2023 International Conference on Recent Advances in Electrical, Electronics, Ubiquitous Communication, and Computational Intelligence (RAEEUCCI), Chennai, India, 19–21 April 2023. [Google Scholar]
- Zhao, Z.; Alzubaidi, L.; Zhang, J.; Duan, Y.; Gu, Y. A comparison review of transfer learning and self-supervised learning: Definitions, applications, advantages and limitations. Expert Syst. Appl. 2024, 242, 122807. [Google Scholar] [CrossRef]
- LeCun, Y.; Bengio, Y.; Hinton, G. Deep learning. Nature 2015, 521, 436–444. [Google Scholar] [CrossRef] [PubMed]
- Krizhevsky, A.; Sutskever, I.; Hinton, G.E. Image Net classification with deep convolutional neural networks. Adv. Neural Inf. Process. Syst. 2012, 25, 1–9. [Google Scholar]
- Szegedy, C.; Liu, W.; Jia, Y.; Sermanet, P.; Reed, S.; Anguelov, D.; Erhan, D.; Vanhoucke, V.; Rabinovich, A. Going Deeper with Convolutions. In Proceedings of the IEEE Conference on Computer Vision and Pattern Recognition (CVPR), Boston, MA, USA, 7–12 June 2015. [Google Scholar]
- Iandola, F.N.; Han, S.; Moskewicz, M.W.; Ashraf, K.; Dally, W.J.; Keutzer, K. SqueezeNet: AlexNet-level accuracy with 50x fewer parameters and< 0.5 MB model size. arXiv 2016, arXiv:1602.07360. [Google Scholar]
- Simonyan, K.; Zisserman, A. Very deep convolutional networks for large-scale image recognition. arXiv 2014, arXiv:1409.1556. [Google Scholar]
- Ruta, D.; Gabrys, B. An overview of classifier fusion methods. Comput. Inf. Syst. 2000, 7, 1–10. [Google Scholar]
- Vujović, Ž. Classification model evaluation metrics. Int. J. Adv. Comput. Sci. Appl. 2021, 12, 599–606. [Google Scholar] [CrossRef]
- Radiuk, P.M. Impact of training set batch size on the performance of convolutional neural networks for diverse datasets. Inf. Technol. Manag. Sci. 2017, 20, 20–24. [Google Scholar] [CrossRef]
- Bottou, L.; Curtis, F.E.; Nocedal, J. Optimization methods for large-scale machine learning. SIAM Rev. 2018, 60, 223–311. [Google Scholar] [CrossRef]
- Attard, M. What Is Stochastic Gradient Descenbt? 3 Pros and Cons. 2024. Available online: https://insidelearningmachines.com/stochastic_gradient_descent/ (accessed on 22 March 2025).
- Li, Q.; Yang, Y.; Guo, Y.; Li, W.; Liu, Y.; Liu, H.; Kang, Y. Performance evaluation of deep learning classification network for image features. IEEE Access 2021, 9, 9318–9333. [Google Scholar] [CrossRef]
- Hassanpour, M.; Malek, H. Learning document image features with SqueezeNet convolutional neural network. Int. J. Eng. 2020, 33, 1201–1207. [Google Scholar]
- Yang, Y.; Zhang, L.; Du, M.; Bo, J.; Liu, H.; Ren, L.; Li, X.; Deen, M.J. A comparative analysis of eleven neural networks architectures for small datasets of lung images of COVID-19 patients toward improved clinical decisions. Comput. Biol. Med. 2021, 139, 104887. [Google Scholar] [CrossRef] [PubMed]
- Ananda, A.; Ngan, K.H.; Karabağ, C.; Ter-Sarkisov, A.; Alonso, E.; Reyes-Aldasoro, C.C. Classification and visualisation of normal and abnormal radiographs; a comparison between eleven convolutional neural network architectures. Sensors 2021, 21, 5381. [Google Scholar] [CrossRef] [PubMed]
- Li, L.; Zhang, C.; Zheng, X. Segmentation Algorithm for Machine-Harvested Cotton based on S and I Regional Features. In Proceedings of the 5th International Conference on Vehicle, Mechanical and Electrical Engineering (ICVMEE 2019), Dalian, China, 28–30 September 2019. [Google Scholar]
- Li, D.; Yang, W.; Wang, S. Classification of foreign fibers in cotton lint using machine vision and multi-class support vector machine. Comput. Electron. Agric. 2010, 74, 274–279. [Google Scholar] [CrossRef]
- Tantaswadi, P.; Vilainatre, J.; Tamaree, N.; Viraivan, P. Machine vision for automated visual inspection of cotton quality in textile industries using color isodiscrimination contour. Comput. Ind. Eng. 1999, 37, 347–350. [Google Scholar] [CrossRef]
- Fisher, O.J.; Rady, A.; El-Banna, A.A.; Emaish, H.H.; Watson, N.J. AI-Assisted Cotton Grading: Active and Semi-Supervised Learning to Reduce the Image-Labelling Burden. Sensors 2023, 23, 8671. [Google Scholar] [CrossRef]
- Mehta, P.; Bukov, M.; Wang, C.H.; Day, A.G.; Richardson, C.; Fisher, C.K.; Schwab, D.J. A high-bias, low-variance introduction to machine learning for physicists. Phys. Rep. 2019, 810, 1–124. [Google Scholar] [CrossRef]
- Moreno-Seco, F.; Inesta, J.M.; De León, P.J.P.; Micó, L. Comparison of Classifier Fusion Methods for Classification in Pattern Recognition Tasks. In Structural, Syntactic, and Statistical Pattern Recognition: Joint IAPR International Workshops, SSPR 2006, and SPR 2006, Hong Kong, China, 17–19 August 2006; Proceedings; Springer: Cham, Switzerland, 2006. [Google Scholar]
- Dietterich, T.G. Ensemble Methods in Machine Learning. In International Workshop on Multiple Classifier Systems, Cagliari, Italy, 21–23 June 2000; Springer: Cham, Switzerland, 2000. [Google Scholar]
- Springenberg, M.; Frommholz, A.; Wenzel, M.; Weicken, E.; Ma, J.; Strodthoff, N. From modern CNNs to vision transformers: Assessing the performance, robustness, and classification strategies of deep learning models in histopathology. Med. Image Anal. 2023, 87, 102809. [Google Scholar] [CrossRef]
- Iman, M.; Arabnia, H.R.; Rasheed, K. A review of deep transfer learning and recent advancements. Technologies 2023, 11, 40. [Google Scholar] [CrossRef]
Disclaimer/Publisher’s Note: The statements, opinions and data contained in all publications are solely those of the individual author(s) and contributor(s) and not of MDPI and/or the editor(s). MDPI and/or the editor(s) disclaim responsibility for any injury to people or property resulting from any ideas, methods, instructions or products referred to in the content. |
© 2025 by the authors. Licensee MDPI, Basel, Switzerland. This article is an open access article distributed under the terms and conditions of the Creative Commons Attribution (CC BY) license (https://creativecommons.org/licenses/by/4.0/).