Abstract
Rice, wheat, and maize are important food grains consumed by most of the population in Asian countries (like India, Japan, Singapore, Malaysia, China, and Thailand). These crops’ production is affected by biotic and abiotic factors that cause diseases in several parts of the crops (including leaves, stems, roots, nodes, and panicles). A severe infection affects the growth of the plant, thereby undermining the economy of a country, if not detected at an early stage. This may cause extensive damage to crops, resulting in decreased yield and productivity. Early safeguarding methods are overlooked because of farmers’ lack of awareness and the variety of crop diseases. This causes significant crop damage and can consequently lower productivity. In this manuscript, a lightweight vision transformer (MaxViT) with 814.7 K learnable parameters and 85 layers is designed for classifying crop diseases in paddy and wheat. The MaxViT DNN architecture consists of a convolutional block attention module (CBAM), squeeze and excitation (SE), and depth-wise (DW) convolution, followed by a ConvNeXt module. This network architecture enhances feature representation by eliminating redundant information (using CBAM) and aggregating spatial information (using SE), and spatial filtering by the DW layer cumulatively enhances the overall classification performance. The proposed model was tested using a paddy dataset (with 7857 images and eight classes, obtained from local paddy farms in Lalgudi district, Tiruchirappalli) and a wheat dataset (with 5000 images and five classes, downloaded from the Kaggle platform). The model’s classification performance for various diseases has been evaluated based on accuracy, sensitivity, specificity, mean accuracy, precision, F1-score, and MCC. During training and testing, the model’s overall accuracy on the paddy dataset was 99.43% and 98.47%, respectively. Training and testing accuracies were 94% and 92.8%, respectively, for the wheat dataset. Ablation analysis was carried out to study the significant contribution of each module to improving the performance. It was found that the model’s performance was immune to the presence of noise. Additionally, there are a minimal number of parameters involved in the proposed model as compared to pre-trained networks, which ensures that the model trains faster.
1. Introduction
Agriculture holds a historic significance in developing worldwide economic conditions by enabling the accumulation of wealth and resources. However, the quantity and quality of crop yields are greatly influenced by various factors, such as soil degradation, water scarcity, natural disasters, climate change, and plant diseases [1,2]. Among these, plant diseases are the leading cause of losses in crop yield, which can significantly threaten global food security. Rice is the most cultivated crop globally and requires a large amount of attention during its growth phase, as it is easily infected by various plant leaf diseases (such as bacterial leaf blight, brown spot, leaf blast, leaf scald, narrow brown spot, rice hispa, neck blast, and tungro), affecting its optimal growth and compromising its nutritional value [3,4]. This leads to yield losses ranging from 10% to 100%, depending on the growth phase of the crop and the degree of infestation [5]. The diagnosis of ill plants is often performed visually, which is time-consuming, imprecise, and impractical in large-scale applications, further exacerbated by the subjectivity of human assessment based on experience and expertise. This introduces inconsistency and variability during diagnosis, which leads to ineffective management strategies and unreliable results [6,7]. Furthermore, these diseases exert pressure on the environment, as farmers increasingly rely on heavy pesticide use with the aim of controlling disease outbreaks. This excessive dependence on chemical interventions engenders significant environmental pollution, ecosystem disruption, and adverse health consequences for both humans and wildlife. Therefore, early anomaly detection is essential in rice crops, which can help in taking the necessary steps to control the outbreak; this includes proper administration of pesticides and development of more resistant varieties [8,9].
Due to the recent advancements in computer vision and artificial intelligence (AI)-assisted techniques, automated disease detection that is highly accurate in classifying various leaf diseases has been made possible. Machine learning (ML) techniques such as K-Nearest Neighbor (KNN) and support vector machine (SVM) can easily achieve the aforementioned task but suffer from having a hand-crafted feature extraction step, which makes them less adaptive. On the other hand, convolutional neural networks (CNNs) under deep learning (DL) can precisely detect leaf diseases, as the features are extracted automatically without any human intervention [10,11]. However, these models experience difficulty when training on imbalanced datasets and facing environmental variability and are computationally complex in nature, making them nonviable for real-world applications.
Bacterial leaf blight (BLB), rice blast, brown spot, sheath blight, tungro, and bacterial leaf streak are common rice crop diseases affecting its yield. The pathogens responsible for the crop diseases discussed above collectively threaten global rice security, with climate change exacerbating disease dynamics. The descriptions of these diseases are discussed below. Modern solutions rely heavily on CRISPR-engineered resistance, microbiome modulation, and climate-smart surveillance systems to reduce the damage [12]. BLB is caused by Xanthomonas oryzae pv. oryzae. In this case, the pathogen infiltrates rice leaves via hydathodes or wounds, colonizing the xylem and forming water-soaked lesions that subsequently become necrotic, leading to leaf wilting and plant mortality at a later stage. BLB is particularly prevalent in tropical and subtropical regions, where warm, humid conditions facilitate its proliferation, often causing yield reductions of 20–50% [13]. The bacterium utilizes virulence mechanisms such as type III secretion systems (T3SSs) and effector proteins to suppress host immunity, thereby promoting systemic infection. Disease management necessitates an integrated approach, including the use of resistant varieties (e.g., those carrying Xa genes), chemical treatments, and cultural practices such as field sanitation and balanced fertilization. Recent advancements in genome editing (e.g., CRISPR-Cas9) present promising strategies for developing durable and resistant varieties [12]. However, climate change may exacerbate BLB outbreaks, necessitating ongoing research into adaptive control measures to protect global rice production. Rice blast (Magnaporthe oryzae), caused by fungal pathogens, causes severe yield losses in paddy crops. The fungus employs specialized pressure-driven appressoria to breach leaf cuticles, followed by invasive hyphal growth that rapidly colonizes tissues [14]. It is characterized by diamond-shaped spots with gray centers and dark margins, which often coalesce under optimal temperatures (i.e., 25–30 °C) with prolonged leaf wetness [15]. Brown spot (Bipolaris oryzae) is mainly caused by phosphorus-deficient soils and leads to reduced photosynthetic efficiency [16]. The pathogen can survive in crop residues and produces wind-dispersed conidia, which makes it persistent throughout the year. But, it is less severe than leaf blast. Sheath blight (Rhizoctonia solani) is problematic in rice due to its sclerotia-based survival mechanism. Modern high-yielding semi-dwarf varieties with dense canopies create ideal microclimates for disease progression [17]. The pathogen’s wide host range and resistance to common fungicides complicate control efforts and can reduce yields by up to 35% [18]. Tungro disease, caused by the RTBV-RTSV complex, continues to evolve through vector adaptation. Crops affected by recent outbreaks in Southeast Asia show altered symptoms, including more severe stunting and complete panicle sterility [19]. The green leafhopper vector (Nephotettix spp.) has developed resistance to common insecticides, necessitating integrated vector management [20]. Bacterial leaf streak (Xanthomonas oryzae pv. oryzicola) is emerging as a significant concern in mechanized farming systems, where harvesting injuries facilitate bacterial entry. New genomic studies reveal extensive horizontal gene transfer driving virulence evolution [13]. Unlike BLB, which causes systemic wilting, leaf streak remains localized, but it can reduce yields by 15–30% due to impaired photosynthesis.
Similar kinds of crop diseases occur in wheat and reduce productivity. The common diseases affecting wheat crops are black point, wheat blast, fusarium root rot, and leaf blight. Black point affects the quality and germination of wheat and is caused by Bipolaris sorokiniana [21]. It can be recognized by a brown or black tip on the grain embryo. Wheat blast is caused by Magnaporthe oryzae pathotype triticum. This fungus can affect various plant parts, including the leaf, awn, glume, spike, seed, and other ground tissues. Observable symptoms (such as silver spikes, dry spikes, black or dark gray sporulation by fungi, lesions, and wrinkled kernels) of this disease are noted during the reproductive phase of wheat [22]. Fusarium root rot is a soil-borne disease, which is caused by Fusarium pseudograminearum, F. culmorum, and F. graminearum. The fungus releases mycotoxin, which affects the stem and root portions of the crop (having visible symptoms such as increased lodging and impaired function in the vascular tissue). Infected plants display chocolate brown discoloration, which can extend to internodes along the stem [23,24]. Leaf blight is caused by the fungal pathogen Alternaria triticina and is characterized by symptoms such as choriotic lesions (on the leaves), blighted leaves, and a burnt appearance.
Therefore, diseases affecting paddy and wheat crops need to be detected accurately at their early stages to apply the necessary precautions to improve the crop yield. In the Indian subcontinent, the identification of crop diseases presents a significant challenge for farmers due to their lack of awareness and the similarity in symptoms among disease classes. So, development of a scalable, environmentally robust diagnostic system capable of precise detection and classification of crop leaf diseases with demonstrated efficacy across diverse environmental conditions, while maintaining scalability for large-scale deployment and integration into agricultural supply chains, is a top priority for advancement in current agricultural systems. By taking into account the current needs of the agricultural sector, a lightweight model based on a vision transformer (i.e., MaxViT) and a convolutional block attention mechanism (CBAM) is proposed. The method was evaluated on a customized eight-class paddy dataset and a five-class wheat dataset for detecting and classifying crop diseases.
The main contributions of this research are as follows:
- The developed architecture consists of CBAM, depth-wise separable (DW) convolution, squeeze and excitation (SE), and ConvNeXt modules. The CBAM module uses channel and spatial attention mechanisms to focus on minute and essential details from the feature map, while the SE module compresses the feature map in order to retain only the key channel that contributes to the identification of diverse disease attributes. Furthermore, the DW module captures the spatial features from each key channel separately, followed by improvement in channel contrast by using regularization (to enhance intricate details), which is aided by the ConvNeXt module.
- The modules collectively have 85 layers with 814.7K parameters. This model is found to be efficient compared to MobileNet, as well as other light networks reported in the literature. Due to its lightweight architecture, it can be implemented in real-time applications through edge devices.
- The developed model serves as an environmentally robust diagnostic system capable of precise detection and classification of crop leaf diseases, demonstrating efficacy across diverse environmental conditions while maintaining scalability for large-scale agricultural systems.
- To validate its effectiveness, robustness, and generalizability, the method has been tested on a publicly available wheat database and a custom paddy dataset (collected from Lalgudi district of Tiruchirapalli, Tamil Nadu, India) and attained overall testing accuracies of 98.47% (paddy) and 92.8% (wheat). Therefore, this model is highly effective for classifying multi-class diseases in paddy (eight classes) and wheat (five classes) crops.
The rest of the manuscript is organized as follows: Section 2 examines prior studies on plant disease detection using deep learning, identifying gaps that motivate this study. Section 3 elaborates on the model design, dataset characteristics, and evaluation strategies employed to assess performance. Section 4 presents experimental findings, including cross-fold validation, interpretability through Grad-CAM, comparisons with pre-trained models, ablation tests, and statistical validation. Finally, Section 5 concludes with reflections on the findings and suggests future directions for broader applicability and real-time deployment.
2. Related Works
Automatic discrimination of paddy crop diseases has been carried out in previous studies using image processing, ML, and DL techniques. ML techniques have employed feature extraction, followed by classification and performance evaluation for leaf disease categorization. Feature extraction captures only the fine details characterizing the disease symptoms and eliminates redundant data for image classification [25]. Color features (extracted using color moments and color histogram), texture features (extracted through gray level co-occurrence matrix (GLCM), Gabor filter, and local binary patterns (LBPs)), and shape features (extracted using elliptic Fourier and discriminant analysis and geometric calculation with moment invariants) [26] are some of the feature engineering techniques employed for leaf disease classification. Selecting the appropriate feature is very crucial for image classification [27]. Feature extraction can be carried out using hand-crafted or deep visual features. Hand-crafted features include shape, color, texture, etc., whereas deep visual features are extracted automatically using deep layers present in the deep neural network (DNN) [28]. ML models rely heavily on hand-crafted features, whereas DL models can extract them automatically. Automatic feature extraction in DL models is subject to the number of images available in the dataset. The larger the number of images in the dataset, the greater the number of visual features that can be captured by the deep layers [29]. In ML models, the features extracted are classified using ML classifiers for disease categorization. After classification, the performance metrics are evaluated.
A few of the recently available techniques for disease classification in paddy crops are represented below in Table 1 with their corresponding limitations and performance.

Table 1.
A summary of methods utilized in the literature for identification of paddy crop diseases.
Bui et al. [30], Haque et al. [31], Pai et al. [32], Cao et al. [35], Altabaji et al. [36], Padhi et al. [37], etc., have used DL architectures to identify paddy crop diseases. Bui et al. [30] developed a Ghost-Attention-YOLOv8 DL architecture (consisting of CBAM, triplet attention, and efficiency multi-scale attention (EMA)) for the prediction of three paddy diseases from 3563 images collected from the Vietnam National University of Agriculture. The authors used a Ghost module, which minimizes the computational cost. This network has 5.5 Million learnable parameters. The triplet attention mechanism helps extract refined features. This method reported a mean average precision of 95.4%.
Haque et al. [31] developed a DL model with ViT (consisting of triplet multi-head attention) to identify leaf diseases in paddy and apple crops. The authors used the RicApp dataset (which consists of 12,322 images of rice crops (11 classes) and 7331 images of apple leaves (10 classes)). This method attained an overall accuracy of 97.99%.
Pai et al. [32] developed a twin CNN architecture for the classification of four classes (three diseased and one healthy) of paddy crops. The multi-scale features extracted from different pre-trained networks (VGG 16, ResNet50, and InceptionV3) were concatenated, followed by feature selection through principal component analysis (PCA). The features were then fed into the twin CNN architecture (with an identical structure) for classification. An overall accuracy of 96.8% was attained.
Elakya and Manoranjitham [33] developed an ensemble model (comprising ResNet, DenseNet, and EfficientNet) to classify nine paddy diseases. The authors used a dataset with 13,876 images collected from various repositories. The images were pre-processed using a Gaussian filter and adaptive thresholding and segmented by a Gaussian mixture model (GMM). This method resulted in an accuracy of 97% and an F1-score of about 90% for all nine rice diseases.
Bhola et al. [34] proposed a hybrid model with 20.2 M parameters for classification of multi-crop (such as corn, rice, and wheat) leaf diseases. The deep features from the crop images were extracted using the DenseNet201 model and fed into an SVM classifier. The dataset contained 2788 images (four classes each for corn, rice, and wheat) collected from various sources. This approach attained an accuracy of 87.23%.
Cao et al. [35] developed the Pyramid-YOLOv8 network for classification of rice blast disease. The dataset includes 2011 rice blast images captured using a mobile phone. The authors incorporated a detection head to capture tiny and fine target details, a CBAM for extracting multi-attention channel and spatial features, and a C2F-Pyramid module for feature extraction, achieving a low computational cost. This method obtained a mean average precision of 84.3%.
Altabaji et al. [36] proposed a modified LeafNet model for classification of three paddy diseases (brown spot, hispa, and leaf spot). The dataset has 2658 images collected from the Kaggle platform. The pre-processed images were augmented by rotation, flipping, height and width adjustments, and brightness variations. Modifications (consistent kernel size in the convolution layer and a modified max pooling layer) were applied to the original LeafNet model to improve its performance. The model’s performance was compared with the original LeafNet model and pre-trained networks (Xception and MobileNetV2). The proposed model attained accuracies of 97.44% and 87.76% for validation and testing, respectively.
Padhi et al. [37] developed an EfficientNet B4 model for classification of 10 paddy diseases using the Paddy Doctor dataset. The dataset consisted of 19131 and 4785 images for training and testing, respectively. The architectural features of this model included a compound scaling technique, the Swish activation function, and mobile inverted bottleneck convolution (MBConv) for better feature extraction and lower computational cost. The authors reported accuracies of 99.09% and 96.91% for training and testing, respectively.
Zhang et al. [38] proposed the ISMSFuse algorithm for classification of rice bacterial blight disease. The ImgS-RBB2022 dataset was utilized in this work. The features from the image were extracted by the MobileNetV2 model and fused with spectral features using the ISMSFuse algorithm and then classified by a multi-class linear SVM classifier. A prototype was developed and implemented on a Raspberry Pi for real-time detection of rice bacterial blight disease. The explainability of the model was analyzed by SHAP visualization. The authors reported an accuracy of 98.14%.
Singh et al. [39] performed classification of rice blast disease using DL models (such as AlexNet, VGG 16, LeNet, Xception, and InceptionV1). The dataset comprised 6300 images (both healthy and blast) captured using a digital camera from local paddy fields in Punjab, India. Among the pre-trained models used, AlexNet produced an accuracy of 98.7%.
Senthil et al. [40] developed a DNN incorporating a multi-class support vector machine (MCSVM) for four classes of paddy diseases. The dataset consists of 450 images sourced from the plantvillage platform. The images were pre-processed using a Gaussian filter and segmented by K-means clustering. The features were extracted using GLCM and classified using MCSVM. This approach achieved an accuracy of 96.85%.
Lu et al. [41] developed the YOLOv8-Rice model for the detection of four paddy diseases. The database consists of 1200 images collected from paddy fields. Twelve different attention mechanisms were used to focus on the target diseased regions. This method achieved a mean average precision score of 86%.
Chitranjan Kumar Rai and Roop Pahuja [10] developed an attention residual U-Net model for classification of four paddy diseases. The dataset comprised 479 images captured using a digital camera from different paddy fields in Orissa. The pre-processed images were augmented by rotation and contrast adjustment. Attention gates in the residual U-Net model performed semantic segmentation of the diseased regions from the leaf images. This method reported Dice coefficient scores of 0.9626 and 0.8192 for training and validation, respectively.
Chen et al. [42] introduced a novel attention mechanism for the detection of four paddy diseases. The dataset comprised 2400 images captured using a camera as well as collected from internet sources. The channel and position attention mechanism (CPAM) was used for deep feature extraction. These features were integrated with a domain adaption method for enhanced recognition of the diseased regions. This method achieved the highest recognition accuracy of 95.25%.
Bharanidharan et al. [43] developed a modified Lemurs optimization algorithm (MLOA) for categorization of five-class paddy images. The dataset has 636 thermal images obtained from the Kaggle platform. Statistical features (such as Box–Cox transformed features) were extracted and then classified by ML classifiers (such as KNN, RF, linear discriminant analysis (LDA), and histogram gradient boosting (HGB)). The authors reported a balanced accuracy of 90% for the proposed method with the KNN classifier.
From the above discussion, it is found that researchers used DL models, pre-trained networks, ensemble learning, attention mechanisms, vision transformer (ViT), etc., for leaf disease classification in crops and fruits. A few of the researchers used ensemble architectures for classification. These networks fused a unique approach derived from different pre-trained networks with traditional ML classifiers to improve performance. Researchers mainly used a few classes of crop diseases. The highest accuracy was reported for the two-class problem (obtained by Singh et al. [39]). The classification performance was drastically reduced for multiple classes. The introduction of ViT by Haque et al. [31] increased the performance to 97.99% for 11 classes. Various techniques adopted by researchers for detecting paddy crop diseases are summarized and presented in Table 1. The highest accuracy was reported to be 98.7% for two classes and 97.99% for multiple classes. There is a need to develop a light DL architecture for identifying diseases in crops and fruits effectively and efficiently.
Table 2 summarizes the recent techniques used by researchers in the literature for identification of wheat crop diseases. An ML technique [44] and DL techniques [45,46,47,48] are adopted by the authors for identification of wheat crop diseases. Among these techniques, the modified ResNet50 architecture proposed by Ruby et al. [46] achieved the highest accuracy of 98.44% for classifying four wheat diseases.

Table 2.
Techniques used in literature for identification of wheat crop diseases.
3. Proposed Methodology
In this work, a multi-axis vision transformer (MaxViT), which is an extension of ViT, is used to identify paddy and wheat crop diseases. The ViT architecture was initially proposed by Dosovitskiy et al. [49] to address the limitations of CNNs in modeling global contextual relationships within visual data. By representing an image as a sequence of fixed-size patches and applying self-attention mechanisms, ViT captures long-range dependencies and holistic spatial interactions. It provides a robust and scalable alternative to CNNs by effectively capturing global features for improved performance in large-scale image recognition tasks.
Traditional ViTs and CNNs often face trade-offs between capturing fine-grained local details and efficiently modeling long-range dependencies. The MaxViT architecture proposed by Tu et al. [50] addresses this drawback by integrating convolutional token embeddings, block-wise grid attention, and dilated axial attention in a multi-axis attention framework. In this manuscript, a ViT architecture was proposed, considering CBAM, SE, DW, and the ConvNeXt modules.
The CBAM was proposed by Woo et al. [51] to enhance feature representation by integrating channel and spatial attention mechanisms into a lightweight, end-to-end trainable form. It sequentially infers attention maps along the channel and spatial dimensions, allowing networks to focus on informative features while suppressing irrelevant ones. The CBAM improves performance across various tasks, such as image classification, object detection, and segmentation, with minimal computational overhead.
The SE network was introduced by Hu et al. [52] to enhance the representational capacity of convolutional networks by modeling inter-channel dependencies. It achieves this through a two-step process, i.e., squeeze (global information embedding) and excitation (adaptive recalibration of channel-wise features). These processes allow the network to capture more informative features. SE modules are lightweight and easily integrable.
The DW block was used in MobileNet by Chollet et al. [53] to reduce the computational complexity of standard convolutions in DNNs. It decomposes a conventional convolution into two operations: depth-wise convolution (which applies a single filter per input channel) and point-wise convolution (which combines these outputs using convolutions). This factorization significantly reduces the number of parameters.
ConvNeXt, proposed by Liu et al. [54], enhances ResNet-like architectures using features such as large kernel convolutions, inverted bottlenecks, and layer normalization. This enhances feature learning and accuracy without improving computational efficiency, making it suitable for large-scale visual tasks.
The computational complexity of the original MaxViT means that the model has more parameters and may not be suitable for edge devices due to resource and power constraints. The complexity is reduced in this work by incorporating CBAM, DW, SE, and ConvNeXt modules. The modified architecture used the following strategies:
- Reduction in filter counts: All convolutional layers, including those within the attention and feedforward components, use only eight filters, in contrast to the higher-dimensional feature maps typically used in the standard MaxViT.
- Shallow convolutional stem: The stem block comprises only two convolutions with stride 2, minimizing early-stage computation while preserving essential spatial features.
- Simplified CBAM and SE modules: Attention mechanisms inspired by the CBAM and SE utilize low-dimensional fully connected layers and minimal activation operations (e.g., global pooling, rectified linear unit (ReLU), and sigmoid). These are implemented without increasing the number of channels or introducing multi-head attention.
- DW: Spatial convolutions are replaced with depth-wise separable convolutions to minimize both the number of operations and parameters.
- Compact ConvNeXt block: The ConvNeXt component is retained in a minimal form by reducing convolutional depth and maintaining residual connections, thereby ensuring feature learning without excessive computation.
- Reuse and residual connections: Intermediate outputs are reused through skip connections and addition layers to facilitate gradient flow and reduce the need for deeper or wider layers.
- Global average pooling: Instead of fully connected layers for spatial flattening, global average pooling (GAP) is used to reduce feature dimensions before classification, further minimizing the parameter count.
The description of the various modules and their functionalities in the proposed architecture for crop disease classification is presented in Table 3.

Table 3.
Description and functionalities of various modules in the proposed DL model for crop disease classification.
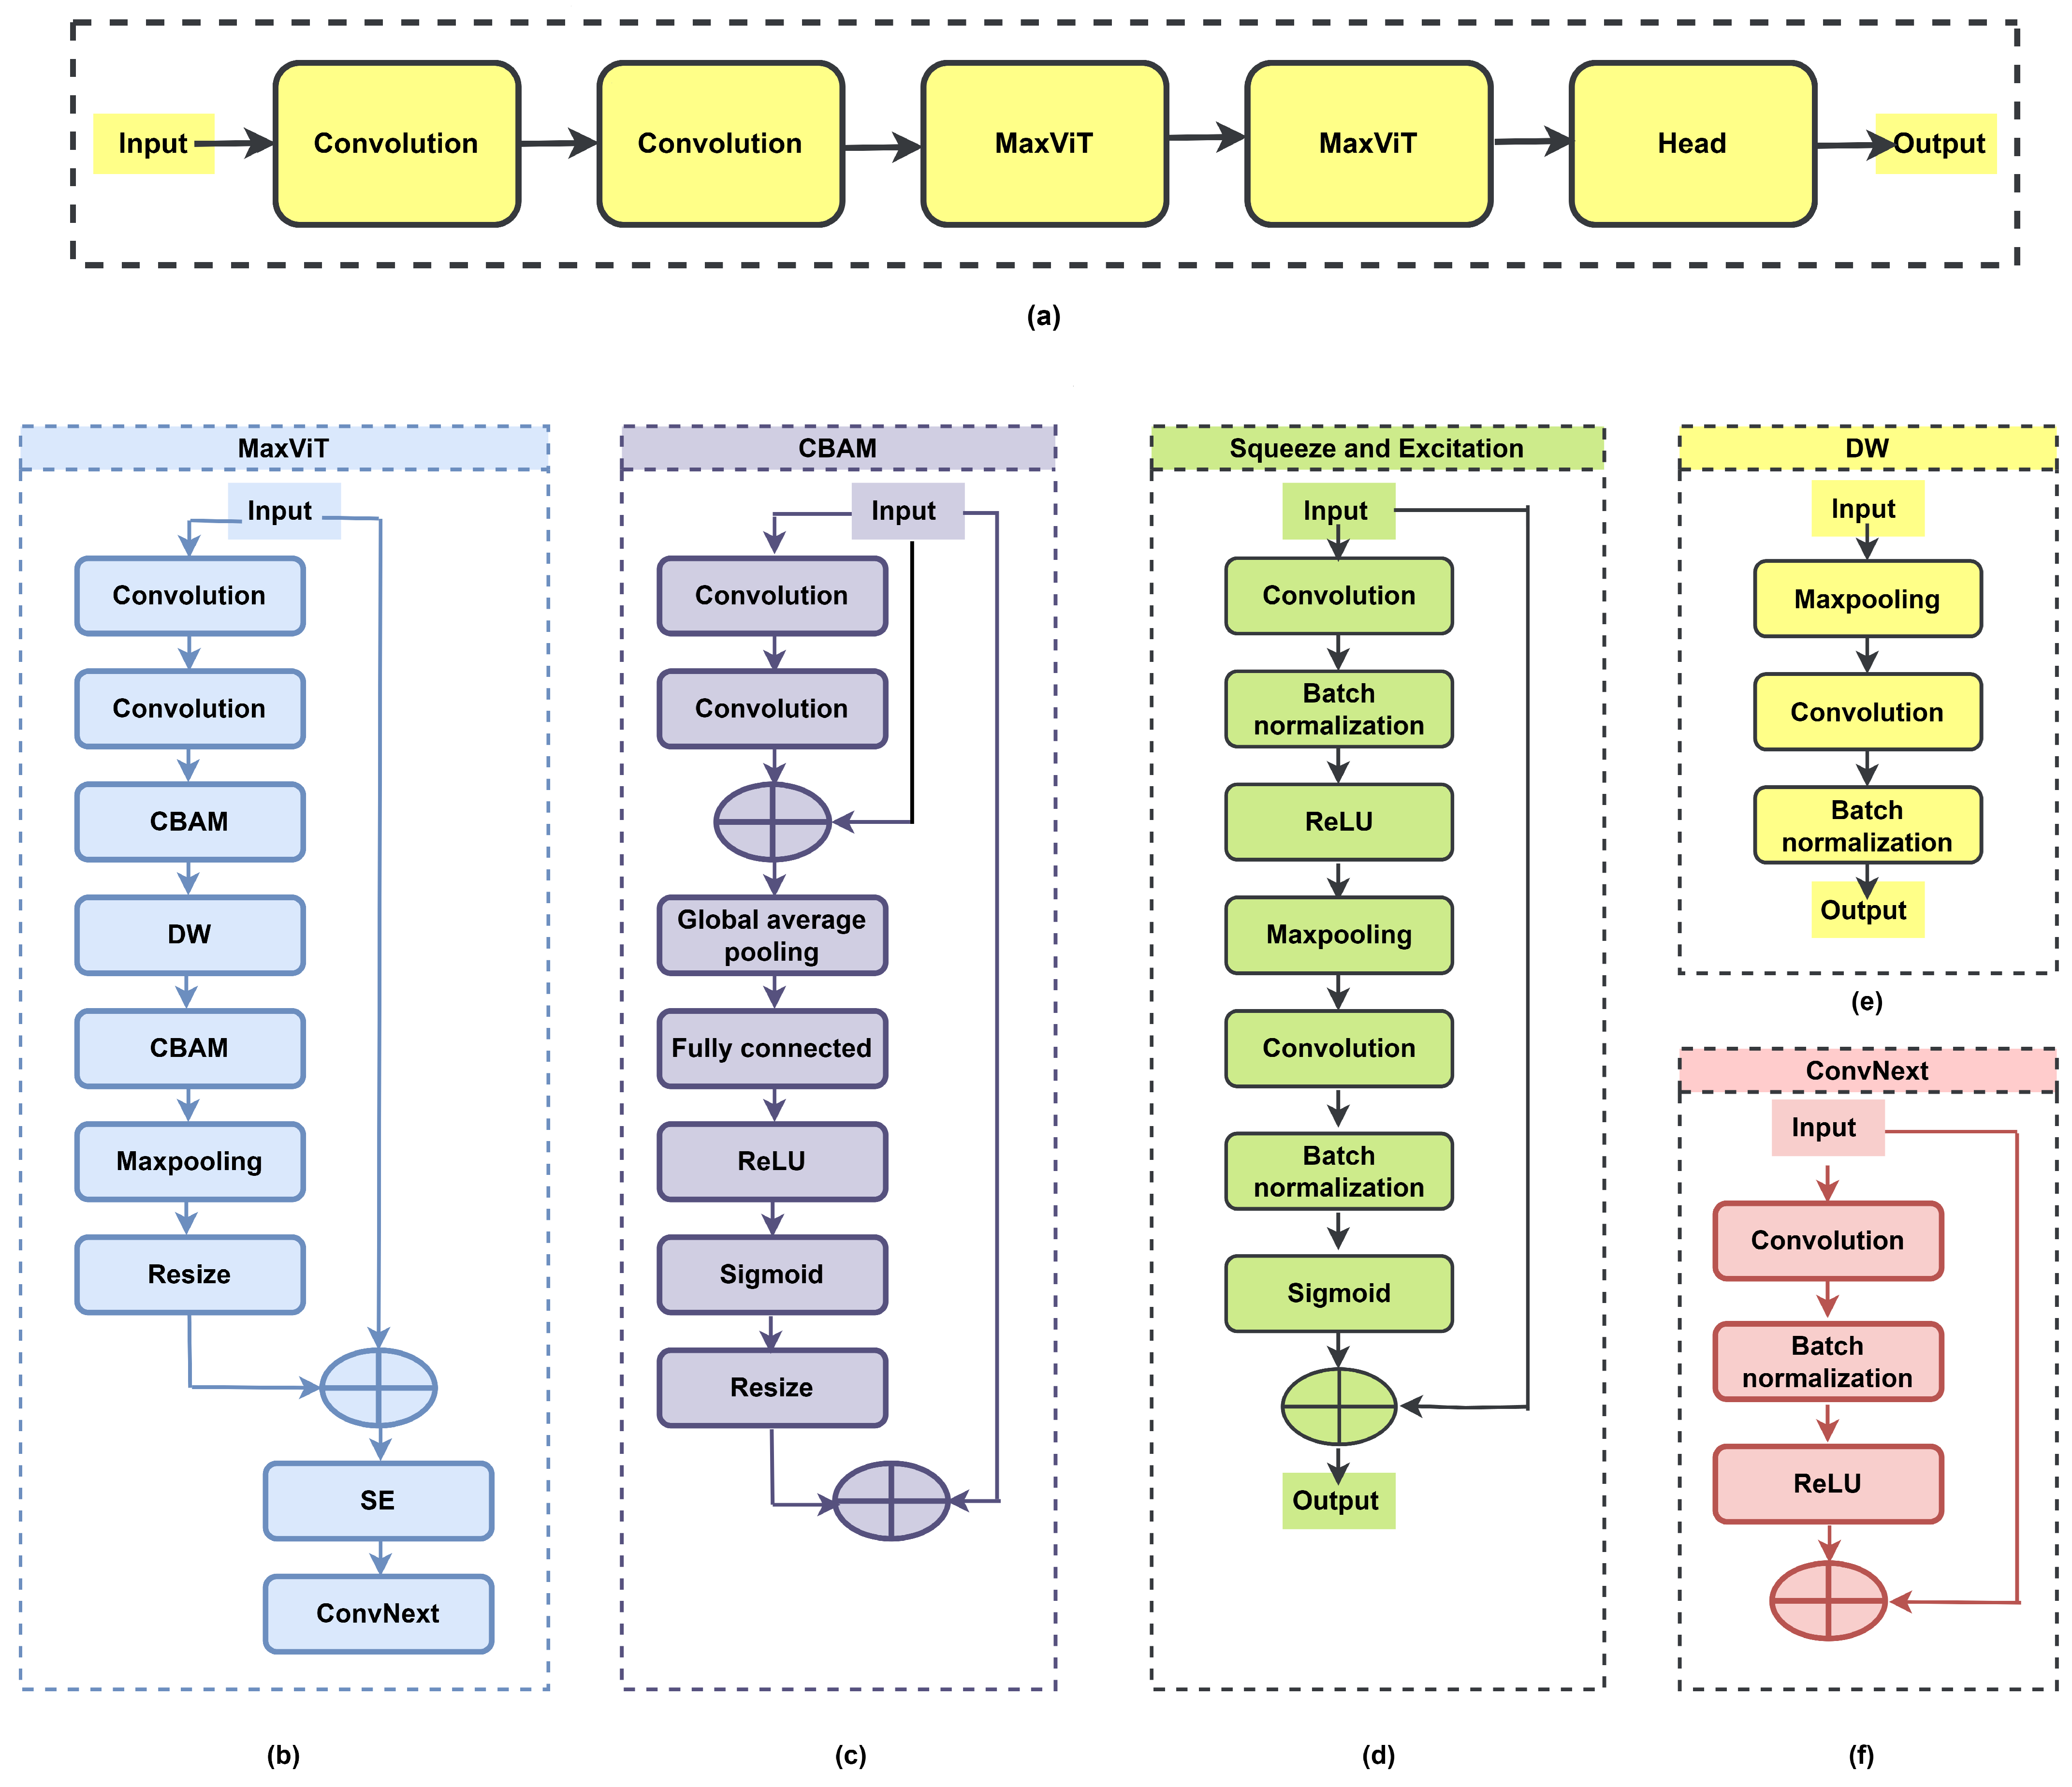
The proposed DNN architecture for crop (paddy and wheat) disease classification consists of a stem block with convolutional layers, a MaxViT module (two stages), and a classification head. The proposed DNN has a lightweight architecture (i.e., 814.7 K learnable parameters and 85 layers) and incurs low computational cost compared to existing pre-trained networks and ViTs. A block diagram illustrating the sequential stages of the proposed DNN model is depicted in Figure 1a. The significance and functionality of each block used in this model are described below. The proposed DL network consists of two stages of the MaxViT module, as presented in Figure 1b. The MaxViT module comprises convolution blocks, a CBAM module, a DW block, another CBAM module, max pooling, a resize layer, and an SE module arranged sequentially.

Figure 1.
The architecture of the proposed DNN for disease classification: (a) block diagram, (b) MaxViT module, (c) CBAM module, (d) SE module, (e) DW module, and (f) ConvNeXt module.
The CBAM module enhances feature representation by preserving only the important features across channels while eliminating redundant/unnecessary features. It ensures that attention is focused on features that contribute to disease classification. The convolution process, followed by a skip connection, extracts the local and global features and feeds them into the GAP layer to compress the spatial features. Sigmoid activation generates the channel-wise attention weights. The attention vector is up-scaled using a resize layer, thus aligning it with the original feature map size. The CBAM module focuses only on salient features through its attention mechanism and aids the DNN model in achieving better discrimination of crop diseases. The CBAM module is represented in Figure 1c. Considering as the input feature map and as the final refined output, the overall CBAM can be represented as
where is the input feature map, is the feature map after channel attention, is the final feature map after channel and spatial attention, denotes the channel attention map, denotes the spatial attention map, and ⊙ denotes element-wise multiplication.
The channel attention map can be expressed as
where is the average pooled feature map along the spatial dimensions of X, is the max-pooled feature map along the spatial dimensions of X, and denotes sigmoid activation.
The spatial attention output is formulated as
where and are the 2D maps produced by channel attention, ‘Conv’ denotes a convolutional layer, and represents channel-wise concatenation. Equations (1)–(4) are adapted from the CBAM formulation by Woo et al. [51], with notational adjustments to align with our implementation. In this work, the CBAM is modified, and the final output of this block is represented by , where is the transformed output obtained by passing the signal through GAP, FC, ReLU, sigmoid, and resize blocks. It is represented by , where is the transformation function. is the output obtained by passing the signal via two-stage convolution, i.e., . The two-convolution block performs channel attention. Spatial attention is performed by GAP, ReLU, sigmoid, and resize blocks.
The SE module (depicted in Figure 1d) aggregates spatial information and learns channel-wise dependencies. Sigmoid activation generates per-channel gating weights in [0, 1], which is applied to the feature maps to recalibrate channel importance. For any input feature map , the operations in the SE network are represented as follows:
where is the input feature map; is the output after the first convolution, batch normalization, and ReLU activation; is the downsampled feature map after max pooling; is the output after the second convolution and batch normalization; is the channel-wise attention vector obtained after sigmoid activation; is the output feature map of the SE block; denote convolutional layers (typically convolutions), denote batch normalization layers, is ReLU activation, represents the max pooling operation, is sigmoid activation, and ⊕ denotes element-wise addition.
Equations (5)–(9) represent a modified version of the SE mechanism formulated by Hu et al. [52]. The original SE block utilizes GAP followed by fully connected layers. But, the proposed architecture introduces convolutional layers, batch normalization, and max pooling to enhance spatial encoding prior to channel recalibration. This module uses element-wise addition in place of element-wise multiplication.
The DW layer (represented in Figure 1e) applies spatial filtering to each channel, allowing lightweight, channel-specific feature learning without cross-channel mixing. It ensures minimal overhead in scaling the network, thereby preserving attention-weighted features from the CBAM block. Given an input feature map , the output of the depth-wise convolution block can be formulated as follows:
where is the input feature map, denotes the max pooling operation, denotes the depth-wise convolution operation, denotes the batch normalization operation, and is the output feature map of the DW block. Equation (10) represents a lightweight feature extraction block inspired by the depth-wise convolutional concept introduced by Chollet et al. [53] in MobileNet, with adaptations (preceding pooling step and batch normalization) for lightweight features in the proposed architecture.
The ConvNeXt module (consisting of convolution, batch normalization, and ReLU activation layer) helps capture the hierarchical features for better discrimination of crop diseases. The ConvNeXt block used in the proposed DNN model is illustrated in Figure 1f. The output of the ConvNeXt block for an input feature map can be formulated as follows:
where is the input feature map, denotes the convolution operation, denotes the batch normalization operation, denotes the activation function (ReLU), ⊕ denotes element-wise addition (skip connection), and is the output feature map of the ConvNeXt block. Equation (11) represents a modified variant of the ConvNeXt block, adapted from the architecture originally proposed by Liu et al. [54]. The original formulation includes depth-wise convolutions, layer normalization, and GELU activation. But, the proposed ConvNext architecture employs standard convolution, batch normalization, and ReLU for computational efficiency in the target domain. Equations associated with the proposed MaxViT architecture are mentioned in Equation (12). In this case, I and represent input and output of the MaxViT module, respectively.
3.1. Dataset
The experimental evaluation of the proposed approach was conducted using images sourced from publicly accessible repositories and real-field samples collected from local paddy fields in the Lalgudi region of Tiruchirapalli, Tamil Nadu, India. Images of paddy crop diseases were partly sourced from the Mendeley data platform, comprising four categories, i.e., bacterial blight, blast, brown spot, and tungro, with a resolution of pixels. These were combined with locally acquired field images and categorized into eight disease classes, resulting in a unified dataset of 7857 samples. To ensure the reliability and integrity of the newly curated paddy crop disease dataset, a systematic validation process was undertaken.
Labeling accuracy: All images were initially labeled based on expert agronomist annotations and then cross-verified by a secondary reviewer to ensure consistency. Disagreements regarding labels were resolved through consultation with domain experts. This two-stage verification minimized labeling errors and enhanced the overall annotation quality.
Class distribution: The dataset consists of eight distinct classes of paddy crop images, including seven disease categories and one healthy class. The distribution of images was examined to avoid severe class imbalance. Although minor variations exist due to natural data availability, the class frequencies were sufficiently balanced to enable fair learning across categories. Detailed statistics for the dataset are provided in Table 4.

Table 4.
Details of custom paddy crop disease dataset.
Image quality assessment: To evaluate image clarity, resolution, and content relevance, all images were visually inspected, and images with low-resolution samples, noisy backgrounds, and duplicates were removed. Only images with sufficient visual information regarding the symptomatic region of the plant were retained. This ensured high-quality inputs to the training model and mitigated the risk of misleading patterns. These validation steps collectively enhance the reliability of the dataset and ensure its suitability for paddy disease classification. A summary of the dataset is provided in Table 4.
The generalizability of the model for prediction of other crop diseases is evaluated using a wheat disease dataset (5000 images, 5 classes) sourced from the Kaggle platform. The distribution of images in the wheat dataset is presented in Table 5.

Table 5.
Dataset description for wheat crop diseases.
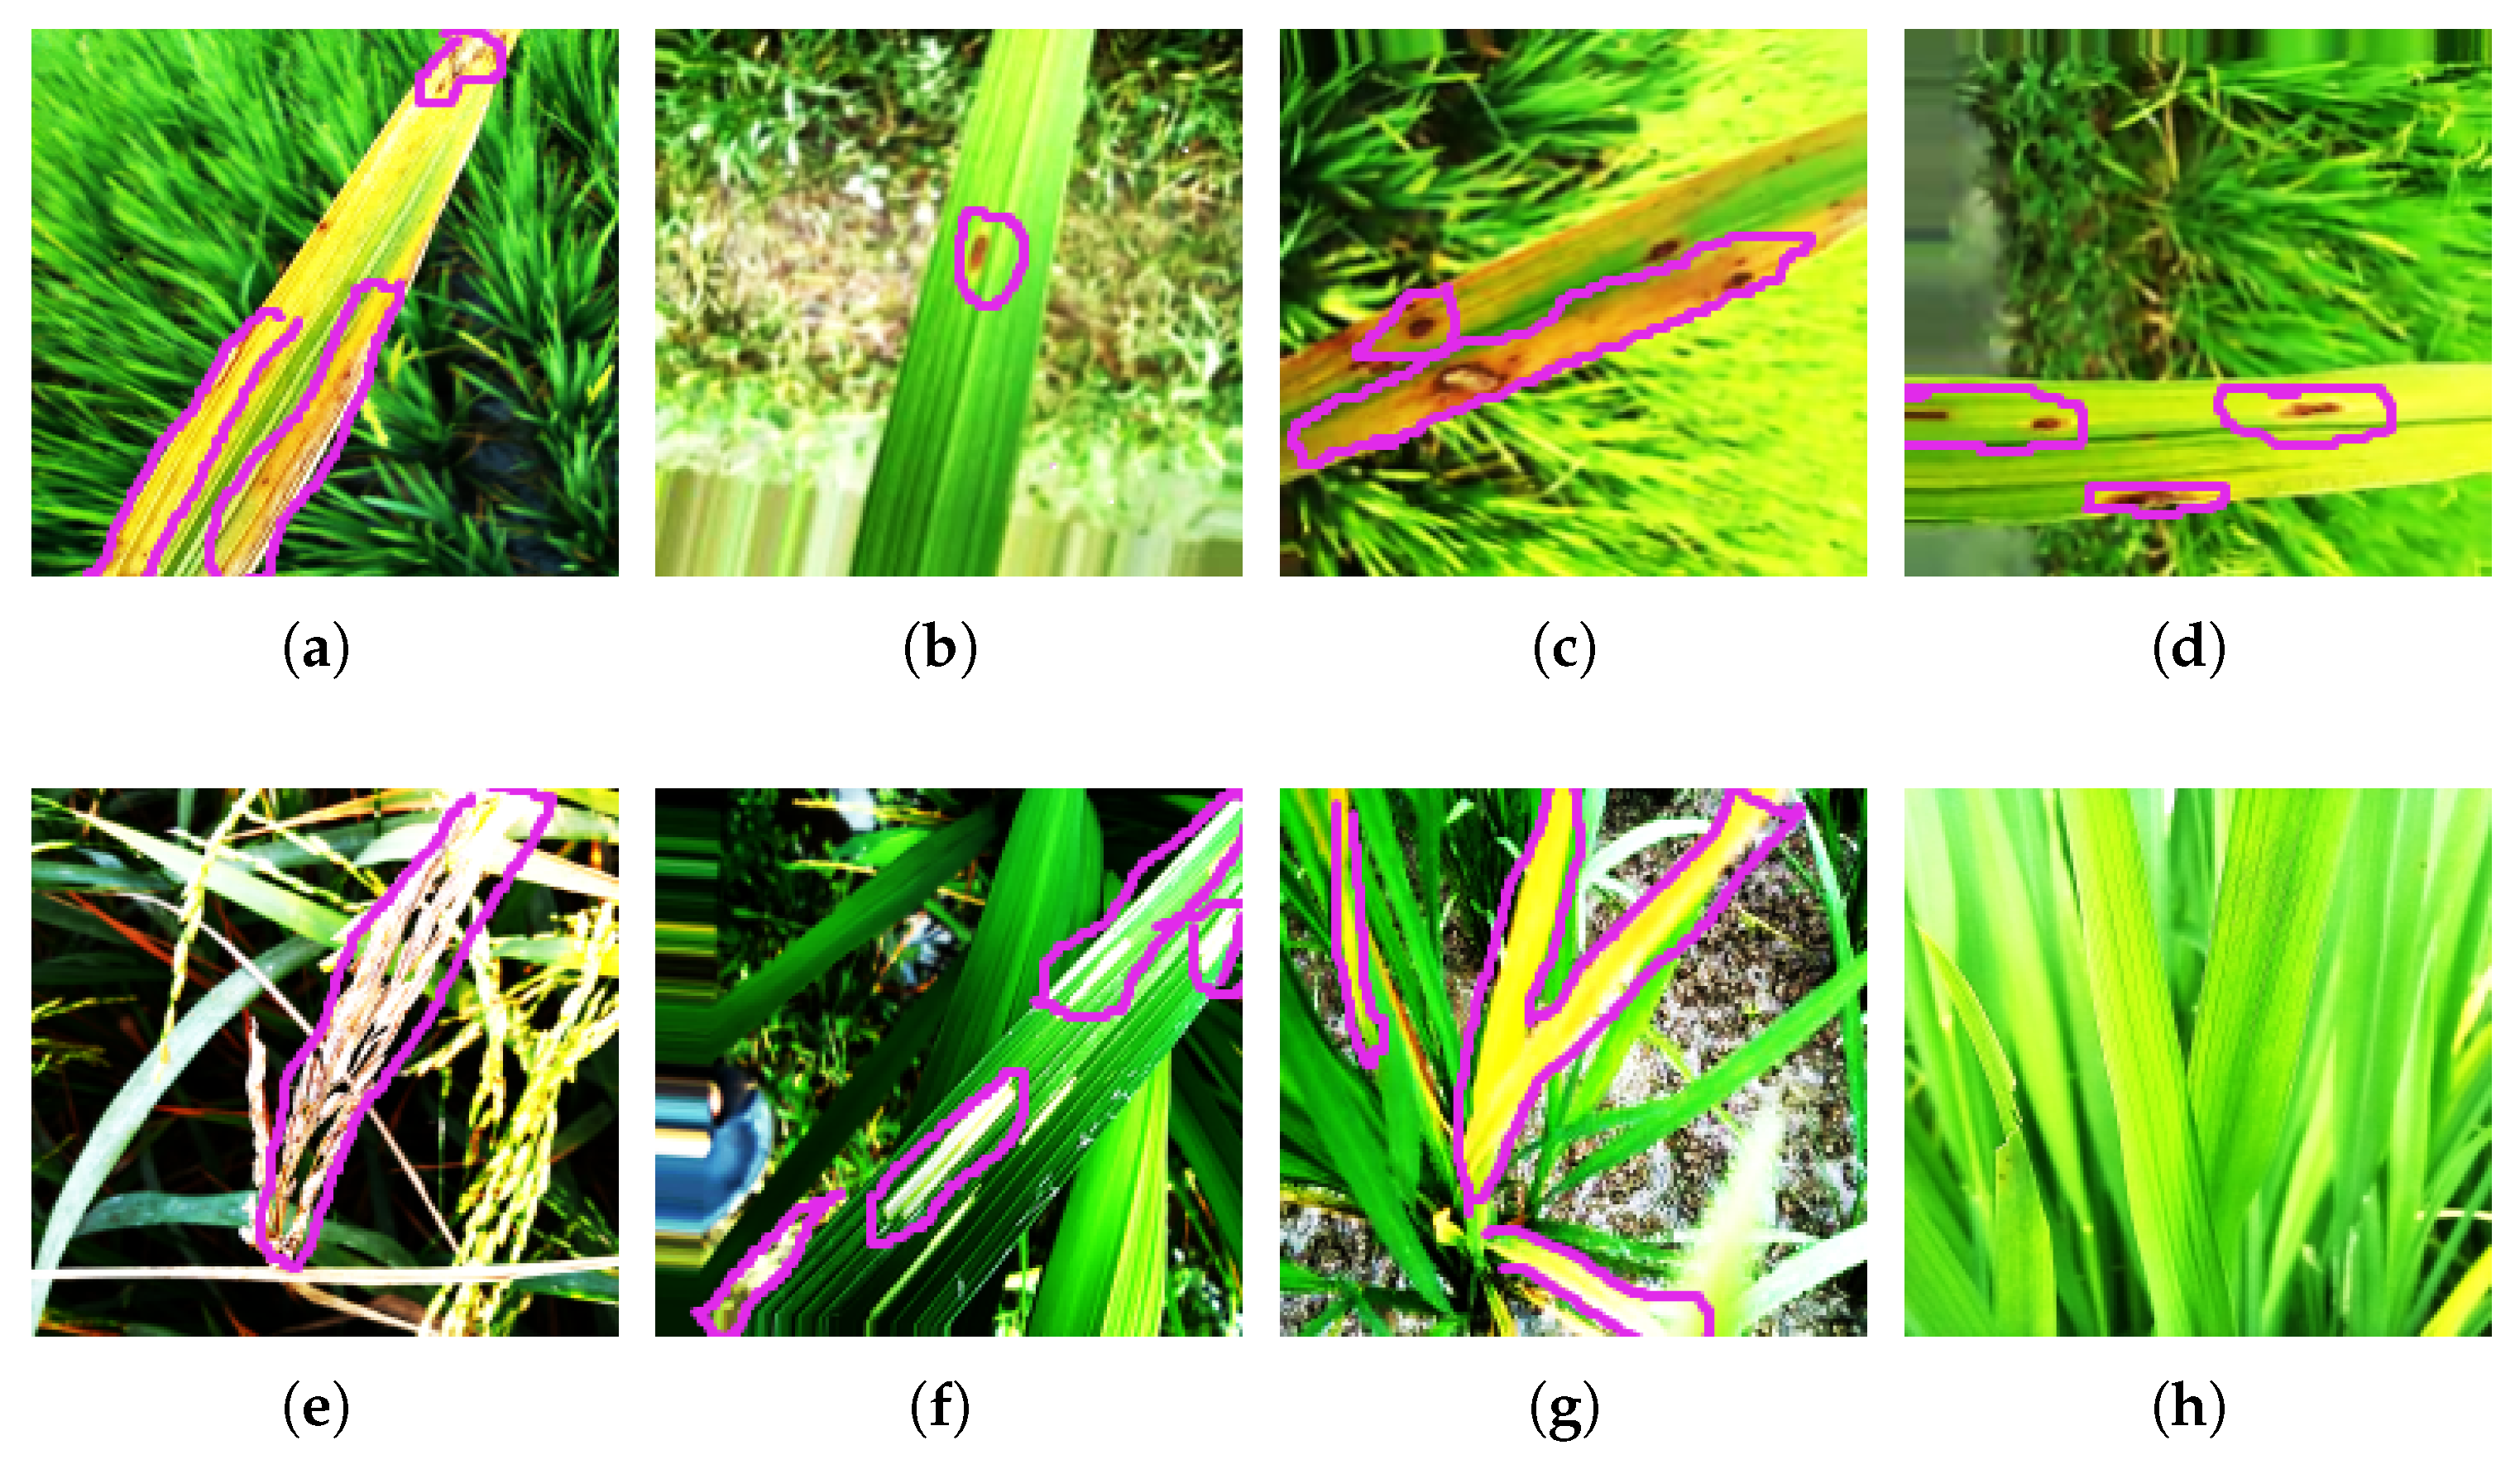
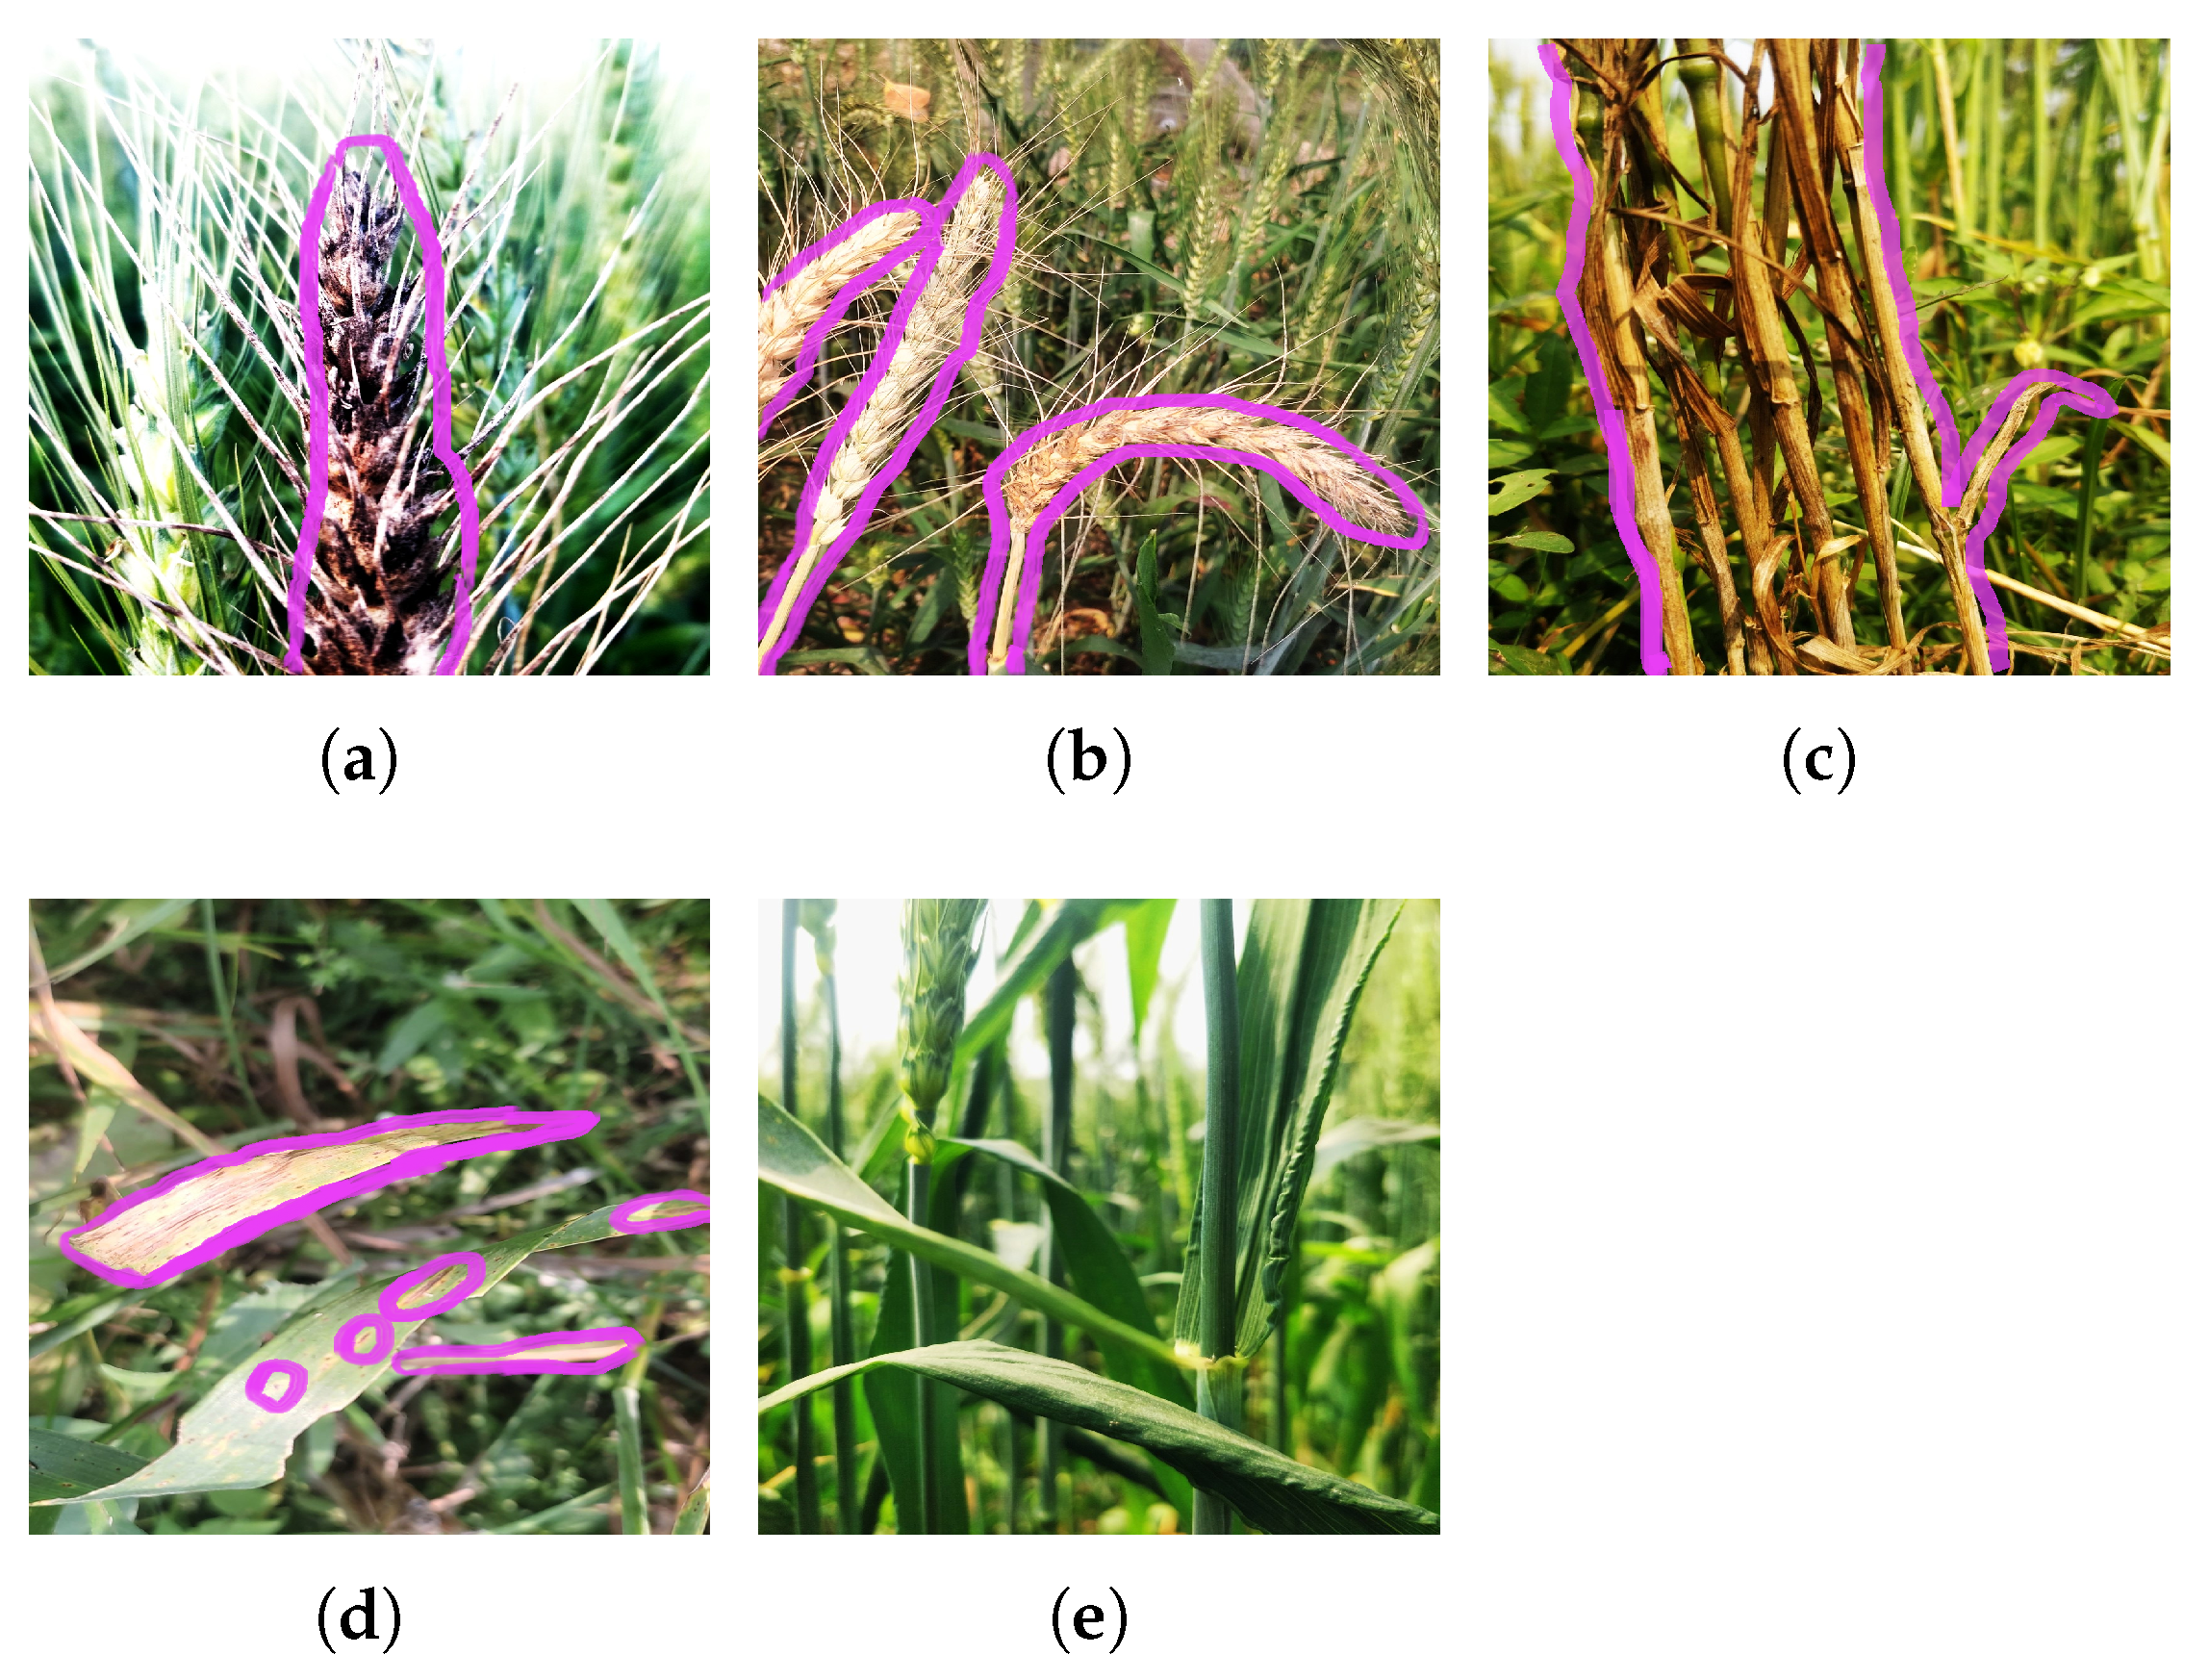
Each image of paddy or wheat illustrates the distinct visual patterns, color variations, and lesion characteristics associated with each disease class. The diseased regions are highlighted with a pink color boundary. These images represent the visual complexity and similarity of different disease types. Images corresponding to each class of paddy and wheat are shown in Figure 2 and Figure 3.

Figure 2.
Images highlighting the diseased regions of various paddy crop diseases available in the paddy dataset: (a) bacterial blight, (b) brown spot, (c) leaf blast, (d) narrow brown spot, (e) neck blast, (f) rice hispa, (g) tungro, and (h) healthy.

Figure 3.
Images representing different wheat diseases available in wheat dataset: (a) black point, (b) blast, (c) fusarium root rot, (d) leaf blight, and (e) healthy.
To evaluate the impact of the train–test split ratio on model performance, experiments were carried out with four different configurations: 90:10, 80:20, 75:25, and 70:30. For each train–test split ratio, the images in the dataset were randomly shuffled. Among the various train–test ratios, the 80:20 split ratio provided the highest training and testing accuracies, with a minimal difference between them. Other train–test ratios resulted in lower performance. Therefore the 80:20 train–test ratio was adopted for performing the final experiments.
3.2. Performance Metrics
The classification ability of the proposed network in identifying diseases in paddy and wheat crops was systematically evaluated using a comprehensive set of performance metrics. Key indicators include the Matthews correlation coefficient (MCC) and several measures derived from the confusion matrix. The confusion matrix provides the distribution of prediction outcomes—namely, true positives (TP), true negatives (TN), false positives (FP), and false negatives (FN), which are used to compute accuracy, sensitivity (recall), specificity, mean accuracy, precision, and F1-score [55,56,57]. These metrics collectively provide a robust assessment of the model’s effectiveness, ensuring its suitability for deployment in precision agriculture settings. The evaluation metrics, along with their corresponding mathematical expressions, are summarized in Table 6.

Table 6.
Performance metrics.
4. Results and Discussion
The proposed DNN model, consisting of MaxViT, CBAM, SE, DW, and ConvNeXt modules, was developed in MATLAB R2023b installed on a machine having the hardware configuration described in Table 7.

Table 7.
Hardware and software configurations.
Experimental evaluation for the prediction of crop diseases was carried out by adjusting the learning rates (from 0.00001 to 0.001), varying the epochs (from 2 to 6 with a step size of 2), batch size (32), L2 regularization, early stopping (enabled), and the Adam optimizer. The classification accuracies with different hyperparameters are listed in Table 8.

Table 8.
Experimental evaluation of the proposed DNN architecture for the classification of wheat and paddy crop diseases.
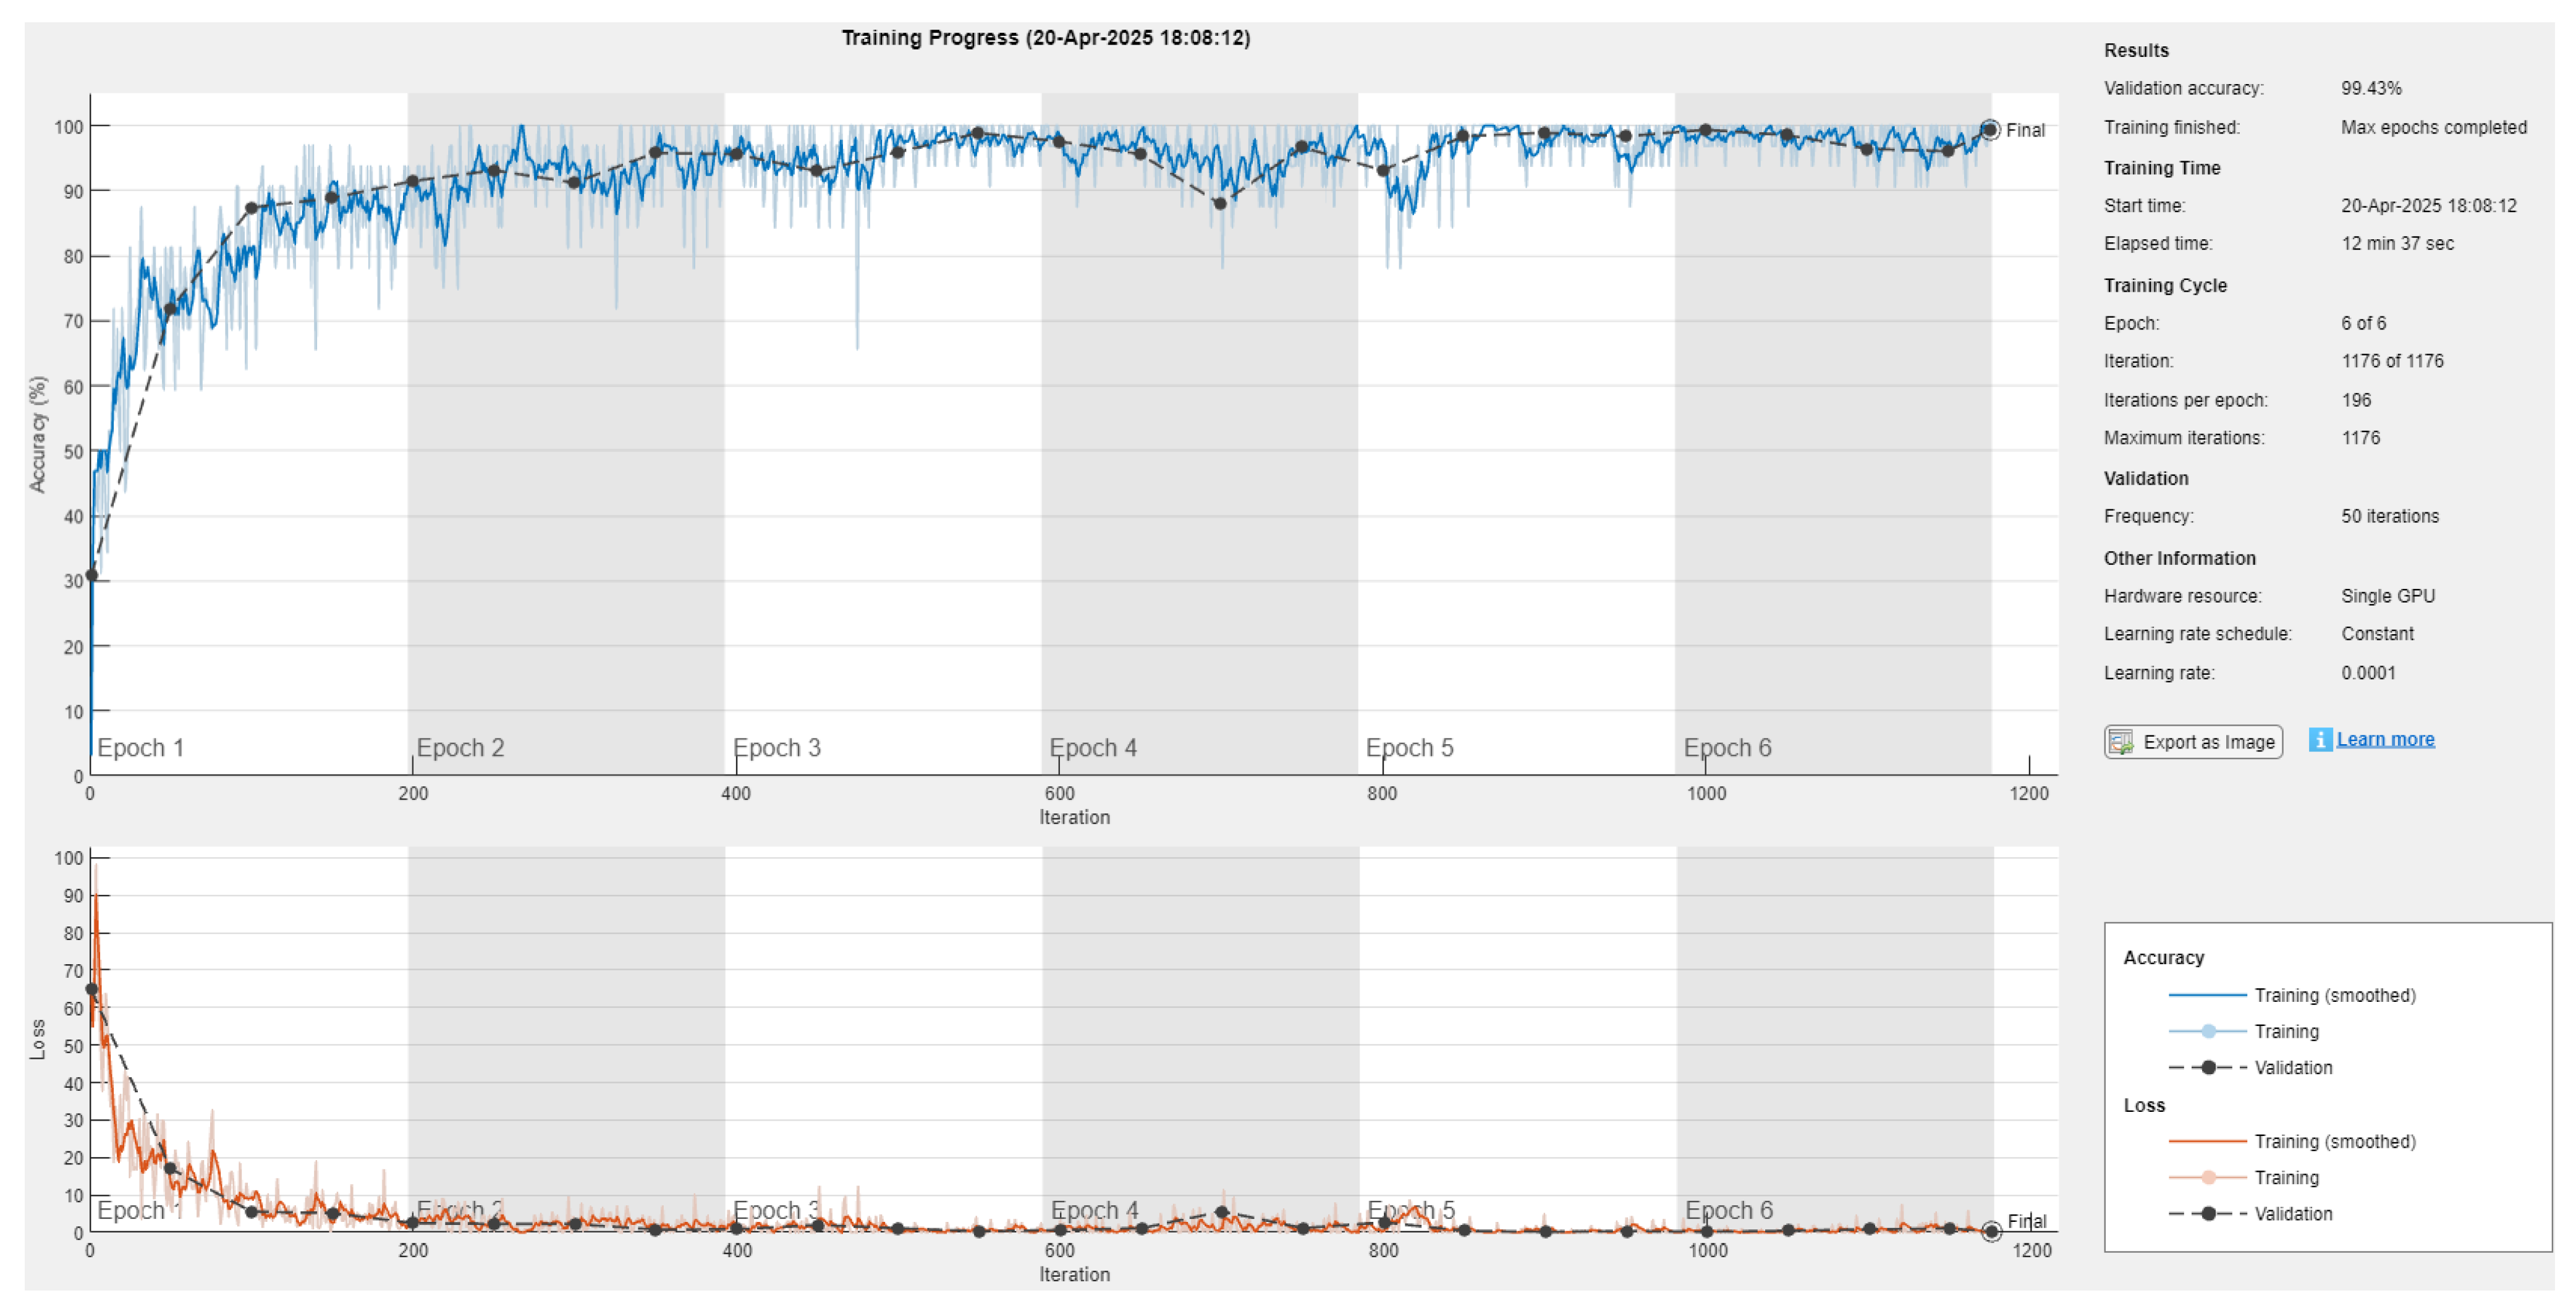
From Table 8, it is inferred that the highest accuracies, 99.43% (for paddy dataset) and 94% (for wheat dataset), were attained using six epochs with a learning rate of 0.0001 and the Adam optimizer.
The class-wise performance metrics (such as accuracy, sensitivity, specificity, precision, F1-score, and MCC) were evaluated on the paddy and wheat datasets with the selected hyperparameters (epoch: 6; LR: 0.0001; optimizer: Adam; and batch size: 32). During the training process, overall accuracies of 99.43% and 94% were reported for the paddy and wheat datasets. For the paddy dataset, the highest performance (100%) was attained for the brown spot, leaf blast, narrow brown spot, and neck blast classes, whereas the lowest accuracy (99.43%) was reported for the bacterial blight class. When experimenting on the wheat dataset, the highest accuracy (98.20%) was recorded for the blast and healthy classes, whereas the lowest accuracy was observed for fusarium root rot. The performance metrics for the paddy and wheat datasets during training are presented in Table 9.

Table 9.
Comparison of results on crop datasets during training.
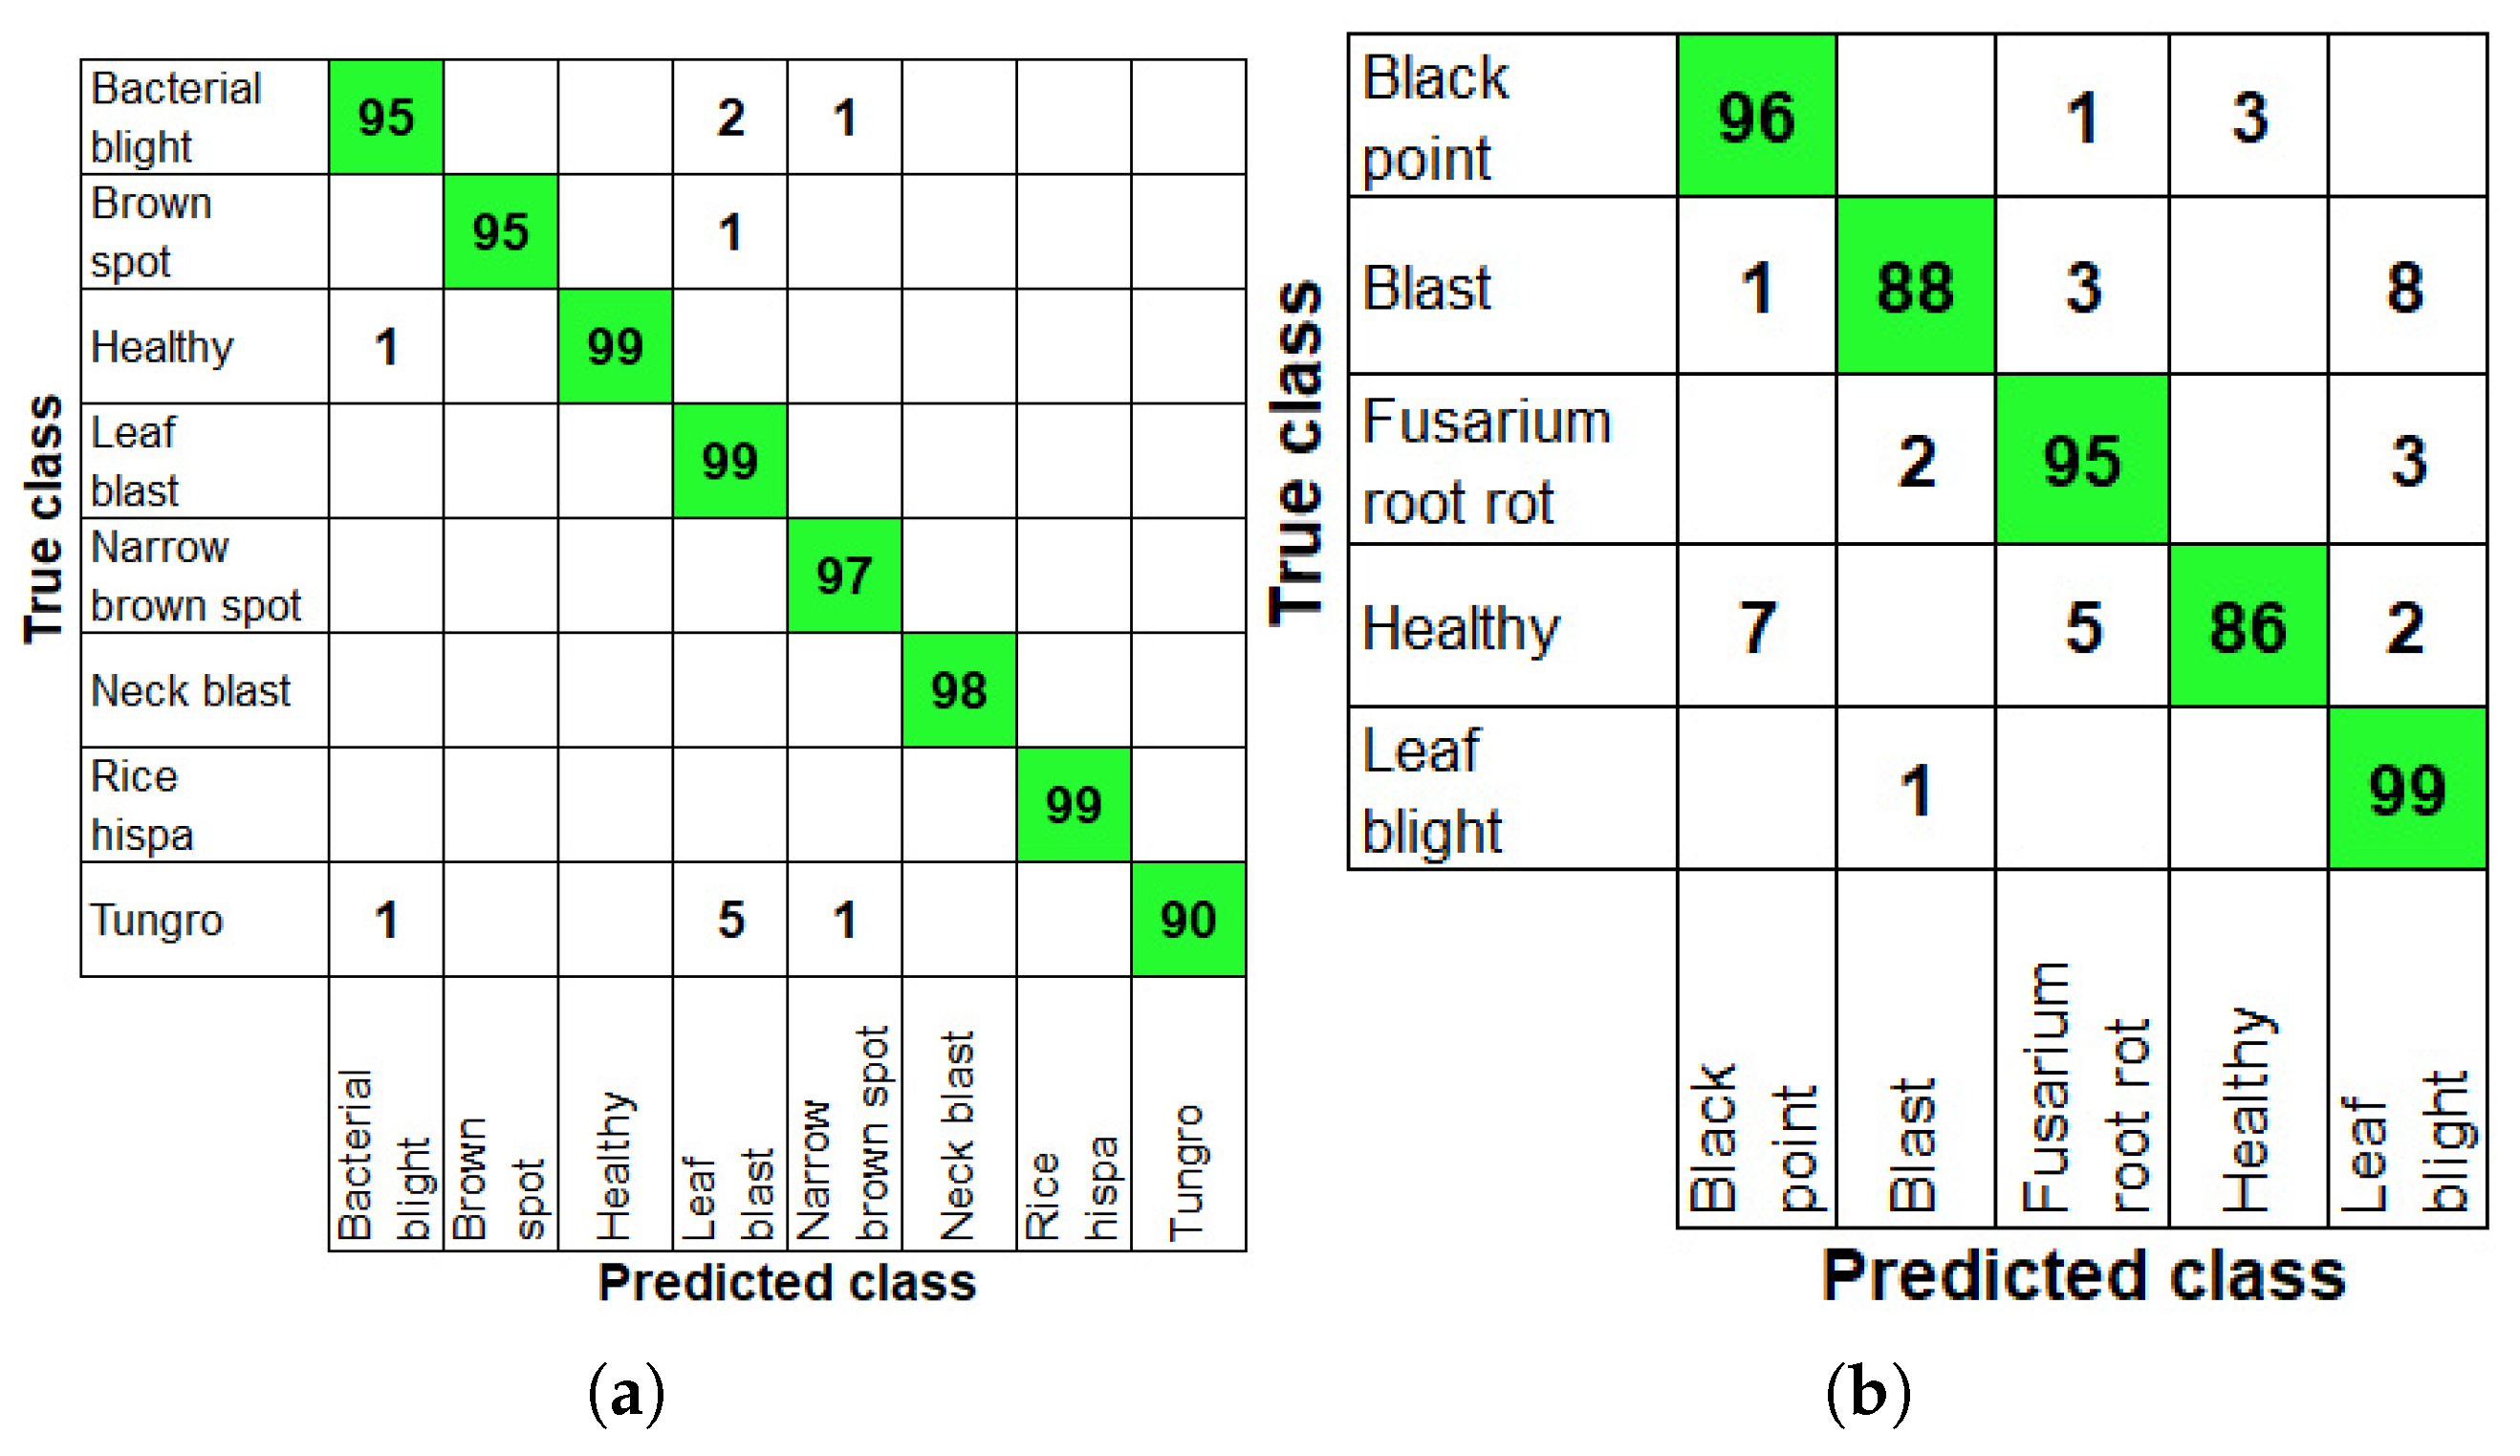
Table 10 provides the classification performance metrics (class-wise) evaluated on the paddy and wheat datasets during the testing process. Overall testing accuracies of 98.47% and 92.8% were recorded for the paddy and wheat datasets. In the testing process, the highest performance (100%) in all metrics was attained for the neck blast and rice hispa classes. The lowest classification accuracy, 98.98%, was noted for the leaf blast class in the paddy dataset. When experimenting on the wheat dataset, the highest accuracy (97.6%) was obtained for fusarium root rot and the lowest accuracy (96.60%) was reported for the healthy class. The confusion matrix plots obtained during testing on the paddy and wheat databases are illustrated in Figure 4.

Table 10.
Comparison of results on crop datasets during testing.

Figure 4.
Confusion matrices illustrating the classification performance of the proposed model during testing: (a) for paddy crop diseases and (b) for wheat crop diseases.
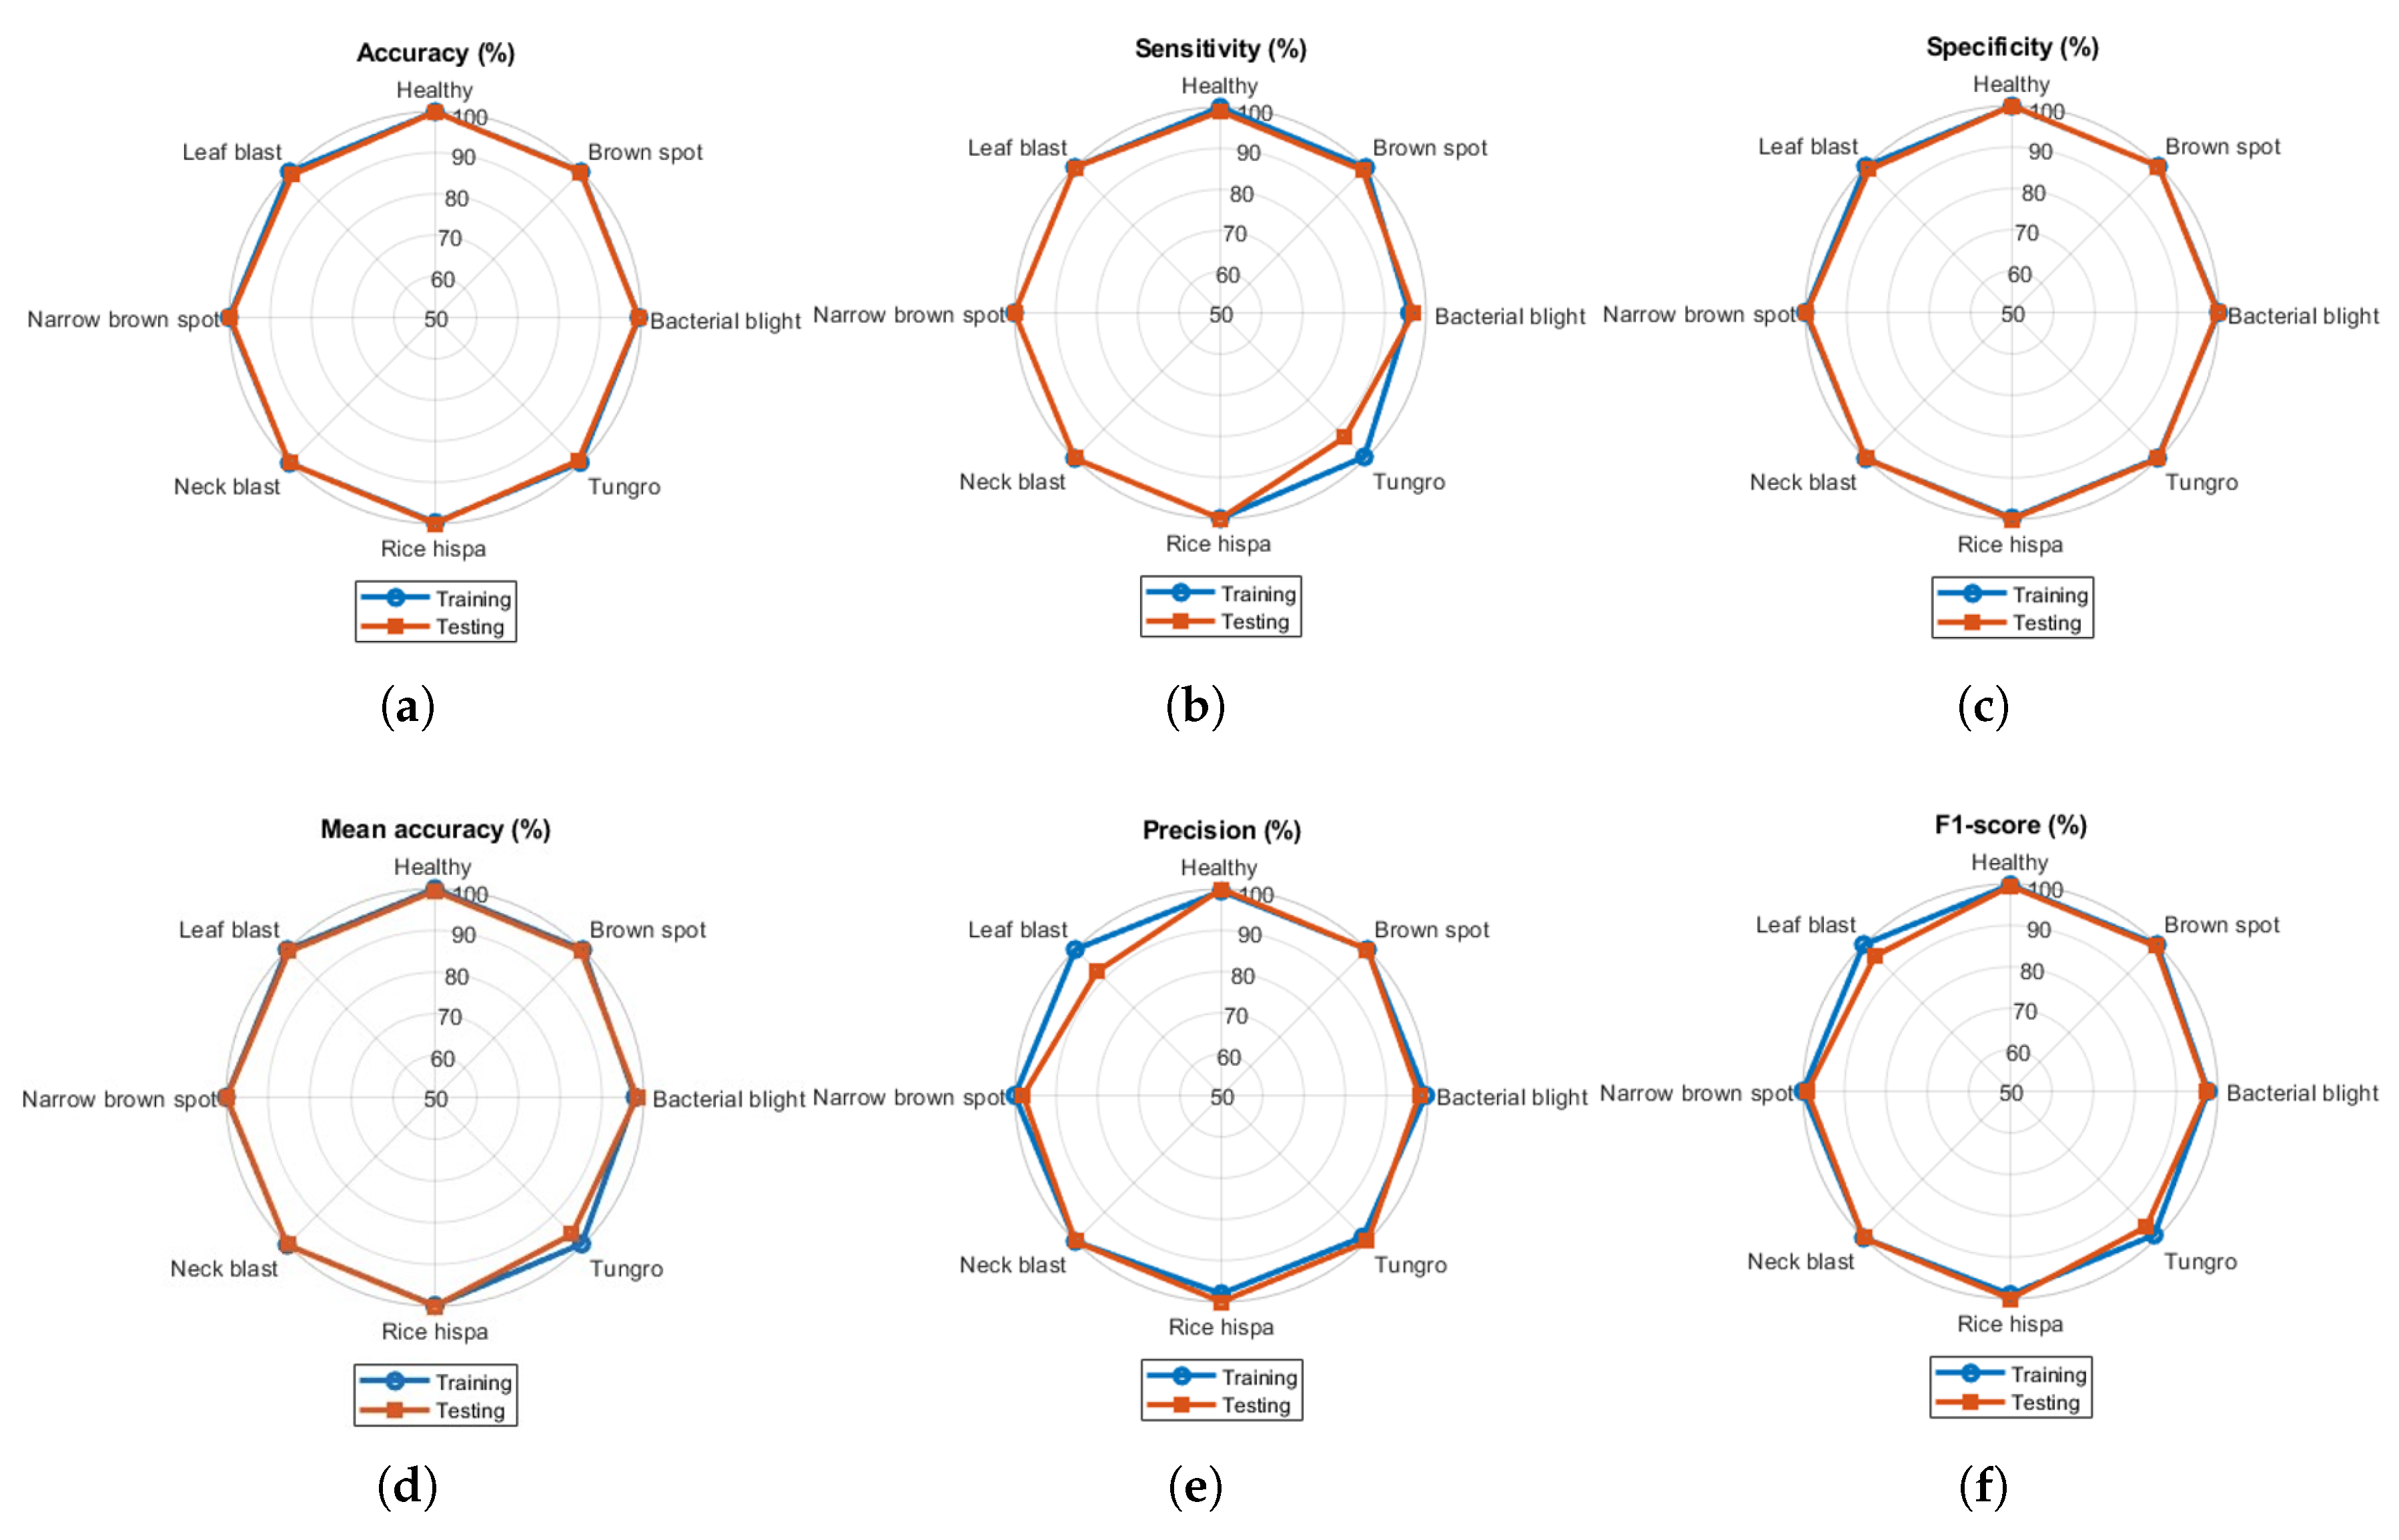
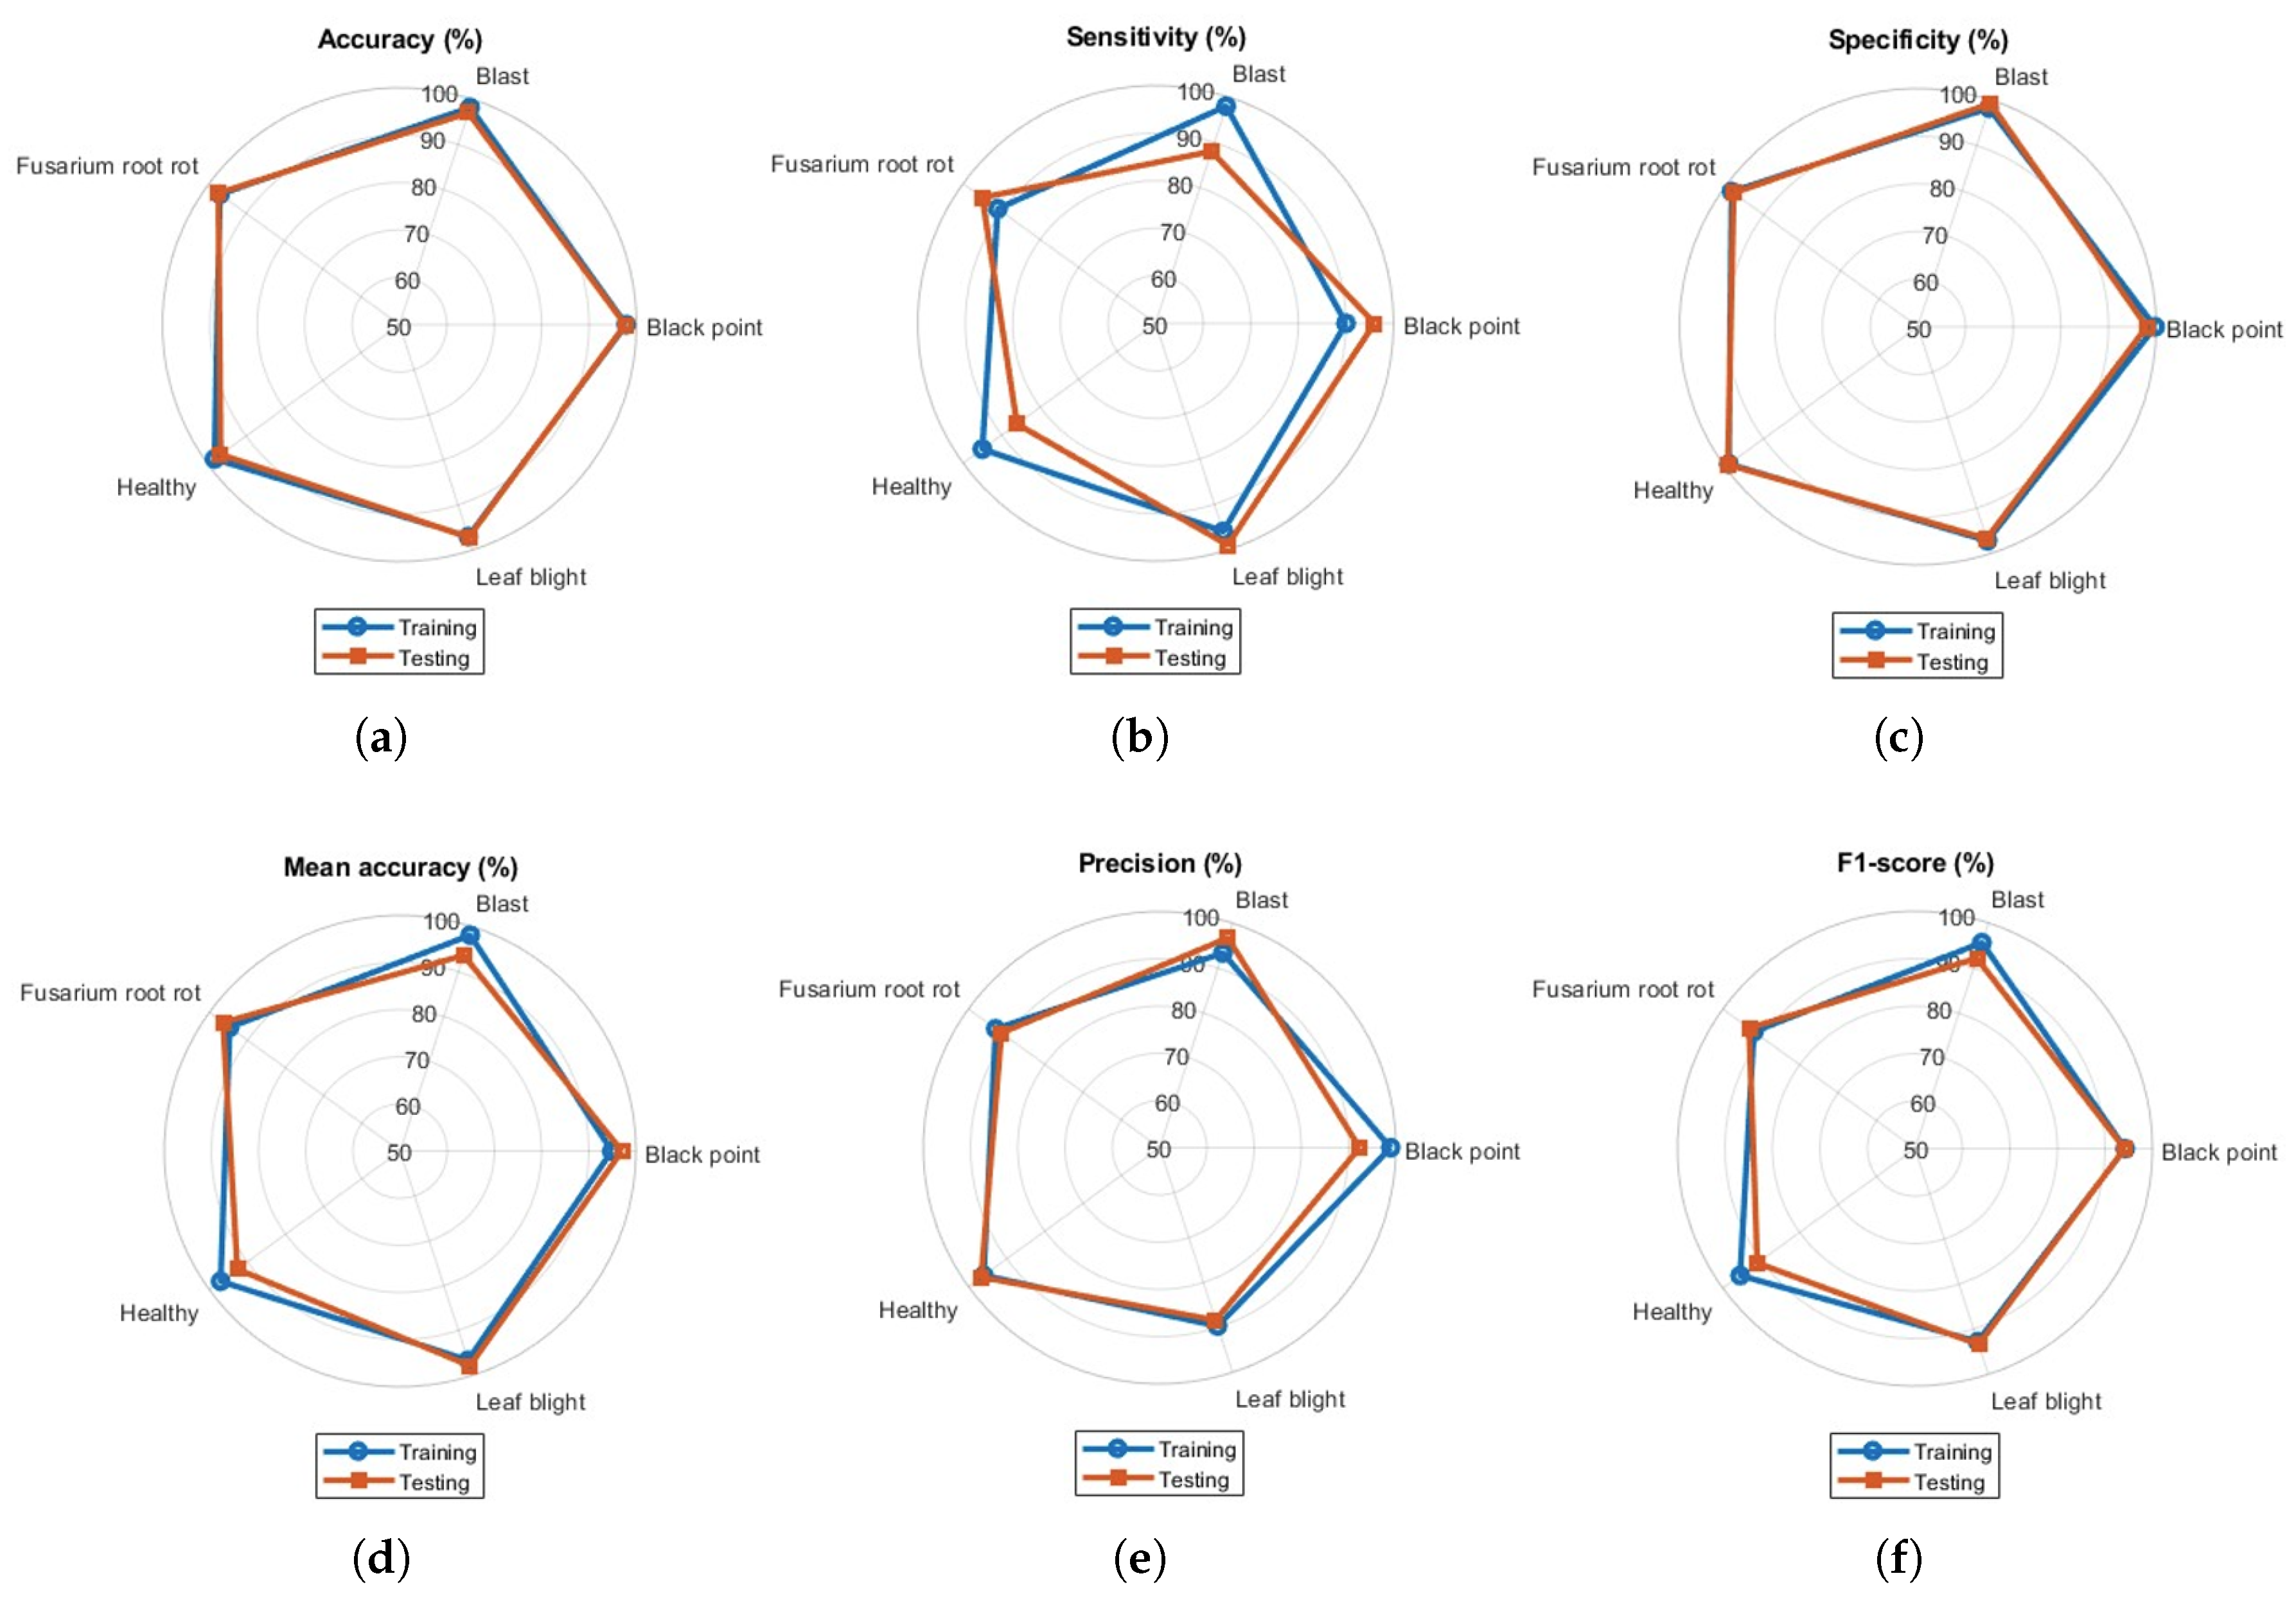
Spider charts are presented to display multiple evaluation metrics (such as accuracy, sensitivity, specificity, MAcc, precision, and F1-score) together to compare the overall performance for all classes at a glance. The radial visualization highlights variations in diagnostic efficacy. Spider charts for both training and testing of the model are presented in Figure 5.

Figure 5.
Spider charts presenting performance metrics for all classes in paddy dataset: (a) accuracy, (b) sensitivity, (c) specificity, (d) mean accuracy, (e) precision, and (f) F1-score.
All the metrics were found to be above 90%. The gap between training and testing performance was very small, representing the ideal classification model for classifying paddy crop diseases. During testing, the model demonstrated reduced sensitivity and precision for tungro and leaf blast, relative to the remaining paddy crop disease classes. The overlapping of training and testing accuracies in the spider chart reveals model consistency and generalization gaps. Similarly, the spider charts for wheat crop disease classification for five classes are presented in Figure 6. Visualization of the performance metrics shown in Figure 6 illustrates the model’s classification ability for other databases. Sensitivity and precision values were found to be less than 90% for the blast and healthy classes, respectively.

Figure 6.
Spider charts presenting performance metrics for all classes in wheat dataset: (a) accuracy, (b) sensitivity, (c) specificity, (d) mean accuracy, (e) precision, and (f) F1-score.
The training and validation loss curves demonstrate the model’s convergence behavior and its robustness to over-fitting. These plots provide clear evidence that the model converged effectively and maintains a consistent gap between training and validation losses, indicating that over-fitting was minimal. The training and validation loss curves are presented below in Figure 7.

Figure 7.
Variation in performance and loss of the model with respect to epoch. The top curve represents training and validation accuracies with respect to epoch. The bottom curve represents training and validation losses with respect to epoch.
4.1. Cross-Fold Validation
To evaluate the generalization capability and robustness of the proposed model, a five-fold cross-validation strategy was adopted. This step was taken to ensure that the performance estimates were not biased by a single train–test split ratio, especially for datasets with limited sample sizes or class imbalance. Initially, the custom paddy dataset comprising eight distinct classes was randomly partitioned into five equal and mutually exclusive folds, maintaining the original class distribution in each fold (i.e., stratified splitting). In each of the five iterations, one fold was reserved as the validation set, and the remaining four folds were used for model training. This procedure ensured that every image in the fold within the dataset was used once for validation and four times for training. The model was trained and then evaluated on the corresponding validation set. The performance metrics (such as accuracy, sensitivity, specificity, precision, F1-score, and MCC) were recorded individually for each class in every fold. Subsequently, for each metric, both per-class averages and macro-averaged scores across all folds were calculated. The mean and standard deviation (SD) of each metric across the five folds are reported in Table 11 to assess the consistency and reliability of the model’s performance across different data splits. This cross-validation approach provided a statistically sound evaluation of the model in multi-class settings, where each class’s contribution to the overall performance was equally weighted through macro-averaging.

Table 11.
Performance evaluation metrics of the proposed model for 5-fold cross-validation.
The performance metrics summarized in Table 11 indicate that the proposed model achieved consistently high classification performance across all eight rice disease classes. With a macro-averaged sensitivity of 97.30%, specificity of 99.62%, and F1-score of 97.29%, the model demonstrated strong capability in both identifying diseased samples and minimizing false detections. The high value of macro-averaged MCC (i.e., 0.9699) further reflected robust predictive reliability across class distributions. These results affirm the model’s effectiveness and generalizability for multi-class rice disease classification. The low standard deviations further suggested the stability and consistency of the model across different validation folds.
4.2. Grad-CAM Visualization
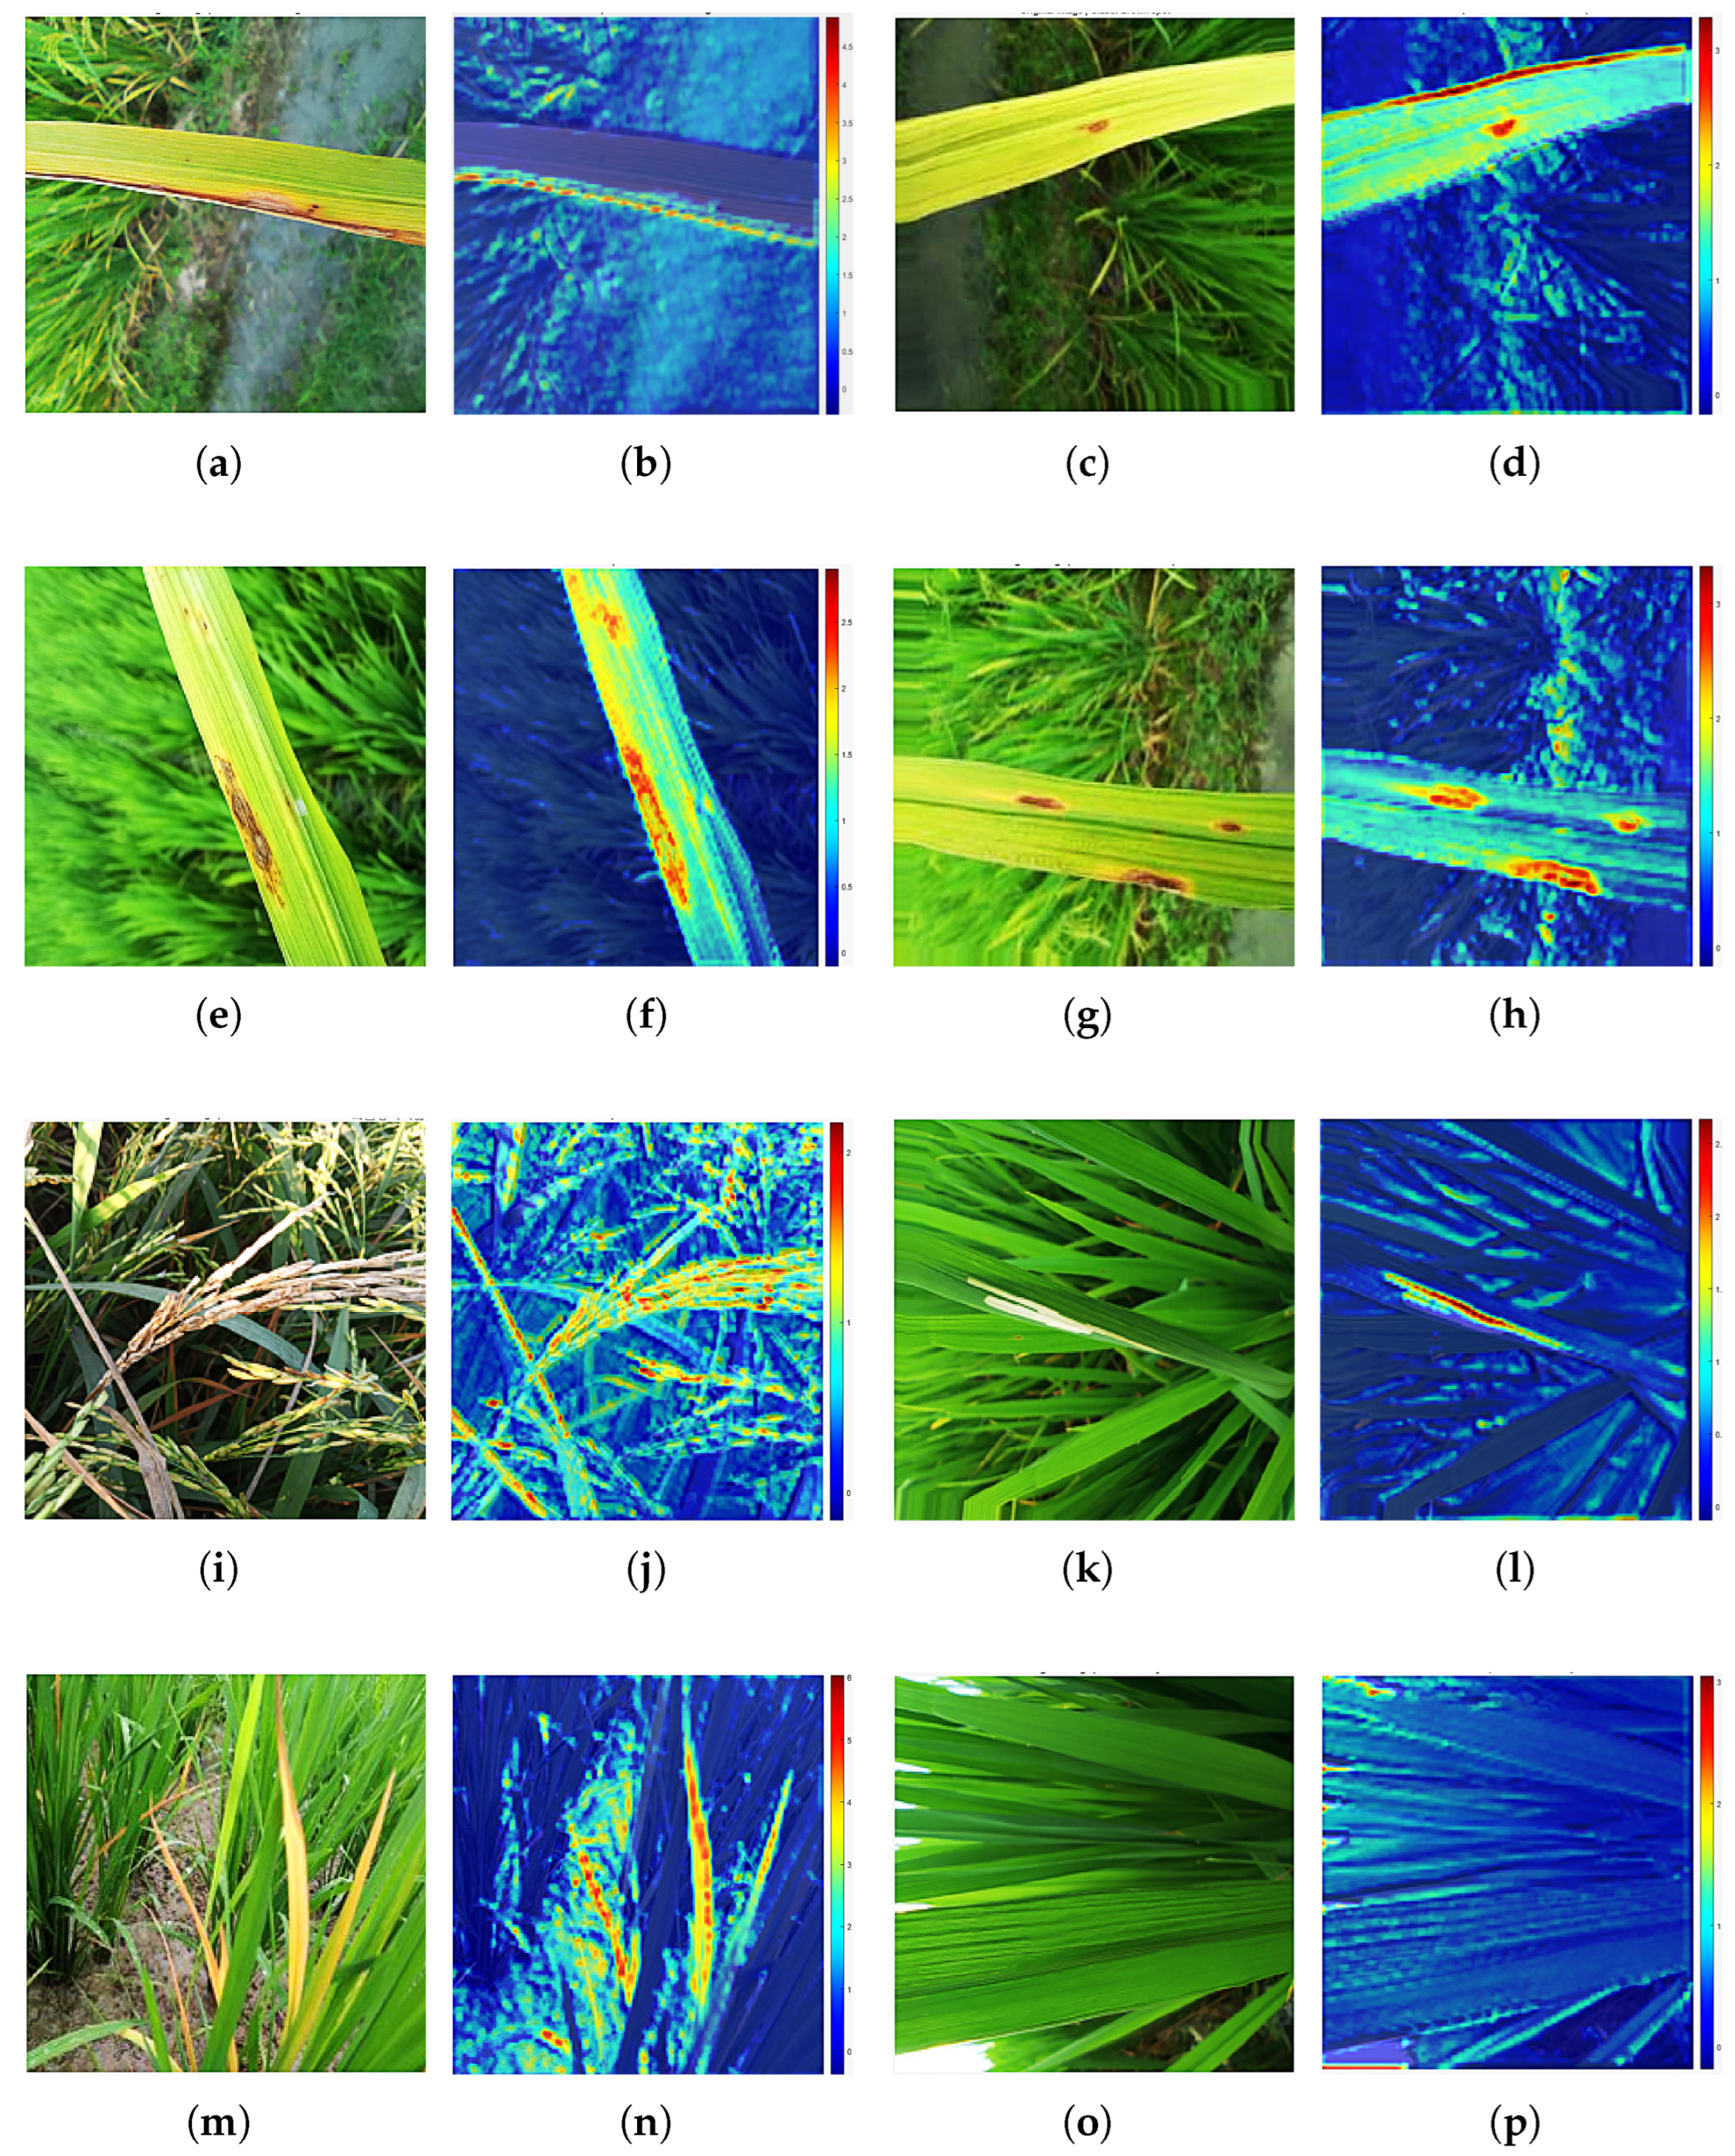
Gradient-weighted class activation mapping (Grad-CAM) is an explainable AI technique proposed by Selvaraju et al. to highlight the class-discriminative regions in convolutional neural networks using the gradients of target outputs. It generates localization maps that visually explain model decisions, aiding in the interpretability of deep models. Grad-CAM is particularly effective in image classification and object detection by providing spatial insight into feature importance. Grad-CAM visualizations are generated by computing the gradients of the predicted class score in relation to the activation maps from the final convolutional layer. It utilizes a color-coded scheme to convey the significance of different regions. The colors are determined by the magnitude of the gradient values, which reflect the contribution of each region to the predicted class. Regions exhibiting high gradient values are depicted in red, indicating a substantial contribution to the predicted class. Regions with moderate gradient values are marked in yellow/green, signifying a moderate level of importance to the predicted class. Regions with low gradient values are represented in blue, signifying low importance, denoting a relatively minor contribution to the predicted class.
In this manuscript, Grad-CAM was used to identify the regions contributing to crop disease classification by the proposed model. To facilitate clear qualitative comparison, the original image, along with its corresponding Grad-CAM heatmap (highlighting the key regions used by the model for crop disease classification), is presented in Figure 8.

Figure 8.
Visualization comparison of Grad-CAM on paddy crop images: (a,c,e,g,i,k,m,o) represent the bacterial blight, brown spot, leaf blast, narrow brown spot, neck blast, rice hispa, tungro diseases, and healthy classes in paddy crops, whereas (b,d,f,h,j,l,n,p) represent the corresponding Grad-CAM. Red represents a high gradient, indicating a substantial contribution to identifying the disease class by the proposed model. Yellow/green and blue represent moderate and low gradient values, respectively. These regions make minimal contributions to disease identification.
4.3. Comparative Analysis with Pre-Trained Model
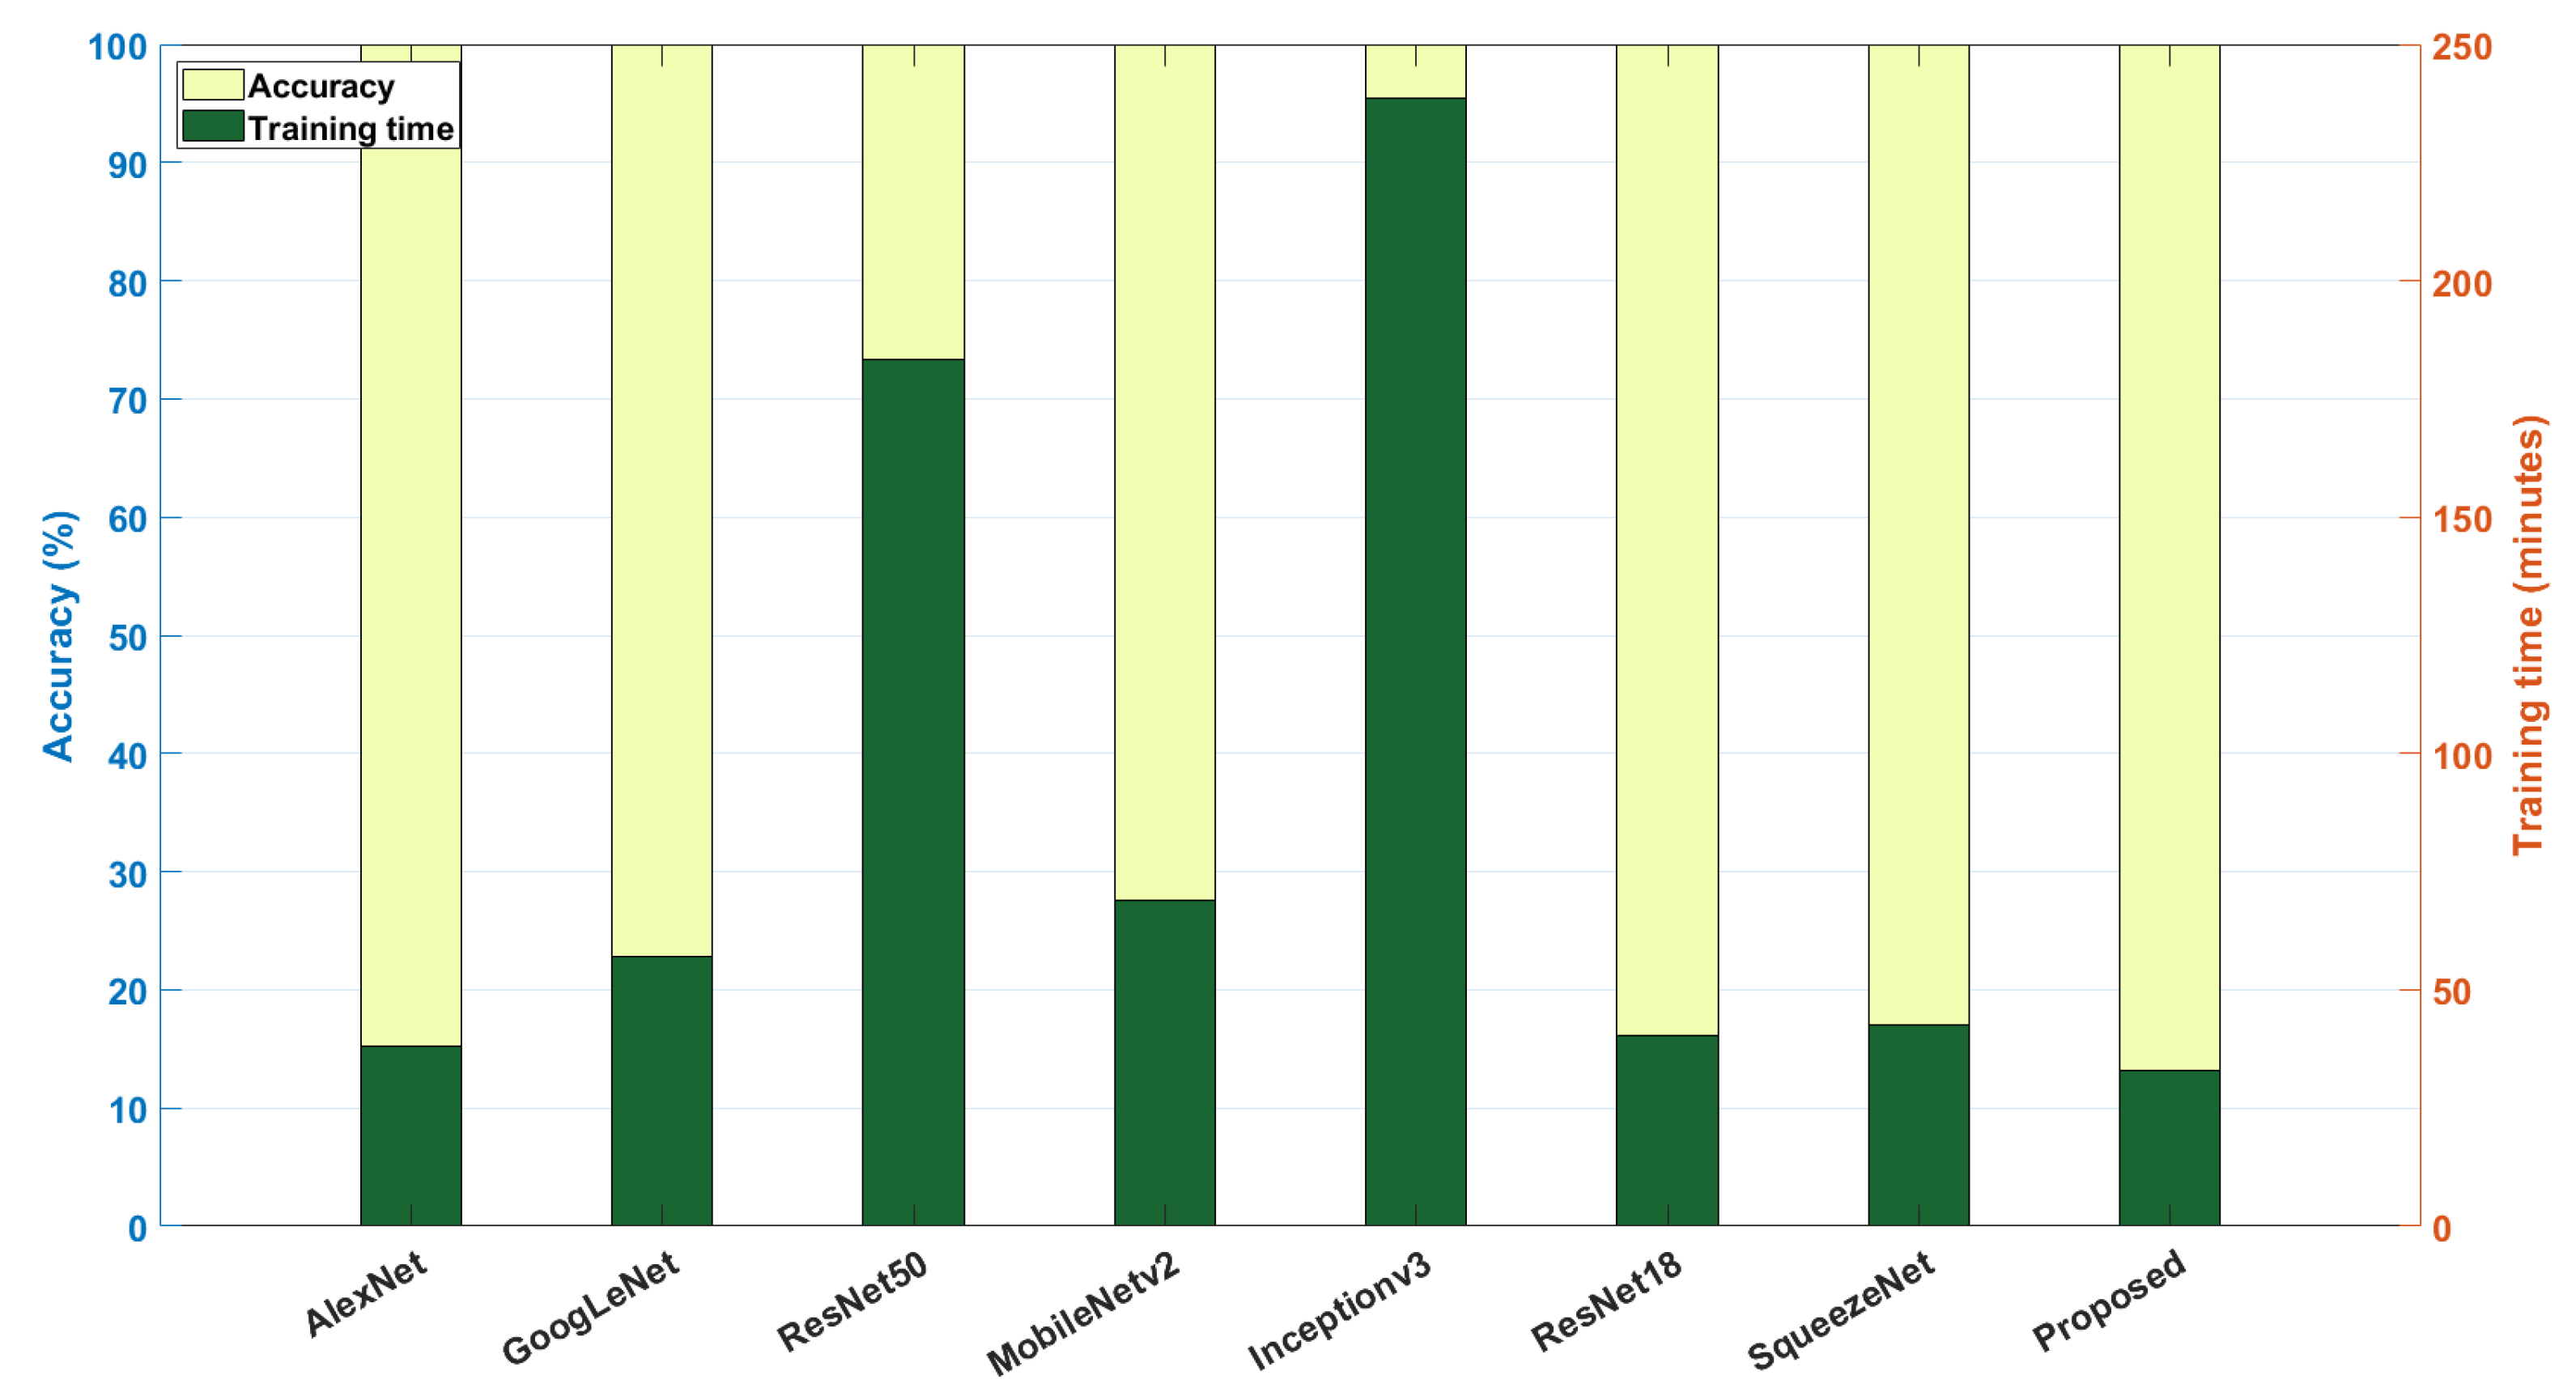
The robustness of the model in the classification of crop (paddy and wheat) diseases is analyzed by comparing the proposed DNN with several existing pre-trained networks (such as AlexNet, GoogLeNet, ResNet50, MobileNetV2, InceptionV3, VGG-16, ResNet18, and SqueezeNet) [58]. The results are compared, along with their parameters (learnable parameters, number of layers, accuracy, and training time), in Table 12.

Table 12.
A comparison of the proposed method with existing pre-trained networks.
Among the pre-trained networks, SqueezeNet and VGG-16 have the minimum (1.2 M) and maximum (134.2 M) number of learnable parameters. On the other hand, the proposed model integrated with the MaxViT transformer has far fewer parameters (i.e., 814.7 K), and hence, training takes much less time (i.e., 12.62 min) compared to the other pre-trained networks. Similarly, for the wheat dataset, the proposed model attained 94% accuracy with a training time of 6.42 min. From the above comparative analysis, it can be inferred that the proposed DNN architecture offers a lightweight solution for categorization of crop diseases with less training time, making it suitable for real-time implementation. The comparison of accuracy and training time of various pre-trained models with the proposed method is visually represented in Figure 9.

Figure 9.
Performance comparison of various DL models used for identifying paddy and wheat crop diseases: the X-axis represents various DL models, and the left vertical axis represents accuracy (in %), whereas the right vertical axis shows the training time (in minutes).
4.4. Ablation Study
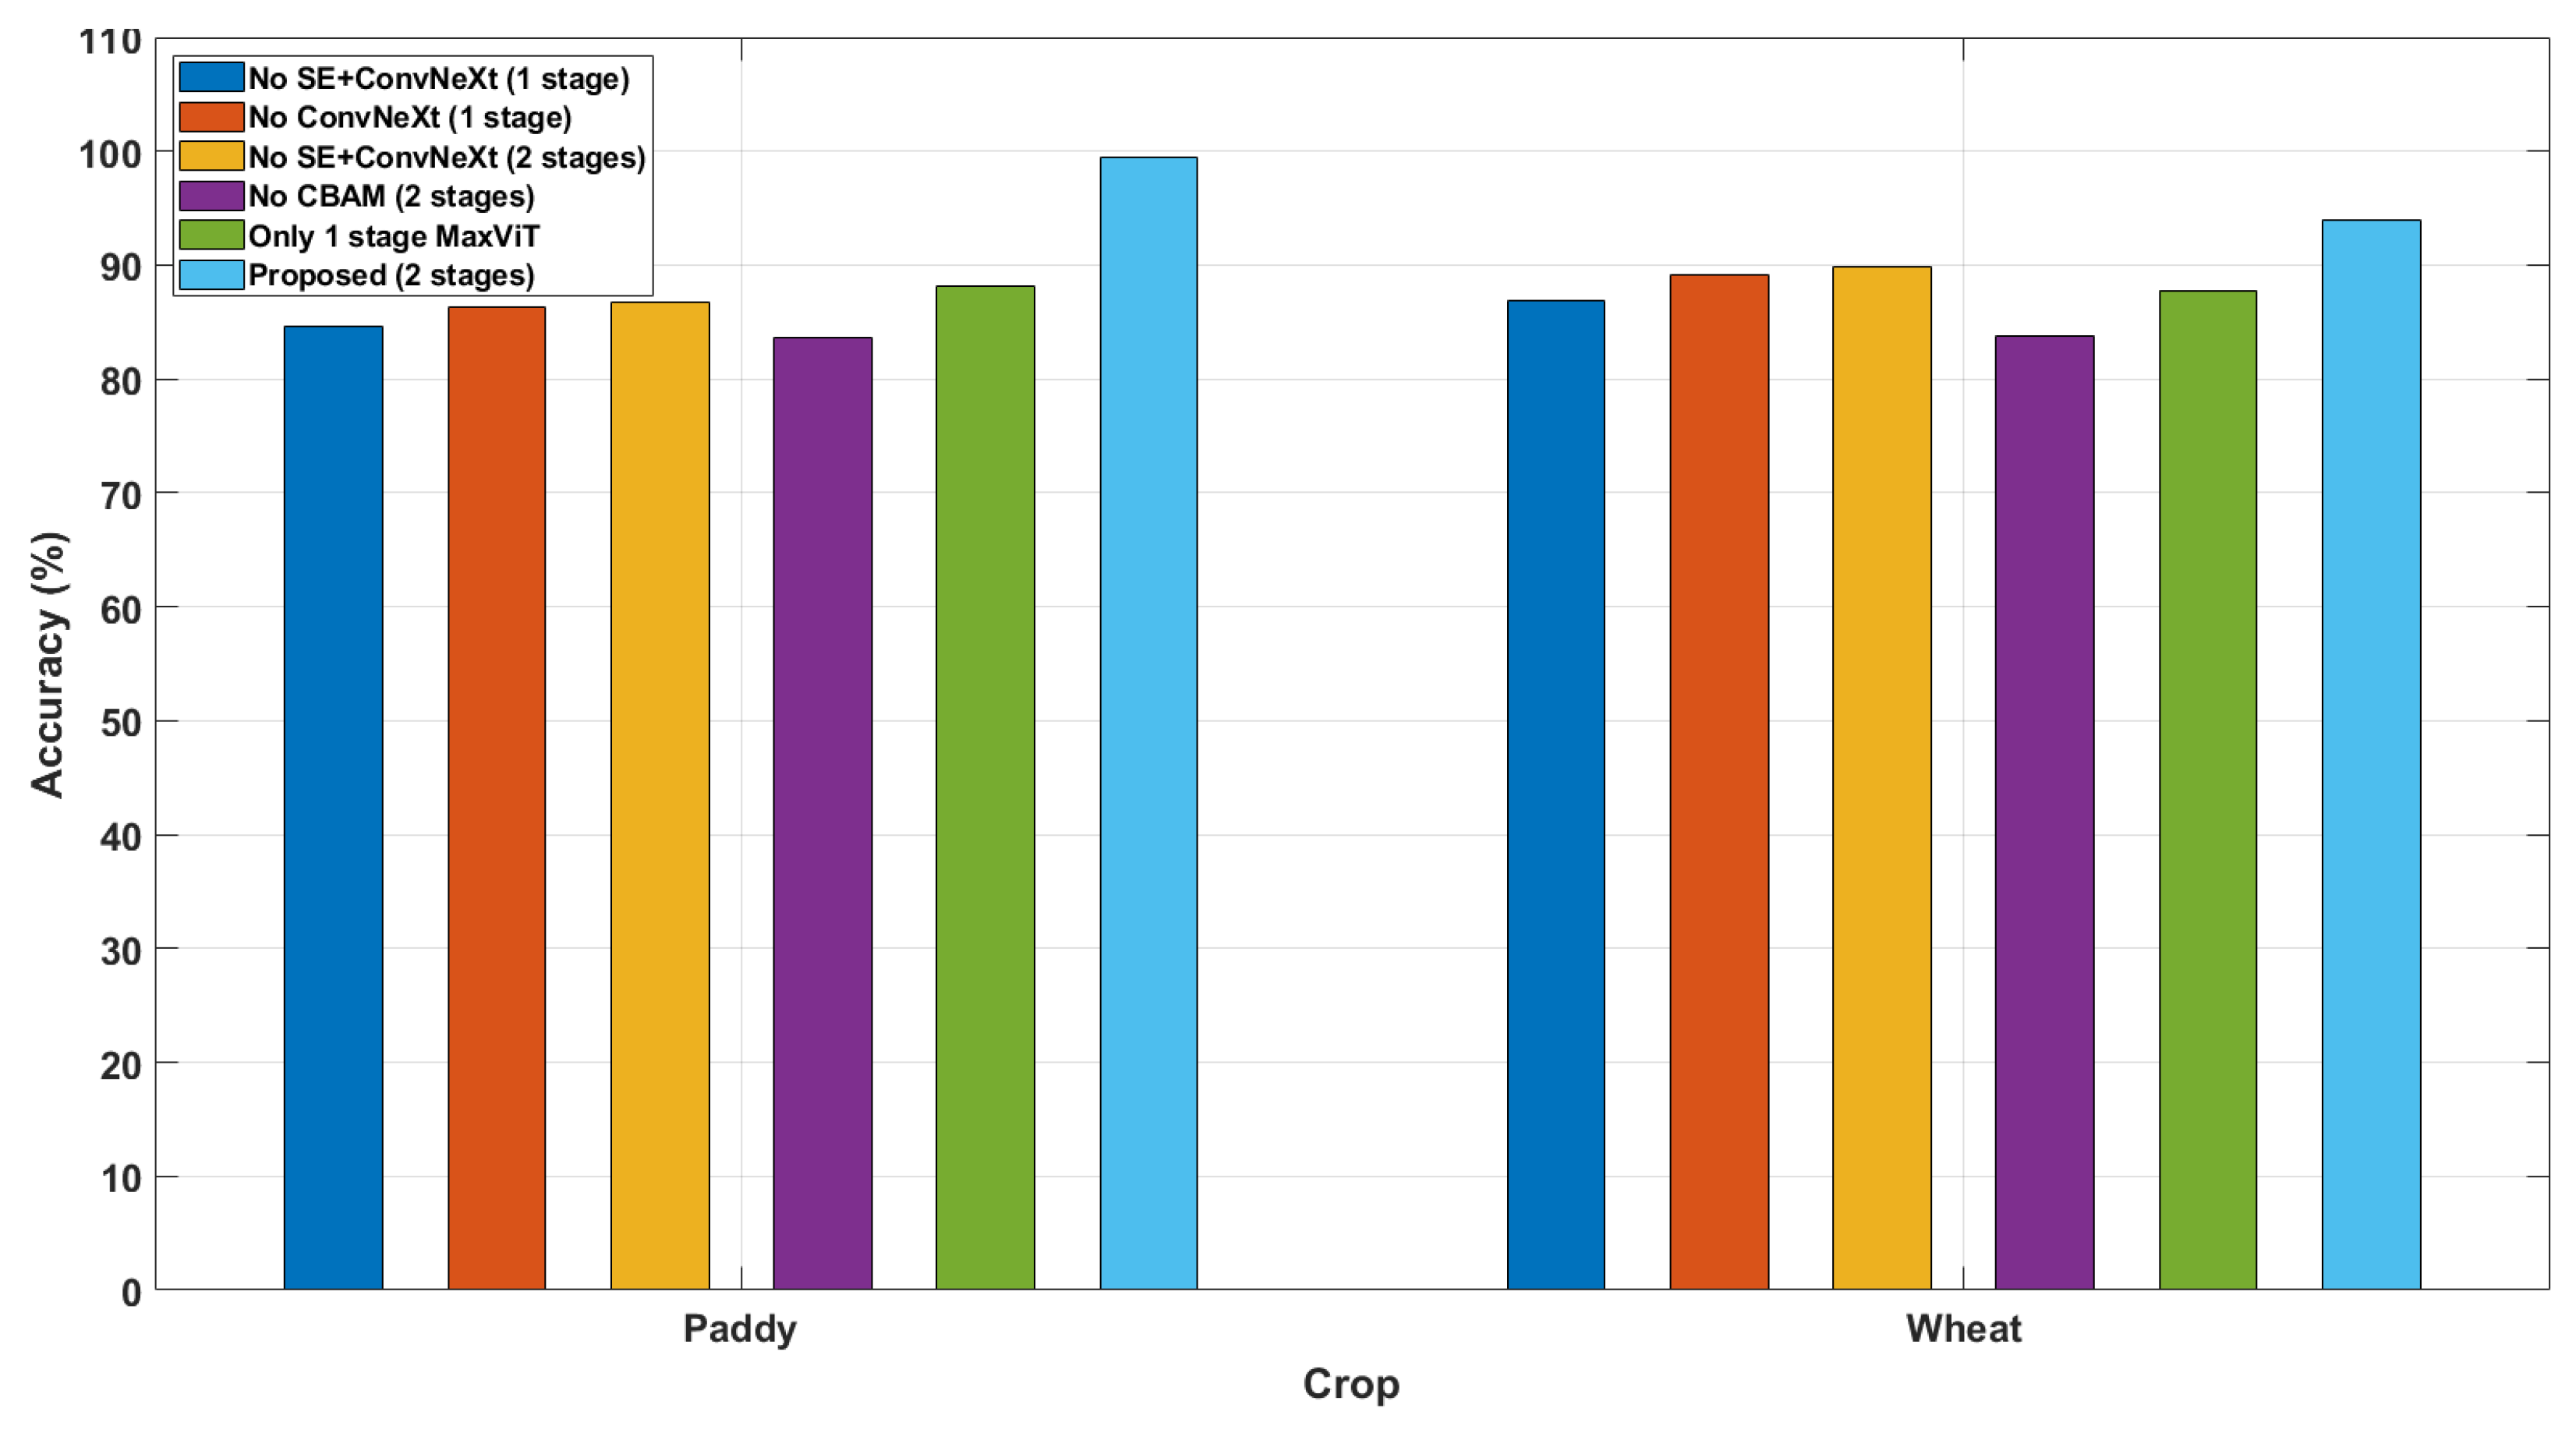
Ablation studies rigorously evaluate the model components by removing or modifying them to assess their impact on performance. This method isolates critical elements, distinguishing essential features from redundant ones. Such analyses enhance interpretability and ensure robust, well-justified model architectures. The ablation study results presented in Table 13 demonstrate how different architectural components contribute to the performance of MaxViT for paddy disease classification. The classification accuracy (with two-stage MaxViT block) for paddy and wheat crops was 99.43% and 94%, respectively. Eliminating one stage of MaxViT reduces the accuracy to 88.10% and 87.80% for paddy and wheat crops, respectively. Removing the CBAM from the MaxViT blocks led to significantly lower accuracy (i.e., 83.65% for paddy and 83.80% for wheat). From this analysis, the importance of the CBAM becomes evident for improving classification performance. Other blocks (such as SE block and ConvNeXt block) were removed one at a time from the proposed model to assess their impact on classification performance. A visual representation of the ablation study is represented in Figure 10.

Table 13.
An ablation study of the proposed DNN.

Figure 10.
Ablation study: Contribution of various modules used for designing MaxViT architecture to classification performance for paddy and wheat crops.
4.5. Statistical Analysis of Proposed Model Performance
To reinforce the robustness and reliability of the results, a 95% confidence interval (CI) was computed, offering a probabilistic approximation of the range within which the true test accuracy is likely to fall with 95% certainty. The CI was determined using the mean, the standard error, and the t-distribution, as defined in Equation (13).
where ‘’ represents the sample mean of the test accuracies, ‘t’ is the critical t-value for the chosen confidence level, ‘s’ denotes the standard deviation, and ‘n’ denotes the number of independent trials. The proposed model was assessed across five independent runs using the paddy disease dataset to ensure variability in testing conditions.
The resulting performance (presented in Table 14) revealed a high degree of consistency, with a mean test accuracy of 98.09%, standard deviation of 0.5369, and 95% confidence interval of [97.43%, 98.76%]. This narrow confidence interval indicates that the model’s performance is accurate, stable, and reproducible. This statistical evaluation supports the claim that the model generalizes well across different test instances, affirming its suitability for real-world disease classification tasks.

Table 14.
Statistical analysis of proposed model performance and confidence interval calculation.
4.6. Assessment of Model Robustness
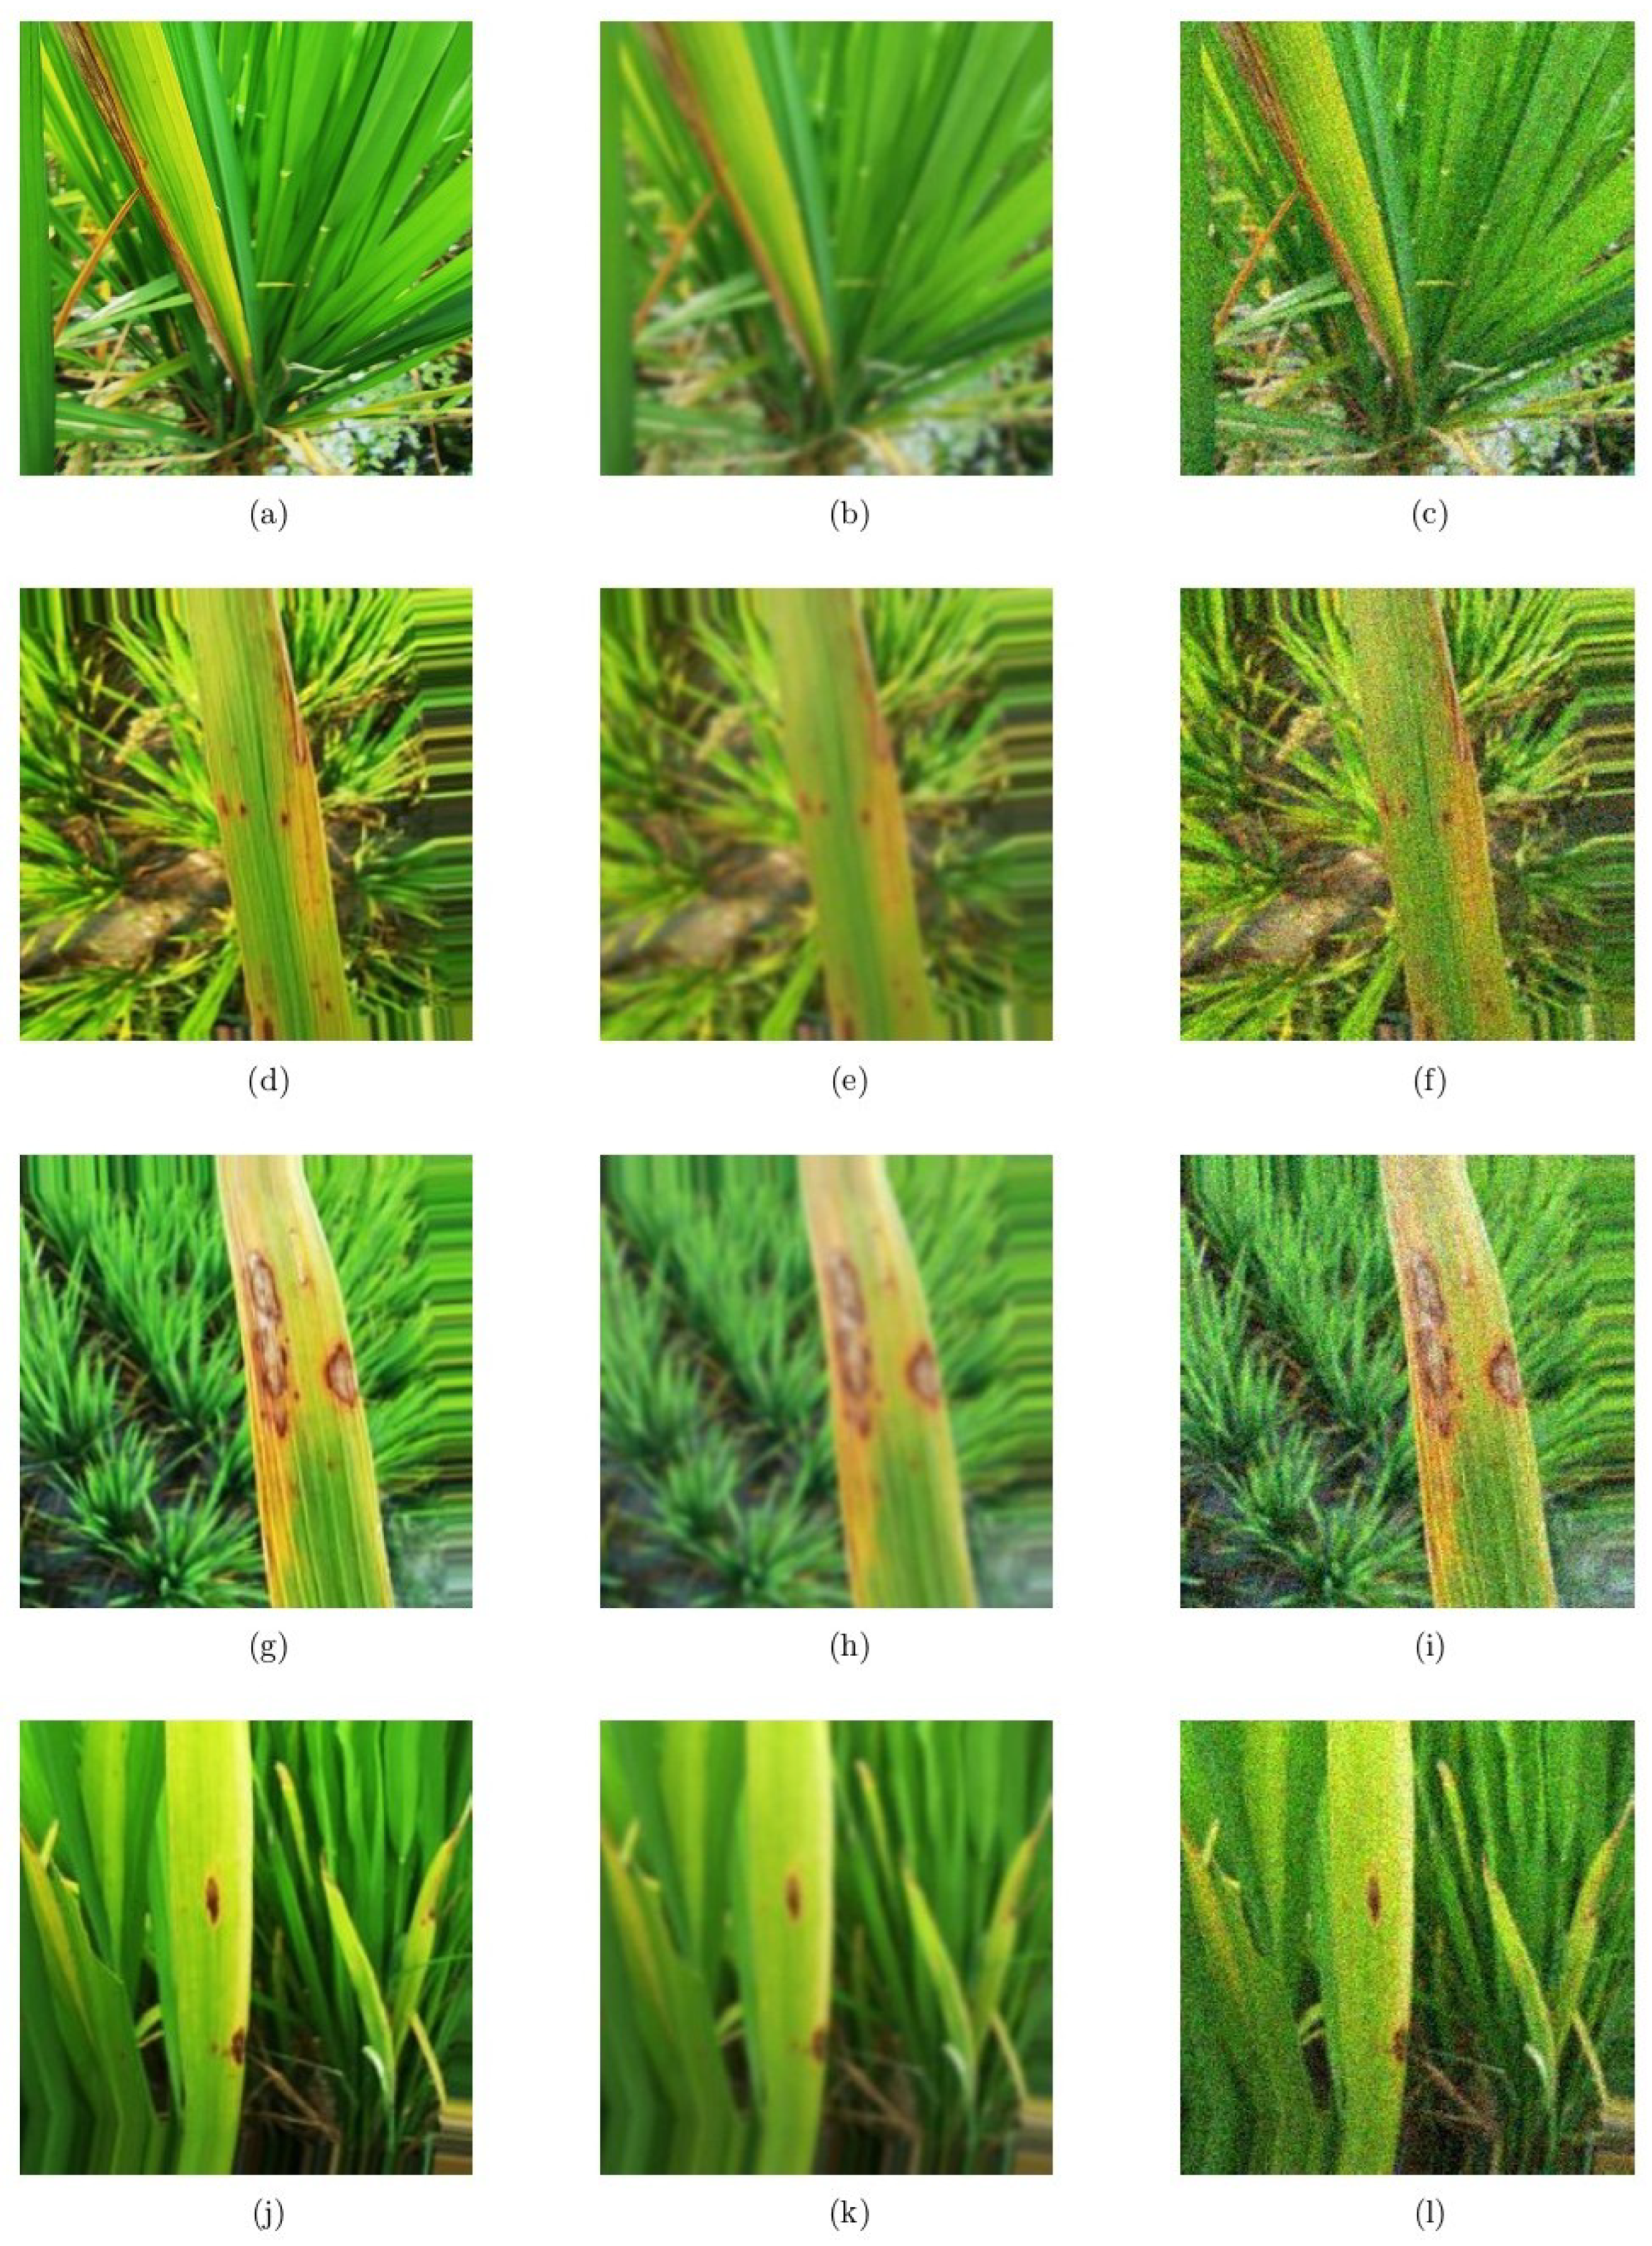
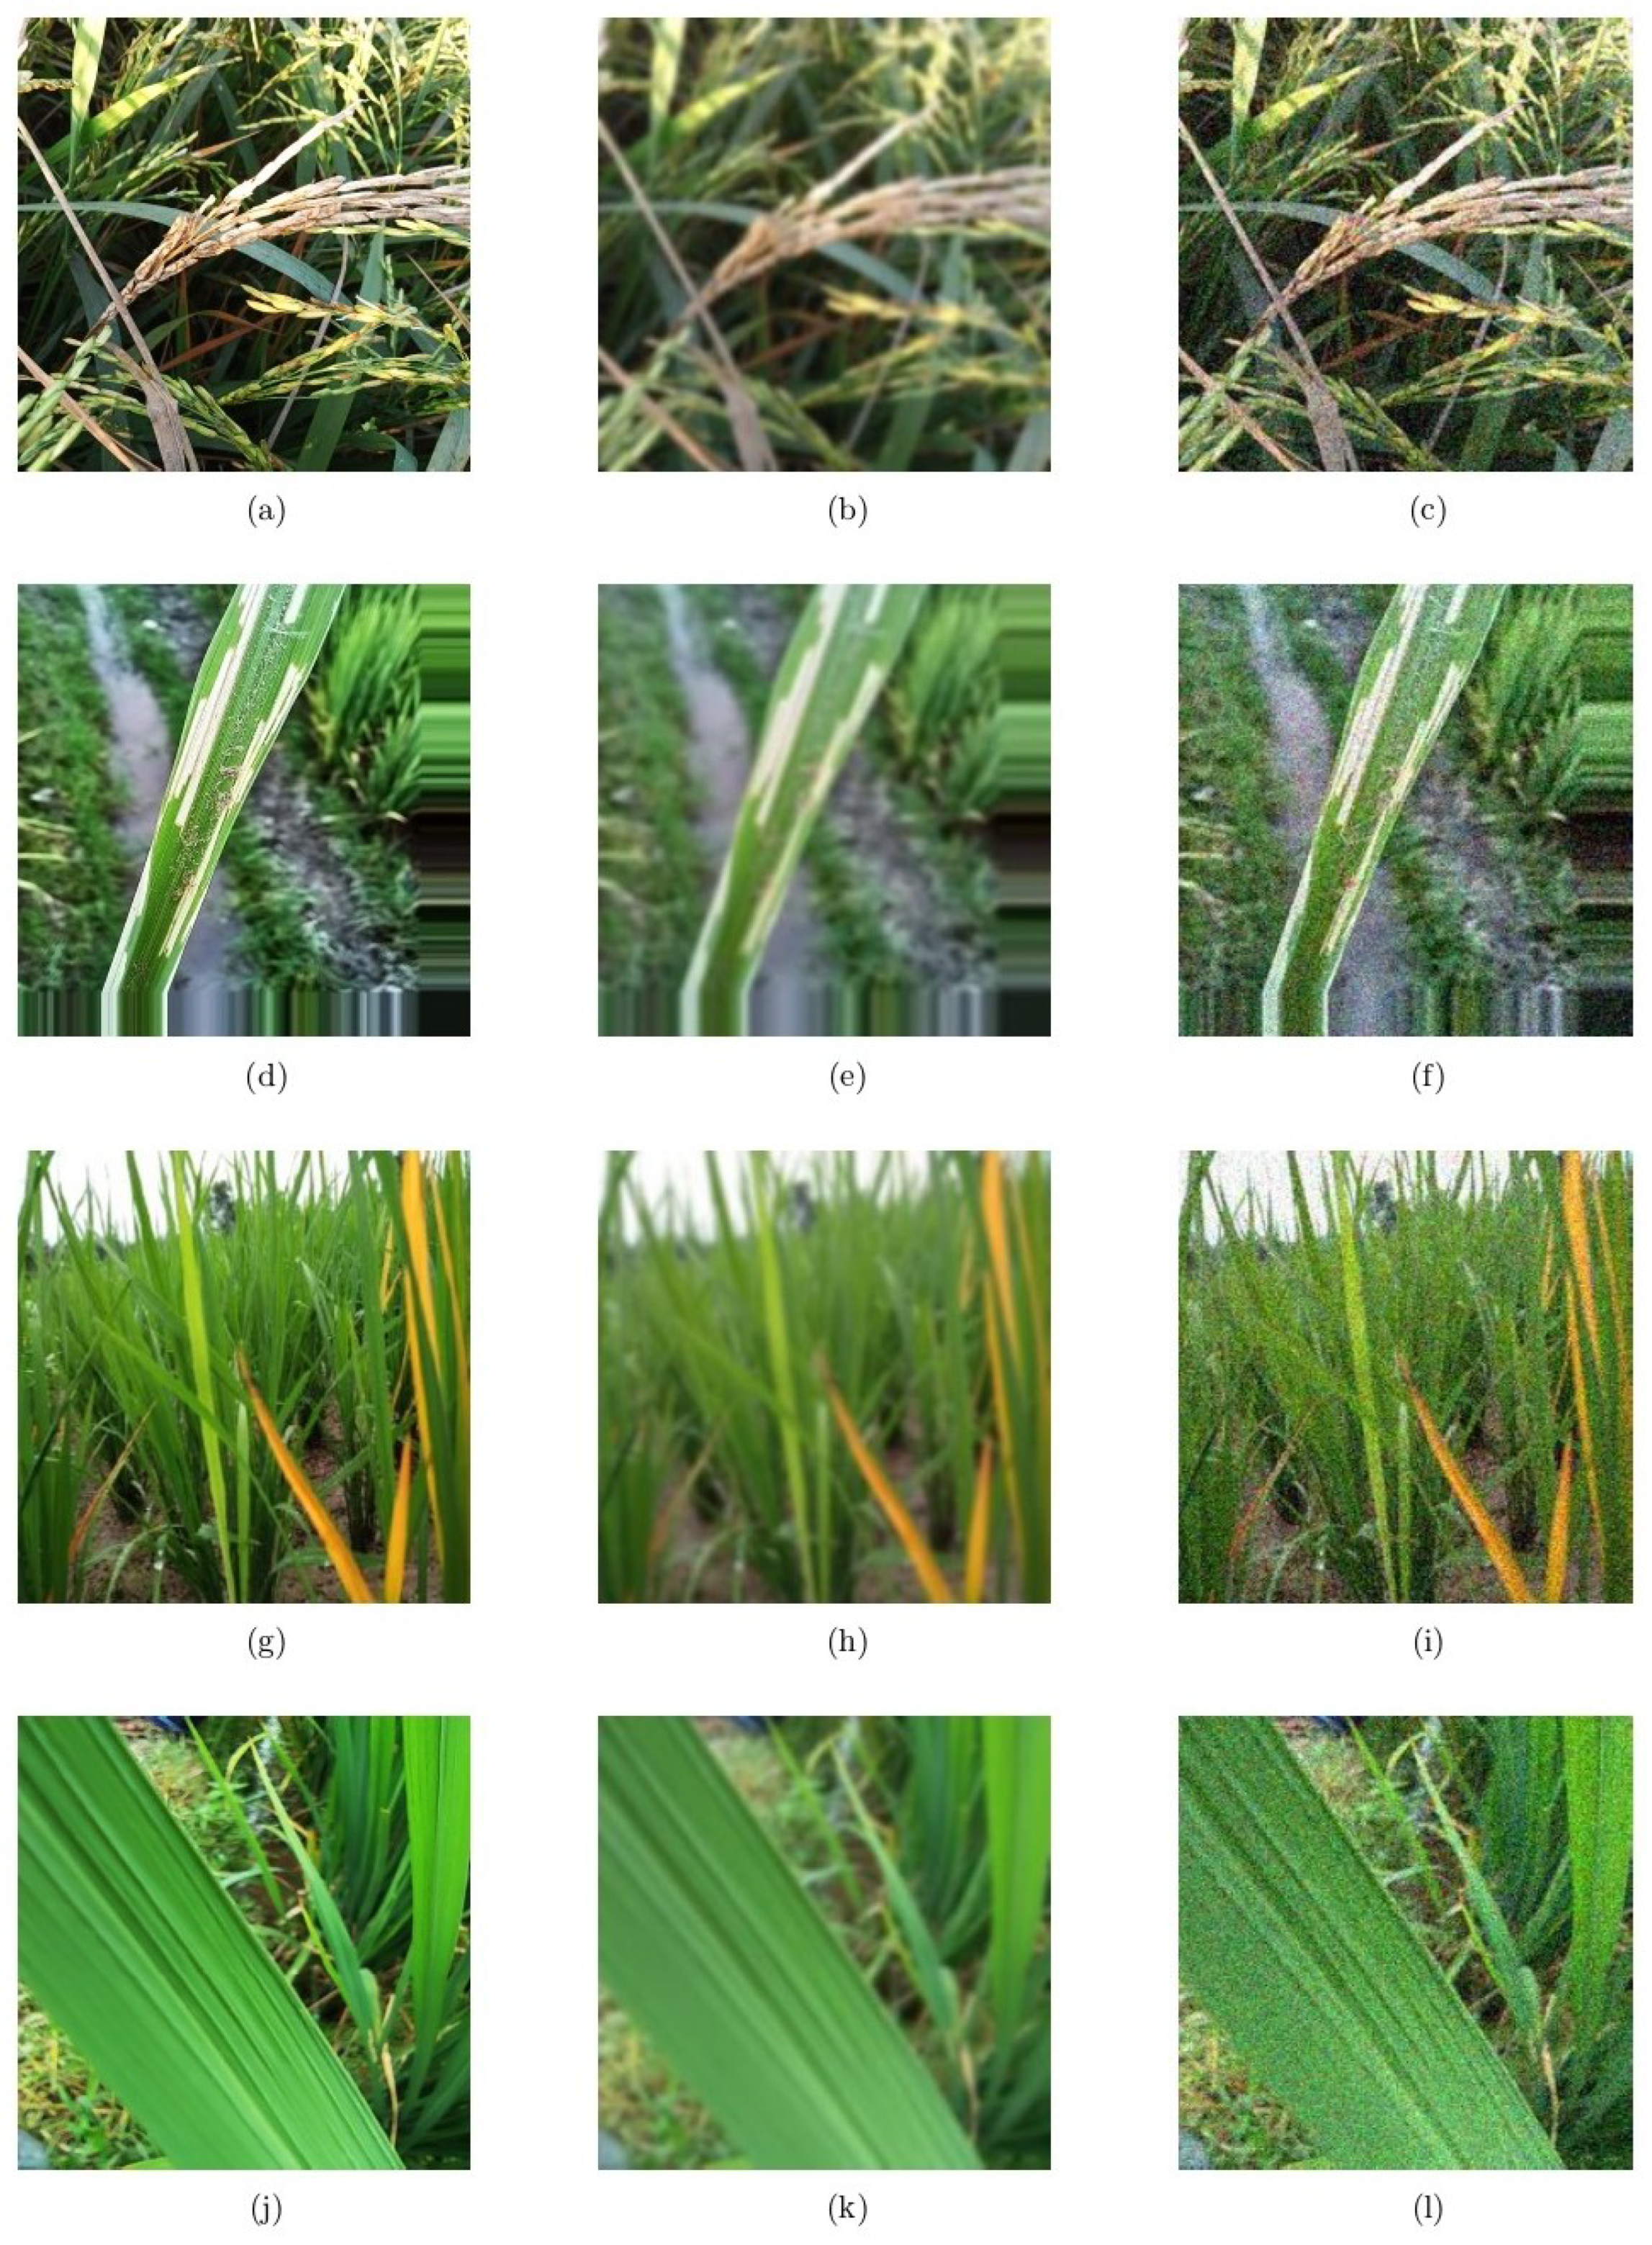
To evaluate the robustness of the proposed model, Gaussian noise with zero mean and variance (0.001 and 0.0001), and Gaussian blur were added to the original crop images, and the noisy images (represented in Figure 11 and Figure 12) were fed to the network for classification.

Figure 11.
Visualization of paddy crop images with blurring and Gaussian noise: The first column (a,d,g,j) presents the original images showing bacterial blight, brown spot, leaf blast, and narrow brown spot diseases. The second column (b,e,h,k) presents the corresponding blurred images. The third column (c,f,i,l) presents the noisy images obtained by adding Gaussian noise with zero mean and variance 0.001.

Figure 12.
Visualization of paddy crop images with blurring and Gaussian noise: The first column (a,d,g,j) presents the original images showing neck blast, rice hispa, tungro diseases, and healthy classes. The second column (b,e,h,k) presents the corresponding blurred images. The third column (c,f,i,l) presents the noisy images obtained by adding Gaussian noise with zero mean and variance 0.001.
For the original images (without blurring and noise), the testing accuracy was 98.47%. The addition of Gaussian noise (mean = 0, variance = 0.001) to the paddy crop images led to a testing accuracy of 97.13%. This value was increased to 97.79% by reducing the variance of Gaussian noise to 0.0001 from 0.001. For blurred images, the obtained testing accuracy was 97.77%. These experimental results, presented in Table 15, indicate that the model retained a high level of accuracy even under degraded input conditions. The results demonstrate minimal reductions in both training and testing accuracies, thereby substantiating the robustness of the model to common visual distortions encountered in practical agricultural scenarios.

Table 15.
Performance of the model for noisy images.
4.7. Comparison of the Proposed Model with Pre-Existing Studies
The proposed model has been validated using a custom paddy dataset and a wheat dataset (collected from Kaggle database). The results of the proposed method have been compared with pre-existing studies in the literature that utilized the same dataset. The comparison is presented in Table 16.

Table 16.
Comparison of disease classification by various methods.
4.8. Limitations of the Proposed Study
Despite the promising performance of the proposed model, a key constraint addressed in this study is the effect of varying train–test split ratios on model performance. To evaluate this, experiments were conducted using four commonly adopted train–test configurations: 90:10, 80:20, 75:25, and 70:30. Each train–test split involved random shuffling of the dataset to ensure unbiased sampling. The results indicate that the 90:10 train–test split yielded minimal deviation (0.9%) between training (91.21%) and testing accuracies (90.31%). The overall performance was suboptimal. The 80:20 train–test split outperformed others, achieving the highest training (99.43%) and testing (98.47%) accuracies with only a 0.96% difference/gap, indicating effective generalization. Conversely, the 75:25 and 70:30 splits indicated stronger over-fitting effects, as evidenced by larger performance differences/gaps (3.51% and 3.59%, respectively). Based on this comparative analysis, the 80:20 split was adopted for subsequent experiments due to its balance between training efficacy and testing reliability. Although the proposed model demonstrated high testing accuracy in rice disease classification (98.47%), its performance declined to 92.8% for wheat disease classification. To address this, future work can explore the integration of domain adaptation techniques, such as adversarial training or feature alignment, to enhance the model’s cross-crop generalizability. Additionally, training the model on multi-crop datasets and employing domain generalization strategies may help the model learn invariant features across plant types.
The DL models typically require vast amounts of data for strong generalization. However, publicly available datasets for various plant diseases are limited, which can negatively impact model performance. In this study, several disease samples were collected from local paddy fields under bright sunlight, introducing variations in lighting conditions. Moreover, some disease classes had significantly fewer samples, leading to class imbalance. This imbalance biases the model toward majority classes and reduces its ability to accurately recognize rare diseases. The other crop diseases are lower in number for a few classes, which remains a significant challenge for crop disease recognition. Addressing this issue through advanced data augmentation, synthetic sample generation, or class-rebalancing techniques will be a crucial direction for future research.
5. Conclusions
In this study, a lightweight DNN (having 814.7 K learnable parameters and 85 layers) is developed (by introducing the MaxViT module, which consists of a CBAM module, SE module, DW module, and ConvNeXt module) for the classification of crop (i.e., paddy and wheat) diseases. The attention mechanism is implemented in the CBAM block. The SE block focuses on important channels and captures channel-wise dependencies to improve feature extraction. The DW block reduces the number of parameters and the computational cost. The ConvNeXt module aids in robust feature extraction. This work performed experiments with a custom paddy disease dataset (collected from local paddy fields in Tiruchirapalli) and a publicly available wheat database. Performance indicators (such as accuracy, sensitivity, specificity, mean accuracy, precision, F1-score, and MCC) were computed to demonstrate the model’s robustness in classifying different diseases of paddy and wheat crops. The proposed model achieved overall accuracies of 99.43% and 98.47% for training and testing, respectively, in classifying seven disease classes in paddy crops. The method obtained overall accuracies of 94.00% and 92.80% during training and testing, respectively, for wheat crops. The proposed model’s performance was compared with pre-trained networks. The training and testing performance of the model was analyzed by spider plots to understand its generalizability. Overlapping of training and testing metrics indicates the model’s ability to classify diseases in unknown samples. The model required the least training time and had a higher overall accuracy due to having the lowest number of learnable parameters compared to other pre-trained networks and DL models. Due to its low number of parameters and short training time, the model can be used for real-time disease detection in crops using unmanned aerial vehicles. In our future research, the model can be generalized to identify diseases in vegetables and fruits, along with grading the severity of damage.
Author Contributions
Karthick Mookkandi: methodology, formal analysis, data curation, writing—original draft preparation, writing—review and editing; Malaya Kumar Nath: methodology, formal analysis, data curation, writing—original draft preparation, writing—review and editing, validation, supervision; Sanghamitra Subhadarsini Dash: writing—original draft preparation, writing—review and editing; Madhusudhan Mishra: validation, review; Radak Blange: validation, review and editing. All authors have read and agreed to the published version of the manuscript.
Funding
This research received no external funding.
Institutional Review Board Statement
Not applicable.
Informed Consent Statement
Not applicable.
Data Availability Statement
The data and code in this study are available from the corresponding author upon reasonable request. After acceptance of the manuscript, the code and data will be shared on an open platform.
Acknowledgments
This work was carried out by the Department of Electronics and Communication Engineering at National Institute of Technology Puducherry, Karaikal-609609, India.
Conflicts of Interest
The authors declare no conflicts of interest.
Abbreviations
The following abbreviations are used in this manuscript:
| AI | Artificial Intelligence |
| ANN | Artificial Neural Network |
| AUC | Area under Curve |
| BLB | Bacterial Leaf Blight |
| CBAM | Convolutional Block Attention Module |
| CNN | Convolutional Neural Network |
| CPAM | Channel and Position Attention Mechanism |
| DL | Deep Learning |
| DNN | Deep Neural Network |
| DT | Decision Tree |
| DW | Depth-wise Convolution |
| EMA | Efficiency Multi-Scale Attention |
| ECSA | Efficient Channel Spatial Attention |
| FN | False Negative |
| FP | False Positive |
| GAP | Global Average Pooling |
| GBM | Gradient Boosting Machines |
| GLCM | Gray Level Co-occurrence Matrix |
| GMM | Gaussian Mixture Model |
| GPU | Graphical Processing Unit |
| HoG | Histogram of Oriented Gradients |
| HGB | Histogram Gradient Boosting |
| IoU | Intersection over Union |
| KNN | K-Nearest Neighbor |
| LBP | Local Binary Pattern |
| LDA | Linear Discriminant Analysis |
| LSTM | Long Short-Term Memory |
| mAP | Mean Average Precision |
| MaxViT | Multi-axis Vision Transformer |
| MBConv | Mobile Inverted Bottleneck Convolution |
| MCC | Matthews Correlation Coefficient |
| MCSVM | Multi-Class Support Vector Machine |
| MHA | Multi-Head Attention |
| ML | Machine Learning |
| MLOA | Modified Lemur’s Optimization Algorithm |
| NB | Naive Bayes |
| PCA | Principal Component Analysis |
| RBB | Rice Bacterial Blight |
| RCNN | Region-based Convolutional Neural Network |
| ReLU | Rectified Linear Unit |
| RF | Random Forest |
| ROC | Receiver Operating Characteristic |
| RNN | Recurrent Neural Network |
| SE | Squeeze and Excitation |
| SVM | Support Vector Machine |
| TN | True Negative |
| TP | True Positive |
| ViT | Vision Transformer |
| WOA | Whale Optimization Algorithm |
| YOLO | You Only Look Once |
References
- Kaur, A.; Guleria, K.; Trivedi, N.K. A deep learning-based model for biotic rice leaf disease detection. Multimed. Tools Appl. 2024, 83, 83583–83609. [Google Scholar] [CrossRef]
- Rahman, W.; Hossain, M.M.; Hasan, M.M.; Iqbal, M.S.; Rahman, M.M.; Hasan, K.F.; Moni, M.A. Automated detection of harmful insects in agriculture: A smart framework leveraging IoT, machine learning, and blockchain. IEEE Trans. Artif. Intell. 2024, 5, 4787–4798. [Google Scholar] [CrossRef]
- Ahad, M.T.; Li, Y.; Song, B.; Bhuiyan, T. Comparison of CNN-based deep learning architectures for rice diseases classification. Artif. Intell. Agric. 2023, 9, 22–35. [Google Scholar] [CrossRef]
- Singh, S.P.; Pritamdas, K.; Devi, K.J.; Devi, S.D. Custom convolutional neural network for detection and classification of rice plant diseases. Procedia Comput. Sci. 2023, 218, 2026–2040. [Google Scholar] [CrossRef]
- Deng, R.; Tao, M.; Xing, H.; Yang, X.; Liu, C.; Lia, K.; Qi, L. Automatic diagnosis of rice diseases using deep learning. Front. Plant Sci. 2021, 12, 701038. [Google Scholar] [CrossRef]
- Daniya, T.; Vigneshwari, S. Exponential Rider-Henry gas solubility optimization-based deep learning for rice plant disease detection. Int. J. Inf. Technol. 2022, 14, 3825–3835. [Google Scholar] [CrossRef]
- Nayak, A.; Chakraborty, S.; Swain, D.K. Application of smartphone-image processing and transfer learning for rice disease and nutrient deficiency detection. Smart Agric. Technol. 2023, 4, 100195. [Google Scholar] [CrossRef]
- Sankareshwaran, S.P.; Jayaraman, G.; Muthukumar, P.; Krishnan, A. Optimizing rice plant disease detection with crossover boosted artificial hummingbird algorithm based AX-RetinaNet. Environ. Monit. Assess. 2023, 195, 1070. [Google Scholar] [CrossRef] [PubMed]
- Daniya, T.; Vigneshwari, S. Rider water wave-enabled deep learning for disease detection in rice plant. Adv. Eng. Softw. 2023, 182, 103472. [Google Scholar] [CrossRef]
- Rai, C.K.; Pahuja, R. Detection and segmentation of rice diseases using deep convolutional neural networks. SN Comput. Sci. 2023, 4, 499. [Google Scholar] [CrossRef]
- Sharma, M.; Kumar, C.J.; Deka, A. Early diagnosis of rice plant disease using machine learning techniques. Arch. Phytopathol. Plant Prot. 2021, 55, 259–283. [Google Scholar] [CrossRef]
- Wang, P.-H.; Wang, S.; Nie, W.-H.; Wu, Y.; Ahmad, I.; Yiming, A.; Huang, J.; Chen, G.Y.; Zhu, B. A transferred regulator that contributes to Xanthomonas Oryzae Pv. Oryzicola Oxidative Stress Adapt. Virulence Regul. Expr. Cytochrome Bd Oxidase Genes. J. Integr. Agric. 2022, 21, 1673–1682. [Google Scholar] [CrossRef]
- Dorneles, K.R.; Refatti, J.P.; Pazdiora, P.C.; de Avila, L.A.; Deuner, S.; Dallagnol, L.J. Biochemical defenses of rice against Bipolaris oryzae increase with high atmospheric concentration of CO2. Physiol. Mol. Plant Pathol. 2020, 110, 101484. [Google Scholar] [CrossRef]
- Dean, R.; Van Kan, J.A.L.; Pretorius, Z.A.; Hammond-Kosack, K.E.; Di Pietro, A.; Spanu, P.D.; Rudd, J.J.; Dickman, M.; Kahmann, R.; Ellis, J.; et al. The top 10 fungal pathogens in molecular plant pathology. Mol. Plant Pathol. 2012, 13, 414–430. [Google Scholar] [CrossRef]
- Talbot, N.J. Appressoria. Curr. Opin. Microbiol. 2019, 29, R144–R146. [Google Scholar] [CrossRef]
- Savary, S.; Akter, S.; Almekinders, C.; Harris, J.; Korsten, L.; Rötter, R.; Waddington, S.; Watson, D. Mapping disruption and resilience mechanisms in food systems. Food Secur. 2020, 1, 695–717. [Google Scholar] [CrossRef]
- Singh, P.; Mazumdar, P.; Harikrishna, J.A.; Babu, S. Sheath blight of rice: A review and identification of priorities for future research. Planta 2019, 250, 1387–1407. [Google Scholar] [CrossRef]
- Zheng, A.; Lin, R.; Zhang, D.; Qin, P.; Xu, L.; Ai, P.; Ding, L.; Wang, Y.; Chen, Y.; Liu, Y.; et al. The evolution and pathogenic mechanisms of the rice sheath blight pathogen. Nat. Commun. 2013, 4, 1–10. [Google Scholar] [CrossRef]
- Widiarta, I.N.; Firmansyah, F.; Yunus, M.; Apriana, A.; Sisharmini, A.; Santoso, T.J.; Terryana, R.T.; Rahmini, R.; Rumanti, I.A.; Sitaresmi, T.; et al. Rice virus disease in Indonesia: Epidemiology and varietal resistance. Phytopathol. Res. 2025, 7, 1–13. [Google Scholar] [CrossRef]
- Dai, S.; Beachy, R.N. Genetic engineering of rice to resist rice tungro disease. Vitr. Cell. Dev. Biol.-Plant 2009, 45, 517–524. [Google Scholar] [CrossRef]
- Al-Sadi, A.M. Bipolaris sorokiniana-Induc. Black Point, Common Root Rot, Spot Blotch Diseases of Wheat: A Review. Front. Cell. Infect. Microbiol. 2021, 11, 1–9. [Google Scholar] [CrossRef]
- Singh, P.K.; Gahtyari, N.C.; Roy, C.; Roy, K.K.; He, X.; Tembo, B.; Xu, K.; Juliana, P.; Sonder, K.; Kabir, M.R.; et al. Wheat blast: A disease spreading by intercontinental jumps and its management strategies. Front. Plant Sci. 2021, 12, 710707. [Google Scholar] [CrossRef] [PubMed]
- Winter, M.; Samuels, P.L.; Otto-Hanson, L.K.; Dill-Macky, R.; Kinkel, L.L. Biological control of fusarium crown and root rot of wheat by streptomyces isolates – It’s complicated. Phytobiomes J. 2019, 3, 52–60. [Google Scholar] [CrossRef]
- Xu, F.; Shi, R.; Liu, L.; Li, S.; Wang, J.; Han, Z.; Liu, W.; Wang, H.; Liu, J.; Fan, J.; et al. Fusarium pseudograminearum Biomass Toxin Accumul. Wheat Tissues Fusarium Crown Rot Symptoms. Front. Plant Sci. 2024, 15, 1356723. [Google Scholar] [CrossRef]
- Jafar Massah, M.S.; Vakilian, K.A.; Shariatmadari, S.M. Design, development, and performance evaluation of a robot for yield estimation of kiwi fruit. Comput. Electron. Agric. 2021, 185, 106132. [Google Scholar] [CrossRef]
- Vishnoi, K.K.V.; Kumar, B. A comprehensive study of feature extraction techniques for plant leaf disease detection. Multimed. Tools Appl. 2022, 81, 367–419. [Google Scholar] [CrossRef]
- Jackulin, C.; Murugavalli, S. A comprehensive review on detection of plant disease using machine learning and deep learning approaches. Meas. Sens. 2022, 24, 100441. [Google Scholar] [CrossRef]
- Atoum, Y.; Afridi, M.J.; Liu, X.; McGrath, J.M.; Hanson, L.E. On developing and enhancing plant-level disease rating systems in real fields. Pattern Recognit. 2016, 53, 287–299. [Google Scholar] [CrossRef]
- Thakur, P.S.; Khanna, P.; Sheorey, T.; Ojha, A. Trends in vision-based machine learning techniques for plant disease identification: A systematic review. Expert Syst. Appl. 2022, 208, 118117. [Google Scholar] [CrossRef]
- Bui, T.D.; Le, T.M.D. Ghost-attention-YOLOv8: Enhancing rice leaf disease detection with lightweight feature extraction and advanced attention mechanisms. AgriEngineering 2025, 7, 93. [Google Scholar] [CrossRef]
- Haque, M.; Deb, C.K.; Gole, P.; Karmakar, S.; Dheeraj, A.; Shah, M.U.D.; Dutta, S.; Kumar, M.; Marwaha, S. An enhanced vision transformer network for efficient and accurate crop disease detection. Expert Syst. Appl. 2025, 282, 127743. [Google Scholar] [CrossRef]
- Pai, P.; Amutha, S.; Basthikodi, M.; Shafeeq, B.M.A.; Chaitra, K.M.; Gurpur, A.P. A twin CNN-based framework for optimized rice leaf disease classification with feature fusion. J. Big Data 2025, 12, 89. [Google Scholar] [CrossRef]
- Elakya, R.; Manoranjitham, T. An artificial intelligence ensemble model for paddy leaf disease diagnosis utilizing deep transfer. Multimed. Tools Appl. 2024, 83, 79533–79558. [Google Scholar] [CrossRef]
- Bhola, A.; Kumar, P. Deep feature-support vector machine based hybrid model for multicrop leaf disease identification in corn, rice, and wheat. Multimed. Tools Appl. 2024, 84, 4751–4771. [Google Scholar] [CrossRef]
- Cao, Q.; Zhao, D.; Li, J.; Li, J.; Li, G.; Feng, S.; Xu, T. Pyramid-YOLOv8: A detection algorithm for precise detection of rice leaf blast. Plant Method 2024, 20, 149. [Google Scholar] [CrossRef] [PubMed]
- Altabaji, W.I.A.E.; Umair, M.; Tan, W.-H.; Foo, Y.-L.; Ooi, C.-P. Comparative analysis of transfer learning, LeafNet, and modified LeafNet models for accurate rice leaf diseases classification. IEEE Access 2024, 12, 36622–36635. [Google Scholar] [CrossRef]
- Padhi, J.; Korada, L.; Dash, A.; Sethy, P.K.; Behera, S.K.; Nanthaamormphong, A. Paddy leaf disease classification using EfficientNet B4 with compound scaling and swish activation: A deep learning approach. IEEE Access 2024, 12, 126426–126437. [Google Scholar] [CrossRef]
- Zhang, J.; Shen, D.; Chen, D.; Ming, D.; Ren, D.; Diao, Z. ISMSFuse: Multimodal fusing recognition algorithm for rice bacterial blight disease adaptable in edge computing scenarios. Comput. Electron. Agric. 2024, 223, 109089. [Google Scholar] [CrossRef]
- Singh, A.; Kaur, J.; Singh, K.; Singh, M.L. Deep transfer learning-based automated detection of blast disease in paddy crop. Signal Image Video Process. 2024, 18, 569–577. [Google Scholar] [CrossRef]
- Senthil, R.; Khatwal, R. An effective disease detection analysis on rice leaves using hybrid MCSVM-DNN predictor architecture. Remote Sens. Earth Syst. Sci. 2024, 8, 84–97. [Google Scholar] [CrossRef]
- Lu, Y.; Yu, J.; Zhu, X.; Zhang, B.; Sun, Z. YOLOv8-Rice: A rice leaf disease detection model based on YOLOv8. Tech. Rep. 2024, 22, 695–710. [Google Scholar] [CrossRef]
- Chen, L.; Zou, J.; Yuan, Y.; He, H. Improved domain adaptive rice disease image recognition based on a novel attention mechanism. Comput. Electron. Agric. 2023, 208, 107806. [Google Scholar] [CrossRef]
- Bharanidharan, N.; Chakravarthy, S.R.S.; Rajaguru, H.; Kumar, V.V.; Mahesh, T.R.; Guluwad, S. Multiclass paddy disease detection using filter-based feature transformation technique. IEEE Access 2023, 11, 109477–109487. [Google Scholar] [CrossRef]
- Yasar, A.; Golcuk, A. Deep learning and evolutionary intelligence with fusion-based feature extraction for classification of wheat varieties. Eur. Food Res. Technol. 2025, 251, 1603–1616. [Google Scholar] [CrossRef]
- Kumar, D.; Kukreja, V. CaiT-YOLOv9: Hybrid transformer model for wheat leaf fungal head prediction and diseases classification. Int. J. Inf. Technol. 2025, 17, 2749–2763. [Google Scholar] [CrossRef]
- Usha Ruby, A.; Chellin Chandran, J.G.; Chaithanya, B. Wheat leaf disease classification using modified ResNet50 convolutional neural network model. Multimed. Tools Appl. 2024, 83, 62875–62893. [Google Scholar] [CrossRef]
- Chang, S.; Yang, G.; Cheng, J.; Feng, Z.; Fan, Z.; Ma, X.; Li, Y.; Yang, X.; Zhao, C. Recognition of wheat rusts in a field environment based on improved DenseNet. Biosyst. Eng. 2024, 238, 10–21. [Google Scholar] [CrossRef]
- Liu, H.; Chen, H.; Du, J.; Xie, C.; Zhou, Q.; Wang, R.; Jiao, L. Auto-adjustment label assignment-based convolutional neural network for oriented wheat diseases detection. Comput. Electron. Agric. 2024, 222, 109029. [Google Scholar] [CrossRef]
- Dosovitskiy, A.; Beyer, L.; Kolesnikov, A.; Weissenborn, D.; Zhai, X.; Unterthiner, T.; Dehghani, M.; Minderer, M.; Heigold, G.; Gelly, S.; et al. An image is worth 16×16 words: Transformers for image recognition at scale. arXiv 2021, arXiv:2010.11929. [Google Scholar] [CrossRef]
- Tu, Z.; Talebi, H.; Zhang, H.; Yang, F.; Milanfar, P.; Bovik, A.; Li, Y. MaxViT: Multi-axis Vision Transformer. In Proceedings of the European Conference on Computer Vision (ECCV), Tel Aviv, Israel, 23–27 October 2022; Springer: Cham, Switzerland, 2022; pp. 459–479. [Google Scholar] [CrossRef]
- Woo, S.; Park, J.; Lee, J.-Y.; Kweon, I.S. CBAM: Convolutional Block Attention Module. In Proceedings of the European Conference on Computer Vision (ECCV), Munich, Germany, 8–14 September 2018; Volume 11211, pp. 3–19. [Google Scholar] [CrossRef]
- Hu, J.; Shen, L.; Sun, G. Squeeze-and-Excitation Networks. In Proceedings of the IEEE Conference on Computer Vision and Pattern Recognition (CVPR) 2018, Salt Lake City, UT, USA, 18–23 June 2018; pp. 7132–7141. [Google Scholar] [CrossRef]
- Chollet, F. Xception: Deep Learning with Depthwise Separable Convolutions. In Proceedings of the IEEE Conference on Computer Vision and Pattern Recognition (CVPR) 2017, Honolulu, HI, USA, 21–26 July 2017; pp. 1251–1258. [Google Scholar] [CrossRef]
- Liu, Z.; Mao, H.; Wu, C.-Y.; Feichtenhofer, C.; Darrell, T.; Xie, S. A ConvNet for the 2020s. In Proceedings of the IEEE/CVF Conference on Computer Vision and Pattern Recognition 2022, New Orleans, LA, USA, 18–24 June 2022; pp. 11966–11976. [Google Scholar] [CrossRef]
- Anbalagan, T.; Nath, M.K.; Vijayalakshmi, D.; Anbalagan, A. Analysis of Various Techniques for ECG Signal in Healthcare, Past, Present, and Future. Biomed. Eng. Adv. 2023, 6, 100089. [Google Scholar] [CrossRef]
- Dash, S.S.; Nath, M.K. A Novel Approach for Detecting Fetal QRS and Estimating Fetal Heart Rate from Abdominal ECG Using EMD and Wavelet Decomposition. Circuits Syst. Signal Process. 2025, 1–24. [Google Scholar] [CrossRef]
- Mookkandi, K.; Nath, M.K. Robust Deep Neural Network for Classification of Diseases from Paddy Fields. AgriEngineering 2025, 7, 205. [Google Scholar] [CrossRef]
- Elangovan, P.; Dhurairajan, V.; Nath, M.K.; Yogarajah, P.; Condell, J. A Novel Approach for Meat Quality Assessment Using an Ensemble of Compact Convolutional Neural Networks. Appl. Sci. 2024, 14, 5979. [Google Scholar] [CrossRef]
Disclaimer/Publisher’s Note: The statements, opinions and data contained in all publications are solely those of the individual author(s) and contributor(s) and not of MDPI and/or the editor(s). MDPI and/or the editor(s) disclaim responsibility for any injury to people or property resulting from any ideas, methods, instructions or products referred to in the content. |
© 2025 by the authors. Licensee MDPI, Basel, Switzerland. This article is an open access article distributed under the terms and conditions of the Creative Commons Attribution (CC BY) license (https://creativecommons.org/licenses/by/4.0/).

